Abstract
Seismic attribute analysis, guided by well data, reveals widespread stratigraphic anomalies caused by erosion or karstification in the late Ordovician-early Devonian Hunton Group in the Arkoma Basin, eastern Oklahoma, USA. This study shows that these strata are more extensive than previously known. Well data and seismic mapping in the Red Oak petroleum field identify approximately 40 m thick Hunton lenses, averaging 3 km in diameter, surrounded by karsted rock. These lenses may be remnants of incomplete erosion during the Middle Devonian period (pre-Woodford unconformity) or result from Hunton rocks sagging into sinkholes caused by karstification and collapse of underlying Viola or Bromide carbonates. Using formation tops from wells, correlated with attribute and structure maps from a 3D seismic volume, we identify (1) areas lacking Hunton seismic markers, indicating complete removal; (2) areas with Hunton contacts, showing where Hunton remains; and (3) zones without Hunton but with a thin layer underlying carbonate strata, interpreted as an incipient karst zone, often near areas with Hunton. We also observe that the thickness of the overlying Woodford Shale, a key hydrocarbon target, correlates with karstic and erosional thinning of Hunton carbonates. Interpretation of 3D seismic data reveals a strong connection between thinned Hunton and thickened Woodford Shale.
1. Introduction
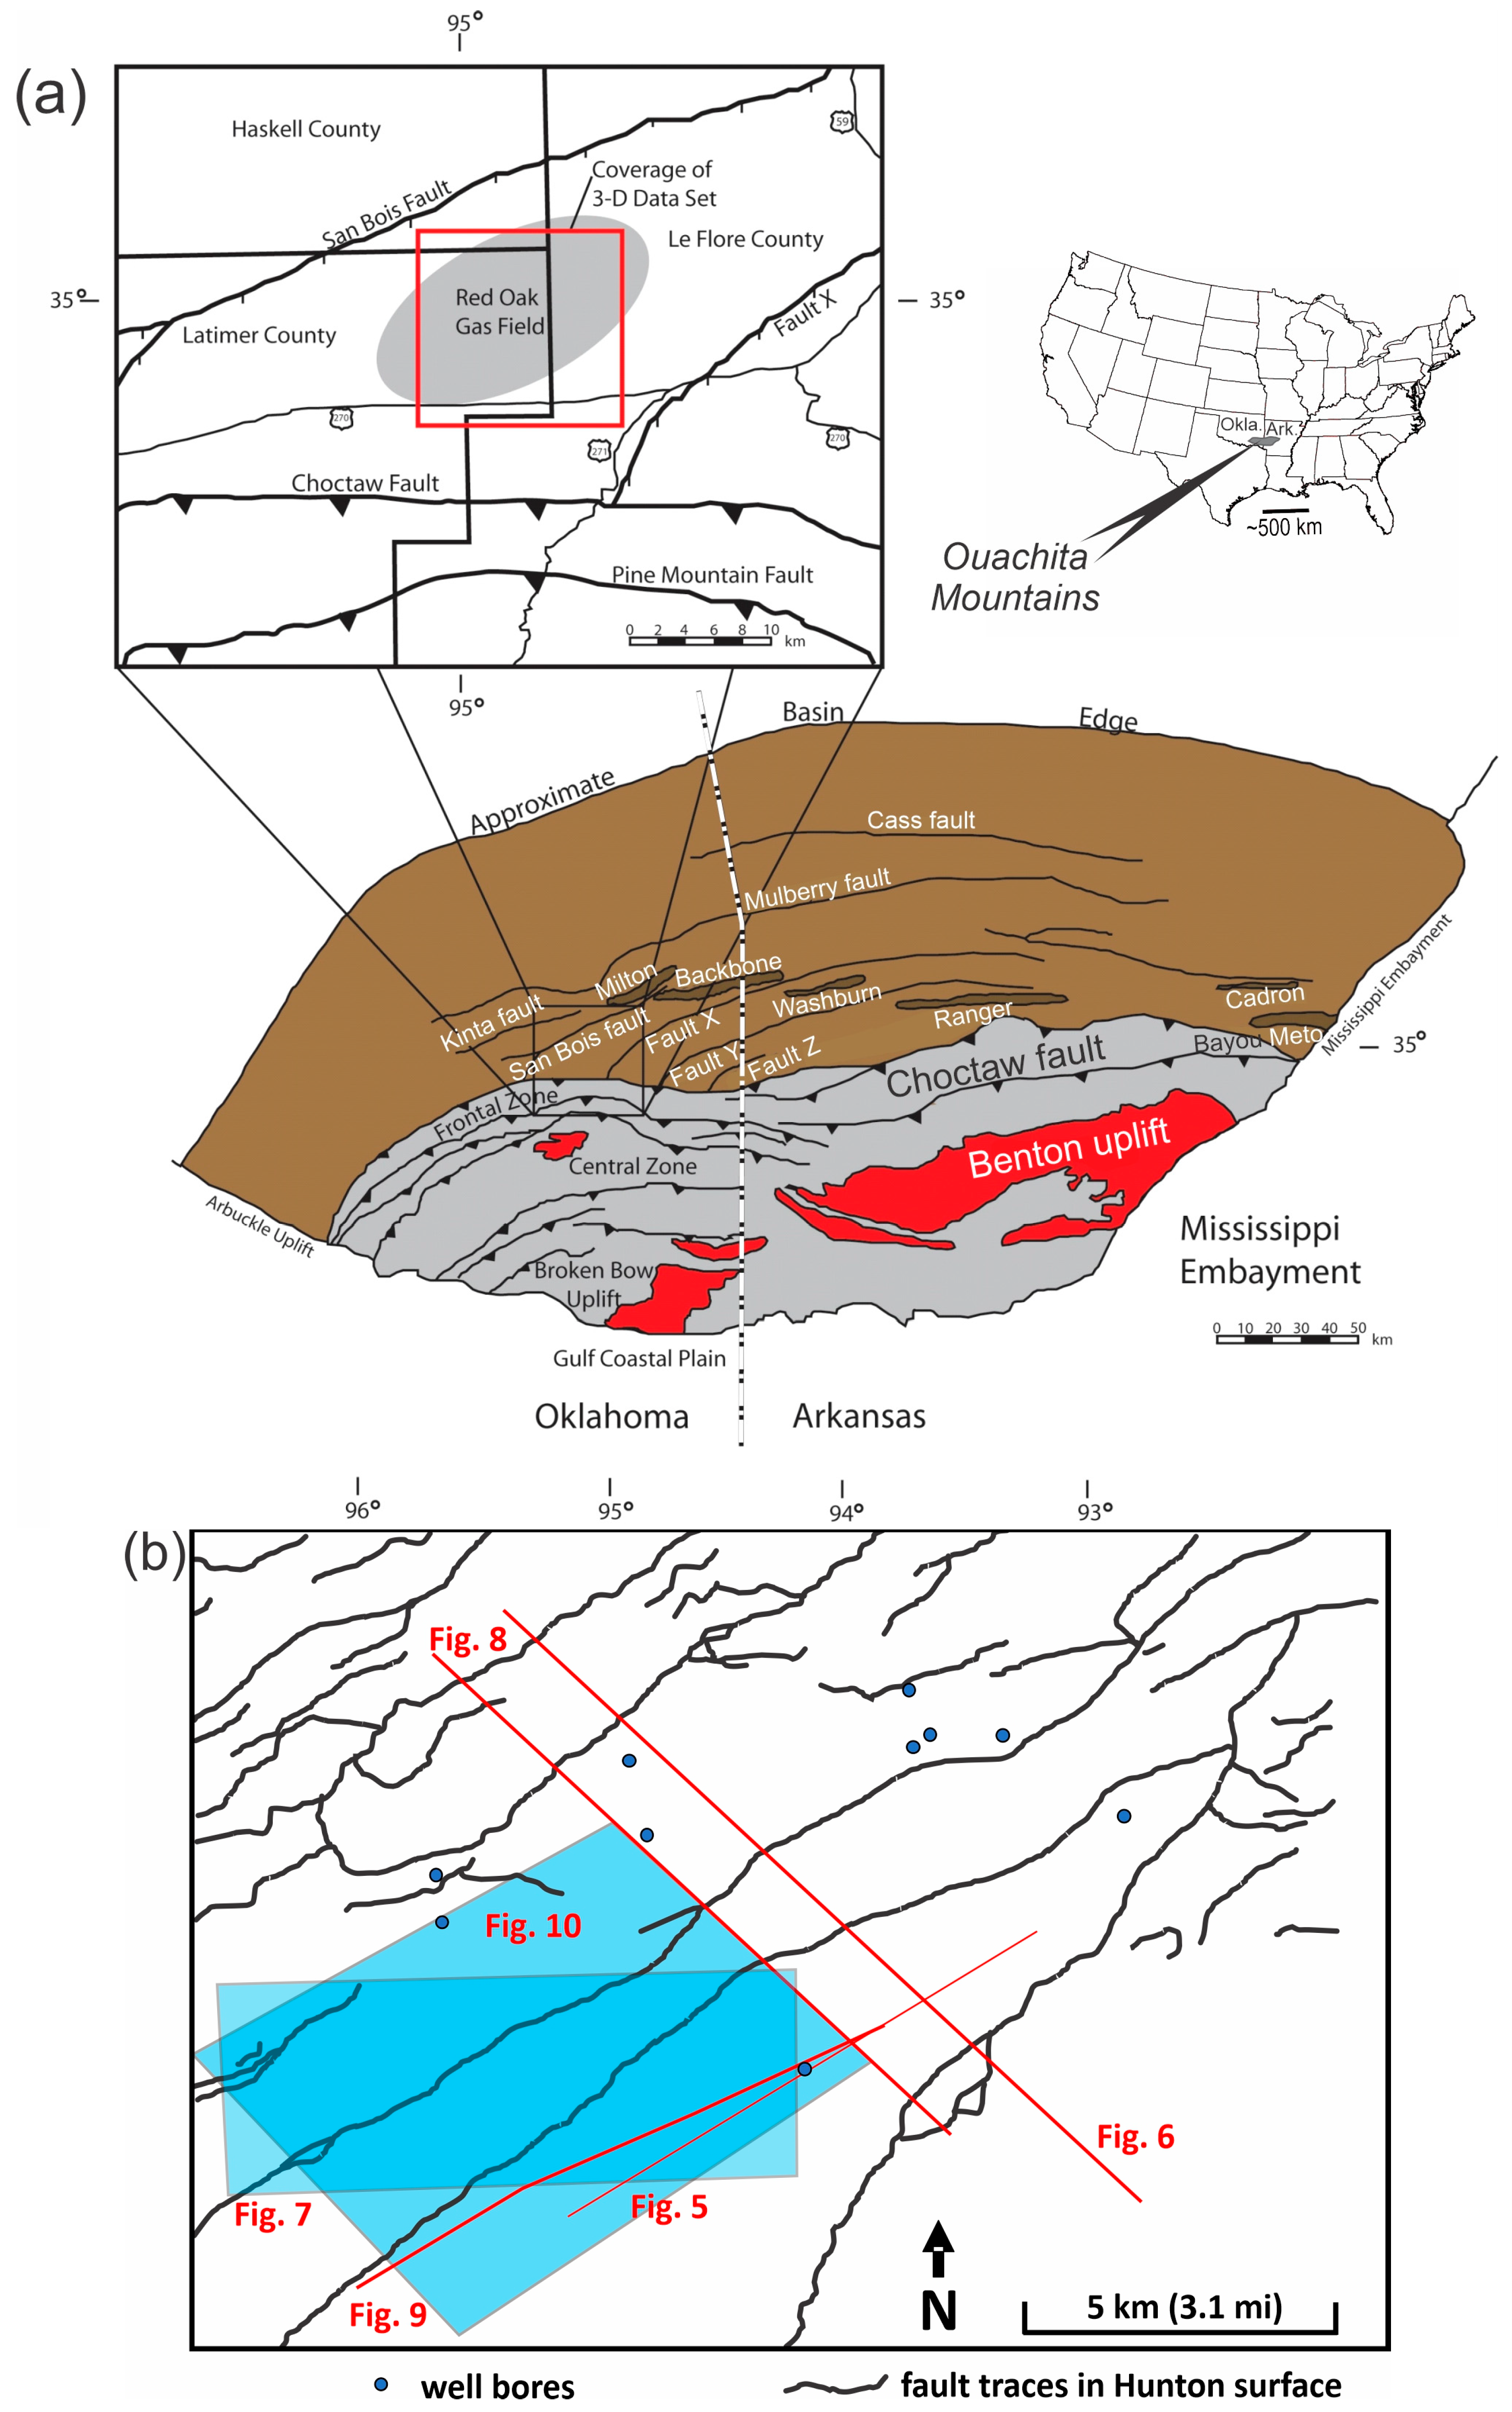
The Hunton Group is an Ordovician-Devonian heterolithic succession of carbonates and shales deposited on a south-dipping ramp [1,2] (Figure 1a,b). It is a significant historical oil and gas producer in Oklahoma (USA). Today, the overlying Woodford Shale is the most economically important drilling target of the Arkoma Basin [3], with over 2493 wells drilled and well over 2 trillion cubic feet of gas (TCFG) produced [4]. However, in the Arkoma Basin of eastern Oklahoma, relatively few wells have penetrated the Hunton Group, and little is known about its stratigraphic character and distribution [5]. It exists, mainly in the subsurface, from the Texas Panhandle across most of Oklahoma and into western Arkansas [1,6]. Oil was first discovered in the Hunton Group in 1921 in eastern Oklahoma [7]. Although current exploitation of the Hunton Formation is overshadowed by the horizontal tight hydrocarbon play in the overlying Woodford Shale, it has historically produced enormous quantities of oil and natural gas, especially in the Anadarko Basin of western Oklahoma. Between January 1977 and September 1999, the Hunton Group produced 157,118,000 barrels of oil and 46,759,666 million cubic feet of natural gas [7].
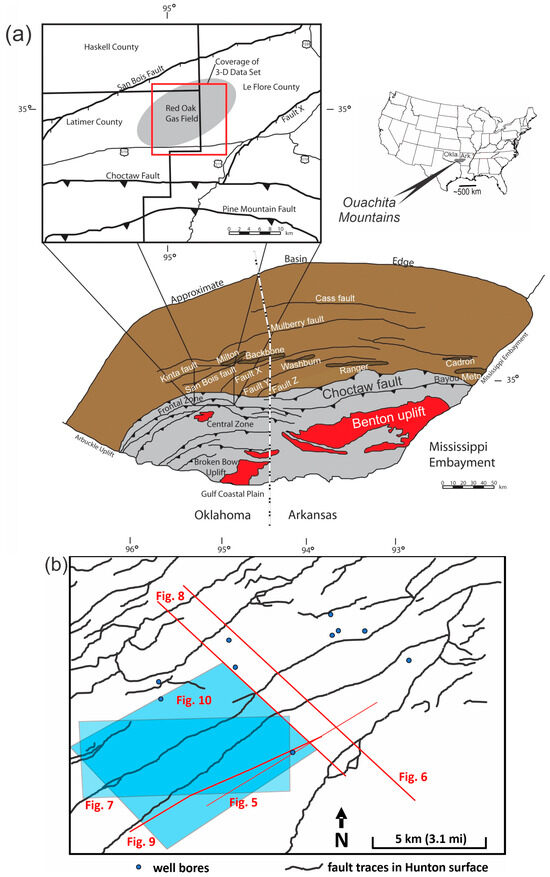
Figure 1.
(a) Location map of the study area. The red area indicates a core of crystalline basement, the grey area shows uplifted pre-orogenic sediments, and the brown area represents synorogenic sediments. (b) Generalized index map of seismic (blue outlines) and borehole (dots) data used in this study, along with figure locations.
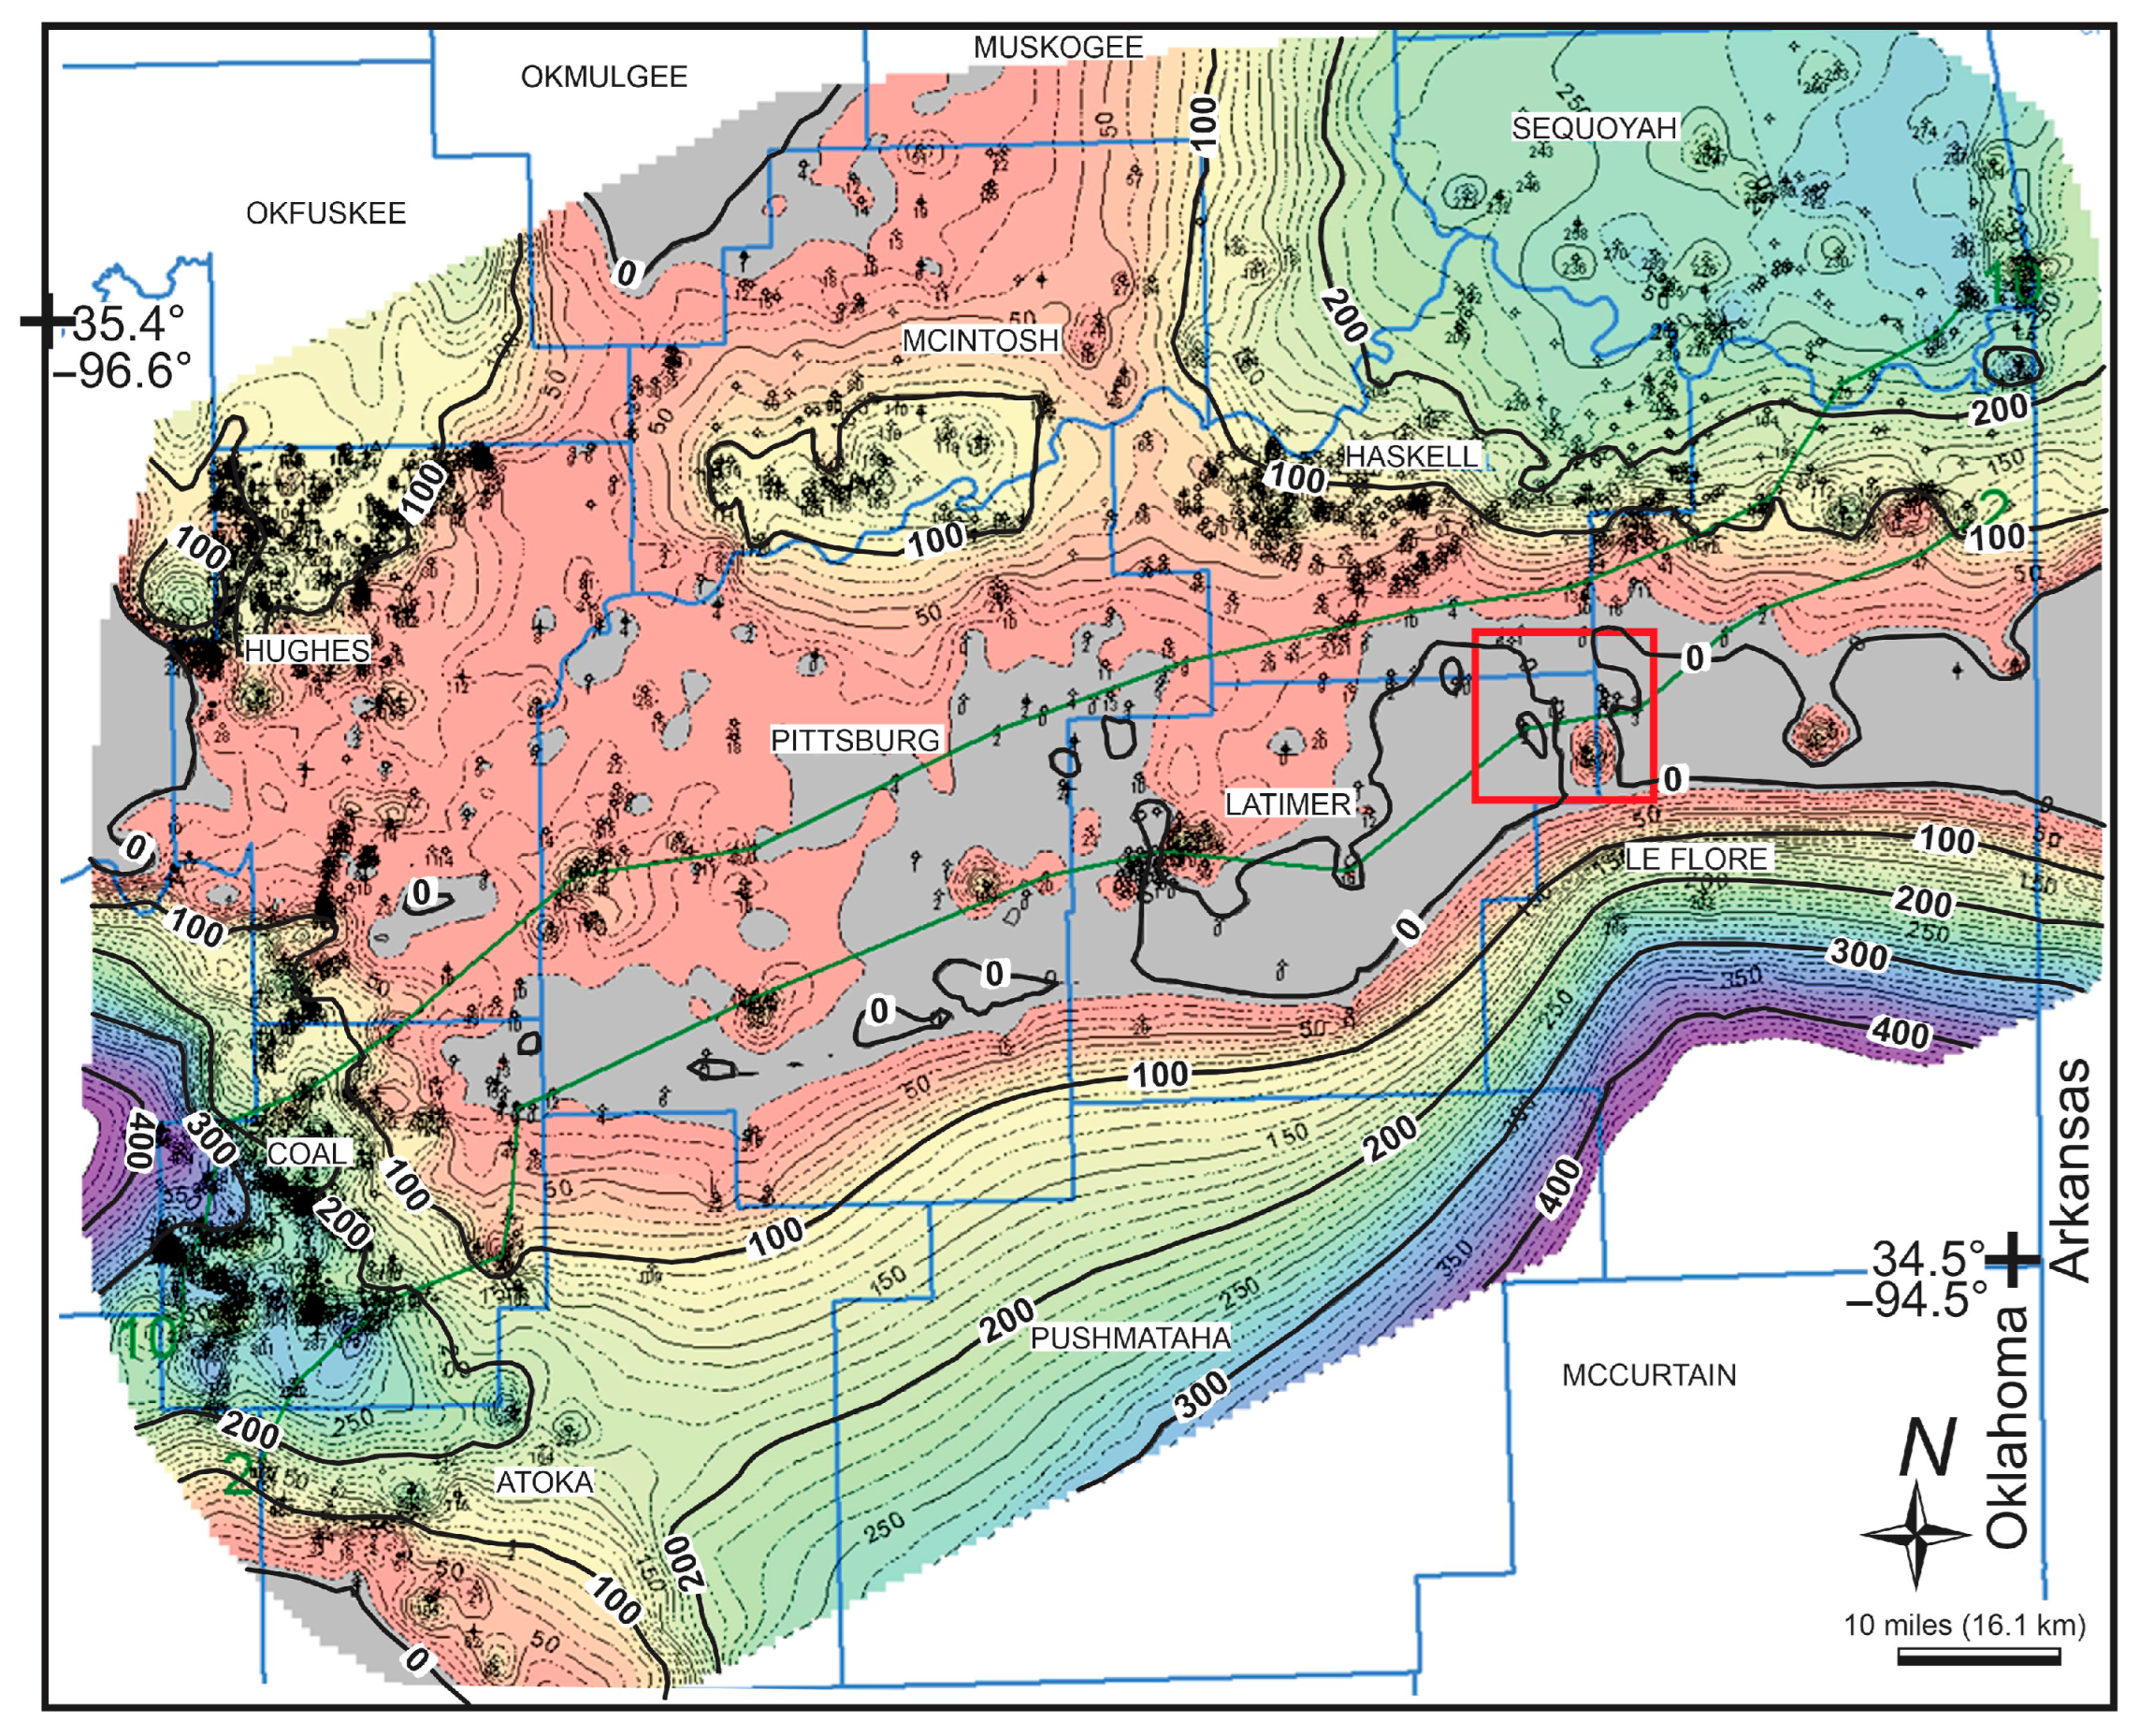
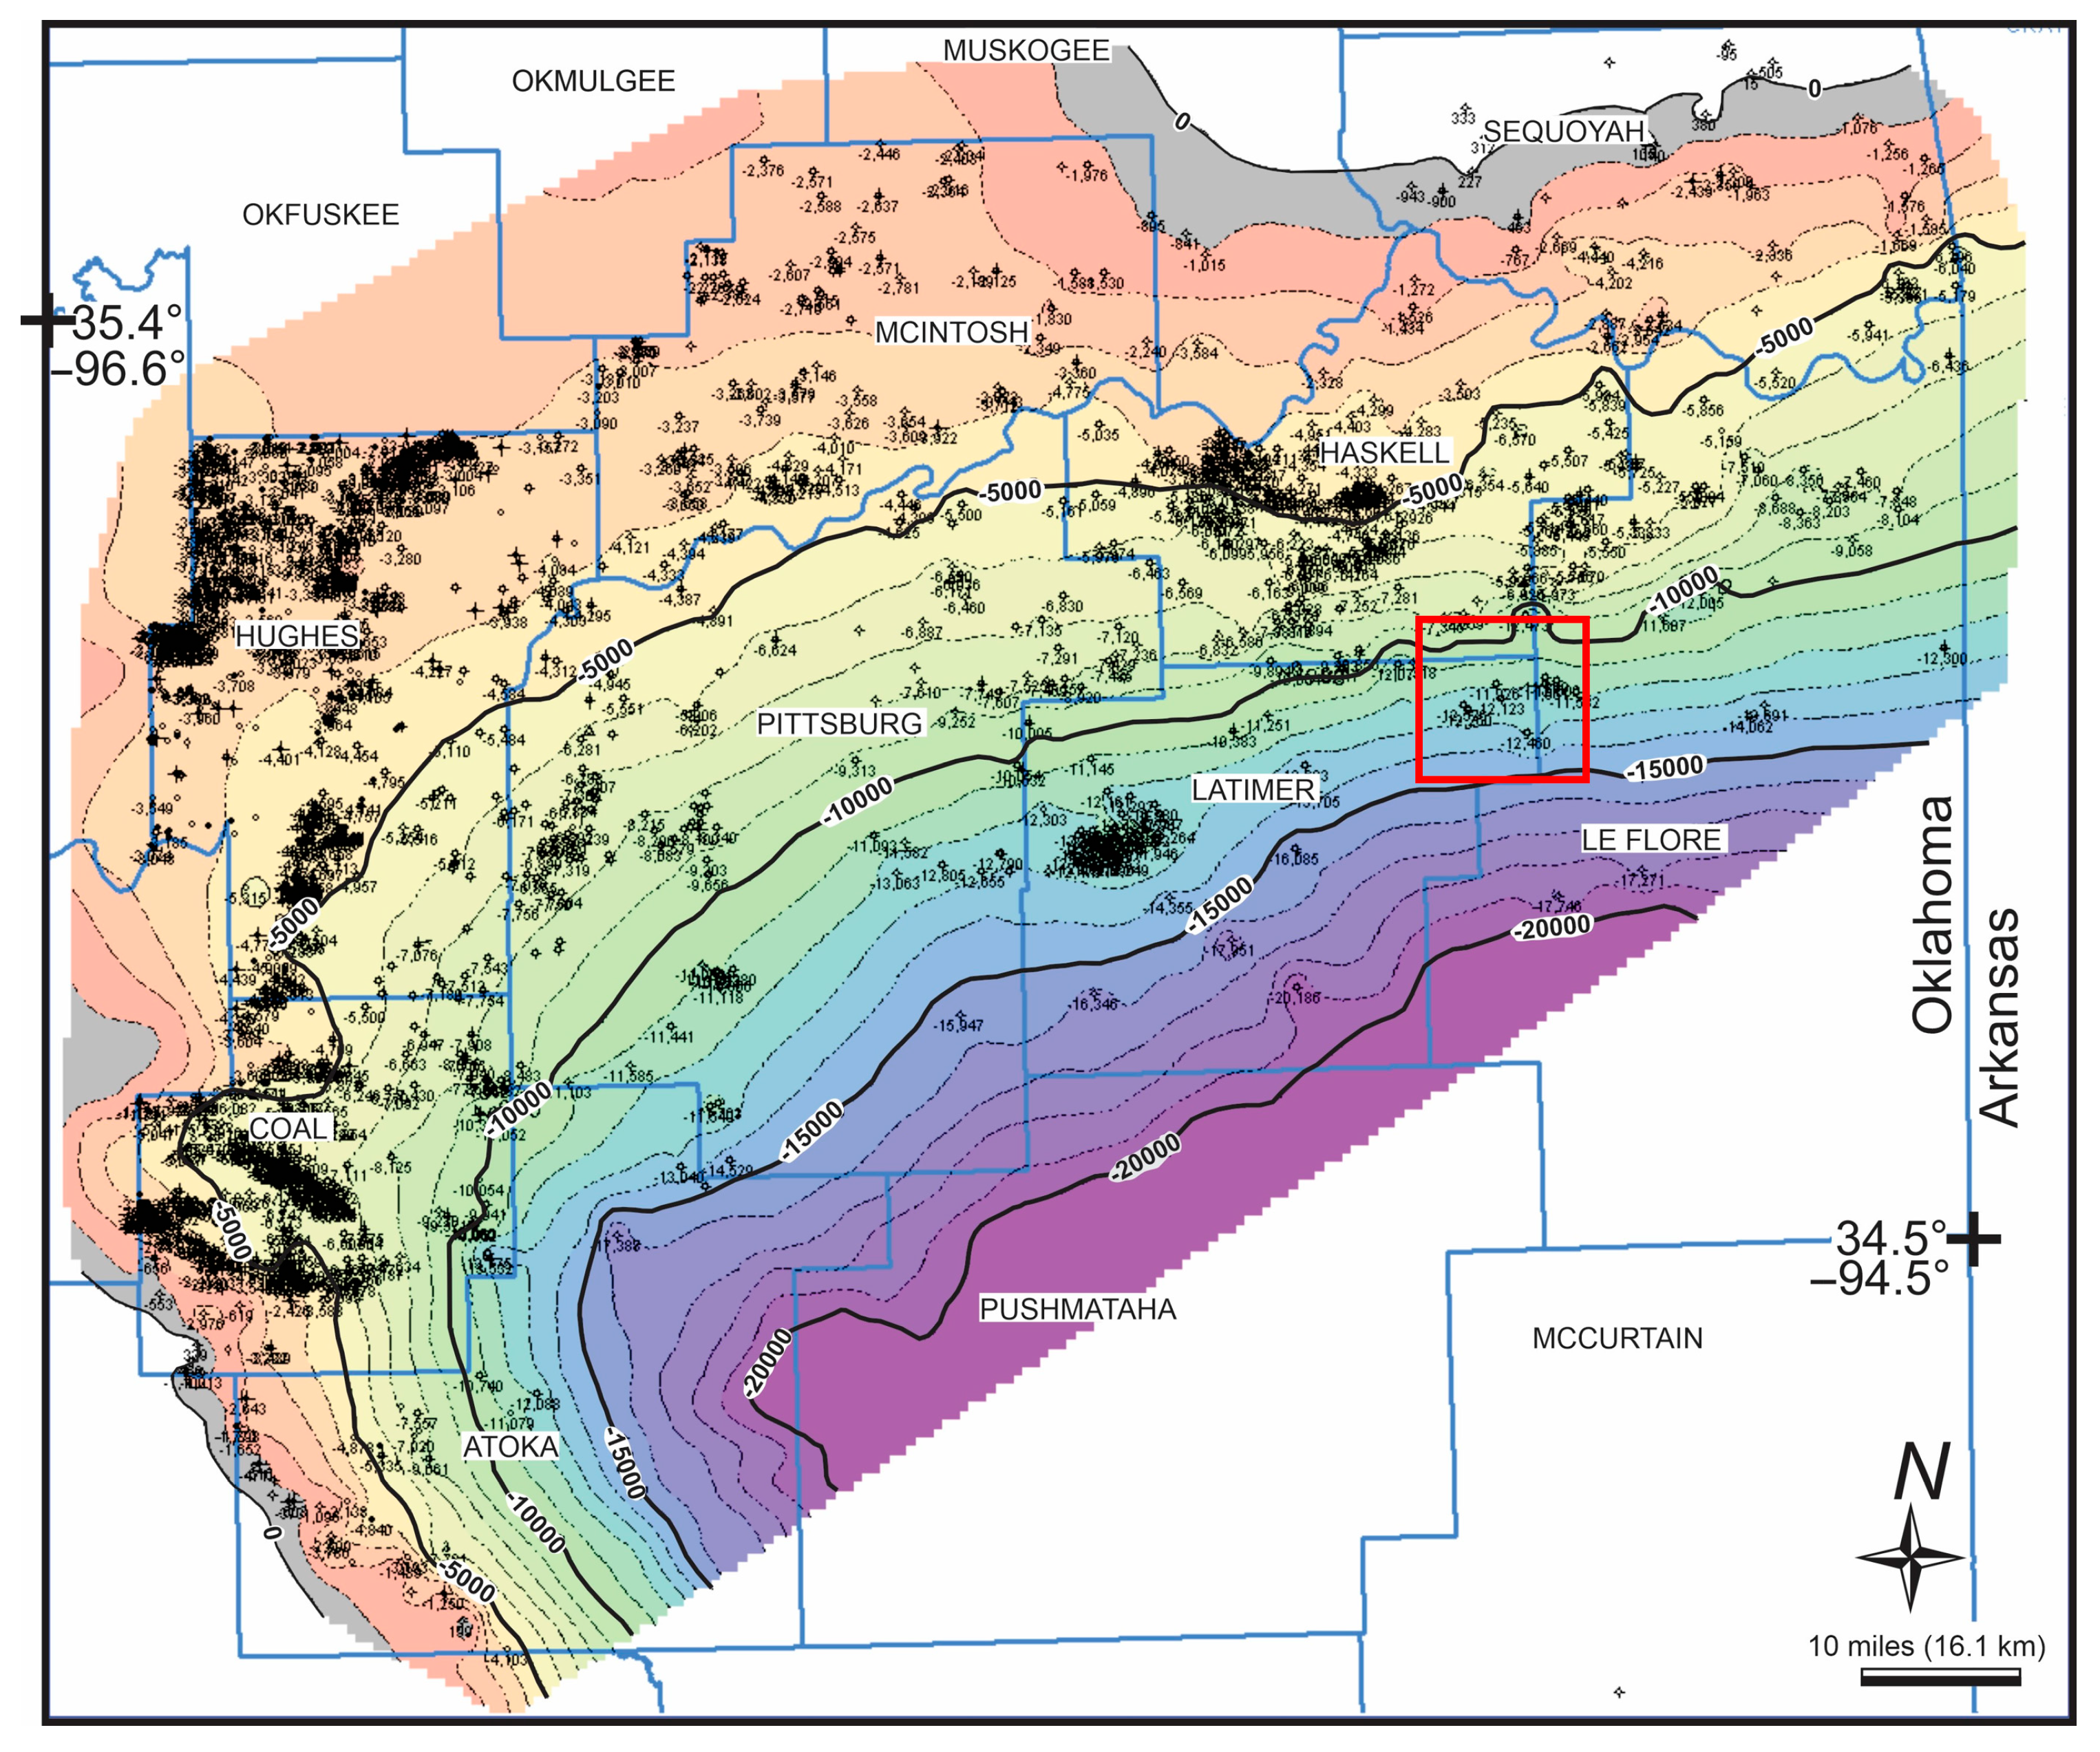
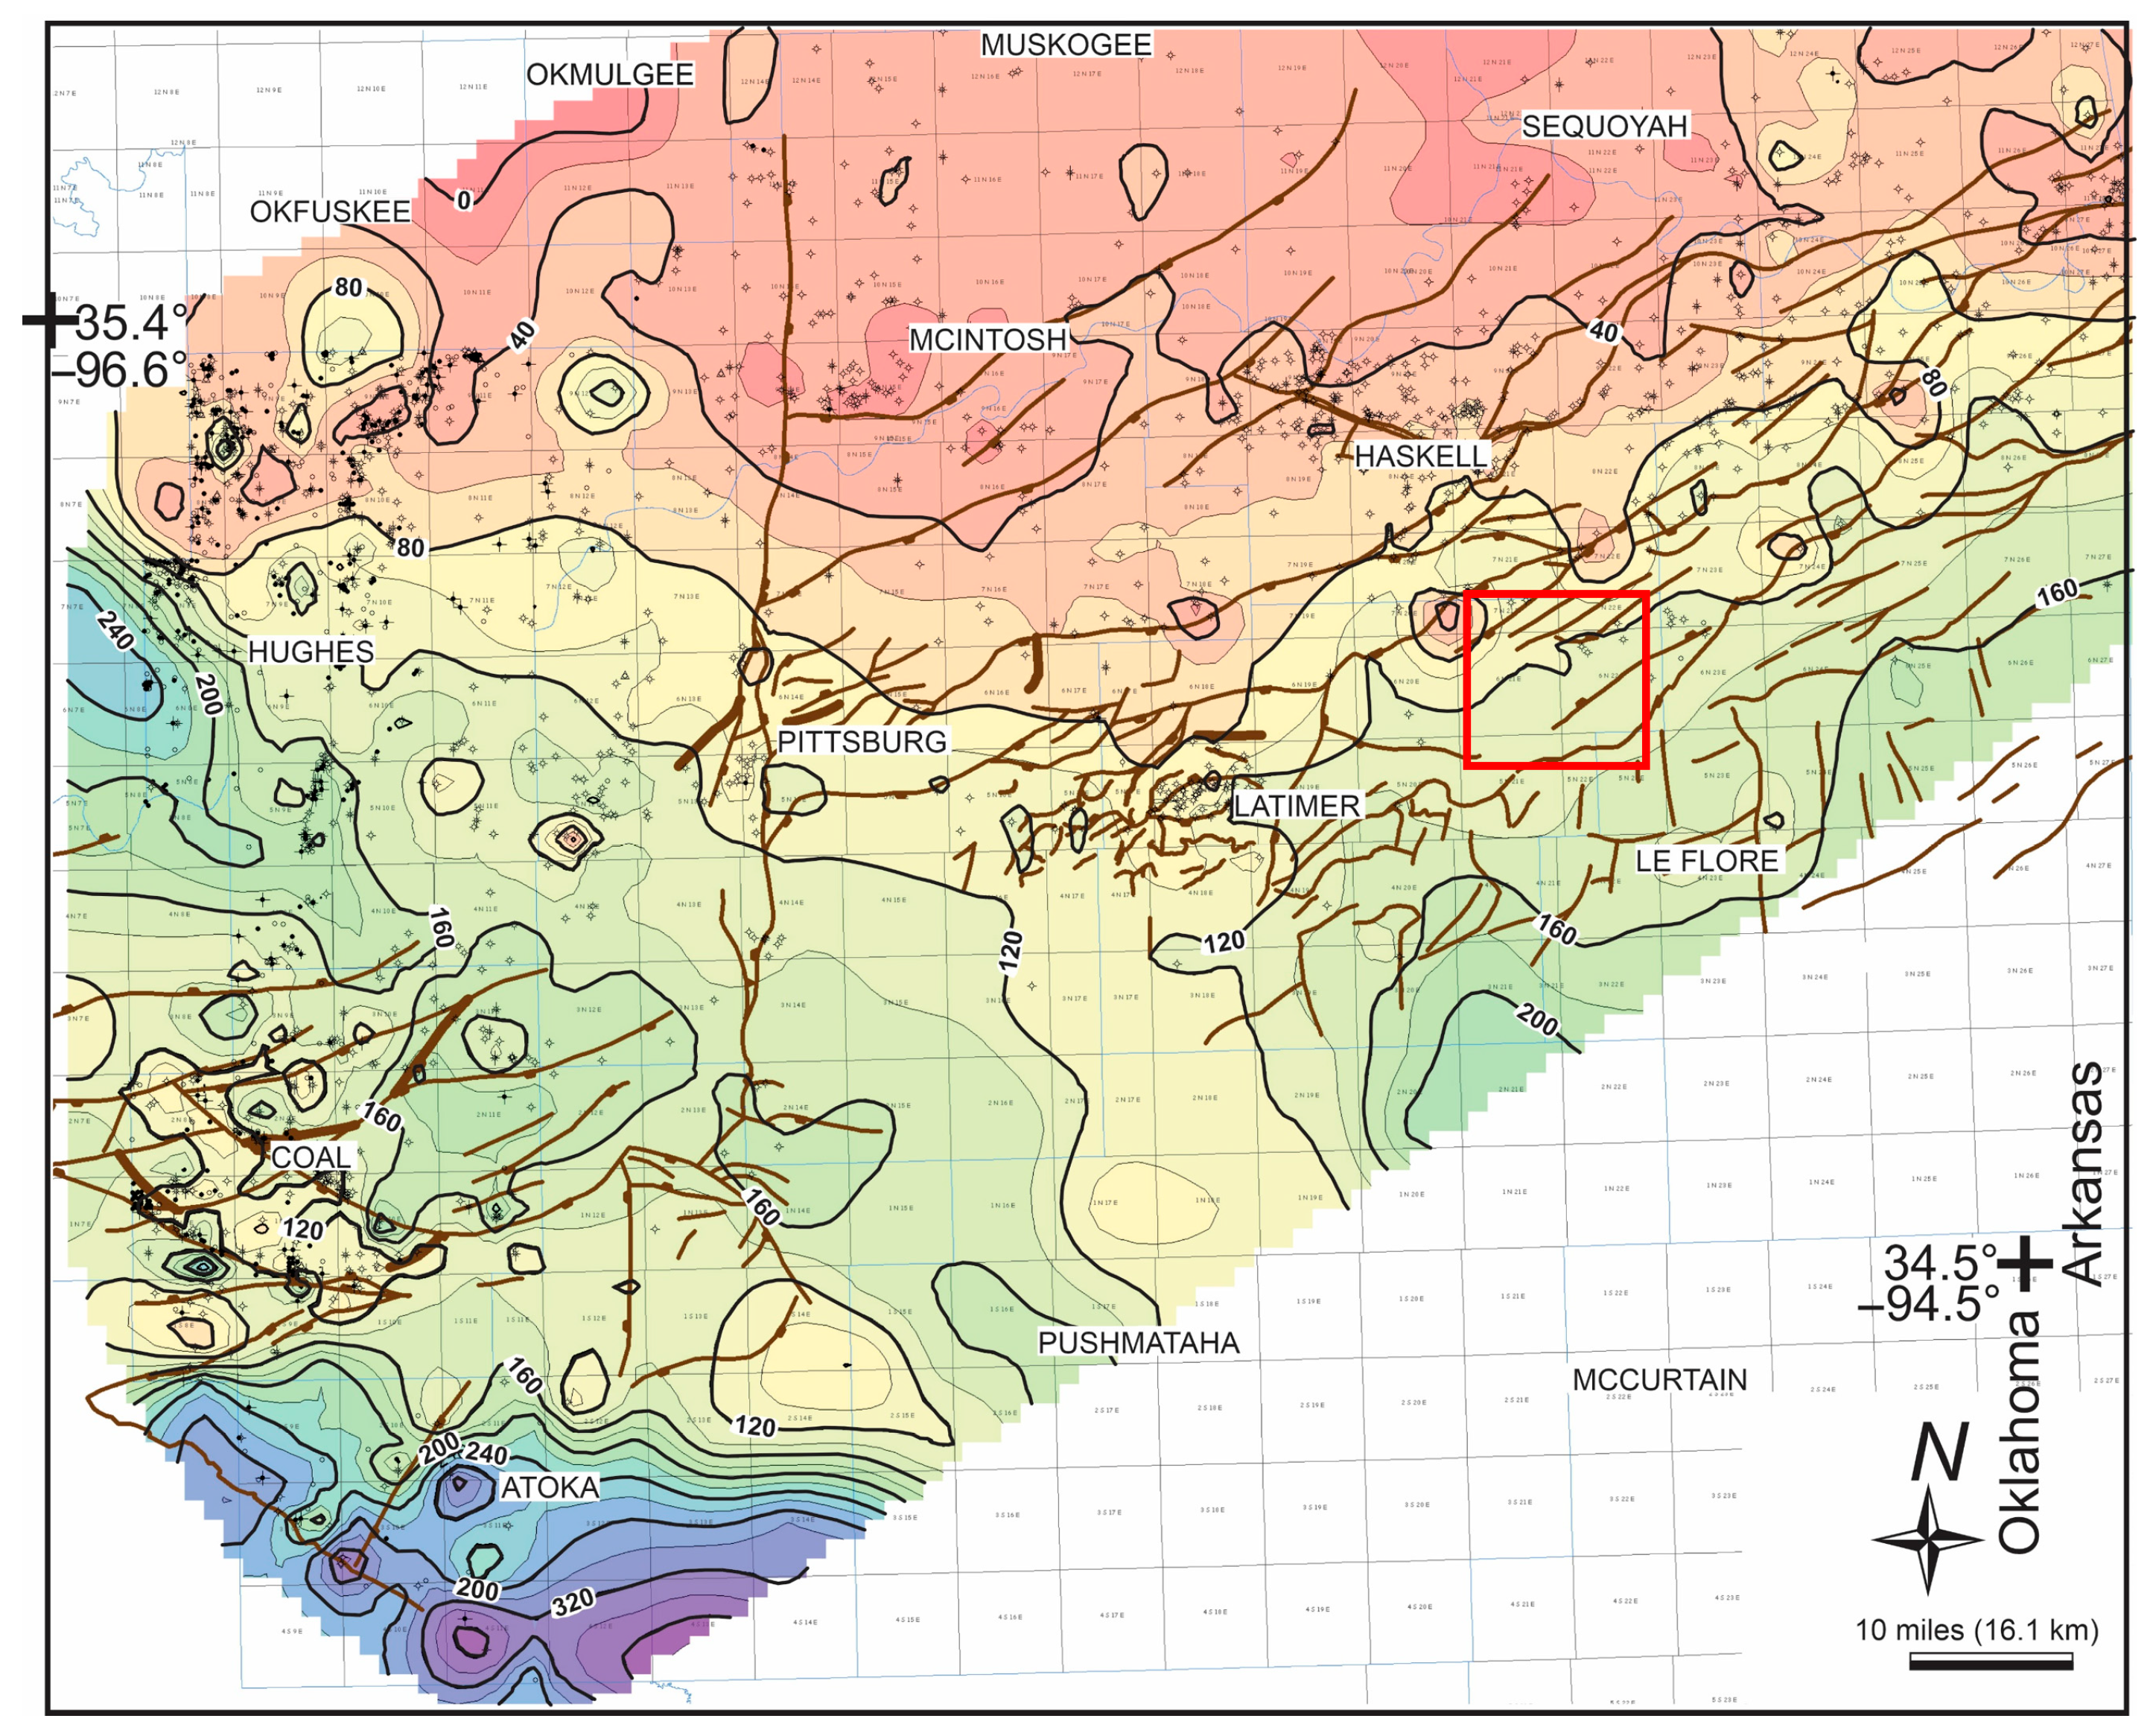
Previous Hunton research has primarily focused on surface geological mapping in historically significant producing regions, such as the southern Anadarko Basin and the Cherokee Platform [1,7]. The Hunton Formation in the southern part of the Arkoma Basin in eastern Oklahoma has attracted somewhat less attention because across much of the basin it is relatively thin (Figure 2). It is deeply buried, averaging about 12,000–16,000 ft (3658–4877 m) (Figure 3). In a broad zone within the middle of the basin, approximately 25 mi (40 km) wide and 100 mi (161 km) long (Figure 2), Hunton rocks were entirely eroded during the Middle Devonian period.
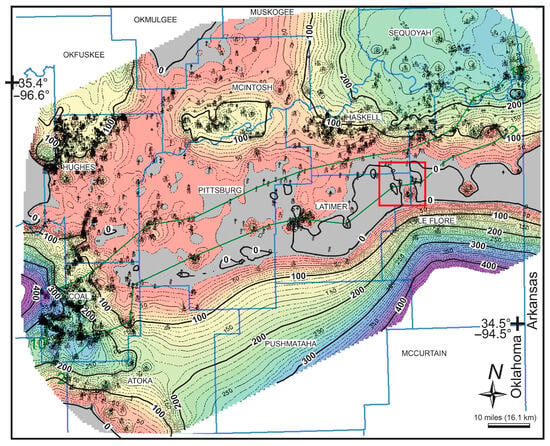
Figure 2.
Generalized isopach map of the Hunton in the Arkoma basin. The map was constructed using a least-squares gridding algorithm with data from 1569 wells that penetrate the Woodford through the Viola interval. Note that all strata less than 10 ft (3 m) were plotted as zero Hunton due to the difficulty in differentiating these thin Hunton intervals from widespread rubble zones associated with the pre-Woodford unconformity. The green lines running from the south-west to the north-east are the cross-sections, with part A representing the northern cross-section and part B the southern cross-section. The red square in the center-right indicates the generalized location of the 3D seismic dataset.
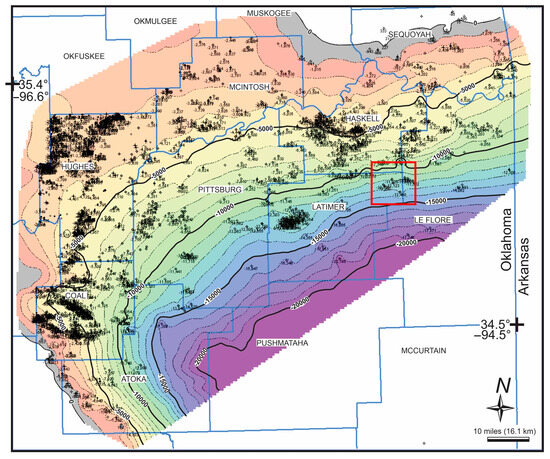
Figure 3.
Structure depth map measured in US standard feet from a sub-sea datum (true vertical depth sub-sea) at the base Woodford-Hunton surface, or base Woodford where the Hunton is absent. Note that the Arkoma Basin generally dips southwards, and that the considerable depth of the Hunton interval, along with the overall greater structural complexity of the overlying sediments, has limited exploration wells in the southern part of the basin. The contouring is constrained by well logs (black dots). The red square in the center-right indicates the location of the 3D seismic dataset.
Many subcrop isopach maps of the Hunton have been produced over the past century [6,8,9,10,11]. All show Hunton rocks thinning southward and eventually pinching out in the central Arkoma Basin (Figure 2). Using new data and interpretations presented herein, we will conclude that Hunton rocks occur in the subsurface much further south than previously believed. New drilling has encountered Hunton rocks in areas where they were previously thought to be absent. Understanding these newly discovered Hunton trends has become economically significant with the ongoing development of the Woodford horizontal gas play.
2. Purpose of Study
Our main goal is to map erosional and karstic features using seismic attributes. An additional aim is to update existing knowledge about the regional extent and thickness of the Hunton Group in the Arkoma Basin. Hunton strata were mapped with seismic data to better understand stratigraphic issues related to the southern erosional margin of the Hunton. To do this, we identified the most effective methods to resolve and map the erosional edge through 2D and 3D seismic and well data. Seismic attribute analysis was used to distinguish Hunton strata from surrounding rocks. The variability of rocks directly above the Hunton—ranging from thin conglomerates to cherty shales and sandstones—required the use of 3D seismic attributes for visualization. Since the Hunton erosional pinch-out is not a simple feather edge but is dispersed into increasingly thinner lenses, it was also important to include the neighboring stratigraphy to model its depositional and preservation history. We mapped the Hunton on a 3D seismic volume within a producing gas field and modelled the coeval karstic and erosional processes involved in its preservation.
The 3D seismic survey used in this study originates from the Red Oak gas field, located within the triangle zone between the Ouachita Mountains and the southern Arkoma Basin [12]. The study area is approximately 4 mi (6.4 km) north of the Choctaw Fault, located in Latimer, Haskell, and Le Flore counties, Oklahoma, and is marked by the red box in Figure 2 and Figure 3. Hunton rocks are largely absent along most of the northern and eastern parts of the area. Where present, they consist of thin lenticular bodies of carbonate strata.
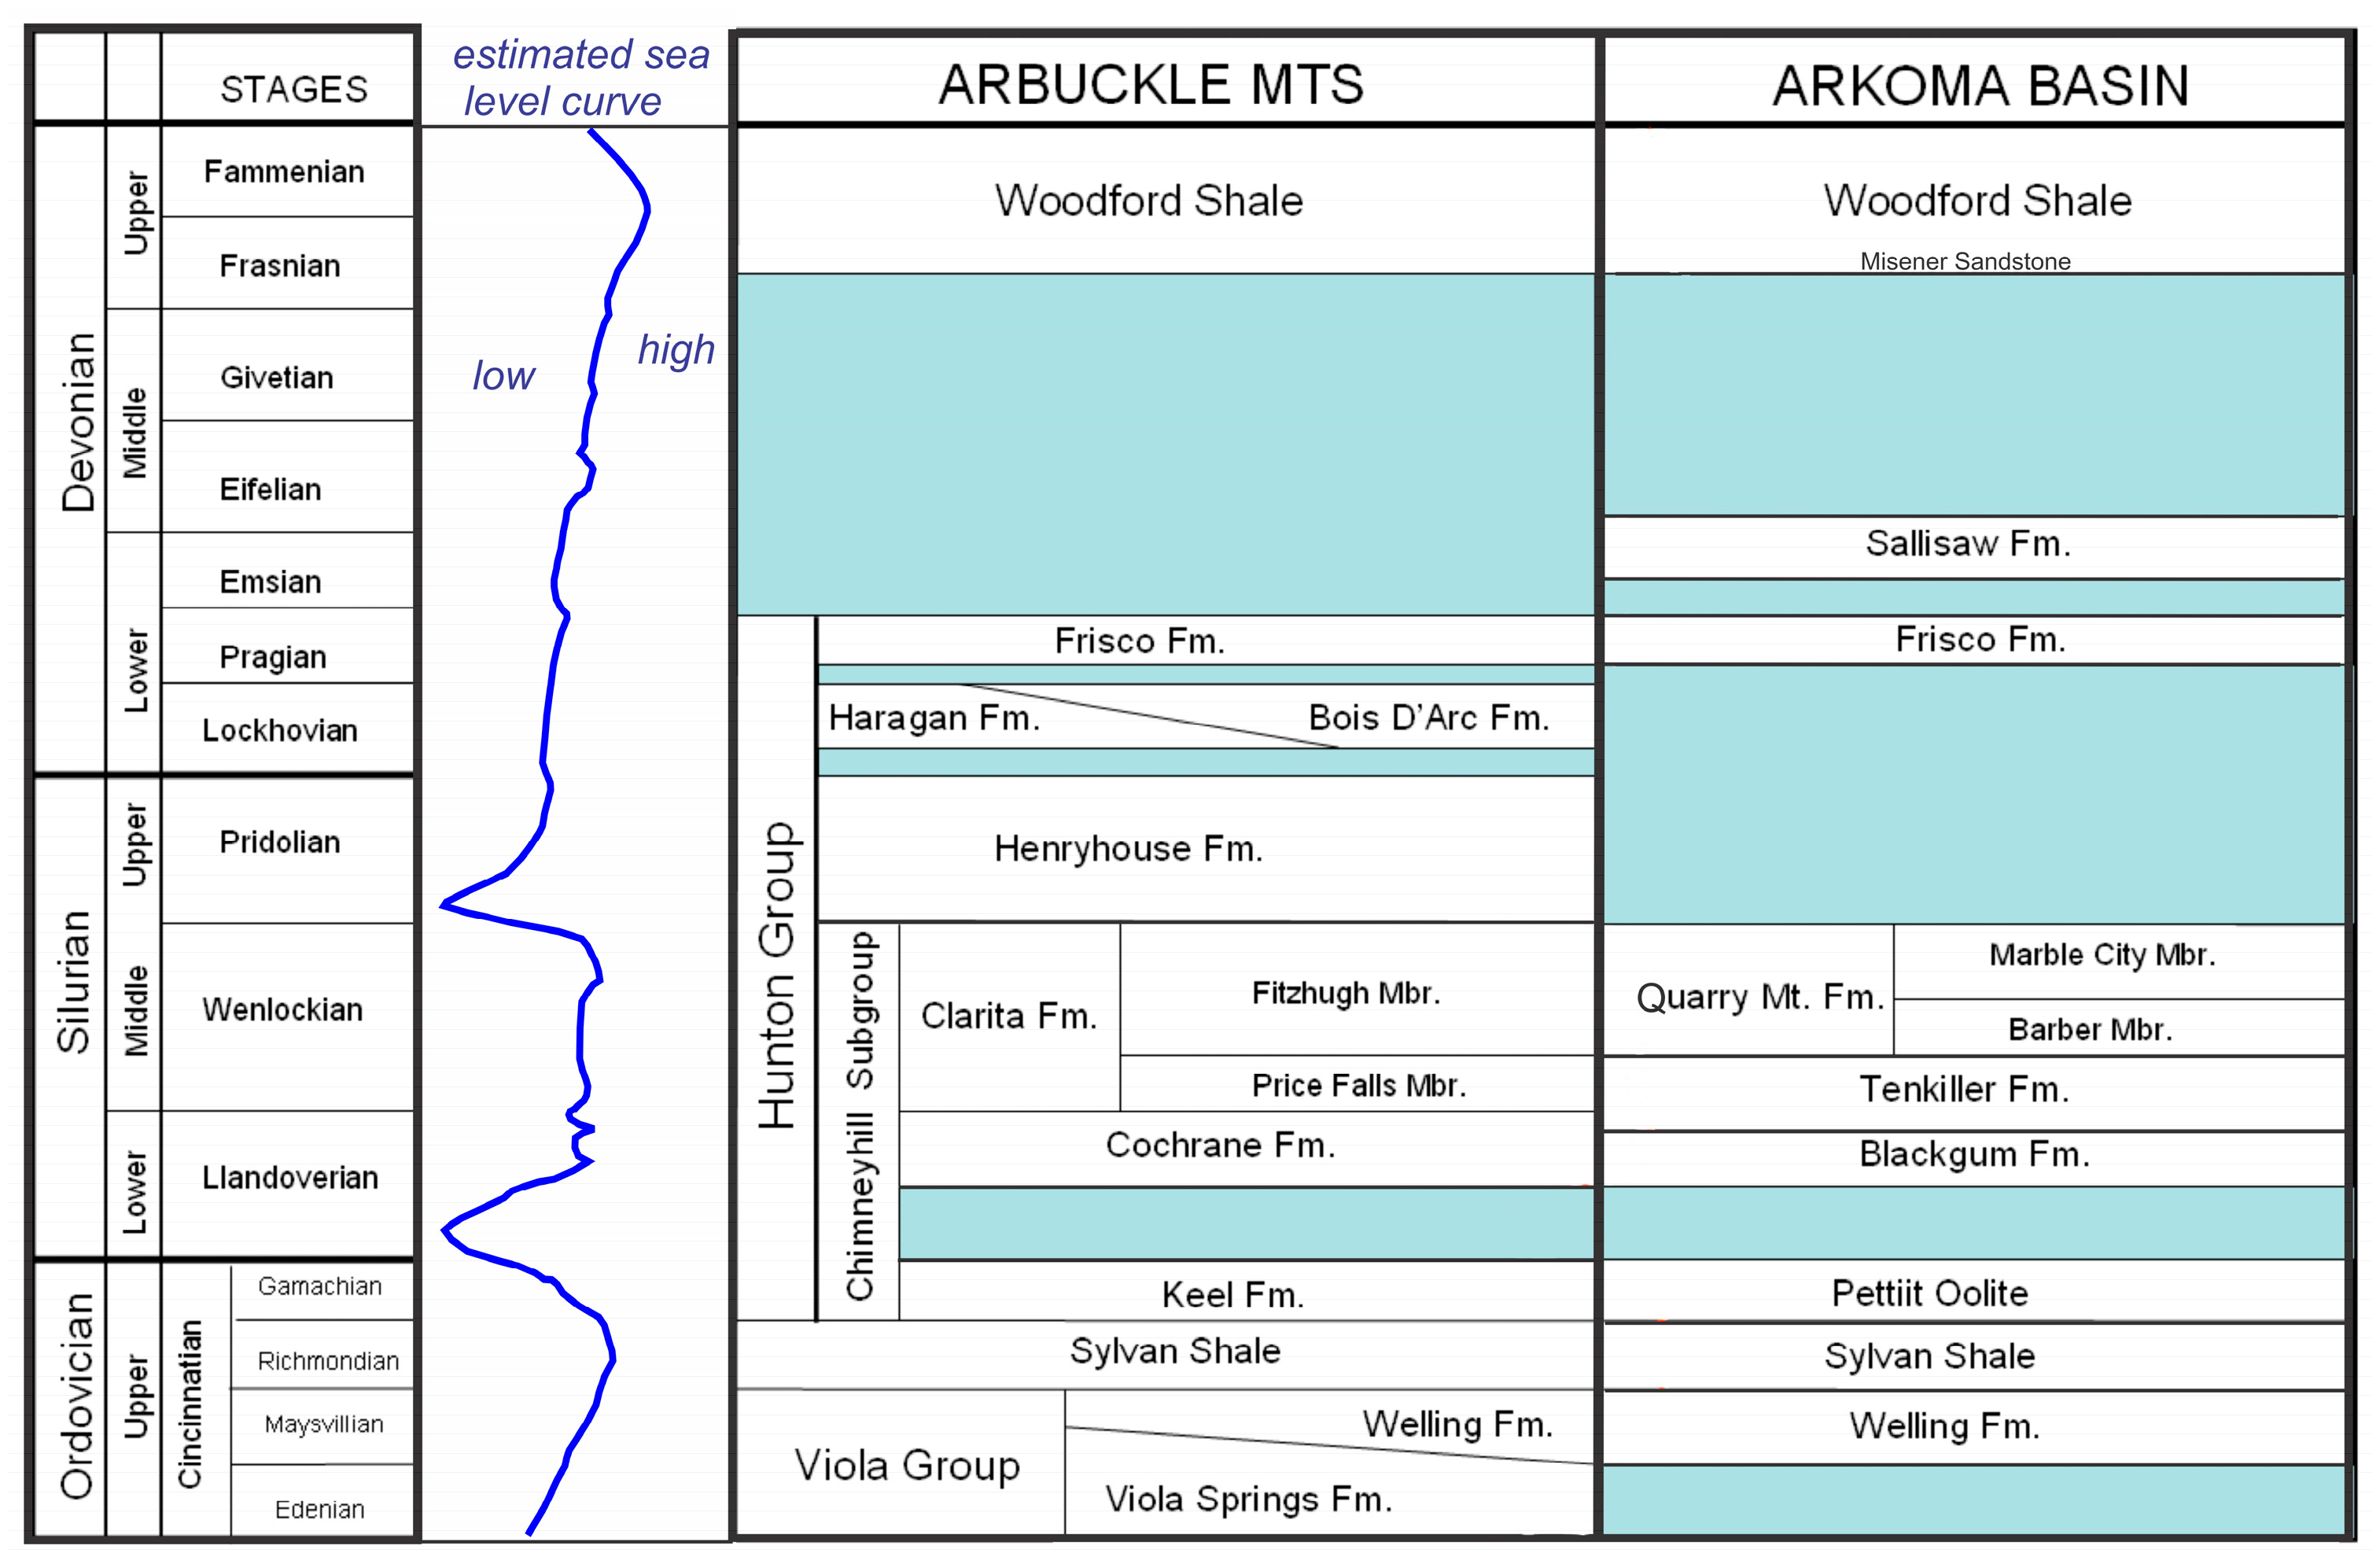
Our study focused on the interval from the top of the Woodford Shale to the base of the Viola Group, which lies beneath the Hunton Group and Sylvan Shale (Figure 4). This interval was selected because of the depositional relationship these rocks share with the Hunton. The base of the Sylvan Shale and the top of the Woodford Shale, which mark the lower and upper boundaries, respectively, form chronostratigraphic surfaces [13]. As a result, the unusual thicknesses of these units are inversely related: the Woodford Shale tends to be thickest where the Hunton Group is thin or absent, possibly indicating back-filled pre-Woodford channels or other mechanisms creating relief (e.g., karstification). Conversely, when there is little or no thickening of the Woodford over Hunton lenses, and when nearby areas show partially karsted Viola rocks, we suggest that karst-induced collapse of Viola strata caused Hunton rocks to be lowered below the paleo-regional base level, thus preserving them. We will demonstrate that a combination of these processes can occur: a Hunton lens may be structurally lowered due to karstification of the underlying carbonates, but because of its resistive nature, the Hunton lens forms a depositional high, leading the Woodford to thin over it.
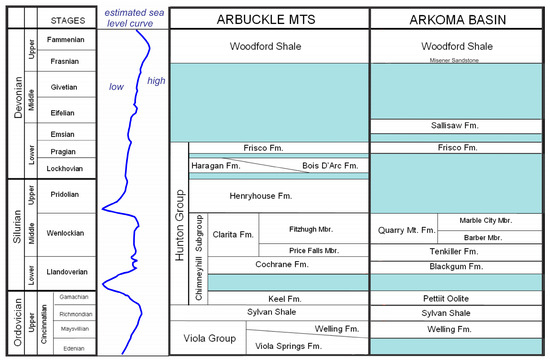
Figure 4.
Illustration of the stratigraphy involved in this study. The blue areas indicate the missing time associated with unconformities. The blue line represents a relative eustatic sea level curve. Note that globally, sea levels were rising throughout the pre-Woodford unconformity (middle Devonian), suggesting that structural uplift of the affected region is responsible for this unconformity. Figure adapted from [13].
3. Previous Studies
Seismic reflection data (2D and 3D) from the Red Oak petroleum field and other petroleum fields have been utilized for many years to examine the complex subsurface Paleozoic stratigraphy in the Arkoma Basin of eastern Oklahoma [14,15,16,17,18,19,20,21]. In particular, previous research has successfully applied seismic attribute analysis to the detailed structure of stratigraphic intervals, including the Hunton Group and the Woodford Shale [2,22]. The interpretation of karstic features in Paleozoic subsurface strata of the Arkoma Basin has been a primary focus of many of these investigations [2,19,22,23,24].
4. Geologic Setting
4.1. Structure and Tectonics
The Arkoma basin is a foreland basin, a gently compressed fold belt of Pennsylvanian and older strata that underlies much of eastern Oklahoma and western Arkansas, extending south to the Choctaw Fault, which experienced maximum displacement during the Early Permian Period [25] (Figure 1a,b). This fault marks the front of the Ouachita Mountains, which run along the southern part of the basin. The frontal zone lies along the Choctaw fault and consists of severely shortened, north- and northwest-vergent imbricated thrusts and tight folds, mainly of Pennsylvanian strata [26]. Generally, the basin becomes deeper and thicker towards the south, into the Choctaw Fault [27].
The Ouachita Mountains are part of a largely buried late Paleozoic fold-and-thrust belt that stretches from Alabama to northern Mexico. In Oklahoma, the Ouachita Mountains and the Arkoma basin can be divided into four tectonic provinces (Figure 1b) based on different structural styles [28,29]. From north to south, these are (1) the Arkoma foreland basin, (2) the frontal thrust zone, (3) the central thrust zone characterized by broad open synclines separated by tight, generally thrust-cored anticlines of mainly Mississippian and Lower Pennsylvanian turbidites, and (4) the Broken Bow uplift, comprising isoclinally folded and faulted Lower Ordovician to Lower Mississippian strata [30,31]. This study focuses on the central thrust zone, where the Red Oak 3D seismic volume is located.
The tectonic history of the Oklahoma part of the Ouachita orogen can be outlined as follows. During the late Precambrian and Early Cambrian, the opening of the Iapetus Ocean created an irregular, rifted margin of the North American craton [32]. Later, a broad, southward-dipping continental shelf developed along the southern edge of North America, transforming into a prolific carbonate ramp from the Late Cambrian to the Early Devonian [27]. These deposits consist of widespread, thin carbonate units separated by thin shale layers and unconformities. These layers are believed to represent periods of terrigenous input and sea level lowstands, as a fall in sea level would reactivate fluvial systems, causing a hiatus in carbonate deposition and providing energy to transport siliceous material. Continental convergence began in the Late Mississippian between North America and the Sabine plate along a southward-dipping subduction zone [25]. In the Atokan (middle Pennsylvanian) period, before the study area experienced extensive thrusting, the shelf was interrupted by predominantly down-to-the-south normal faulting, apparently caused by the obduction of the approaching Ouachita accretionary prism and the related loading of the continental margin [33,34]. The subsequent orogeny reached its peak in the Early Permian [25]. Regional tectonic transport within the Ouachita fold-and-thrust belt was directed north-northwestward, approximately perpendicular to the current orientations of fold axes and fault traces [30].
4.2. Stratigraphy and Depositional Environment
The Hunton Group comprises organo-detrital limestones, associated dolomites, and shales (Figure 4), which formed in a shallow sea on a gently south-dipping ramp during the Late Ordovician to Early Devonian period [35]. In the study area, its thickness ranges from non-existent to over 300 ft (91 m). Across the basin, Hunton strata generally dip south (Figure 3) towards the Choctaw Fault Zone; the deepest Hunton penetration in the Arkoma basin reaches approximately 20,000 ft (6096 m).
Hunton deposition was not continuous, with unconformities occurring in the Early Silurian, Middle Silurian, and Early Devonian [1]. Of the several major unconformities, the most significant for this project are the post-Upper Silurian Henryhouse pre-Lower Devonian Frisco erosional unconformity, defined as a third-order regional unconformity, and the post-Hunton, pre-Woodford erosional unconformity, classified as a second-order unconformity [36].
The post-Hunton, pre-Woodford erosional unconformity occurs in the Middle Devonian (Emsian-Givetian). The current extent of the Hunton is mainly influenced by erosion that occurred during the time of this unconformity (Figure 3) [1,37]. Because eustatic sea levels rose throughout the Devonian (Figure 4), this unconformity is generally regarded as indicating a period of significant uplift [1,8]. Some researchers believe that the unconformity instead marks a major lowstand of short duration, based on the lack of dolomite and karst features in the Frisco Formation, the uppermost unit of the Hunton Group (Figure 4) [38]. This study aims to provide evidence in support of the structural uplift hypothesis.
A significant transgression happened after the middle Devonian erosion phase, during which both the Misener Sandstone (the basal member of the Woodford, composed of a cherty, fluvial lag) and the Woodford Shale (Figure 4) were laid down. Dissolution of the pre-Woodford surface during this hiatus created a network of relatively deep fissures and caverns in many of the Ordovician-Devonian carbonates, some reaching 50 ft (15 m) across [39,40,41]. Where this unconformity did not remove the Hunton, its upper surface was often eroded by fluvial processes, ranging from very little erosion to complete removal. Earlier researchers have created isopach maps of the Misener member (Figure 4), which show a broadly down-to-the-south dendritic stream pattern, influenced by faulting and fracturing along the north–south Nemaha Ridge [11,38].
5. Methodology
This study commenced with a detailed stratigraphic analysis of the section, using a high-quality 3D seismic survey and supported by a comprehensive set of well data. The model and results from this initial analysis were then applied to a much larger dataset across the Arkoma Basin.
Two separate 3D seismic surveys were used for this study, recorded in 1999 and 2001. These surveys were merged during reprocessing to create the dataset analyzed here. Notably, the 2001 survey was, at the time, among the most densely sampled land datasets worldwide. It included over 1 million prestack traces per square mile (2.6 km2), and because of its 55 ft (16.8 m) common depth point bin size, its nominal fold of cover exceeded 700. The survey was designed with such density to mitigate strong surface wave contamination (ground roll), which affects much reflection data in the lower Pennsylvanian Red Oak Sandstone (the largest producing interval in the Red Oak gas field). Although the high fold did not entirely eliminate ground roll in the Pennsylvanian section, it is not a concern in the much deeper carbonate rocks involved in this study. Ultimately, this high nominal fold of cover provided high-quality data in areas of interest related to Hunton stratigraphy.
The combined migrated dataset includes 866 east–west in-line profiles and 1415 north–south cross-line profiles, totaling 1,225,390 bins (common cell gathers). The source line orientation was north–south, and the receiver line orientation was east–west in both surveys. The length in the cross-line direction is 12 mi (19.3 km), and in the in-line direction it is 8 mi (12.9 km), covering a total area of 103 square mi (266.8 km2). The data quality varies depending on fold coverage. Since we merged two datasets, the maximum fold in the center of the combined data was 288, decreasing towards the edges of the survey. The data were recorded in the field following SEG (Society of Exploration Geophysicists) standards, meaning that an upward earth motion results in negative amplitudes on the geophones.
We applied surface-consistent deconvolution, a process that eliminates undesired filtering by the Earth [42], assuming a minimum-phase source (i.e., dynamite). Special care had to be taken with phase consistency because this is a merged survey, due to the detailed stratigraphic interpretations derived from the waveform. To match the dynamite data, the vibroseis data were converted from zero phase (where the wavelet is symmetrical about zero time) to minimum phase (where the wavelet is causal, offset in time) before deconvolution. This sought to ensure consistency with the dynamite data and to enable a single deconvolution algorithm to be applied across the entire combined survey, resulting in zero phase data. Zero-phase data are preferred over minimum-phase data because they tend to offer sharper definition and less distortion between stratigraphic features in the subsurface [43], in this case aiding in the delineation of the Woodford-Hunton contact. Applying deconvolution ensures that the data are close to zero-phase. No other subsequent processing was applied that could alter the data’s phase. Further information on the acquisition and processing parameters can be found in [44].
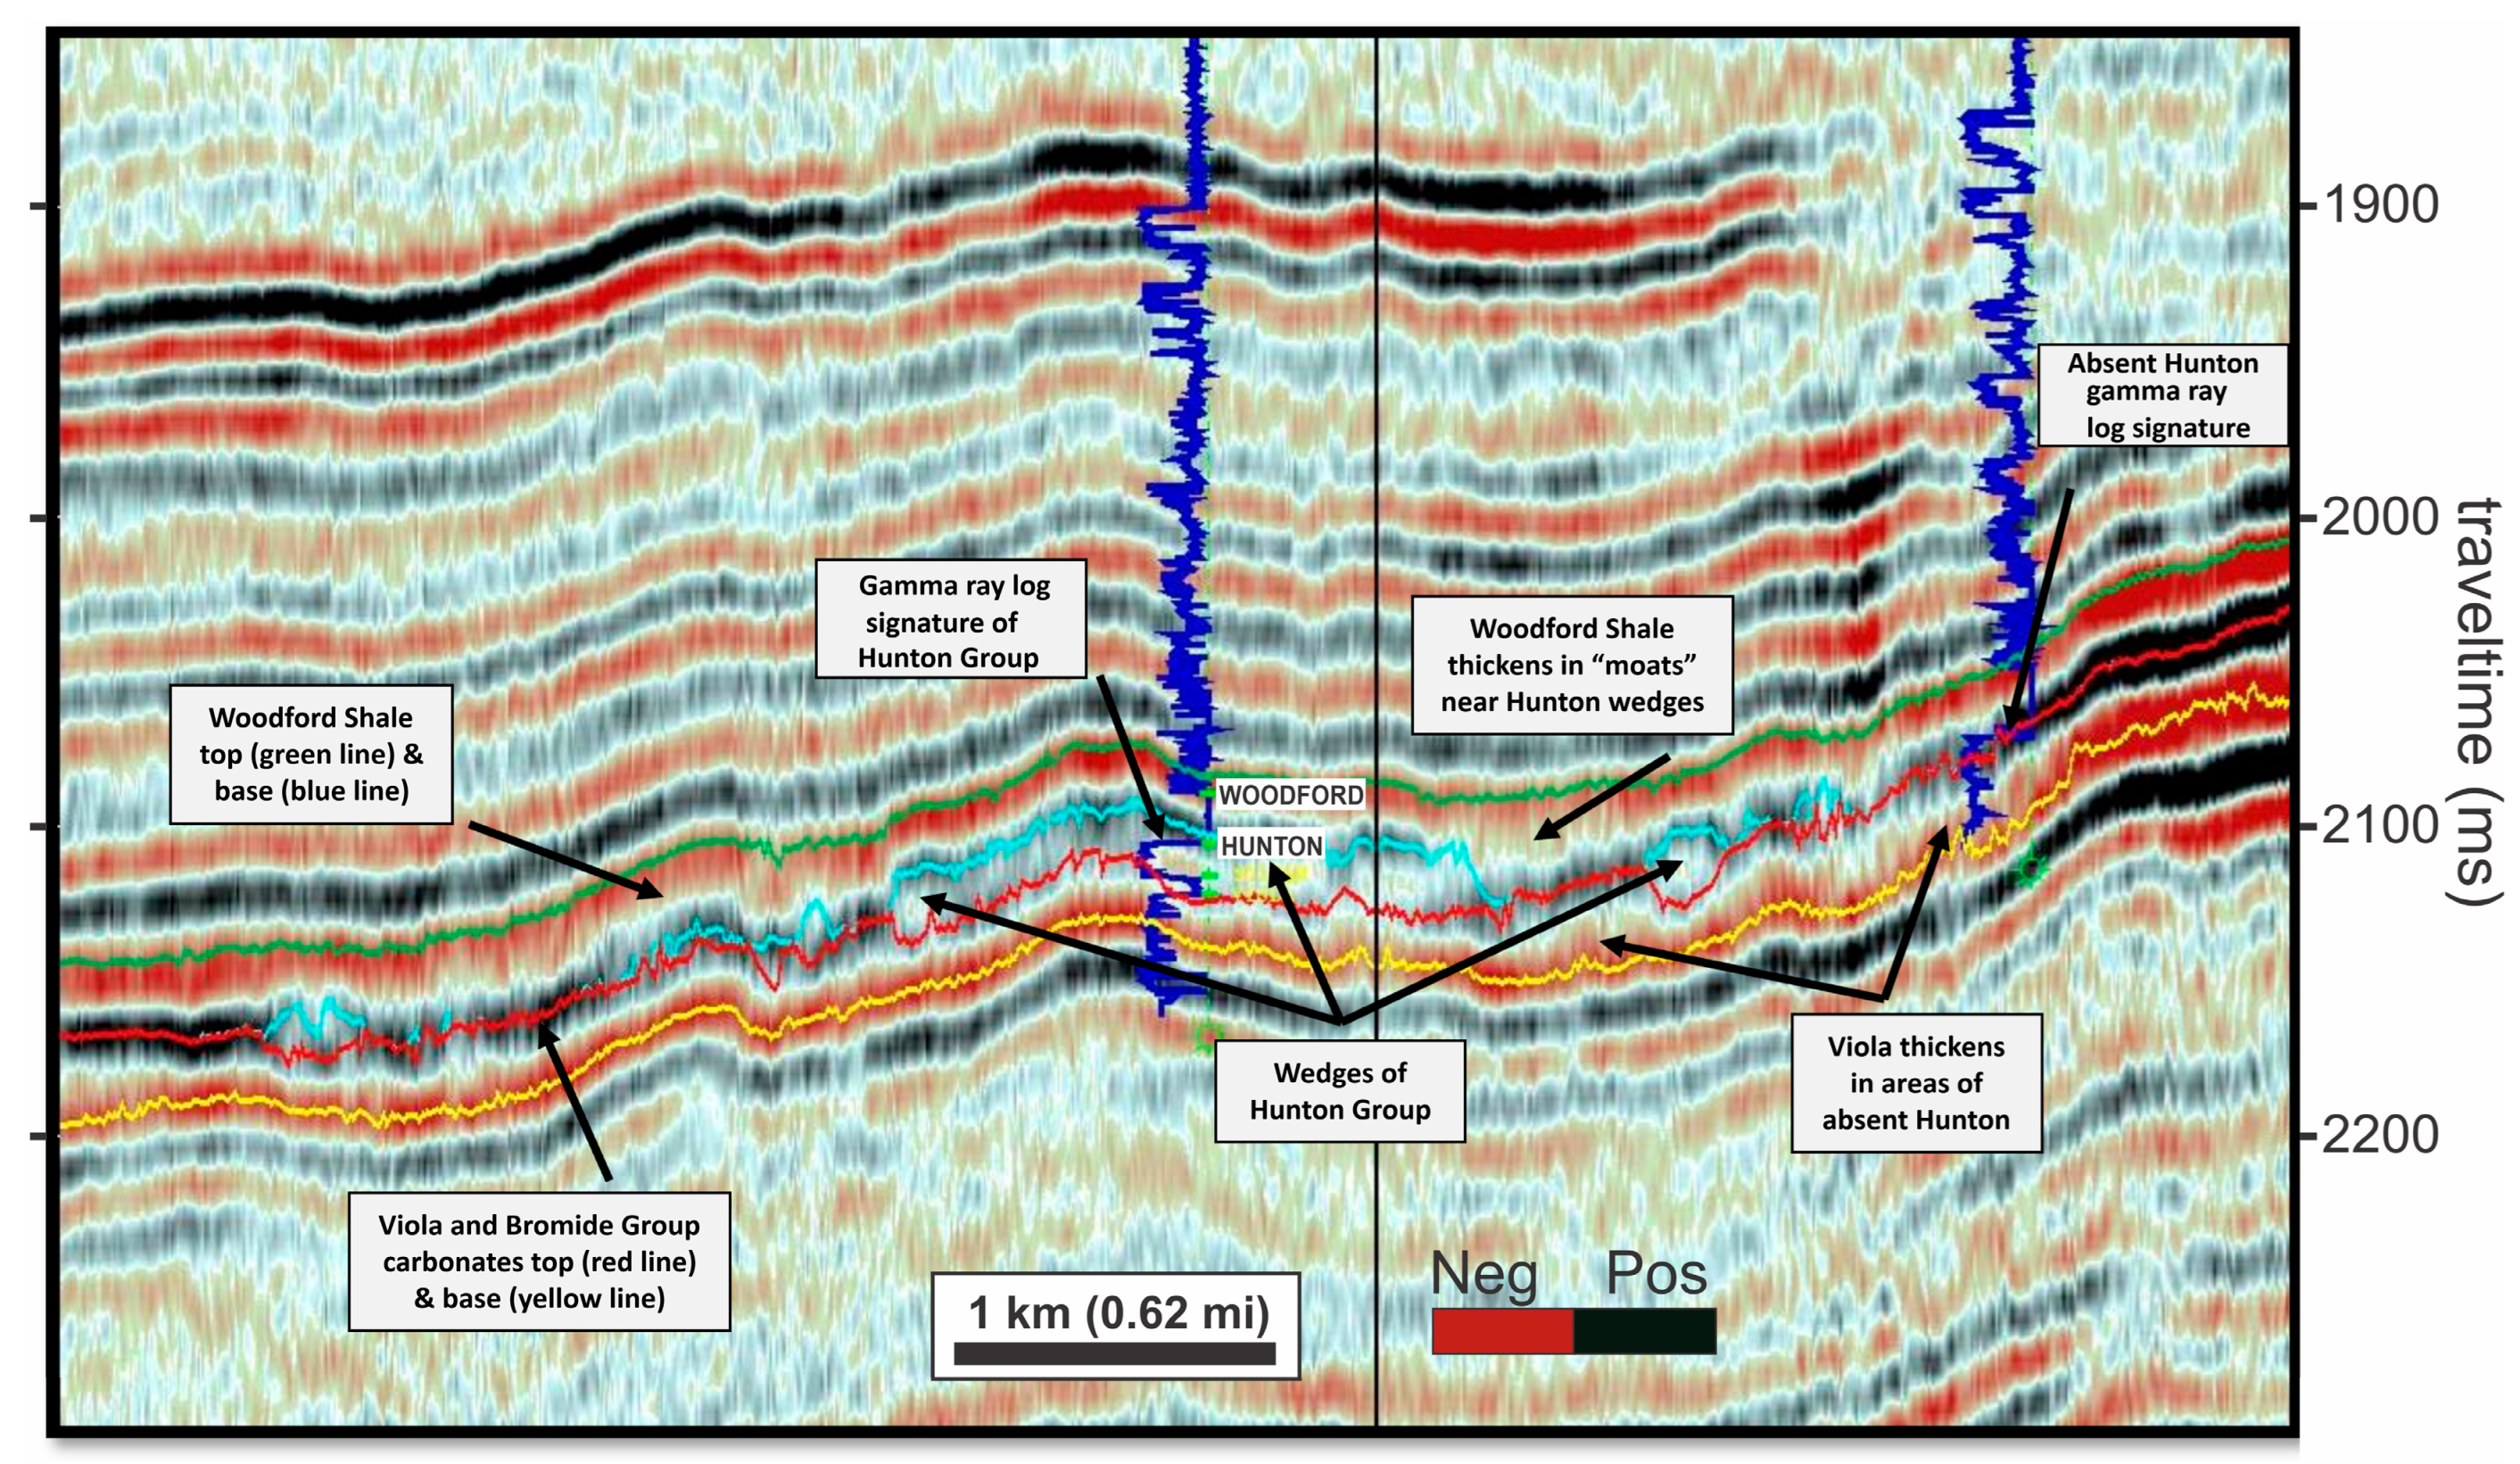
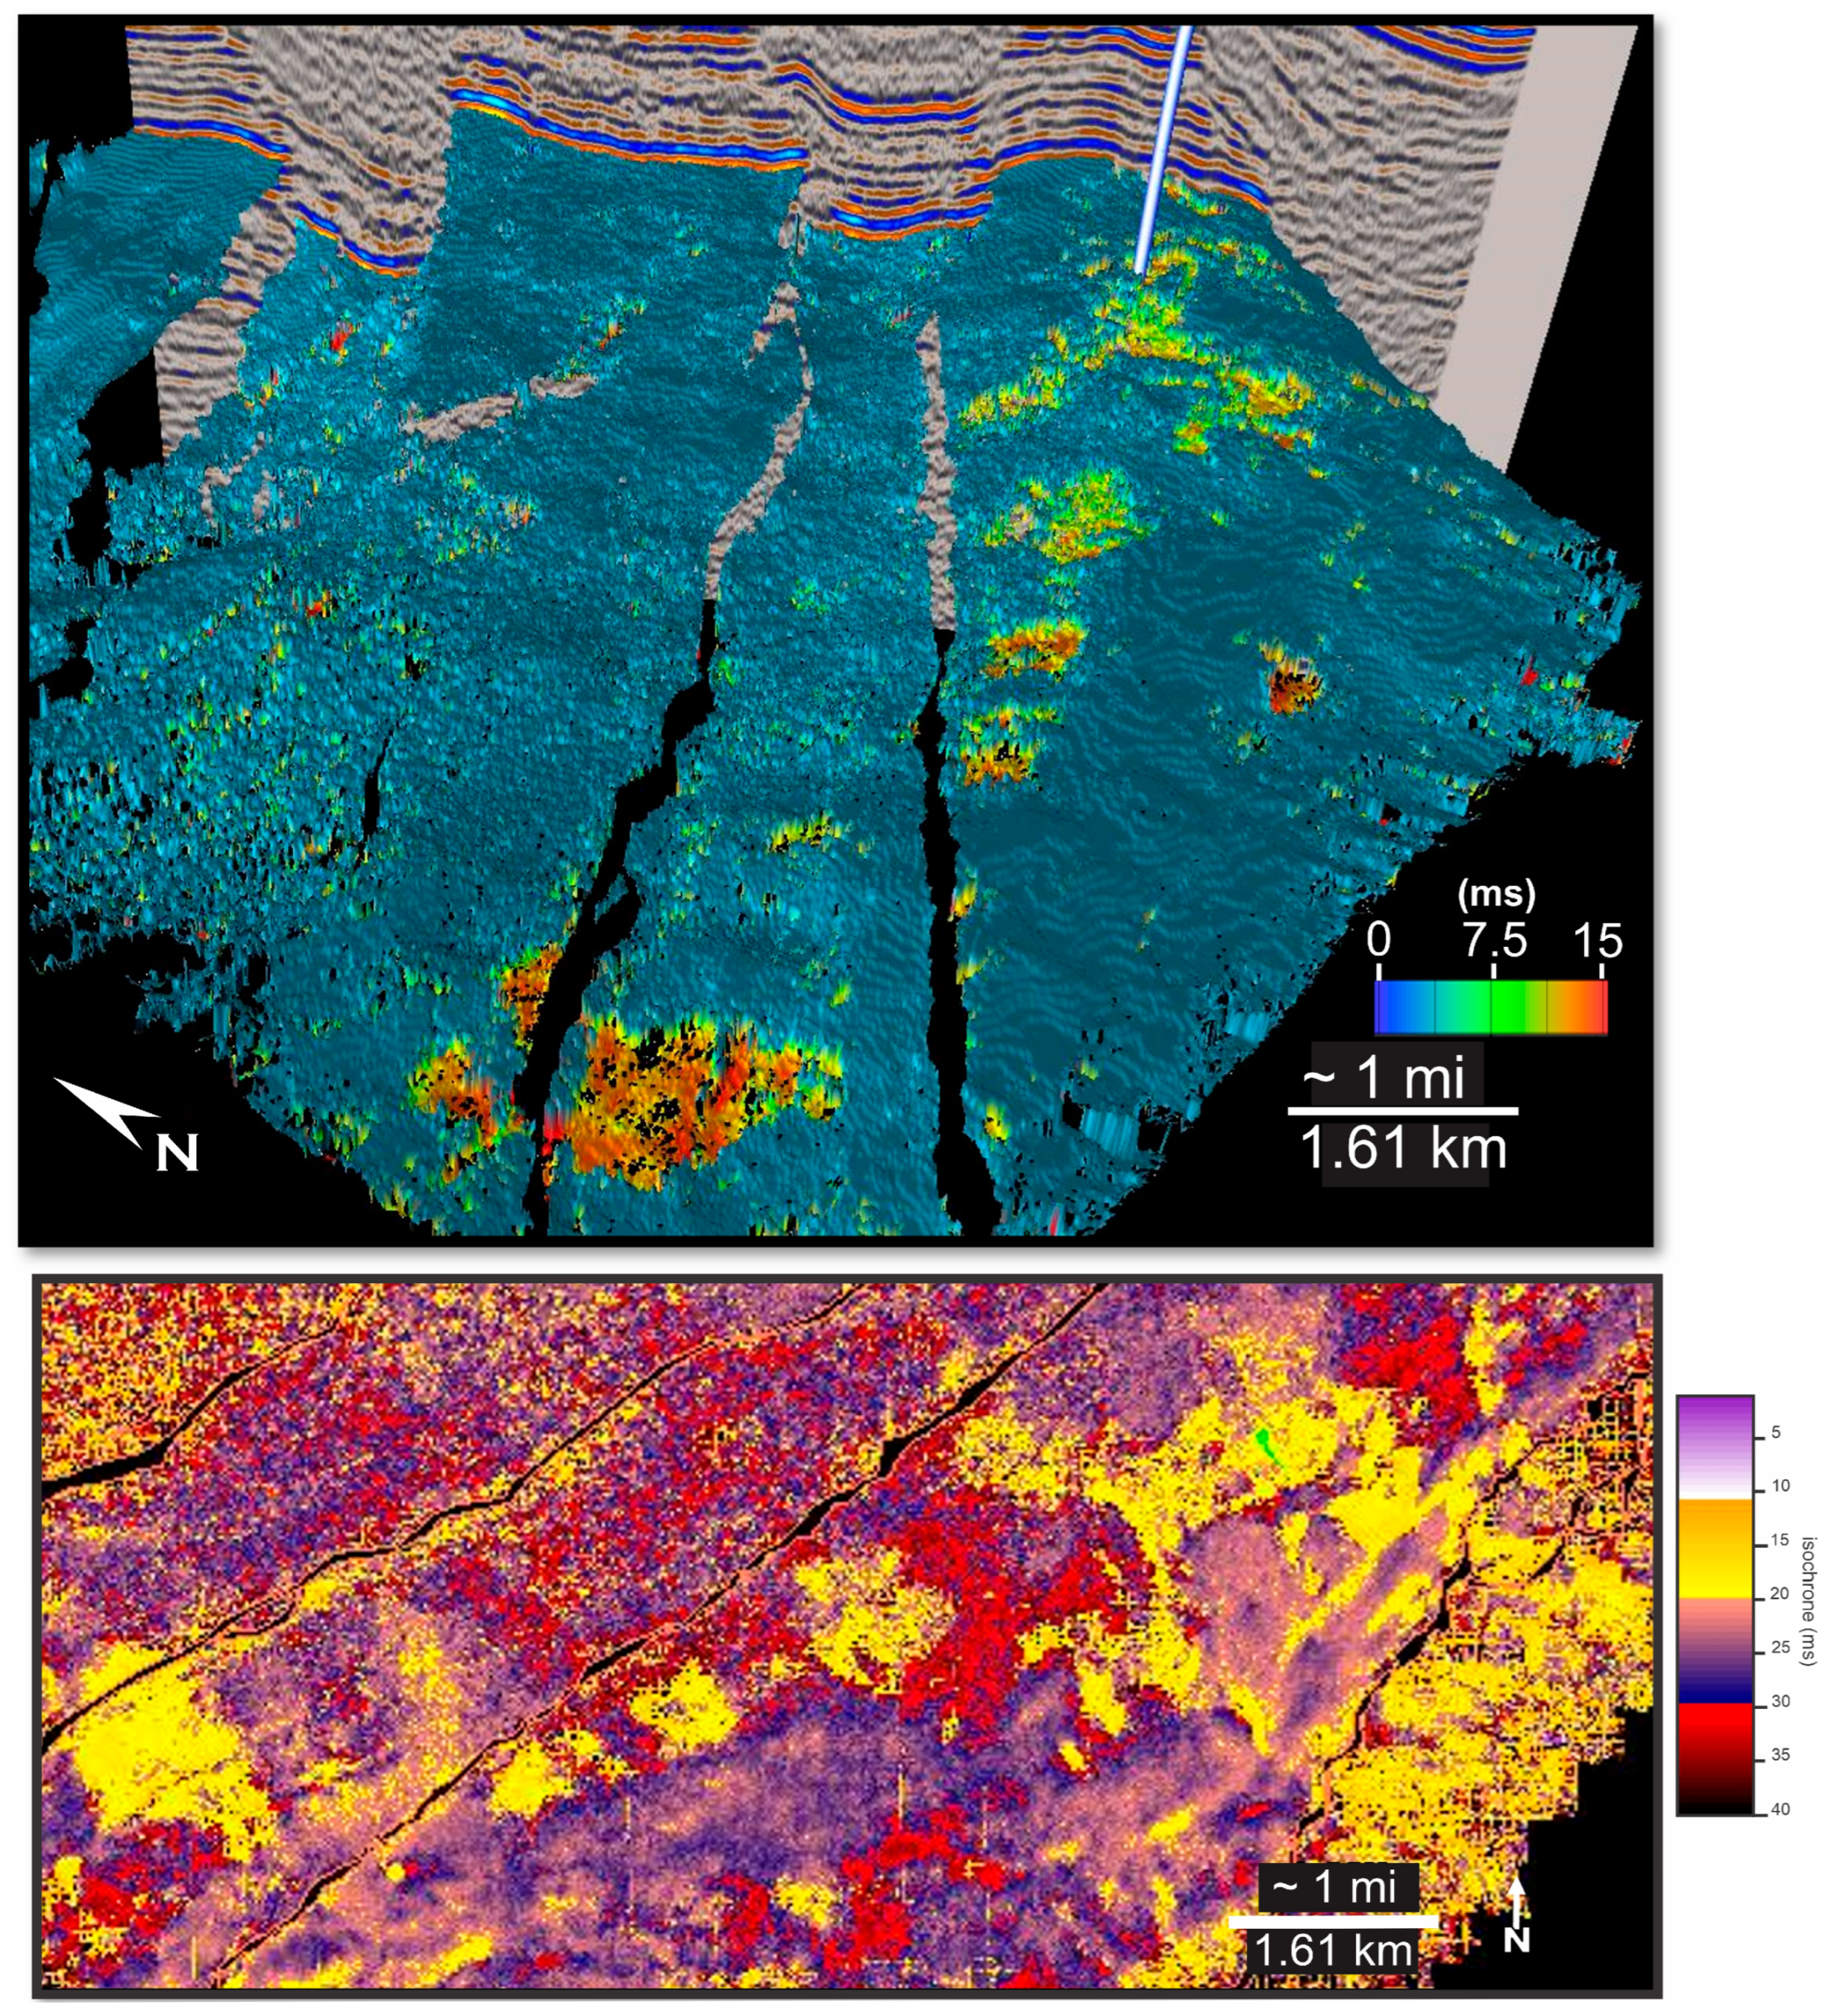
We seismically mapped five horizons: the top and base of the Woodford Shale, the top and base of the Viola Group, and a weak, interrupted horizon within the Viola (Figure 5). Areas lacking Hunton were defined where the base of the Woodford Shale coincided with the top of the Viola Group. In zones containing Hunton, we subtracted the base of the Woodford from the top of the Viola to create a Hunton isochron map. The Sylvan Shale was not resolvable in our seismic data, so it was grouped with the Hunton. Travel time–structure maps were produced by mapping these horizons at every fifth vertical section, in both inline and crossline directions. Areas with Hunton rocks were mapped more precisely, from every third to every line, since their weak amplitudes made them difficult for automated interpolation algorithms (auto pickers) to track. Fault heaves, which are the horizontal offsets that separate once continuous formations at a normal fault, are shown as gaps in the horizons. Control polygon maps were created by connecting these gaps, indicating fault heaves. These maps form a series of polygons outlining each fault heave. The control maps were then used with an interpolation algorithm to construct a continuous horizon from the interpreted lines, ensuring the algorithm did not interpolate across faults to maintain accuracy. Finally, the horizons were used to generate accurate isochron maps of the Woodford, Hunton/Sylvan, and Viola intervals through subtractive calculations (Figure 6).
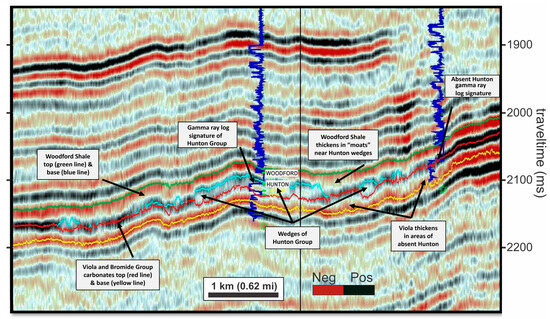
Figure 5.
An interpreted seismic section illustrating the stratigraphy involved in this study. The blue lines represent gamma-ray curves from two wells used to correlate the seismic survey with the relevant units. The well on the left is the 2004 well, which first confirmed the presence of Hunton wedges in the area. Observe the Hunton log signature in this well, as well as the low amplitude character of the Hunton wedges, the thickened Woodford ‘moats’, and how the Viola thickens in areas outside the Hunton that are likely also non-karsted. Note that for this and other sections or maps, precise location details are not provided to maintain the necessary confidentiality of the data.
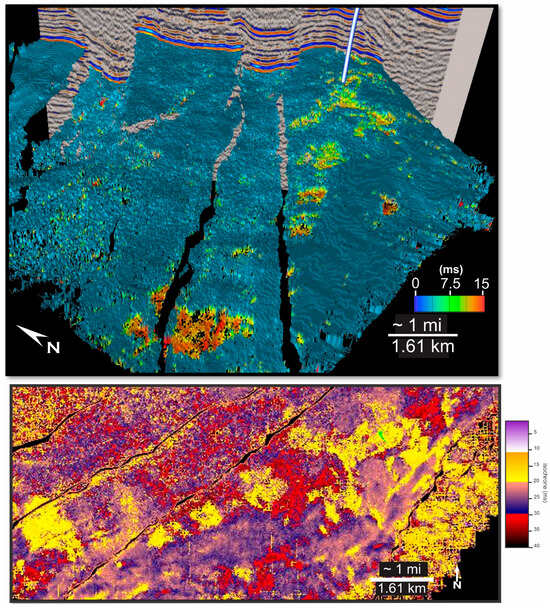
Figure 6.
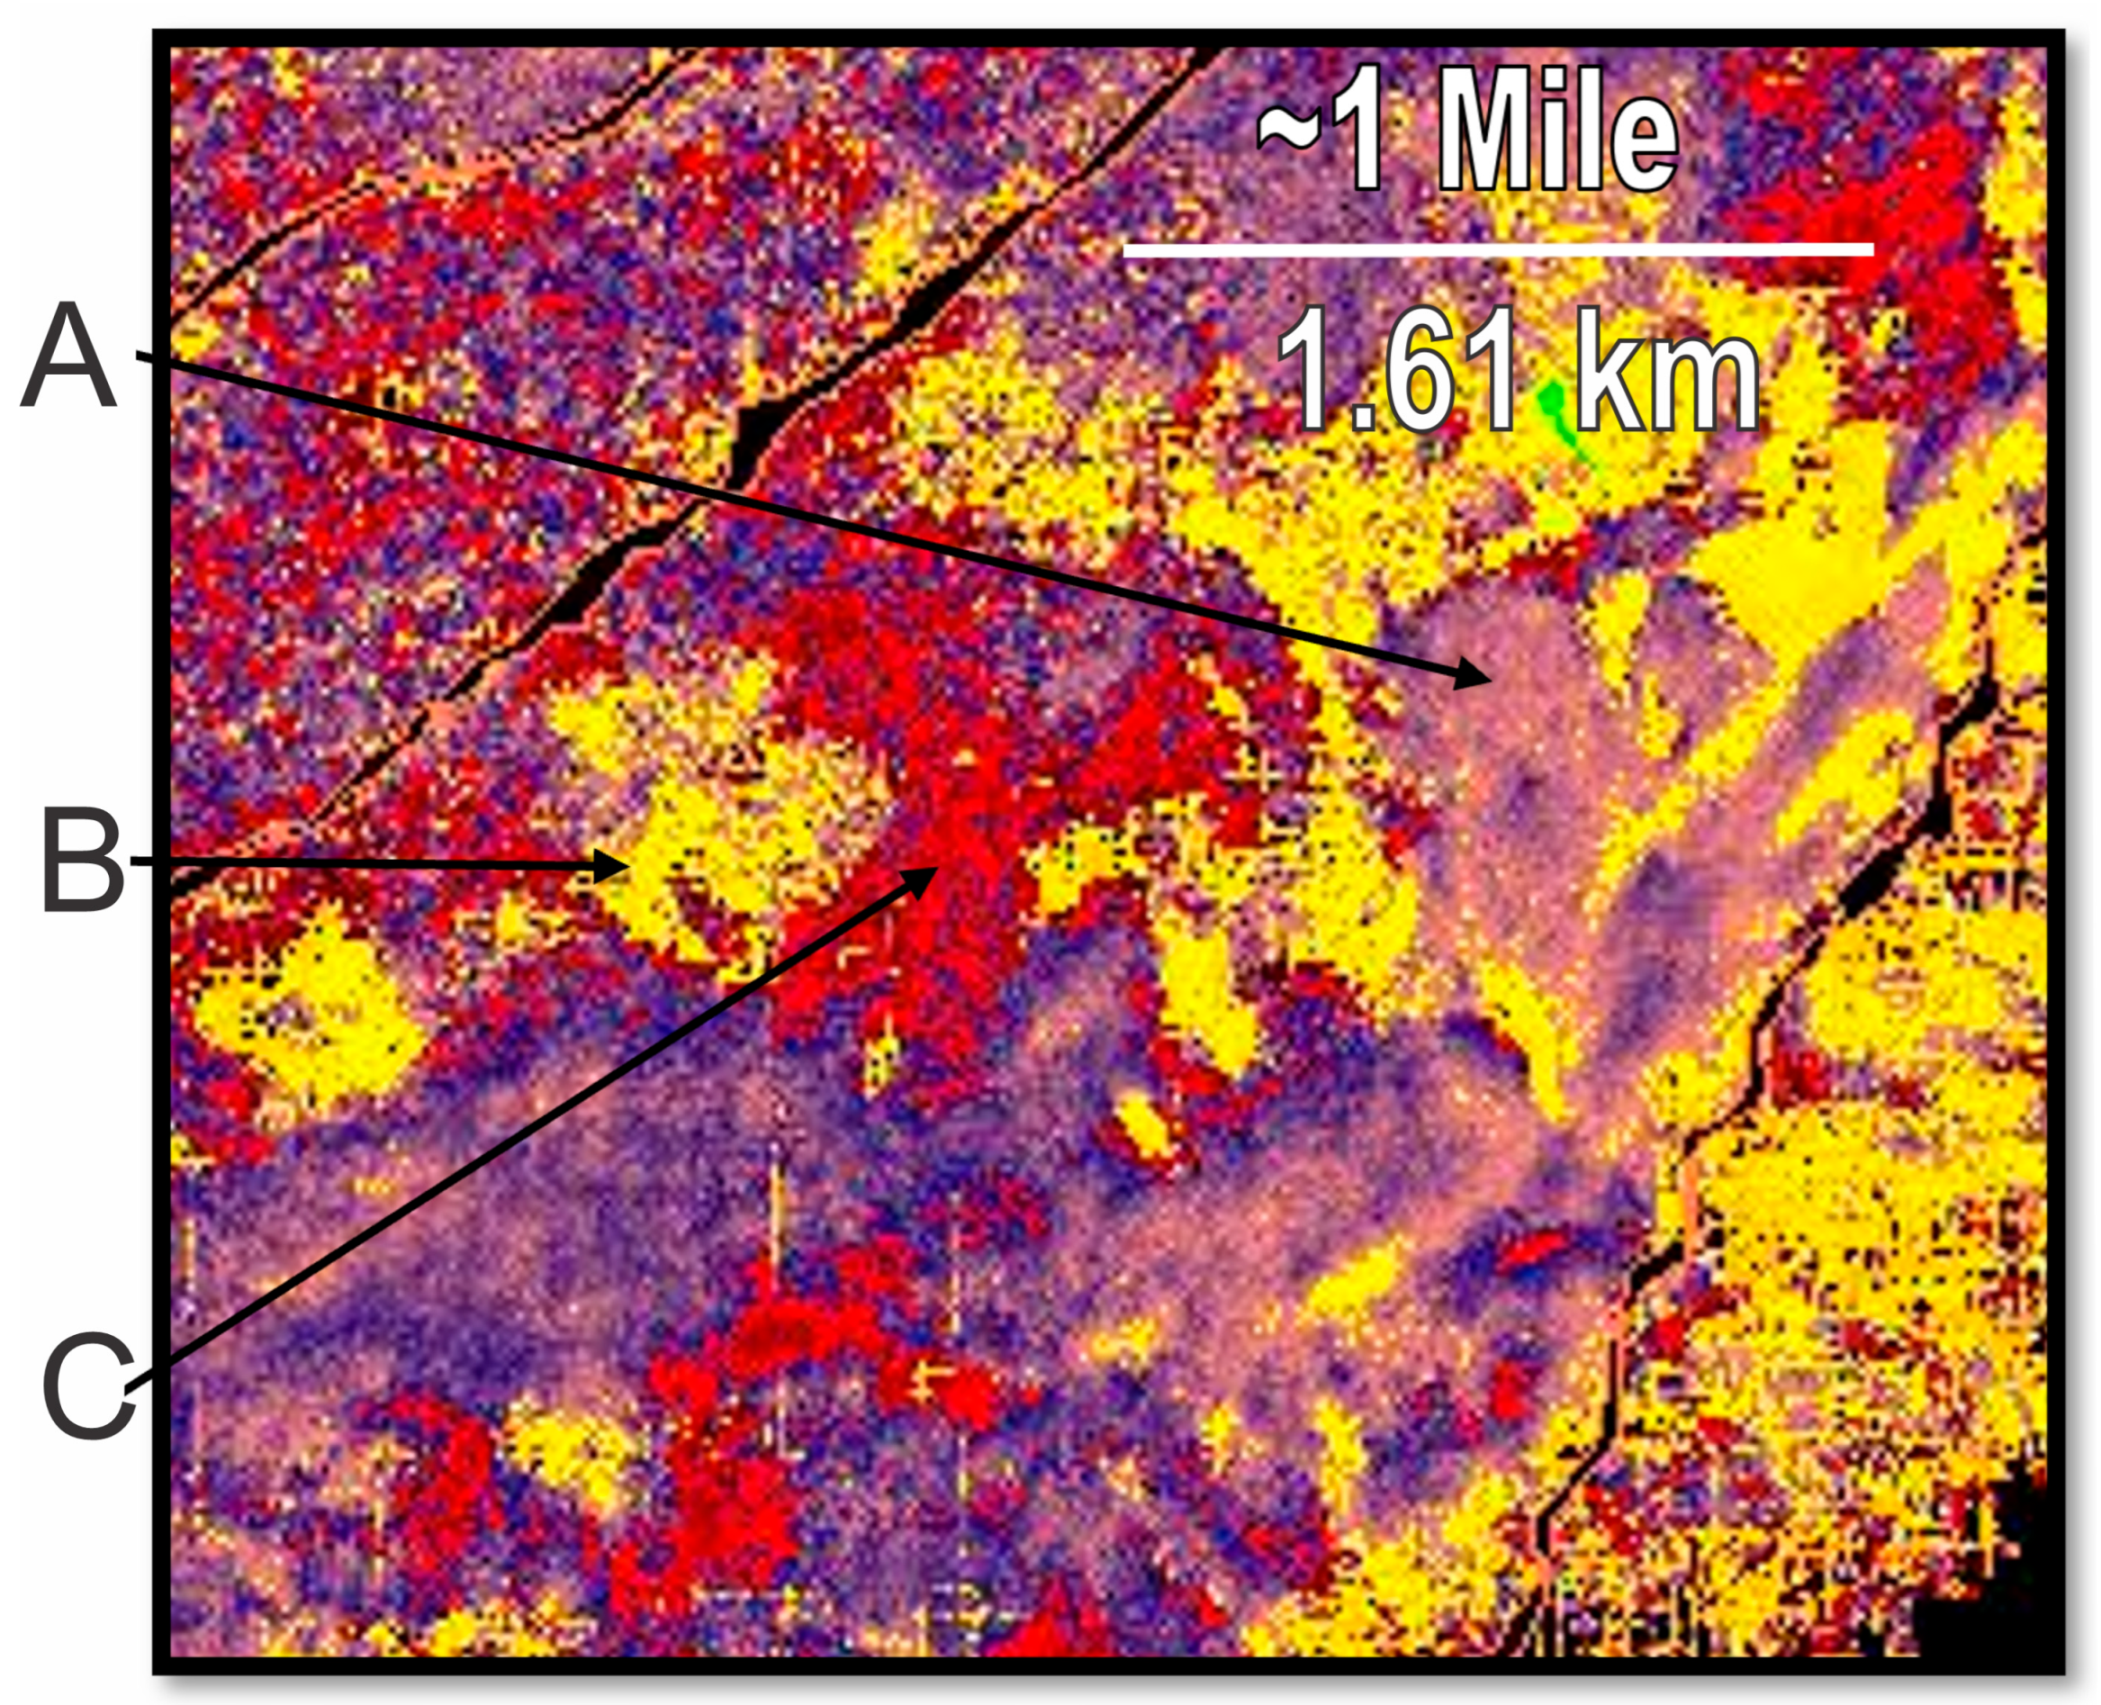
(Top) Time–structure map of the top of the Viola limestone, overlaid with an isochron map of the Hunton-Sylvan interval. Notice the large depressions appearing in the structure map, which are also visible in reds, greens, and yellows on the Hunton Isochron map. The reds indicate areas approximately 200 ft (61 m) thick, while the greens represent about 100 ft (30.5 m). (Bottom) Isochron of the Woodford Shale, created by subtracting the top Woodford pick from the base Woodford. Note that the Woodford thins over the Hunton wedges (yellow) and thickens considerably in “moats” around the Hunton wedges (red). The purples indicate unaffected Woodford sedimentation. The green dot and line in the upper right mark the 2004 well that first penetrated a Hunton wedge.
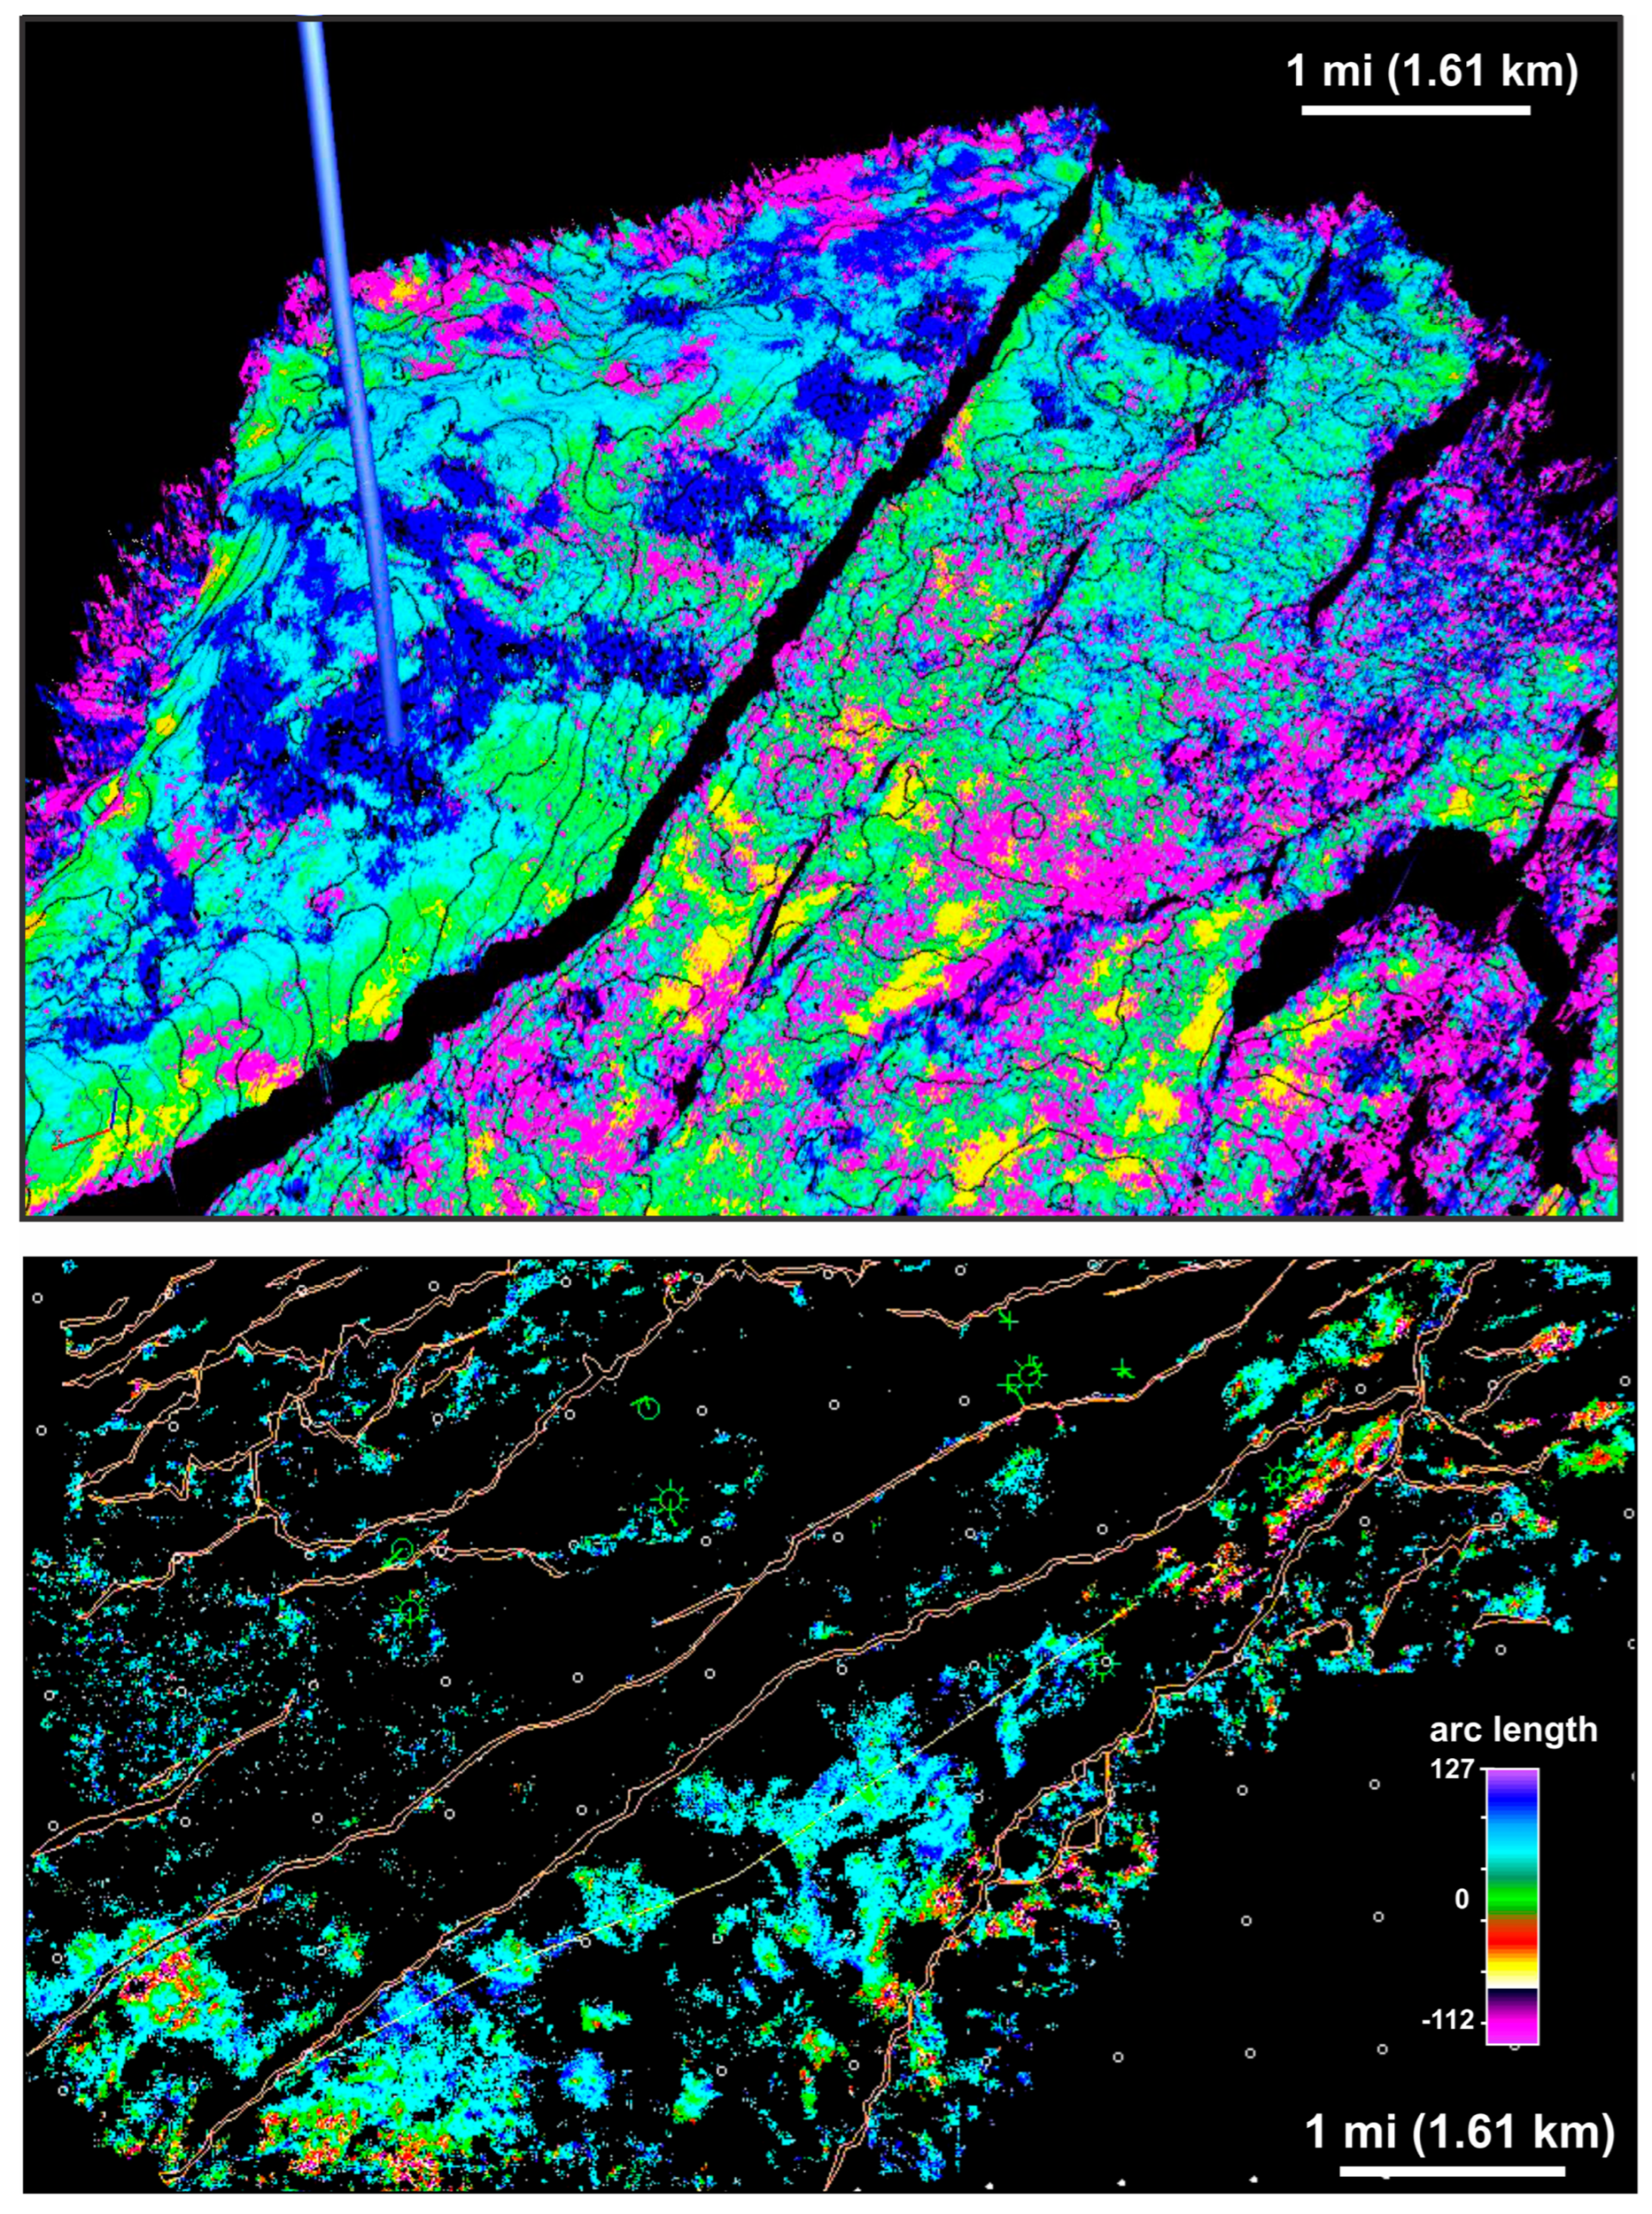
As we started to understand how these units connect, we chose the seismic attribute extractions that best demonstrate shared erosional and depositional relationships. Seismic attributes highlight features of the seismic response with geological importance, such as a high-amplitude fluvial channel contrasted against a low-amplitude background representing overbank muds [45]. The attribute extractions showed the zones of interest using three different methods: direct extraction via a total amplitude algorithm (Figure 7), a statistical analysis of the wavelet (to identify trends in the different frequency components of the waveform) over the zone of interest through a waveform extraction (Figure 8), and the isolation of wavelet components through frequency and phase extractions (Figure 8). Some extractions depicted Hunton rocks more clearly than others, including those that grouped Hunton rocks with unrelated deeper Viola stratigraphic variations. We validated the attribute extractions by comparing them with an isochron of the Hunton (Figure 6). We also tested several attributes, calculated through independent extracts, to validate the repeatability of our interpretations. Many attributes, such as the arc length extraction shown in Figure 8, accurately map the Hunton but tend to be grouped with the Viola stratigraphy (compare Figure 6 and Figure 8). Clumping of Hunton and Viola stratigraphy usually happened in frequency-dominated extractions, such as arc length, energy halftime, effective bandwidth, and dominant frequency series. The extractions used for this study are outlined in the Data Interpretation section.
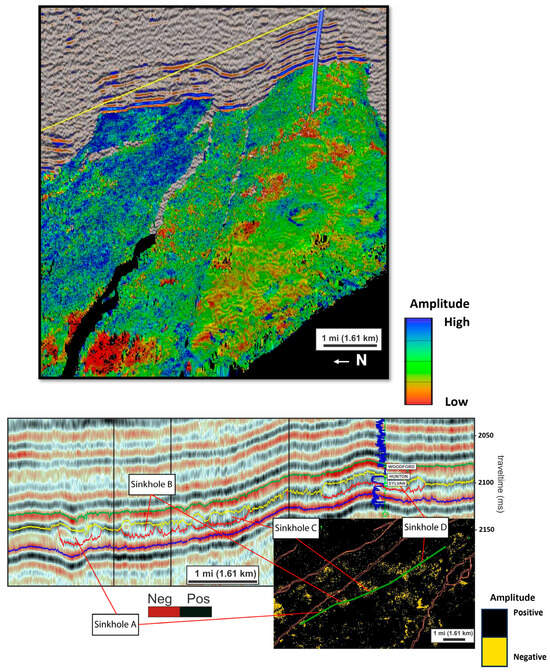
Figure 7.
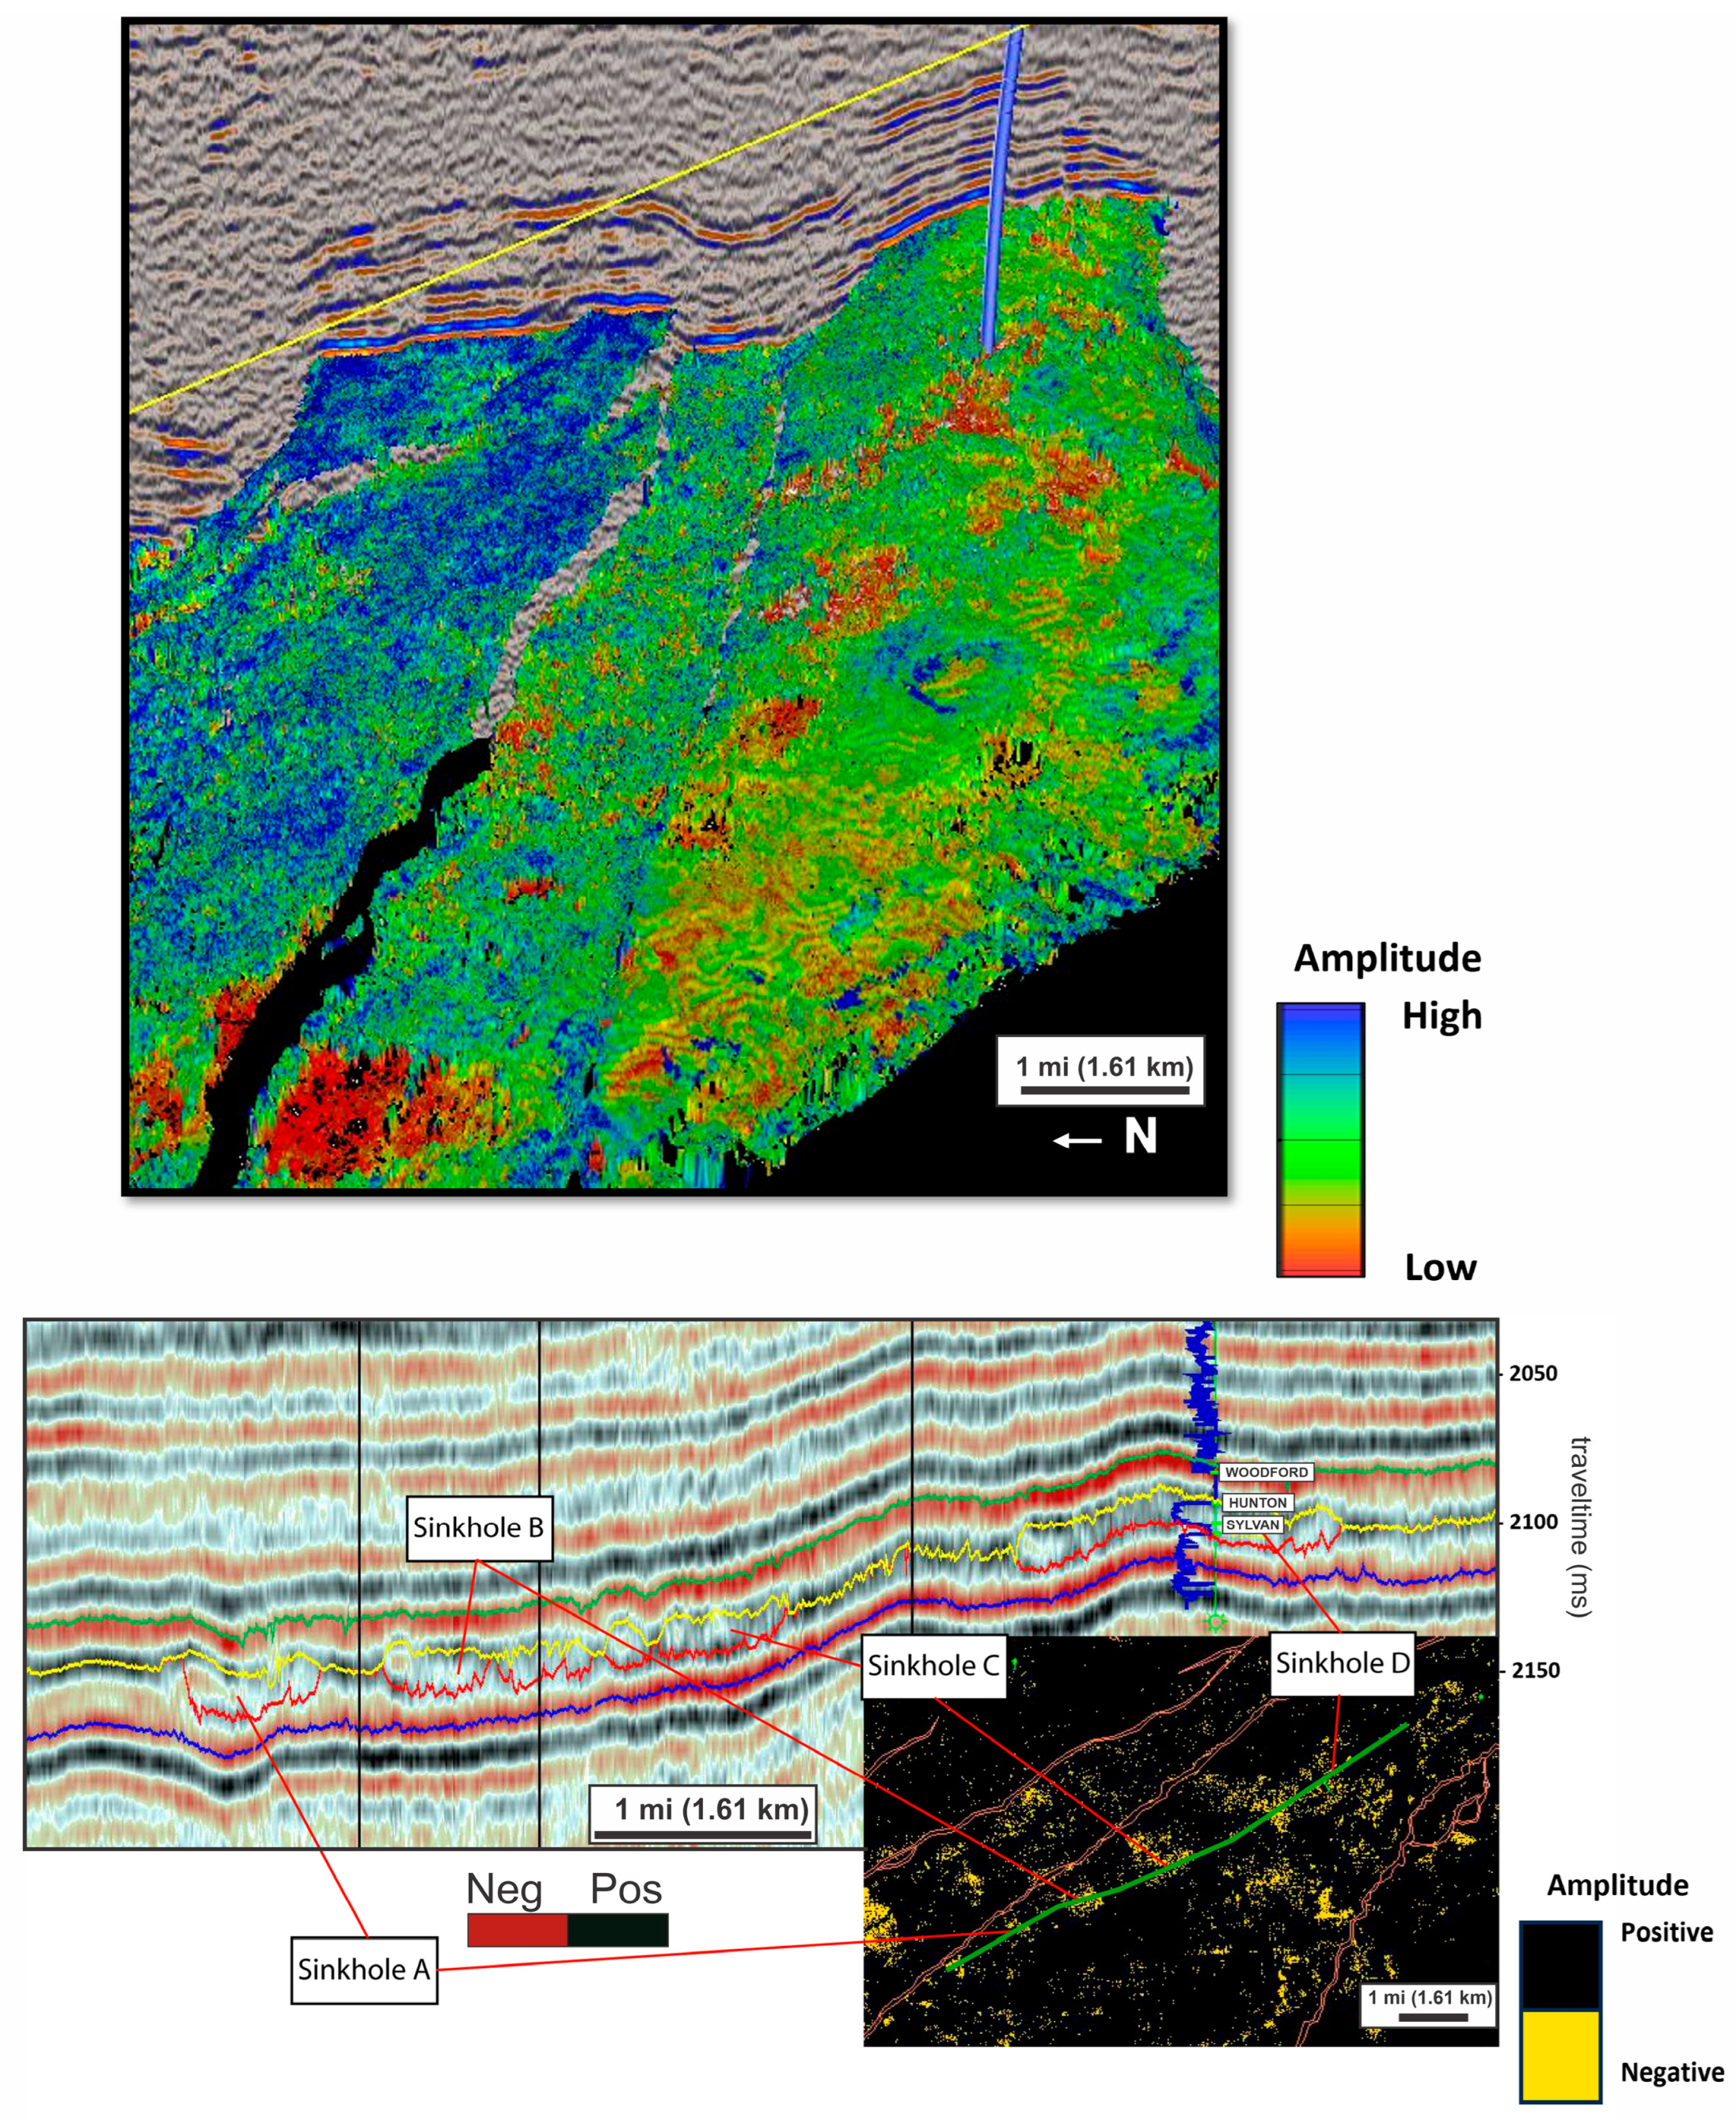
(Top) Time–structure map of the top of the Viola limestone, with a total amplitude map of the Hunton–Viola interval overlaid. Yellow line indicates link to nearby well. Reds indicate areas of negative amplitude anomalies, while greens and blues represent regions with much higher amplitudes. Notice that the red areas align with large depressions in the time–structure map. We interpret these depressions as sinkholes formed within the Viola interval, filled with Hunton debris, which, due to their disrupted nature, appear as negative amplitude anomalies in the total amplitude extraction. Hunton wedges are visible as areas of low amplitude because their chaotic structure scatters seismic energy. (Bottom) Seismic section connecting Hunton-filled Viola sinkholes to a total amplitude attribute analysis. The yellow areas on the amplitude maps represent negative amplitude anomalies, interpreted as the sinkholes mentioned earlier. The blue gamma ray curve on the seismic section shows the 2004 well that initially penetrated Hunton rocks. Note that it is located well within a negative amplitude anomaly zone. Additionally, observe how the trend of the sinkholes parallels the Pennsylvanian age normal faults (the red lines).
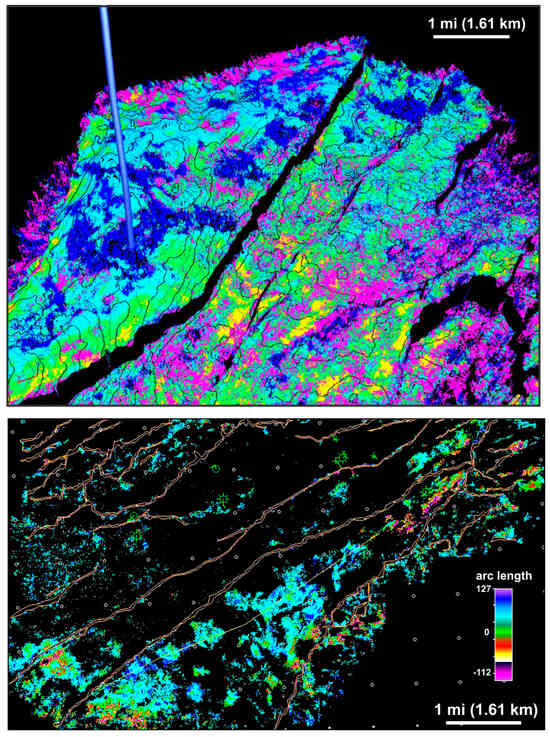
Figure 8.
(Top) Six-part waveform classifier illustrating areas of Hunton rocks in blue, emphasizing the distinctiveness of the Hunton waveform. The dark blue zones denote regions where the waveform classifier detected the Hunton characteristic. The light-blue pole marks the 2004 well that first penetrated Hunton rocks. Note that it is squarely within a blue zone interpreted as a Hunton wedge. The green, pink, and light blue zones indicate areas with varying Viola thickness and character. (Bottom) Arc length attribute extraction. Notice that many of the lower arc length anomalies (the bright spots) coincide with the Hunton wedges in the isochron map of Figure 6, but many, especially near the southern edge, do not. This is because this attribute tends to group the Hunton phenomena with Viola thickening, making this attribute a poor choice for mapping Hunton wedges.
6. Interpretation
6.1. Seismic Character of the Hunton
We began our interpretation by using synthetic seismograms from six wells to correlate formation tops with key stratigraphic horizons in the seismic sections. A notable first observation is the appearance of low-amplitude doublets (Figure 7) between the high-amplitude Woodford base and the top of the Viola Group, which is also a high-amplitude horizon. A well drilled in 2004 in the Red Oak gas field found wireline log characteristics of Hunton and underlying Sylvan Shale rocks, confirming that these low-amplitude doublets are Hunton rocks (Figure 7). Within the Hunton wedge perforated by the well, the base of the Woodford surface (top of the Hunton Group) was found to be 165 ft (50.3 m) above the Viola surface, separated by 102 ft (31.1 m) of Hunton rocks and another 63 ft (19.2 m) of Sylvan Shale (Figure 7).
We note that Figure 7 and other vertical views are displayed as “squash plots” where the traces are stacked close together to permit displaying a long section on a single page. This creates a vertically exaggerated image, which causes the interpreted stratigraphic “picks” to seem jagged. We note that the seismic picks are mostly on the zero-crossing and largely auto-picked to avoid subjective interpretations.
A synthetic seismogram was generated by first creating an acoustic impedance log from the density and sonic logs of our type well. This was then convolved with a source wavelet extracted from our seismic dataset. The resulting synthetic seismic trace helped define the seismic characteristics of the Woodford Shale, Hunton Group, and Viola Group, and was used to tie stratigraphic picks to the seismic data. The top of the Woodford Shale appears as a high-amplitude, continuous seismic trough, with the base following as a peak. Our synthetic model indicates this peak has a lower amplitude where Hunton rocks are present but is significantly higher when positioned over the Viola Group (Figure 7). The Hunton interval is characterized as a discontinuous, low-amplitude doublet, 20 to 30 ms in travel time thickness. The Sylvan Shale, with its lower seismic velocity, is indistinguishable from the Hunton, causing the base of the Hunton/Sylvan interval to appear as a single peak. This same high-amplitude, continuous peak also corresponds to the top of the Viola. The interpreted Viola horizon includes the underlying Bromide Dense Member of the Bromide Group, as they are seismically indistinguishable. The base of this interval is marked by the underlying high-amplitude, continuous trough (Figure 7).
The seismic response in each wedge of the Hunton varies significantly from the response where the Hunton is absent. This variation in seismic behavior is clearly demonstrated where the total amplitude of the interpreted Hunton–Viola wavelet is overlaid on the interpreted Viola time–structure map (Figure 7). Irregular amplitude lows align with the Hunton wedges, as shown by comparing the Viola surface (Figure 7) with the Hunton isochron map (Figure 6). This isochron surface follows a reflection trough between the interpreted base of the Woodford Shale and the top of the Viola Group.
6.2. Imaging Collapse Features Within the Viola Group
A notable feature of the Arkoma basin stratigraphy identified in this study is how Hunton rocks have been affected by solution collapse originating from deeper rocks of the Ordovician-age Viola Group, which has complicated the depositional thickness of the Woodford as it was laid down across the area. This is illustrated in a lithology log correlation in the Red Oak Gas Field (Figure 9 and Figure 10). Precise mapping of the Hunton wedges’ influence on Woodford thickening (Figure 6) and the shapes of these wedges (Figure 6) can only be achieved using 3D seismic data. Depressions are visible in the seismic-interpreted Viola surface (Figure 6). An important observation is that these Viola depressions are located directly beneath similar lenses of Hunton rocks approximately 100 ft (~30.5 m) thick, supporting the interpretation of a genetic link between the Hunton wedges and the underlying Viola depressions.
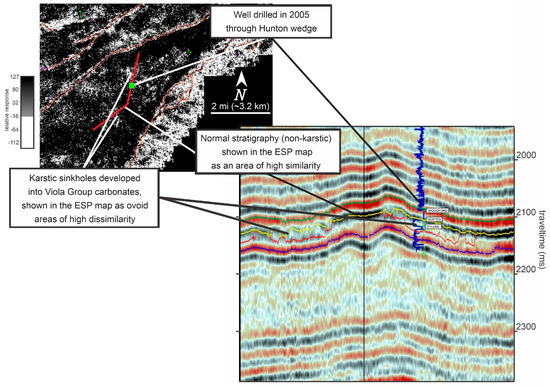
Figure 9.
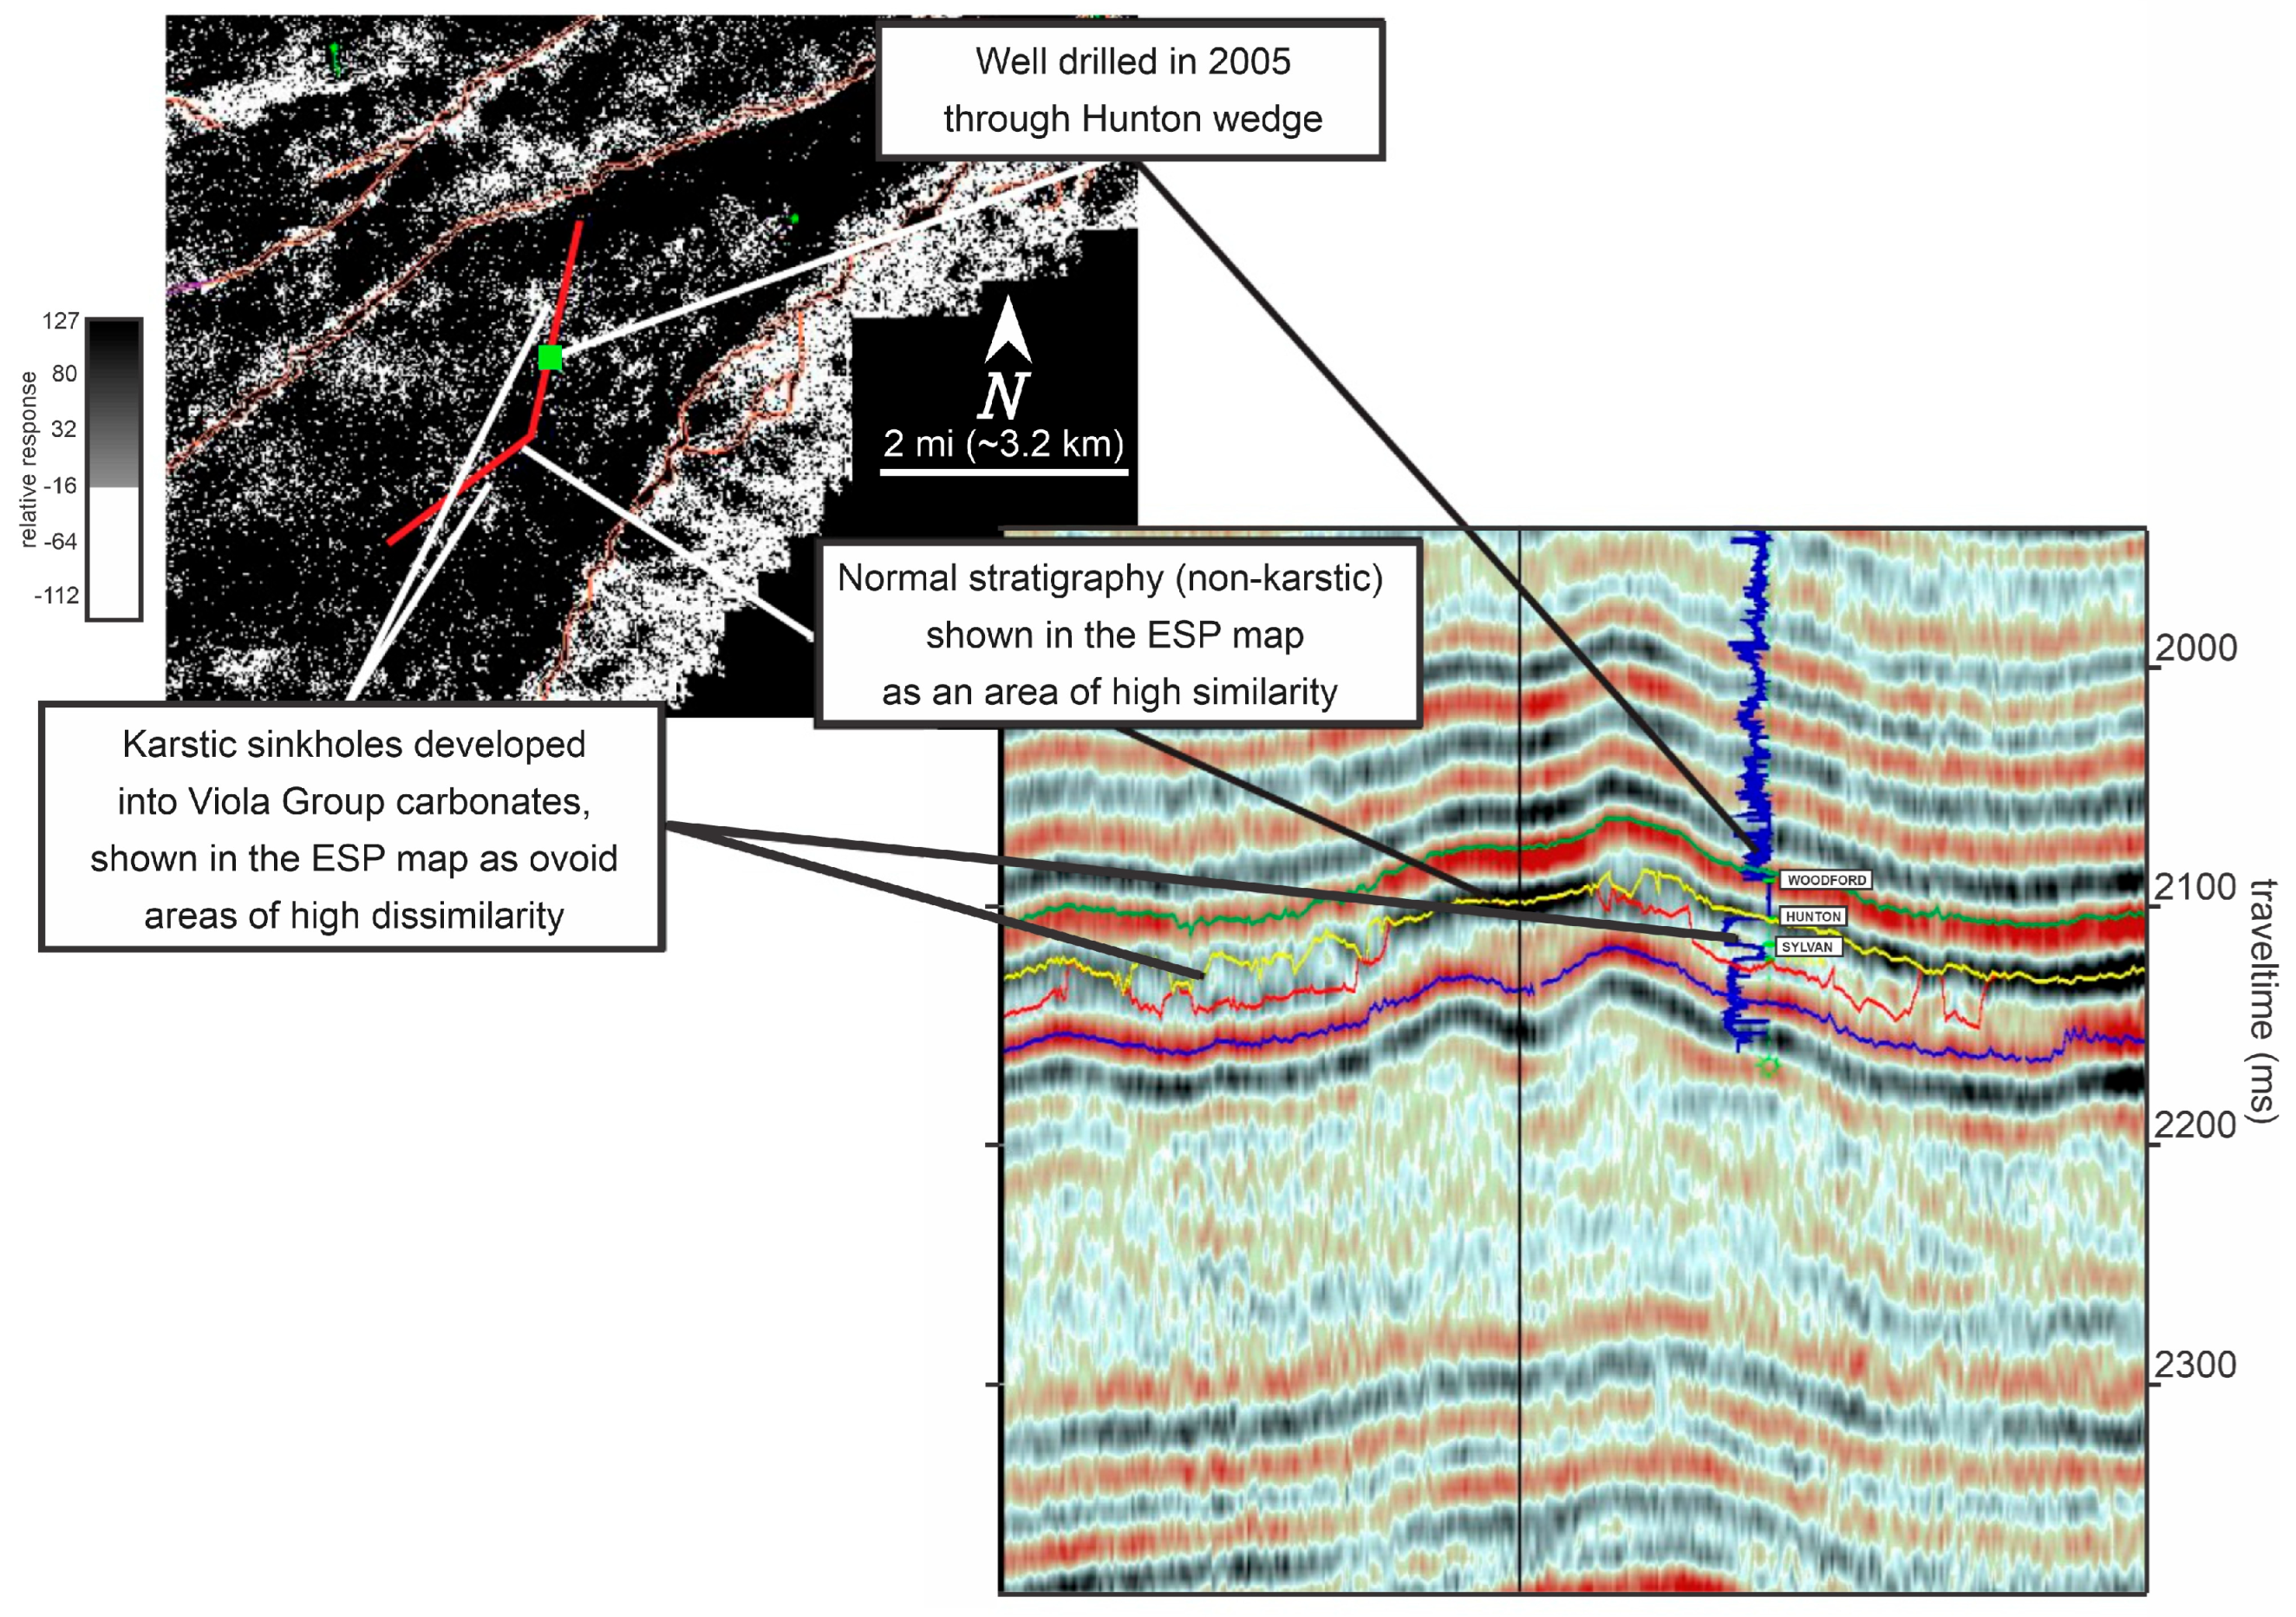
ESP (Event Similarity Prediction) extraction at the top of the Viola shows the edges of the sinkholes filled with Hunton debris. To better interpret the karstic collapse and determine its size and orientation, the ESP attribute was calculated within a window spanning the top of the Viola to the base Bromide. The ESP attribute primarily measures trace-to-trace dissimilarity. In the figure above, regions of high dissimilarity are shown in white, whereas areas of relatively low dissimilarity (indicating more uniform geology) are depicted in black. The ESP attribute window clearly emphasizes the major collapse trends and significantly enhances the interpretation of subtle collapse features compared to conventional 3D seismic data in time-slice view.
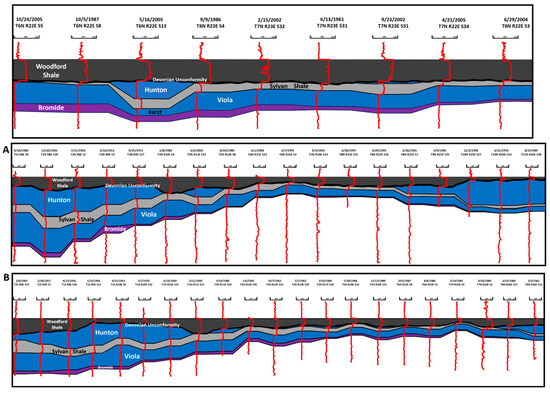
Figure 10.
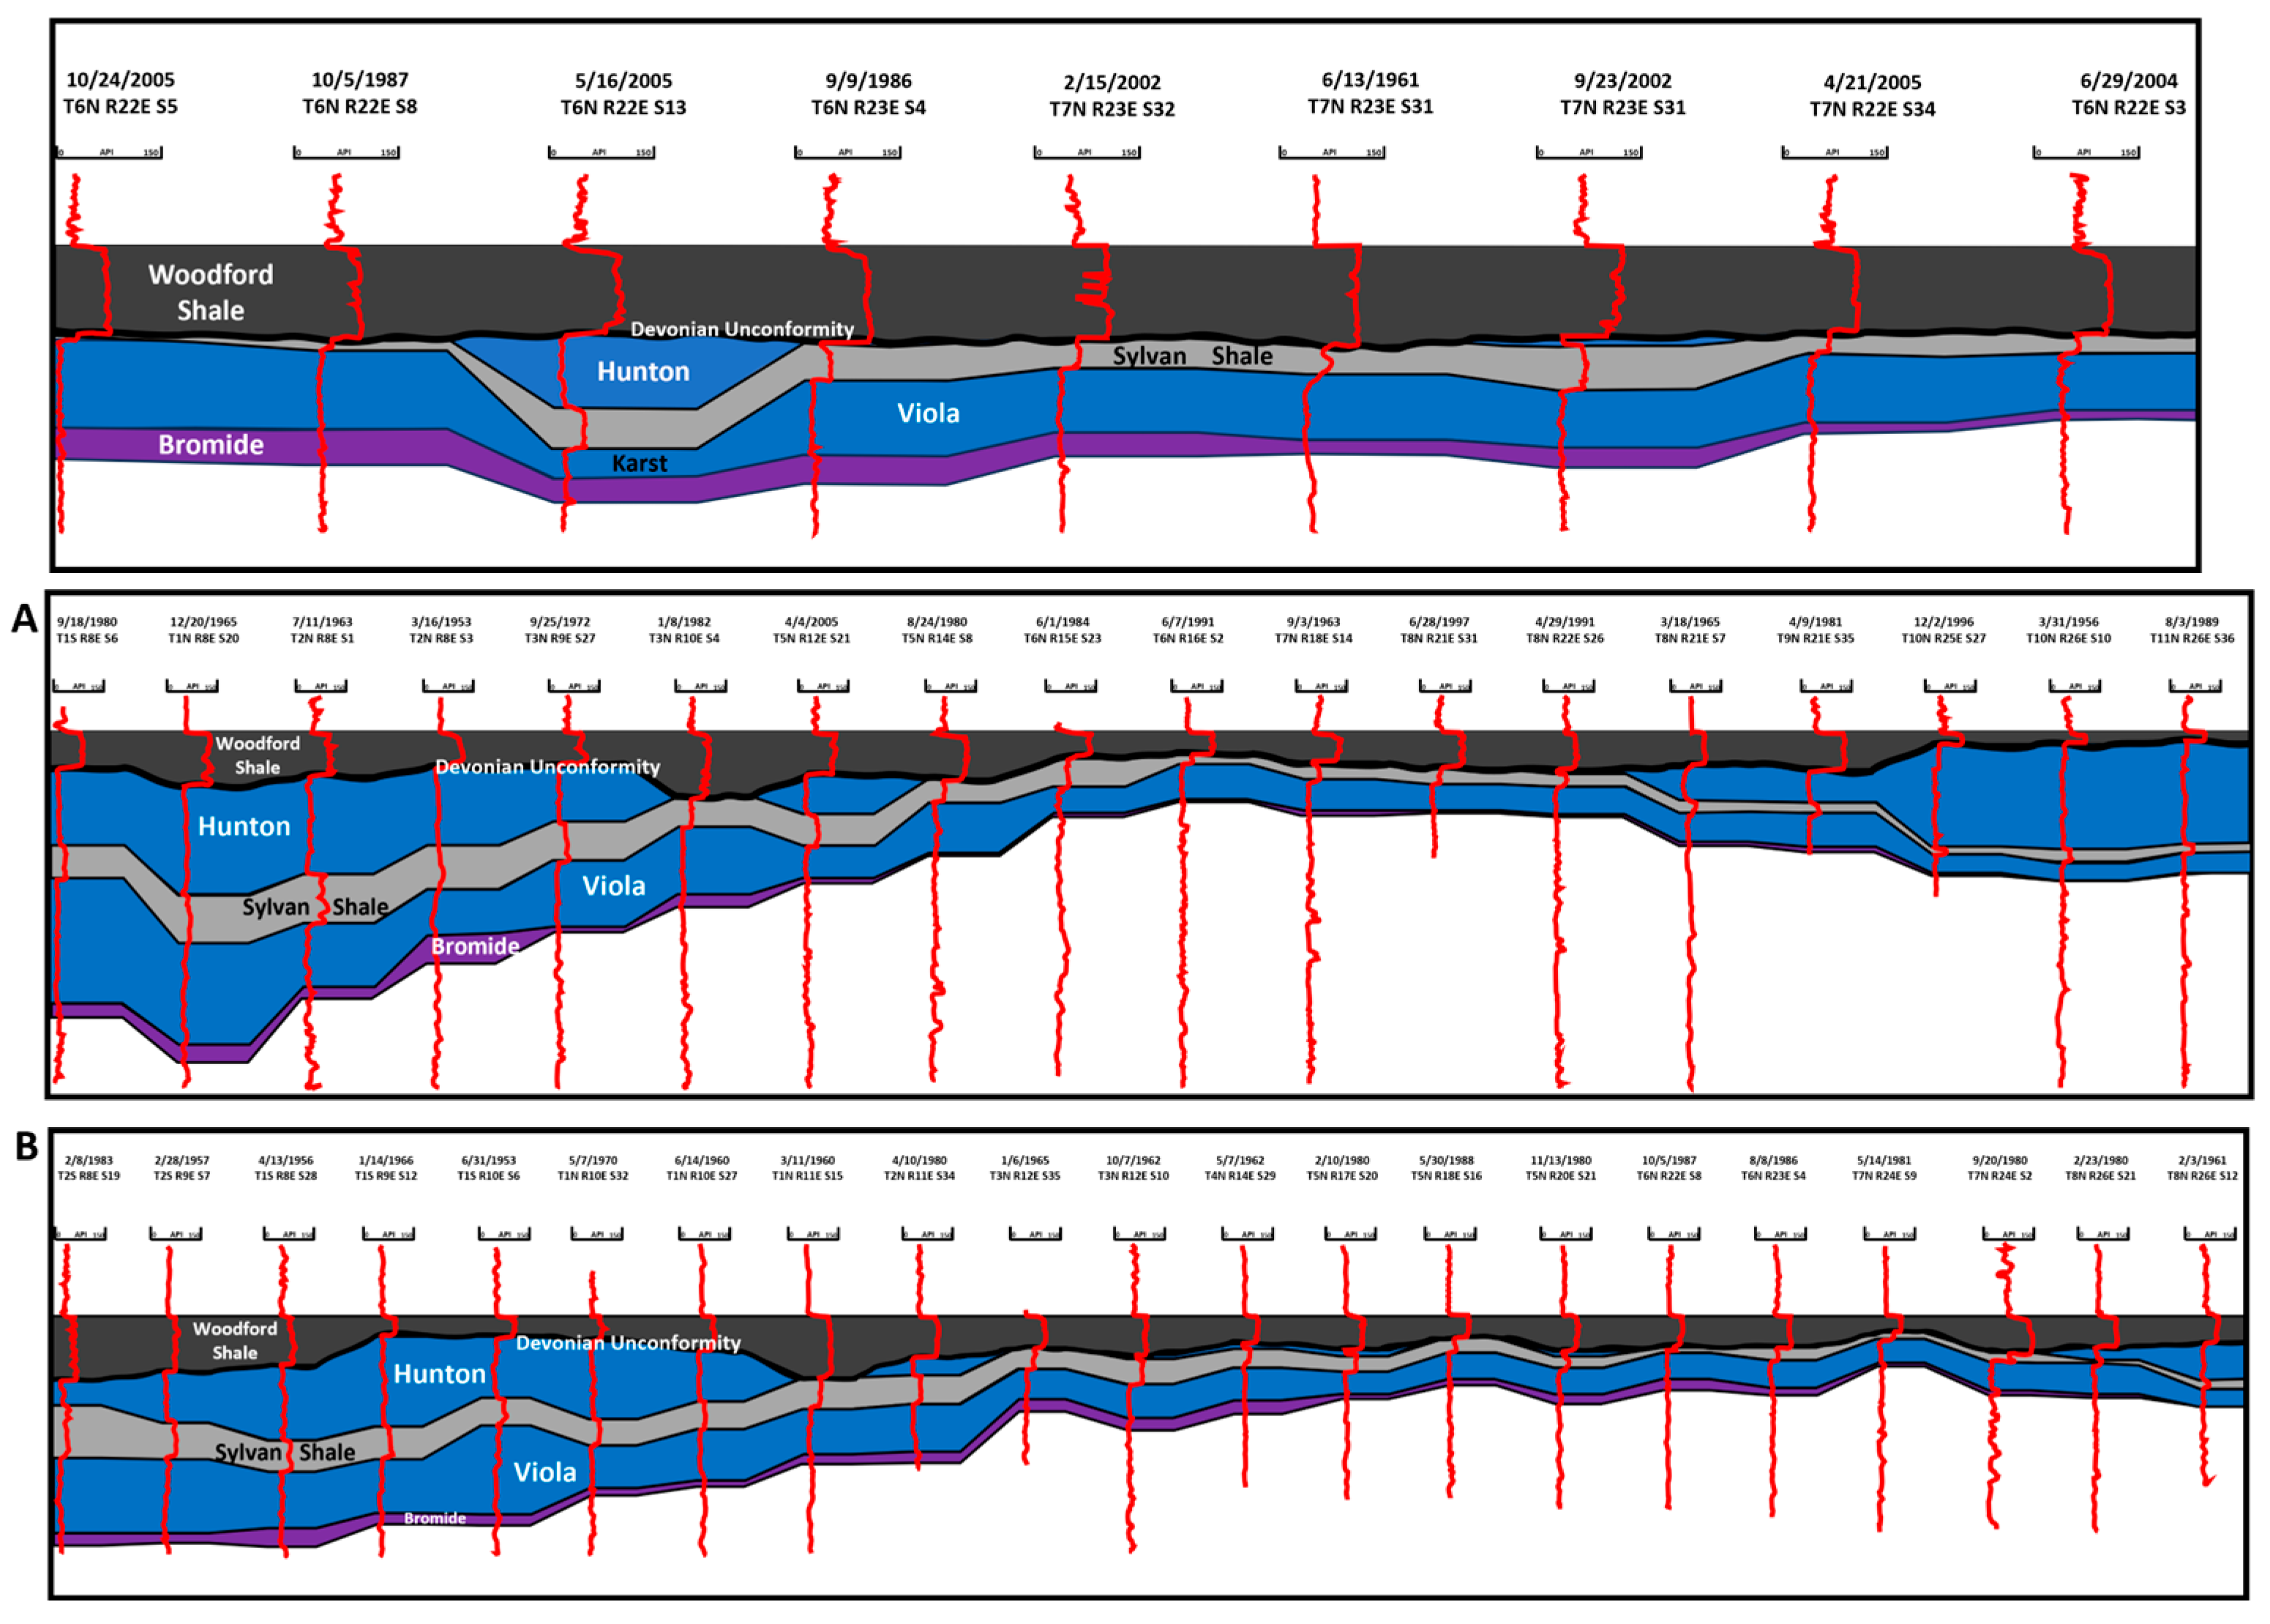
(Top) Interpretation of gamma-ray well log correlation across the Red Oak gas field, flattened on the top of the Woodford Shale. This correlation displays a thick Hunton wedge with an unusually thin Viola interval beneath it in the 2004 well shown in Figure 7. See [44] for further information. See ref. [44] for more details on the well log curves. (Bottom) Two interpreted gamma-ray well log correlations are displayed across the Arkoma basin, extending from southwest to northeast. They are flattened on the top of the Woodford Shale. Notice that a structural arch was levelled during the pre-Woodford unconformity, which allowed Hunton rocks to be eroded and karst to form in the Viola. Cross-section A corresponds to the northern green line in Figure 2, and cross-section B to the southern line. See ref. [44] for more details on the well log curves.
These collapse zones occur at a high spatial density, with adjacent collapses often separated by only 1 mi (1.61 km) or less (Figure 6). Due to the severe topographical disruption on the Hunton surface caused by the Viola collapses, they substantially affected Mississippian sedimentation in the overlying Woodford Shale. Such collapse features should therefore be considered when attempting to understand sedimentation patterns over karst-prone carbonates in general.
Event Similarity Prediction (ESP) attribute extractions essentially measure trace-to-trace dissimilarity across a set time window in the seismic data. The advantage of ESP dissimilarity maps (Figure 9) is that they reveal and highlight lateral seismic changes that may relate to geological anomalies. These maps provide visual identification of such features as faults, facies changes, and other geological patterns. Faults and stratigraphic changes (such as the collapse features within the Viola) often stand out in otherwise homogeneous displays [46]. One expects high trace-to-trace similarity where strata are flat and continuous, lower values when they are dipping but still continuous, and anomalous values when they are discontinuous. The ESP map (Figure 9) was calculated along the top of the Viola horizon and revealed strong circular and ovoid anomalies that correspond with mapped Hunton wedges. We interpret these anomalies as a truncation effect, meaning a line where continuous strata are cut by some geological feature. This karstening phenomenon is further illustrated by the interpreted sinkholes on an ESP map extracted from the Viola interval (Figure 9), from which the location, size, shape, and orientation of the Hunton lenses and interpreted sinkholes in Viola group rocks (near the Hunton base) can be derived. Since ESP volumes are essentially a measure of trace-to-trace similarity, discontinuities in the seismic data are enhanced [47]. The ESP map (Figure 9) shows that ovoid disruptions (white areas) occur across the top Viola horizon. Correlating this disruption pattern with the Hunton isochron map (Figure 6) confirms that each of these anomalies corresponds to a depression on the Viola surface.
The total amplitude and Viola ESP maps (Figure 7 and Figure 9) show that several depressions form a line nearly parallel to the normal fault system cutting through the Viola surface. This suggests that the same stress field responsible for normal faulting was active during the pre-Woodford unconformity. Fractures may have opened parallel to the fault lines, allowing meteoric waters to initiate dissolution. These depressions are typically oval, with the long axis parallel to the faults, ranging in length from approximately 500 ft (152 m) to 5000 ft (1524 m).
In the northern part of the Red Oak gas field, which we interpret as lacking Hunton wedges, the thickness of the Viola measured from well data is similar to that beneath the Hunton intervals. We suggest that the soluble part of the Viola responsible for karsting has been eroded (Welling Member?) (Figure 4) from both areas, leaving the more insoluble Viola Springs Member [48].
6.3. Using Amplitude Extractions to Characterize the Hunton Wedges
The intervals just above the interpreted sinkholes within the Viola exhibit a distinct seismic character interpreted as disrupted Hunton wedges. The behavior of the Hunton wedges is best illustrated when presented as an amplitude attribute overlay on a time–structure map of the Viola Group (Figure 7). Lateral amplitude variations can be used to distinguish areas of consistent stratigraphy from chaotic or mounded beds, e.g., [44]. Concordant beds show higher amplitudes because energy is not scattered. Hummocky beds display lower amplitudes, while chaotic beds exhibit the lowest amplitudes. To gain a clearer understanding of the Viola wavelet, we centered a very small travel-time window over the horizon (Figure 7). Focusing on a single wavelet enhances our interpretation of bed-to-bed interfaces. Summing the amplitude for all the samples on each trace within the interval reveals the oval and circular shapes of the Hunton lenses, with the negative amplitude anomaly confirming the chaotic nature of the collapsed rocks within the interpreted sinkhole. This low-amplitude character becomes larger and more clearly defined nearer to the edges of the collapsed intervals. We believe this results from the chaotic nature of the beds within the Hunton wedges. As the beds sagged, some brecciation and fracturing likely occurred, explaining the low amplitude. An important observation is that these low-amplitude anomalies occur in the thickest preserved sections of the Viola. This response is interpreted as incipient karsting, yet it had not developed sufficiently to cause the Hunton rocks to be lowered and thus preserved.
The location of profile ABCD shown in Figure 7 was chosen to cross four of the interpreted sinkholes on the Viola surface. A vertically exaggerated section (Figure 7) displays the consistently near-vertical attitude and the height of these stratigraphic disruptions. Each structural disruption starts in the Viola interval (just below 2 s) and extends up into the Hunton Group wedge. The vertical extent of these disrupted zones reaches up to 200 to 250 ft (61 m to 76 m) across the 3D seismic grid.
6.4. Using Waveform Classification to Differentiate Hunton from Viola Rocks
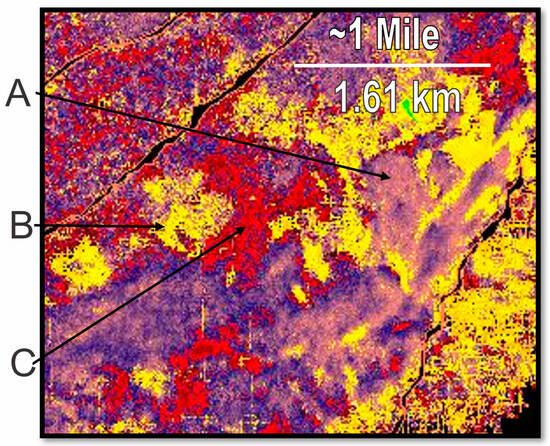
A six-part waveform classifier provides another example of how seismic reflection is sensitive to surface depressions within a travel-time window spanning from the base of the Woodford through the Viola (Figure 8). The waveform classifier allowed us to automatically group similar waveforms into classes [49]. These classes are ordered by similarity, with members of class 1 being more alike than those of class 2, and so on. In this study, six classes were chosen. We used an unsupervised algorithm to classify six waveform types, each representing different features within the search window (Figure 8), which we defined as the top of the Viola Group and the base of the Bromide Dense Formation. Three of these classes were particularly relevant to the Hunton wedges: one represented very thin to absent Viola rocks beneath Hunton wedges; another indicated a very thick Viola section with little or no karsting; and the third depicted Viola rocks that did not develop enough karsting to preserve a Hunton wedge. Hunton wedges are characterized by the thin Viola waveform class (Figure 8).
6.5. Modelling Hunton Preservation
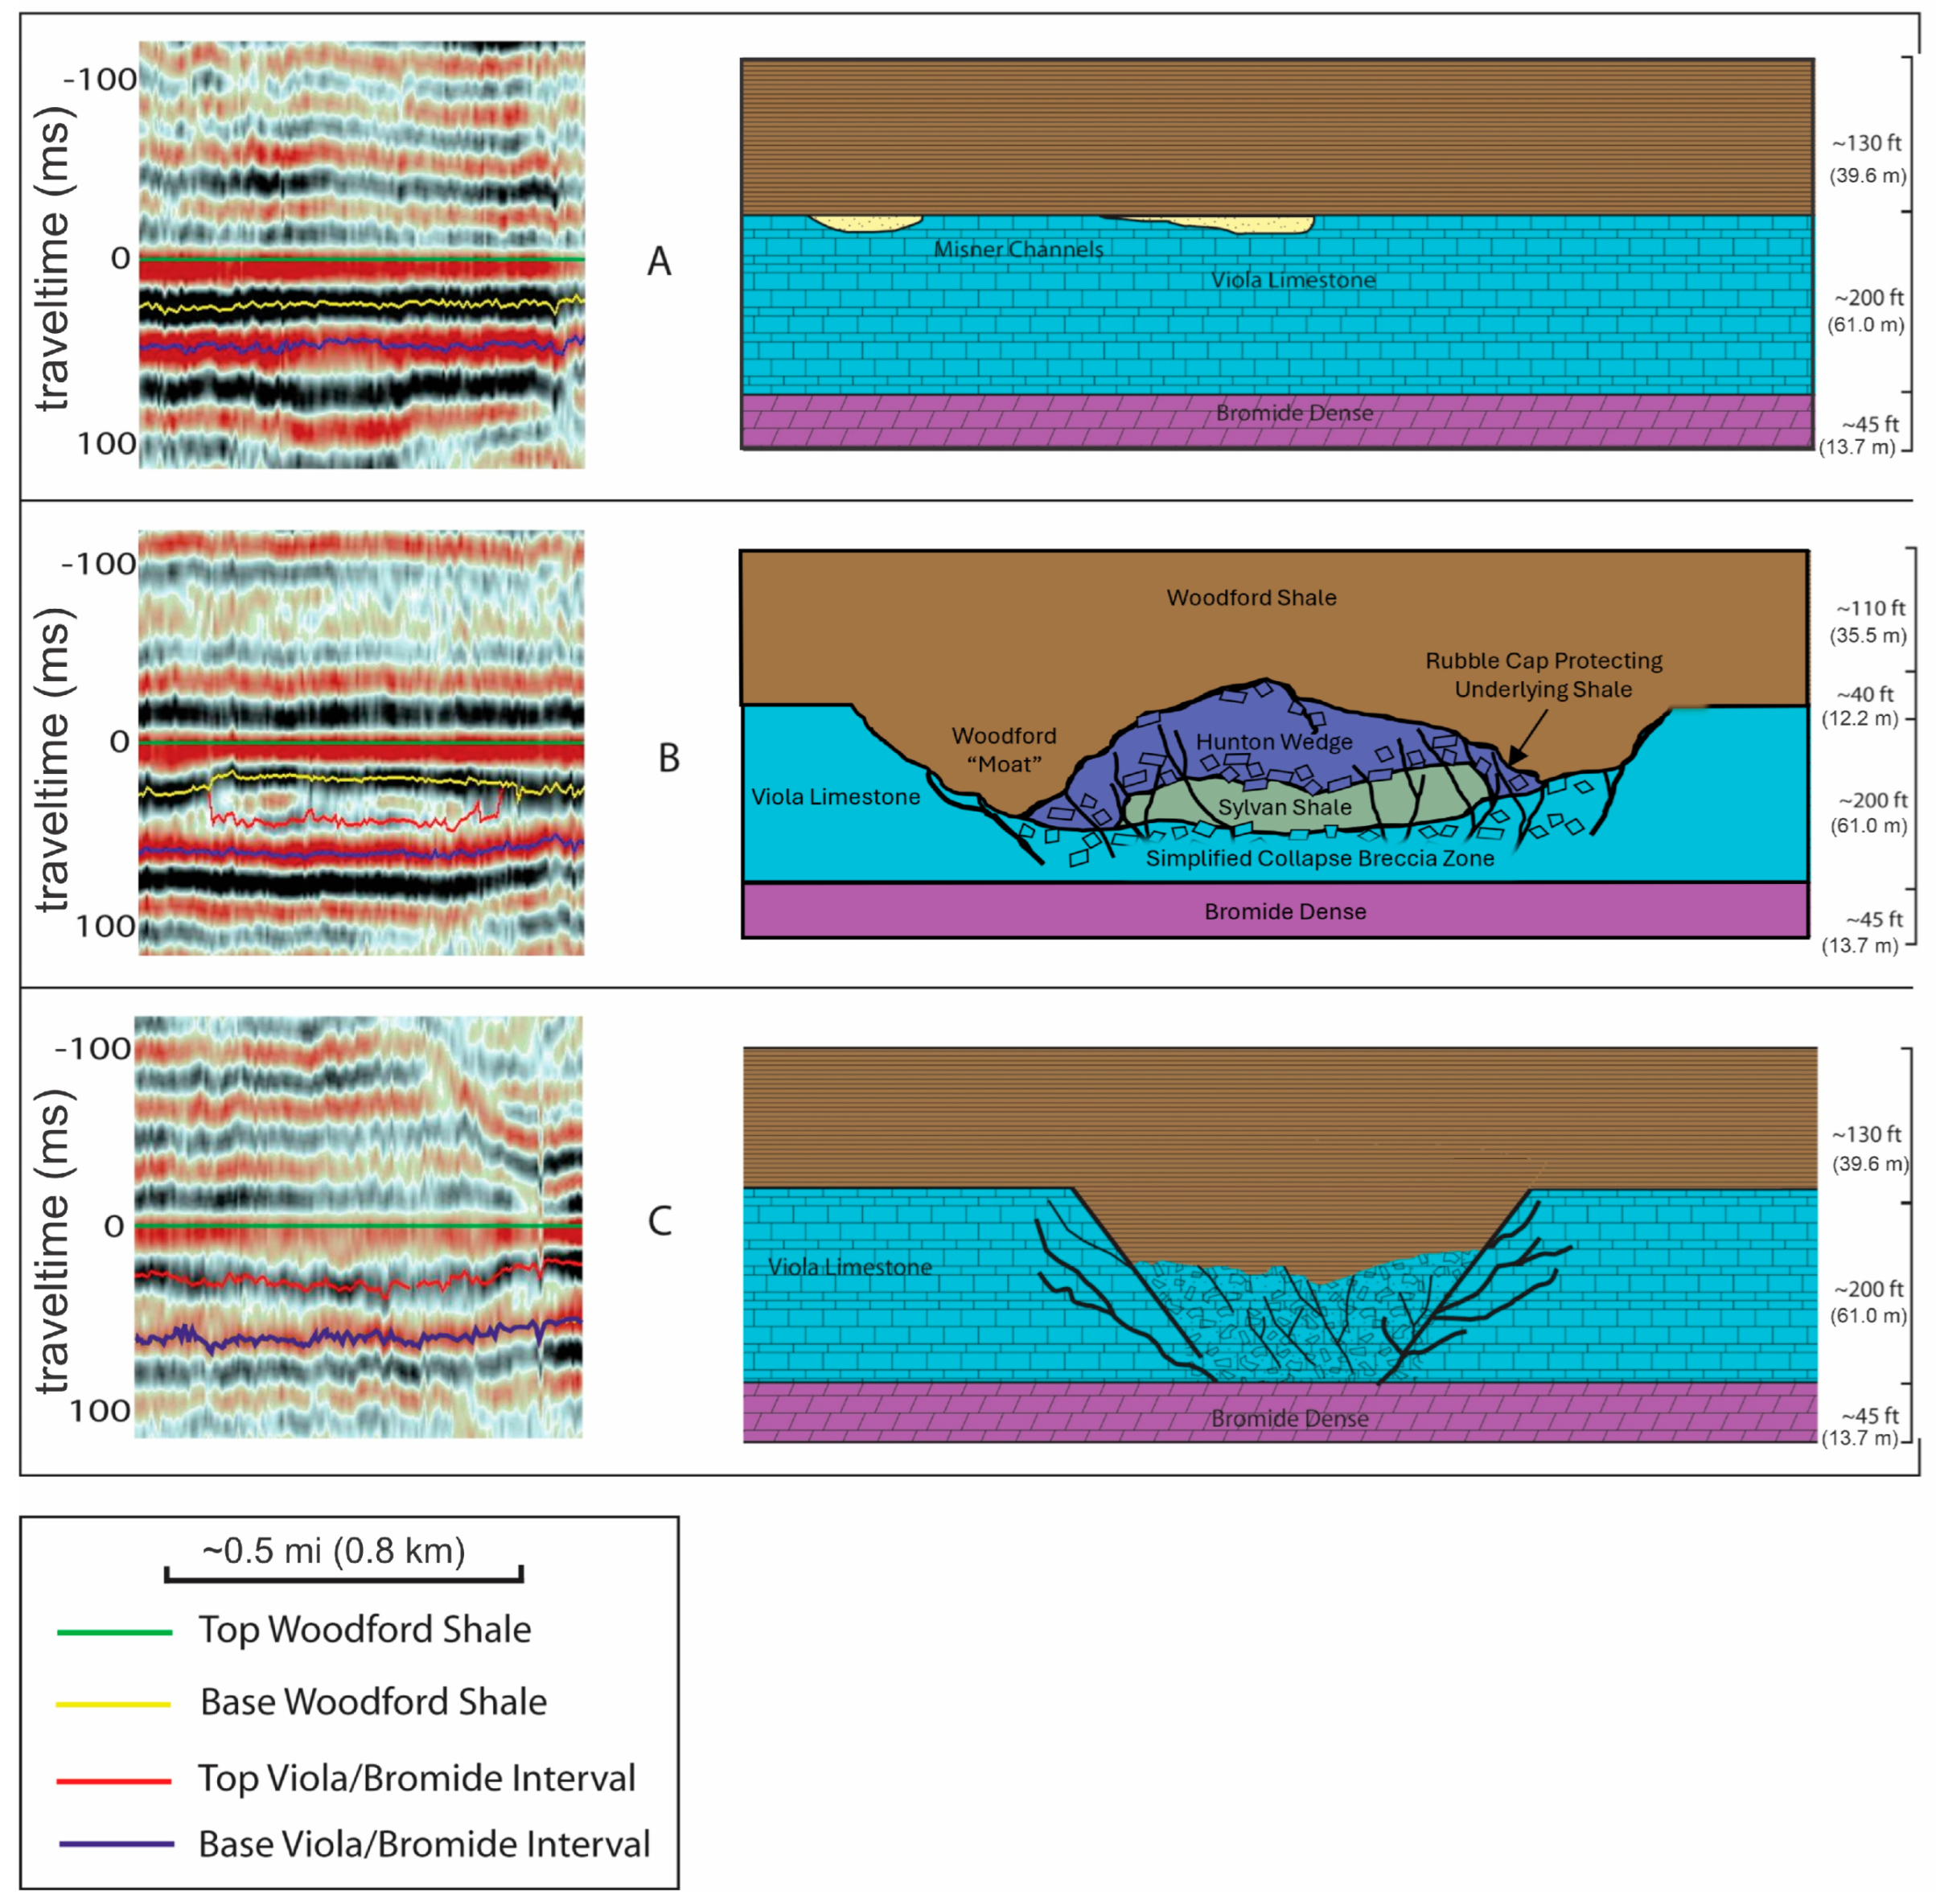
An important observation is that the areas with the thinnest Woodford Shale are directly above the Hunton lenses, whereas thick moats of Woodford Shale surround the Hunton lenses. Further from the Hunton wedges, a more consistent Woodford thickness is observed. The “moats” are regions of unusually thick Woodford near the Hunton wedges and could be sinkholes where Hunton rocks have already been removed, creating an especially thick Woodford section (Figure 10 and Figure 11). Three stratigraphic models (Figure 11 and Figure 12) explain these variations: Model A (Figure 11) shows the typical Woodford case, while Models B and C (Figure 11) represent the thin and thick Woodford cases, respectively. The Woodford thickness over the Hunton wedges in the moat ranges from 250 ft (76 m) to 300 ft (91 m), suggesting that the Hunton rocks formed a paleo-high at least 50 ft (15 m) high, which was eventually flooded by Woodford seas (Model B, Figure 11). A seismic section beside an isochron of the Woodford (Figure 12) illustrates this thinning where the Woodford overlies a Hunton wedge and also shows the thinning of the Viola beneath the same Hunton wedge. We attribute the Hunton wedges to sinkholes that form in the underlying Viola, allowing the Hunton to sag as the Viola collapses, as depicted in Figure 6. The preservation of the Hunton wedges is primarily due to their location beneath the regional base level, as the area was eroded during the Middle Devonian period. However, since the Woodford thins over these wedges, we must consider that they still formed paleo-highs (Model B, Figure 11).
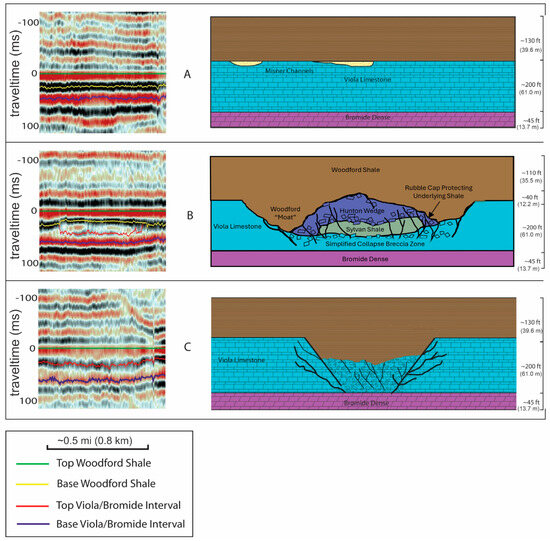
Figure 11.
Models illustrating possible variations in Woodford Shale thickness and their corresponding seismic expression. The seismic sections are flattened on the top of the Woodford Shale. (A) Model A shows normal Woodford and Viola thickness in an area where the Hunton is absent, and how this absence is reflected in seismic data. (B) The middle model depicts a model of a Hunton wedge with karsted underlying Viola limestone, with a thick Woodford “moat” surrounding the Hunton lens, as shown in Figure 5 and Figure 6. Note that the underlying Sylvan Shale is no longer exposed to erosion, allowing the more resistant Hunton rocks to form topographic relief and eventually cause the Woodford Shale to thin over these Hunton wedges. (C) The bottom model illustrates an area of abnormally thick Woodford Shale and its seismic representation. We suggest that this may represent areas where the Hunton was removed (as in the top model) before the collapse of the Viola.
Our model, which shows Hunton wedges forming relative topographic highs during Woodford deposition, is best examined by noting the Sylvan Shale’s stratigraphic position relative to the base level. The Chimneyhill Subgroup of the Hunton Group generally resists erosion more than the weaker Sylvan Shale. The Sylvan Shale unit is stratigraphically sandwiched between the Hunton and Viola (Figure 4), sagging into sinkholes along with the Hunton during the Viola collapse. Non-karstified areas had their Sylvan sections above base level and thus were subject to erosion (Figure 13), typically accelerated by the removal of the weak Sylvan Shale and subsequent undermining and collapse of overlying Hunton rocks. Areas that sagged into sinkholes only had Hunton rocks exposed (Model B, Figure 11), with the Sylvan Shale buried within the sinkhole. Hunton carbonates, being more resistant, could stand up in relief much better than a typical Hunton-Sylvan-Viola section. The resulting Hunton wedges formed topographic highs as the Woodford Sea advanced and eventually drowned the region. The Woodford Shale is thus thinner over these Hunton paleo-highs, as demonstrated by a Woodford isochron map (Figure 12). The local thinning of the Woodford over Hunton wedges is an essential observation because this thinning could indicate areas of Hunton wedges otherwise not detected. We note that these slight variations in Woodford thickness are high-resolution features that do not appear on a basin-scale isopach map of the Woodford Shale (Figure 14).

Figure 13.
A diagram showing how the Hunton could be rapidly removed from non-karstic areas due to the quick erosion of the weak Sylvan Shale, which would then destabilize the overlying Hunton rocks. The resulting debris would be swiftly washed away.
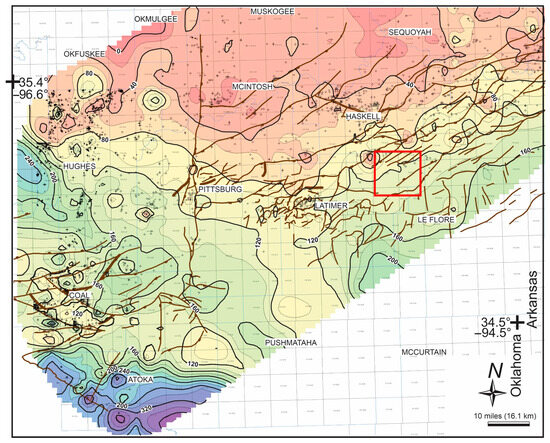
Figure 14.
Woodford isopach map. Compare this to the Hunton isopach map (Figure 2). Note that the Woodford formation is relatively thick through the center of the basin where the Hunton has been completely removed. The red square in the center-right highlights the 3D seismic dataset.
6.6. Regional View
After conducting a detailed analysis of Hunton Group rocks in the Red Oak gas field (Figure 2) area, we extended our approach across the entire southern erosional margin of the Hunton in the Arkoma basin (Figure 1). We observed that these karsting episodes and the resulting wedges characterize the southern pre-Woodford erosional margin in at least two locations: the Red Oak field mentioned in this study and an area to the west on the borders of Pittsburg and Latimer counties (Figure 2). Further south, scattered well data demonstrate a gradual thickening of Hunton strata, which include not only the Chimneyhill Subgroup but also the Henryhouse and related strata. Since none of these wells indicate absent Hunton strata and all show a southward thickening of the Hunton, we conclude that the isolated Hunton wedges to the north become part of a continuous section of Hunton rock as we move down dip along the southern flank of a basement-involved arch that formed during the mid-Devonian (Figure 3).
Our regional isopach map of the Hunton Group features two extensive bodies of Hunton rocks separated by an east–west-aligned area approximately 20 mi (32 km) by 100 mi (161 km) where Hunton and, to a lesser extent, Sylvan rocks were eroded (Figure 2 and Figure 10). This geometry, aligned with the later Ouachita orogenic belt, suggests that a post-Hunton, pre-Woodford arch in mid-Devonian time may account for the broad region of thin or absent Hunton. Well-log correlations flattened on the top Woodford (Figure 10) indicate uplift along a broad, east–west oriented zone running the length of the Oklahoma part of the basin, with the Hunton eroded from the top of the arch but preserved on both limbs. The opposing dips (with the northern limb dipping to the north, and the southern limb dipping to the south) of Hunton and older rocks support a post-Hunton, pre-Woodford arch.
An isopach of the Woodford Shale (Figure 14) across the basin shows no influence from a pre-Woodford arch, indicating it was entirely levelled by the pre-Woodford unconformity. Rising eustatic sea levels (Figure 4) during the Devonian Period [50] support the presence of an arch, as the Arkoma Basin experienced a significant sea-level fall and subsequent erosion [1], pointing to structural uplift occurring alongside the Acadian Orogeny further northeast. West of the Arkoma Basin, other uplifts from the period after the Hunton and before the Woodford have been identified [8,51], with the Guthrie–Holdenville Arch being especially relevant to this study. The structure of regions where the Hunton formation is absent in the Arkoma Basin resembles an eroded arch, with its long axis aligned parallel to the later Ouachita contractional features.
7. Discussion
7.1. Geological Mechanism for Karst Collapse Structures
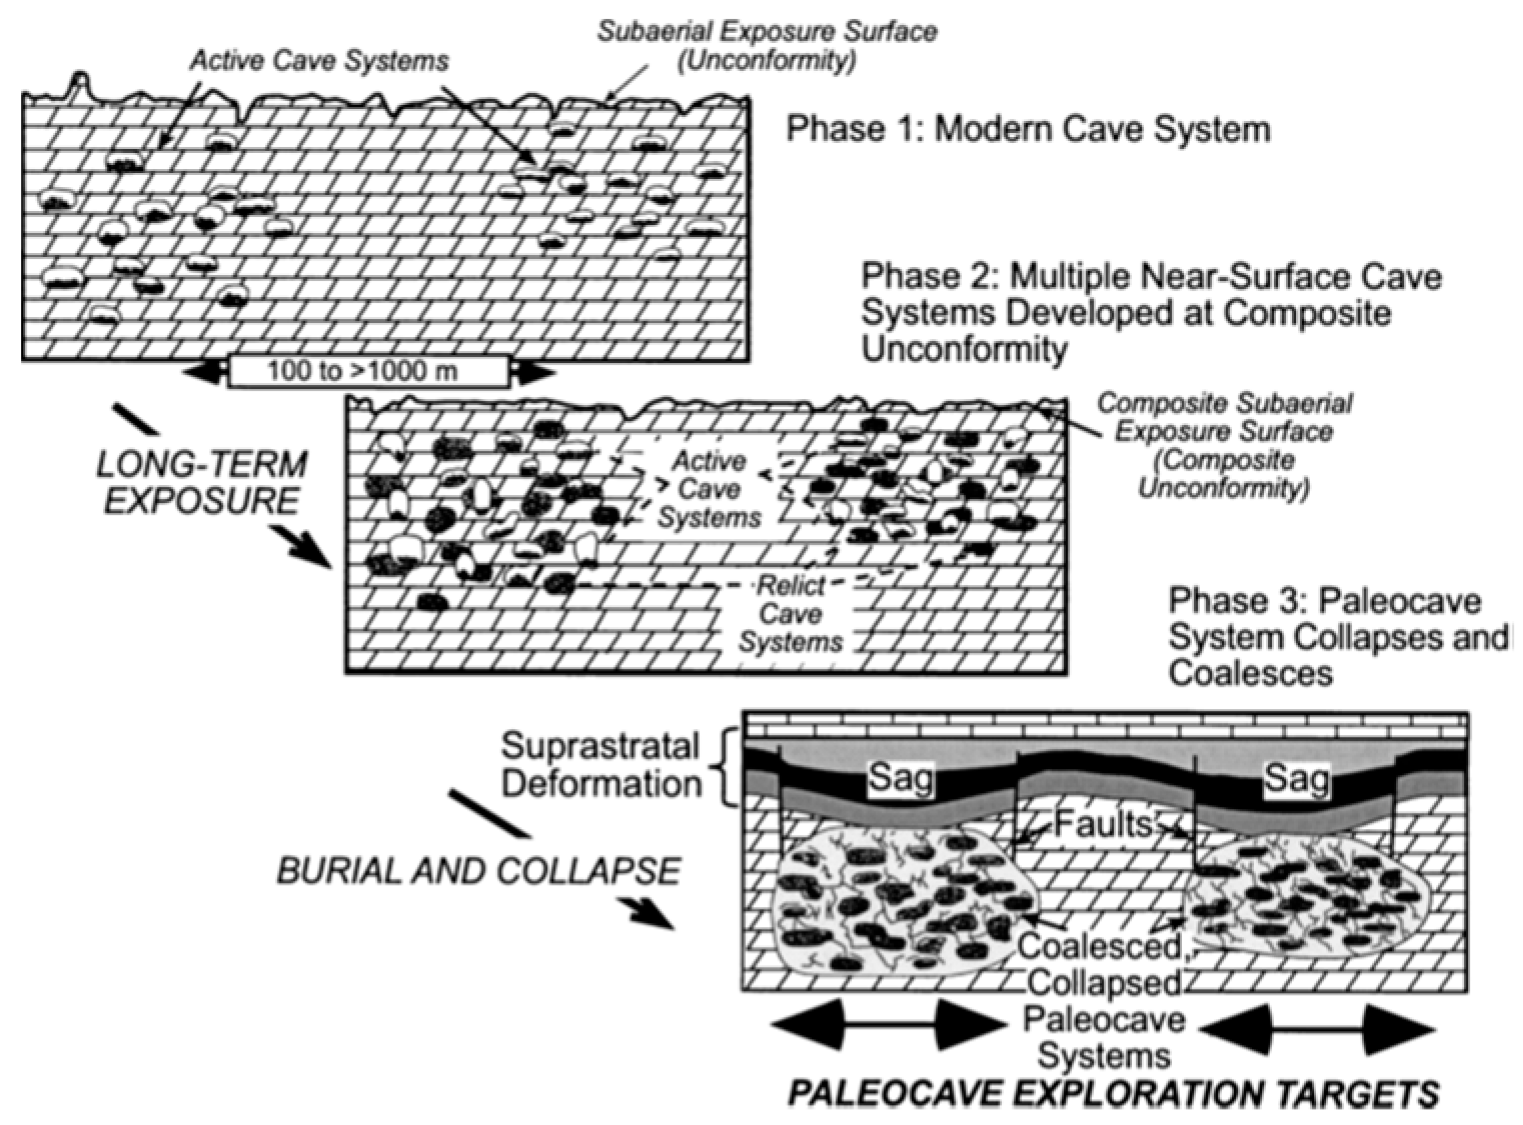
The vertical collapse zones are thought to originate from post-Viola carbonate dissolution beneath the Hunton, which occurred during the pre-Woodford exposure when the entire section was uplifted, possibly into the vadose zone (Figure 15). This hypothesis is supported by karst-derived vertical collapse zones seen in Viola outcrops in the Arbuckle Mountains, Garvin County (Figure 16) [41]. In fact, Viola karst exploration targets have been pursued throughout southern Oklahoma [52] (Figure 16).
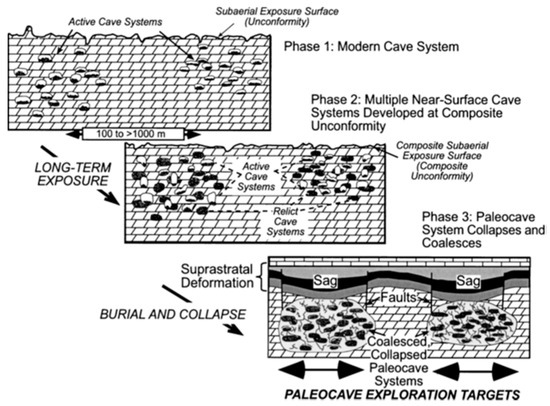
Figure 15.
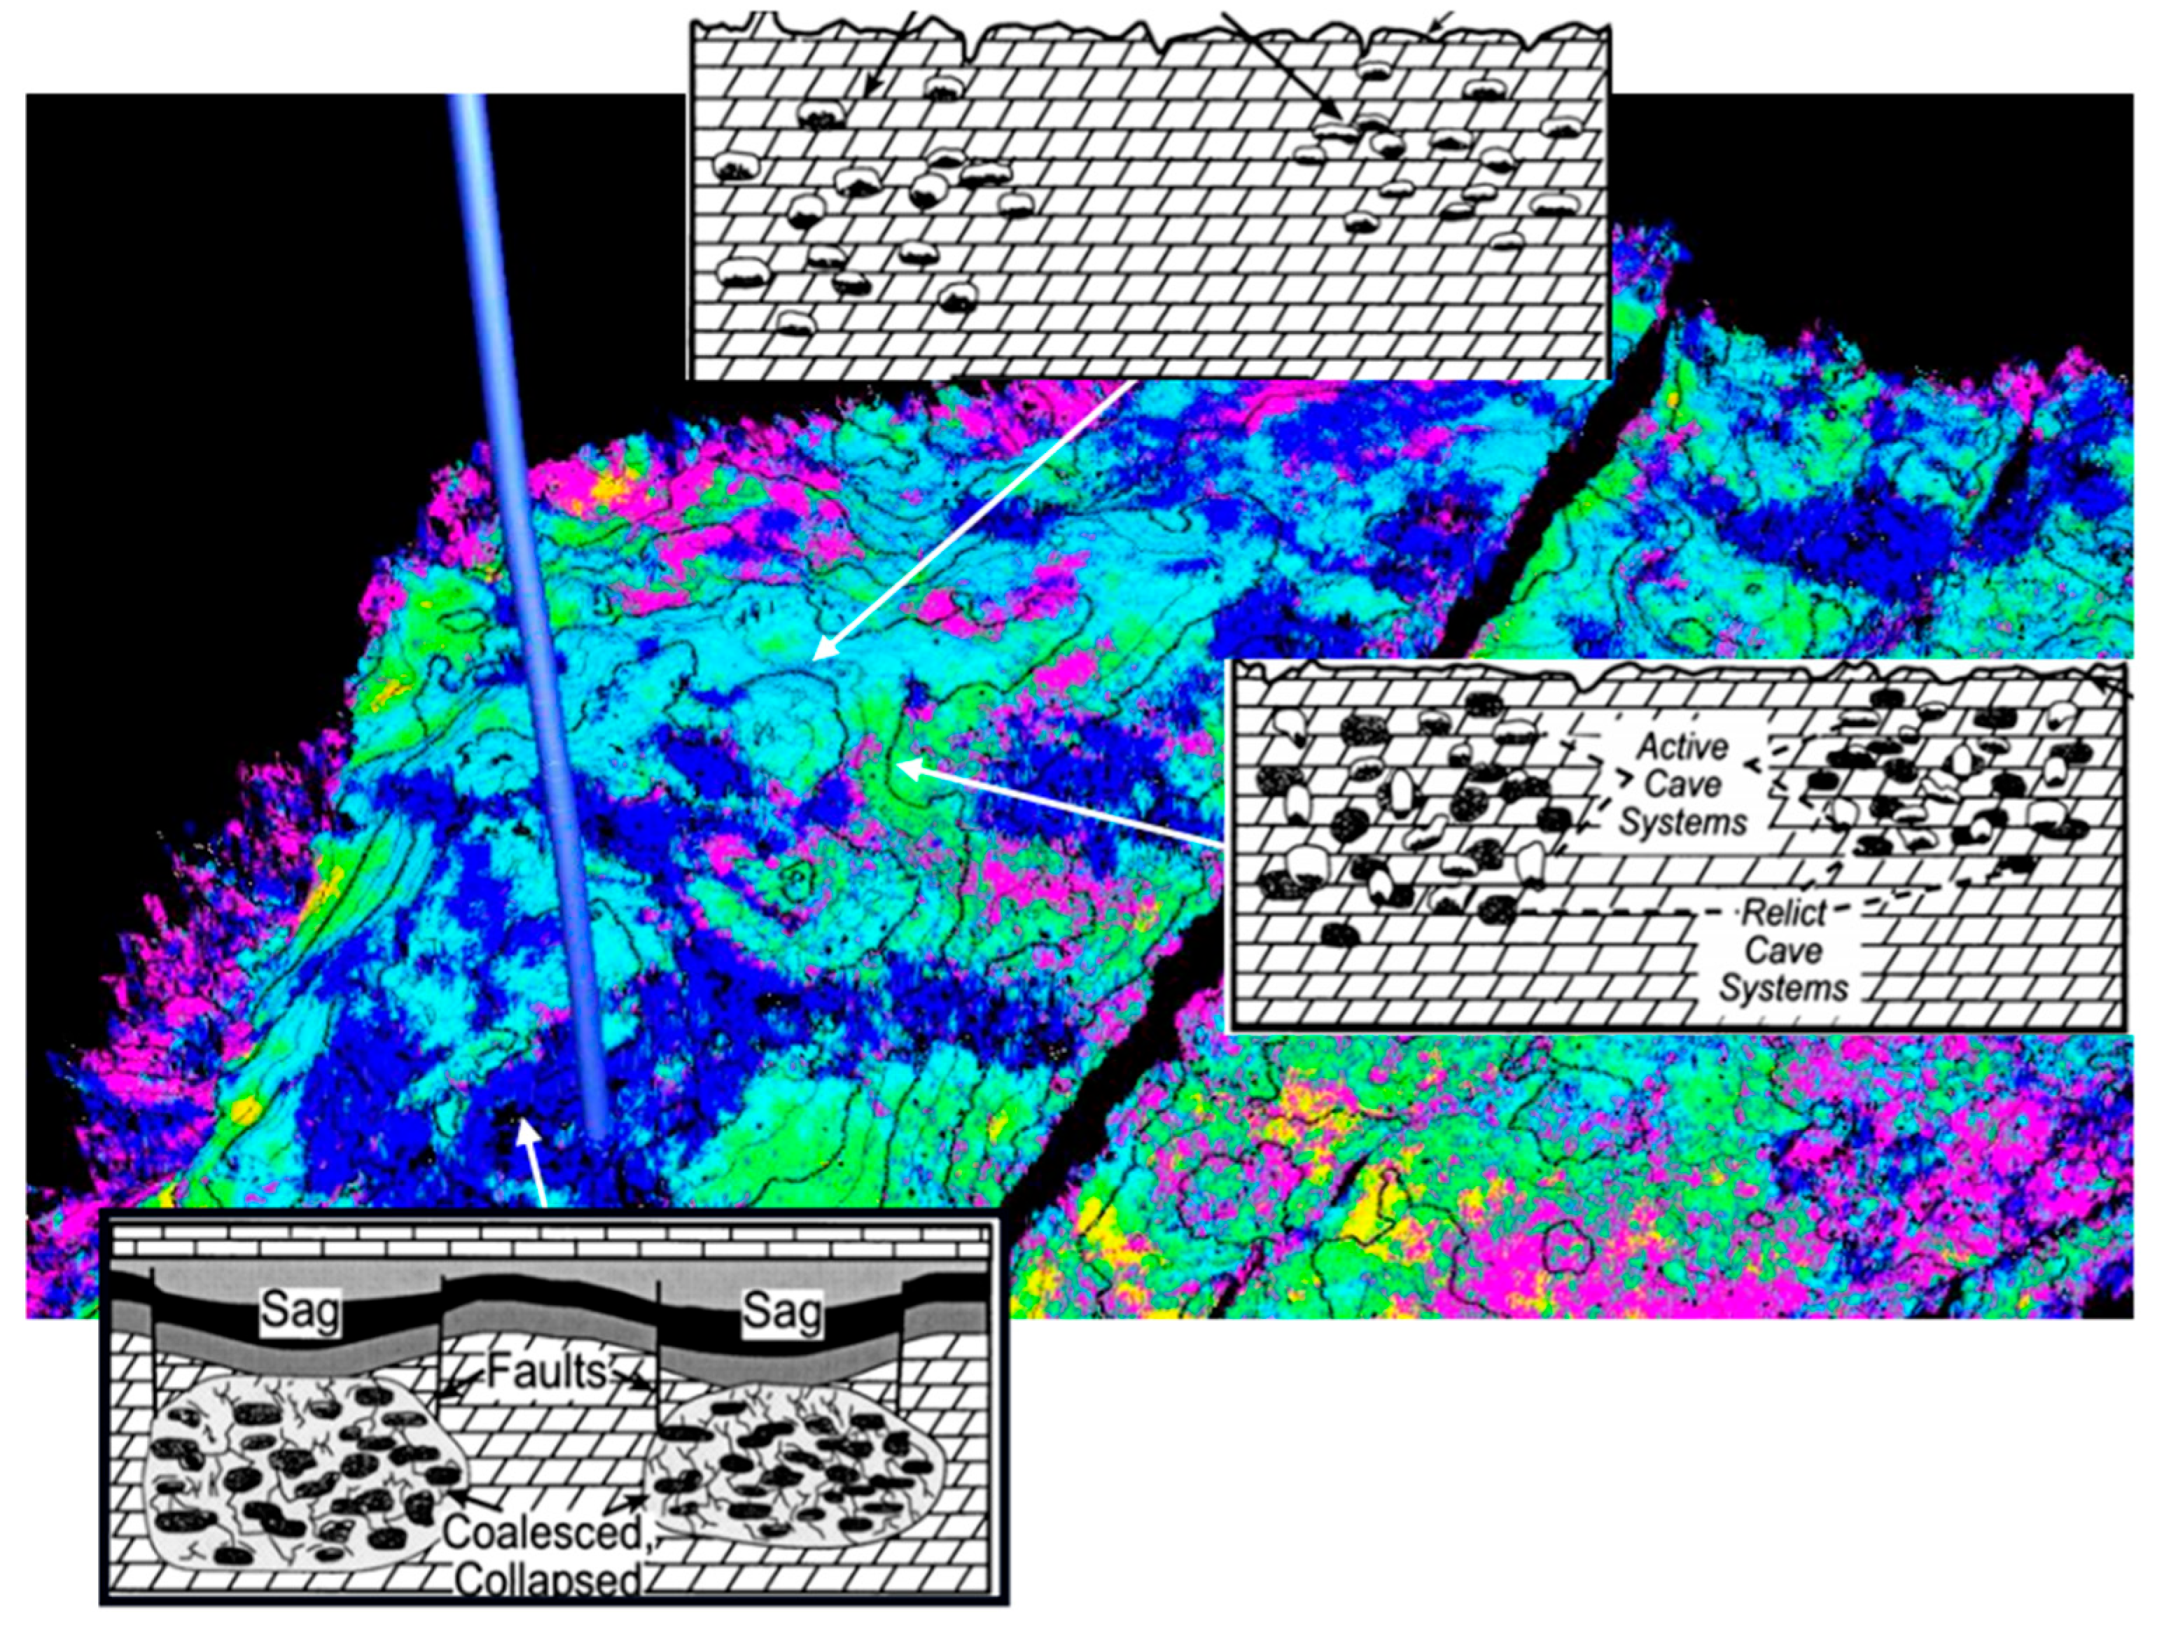
Illustration of the development stages of a coalesced, collapsed paleocave system. Multiple cave system formation at a composite unconformity may be necessary to generate a high density of passages. As the multiple-episode cave system subsides into the deeper subsurface, wall and ceiling rocks adjacent to open passages collapse, creating breccias that extend outward from the passages and intersect fractures from other collapsed passages and older breccias within the system. The strata above the collapsed system are characterized by faults and sags known as “suprastratal deformation” by [53]. Collapsed paleocave systems are the primary targets for exploration in the Viola Group in the central Arkoma Basin. Modified from [53,54,55].
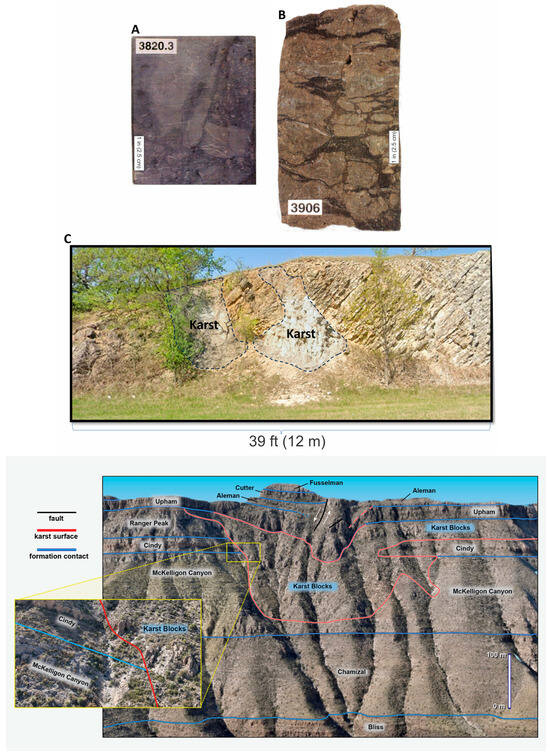
Figure 16.
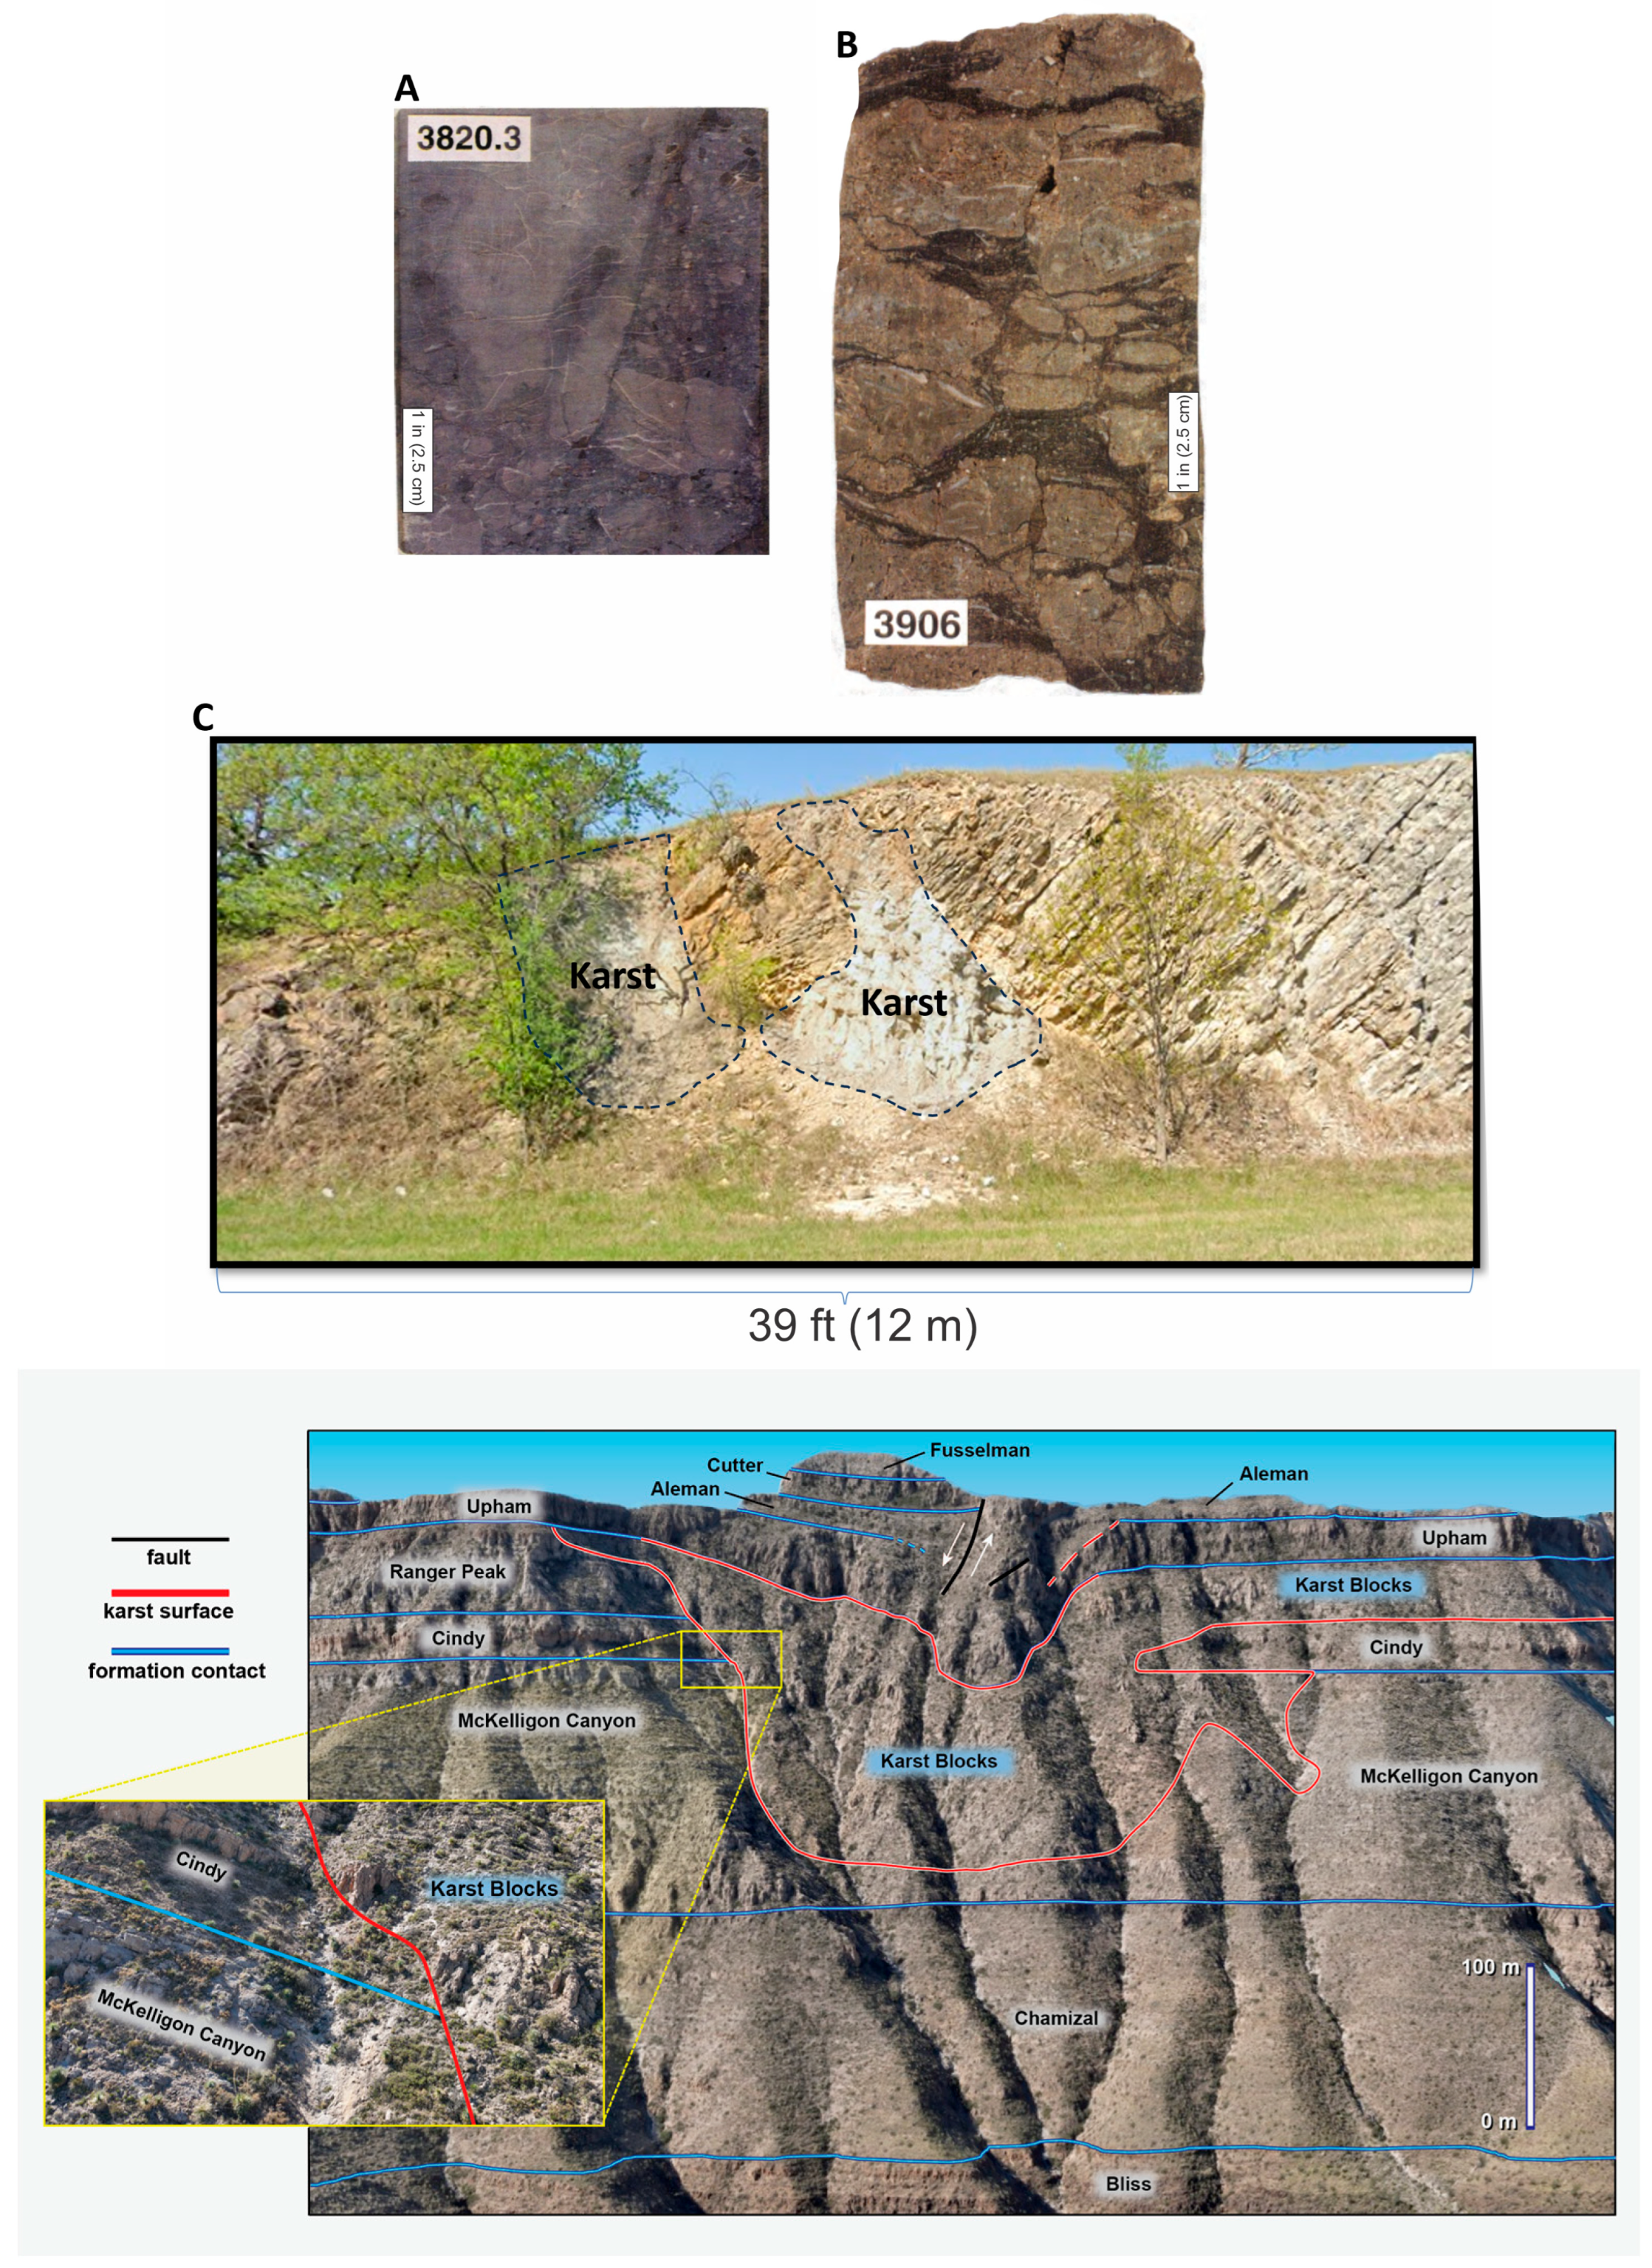
(Top) Examples of karst in the Viola, adapted from [41]. (A) Cavern-fill parabreccia composed of angular to subrounded clasts in a mud-rich matrix. Fractures ending at clast margins suggest possible origins of crackle fractures. Mobile No. 21-19 East Fitts Unit (EFU). Depth, 3820.5 ft (1164.5 m). (B) Collapse breccia containing angular clasts with mud infill from the same well as above. Depth, 3.906 ft (1.190.5 m). (C) Collapse feature (sinkhole) filled with fine carbonate debris, mud, and large clasts. Note the near-horizontal stratification that contrasts with the apparent dip of the host beds. A large ceiling block has rotated into the cavern from an Interstate Highway-35 road cut in Oklahoma. (Bottom) Photogrammetry model of The Great McKelligon Sag in McKelligon Canyon on the eastern face of the Franklin Mountains, TX. Note the distribution of collapse breccia and the collapse of the Ordovician Montoya Group into the Ranger Peak and McKelligon Canyon Formations. Karst contacts from [56].
The preservation of sediments through sagging into collapsed strata has previously been documented from outcrops [56,57] and other 3D seismic datasets [46,58]. Large karst-induced vertical collapse zones are also visible in outcrops of the Ordovician McKelligon Canyon Formation (roughly similar in age and composition to the Viola Group) in the Franklin Mountains near El Paso, Texas (Figure 16) [56,59]. The collapse features in the Franklin Mountains outcrop are very deep, with some extending vertically for at least 1200 ft (365 m) in the larger exposures. In Meade County, Kansas, subsurface lenses of St. Peter Sandstone age are believed to have been preserved in Ordovician-age sinkholes [60], through a mechanism similar to that described for the Hunton. These Kansas sinkholes formed in Arbuckle Group carbonates. Ref. [61] used 3D seismic data to document classic karst features [44] in the Gippsland Basin offshore South-East Australia, similar to what we interpret in the Oklahoma Arkoma Basin.
7.2. Potential for Solution Collapse Within the Viola
In a study of the Upper to Middle Ordovician Viola cores in south-central Oklahoma (Black Riverian to Richmondian), ref. [62] identified paleokarstic features such as collapse and crackle breccias, focused flow features, cave parabreccias, sediment infill, and solution-enhanced fractures (Figure 16). Solution-enlarged joints and bedding planes, karren, and small caves indicate active dissolution of the Viola. These features are common in outcrops of the Arbuckle Mountains, 25 mi (40 km) west of the study area. Paleokarst in the Viola cores and outcrops includes (1) cavern-fill parabreccia, (2) collapse breccia, (3) crackle breccia, (4) solution-enlarged fractures and vugs, sediment infill, and (5) conduits and channels [46,62,63,64]. All these features point to volumetrically destructive processes, supporting a model that would allow the Hunton to subside at the expense of the Viola.
We suggest that weathering during the formation of the Middle Devonian unconformity caused widespread Viola karstification and collapse in the study area, similar to what ref. [41] observed in south-central Oklahoma. Using a six-part waveform classifier (Figure 8), we correlate karst models (Figure 17) with different parts of the Viola Group interval, dividing the Viola into areas of early karst development, well-established karst, and regions where the Viola has been fully dissolved. The shapes of the interpreted collapse zones align with a karst terrain [64].
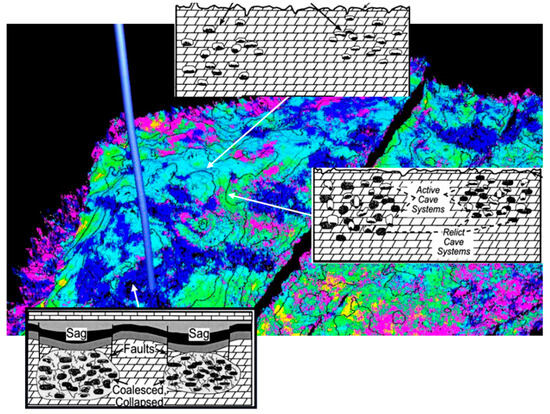
Although no constraining Viola cores are available within the project area, our seismic images allow a hypothesis regarding the origin of the collapse structures.
- Post-Viola/pre-Woodford fracture sets formed (trending east-northeast) in response to regional uplift during the Middle Devonian period.
- Karst solution weathering occurred between the post-Hunton and pre-Woodford periods, especially along vertical fractures trending northeast, where water seepage was intensified. This process created large caverns in some carbonate units, notably the Welling Member of the Viola Group.
- As uplift continued and the regional water table lowered, extensive Viola dissolution and collapse occurred.
- The resulting collapse structures caused Hunton rocks to fall below the paleo-regional base level, thereby protecting them from later widespread erosion.
- Episodes of collapse likely persisted until most of the solution caverns had caved in and filled from above, causing the overlying strata to sag.
- Due to the resistive nature of most of the Hunton Group, the collapsed Hunton lenses formed depositional highs as the Woodford Sea advanced and eventually submerged the region, causing the thinning of the resulting Woodford Shale over them.
8. Conclusions
Our 3D seismic reflection investigation, especially the use of attribute extractions, documents karstifying features and subtle stratigraphic changes that would be impossible to map using only 2D seismic reflection profiles. Clearly, our interpretation is most robust within the confines of the seismic dataset (Figure 1). Constraining the interpretation of 3D seismic data with previously unavailable well data shows the Hunton Group to be more extensive than previously believed. Mid-Devonian karsting episodes and resulting wedges typify the southern Hunton’s erosional edge. Similar wedges appear within and around the Red Oak and Wilburton fields. Further south, these isolated wedges become a continuous section of gradually thickening Hunton strata that ultimately include not only the Chimneyhill Subgroup but also the Henryhouse and related strata. Because these formations terminate in an erosional pinch-out and dip southwards with a source rock (the Woodford Shale) directly overlying them, they form ideal hydrocarbon targets.
We interpret the large zone of absent Hunton to the north of the Red Oak and Wilburton fields as the crest of a post-Hunton, pre-Woodford arch, based on the following: (1) Eustatic sea levels rose globally during the Devonian, but the southern mid-continent USA experienced a significant regression and erosion, indicating regional uplift. (2) West of the Arkoma basin, other post-Hunton, pre-Woodford arches have been identified, with the most significant to this study being the Guthrie–Holdenville Arch, which extends NW-SE through Hughes and Seminole Counties [8]. (3) The shape of the areas lacking Hunton in the Arkoma Basin corresponds with a breached arch (Figure 2).
We envisage a wide uplift that erodes the previously deposited Hunton rocks from the crest and, on the southern part of the arch, raises the Hunton through the Viola section into the vadose zone. This facilitates extensive solution weathering and karst development, ultimately shaping the Hunton wedge geometries observed today in the Red Oak and other nearby gas fields.
Author Contributions
Conceptualization, R.W.K.II, S.M.R. and A.R.B.; methodology, R.W.K.II and A.R.B.; software, R.W.K.II; formal analysis, A.R.B., R.W.K.II and J.M.; investigation, A.R.B., R.W.K.II, J.M. and S.M.R.; data curation, R.W.K.II and J.M.; writing—original draft preparation, A.R.B.; writing—review and editing, A.R.B. and J.M.; visualization, A.R.B. and R.W.K.II; supervision, J.M. and R.W.K.II; project administration, J.M. and R.W.K.II; funding acquisition, J.M. All authors have read and agreed to the published version of the manuscript.
Funding
The College of Physical and Mathematical Sciences at Brigham Young University funded this project.
Data Availability Statement
The datasets presented in this article are not readily available because the data are part of an ongoing study.
Acknowledgments
The authors gratefully credit two anonymous referees with providing comments that greatly improved the final version of the paper. A generous software grant from the Landmark (Halliburton) University Grant Program supported the seismic data visualization and analysis.
Conflicts of Interest
The authors declare no conflicts of interest. The funders had no role in the design of the study.
References
- Amsden, T.W. Hunton Group (Ordovician, Silurian, Early Devonian) in the Arkoma Basin of Oklahoma. Okla. Geol. Surv. Bull. 1980, 129, 136. [Google Scholar]
- Torres-Parada, E.J. Woodford Shale Enclosed Mini-Basin Fill on the Hunton Paleo Shelf. A Depositional Model for Unconventional Resource Shales. Ph.D. Thesis, University of Oklahoma, Norman, OK, USA, 2020. Available online: https://hdl.handle.net/11244/323811 (accessed on 1 May 2025).
- Houseknecht, D.W.; Rouse, W.A.; Paxton, S.T.; Mars, J.C.; Fulk, B. Upper Devonian-Mississippian stratigraphic framework of the Arkoma Basin and distribution of potential source-rock facies in the Woodford-Chattanooga and Fayetteville-Caney shale-gas systems. AAPG Bull. 2014, 98, 1739–1759. [Google Scholar] [CrossRef]
- Evervus Intelligence Research Inc. U.S. Production and Well Data: Database Available from Enervus Intelligence Research, 2901 Via Fortuna #200, Austin, TX, USA. Available online: https://www.enverus.com/solutions/energy-analytics/land/ (accessed on 1 April 2022).
- Amsden, T.W. Depositional and post-depositional history of Middle Paleozoic (Late Ordovician through Early Devonian) strata in the ancestral Anadarko Basin. Okla. Geol. Surv. Circ. 1989, 90, 143–146. [Google Scholar]
- Shannon, J.P., Jr. Hunton Group (Silurian-Devonian) and related Strata in Oklahoma. AAPG Bull. 1962, 46, 1–29. [Google Scholar] [CrossRef]
- Northcutt, R.A. History of Hunton oil and gas exploration and development in Oklahoma, Part III. In Hunton Play in Oklahoma (Including Northeast Texas Panhandle); Special Publication 2000-2; Oklahoma Geological Survey: Oklahoma City, OK, USA, 2000; pp. 9–20. Available online: http://ogs.ou.edu/docs/specialpublications/SP2000-2.pdf (accessed on 1 April 2025).
- Tarr, R.S. Paleogeologic map at base of Woodford, and Hunton isopachous map of Oklahoma. AAPG Bull. 1955, 39, 1851–1858. [Google Scholar] [CrossRef]
- Maxwell, R.W. Post-Hunton Pre-Woodford unconformity in Southern Oklahoma; Petroleum Geology of Southern Oklahoma—A Symposium; American Association of Petroleum Geologists: Tulsa, OK, USA, 1959; Volume 2, pp. 101–126. [Google Scholar]
- England, R.L. Subsurface study of the Hunton Group (Silurian-Devonian) in the Oklahoma portion of the Arkoma Basin. Shale Shak. Dig. IV 1961, 12, 19–35. [Google Scholar]
- Rottman, K. Defining the role of Woodford-Hunton depositional relationships in Hunton stratigraphic traps of western Oklahoma. In Platform Carbonates of the Southern Midcontinent; Johnson, K.S., Ed.; Circular 101; Oklahoma Geological Survey: Norman, OK, USA, 2000; pp. 139–146. [Google Scholar]
- Valderrama, M.H.; Nielsen, K.C.; McMechan, G.A. Three-dimensional seismic interpretation from the Triangle Zone of the Frontal Ouachita Mountains and Arkoma Basin, Pittsburg County, Oklahoma. AAPG Bull. 1996, 80, 1185–1202. [Google Scholar] [CrossRef]
- Rottman, K. Hunton stratigraphy, Part IV. In Hunton Play in Oklahoma (Including Northeast Texas Panhandle); Special Publication 2000-2; Oklahoma Geological Survey: Oklahoma City, OK, USA, 2000; pp. 21–38. Available online: http://ogs.ou.edu/docs/specialpublications/SP2000-2.pdf (accessed on 9 July 2023).
- Houseknecht, D.W.; McGilvery, T.A. Red Oak field. In Structural Traps II. Traps Associated with Tectonic Faulting: AAPG Treatise of Petroleum Geology Atlas of Oil and Gas Fields; Beaumont, E.A.; Foster, N.H., Translators; The American Association of Petroleum Geologists (AAPG): Tulsa, OK, USA, 1990; pp. 201–225. [Google Scholar]
- Rutty, P.; Schlaefer, J.; Vizurrage, A. Exploitation utilizing 3D seismic in the Red Oak gas field of the Arkoma basin, Oklahoma, USA (abstract). AAPG Bull. 1995, 79, 1406–1407. [Google Scholar]
- Rutty, P.M. Exploitation Using 3D Seismic in the Red Oak Field, Arkoma Basin, Oklahoma; Transactions of the 1995 AAPG Mid-Continent Section Meeting; American Association of Petroleum Geologists: Tulsa, OK, USA, 1996; Available online: https://archives.datapages.com/data/tgs/tgs-sp/data/049/049001/62_tgs-sp0490062.htm (accessed on 2 February 2024).
- Cardott, B.J. Bibliography of Arkoma Basin and Cherokee Platform. 2021. Available online: https://ou.edu/content/dam/ogs/documents/information/Bibliographies-basins/Arkoma-Basin-and-Cherokee-Platform.pdf (accessed on 8 January 2024).
- Durham, L.S. Old basin, new interest; 3-D use rises in Arkoma. AAPG Explor. 2011, 32, 12. Available online: https://explorer.aapg.org/Portals/0/docs/Explorer/2011/03mar/03explorer11.pdf (accessed on 2 December 2024).
- Aboaba, O.; Liner, C. Interpretation of Paleozoic paleokarst features in the Arkoma Basin of Oklahoma using 3D seismic and well logs. Interpretation 2020, 8, T421–T440. [Google Scholar] [CrossRef]
- Ibrahim, Ç.; Fuchs, J.; Coffey, B.; Gertson, R.; Hager, C. Correlating Porosity with Acoustic Impedance in Sandstone Gas Reservoirs: Examples from the Atokan Sandstones of the Arkoma Basin, Southeastern Oklahoma. 2014 Search and Discovery Article #41255. Available online: https://www.searchanddiscovery.com/pdfz/documents/2014/41255cemen/ndx_cemen.pdf.html (accessed on 6 January 2024).
- Fuchs, J.C. Using 3-D Seismic Inversion Data as a Tool for Predicting Porosity in the Wilburton Gas Field, Arkoma Basin, Southeastern Oklahoma. Master’s Thesis, University of Alabama, Tuscaloosa, AL, USA, 2012. Available online: https://ir.ua.edu/handle/123456789/1624 (accessed on 9 July 2023).
- Torres, E.J.; Slatt, R.M.; Marfurt, K.J.; Infante, L.E.; Castillo, L.A. Identification of potential lacustrine stratigraphic intervals in the Woodford Shale, Oklahoma, using multi-attribute 3-D seismic displays and a supervised neural network. In Proceedings of the Unconventional Resources Technology Conference, Austin, TX, USA, 24–26 July 2017. [Google Scholar] [CrossRef]
- Milad, B.; Slatt, R. Integrated 3-D Seismic and Core Data for Characterization of Natural Fractures of the Hunton Limestone and the Woodford Shale in Central Oklahoma. In Proceedings of the AAPG Annual Convention and Exhibition, Houston, TX, USA, 4 April 2017; Available online: https://www.searchanddiscovery.com/abstracts/html/2017/90291ace/abstracts/2609796.html (accessed on 9 July 2023).
- Milad, B. The Effect of Karsting on Natural Fracture, Hardness, and Brittleness of the Hunton Limestone and Paleo-Deposition of the Woodford Shale: A Study Using 3-D Seismic, Outcrop, Well Log, and Core Data. Search and Discovery Article #51417. 2017. Available online: https://www.searchanddiscovery.com/pdfz/documents/2017/51417milad/ndx_milad.pdf.html (accessed on 23 January 2024).
- Whitaker, A.E.; Engelder, T. Plate-scale stress fields driving the tectonic evolution of the central Ouachita salient, Oklahoma and Arkansas. GSA Bull. 2006, 118, 710–723. [Google Scholar] [CrossRef]
- Lutz, B.M.; Hudson, M.R.; Smith, T.M.; Dechesne, M.; Spangler, L.R.; McCafferty, A.E.; Amarel, C.M.; Griffis, N.P.; Hirtz, J.A. Influence of inherited structure on flexural extension in foreland basin systems: Evidence from the northern Arkoma basin and southern Ozark dome, USA. Earth Sci. Rev. 2024, 251, 104715. [Google Scholar] [CrossRef]
- Amsden, T.W. Arkoma Basin model: Middle Ordovician through Early Devonian. In Proceedings of the 1981 AAPG Mid-Continent Regional Meeting, 1984, Oklahoma City, OK, USA, 1 August 1981; pp. 116–118. Available online: https://archives.datapages.com/data/ocgs/data/028/028001/116_ocgssp280116.htm (accessed on 6 January 2025).
- Arbenz, J.K. Ouachita thrust belt and Arkoma basin. In The Geology of North America, Volume F-2, the Appalachian-Ouachita Orogen in the United States; Hatcher, R.D., Jr., Viele, G.W., Eds.; Geological Society of America: Boulder, CO, USA, 1989; Volume F-2, pp. 621–634. [Google Scholar]
- Suneson, N.H.; Campbell, J.A.; Tilford, M.J. Geologic setting and introduction. In Geology and Resources of the Frontal Belt of the Western Ouachita Mountains, Oklahoma; Suneson, N.H., Campbell, J.A., Tilford, M.J., Eds.; Special Publication 90-1; Oklahoma Geological Survey: Norman, OK, USA, 1990; p. 1. [Google Scholar]
- Lillie, R.J.; Nelson, K.D.; De Voogd, B.; Brewer, J.A.; Oliver, J.E.; Brown, L.D.; Kaufman, S.; Viele, G.W. Crustal structure of Ouachita Mountains, Arkansas: A model based of integration of COCORP reflection profiles and regional geophysical data. AAPG Bull. 1983, 67, 907–931. [Google Scholar] [CrossRef]
- Thomas, W.A.; Viele, G.W. Tectonic history of the Ouachita Orogen. Geology 1983, 11, 482–483. [Google Scholar] [CrossRef]
- Thomas, W.A. The Appalachian–Ouachita rifted margin of southeastern North America. GSA Bull. 1991, 103, 415–431. [Google Scholar] [CrossRef]
- Houseknecht, D.W. Evolution from passive margin to foreland basin: The Atoka formation of the Arkoma Basin, south-central USA. Spec. Publs. Int. Ass. Sediment. 1986, 8, 327–345. [Google Scholar] [CrossRef]
- Sutherland, P.K. Late Mississippian and Pennsylvanian depositional history in the Arkoma basin area, Oklahoma and Arkansas. GSA Bull. 1988, 100, 1787–1802. [Google Scholar] [CrossRef]
- Al-Shaieb, Z.; Puckette, J.O.; Blubaugh, P. The Hunton Group: Sequence stratigraphy, facies, dolomitization, and karstification, Part V. In Hunton Play in Oklahoma (Including Northeast Texas Panhandle); Special Publication 2000-2; Oklahoma Geological Survey: Oklahoma City, OK, USA, 2000; pp. 39–50. Available online: http://ogs.ou.edu/docs/specialpublications/SP2000-2.pdf (accessed on 9 July 2023).
- Fritz, R.D.; Medlock, P.L. Recognition of unconformities and sequences in Mid-Continent carbonates. In Sequence Stratigraphy of the Mid-Continent; Hyne, N.J., Ed.; Special Publication, No. 4; Tulsa Geological Society: Tulsa, OK, USA, 1995; pp. 49–80. [Google Scholar]
- Hollrah, T.L. Subsurface lithostratigraphy of the Hunton Group, in parts of Payne, Lincoln and Logan Counties, Oklahoma. Shale Shak. Dig. IX 1978, 27, 76–91. [Google Scholar]
- Kuykendall, M.D.; Fritz, R.D. Misener Sandstone: Distribution and relationship to Late/Post-Hunton Unconformities, Northern Shelf, Anadarko Basin. In Hunton Group Core Workshop and Field Trip; Johnson, K.S., Ed.; Special Publication 93-4; Oklahoma Geological Survey: Oklahoma City, OK, USA, 1993; pp. 117–134. Available online: http://ogs.ou.edu/docs/specialpublications/SP93-4.pdf (accessed on 7 July 2022).
- Amsden, T.W. Stratigraphy of the Frisco and Sallisaw formations (Devonian) of Oklahoma. Okla. Geol. Surv. Bull. 1961, 90, 1–121. Available online: http://ogs.ou.edu/docs/bulletins/B90.pdf (accessed on 6 July 2021).
- Matthews, F.D. Paleokarstic features and reservoir characteristics of the Hunton Group in the Anadarko Basin, Oklahoma. Shale Shak. 1994, 44, 102–109. [Google Scholar]
- Sykes, M. Paleokarst characteristics of the surface and subsurface in the Viola Limestone (Ordovician), Arbuckle Mountains, Oklahoma. Shale Shak. 1997, 47, 107–121. [Google Scholar]
- Biggs, D.S.C. Clearing up deconvolution. Biophotonics Int. 2004, Feb., 2–10. [Google Scholar]
- Addison, P.S. The Illustrated Wavelet Transform Handbook; Taylor and Francis: New York, NY, USA, 2002. [Google Scholar]
- Brinkerhoff, A.R. Mapping Middle Paleozoic Erosional and Karstic Patterns with 3-D Seismic Attributes and Well Data in the Arkoma Basin, Oklahoma. Master’s Thesis, Brigham Young University, Provo, UT, USA, 5 June 2007. Available online: https://scholarsarchive.byu.edu/etd/907/ (accessed on 12 July 2008).
- Brown, A.R. Interpretation of 3-Dimensional Seismic Data, 5th ed.; AAPG Memoir 42; American Association of Petroleum Geology: Tulsa, OK, USA, 2004; pp. 174–175; 233, 341. Available online: https://library.seg.org/doi/pdf/10.1190/1.9781560802884.fm (accessed on 6 July 2021).
- Kumbalek, M. Analysis of Paleokarst Sinkholes in the Arkoma Basin Using 3-D Seismic. Master’s Thesis, University of Arkansas, Fayetteville, AR, USA, May 2015. Available online: https://scholarworks.uark.edu/etd/1104 (accessed on 4 July 2021).
- Haber, A.; Wilk, A. Application of new techniques in the seismic data interpretation to enhance their examination effectiveness. Acta Montan. Slovaca 2006, 11, 51–55. [Google Scholar]
- Mairs, T. A subsurface study of the Fernvale and Viola formations in the Oklahoma portion of the Arkoma Basin. Tulsa Geol. Soc. Dig. 1966, 34, 60–81. [Google Scholar]
- Andersen, E.; Boyd, J. Seismic waveform classification: Techniques and benefits. CSEG Rec. 2004, 29, 26–30. Available online: https://csegrecorder.com/articles/view/seismic-waveform-classification-techniques-and-benefits (accessed on 4 June 2024).
- Johnson, J.G.; Klapper, G.; Sandberg, C.A. Devonian eustatic fluctuations in Euramerica. GSA Bull. 1985, 96, 567–587. [Google Scholar] [CrossRef]
- Maxwell, R.A. The Stratigraphy and Areal Distribution of the Hunton Formation, Oklahoma. Ph.D. Thesis, Northwestern University, Evanston, IL, USA, 1 August 1936. [Google Scholar]
- Al Shaieb, Z.; Puckette, J. Sequence stratigraphy of Hunton Group ramp facies, Arbuckle Mountains and Anadarko Basin, Oklahoma. In Platform Carbonates of the Southern Midcontinent, 1996 Symposium; Johnson, K.S., Ed.; Circular 101; Oklahoma Geological Survey: Norman, OK, USA, 2002; pp. 131–137.53. [Google Scholar]
- Loucks, R.G.; Mescher, P.K.; McMechan, G.A. Three-dimensional architecture of a coalesced, collapsed paleocave system in the Lower Ordovician Ellenburger Group, central Texas. AAPG Bull. 2004, 88, 545–564. [Google Scholar] [CrossRef]
- Loucks, R.G. Paleocave carbonate reservoirs: Origins, burial-depth modifications, spatial complexity, and reservoir implications. AAPG Bull. 1999, 83, 1795–1834. [Google Scholar] [CrossRef]
- Loucks, R.G. A Review of coalesced, collapsed-paleocave systems and associated suprastratal deformation. Acta Carsologica/Karsoslovni Zb. 2007, 36, 121–132. [Google Scholar] [CrossRef]
- Lucia, F.J. Lower Paleozoic cavern development, collapse, and dolomitization, Franklin Mountains, El Paso, Texas. In Unconformities and Porosity in Carbonate Strata; Budd, D.A., Saller, A.H., Harris, P.M., Eds.; AAPG Memoir 63; American Association of Petroleum Geologists: Tulsa, OK, USA, 1995; pp. 279–300. [Google Scholar] [CrossRef]
- Bellian, J.A. Laser-Mapping and 3-D Reconstruction of the Lower Ordovician El Paso Group Breccia Collapse Breccias, Franklin Mountains, Texas. Ph.D. Thesis, University of Texas, Austin, TX, USA, August 2009. Available online: https://hdl.handle.net/2152/9669 (accessed on 3 November 2023).
- Aboaba, O.A. Seismic Expressions of Paleokarst. Ph.D. Thesis, University of Arkansas, Fayetteville, AR, USA, December 2020. Available online: https://scholarworks.uark.edu/etd/3915 (accessed on 3 May 2024).
- Hardage, B.A.; Carr, D.L.; Lancaster, D.E.; Simmons, J.L., Jr.; Elphick, R.Y.; Pendleton, V.M.; Johns, R.A. 3-D Seismic evidence of the effects of carbonate karst collapse on overlying clastic stratigraphic and reservoir compartmentalization. Geophysics 1996, 61, 1336–1350. [Google Scholar] [CrossRef]
- Merriam, D.F.; Atkinson, W.R. Simpson Filled Sinkholes in Eastern Kansas; Bulletin 119, Part 2; Kansas Geological Survey: Lawrence, KS, USA, 1956. Available online: www.kgs.ku.edu/Publications/Bulletins/119_2/ (accessed on 2 August 2023).
- Sanders, J.I.; Steel, G. Improved structural resolution from 3D surveys in Australia. Aust. Pet. Explor. Assoc. J. 1982, 22, 17–41. [Google Scholar] [CrossRef]
- Sykes, M.; Puckette, J.; Abdalla, A.; Al-Shaieb, Z. Karst development in the Viola Limestone in southern Oklahoma. In Simpson and Viola Groups in the Southern Midcontinent, 1994 Symposium; Johnson, K.S., Ed.; Circular 99; Oklahoma Geological Survey: Norman, OK, USA, 1997; pp. 66–75. [Google Scholar]
- Payne, E.N. Analysis of an Exposure of the Viola Group in the Arbuckle Mountains, Southern Oklahoma. Master’s Thesis, Texas Christian University, Fort Worth, TX, USA, August 2008. Available online: https://repository.tcu.edu/handle/116099117/4094 (accessed on 4 September 2015).
- White, W.B. Geomorphology and Hydrology of Karst Terrains; Oxford University Press: Oxford, UK, 1988; p. 464. Available online: https://digitalcommons.usf.edu/kip_articles/2160 (accessed on 1 May 2024).
Disclaimer/Publisher’s Note: The statements, opinions and data contained in all publications are solely those of the individual author(s) and contributor(s) and not of MDPI and/or the editor(s). MDPI and/or the editor(s) disclaim responsibility for any injury to people or property resulting from any ideas, methods, instructions or products referred to in the content. |
© 2025 by the authors. Licensee MDPI, Basel, Switzerland. This article is an open access article distributed under the terms and conditions of the Creative Commons Attribution (CC BY) license (https://creativecommons.org/licenses/by/4.0/).

