Article

Andesite and CO2-Saturated Water Interaction at Different Temperatures and Flow Rates Using a Flow-Through Reactor

1
Department of Natural and Environmental Sciences, Faculty of Science, Academic Assembly, University of Toyama, Gofuku 3190, Toyama 930-8555, Japan
2
Taisei Corporation, 344-1 Nase-cho, Totsuka-ku, Yokohama 245-0051, Japan
3
Japan Organization for Metals and Energy Security (JOGMEC), 2-10-1 Toranomon, Tokyo 150-0001, Japan
*
Author to whom correspondence should be addressed.
Geosciences 2025, 15(9), 351; https://doi.org/10.3390/geosciences15090351
Submission received: 29 July 2025 / Revised: 1 September 2025 / Accepted: 2 September 2025 / Published: 5 September 2025

Abstract

This study aims to elucidate the geochemical reactions between CO2-saturated water and rocks in CO2-enhanced geothermal system (CO2-EGS) reservoirs by focusing on andesite found in island arc regions, such as Japan. Laboratory flow tests of CO2-saturated water (3 wt.% CO2) and rocks (particle size: 0.14–1 mm) were conducted under varying temperature (150–250 °C) and flow rate (0.3 and 1.0 mL/min) conditions using a flow-through reactor. Elevated temperatures enhanced the dissolution of silicate minerals, reflected by increased Na+, K+, Ca2+, and Si concentrations, whereas those of Fe2+ and Al3+ remained low, suggesting secondary mineral precipitation. The dissolution process was dominant at 150 °C. Al-bearing minerals, such as gibbsite and boehmite, as well as clay minerals, including beidellite and kaolinite, were predominant at higher temperatures (200–250 °C). Carbonate minerals were not observed, attributable to low pH and limited availability of divalent cations. Flow rate substantially influenced Si dissolution rates, with lower flow rates promoting longer residence times and higher Si dissolution rates. These results indicate that the test conditions simulate the environment around the injection well, where the fluid is acidic and dissolution is the main reaction in the rock. Although a small amount of secondary minerals precipitated and the Si dissolution rates were of the same order of magnitude as those for labradorite, it may be considered that andesite has less impact on permeability variations than basalt near the injection well in CO2-EGS reservoirs.

1. Introduction

Among the numerous environmental threats confronting humanity, global warming has emerged as one of the most critical in recent years. It has contributed to frequent extreme precipitation events and prolonged regional droughts [1,2,3]. Carbon dioxide (CO2) accounts for 76% of the greenhouse gas emissions driving climate change, with 65% of CO2 emissions resulting from fossil fuel combustion and industrial processes, and an additional 11% originating from forestry and land use patterns [4]. To mitigate these impacts, it is imperative to transition from fossil fuels to renewable energy sources as well as implement technologies for carbon capture and storage [5]. CO2-enhanced geothermal systems (CO2-EGSs) are recognized as a renewable energy technology and represent a promising approach for minimizing CO2 emissions into the atmosphere [6,7,8,9]. Moreover, this technology is expected to facilitate CO2 sequestration within geothermal reservoirs [10,11].
Japan’s geothermal power generation potential is estimated to be approximately 20,000 MW, which could supply up to 20% of the nation’s electricity demand. However, the current installed geothermal capacity remains limited to approximately 530 MW, accounting for only 0.3% of the domestic electricity consumption [12]. One contributing factor to this underutilization is that several geothermal areas are hot but lack sufficient geothermal fluids [11]. CO2-EGSs hold great potential to expand the range of viable geothermal power generation areas and increase the power generation capacity. Within geothermal reservoirs, CO2 can conceptually exist in three zones: a single-phase supercritical CO2 zone, a two-phase zone containing both CO2 and aqueous fluid, and a water-dominated zone with dissolved CO2 [8,13,14]. In the fluid-containing zones, CO2 can react with reservoir rocks, potentially leading to mineralization and altering the reservoir properties such as porosity and permeability. The ideal scenario involves power generation operating within the supercritical CO2 zone while CO2 sequestration occurs in the surrounding fluid-containing zones. However, this has not yet been implemented in practice, and a study [11] noted that carbonate and clay minerals may precipitate when a portion of injected supercritical CO2 dissolves into geothermal fluids and subsequently reacts with reservoir rocks. Thus, further investigation is required to assess the geochemical evolution within reservoirs and the operational feasibility of CO2-EGSs.
Numerous studies have investigated CO2–water–rock interactions to further understand the geochemical processes occurring in geothermal reservoirs [15,16,17,18,19,20,21,22]. Basaltic rocks have been primarily studied because of their high olivine, pyroxene, and plagioclase contents. Olivine and pyroxene exhibit thermodynamically favorable dissolution rates under acidic conditions induced by CO2 injection, facilitating the release of alkaline-earth metal cations that promote carbonate mineral precipitation [23,24]. However, CO2-EGS reservoirs must maintain preferential porosity and permeability to ensure effective circulation of supercritical CO2. In summary, the precipitation of secondary minerals within the supercritical CO2 zone should be prevented, as it may hinder fluid flow and reduce system efficiency.
Andesite, an intermediate volcanic rock commonly associated with subduction zones, is widely distributed in various parts of the world, including Central and South America and several regions in Australasia [25,26]. In Japan, active volcanoes have led to the formation of various types of igneous rocks besides basalt. Notably, andesite is expected to contain a range of reactive mineral species [26]. A recent study that investigated the interactions between andesite and CO2-saturated water through batch reaction experiments revealed that glass, pyroxenes, and anorthite dissolved, whereas carbonate minerals precipitated after 60 days at a high temperature of 200 °C [26]. Utomo and Güleç [17] proposed a geochemical model of CO2–brine–rock interaction for CO2 injection in the Ungaran geothermal field in Java Island, Indonesia, using data on rock mineralogy and geothermal water chemistry. They focused on intermediate volcanic rocks (andesite) to simulate geochemical processes within the geothermal reservoir and identified that anorthite dissolution was initiated by a lowered pH resulting from CO2 dissolution in brine. This, in turn, led to the precipitation of calcite at the expense of anorthite, thereby contributing to CO2 mineral trapping. Belshaw et al. [25] conducted batch reaction experiments using andesite rock samples obtained from an active geothermal reservoir in Sumatra at 100 °C with neutral-pH and acidic fluids. Their findings indicated the formation of secondary aluminum (Al)-bearing minerals and that the silicon (Si) dissolution rate of andesite was approximately two orders of magnitude lower than that of basalt. Si release rates are commonly used to quantify silicate mineral dissolution rates. This is because Si plays a key role in maintaining the crystalline structures of these minerals. Delerce et al. [27] summarized the Si dissolution rates normalized to the geometric surface areas of Columbia River Basalt, crystalline basalt, and basalt glass, referring to previous studies that reported rates ranging from 10−9 to 10−5 mol/m2s. The results suggested that andesite is suitable for CO2-EGS reservoirs, as it poses a low risk of efficiency reduction due to mineral precipitation.
Compared with basalt, research on andesite and CO2-saturated water interactions remains relatively inadequate. Accurately assessing the geochemical behavior of andesite is essential for evaluating its suitability in CO2-EGS applications. Therefore, we experimentally investigated andesite and CO2-saturated water interactions based on flow-through experiments conducted at temperatures ranging from 100 °C to 250 °C and flow rates of 0.3 and 1.0 mL/min, aiming to deepen the understanding of changes in fluid composition and secondary mineral formation. Moreover, we estimated the Si dissolution rates in andesite under varying thermal conditions. Particularly, the experimental conditions simulate an environment near the injection well in CO2-EGS reservoirs, where the fluid is acidic and dissolution is the main reaction in the rock.

2. Materials and Methods

2.1. Rock Samples and Treatments

The andesite used in the flow-through experiments was fresh Quaternary andesite collected from the Onioshidashi lava field in Japan, which was formed during the 1783 eruption of Mt. Asama [28]. The Onioshidashi lava is classified as pyroxene–plagioclase andesite. Its phenocrysts include monoclinic pyroxene, plagioclase, and titanomagnetite [29]. Table 1 lists the major chemical compositions of the andesite.
First, the collected rock samples were crushed to a grain size range of 0.14–1 mm. Subsequently, the grains were immersed in distilled water and cleaned multiple times using an ultrasonic cleaner (Azwan MCS-2, As one Corp., Osaka, Japan). After cleaning, the samples were air-dried at room temperature and subsequently stored in a sealed container.

2.2. Flow-Through Reactor

A flow-through reactor, equipped with duplex reactors, was designed to evaluate the reactions between CO2-saturated water and rock grains by varying the temperature and flow rate. The experimental setup comprised a water tank, a pump, reactors, a back pressure valve, and an autosampler (Figure 1). The water tank, with a capacity of 11 L, was pressurized with CO2 gas up to 2.5 MPa to produce CO2-saturated water. The pump regulates the flow rate within 0.1–10 mL/min and operates under a maximum back pressure of 10 MPa. Reactors 1 and 2 have the same design. Each reactor can be heated to as high as 300 °C. In this study, only Reactor 2 was used as a single-reactor system and pressurized to 10 MPa using an electric furnace and the back pressure valve to simulate the reservoir pressure. The solution flowing out of the reactors was collected by an autosampler for subsequent chemical analysis. Rock samples, stored before the experiments, were placed in a core holder within the reactor, measuring 15 cm in length. Distilled water was used as the base fluid for all experiments.
The flow-through tests were conducted six times, designated as Fa1 (150 °C, 0.3 mL/min), Fa2 (200 °C, 0.3 mL/min), and Fr3 (250 °C, 0.3 mL/min), and Fa4 (150 °C, 1.0 mL/min), Fa5 (200 °C, 1.0 mL/min), and Fa6 (250 °C, 1.0 mL/min) (Table 2). CO2-saturated water was prepared by injecting CO2 gas at a 2 MPa pressure into 11 L distilled water and maintaining the pressure with an automatic gas valve for one day to ensure equilibrium. This produced CO2-saturated water with a pH of approximately 3.2 and 3 wt.% dissolved CO2 at room temperature, providing a stable CO2-saturated water supply into the reactor. The pH of the CO2-saturated water was measured to be below 3.9 before each experiment. The flow rate was set to 0.3 mL/min for Fa1, Fa2, and Fa3 and set to 1.0 mL/min for Fa4, Fa5, and Fa6. The running times were from 120 to 228 h, and the total discharges were within 3700–8300 mL (Table 2). The Darcy velocities calculated using the flow rate divided by the core cross-sectional area (1.77 × 10⁻⁴ m2) ranged from 2.8 × 10⁻⁵ to 9.4 × 10⁻⁵ m/s, which were slightly lower than the calculated velocities (4.1 × 10⁻³–5.6 × 10⁻⁵ m/s) of geothermal pathways in the Sumikawa geothermal area, Japan [30]. In all experiments, a gold filter was used to fix the rock samples within the core.

2.3. Analysis of Water Quality and Rock Composition

The fluid samples collected from the reactor were divided into two groups: one for measuring pH and electrical conductivity (EC; HORIBA D-54, Kyoto, Japan) and the other for analyzing the dissolved chemical components (Na+, K+, Ca2+, Mg2+, Fe2+, Al3+, and Si). The samples for the chemical component analysis were acidified to pH 2 with 1N HNO3 to prevent element precipitation [31]. Analyses were performed using inductively coupled plasma atomic emission spectroscopy (ICP-AES; Optima 7300DV, Perkin Elmer, Waltham, MA, USA). Calibration curves were plotted using Multielement Standard Solution W-VI and Silicon and Potassium Standard Solution (FUJIFILM Wako Pure Chemical Corp., Osaka, Japan). Analytical accuracy was confirmed by reanalyzing three selected samples from each test. The analytical error for most elements was within ±5%, with a few exceptions. The standard deviations are shown as vertical lines in Figure 2.
After the laboratory tests, the surface morphology and chemical composition of the rock samples after the reaction were evaluated via scanning electron microscopy with energy-dispersive X-ray spectroscopy (SEM-EDS; JCM7000 + JED2300, JEOL, Tokyo, Japan). X-ray diffractometry (XRD; Rigaku MiniFlex 600, Tokyo, Japan) was employed for crystal analysis. A Cu X-ray tube was used, and a Ni plate was employed as a kβ filter. The tube voltage, tube current, and scan speed were set to 40 kV, 15 mA, and 5.0°/min, respectively [32].

2.4. Geochemical Modeling

The pH values of the rock samples were measured; however, the samples were exposed to the atmosphere at room temperature, which may have caused degassing [10,11]. Therefore, the pH values were calculated using PHREEQC Version 3 to ensure accuracy, with the analyzed solution values serving as inputs for the calculations [33]. The speciation, gas-phase, and reaction modules in PHREEQC were used to replicate the flow-through experimental conditions. All cations were included in the speciation module, and CO2 (g) pressure was set to 2 MPa at 25 °C in the gas-phase module to represent the CO2 dissolver conditions. The reaction pressure was then set to 10 MPa, and the reaction temperature was adjusted according to each experimental condition to simulate the reactor environment. All PHREEQC calculations were performed using thermodynamic data from the Lawrence Livermore National Laboratory (LLNL) [34,35]. This code and database enable accurate calculation of chemical species quantities and mineral saturation indices (SIs), even in high temperature ranges of approximately 300 °C and low pH values [36].

3. Results

3.1. Dissolved Chemical Components
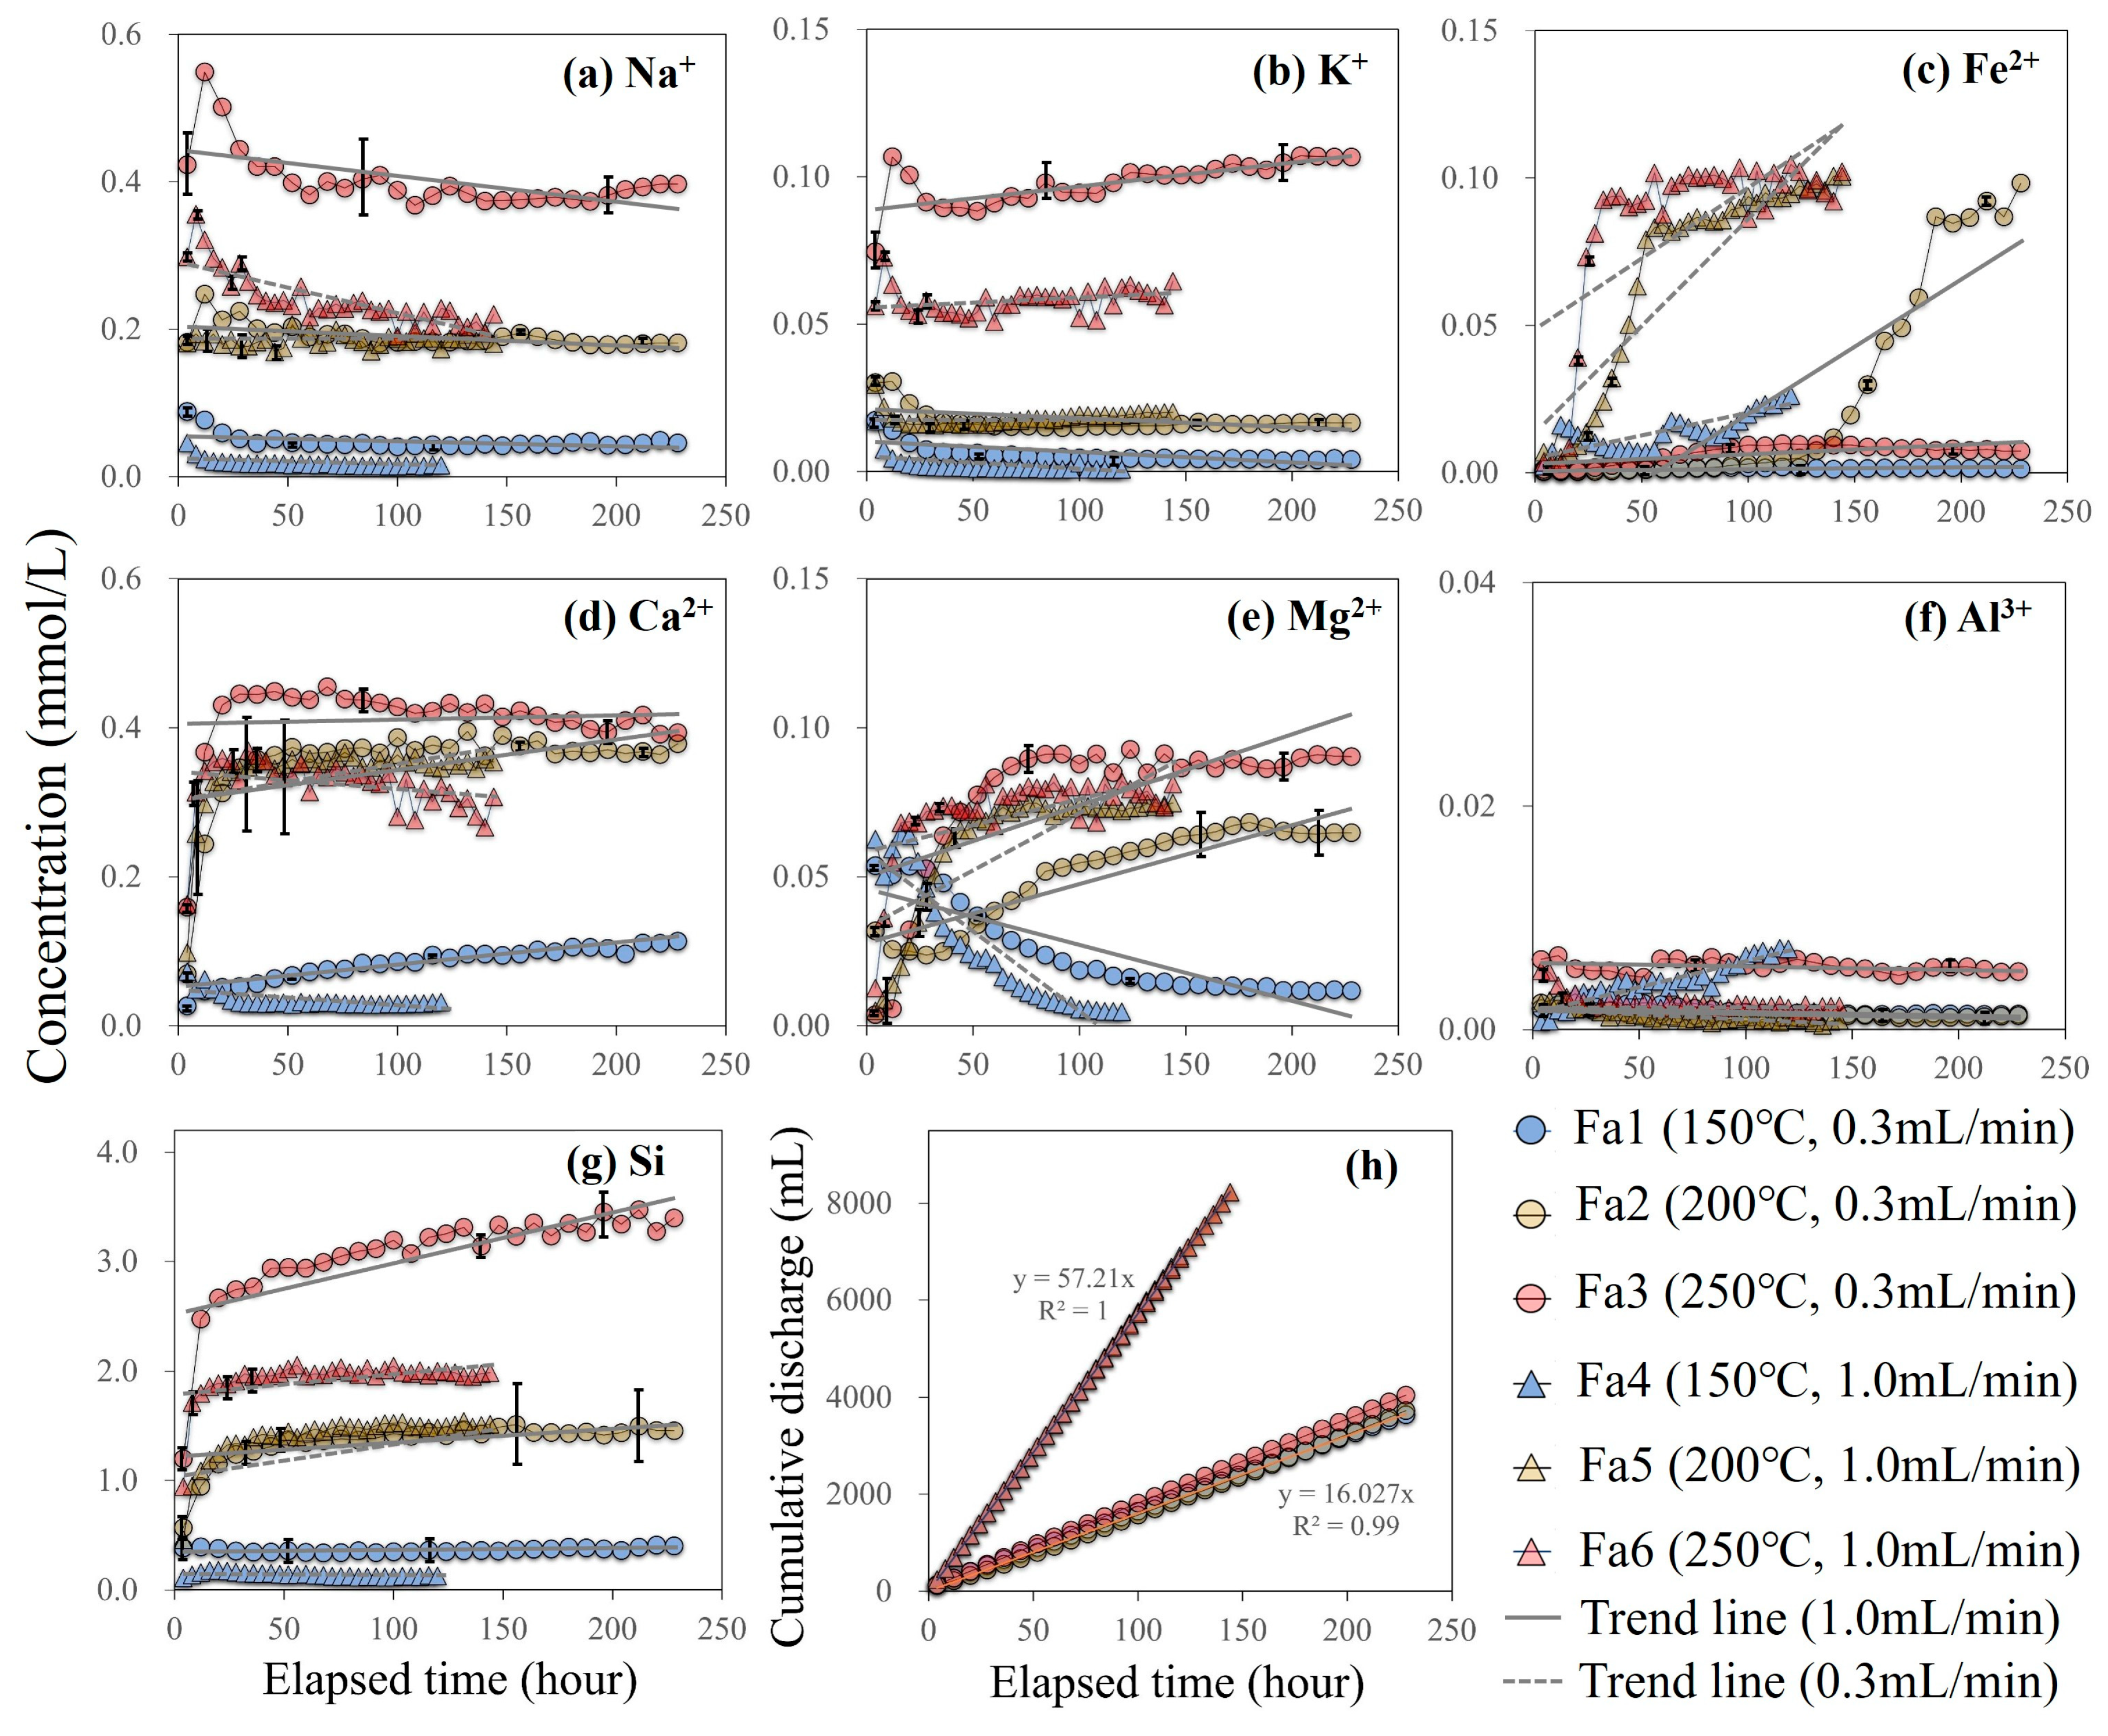
The concentrations of each component in the solution, as analyzed by ICP-AES, are presented in Figure 2 and Table S1 of the Supplementary Information. The concentrations initially fluctuated at the beginning of the test but gradually stabilized over time. The standard deviations of Na+, Ca2+, and Si were relatively large in some samples; however, they did not affect the overall concentration trends observed in each test. The concentrations of Na+, K+, Ca2+, Mg2+, and Si increased with temperature, following the trend 250 °C (Fa3 and Fa6) > 200 °C (Fa2 and Fa5) > 150 °C (Fa1 and Fa4). In addition, the concentrations were higher at the lower flow rate of 0.3 mL/min (circles in Figure 2) than at 1.0 mL/min (triangles in Figure 2). The Fe2+ concentrations were higher in the 200 °C and 250 °C tests (Fa2, Fa5, and Fa6), except for Fa3. The Al3+ concentrations ranged from 0.001 to 0.007 mmol/kg and demonstrated no clear trend with temperature variation. The calculated pH ranged from 3.4 to 3.9 (Table S1). This behavior may be related to the dissolution and precipitation of Al-bearing minerals. The cumulative discharge in all experiments exhibited a linear relationship, indicating a stable discharge throughout the test duration: 17.87 mL/h for Fa1, Fa2, and Fa3, and 57.21 mL/h for Fa4, Fa5, and Fa6. The concentration of the elements followed the order of Si > Na > Ca > K > Mg > Fe > Al.
Figure 2. Chemical composition of water samples for (a) Na+, (b) K+, (c) Fe2+, (d) Ca2+, (e) Mg2+, (f) Al3+, and (g) Si reacted in Fa1–Fa6 (circles and triangles represent flow rates of 0.3 and 1.0 mL/min, respectively; colors correspond to temperature conditions: blue for 150 °C, yellow for 200 °C, and red for 250 °C). Vertical lines indicate standard deviation. The cumulative discharge (h) increased linearly with time, indicating that the flow rates remained stable throughout the tests.
Geosciences 15 00351 g002

3.2. Rock Properties

3.2.1. Reacted Rock Samples and XRD

Figure 3 shows photographs of rock samples retrieved from the core after the flow-through experiments. In Fa1 and Fa4 (150 °C), the rock surfaces from the inlet to the outlet retained a black coloration, reflecting the natural color of the unreacted andesite. In Fa2, Fa3, and Fa5, the rock samples collected from the core inlet showed gray discoloration, whereas those obtained from the outlet retained a black coloration. The discoloration extent at the inlet was more pronounced than the original color of the rock samples, suggesting that the reaction between CO2-saturated water and the rock grains predominantly occurred at the core inlet section. In Fa6, the rock samples from the core inlet showed brown discoloration whereas those from the outlet retained a black coloration. The active reaction observed at the core inlet section is attributable to the low pH of the CO2-saturated water, which decreases the solubility of minerals along the flow path toward the outlet and the residence time of fluids within the core; however, further study is required to clarify these mechanisms.
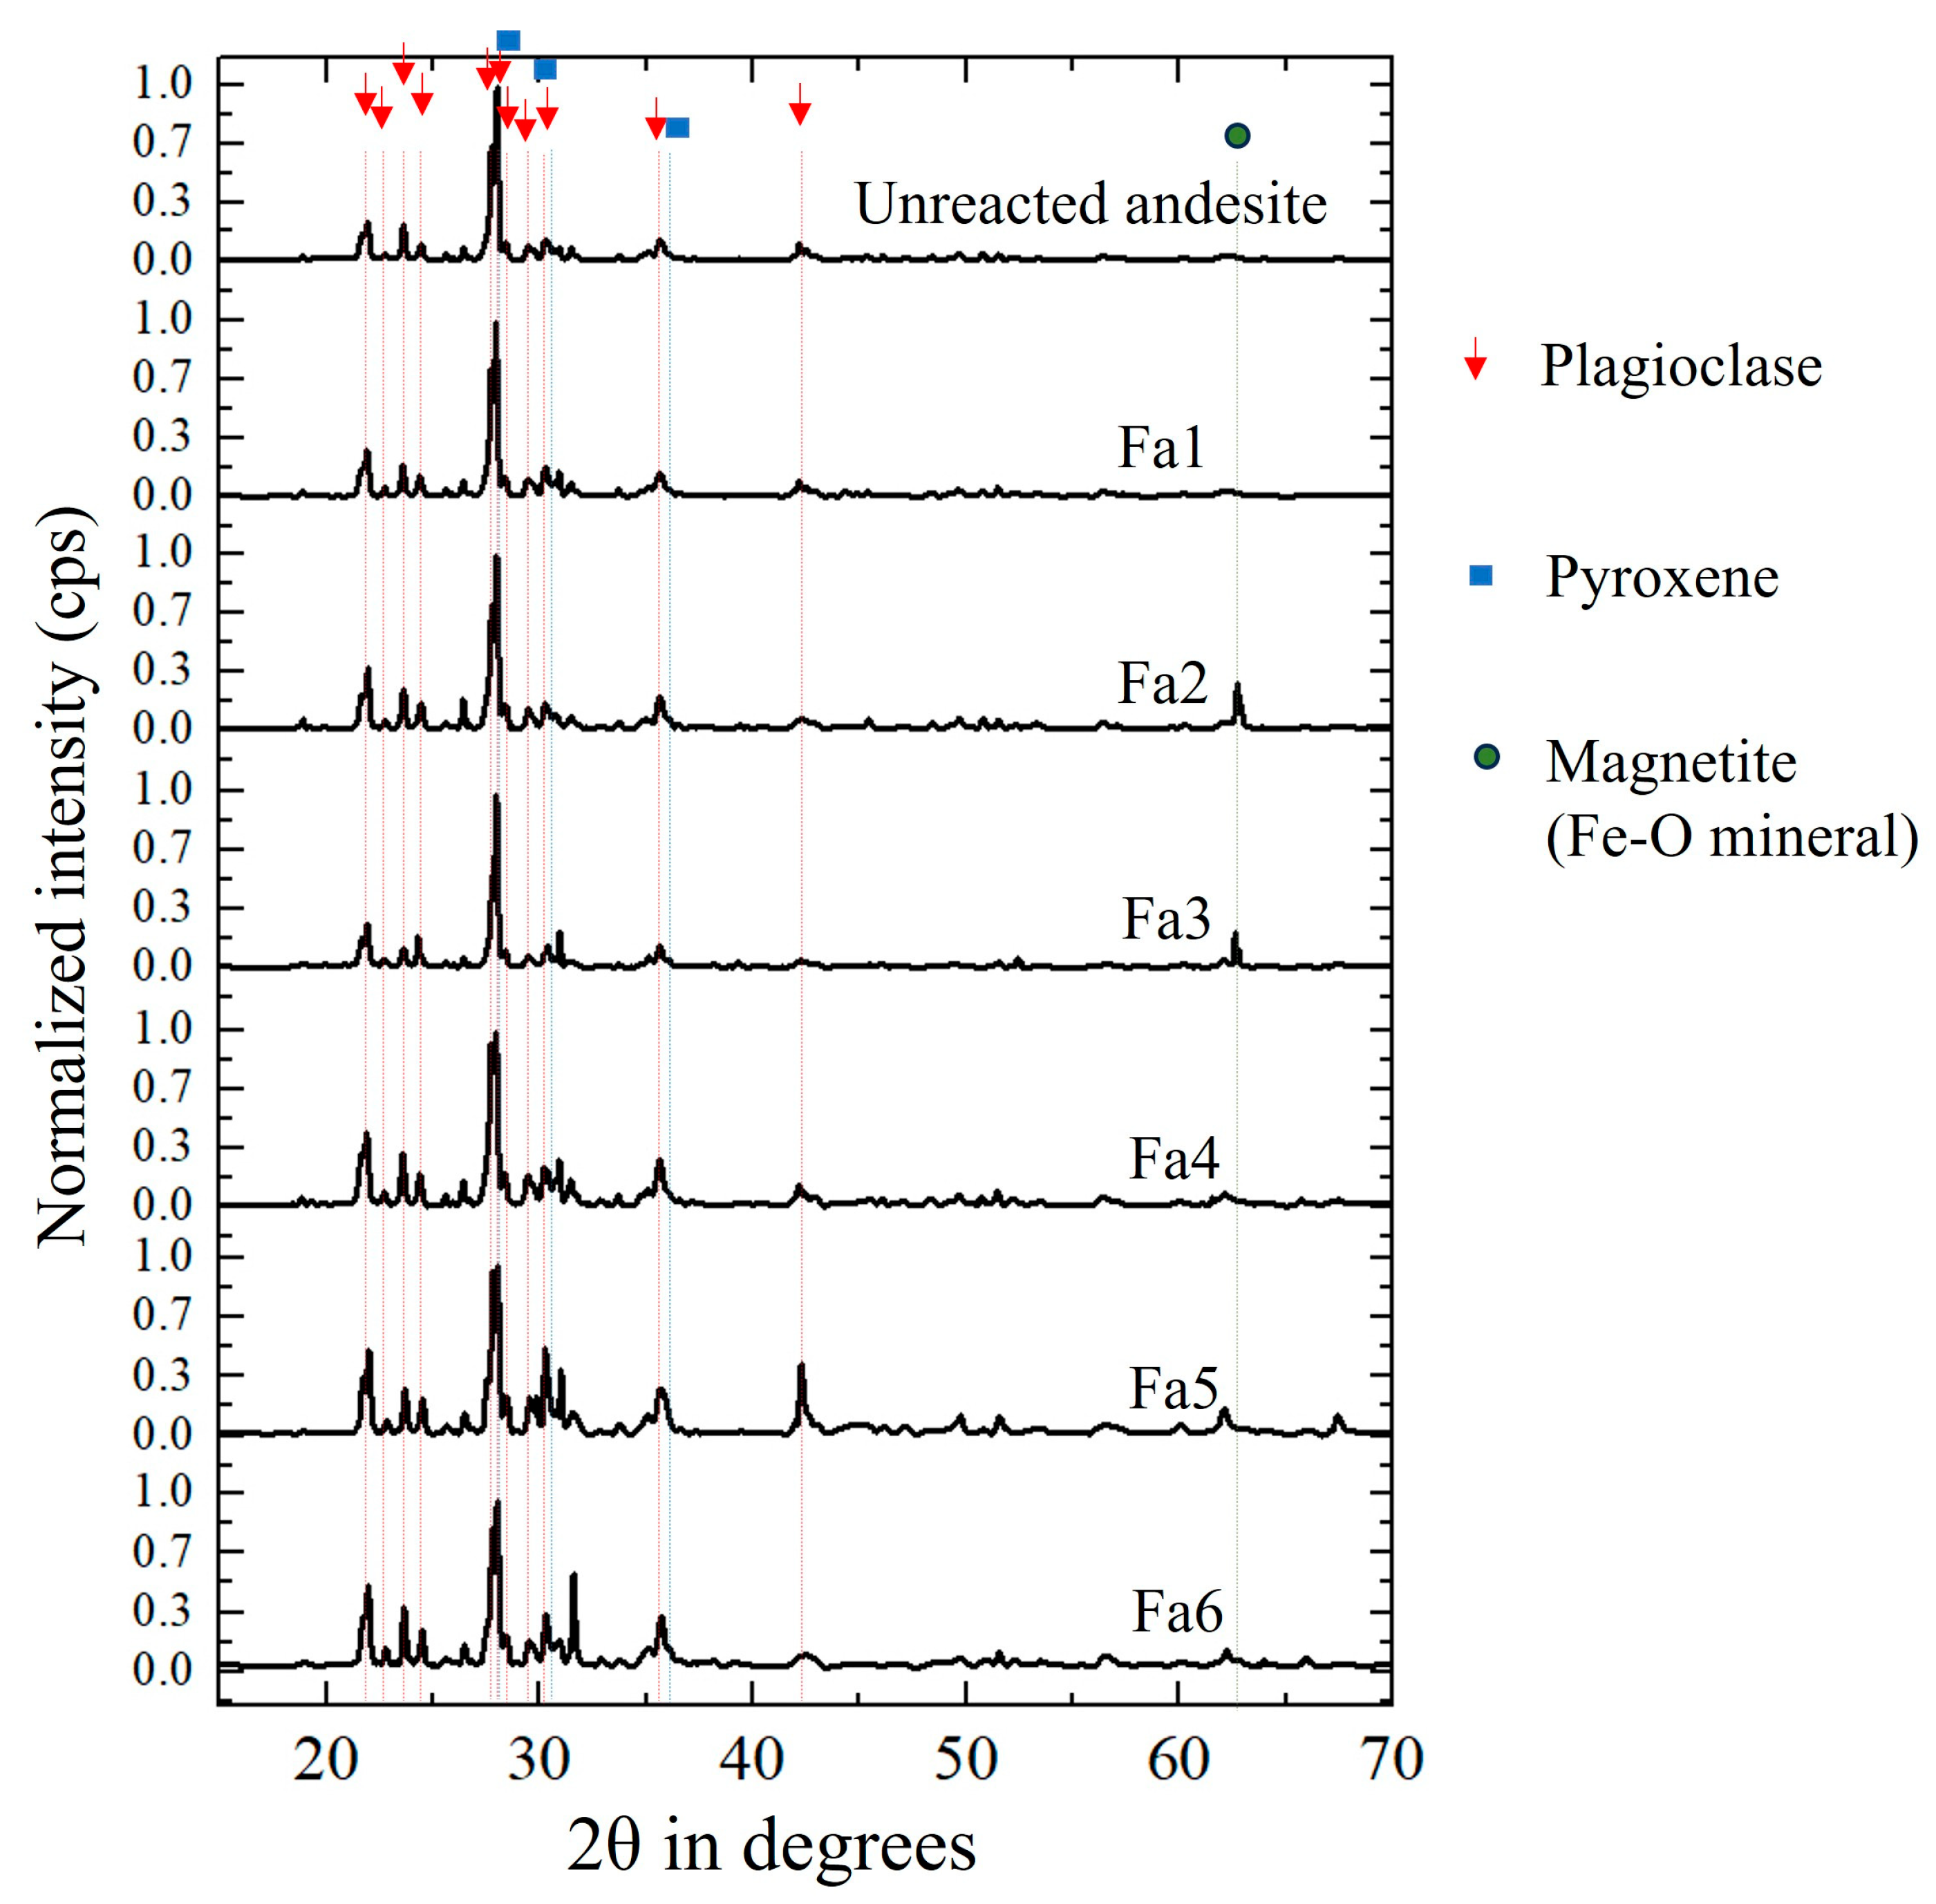
The XRD results of the reacted rock samples collected 30 mm from the inlet sections of Fa1–Fa6 are shown in Figure 4. The black curves in each subfigure represent the diffraction patterns of the corresponding samples. XRD analysis was performed to identify deviations from the diffraction pattern of unreacted andesite and detect the formation of secondary minerals. The mineral phases were identified using the PDF-2 2023 powder diffraction database. The identified minerals in the unreacted rock were albite, anorthite, labradorite, and augite. In the reacted rock samples (Fa1–Fa6), the primary minerals identified were albite, anorthite, and labradorite in the plagioclase group and augite in the pyroxene group. The diffraction patterns obtained from Fa2, Fa3, Fa5, and Fa6 (200 °C and 250 °C) exhibit a weak reflection at approximately 62.75°, attributable to Fe-dominant precipitates (Fe-O; magnetite). In the other test results, no pronounced precipitation of secondary minerals was observed. A possible explanation for this observation is the limited extent of secondary mineral precipitation on the rock surfaces. During the preparation of powdered samples for XRD analysis, the proportion of the unreacted bulk rock material likely exceeded that of the surface precipitates. As a result, the diffraction patterns of all reacted rock samples (Fa1–Fa6) were predominantly characteristic of the unreacted andesite.

3.2.2. SEM-EDS

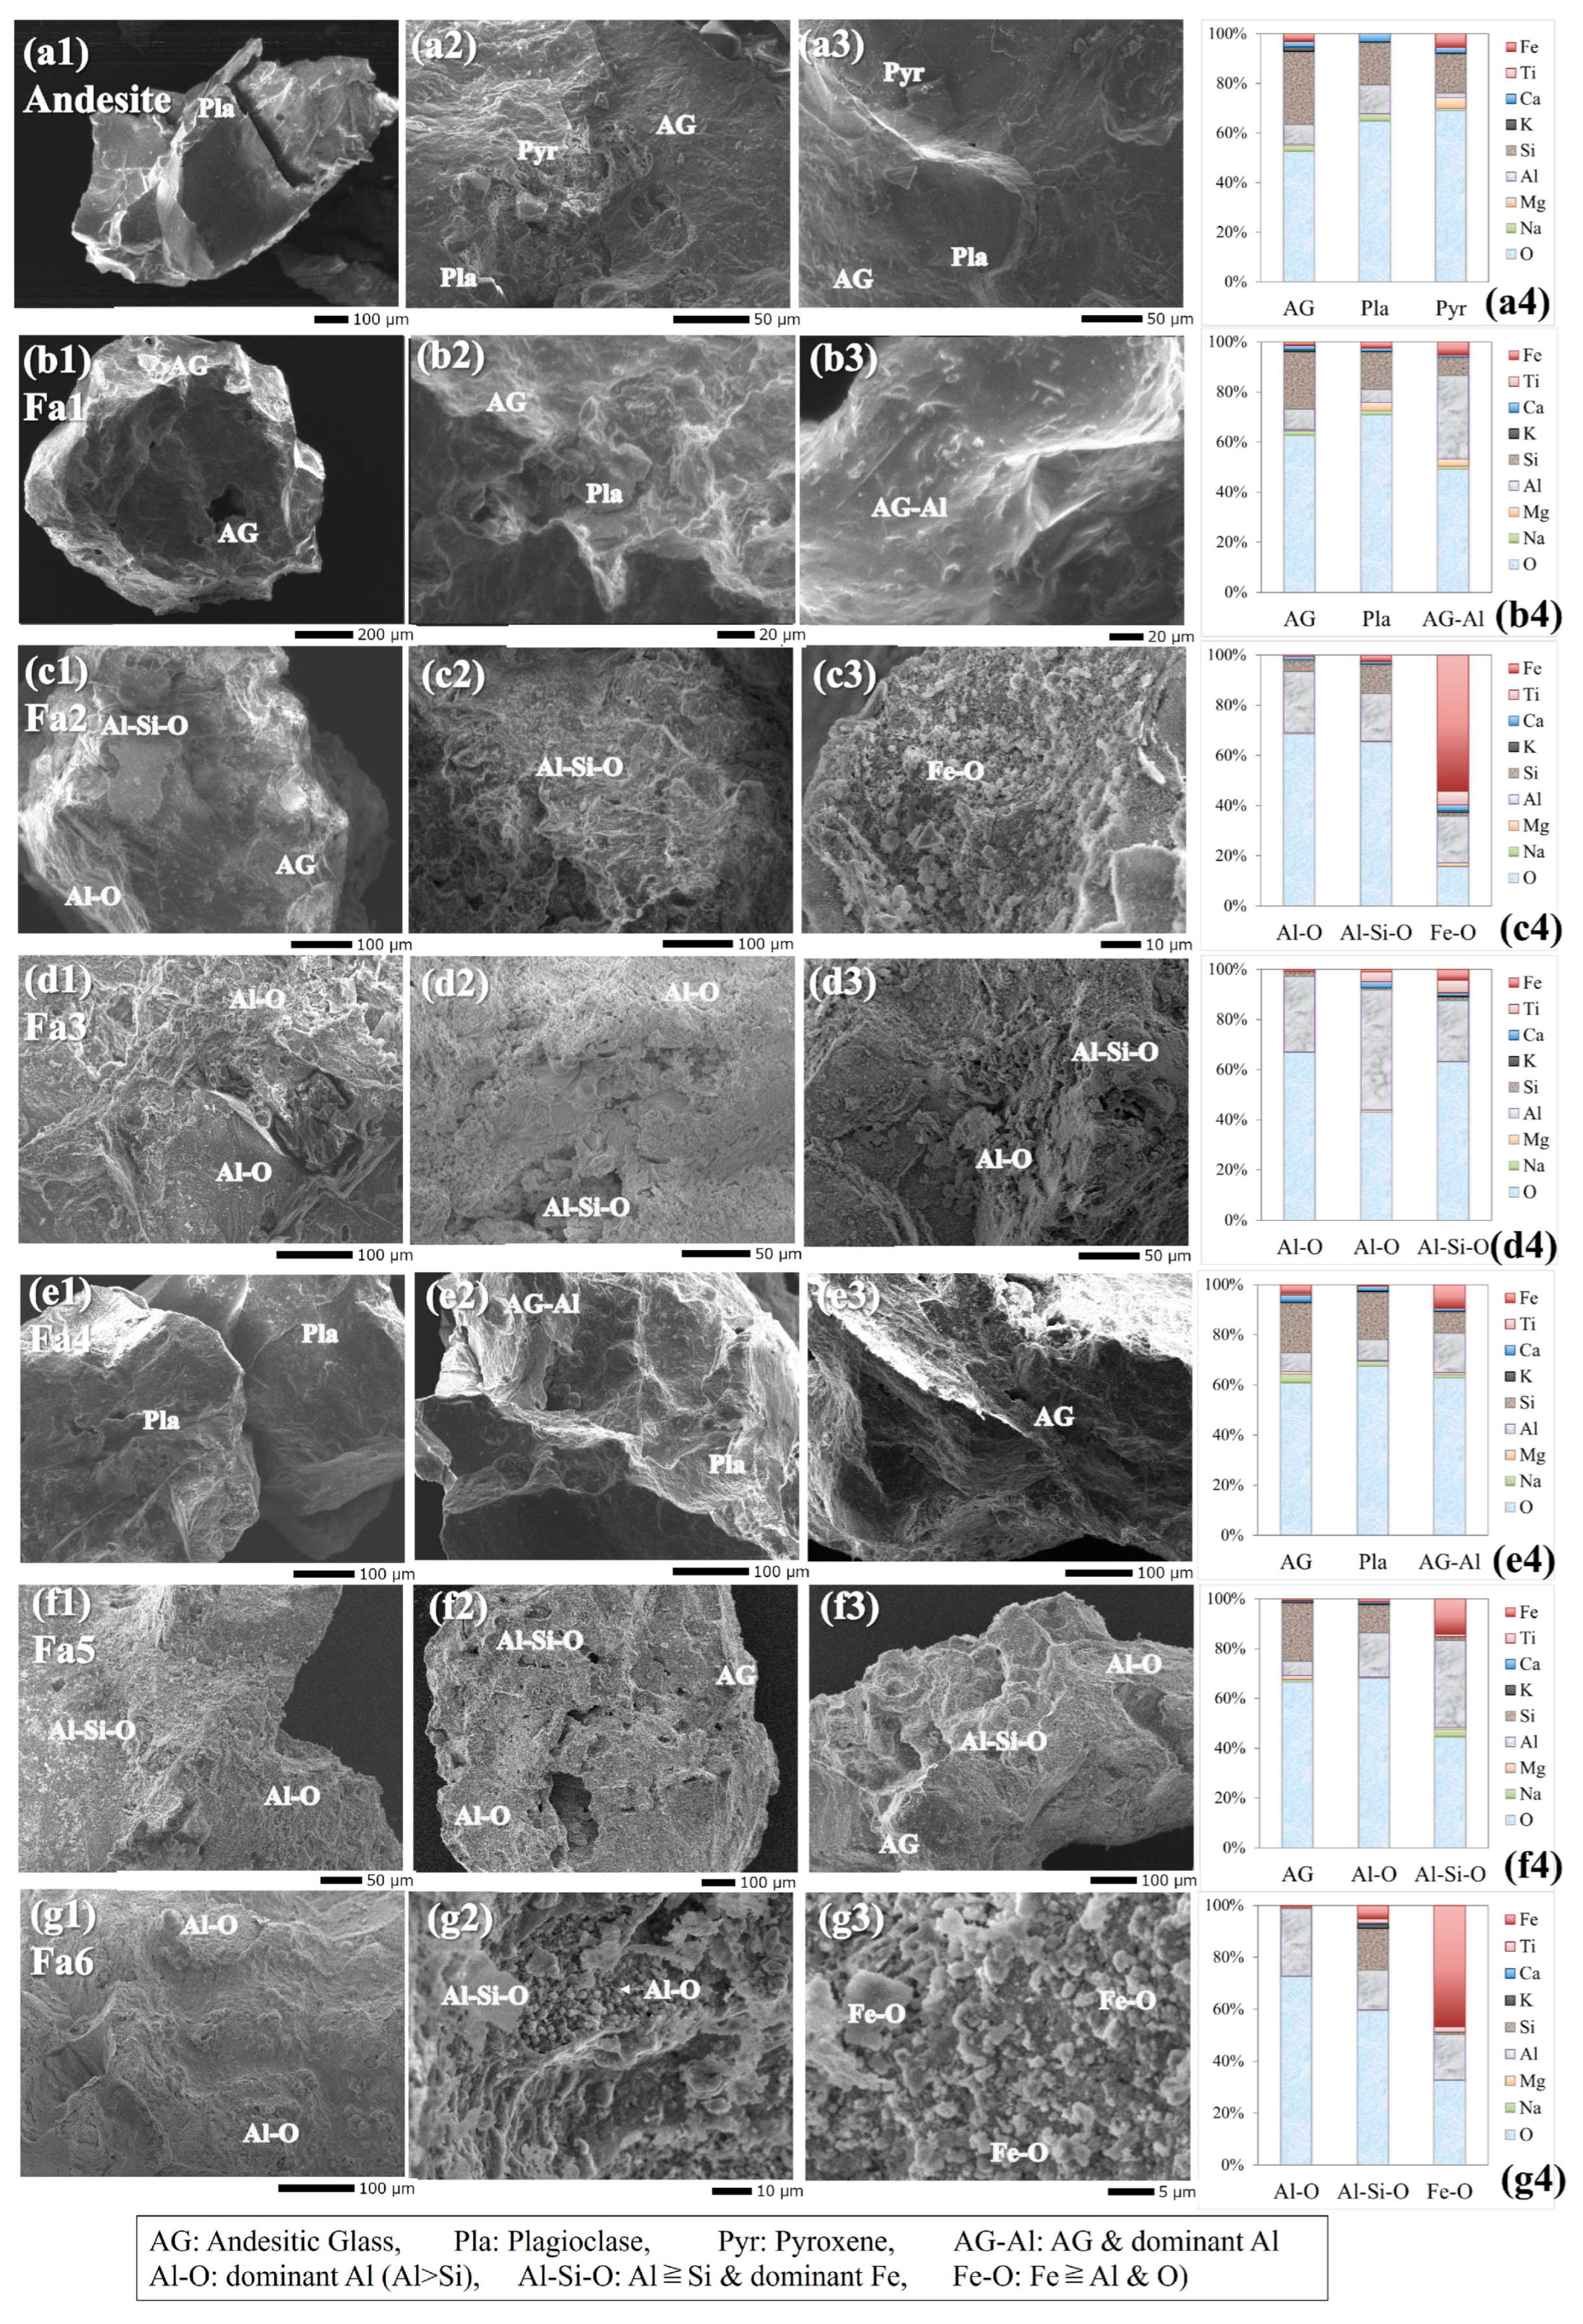
Figure 5 shows the SEM-EDS analysis results. Samples were taken from the discolored mineral surfaces located within 30 mm from the inlet sections of Fa2, Fa3, Fa5, and Fa6 and the minerals at the inlet sections of Fa1 and Fa4. The andesite (unreacted rock) sample is shown in Figure 5a, and the Fa1–Fa6 samples are shown in Figure 5b–g, respectively. In Figure 5, AG denotes andesitic glass, Pla denotes plagioclase, and Pyr denotes monoclinic pyroxene. AG-Al denotes andesitic glass with dominant Al, which is mainly found in the 150 °C experiments (Fa1 and Fa4); Al-O denotes aluminum oxide minerals, characterized by a higher molar percentage of Al than Si; Al-Si-O represents aluminum silicate minerals with approximately equal molar ratios of Al and Si or dominant Al and elevated Fe content; Fe-O denotes Fe-dominant, Al-bearing precipitates. These mineral classifications are based on SEM imagery and EDS data (Table S2; Figure 5a4–g4).
The andesite primarily comprises glass with crystalline plagioclase and monoclinic pyroxene (Figure 5a). In Fa1, the mineral on the rock surface is similar to that of the unreacted andesite, but AG-Al was observed on the flat surface. In Fa2, Al-O, Al-Si-O, and Fe-O precipitates were present on the glass and plagioclase. Fa3 exhibited Al-O, Al-Si-O, and Fe-O precipitates on the rock surface. The precipitation trends observed in Fa4, Fa5, and Fa6 were similar to those in Fa1, Fa2, and Fa3, respectively. According to the SEM imagery results, the precipitates observed at 150 °C (Fa1 and Fa4) indicate only small amounts of secondary Al-O and Al-Si-O minerals, suggesting that dissolution processes were predominant at this temperature under the hydrothermal conditions of this study. However, with increasing temperature (200 °C and 250 °C), larger amounts of Al-O, Al-Si-O, and Fe-O minerals were precipitated, indicating the formation of Al-bearing precipitates with high Fe content. The SEM-EDS analysis did not reveal marked differences in the types of secondary minerals formed due to changes in flow rate.
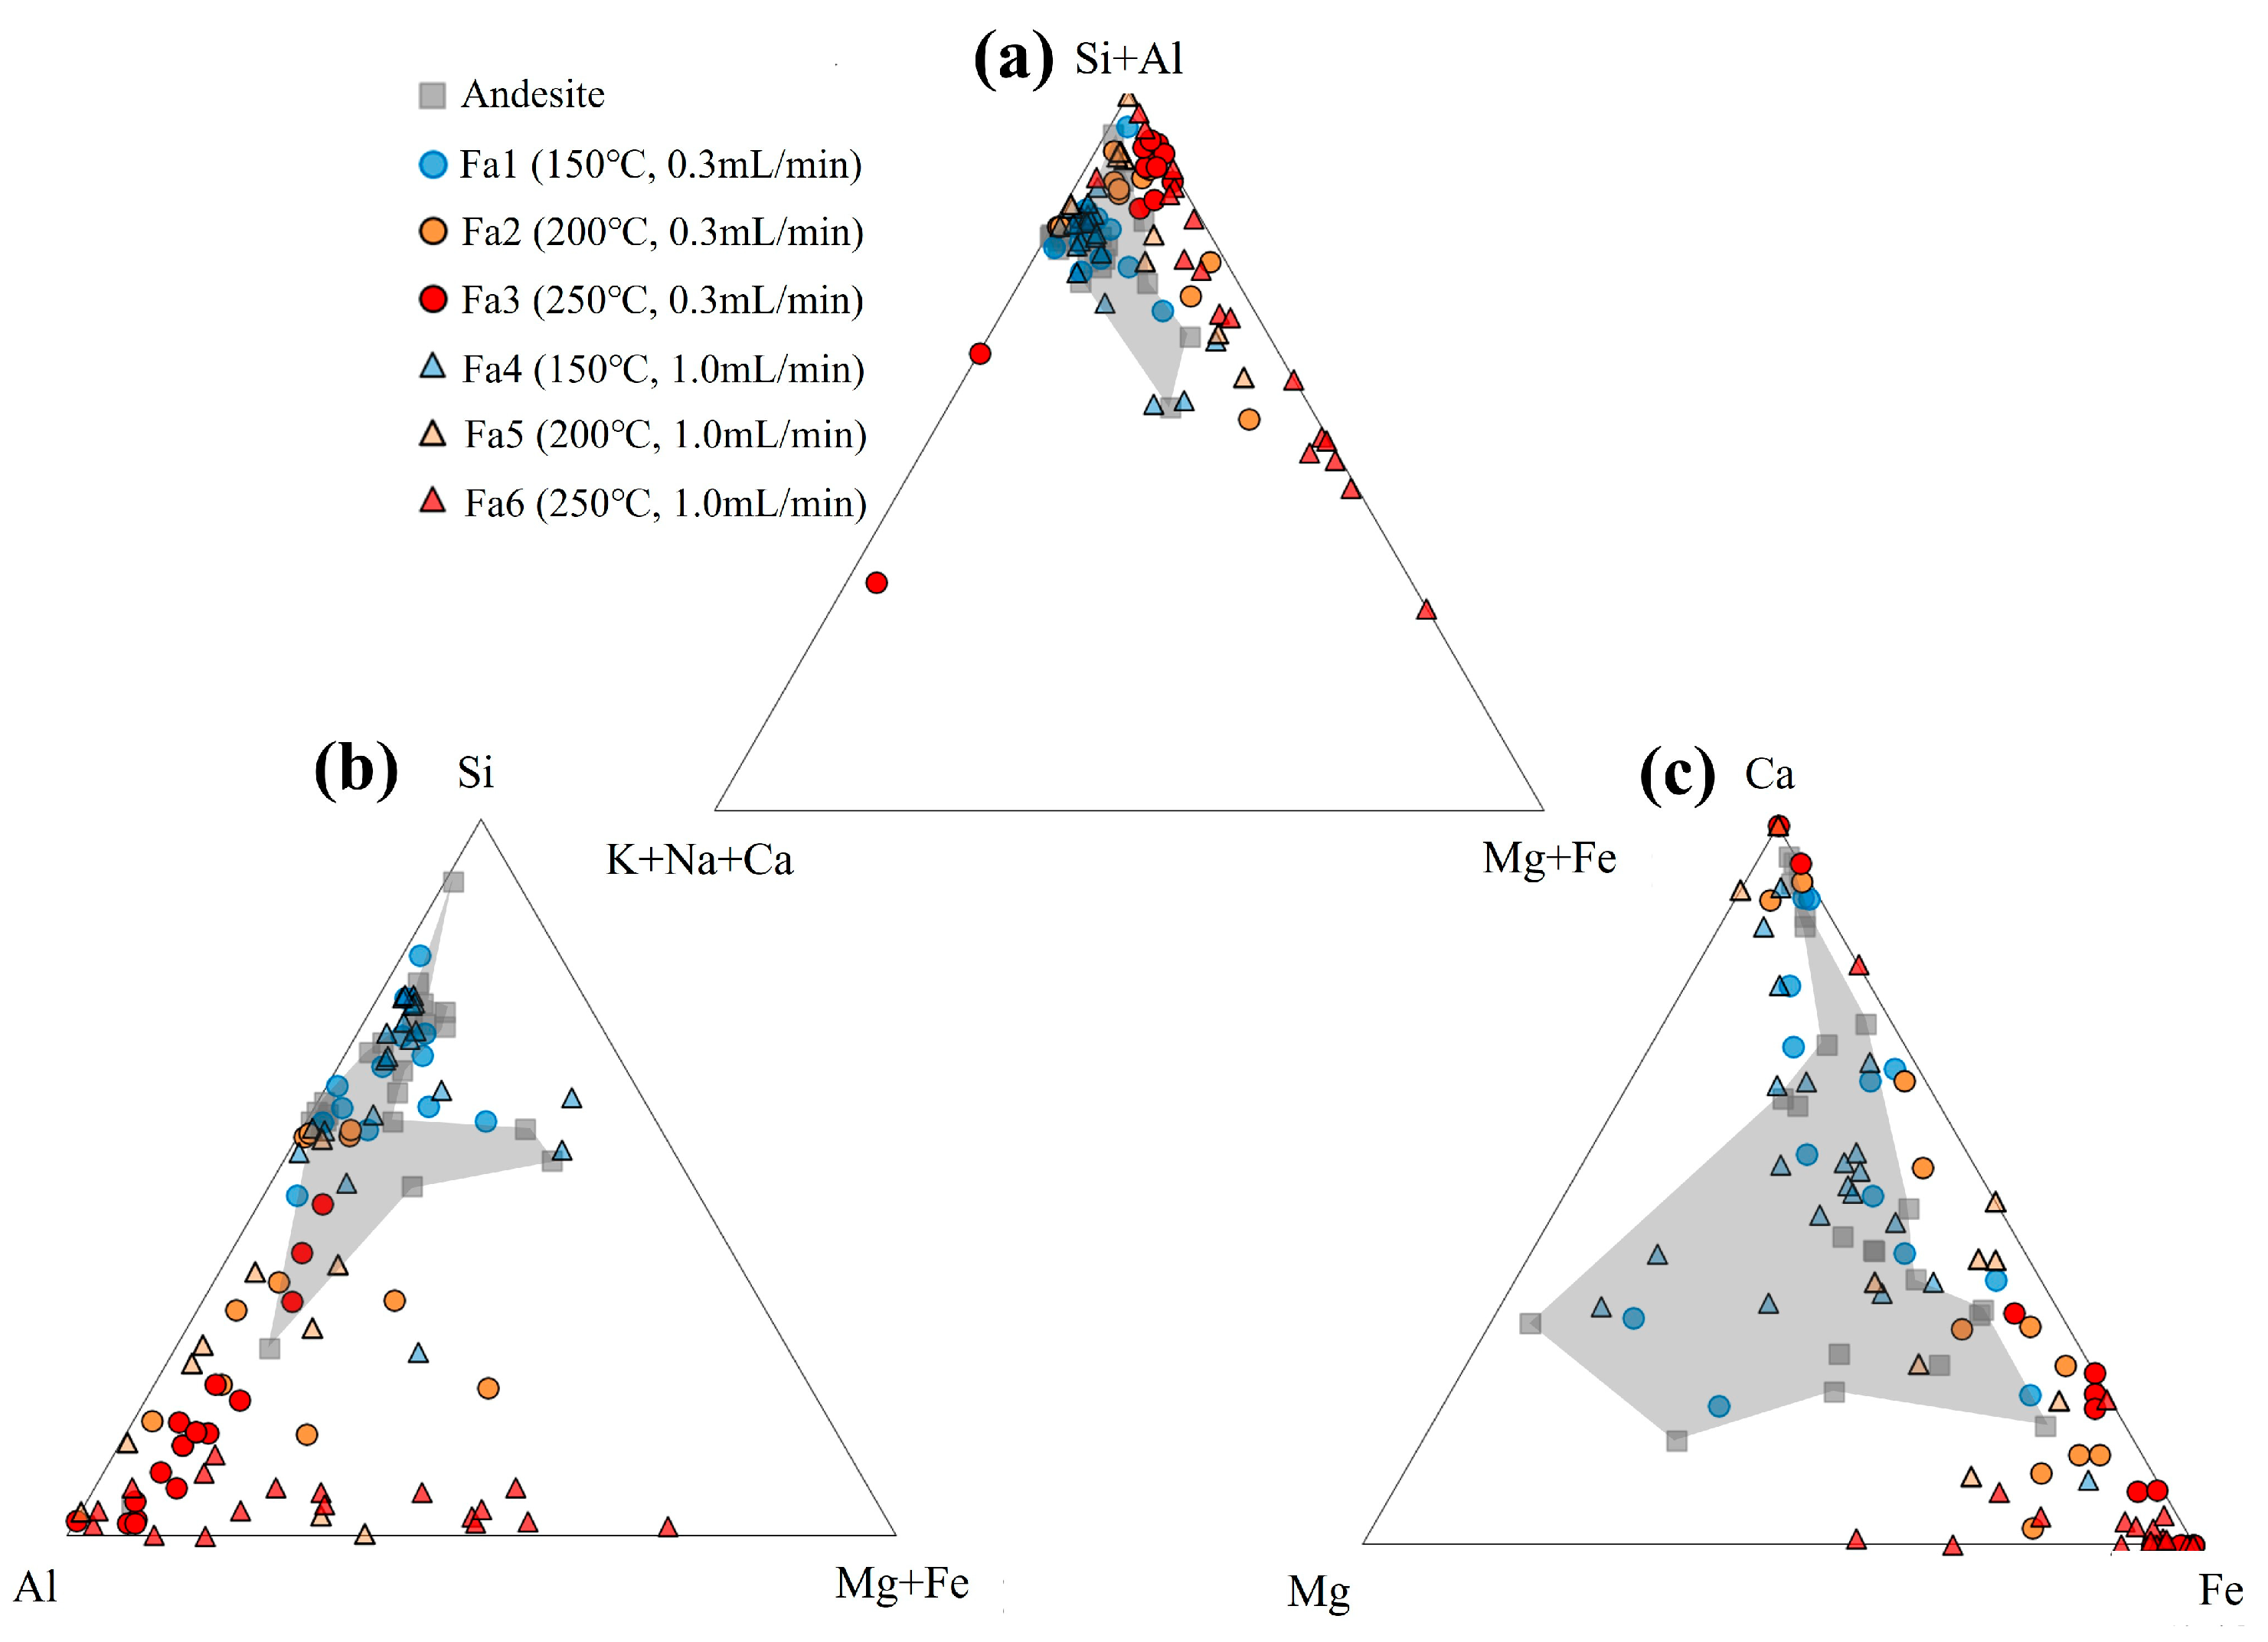
Ternary diagrams created using the EDS results for the rock samples are shown in Figure 6: (a) Si + Al—K + Na + Ca—Mg + Fe, (b) Si—Al—Mg + Fe, and (c) Ca—Mg—Fe. The gray area in each panel represents the unreacted andesite sample, serving as a reference for comparison. The chemical compositions of the rock surfaces for Fa1–Fa6 were distributed near the andesite area but exhibited a shift toward the Si + Al component axis, indicating chemical alteration relative to the unreacted rock (Figure 6a). In Figure 6b, the Si and Al contents of Fa1 and Fa4 are distributed near those of the unreacted andesite. However, with increasing temperature (Fa2, Fa3, Fa5, and Fa6), the Al content on the rock surface increased relative to Si, and the Mg + Fe component showed a notable increase. The Fe content increased more than the Mg content, indicating a dominant Fe enrichment on the rock surface (Figure 6c). This suggests that the chemical composition of the rock surface was altered by the flow-through experiments, with the predominant precipitation of Al and Fe components.

4. Discussion

4.1. Dissolution of Andesite

The chemical composition of the reaction solution reflects the dissolution and precipitation reactions of the rock grains in CO2-saturated water within the reactor. CO2-saturated water acts as the input, the reaction solution represents the output, and the rock–CO2–water interaction is the underlying mechanism driving the changes. Suto et al. [36] investigated the interactions between granite and CO2-saturated water over a temperature range of 100–350 °C and reported consistently low Al3+ concentrations across the temperature range and a marked decrease in divalent cations (e.g., Mg2+) with increasing temperature. They attributed these trends to the low solubility of Al-bearing minerals or their incorporation into secondary phases as well as the precipitation of magnesium as carbonate minerals.
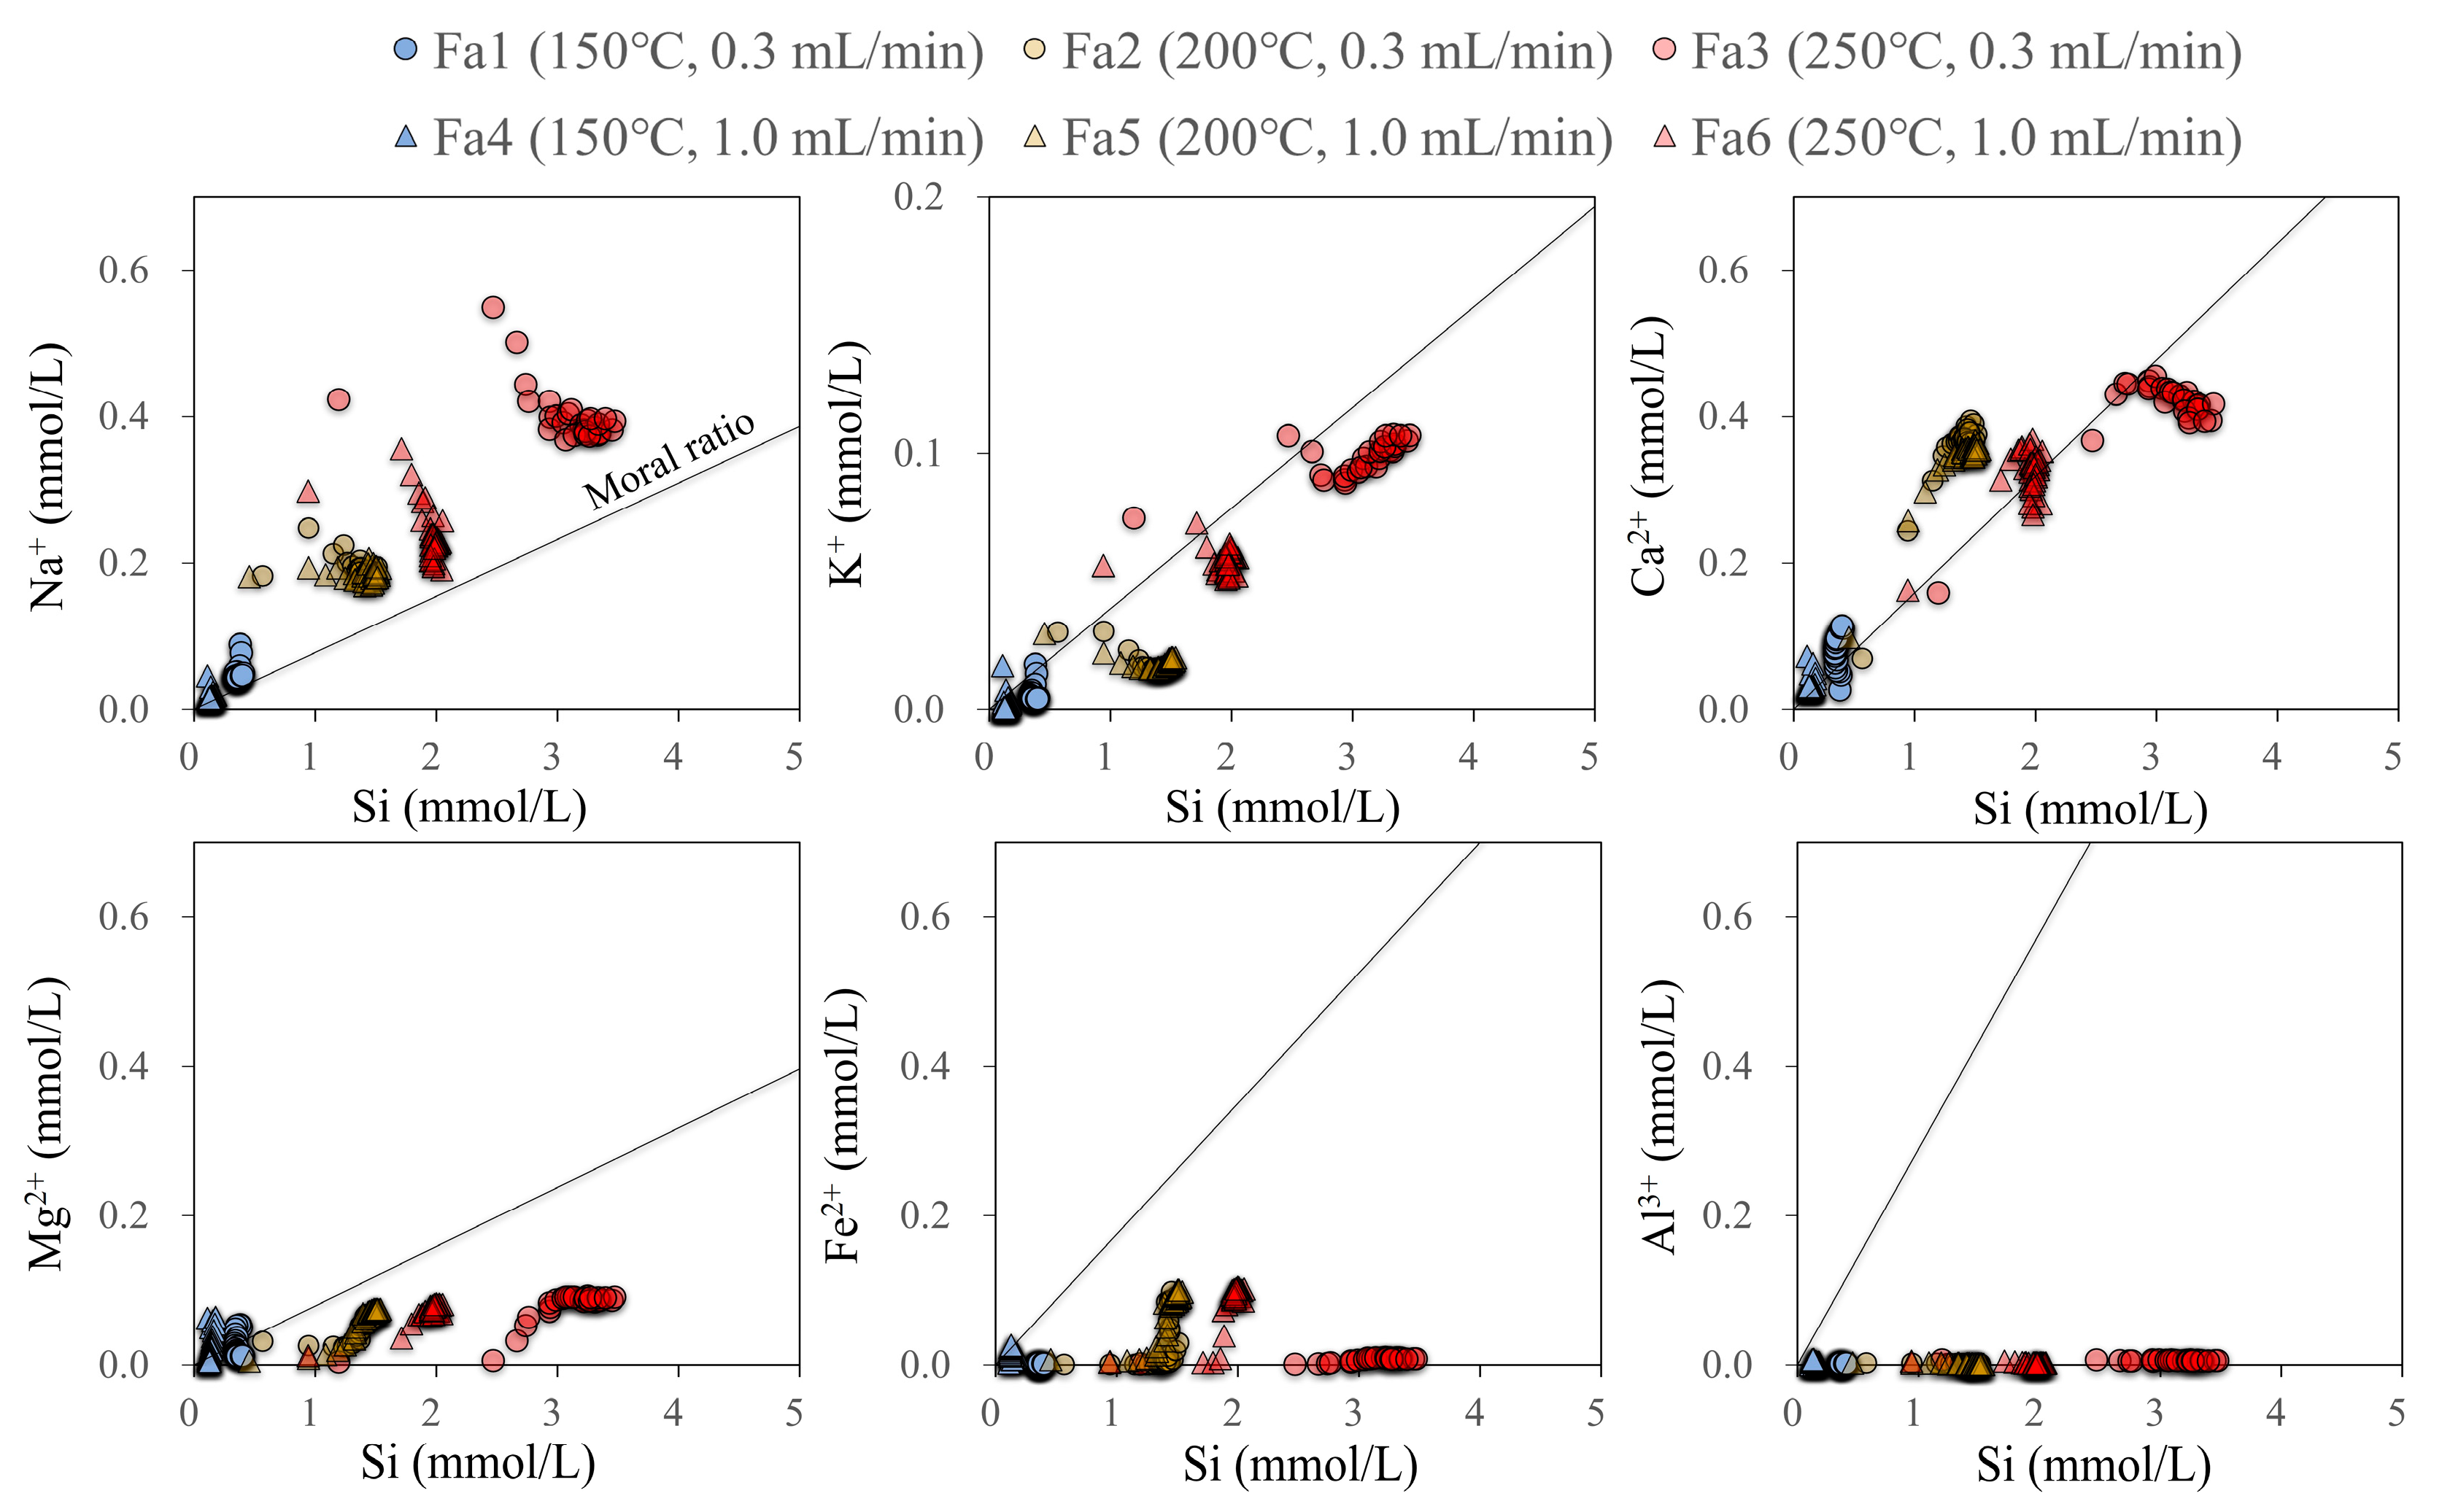
Figure 7 shows each chemical component plotted against Si. Molar ratios were calculated based on the averaged major oxide data for the andesite (Table 1). Higher Si concentrations were observed at elevated temperatures, reflecting the dominance of silicate mineral dissolution. The chemical elements, except for the Fe2+ and Al3+ concentrations, are generally distributed around the molar ratios of the unreacted rock. Although our results are partly consistent with a previous study relating to the Fe2+ and Al3+ concentrations, carbonate minerals were not observed in our study (Figure 5). Hangx and Spiers [37] reported that little to no carbonate and no dawsonite were detected in plagioclase–CO2–water interaction experiments. They concluded that this absence is attributable to the lack of appropriate substrate (seed) material required to promote carbonate precipitation, as in previous studies referenced in their paper. Similarly, Satake et al. [11] reported that no carbonate minerals were detected in their batch tests of basalt–CO2–water interactions and concluded that low pH might have contributed to this result. Therefore, although divalent cations were released through silicate mineral dissolution (Figure 7), the absence of carbonate mineral precipitation in our study is attributable to the low pH values and the lack of suitable substrate material or limited availability of divalent cations [37].

4.2. Precipitation of Minerals

Rock samples collected from the core inlet exhibited gray discoloration at 200 °C (Figure 3), and Al-O, Al-Si-O, and Fe-O minerals were precipitated (Figure 5) with low Fe2+ and Al3+ concentrations (Figure 7). Precipitates formed at different temperatures exhibit distinct characteristics due to changes in solubility, ion concentrations, and chemical reactions [22]. As the temperature increases, the solubility of certain minerals decreases, promoting the precipitation of specific minerals. To evaluate the saturation states of the major minerals potentially contributing to the observed reactions, SI values were calculated using PHREEQC [33]. As input parameters, the CO2 concentration of the solution and the initial CO2 pressure were assumed to be in equilibrium at room temperature. Subsequently, the pH and CO2 concentration were recalculated for each reaction temperature. SI is given by the following equation:
S I = l o g I A P K ,
where IAP and K denote the ion activity product and solubility constant of the mineral of interest, respectively. If SI > 0, then the mineral is oversaturated, indicating potential precipitation; if SI < 0, then the mineral is undersaturated, suggesting that dissolution is the dominant process.
Figure 8 shows the SIs of the secondary minerals selected for their distribution near equilibrium or within the oversaturated region. Carbonate minerals were undersaturated in all tests; only the SI of siderite is shown, indicating that the low pH contributed to the undersaturation [11]. Al-bearing minerals, such as gibbsite and boehmite, exhibited SI values ranging from 0 to 1.5 but did not exceed 2 in all tests. Clay minerals, such as beidellite and kaolinite, were distributed in the undersaturated region in all tests but were near equilibrium in Fa3 and Fa4. Iron hydroxide exhibited SI values ranging from 1 to 2 in the 150 °C tests (Fa1 and Fa4), but these values increased to approximately 3 in the tests conducted above 200 °C (Fa2, Fa3, Fa5, and Fa6). The SI values of magnetite ranged from 6 to 8 in the 150 °C tests but increased to 12–17 in the 200 °C and 250 °C tests, exhibiting a trend similar to that of iron hydroxide (Figure S1).
Gysi and Stefánsson [21] investigated the interactions between CO2-rich water and basaltic glass and reported that the alteration products comprised chemically zoned Ca–Mg–Fe carbonate solid solutions and amorphous silica at low temperatures (<100 °C). At higher temperatures (150–250 °C), calcite was the only carbonate mineral formed, indicating that temperature is essential in controlling the elemental mobility and secondary mineral formation. At the higher temperatures, clay minerals became the predominant alteration products. Similarly, previous studies on basalts have reported that kaolinite and halloysite typically form below 150 °C, followed by the formation of smectite, zeolites, and carbonate minerals; however, above 150 °C, the stable secondary mineral assemblage shifts, with quartz, smectite, and calcite becoming dominant [22,36,38,39]. In particular, a mineralogical transition from smectite to chlorite has been observed between 200 °C and 240 °C [40].
Based on previous studies [21,22,36,38,39] and our results, the Al-Si-O minerals identified in the 200 °C and 250 °C tests are likely beidellite, a member of the smectite group, or kaolinite. In addition, no carbonate precipitation was observed in this study, attributable to the low pH values [11]. For andesite, batch tests conducted at 100 °C have demonstrated the formation of Al-bearing minerals [25]. Gibbsite tends to precipitate under acidic conditions, whereas its polymorph, bayerite, readily forms in solutions with a pH above 5.8 [25,41]. Therefore, gibbsite and boehmite are considered suitable candidates for the Al-O minerals identified in this study. However, Al-O minerals were not identified in the 150 °C tests (Fa1 and Fa4), likely because the dissolution process was dominant under the test conditions. Based on the brown color of the rock grains and chemical components, iron hydroxide or magnetite is considered the Fe-O mineral. Therefore, Fe2+ and Al3+ concentrations in the fluid were markedly lower than those of Si (Figure 7), implying that secondary mineral formation is effectively sequestering Fe and Al elements from the solution. Although the increasing Fe2+ concentrations in Fa2, Fa5, and Fa6 solutions were uncertain (Figure 2c), precipitation is likely, as the Fe2+/Si ratio was markedly lower than the molar ratio of the unreacted rock (Figure 7).

4.3. Difference of Flow Rate Using Si Dissolution Rates

To understand the effects of flow rate and identify the parameters influencing the differences in chemical composition, dissolution rates were calculated and compared. In flow-through experiments, the dissolution rate of a rock is given by [25,42] as
R = d C d t · V A
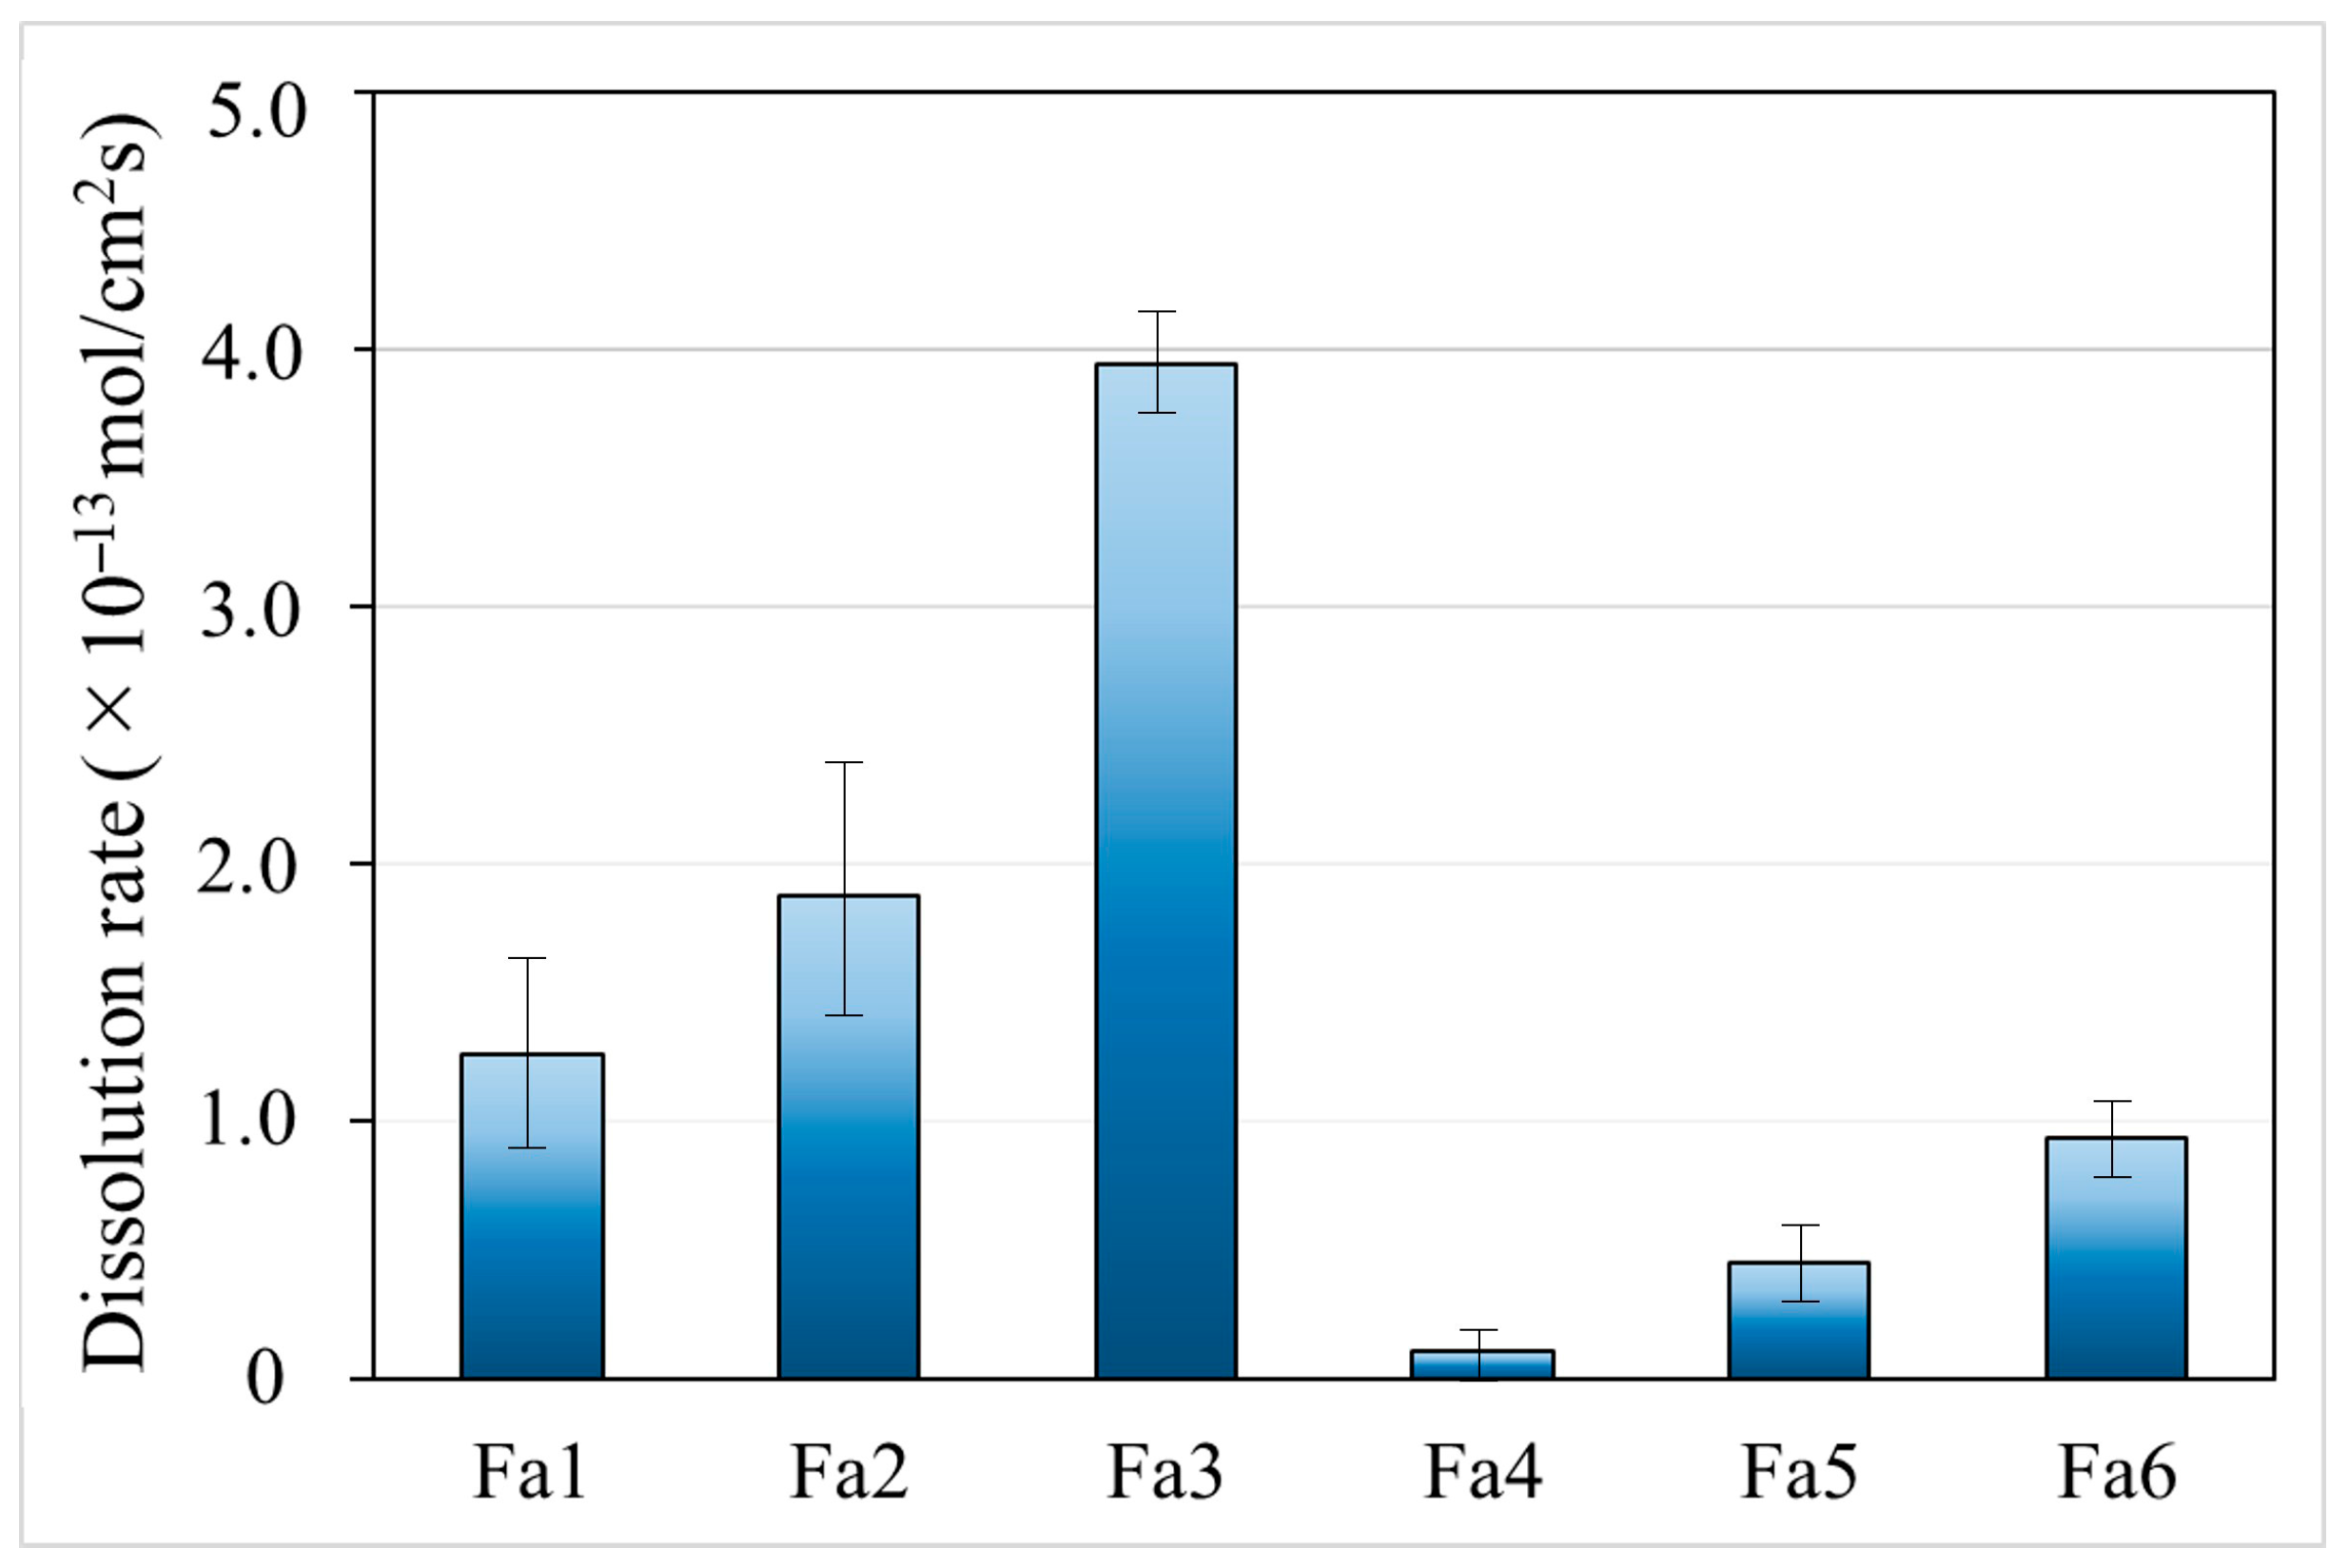
where A denotes the surface area of the rock (cm2), dt denotes the time interval for the reaction (s), dC denotes the molar concentration of the element leached during dt (mol/dm3), and V denotes the volume of the solution (cm3) involved in the reaction (i.e., the volume of water that flowed during dt in a flow-through test). Using these parameters, the dissolution rate (R) can be expressed as the number of moles of the element released per square meter of rock surface per second (mol/cm2s) [43]. Assuming a linear change in concentration over time within the sampling interval, the reaction rate can be calculated by substituting the average rate of change in concentration (dC/dt) for the time derivative of concentration [25]. To determine the dissolution rates, we used the release of Si during the first 4 h of the experiment (Figure 2g and Table S1). Belshaw et al. [25] reported that this approach enables approximation of far-from-equilibrium conditions in reactors and simulates the behavior of a hydrothermal system under continuous fluid flow. Under such conditions, the release of Si can be quantified based on the difference between the initial Si concentration in the distilled water and the concentration measured after 4 h. The specific surface areas were calculated based on the diameters of the andesite particles used (0.14 and 1.0 mm), which correspond to 159 and 22 cm2/g, respectively, assuming a rock density of 2.7 g/cm3. The surface area (A) was obtained by multiplying the specific surface area by the total rock sample weight (35 g). The volume of the solution was 26.5 cm3. Because the two surface areas resulted in different dissolution rates, we used the logarithmic average of the dissolution rates for each test. The distribution rates are shown in Figure 9.
The Si dissolution rates calculated in this study were of the same order of magnitude as the Si dissolution rates reported for labradorite at 100 °C and 0.6 mol of CO2 (aq), ranging from 5.0 × 10⁻¹³ to 1.5 × 10⁻¹² mol/cm2s [44], and were two orders of magnitude higher than those reported for andesite on Sumatra Island [25]. However, the rates calculated in this study (10−9 mol/m2s) were approximately two and four orders of magnitude lower than those of altered basalt (×10−7 mol/m2s) reported by Delerce et al. [27] and basaltic glass (×10−5 mol/m2s) [45], respectively, indicating that the andesite used in this study exhibited slower dissolution rates than basalt. The dissolution rates increased with temperature, consistent with previous studies, indicating that temperature plays a key role in controlling the elemental mobility and mineral precipitation [21]. Notably, the dissolution rates were lower in the tests conducted at higher flow rates (Fa4, Fa5, and Fa6). The dissolution rate in the 1.0 mL/min tests was approximately four times lower than that in the 0.3 mL/min tests, except for Fa4, reflecting the influence of flow rate differences. Flow-through laboratory experiments conducted at 150 °C and 15 MPa with different flow rates (0.1 and 0.01 mL/min) had shown that lower flow rates allow for longer residence times, making them more favorable for the formation of secondary minerals than higher flow rates [46]. Thus, the observed differences in dissolution rates are attributable to variations in residence time.
In this study, the XRD and SEM-EDS results indicated that a small amount of secondary minerals precipitated and the Si dissolution rates were lower than those of altered basalt and basalt glass at 150–250 °C. Al-bearing minerals, such as gibbsite and boehmite, as well as clay minerals, including beidellite and kaolinite, mainly precipitated. For basalt glass, Gysi and Stefánsson [22] reported that the pH increased from ~5.5 to >6 upon basaltic glass dissolution with the mineralization of smectites or chlorites, depending on the temperature (150 °C or 250 °C). Regarding CO2 sequestration, it is favored at 75 °C and pH 6, with Ca, Mg, and Fe being quantitatively incorporated into carbonates. However, at higher temperatures, clays and zeolites predominate in the uptake of divalent cations [22]. The pH values in this study were <4, which reflects the limited clay mineral formation during andesite dissolution compared with basalt glass. Based on the results, we infer that andesite has a relatively minor impact on permeability variations compared with basalt glass around the injection well in CO2–EGS reservoirs. Nevertheless, further studies, such as long-term batch and flow-through tests as well as kinetic simulations, are required to accurately evaluate the permeability variations.

5. Conclusions

This study experimentally investigated the geochemical interactions between andesite and CO2-saturated water under varying temperature (150–250 °C) and flow rate (0.3 and 1.0 mL/min) conditions using a flow-through reactor to simulate the environment near the injection well in CO2–EGS reservoirs. Higher chemical concentrations were observed at elevated temperatures, reflecting the dominance of silicate mineral dissolution. Secondary mineral formation varied with temperature: Al-bearing minerals, such as gibbsite and boehmite, could form under acidic conditions and were confirmed in the tests conducted at temperatures above 200 °C; Al-Si-O clay minerals, such as beidellite and kaolinite, were predominant at higher temperatures (200 °C and 250 °C); carbonate minerals were not observed in the tests, attributable to the low pH and limited availability of divalent cations. Lower Fe2+ and Al3+ concentrations in the solutions suggest the precipitation of secondary minerals, such as iron hydroxides and Al-bearing minerals. Flow rate substantially influenced reaction kinetics; lower flow rates (0.3 mL/min) allowed for longer residence times, resulting in higher dissolution rates.
The results of this study, using andesite and CO2-saturated water, deepen our understanding of the evolution of solution composition and the formation of secondary minerals under varying temperature and flow rate conditions in the peripheral zones. Particularly, the results indicate that the test conditions simulate the environment near the injection well in CO2–EGS reservoirs, where the fluid is acidic and dissolution is the dominant reaction in the rock. A small amount of secondary minerals precipitated, as indicated by the XRD results, and the Si dissolution rates were lower than those of altered basalt and basalt glass.

Supplementary Materials

The following supporting information can be downloaded at https://www.mdpi.com/article/10.3390/geosciences15090351/s1: Figure S1: Saturation index (SI) of magnetite: (a) Fa1, (b) Fa2, (c) Fa3, (d) Fa4, (e) Fa5, and (f) Fa6; Table S1: Chemical composition of the solutions after the reactions; Table S2: Molar percentages of O, Na, Mg, Al, Si, K, Ca, Ti, and Fe components analyzed by EDS.

Author Contributions

Conceptualization, H.Y.; methodology, H.Y. and A.U.; validation, H.Y., S.S., A.U. and H.K.; formal analysis, H.Y., A.U., H.K., S.S. and K.M.; investigation, H.Y., A.U., H.K., S.S., K.M. and A.T.; data curation, H.Y., A.U., K.M. and A.T.; writing—original draft preparation, H.Y. and A.U.; writing—review and editing, H.Y., A.U. and H.K.; visualization, H.Y. and S.S.; supervision, K.M. and A.T.; project administration, K.M. and A.T.; funding acquisition, K.M. and A.T. All authors have read and agreed to the published version of the manuscript.

Funding

This research received no external funding.

Data Availability Statement

All data are contained within the article.

Acknowledgments

The authors would like to thank members of the University of Toyama, especially Y. Hoshino, Y. Yamazaki, and M. Hamachi for their technical guidance on trace element analysis by ICP-AES. This study was re-commissioned by Taisei Corporation as a part of the JOGMEC project investigation in the R&D project “Carbon Recycling CO2 Geothermal Power Generation Technology”. We would like to thank the members of JOGMEC and Taisei Corporation for their cooperation.

Conflicts of Interest

Author Kentaro Masuoka was employed by the company Taisei Corporation. Author Amane Terai was employed by the company Japan Organization for Metals and Energy Security (JOGMEC). The remaining authors declare that the research was conducted in the absence of any commercial or financial relationships that could be construed as a potential conflict of interest.

References

  1. Adams, H.D.; Barron-Gafford, G.A.; Minor, R.L.; Gardea, A.A.; Bentley, L.P.; Law, D.J.; Breshears, D.D.; McDowell, N.G.; Huxman, T.E. Temperature response surfaces for mortality risk of tree species with future drought. Environ. Res. Lett. 2017, 12, 115014. [Google Scholar] [CrossRef]
  2. Liu, Y.; Tang, L.; Qiu, X.; Liu, B.; Chang, X.; Liu, L.; Zhang, X.; Cao, W.; Zhu, Y. Impacts of 1.5 and 2.0 degrees C global warming on rice production across China. Agric. For. Meteorol. 2020, 284, 107900. [Google Scholar] [CrossRef]
  3. Wu, Y.; Li, P. The potential of coupled carbon storage and geothermal extraction in a CO2-enhanced geothermal system: A review. Geotherm. Energy 2020, 8, 19. [Google Scholar] [CrossRef]
  4. Abas, N.; Kalair, A.; Khan, N.; Kalair, A.R. Review of GHG emissions in Pakistan compared to SAARC countries. Renew. Sustain. Energy Rev. 2017, 80, 990–1016. [Google Scholar] [CrossRef]
  5. Intergovernmental Panel on Climate Change (IPCC). Summary for policymakers. In Global Warming of 1.5 °C; Masson-Delmotte, V., Zhai, P., Portner, H.O., Roberts, D., Skea, J., Shukla, P.R., Pirani, A., Moufouma-Okia, W., Péan, C., Pidcock, R., et al., Eds.; Cambridge University Press: Cambridge, UK; New York, NY, USA, 2018; pp. 3–24. [Google Scholar]
  6. Brown, D. A hot dry rock geothermal energy concept utilizing supercritical CO2 instead of water. In Proceedings of the 24th Workshop on Geothermal Reservoir Engineering, Stanford University, Standford, CA, USA, 24–26 January 2000. [Google Scholar]
  7. Pruess, K. Enhanced Geothermal Systems (EGS) Using CO2 as working fluid—A novel approach for generating renewable energy with simultaneous sequestration of carbon. Geothermics 2006, 35, 351–367. [Google Scholar] [CrossRef]
  8. Wu, Y.; Li, P.; Hao, Y.; Wanniarachchi, A.; Zhang, Y.; Peng, S. Experimental research on carbon storage in a CO2-Based enhanced geothermal system. Renew. Energy 2021, 175, 68–79. [Google Scholar] [CrossRef]
  9. Li, P.; Hao, Y.; Wu, Y.; Wanniarachchi, A.; Zhang, H.; Cui, Z. Experimental study on the effect of CO2 storage on the reservoir permeability in a CO2-based enhanced geothermal system. Geotherm. Energy 2023, 11, 24. [Google Scholar] [CrossRef]
  10. Yang, H.; Satake, S.; Kuramitz, H.; Ueda, A.; Kusakabe, M.; Hoshino, Y.; Masuoka, K.; Enomoto, H.; Terai, A. Experimental study for basalt-CO2-water interaction with a high temperature and pressure flow reactor. In Proceedings of the WR-17 Y AIG-14, Sendai, Japan, 18–22 August 2023. [Google Scholar]
  11. Satake, S.; Yang, H.; Mori, K.; Hoshino, Y.; Ueda, A.; Kuramitz, H.; Masuoka, K.; Enomoto, H.; Terai, A. CO2 geothermal power generation: Laboratory experiment on the interaction between carbonated water and Rishiri Island basalt in the vicinity of injection wells. Energies 2025, 18, 2251. [Google Scholar] [CrossRef]
  12. Muraoka, H.; Sakaguchi, K.; Komazawa, M.; Sasaki, S. Assessment of Hydrothermal Resource Potentials in Japan. In Proceedings of the Geothermal Research Society of Japan, Kanazawa, Japan, 30 October–1 November 2008. [Google Scholar]
  13. Xu, T. Numerical studies of fluid-rock interactions in Enhanced Geothermal Systems (EGS) with CO2 as working fluid. In Proceedings of the Thirty-Third Workshop on Geothermal Reservoir Engineering, Stanford University, Standford, CA, USA, 28–30 January 2008. [Google Scholar]
  14. Mitiku, A.B.; Li, D.; Bauer, S.; Beyer, C. Geochemical modelling of CO2–water–rock interactions in a potential storage formation of the North German sedimentary basin. Appl. Geochem. 2013, 36, 168–186. [Google Scholar] [CrossRef]
  15. Ueda, A.; Ajima, S.; Yamamoto, M. Isotopic study of carbonate minerals from the Sumikawa geothermal area and its application to water movement. J. Geotherm. Res. Soc. 2001, 23, 181–196. (In Japanese) [Google Scholar]
  16. Xu, T.; Feng, G.; Shi, Y. On fluid-rock chemical interaction in CO2-based geothermal systems. J. Geochem. Explor. 2014, 144, 179–193. [Google Scholar] [CrossRef]
  17. Utomo, G.P.; Güleç, N. Preliminary geochemical investigation of a possible CO2 injection in the Ungaran geothermal field, Indonesia: Equilibrium and kinetic modeling. Greenh. Gases Sci. Technol. 2021, 11, 3–18. [Google Scholar] [CrossRef]
  18. Gislason, S.R.; Wolff-Boenisch, D.; Stefansson, A.; Oelkers, E.H.; Gunnlaugsson, E.; Sigurdardottir, H.; Sigfusson, B.; Broecker, W.S.; Matter, J.M.; Stute, M.; et al. Mineral sequestration of carbon dioxide in basalt: A preinjection overview of the CarbFix project. Int. J. Greenh. Gas Control 2010, 4, 537545. [Google Scholar] [CrossRef]
  19. Gislason, S.R.; Oelkers, E.H. Carbon storage in basalt. Science 2014, 344, 373374. [Google Scholar] [CrossRef]
  20. Gysi, A.P.; Stefánsson, A. CO2-water-basalt interaction. Numerical simulation of low temperature CO2 sequestration into basalts. Geochim. Cosmochim. Acta 2011, 75, 4728–4751. [Google Scholar] [CrossRef]
  21. Gysi, A.P.; Stefansson, A. Mineralogical aspects of CO2 sequestration during hydrothermal basalt alteration—An experimental study at 75 to 250 °C and elevated pCO2. Chem. Geol. 2012, 306, 146–159. [Google Scholar] [CrossRef]
  22. Gysi, A.P.; Stefansson, A. Experiments and geochemical modeling of CO2 sequestration during hydrothermal basalt alteration. Chem. Geol. 2012, 306–307, 10–28. [Google Scholar] [CrossRef]
  23. Matter, J.M.; Takahashi, T.; Goldberg, D. Experimental evaluation of in situ CO2 water rock reactions during CO2 injection in basaltic rocks: Implications for geological CO2 sequestration. Geochem. Geophys. Geosyst. 2007, 8, Q02001. [Google Scholar] [CrossRef]
  24. McGrail, B.P.; Schaef, H.T.; Spane, F.A.; Cliff, J.B.; Qafoku, O.; Horner, J.A.; Thompson, C.J.; Owen, A.T.; Sullivan, C.E. Field validation of supercritical CO2 reactivity with basalts. Environ. Sci. Technol. Lett. 2017, 4, 6–10. [Google Scholar] [CrossRef]
  25. Belshaw, G.E.; Steer, E.; Ji, Y.; Azis, H.; Sapiie, B.; Muljadi, B.; Vandeginste, V. Fluid-rock interaction experiments with andesite at 100 °C for potential carbon storage in geothermal reservoirs. Deep Undergr. Sci. Eng. 2024, 3, 369–382. [Google Scholar] [CrossRef]
  26. Takeya, M.; Matsui, R.; Kobayashi, Y. Evaluating the potential for CO2 mineralization in andesite: Experiments and geochemical modeling. In Proceedings of the 17th International Conference on Greenhouse Gas Control Technologies, Calgary, AB, Canada, 20–24 October 2024. [Google Scholar]
  27. Delerce, S.; Bénézeth, P.; Schott, J.; Oelkers, E.H. The dissolution rates of naturally altered basalts at pH 3 and 120 °C: Implications for the in-situ mineralization of CO2 injected into the subsurface. Chem. Geol. 2023, 621, 121353. [Google Scholar] [CrossRef]
  28. Sato, J.; Nakamura, T.; Sugawara, S.; Takahashi, H.; Sato, K. Elemental composition of the 1783 eruption products from Asama volcano. Volcanol. Soc. Jpn. 1989, 1, 19–39. [Google Scholar]
  29. Nomura, M.; Kakubuchi, S.; Iijima, S.; Kanazawa, Y. The volcanic rocks of 5 active volcanos in Gunma prefecture, Japan–Disciptions under the polarizing microscope and chemical composition. Bull. Gunma Mus. Nat. Hist. 2005, 9, 109–119. [Google Scholar]
  30. Kumagai, N.; Tanaka, T.; Kitao, K. Characterization of geothermal fluid flows at Sumikawa geothermal area, Japan, using two types of tracers and an improved multi-path model. Geothermics 2004, 33, 257–275. [Google Scholar] [CrossRef]
  31. Hossain, S.; Hosono, T.; Yang, H.; Shimada, J. Geochemical processes controlling fluoride enrichment in groundwater at the western part of Kumamoto area, Japan. Water Air Soil Pollut. 2016, 227, 385. [Google Scholar] [CrossRef]
  32. Morita, M.; Yamaguchi, A.; Koyama, S.; Motoda, S. Method for imitating magnesium silicate scale formed at the geothermal power plant in Obama Hot Spring, Japan. Geothermics 2021, 9, 102203. [Google Scholar] [CrossRef]
  33. Parkhurst, D.L.; Appelo, C.A.J. Description of input and examples for PHREEQC version 3-A computer program for speciation, batch-reaction, one-dimensional transport, and inverse geochemical calculations. In US Geological Survey Techniques and Methods; Chapter A43; U.S. Geological Survey: Drive Reston, VA, USA, 2013; Volume 6, p. 497. [Google Scholar]
  34. Lu, P.; Zhang, G.; Apps, J.; Zhu, C. Comparison of thermodynamic data files for PHREEQC. Earth-Sci. Rev. 2022, 225, 103888. [Google Scholar] [CrossRef]
  35. Voigt, M.; Marieni, C.; Clark, D.E.; Gíslason, S.R.; Oelkers, E.H. Evaluation and refinement of thermodynamic databases for mineral carbonation. Energy Procedia 2018, 146, 81–91. [Google Scholar] [CrossRef]
  36. Suto, Y.; Liu, L.; Yamasaki, N.; Hashida, T. Initial behavior of granite in response to injection of CO2-saturated fluid. Appl. Geochem. 2007, 22, 202–218. [Google Scholar] [CrossRef]
  37. Hangx, S.J.T.; Spiers, C.J. Reaction of plagioclase feldspars with CO2 under hydrothermal conditions. Chem. Geol. 2009, 265, 88–98. [Google Scholar] [CrossRef]
  38. Browne, P.R.L. Hydrothermal alteration in active geothermal fields. Annu. Rev. Earth Planet. Sci. 1978, 6, 229–250. [Google Scholar] [CrossRef]
  39. Stefánsson, A.; Gíslason, S.R. Chemical weathering of basalts. SW Iceland. Effect of rock crystallinity and secondary minerals on chemical fluxes to the ocean. Am. J. Sci. 2001, 301, 513–556. [Google Scholar] [CrossRef]
  40. Schiffman, P.; Fridleifsson, G.O. The smectite–chlorite transition in drillhole NJ-15, Nesjavellir geothermal field, Iceland: XRD, BSE and electron microprobe investigations. J. Metamorph. Geol. 1991, 9, 679–696. [Google Scholar] [CrossRef]
  41. Barnhisel, R.I.; Rich, C.I. Gibbsite, bayerite, and nordstrandite formation as affected by anions, pH, and mineral surfaces. Soil Sci. Soc. Am. J. 1965, 29, 531–534. [Google Scholar] [CrossRef]
  42. Lasaga, A.C. Kinetic Theory in the Earth Science; Princeton University Press: Princeton, NJ, USA, 1998; pp. 220–307. [Google Scholar]
  43. Nakata, E.; Watanabe, M. Dissolution and precipitation between pH 3.8, CO2 dissolved-solution and anorthite rich tuffaceous sandstone by using high temperature flow-through reactor. Jpn. Assoc. Mineral. Sci. 2009, 38, 161–174. (In Japanese) [Google Scholar]
  44. Carroll, S.A.; Knauss, K.G. Dependence of labradorite dissolution kinetics on CO2(aq), Al(aq), and temperature. Chem. Geol. 2005, 217, 213–225. [Google Scholar] [CrossRef]
  45. Gislason, S.R.; Oelkers, E.H. Mechanism, rates, and consequences of basaltic glass dissolution: II. An experimental study of the dissolution rates of basaltic glass as a function of pH and temperature. Geochim. Cosmochim. Acta 2003, 67, 3817–3832. [Google Scholar] [CrossRef]
  46. Luhmann, A.J.; Tutolo, B.M.; Bagley, B.C.; Mildner, D.F.R.; Seyfried, W.E., Jr.; Saar, M.O. Permeability, porosity, and mineral surface area changes in basalt cores induced by reactive transport of CO2-rich brine. Water Resour. Res. 2017, 53, 1908–1927. [Google Scholar] [CrossRef]
Figure 1. Flow-through reactor for rock–CO2–water interactions at high temperature and pressure.
Geosciences 15 00351 g001
Figure 3. Photographs of rock grains retrieved from the core after the flow-through experiments. The natural color of unreacted andesite was the same as that observed in Fa1 and Fa4.
Geosciences 15 00351 g003
Figure 4. XRD results of rock samples in the following order: unreacted andesite, Fa1, Fa2, Fa3, Fa4, Fa5, and Fa6. The black lines in the figure represent the diffraction patterns of the samples. Mineral phases were identified using the PDF-2 2023 powder diffraction database.
Geosciences 15 00351 g004
Figure 5. SEM-EDS results: (a1a3) unreacted andesite, (b1b3) Fa1 (150 °C and 0.3 mL/min), (c1c3) Fa2 (200 °C and 0.3 mL/min), (d1d3) Fa3 (250 °C and 0.3 mL/min), (e1e3) Fa4 (150 °C and 1.0 mL/min), (f1f3) Fa5 (200 °C and 1.0 mL/min), and (g1g3) Fa6 (250 °C and 1.0 mL/min). Rock samples were taken from the discolored mineral surfaces at the inlet sections of Fa2, Fa3, Fa5, and Fa6 and the minerals at the inlet sections of Fa1 and Fa4. Percentage bar chart of elements for (a4) unreacted andesite; (b4) Fa1, (c4) Fa2, (d4) Fa3, (e4) Fa4, (f4) Fa5, and (g4) Fa6.
Geosciences 15 00351 g005
Figure 6. EDS results for rock samples plotted with end members of (a) Si + Al—K + Na + Ca—Mg + Fe, (b) Si—Al—Mg + Fe, and (c) Ca—Mg—Fe. Circles and triangles represent flow rates of 0.3 and 1.0 mL/min, respectively; colors correspond to temperature conditions: blue for 150 °C, yellow for 200 °C, and red for 250 °C. The gray areas indicate the compositional range of the unreacted andesite, delineated by connecting the data points of the unreacted andesite (indicated by “□” symbols).
Geosciences 15 00351 g006
Figure 7. Binary diagrams of each element plotted against Si. Molar ratios (black line) were calculated based on the averaged major oxide data for the andesite (Table 1).
Geosciences 15 00351 g007
Figure 8. Saturation index (SI) of secondary minerals of interest: (a) Fa1 (150 °C and 0.3 mL/min), (b) Fa2 (200 °C and 0.3 mL/min), (c) Fa3 (250 °C and 0.3 mL/min), (d) Fa4 (150 °C and 1.0 mL/min), (e) Fa5 (200 °C and 1.0 mL/min), and (f) Fa6 (250 °C and 1.0 mL/min).
Geosciences 15 00351 g008
Figure 9. Calculated Si dissolution rates (×10−13 mol/cm2s) for each test. Because the rates were calculated using rock grains with diameters of 0.14 and 0.1 mm, the results are presented as logarithmic averages with standard deviations. The error bars also include analytical standard deviations of the Si concentrations measured at 4 h for each test.
Geosciences 15 00351 g009
Table 1. Chemical components of andesite (Onioshidashi lava); adapted from Sato et al. [28] and Nomura et al. [29].
ComponentSato et al. [28] (wt.%)Nomura et al. [29] (wt.%)
SiO261.6462.79
Al2O316.0015.74
Total iron as Fe2O36.576.52
CaO6.606.35
K2O1.371.38
Na2O2.913.16
P2O30.180.12
MgO3.983.67
TiO20.610.68
Total99.86100.41
Table 2. Experimental conditions of flow-through tests (core cross-sectional area was 1.77 × 10⁻⁴ m2) and surface areas calculated by particle size.
CO2
Pressure
TemperatureBack PressureFlow RateRunning TimeTotal DischargeDarcy VelocityParticle SizeSurface Area
MPa°CMPamL/minhourmLm/smmcm2
Fa12150100.322836402.8 × 10−50.14
1.0
5565
770
Fa22200100.322837202.8 × 10−50.14
1.0
5565
770
Fa32250100.322840402.8 × 10−50.14
1.0
5565
770
Fa4215010112069209.4 × 10−50.14
1.0
5565
770
Fa5220010114482309.4 × 10−50.14
1.0
5565
770
Fa6225010114482309.4 × 10−50.14
1.0
5565
770
Disclaimer/Publisher’s Note: The statements, opinions and data contained in all publications are solely those of the individual author(s) and contributor(s) and not of MDPI and/or the editor(s). MDPI and/or the editor(s) disclaim responsibility for any injury to people or property resulting from any ideas, methods, instructions or products referred to in the content.