Article

Least Squares Collocation for Estimating Terrestrial Water Storage Variations from GNSS Vertical Displacement on the Island of Haiti

1
Research Unit in Geosciences (URGeo), Faculty of Science, State University of Haiti, Port-au-Prince HT 6110, Haiti
2
Faculty of Science, Technology and Medicine, Belval Campus, University of Luxembourg, 4365 Luxembourg, Luxembourg
*
Author to whom correspondence should be addressed.
Geosciences 2025, 15(8), 322; https://doi.org/10.3390/geosciences15080322
Submission received: 30 June 2025 / Revised: 5 August 2025 / Accepted: 14 August 2025 / Published: 19 August 2025
(This article belongs to the Special Issue Geophysical Inversion)

Abstract

Water masses are continuously redistributing across the Earth, so accurately estimating their availability is essential. Global Navigation Satellite Systems (GNSSs) have demonstrated potential for observing vertical deformations, which is partly driven by terrestrial water storage (TWS) variations. This capability has been used in hydrogeodesy to estimate TWS variations. However, GNSS data inversions are often ill-posed, requiring regularization for stable solutions. This study considers the Least Squares Collocation (LSC) statistical method as an alternative. LSC uses covariance functions to characterize observations, parameters, and their interdependence. By incorporating additional physical information into inverse models, LSC allows ill-posed problems stabilization. To assess LSC effectiveness, we apply it to observed and simulated GNSS vertical displacement on Haiti island. Hydrological signals are modeled using Global Land Data Assimilation (GLDAS) data. In sparse GNSS data regions, findings indicate poor agreement between TWS and hydrological input, with a Root-Mean-Square-Error (RMSE) of 115 kg/m2, a correlation of 0.3, and a reduction of 73%. However, in dense simulated GNSS areas, TWS and hydrological input show strong agreement, with an RMSE of 41 kg/m2, a correlation of 0.83, and a reduction of 92%. The results confirm LSC potentiality for assessing TWS changes and improving water quantification in dense GNSS station region.

1. Introduction

Water is essential for sustaining life, society, and ecosystems. However, this vital resource is under increasing pressure due to rising demand and environmental changes. Monitoring its availability on or near the Earth’s surface is therefore of paramount importance. Terrestrial water storage (TWS), which includes water stored in lakes, rivers, soil moisture, groundwater, snow and ice, and vegetation canopy is a key indicator for assessing water availability. Direct measurement methods, such as piezometers for groundwater or soil moisture sensors, provide valuable insights but are often limited in spatial coverage and are labor-intensive. Hydrological models, which integrate ground-based and satellite observations, offer a broader understanding of TWS’s spatial and temporal patterns. However, these models often involve uncertainties due to incomplete observational data or model limitations. The Gravity Recovery and Climate Experiment (GRACE) satellite mission has successfully estimated TWS variations at regional to global scales using spatial gravity measurements, with a temporal resolution of one month. However, GRACE’s spatial resolution (~350 km) is insufficient for small island nations such as Haiti [1,2]. In 2001, ref. [3] demonstrated the potential of the Global Navigation Satellite System (GNSS) for geophysical analysis. Subsequent studies have revealed a clear correlation between GNSS-derived seasonal vertical displacements and GRACE-detected hydrological loading signals [4,5,6,7,8]. Ref. [9] further demonstrated a strong agreement between GNSSs and the Water Global Assessment and Prognosis (WaterGAP) model [10] on a global scale. Similarly, ref. [11] found a good correlation between GNSSs and the Global Land Data Assimilation System (GLDAS) over the island of Haiti, reinforcing the feasibility of using GNSS data for TWS retrieval. Efforts to retrieve hydrological signals from direct GNSS data inversion have been conducted at global [12], continental [13], and regional scales [14]. These studies have primarily focused on areas with significant hydrological mass variations across different temporal scales, including sub-seasonal, seasonal, inter-annual [15], and even daily variations [16]. A key characteristic of these studies is their reliance on regions with substantial hydrological signal coverage in both spatial and temporal dimensions. However, GNSS-based TWS estimation faces challenges due to the ill-posed nature of the inverse problems, which are often underdetermined and numerically unstable, particularly in areas with sparse GNSS station coverage. To address this, regularization techniques are commonly employed [17,18,19,20]. The Tikhonov regularization method has been widely applied in TWS inversion [14,21,22,23,24,25,26,27], where a regularization parameter is introduced to stabilize the solution. Typically, the L-Curve method is used to optimize this parameter. Recently, ref. [28] applied the Truncated Singular Value Decomposition (TSVD) method to estimate TWS variations in Taiwan. TSVD stabilizes inversion by truncating the ill-conditioned design matrix, discarding its smallest singular values. The truncation parameter is selected using the General Cross Validation method. In 2023, ref. [29] proposed a combined approach, referred to as the TSVD–Tikhonov regularization method, that combines both TSVD and Tikhonov techniques to further stabilize the GNSS-based inversion. Tikhonov, TSVD, and their combined form aim to balance solution accuracy and stability but rely on mathematical optimization rather than physical priors.
In this study, we propose an alternative approach, similar to [30], which uses an a priori constraint method that avoids using explicit regularization parameters by leveraging the intrinsic physical characteristics of the data for stabilization. Specifically, we adopt the Least Squares Collocation (LSC) method, a statistical approach based on the covariance function. LSC has been applied successfully in geoid determination [31], interpolation of ground-based data [32], geoid modeling [33], photogrammetry [34], and geodetic transformation [35]. LSC assumes that the spatial variability of the observed field (hydrological or GNSS) can be described by a covariance function, implying that observations at one location provide information about neighboring locations. This spatial dependence diminishes with increasing distance.
This paper assesses the capability of LSC to retrieve TWS variations from GNSS-derived vertical displacements. Firstly, we validate our approach using a synthetic GNSS dataset for Haiti and we then analyze real GNSS time series from operational stations on the island. The article is organized as follows: Section 2 details method and data, Section 3 presents results and discussion, and finally, Section 4 addresses the conclusion.

2. Materials and Methods

This section introduces the basics of the Least Squares Collocation (LSC) method and the GNSS network of the island of Haiti used in this study.

2.1. Least Squares Collocation: Basic Formulation

LSC is a statistical estimation technique used to determine the values of a stochastic process and their associated uncertainties. It is a flexible method allowing direct signal predictions at any location within the study domain by integrating the statistical properties of the observed field, represented by a covariance function. The basic equation for LSC, as described by [36], can be written as follows:
d = A X + n
where d is the measurement vector, A is the coefficient matrix of the forward model, X is the vector of unknown parameters, and n represents the measurement error. The covariance matrices C∈∈ and Cdd characterize the statistical behavior of the noise n and signal d, respectively. The signal at any location P ^ , is estimated as follows:
  P ^ =   C p d C   +   C d d 1 d
where C p d represents the cross-covariance matrix of the signal and parameters, derived from analytical covariance models. The diagonal elements of C represent the variances of GNSS data uncertainties, while off-diagonal elements are assumed to be zero due to the uncorrelated nature of GNSS errors. The sum C + C d d known as the total covariance of observations is the sum of the GNSS noise covariance matrix and the signal covariance matrix, which is generated from the simulated vertical displacement covariance function. This matrix is symmetric, positive-definite, and thus invertible.
To estimate the parameters, the process starts by calculating the mean values of the data, which are then used to calculate the mean values of the parameters using the forward model. This provides an a priori solution, which is subtracted from the data to yield residuals. These residuals are then inverted, and the a priori solution is subsequently added back to the inverted residuals. Given that the a priori value of the parameters P 0 and data d 0 are known, Equation (2) can be rewritten as follows:
P ^ = P 0 + C pd C + C dd 1 d d 0
For GLDAS/NOAH data, the a priori solution corresponds to the monthly mean soil water content over Haiti, averaging 527   k g / m 2 from 2010 to 2019. The a priori values for the data are determined as follows:
G m 0 = d 0
where G represents the Green’s function, and m 0 is the a priori solution.
Beyond estimating P ^ , the uncertainty of the estimated parameters Cpp is also determined as follows:
C p p = C p o p     C p d C   +   C d d 1 C d p
where C p o p represents the covariance matrix of the estimated signal P ^ .

2.2. Problem Characterization

To evaluate the degree of ill-posedness in our problem, we analyze the rate of decay in the singular value spectrum of the design matrix A (Equation (1)). Singular value decomposition is a commonly used technique for assessing the stability of such problems. Figure 1 (left panel) shows the singular values of the design matrix for the forward problem [11], sorted in descending order, and Figure 1 (right panel) presents the histogram of fitting residuals. The classification of ill-posed problems is based on the decay behavior of singular values as a function of rank K. A problem is considered mildly ill-posed if the decay of the singular values follows a power-law decay of the form K α with α ≤ 1, moderately ill-posed if α > 1, and severely ill-posed if the decay follows an exponential form such as exp ( α K ) [18]. For the inversion problem over the island of Haiti, the singular value exhibits an exponential decay described by σ k = 8.42 × 10 12 × exp ( 0.52 k ) . This exponential decay confirms that the problem is severely ill-posed, necessitating the use of regularization techniques to obtain a stable solution.

2.3. Analytical Covariance Function Determination

Determining an empirical covariance function is inherently challenging, as it requires a complete understanding of the underlying physical processes within the study area. Additionally, a dense distribution of data points is necessary for accurately estimating the empirical covariance function. According to [37], empirical covariance functions were computed, and an analytical covariance function was fitted to construct the covariance matrix, allowing the estimation of unknown values at locations without measurement.
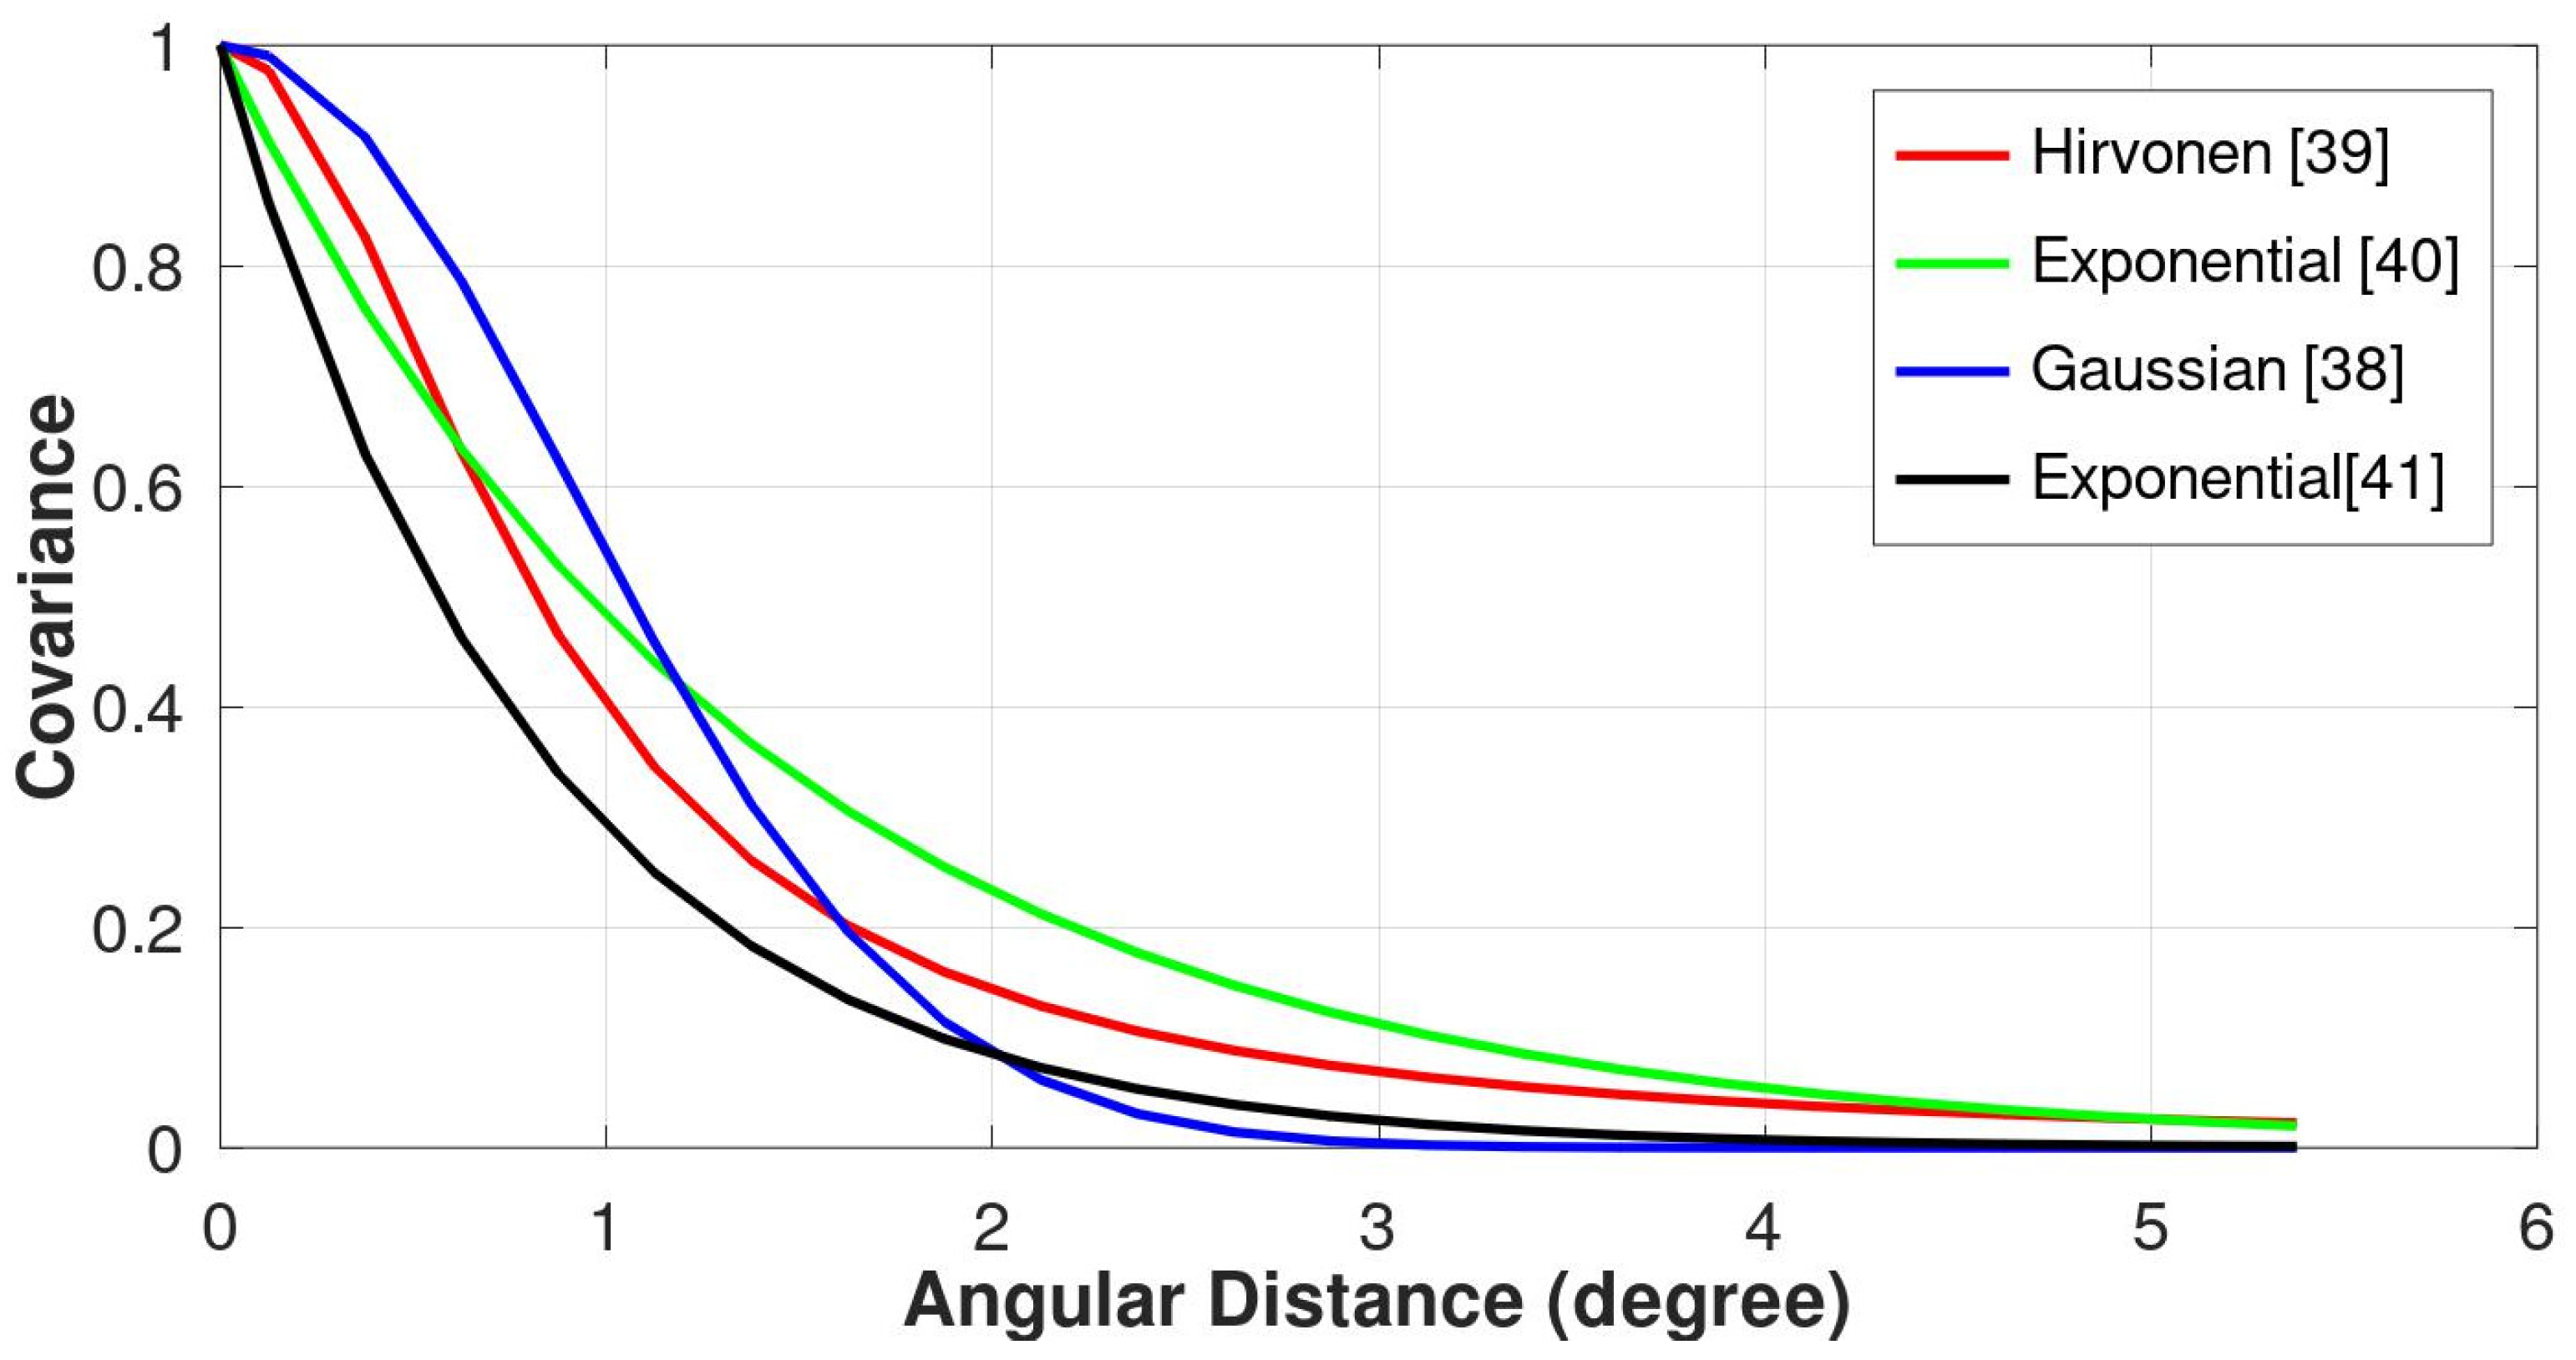
To select the appropriate analytical covariance function, we have tested different functions presented in Table 1 and plotted in Figure 2.
We tested these 4 functions for each month of the year 2019 with real GNSS data. Table 2 below showed the annual mean results for RMSE, reduction, and correlation. We observed a slightly similar result for Exponential and Gaussian functions, but both outclass Hirvonen function.
To simplify the analysis, we adopted a Gaussian covariance function with a uniform correlation length for both covariance and cross-covariance functions. The Gaussian function, one of the most widely used covariance functions, is expressed as follows:
f ( r ) = a e k 2 r 2
where the correlation length represents the distance at which the variance C 0 decreases to half its value C 0 2 at zero distance [39].
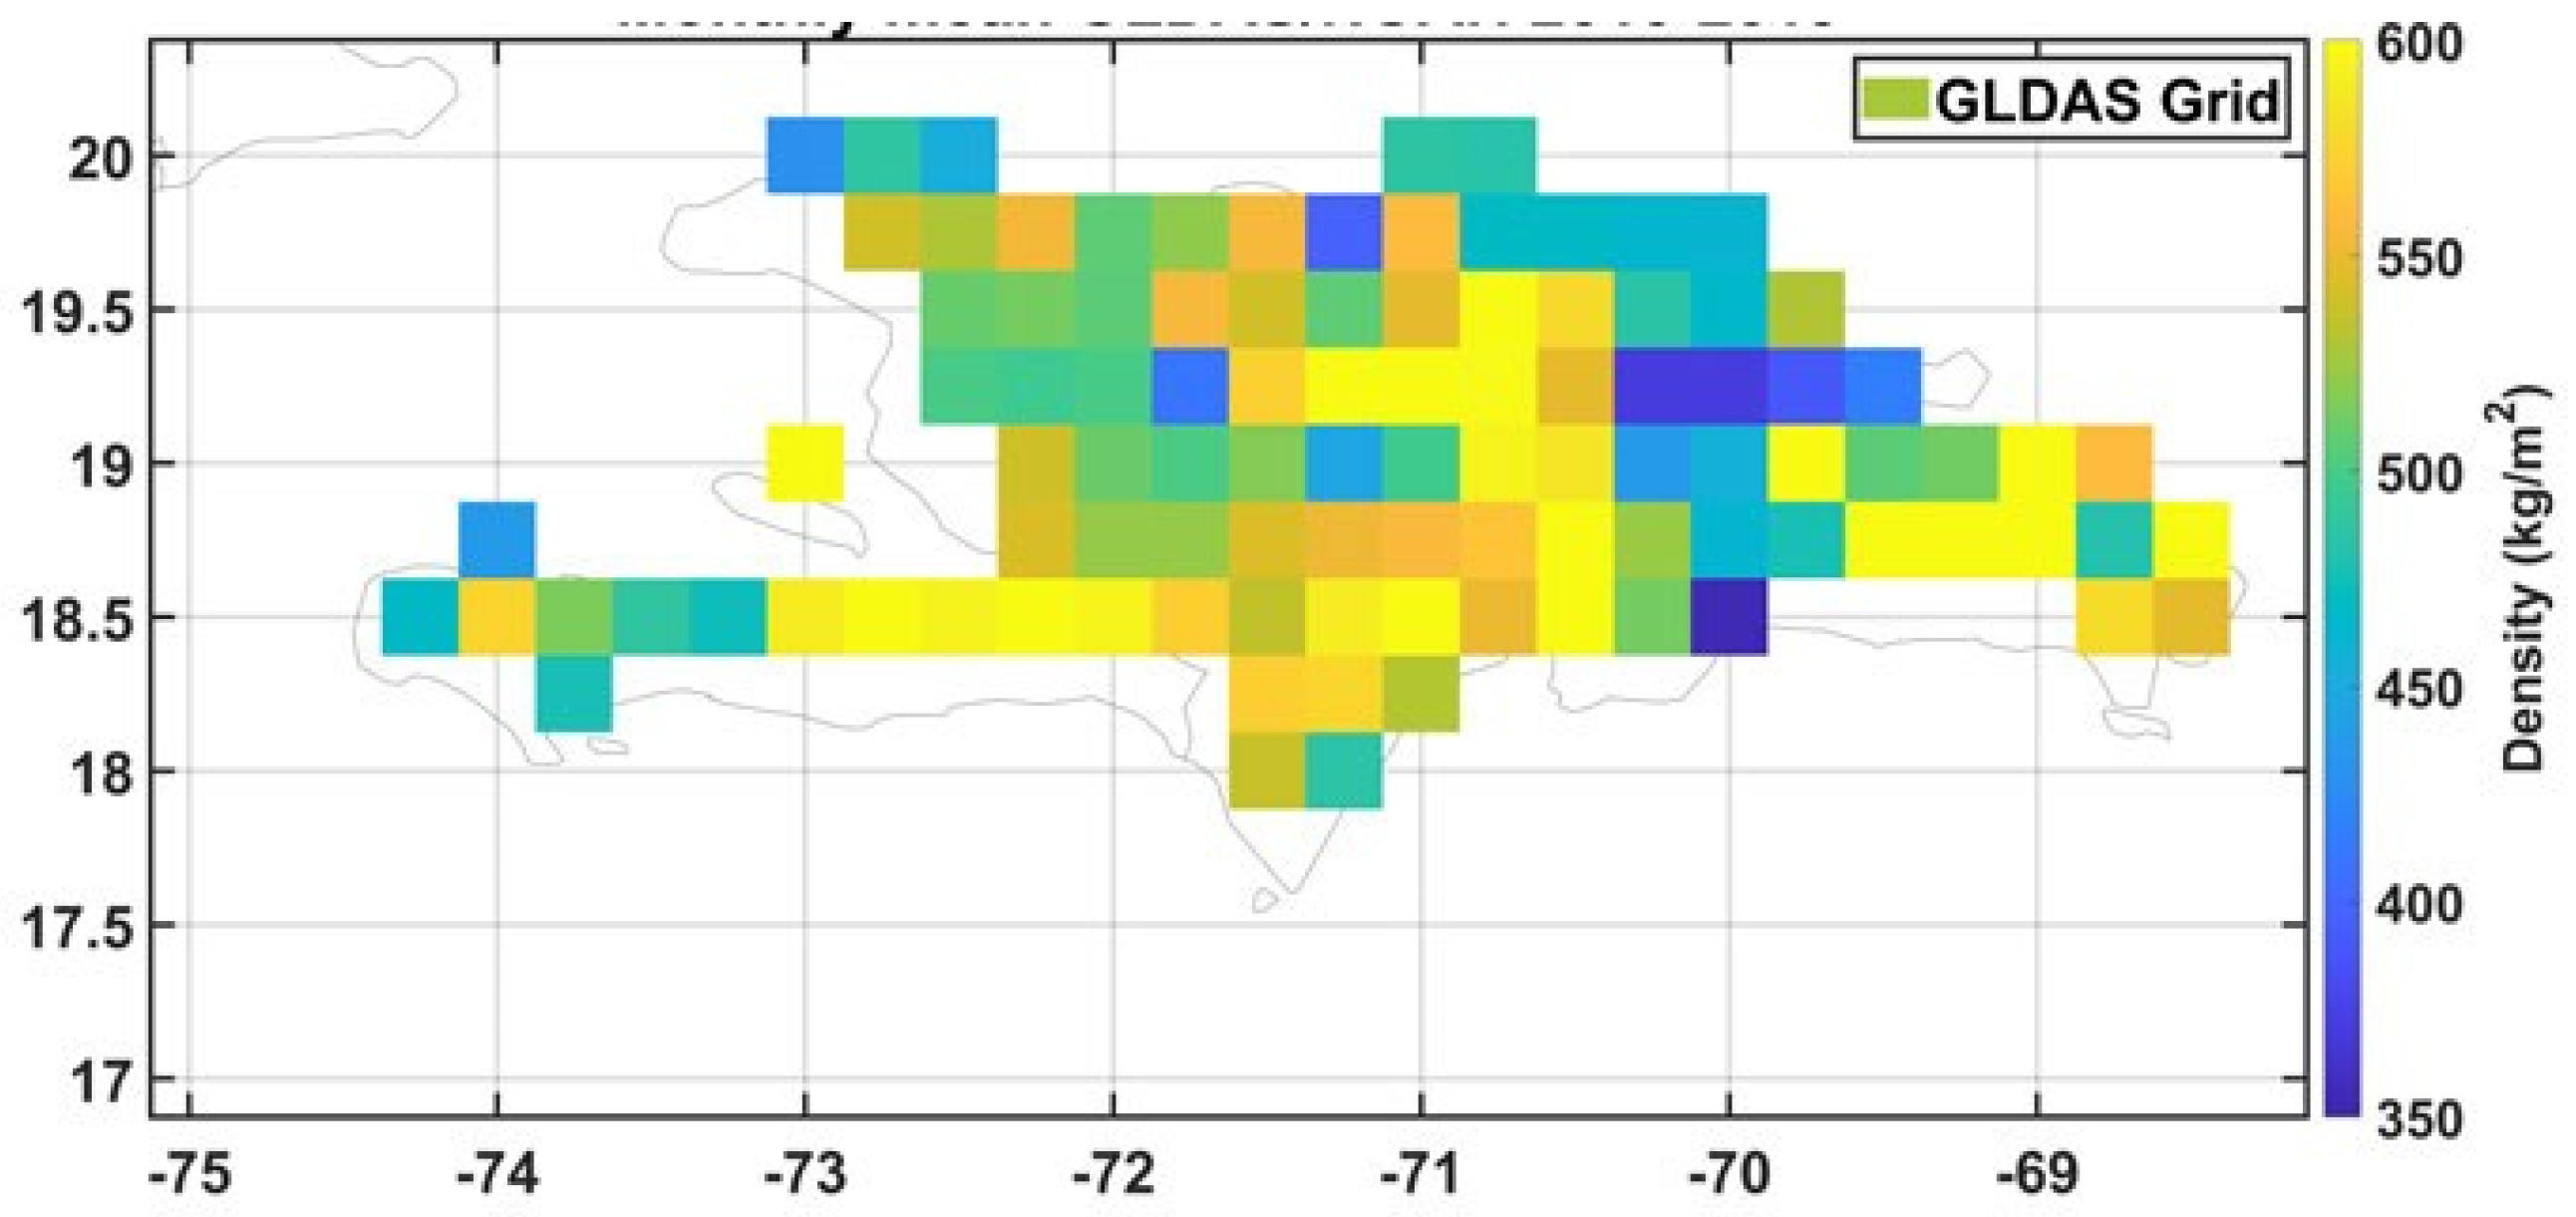
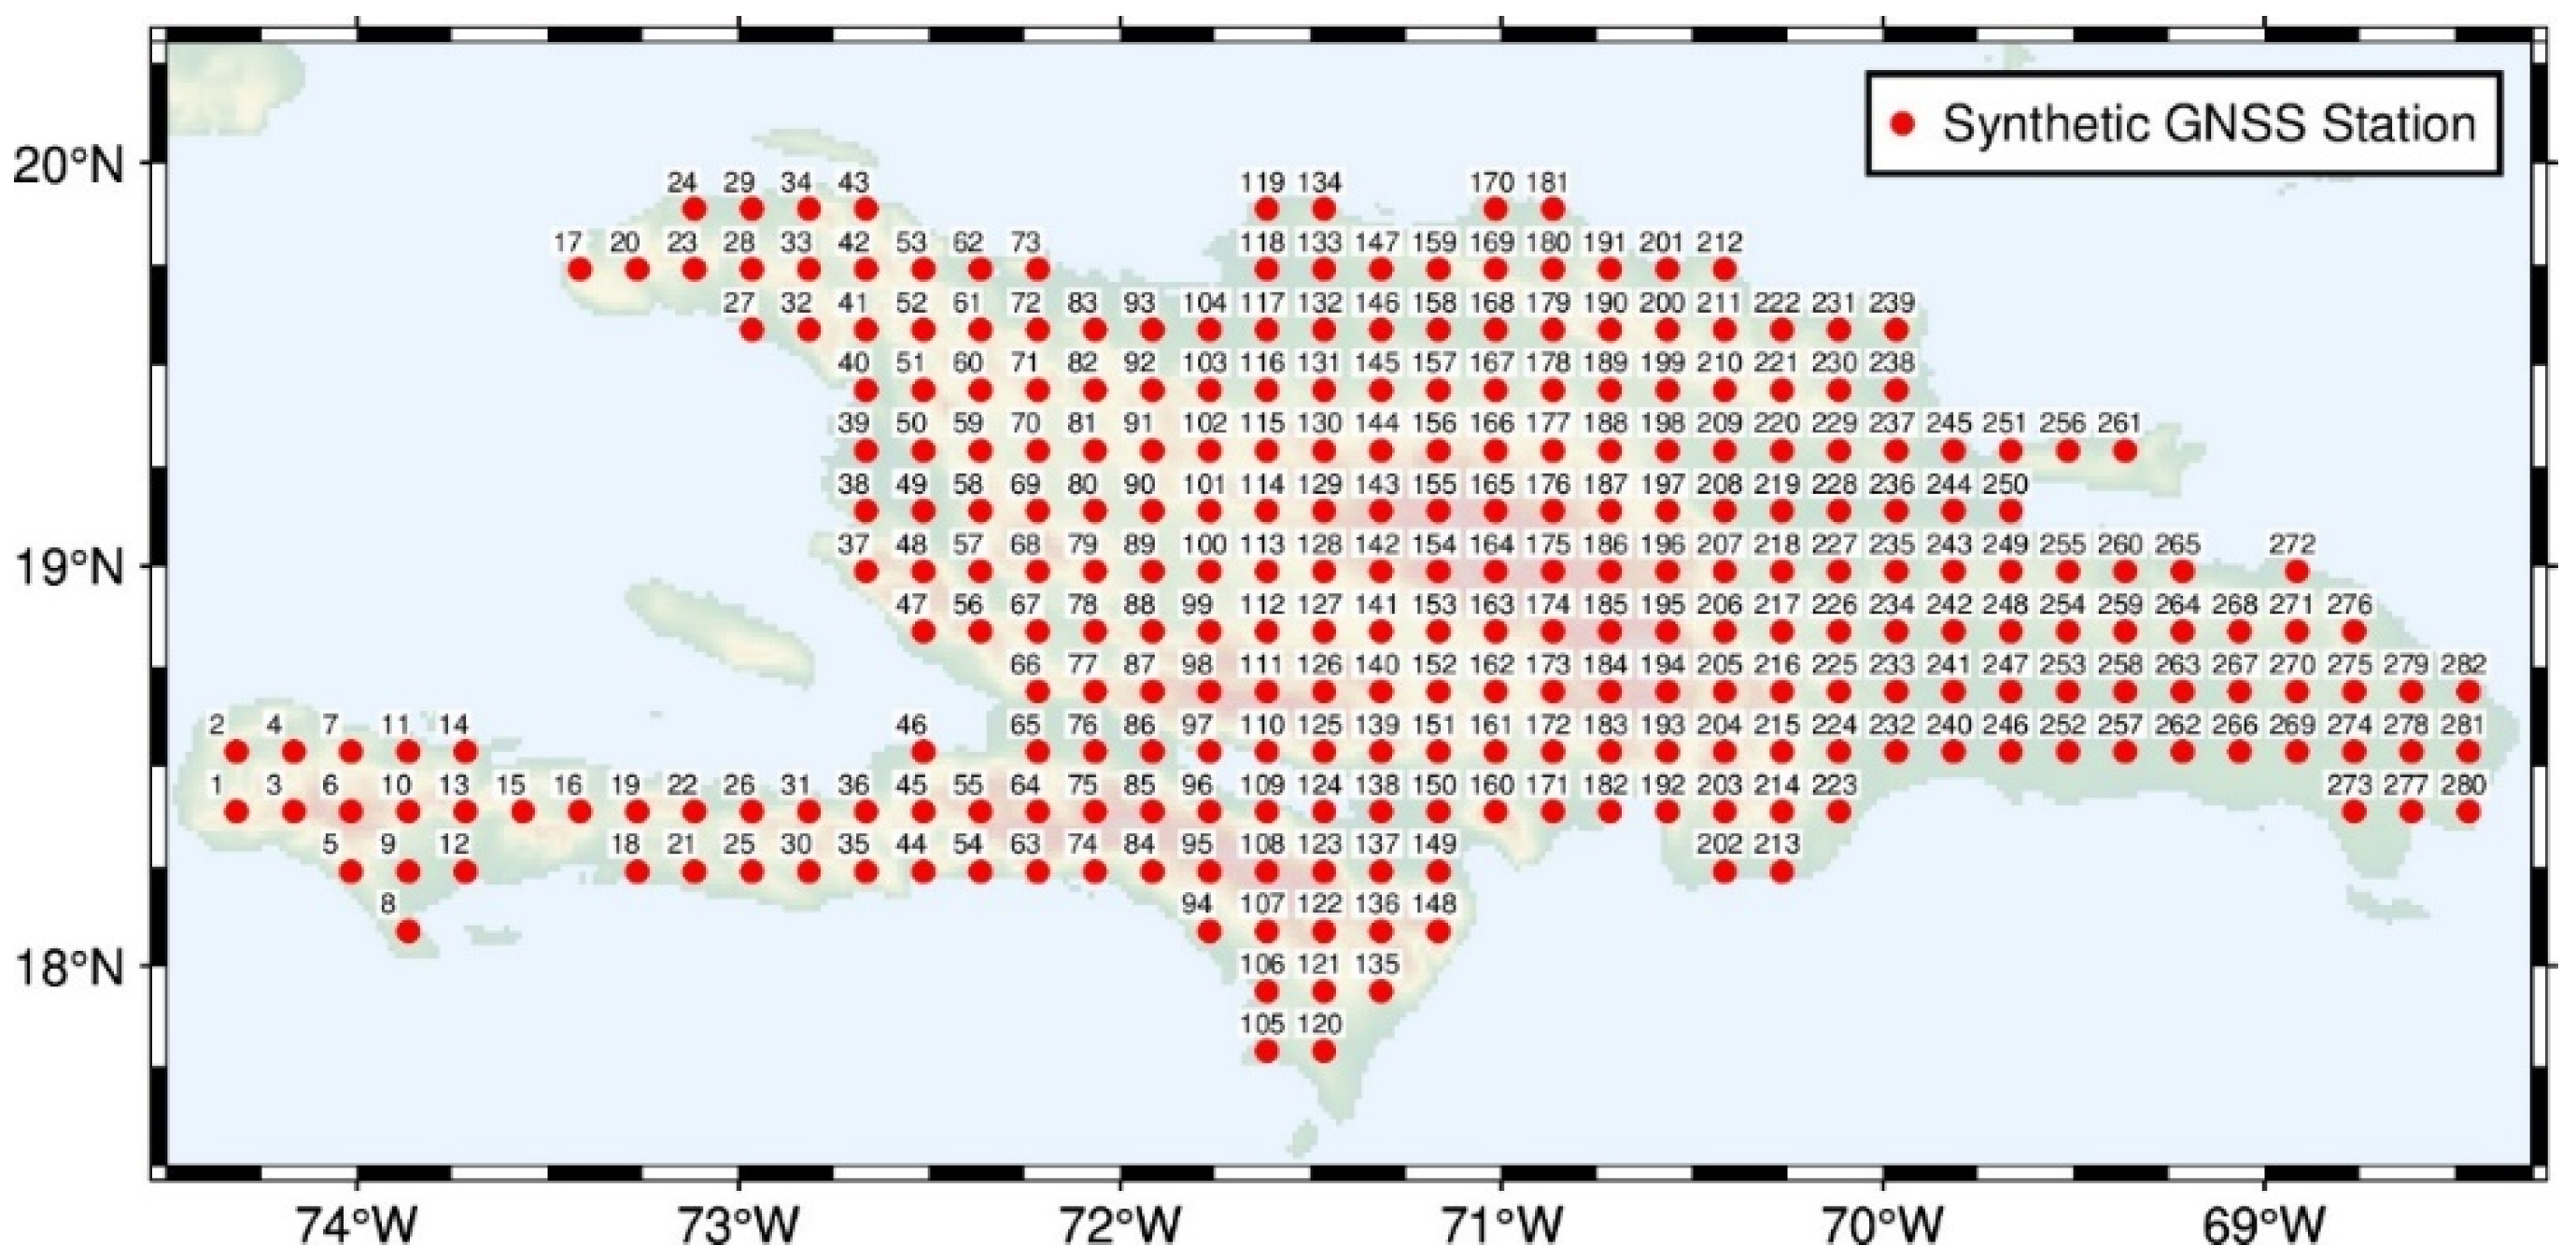
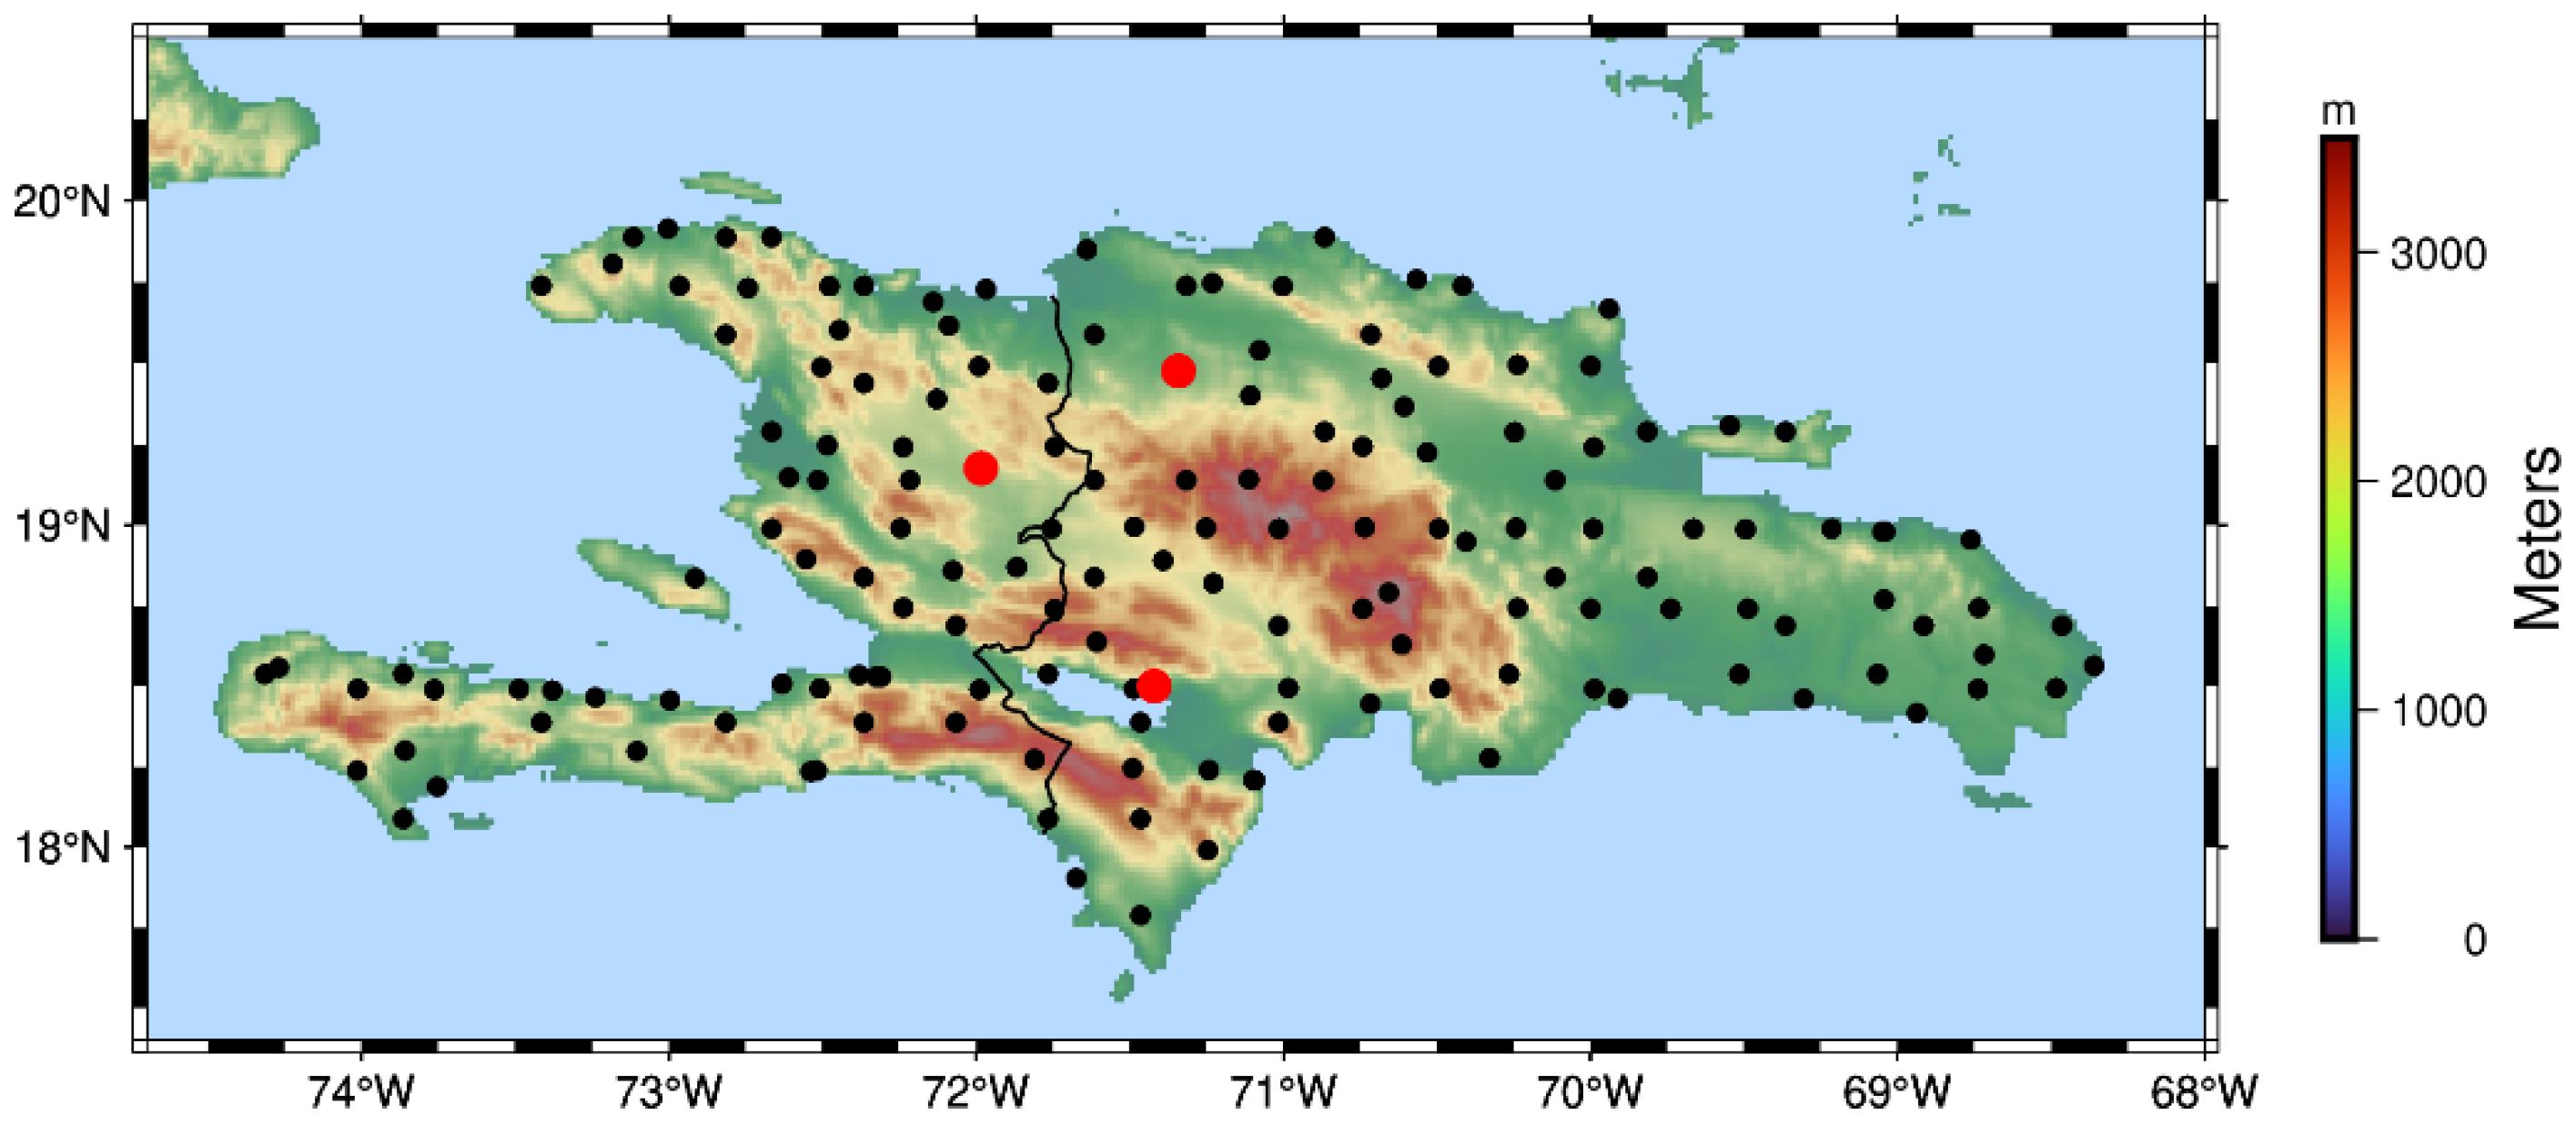
To determine the empirical hydrological covariance function, we used the GLDAS dataset (Figure 3), representing the monthly mean GLDAS/NOAH data from 2010 to 2019 at a spatial resolution of 0.25° × 0.25°. To determine the simulated GNSS vertical displacement covariance function, we generated data for 282 synthetic GNSS stations, evenly distributed across the island (Figure 4). This dense station network ensures good spatial coverage of the island and sufficient information to characterize the covariance function.
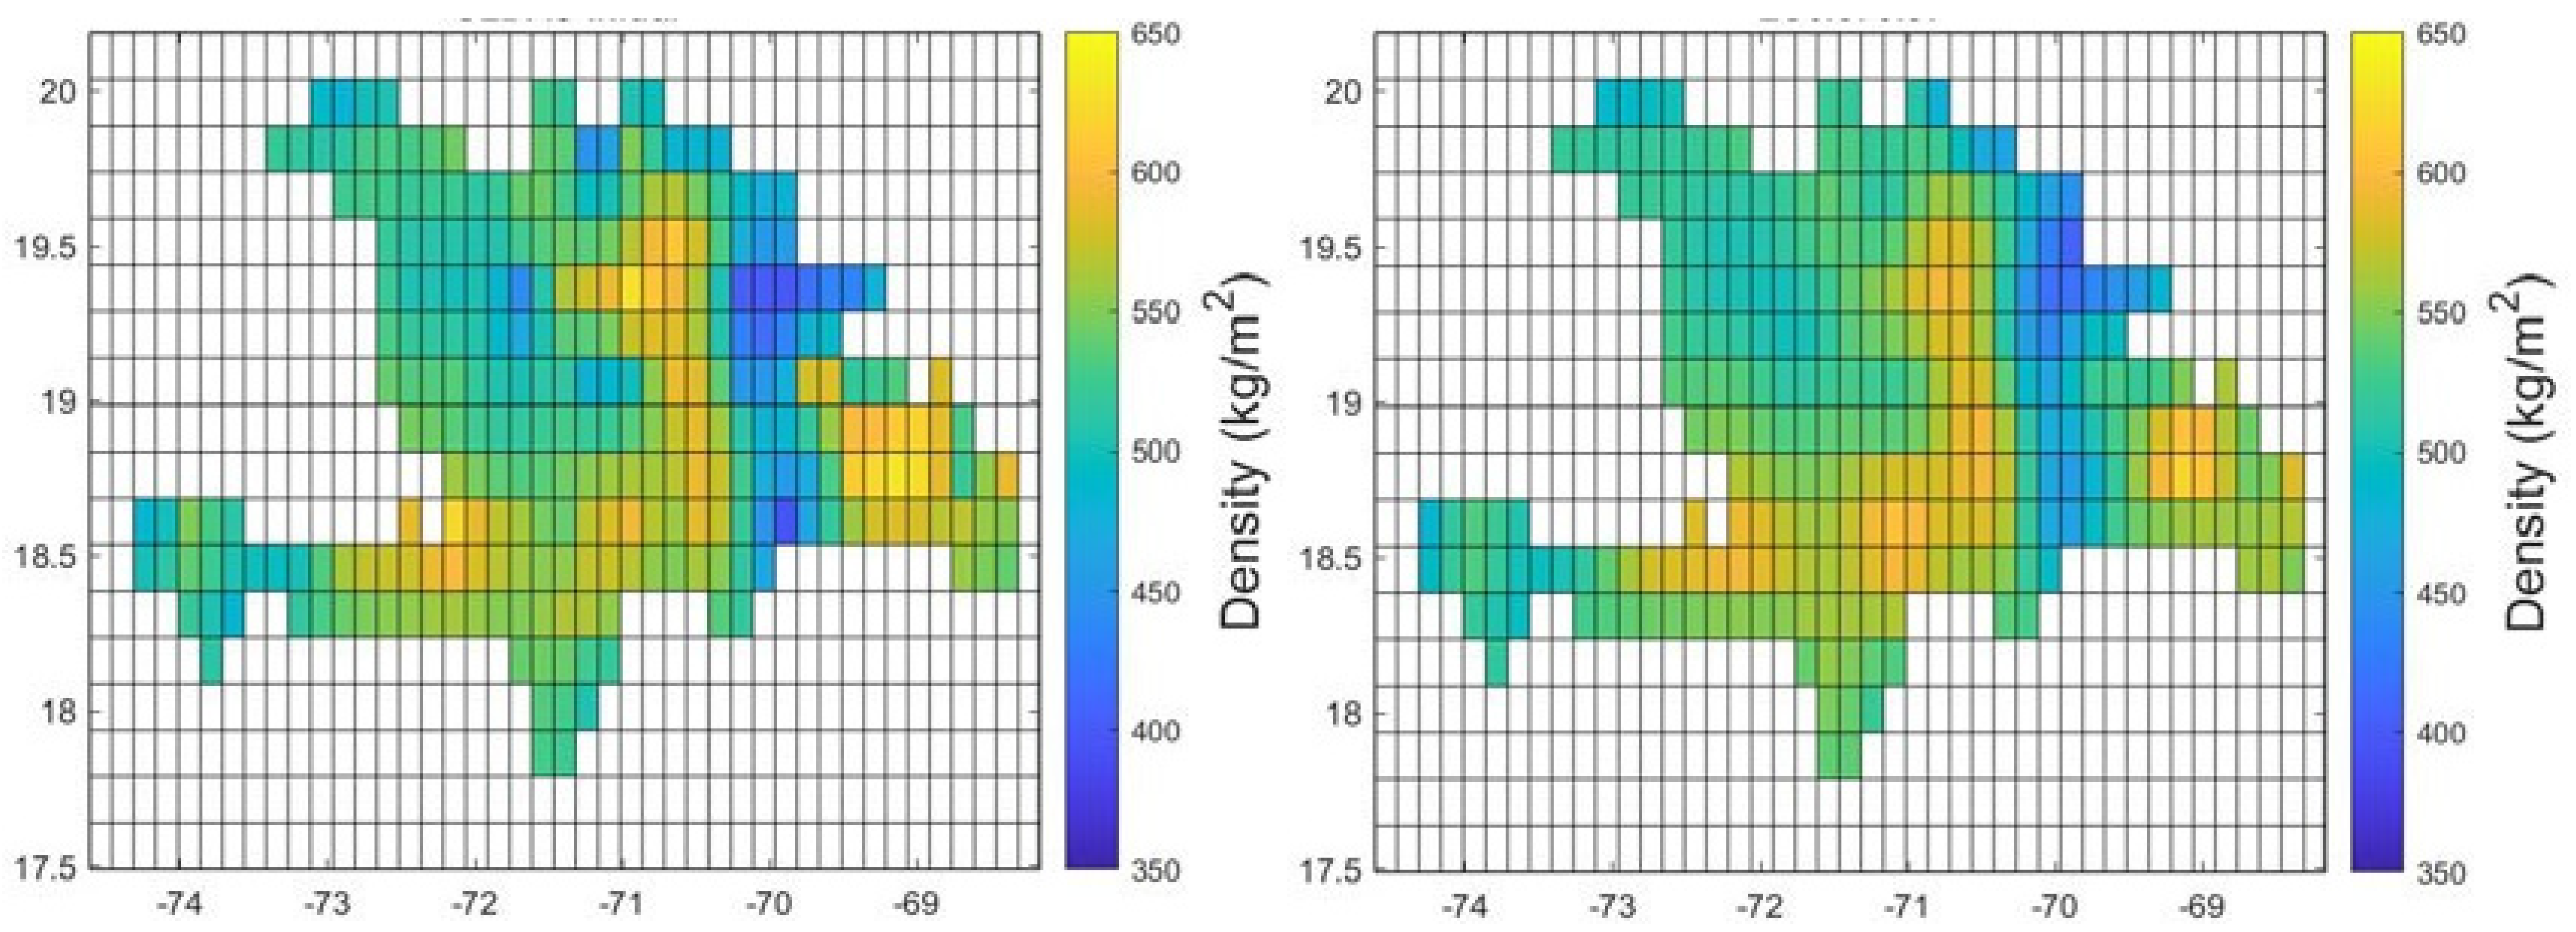
Using the constructed GLDAS covariance function (Equation (7a)) and the GLDAS monthly mean data (Figure 3), we interpolated the GLDAS data at the synthetic GNSS station locations (Figure 4), resulting in a denser hydrological dataset (Figure 5, left panel). This dataset was used to calculate the simulated loading at these stations using the Green’s function approach [42]. The empirical covariance function for the vertical displacement of the Earth’s surface was then derived from the simulated loadings.
Figure 5 (right panel) above displays the inversion results using the cross-covariance function (Equation (7c)). A good agreement between the input data and the inverted solution validates the covariance function’s appropriateness. The observed differences include a maximum of 66 kg/m2, a minimum of −86 kg/m2, a correlation of 0.83, a reduction of 92%, and an RMSE of 41 kg/m2 for a signal with a mean amplitude of 536.3 kg/m2.
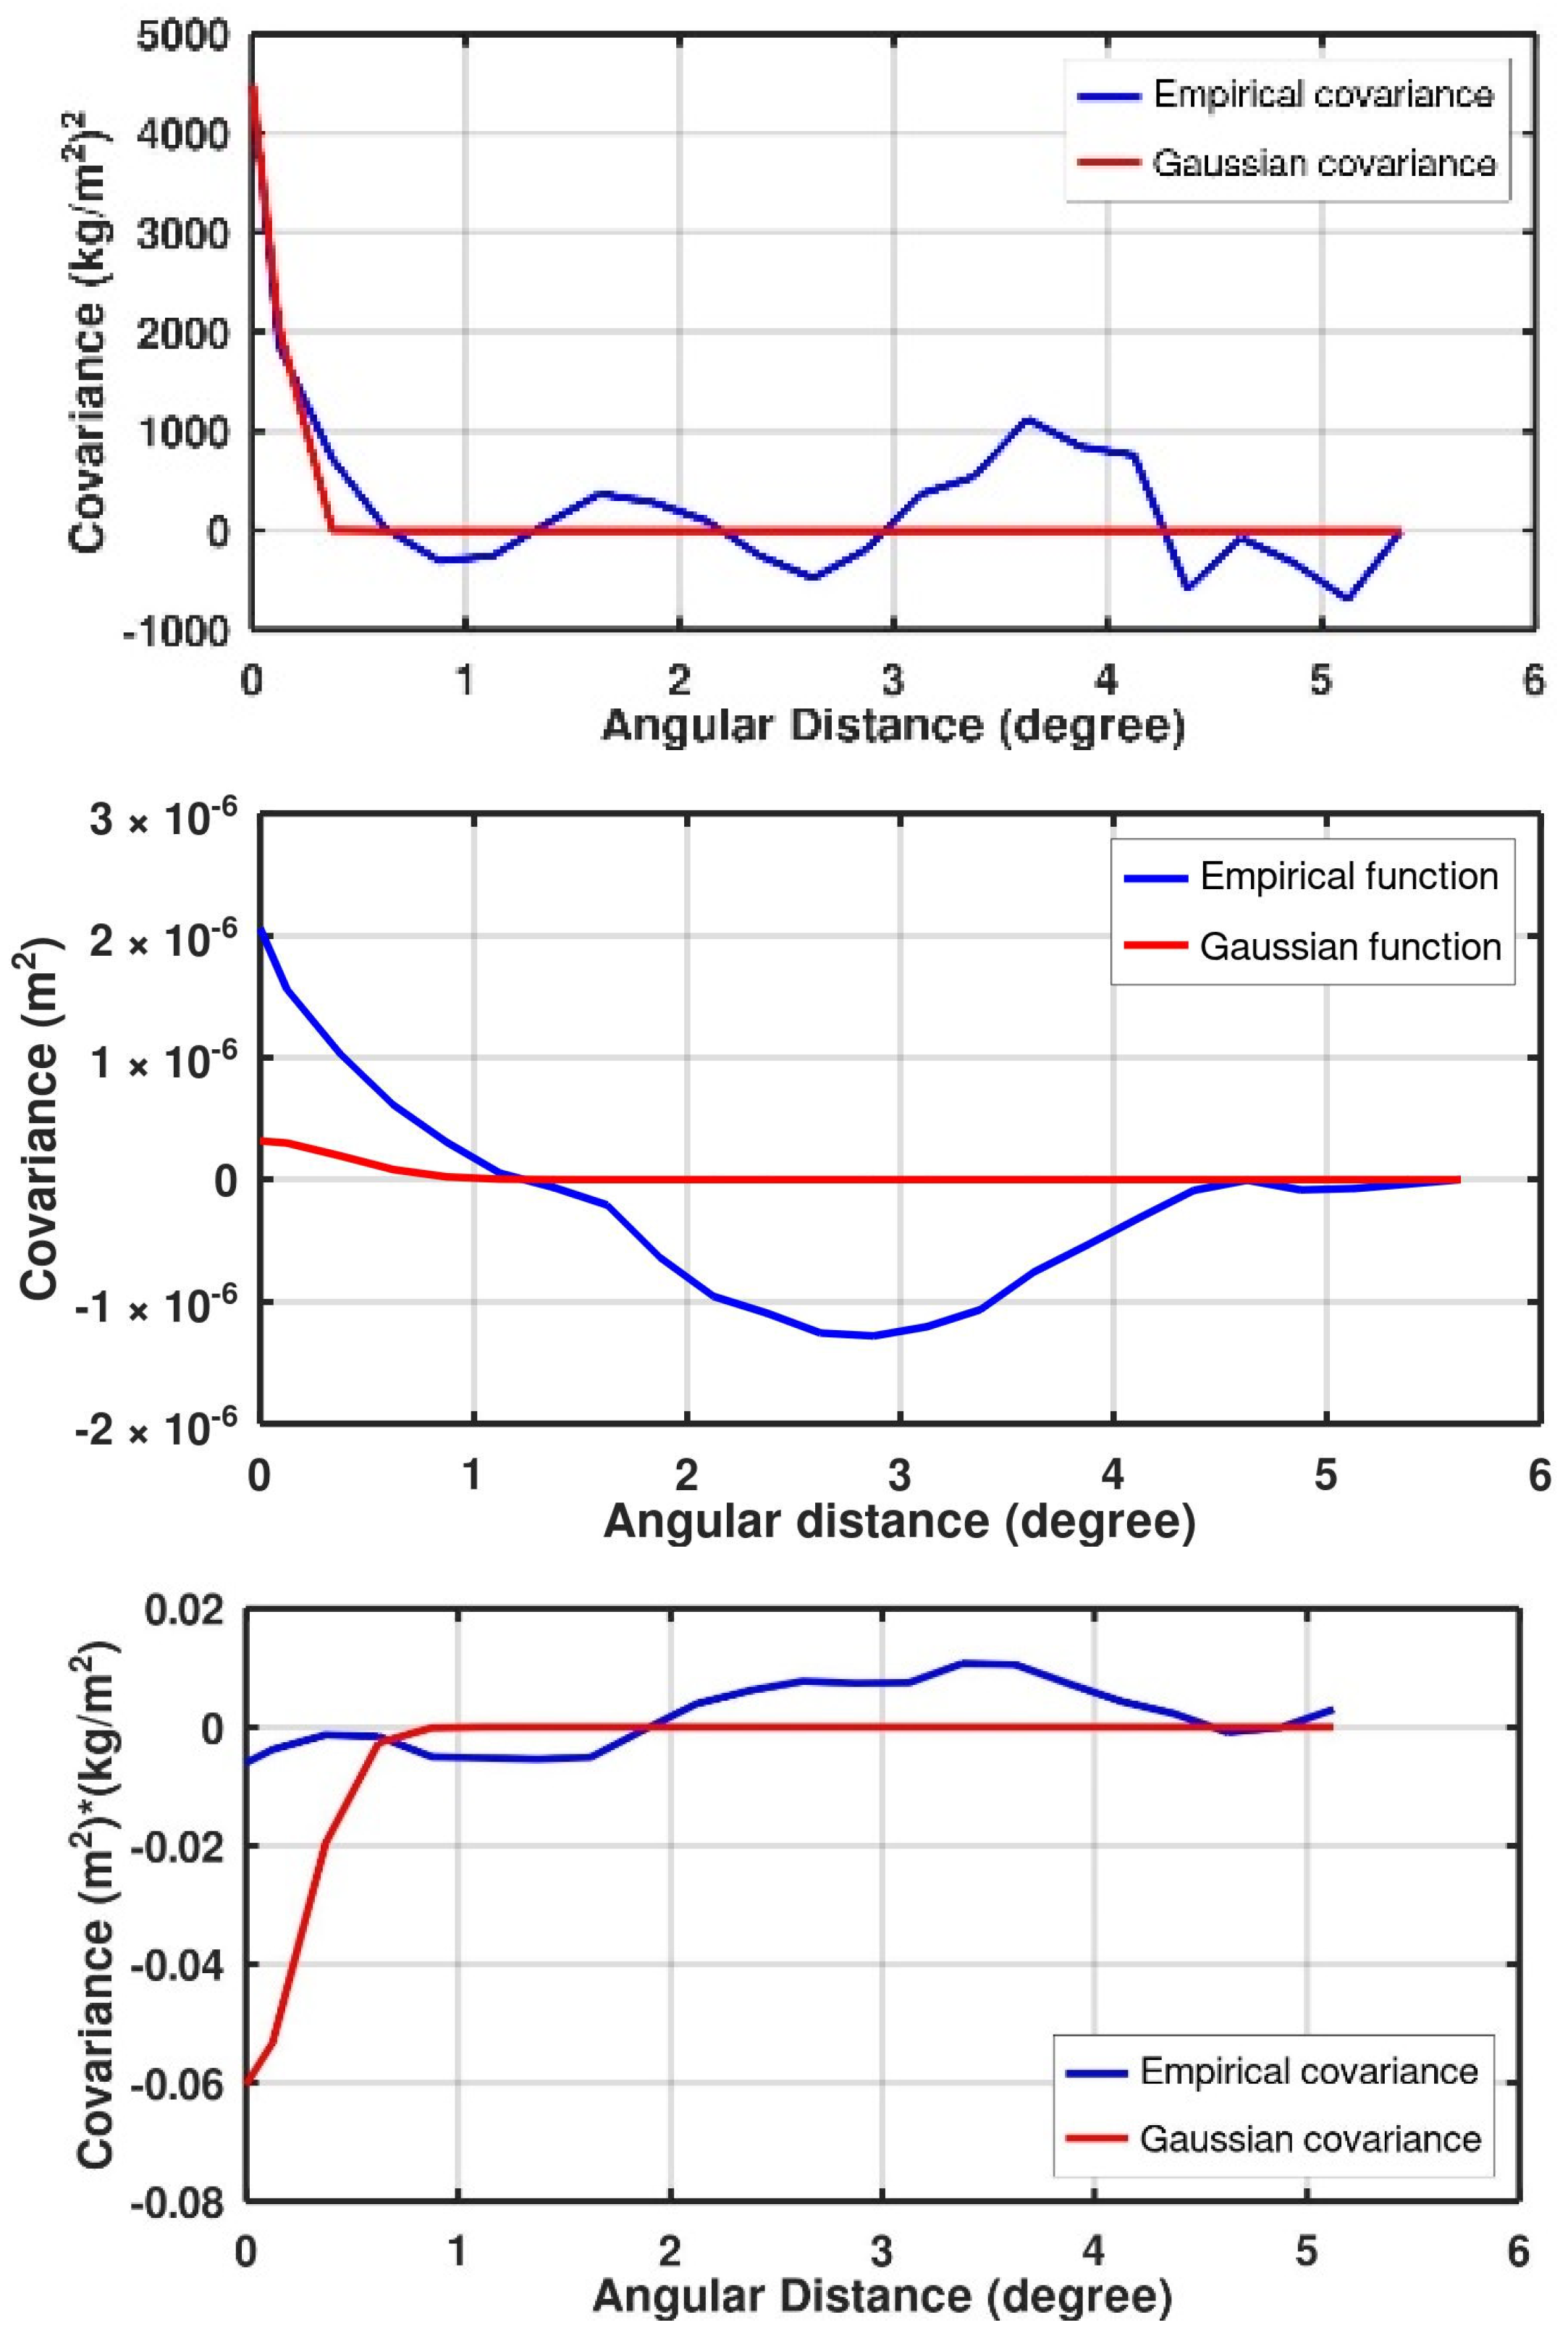
The empirical covariance and cross-covariance functions were fitted into the appropriate analytical functions (Figure 6). First, we fixed the variance for the simulated covariance and cross-covariance functions. Through simulations, we determined that a correlation length of 0.37° provided the best inversion results. While simulations showed discrepancies between analytical and empirical covariance functions, such deviations are expected. As noted by [43], these inconsistencies can arise due to dependencies and biases in the empirical covariance function.
The analytical expressions for GLDAS covariance function (Equation (7a)), the simulated vertical displacement covariance function (Equation (7b)), and GLDAS and simulated vertical displacement cross-covariance function (Equation (7c)) are as follows:
f ( r ) = 4483 × e ( r 2 2 × L C 2 )
f ( r ) = 3.18 × 10 07 × e ( r 2 2 × L C 2 )
f ( r ) = 0.06 × e ( r 2 2 × L C 2 )

2.4. GNSS Network

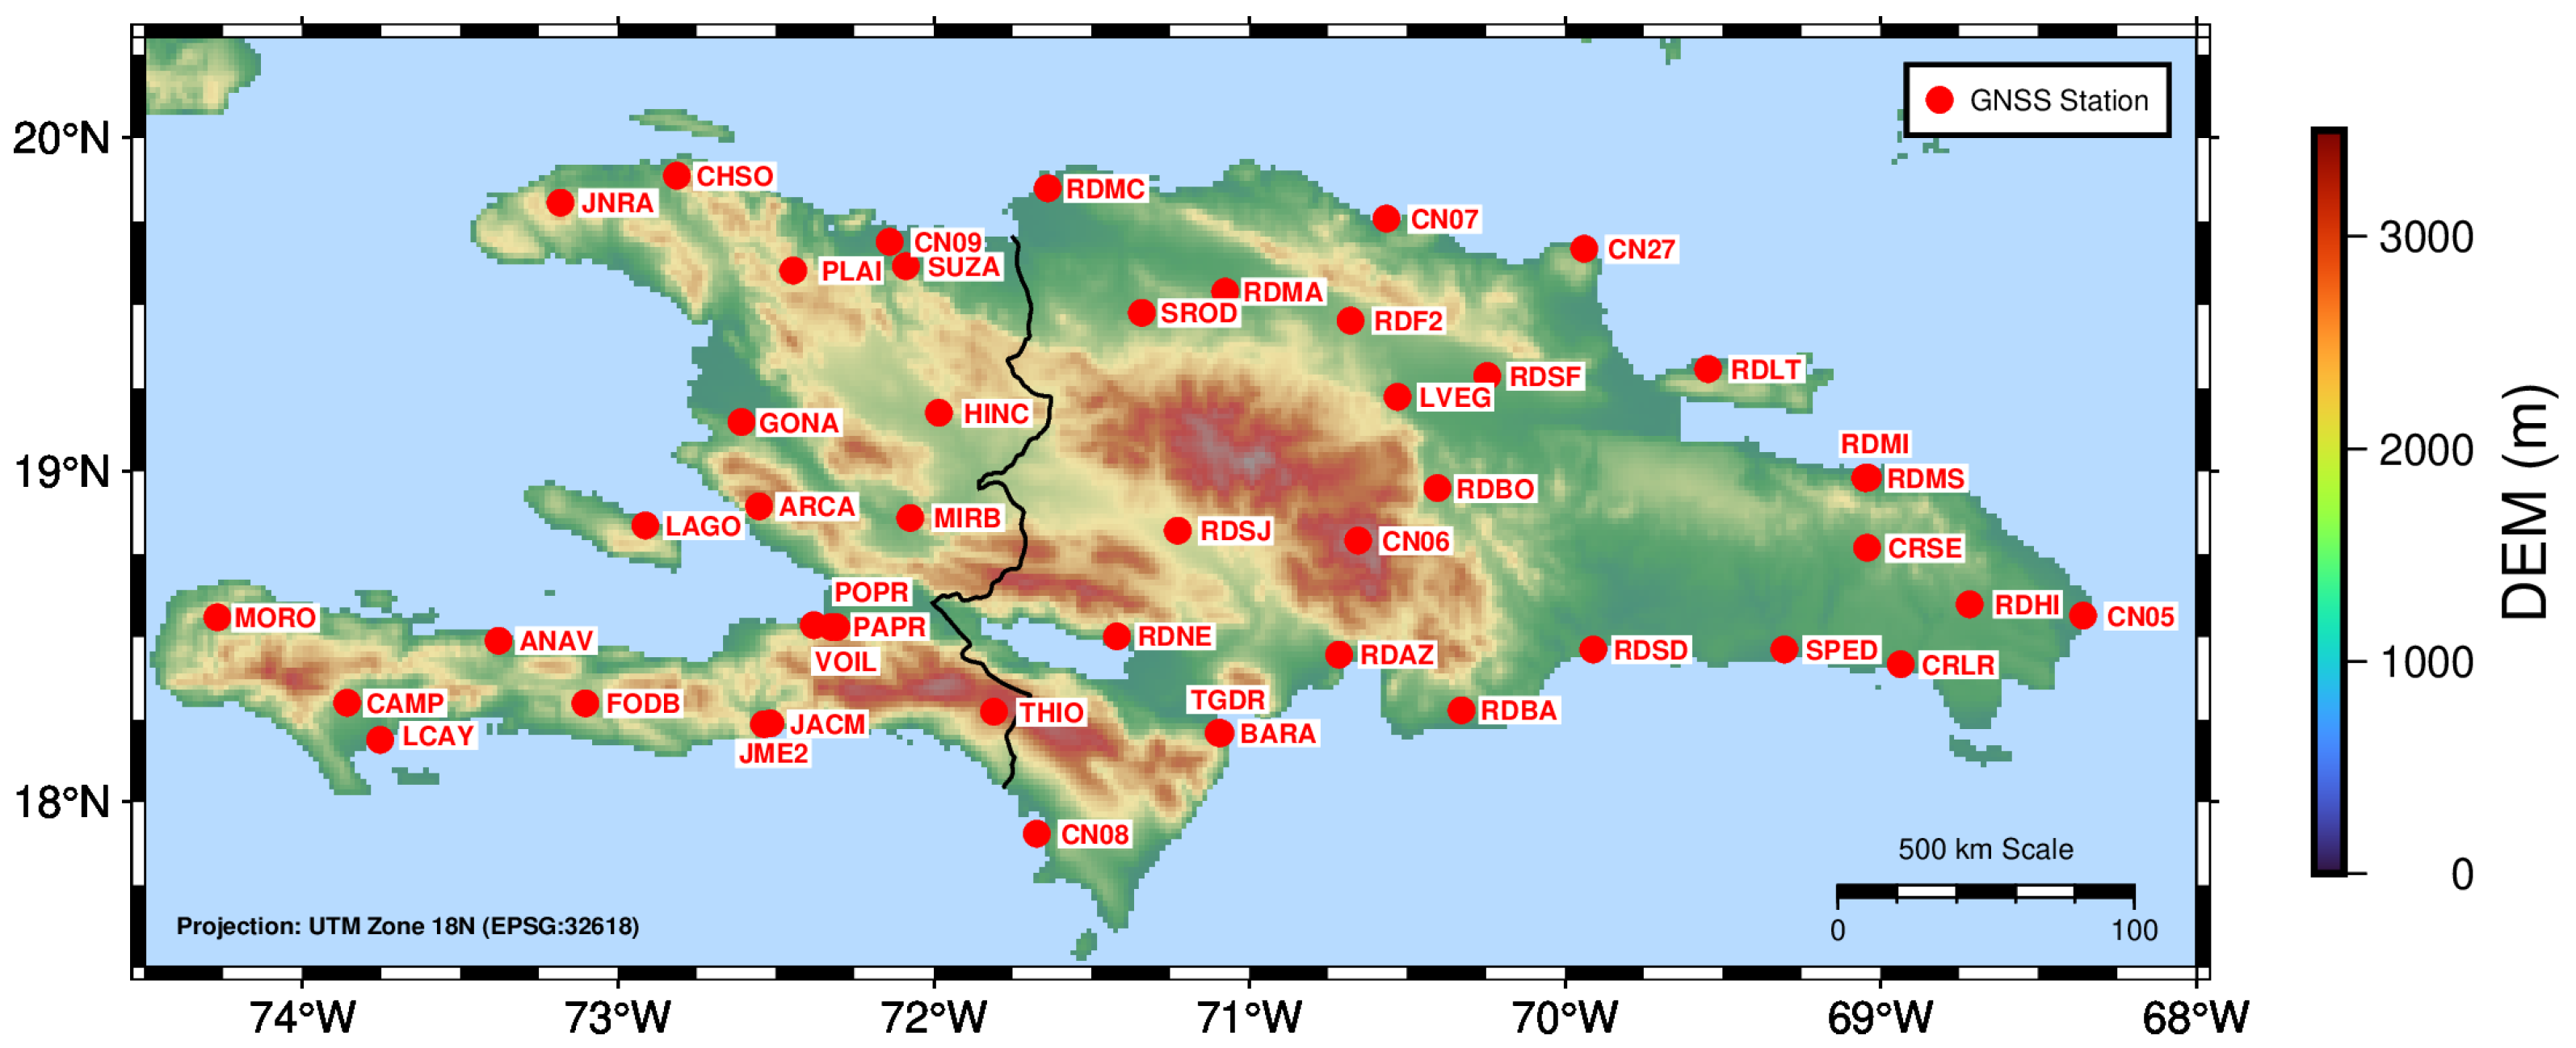
This section focuses on the GNSS network data available over the island, as shown in Figure 7. The network consists of 21 stations in Haiti and 26 in the Dominican Republic [44]. For detailed information about the data processing methods applied to the GNSS network, readers are referred to [11,45]. Figure 8 shows the data availability for the GNSS network during the study period spanning from July 2011 to February 2022. Unlike other regions with dense operational GNSS stations [14], we have a relatively limited number of operational stations in the island.

3. Results and Discussion

This section presents the results of the simulated and hydrological signals based on data from the GNSS network in Haiti.

3.1. Simulated Data Result

To evaluate the effectiveness of the LSC method in retrieving the hydrological signal, two types of synthetic tests were conducted: a data resolution test and an error estimation test. The data resolution test examines the impact of the number of stations on the inversion results, while the error estimation test assesses the influence of data noise.

Data Resolution Test

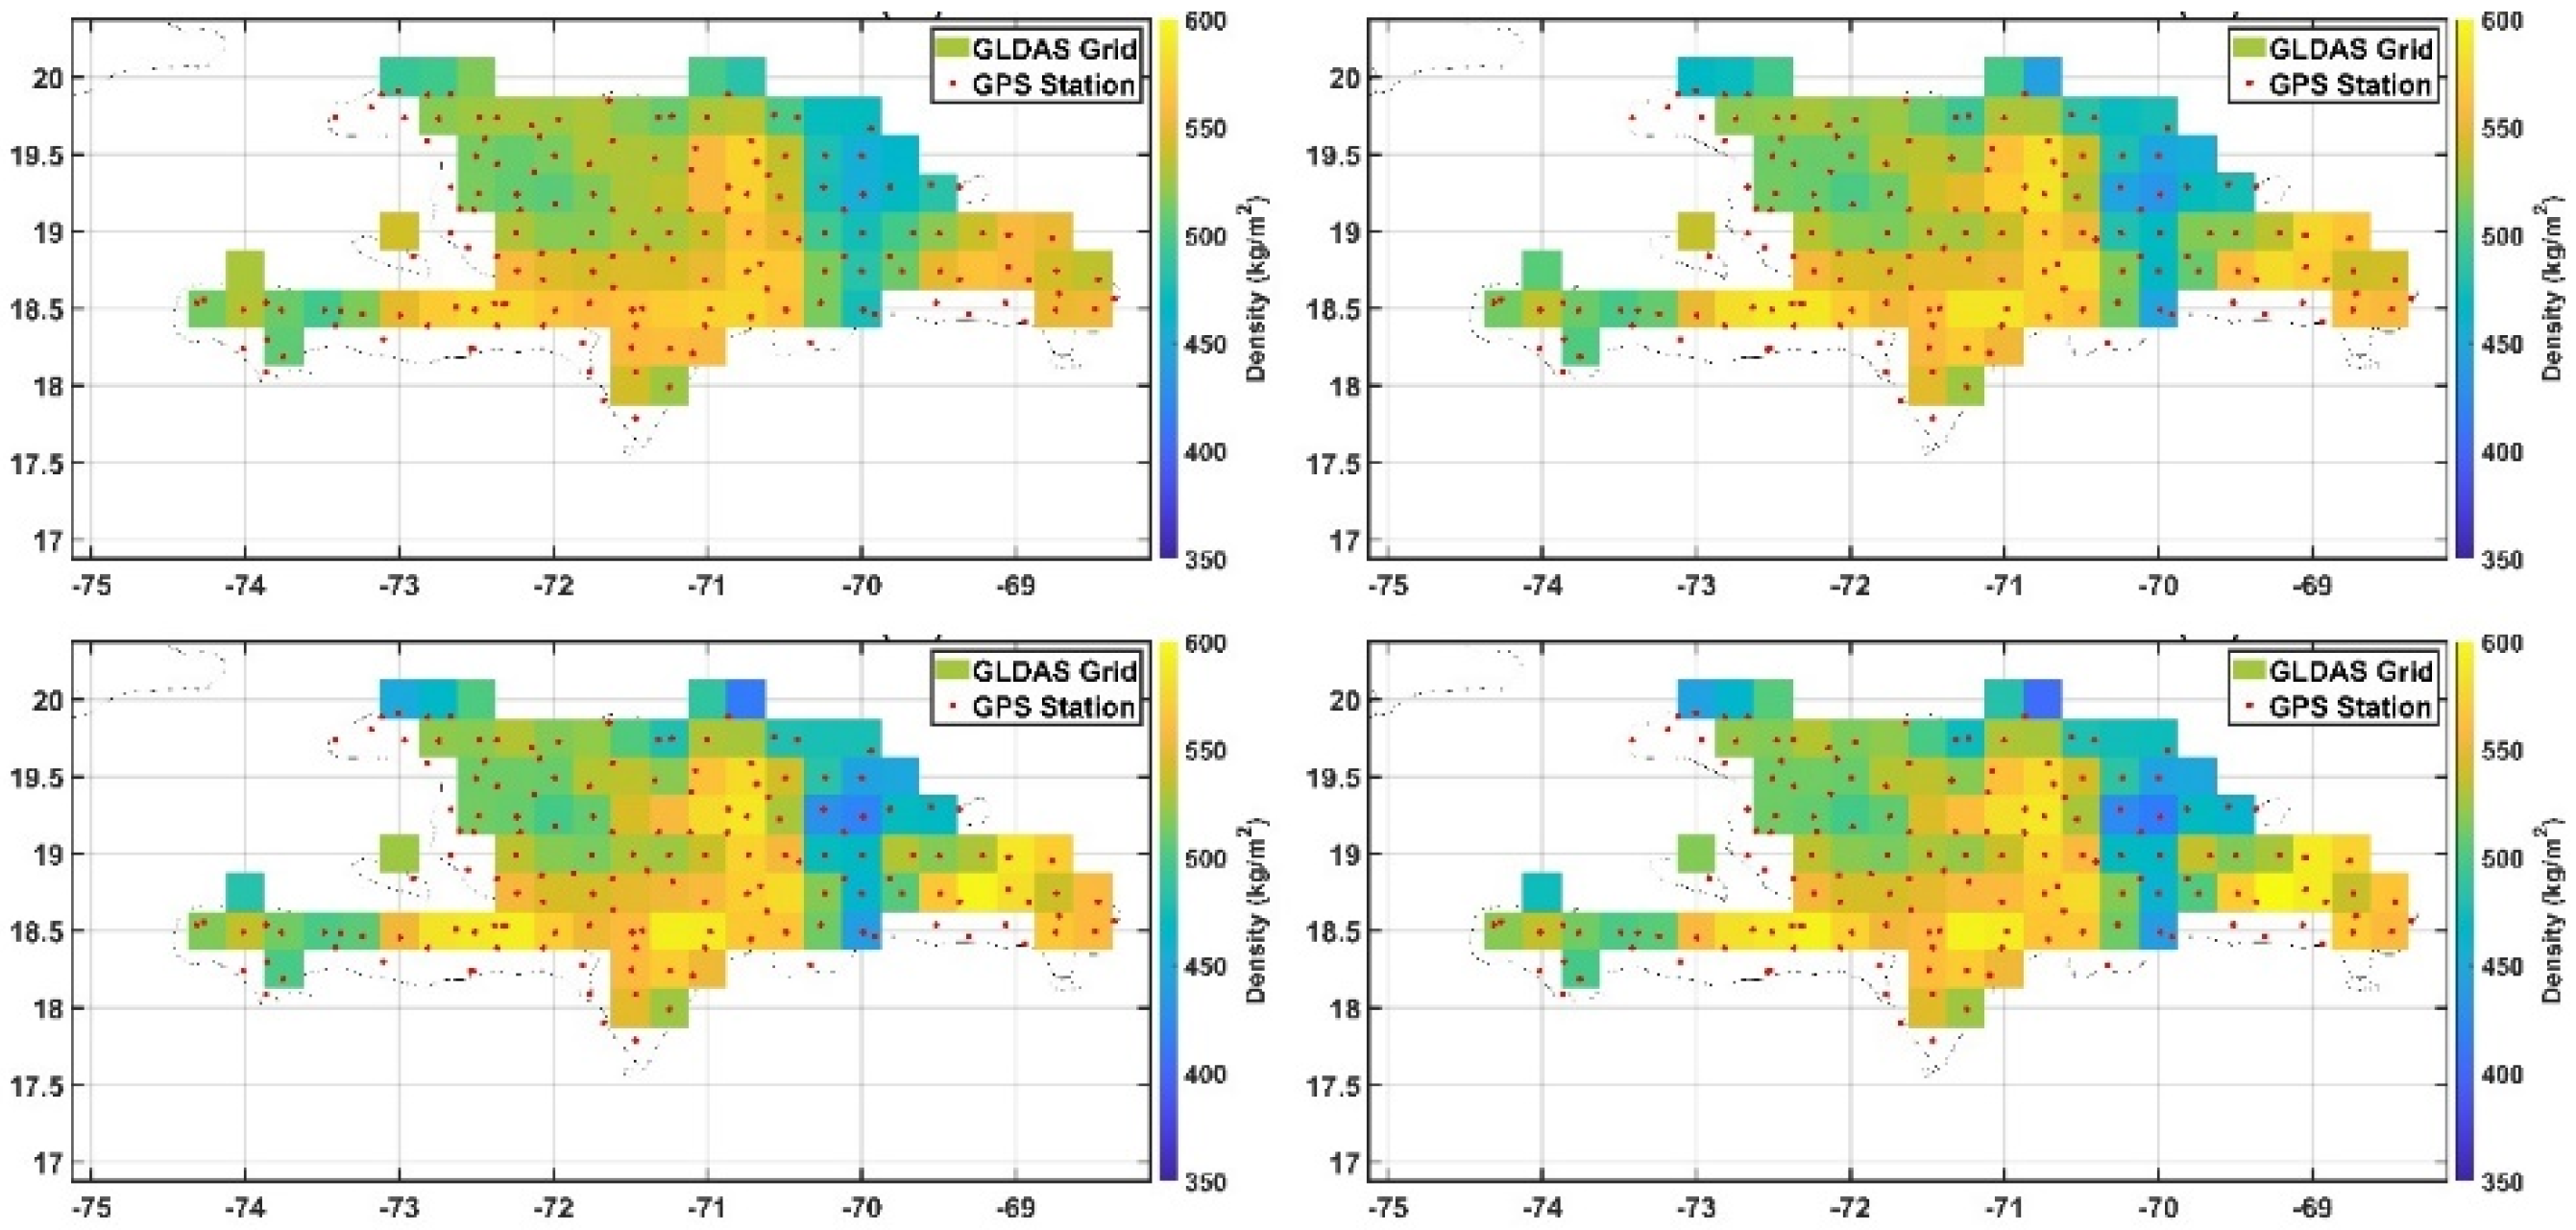
Given the limited number of operational GNSS stations on the island, we performed a data resolution test to assess the sensitivity of the LSC inversion method to the number of available stations. We considered 13 sets of simulated stations, comprising, respectively, 1, 10, 20, 40, 60, 80, 100, 120, 140, 160, 180, and 200 stations. The number of stations progressively increased from 1 to 200, with selected examples illustrated by red dots in Figure 9, showing the inverted solutions.
For each station set, we estimated the simulated vertical displacement at the station locations. These simulated displacements were then inverted to retrieve the original GLDAS data (Figure 3). The results demonstrate that increasing the number of stations enhances the retrieval accuracy of the initial hydrological signal. Specifically, as the station count rises, the correlation coefficient shows a significant increase (Figure 10a), the reduction coefficient, which represents the average contribution of the inverted hydrological data to the original hydrological data, is calculated according to [46,47], exhibits a slight improvement (Figure 10b), and the RMSE decreases substantially (Figure 10c). These trends are expected, as the original hydrological data contain inherent spatial variability with localized peaks.
Further analysis in Figure 11 reveals that as the number of stations increases, the standard deviation of the inversion decreases. In regions with higher station density, such as the central part of the island, the standard deviation is lower compared to coastal areas, where station coverage remains sparse. This highlights the importance of station density in achieving more accurate and stable inversion results.
In conclusion, these simulations demonstrate that the LSC method can effectively reproduce TWS in regions with a dense GNSS network. The results indicate a strong agreement between the input values (Figure 3) and the inversion results (Figure 9), validating the method’s effectiveness. Furthermore, the number of stations used in the data resolution test for Haiti represents a technically realistic scenario. However, the findings also highlight the challenge of achieving reliable spatiotemporal inversions across the entire island due to the limited availability of operational GNSS stations. Expanding the GNSS network could significantly improve the accuracy and robustness of hydrological signal retrieval in this region.

3.2. Error Estimate Test

To assess the sensitivity of the inversion method to errors in the observation data, we conducted two specific tests: the stability test and the robustness test.

3.2.1. Stability Test

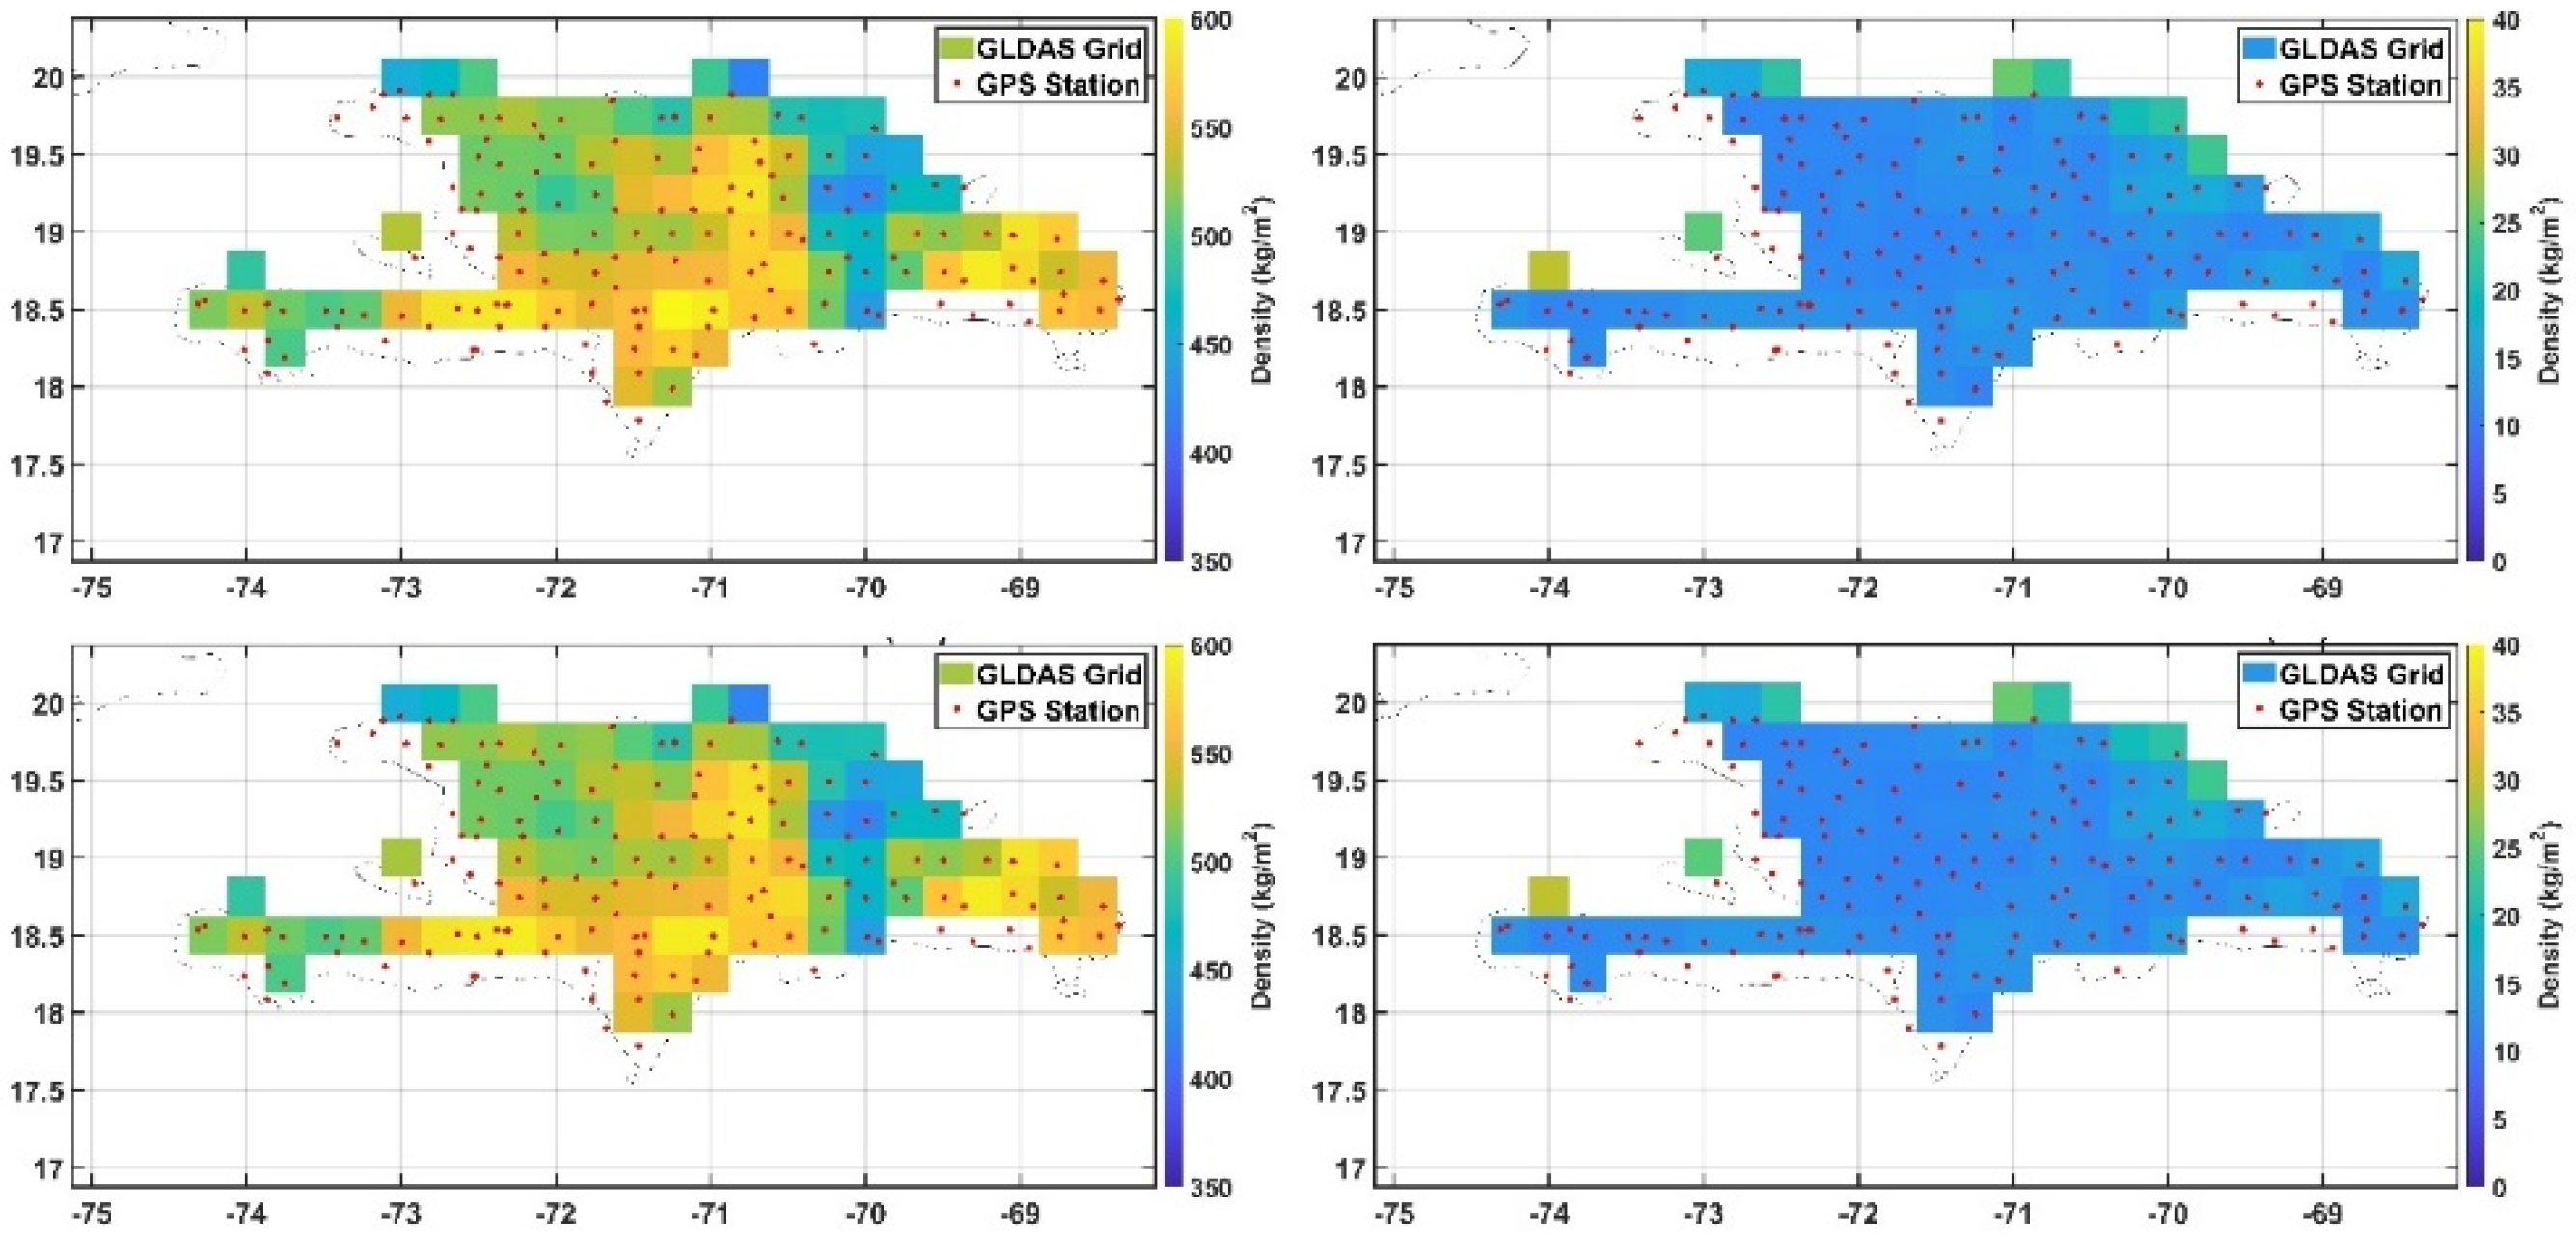
The stability test examined how the inversion method responds to varying levels of noise in the observation data. We simulated different noise amplitudes using a configuration of 160 synthetic stations on the island (Figure 12). Initially, we applied an error to the simulated displacements with an amplitude equal to that of the simulated vertical displacement (1/1). Subsequently, we progressively reduced the noise amplitude by considering error levels of 1/3, 1/6, and 1/9 of the simulated vertical displacement amplitude.
The results, summarized in Table 3, indicate that as the error decreases, the solution improves. Small modifications in the data error resulted in small adjustments to the inversion solution, indicating that the inversion method is stable [48]. The inversion solutions for the different noise levels are shown in Figure 13.

3.2.2. Robustness Test

A numerical method is considered robust if it remains stable despite the presence of a small number of large errors [17,18,49]. To assess the robustness of the inversion, we used 160 synthetic stations, as shown in Figure 12. Initially, we applied a relative error of 20% to the simulated vertical displacement values at 157 stations (represented by black dots). Then, we introduced errors 100 times larger (considered outliers) at three stations (represented by red dots). Despite these large errors at the three stations, the inversion solution remained stable (see Table 4 and Figure 14). This outcome demonstrates the robustness of the inversion method. The left panel of Figure 14 displays the inversion results, while the right panel shows the corresponding standard deviation.

3.3. Real GNSS Data Result

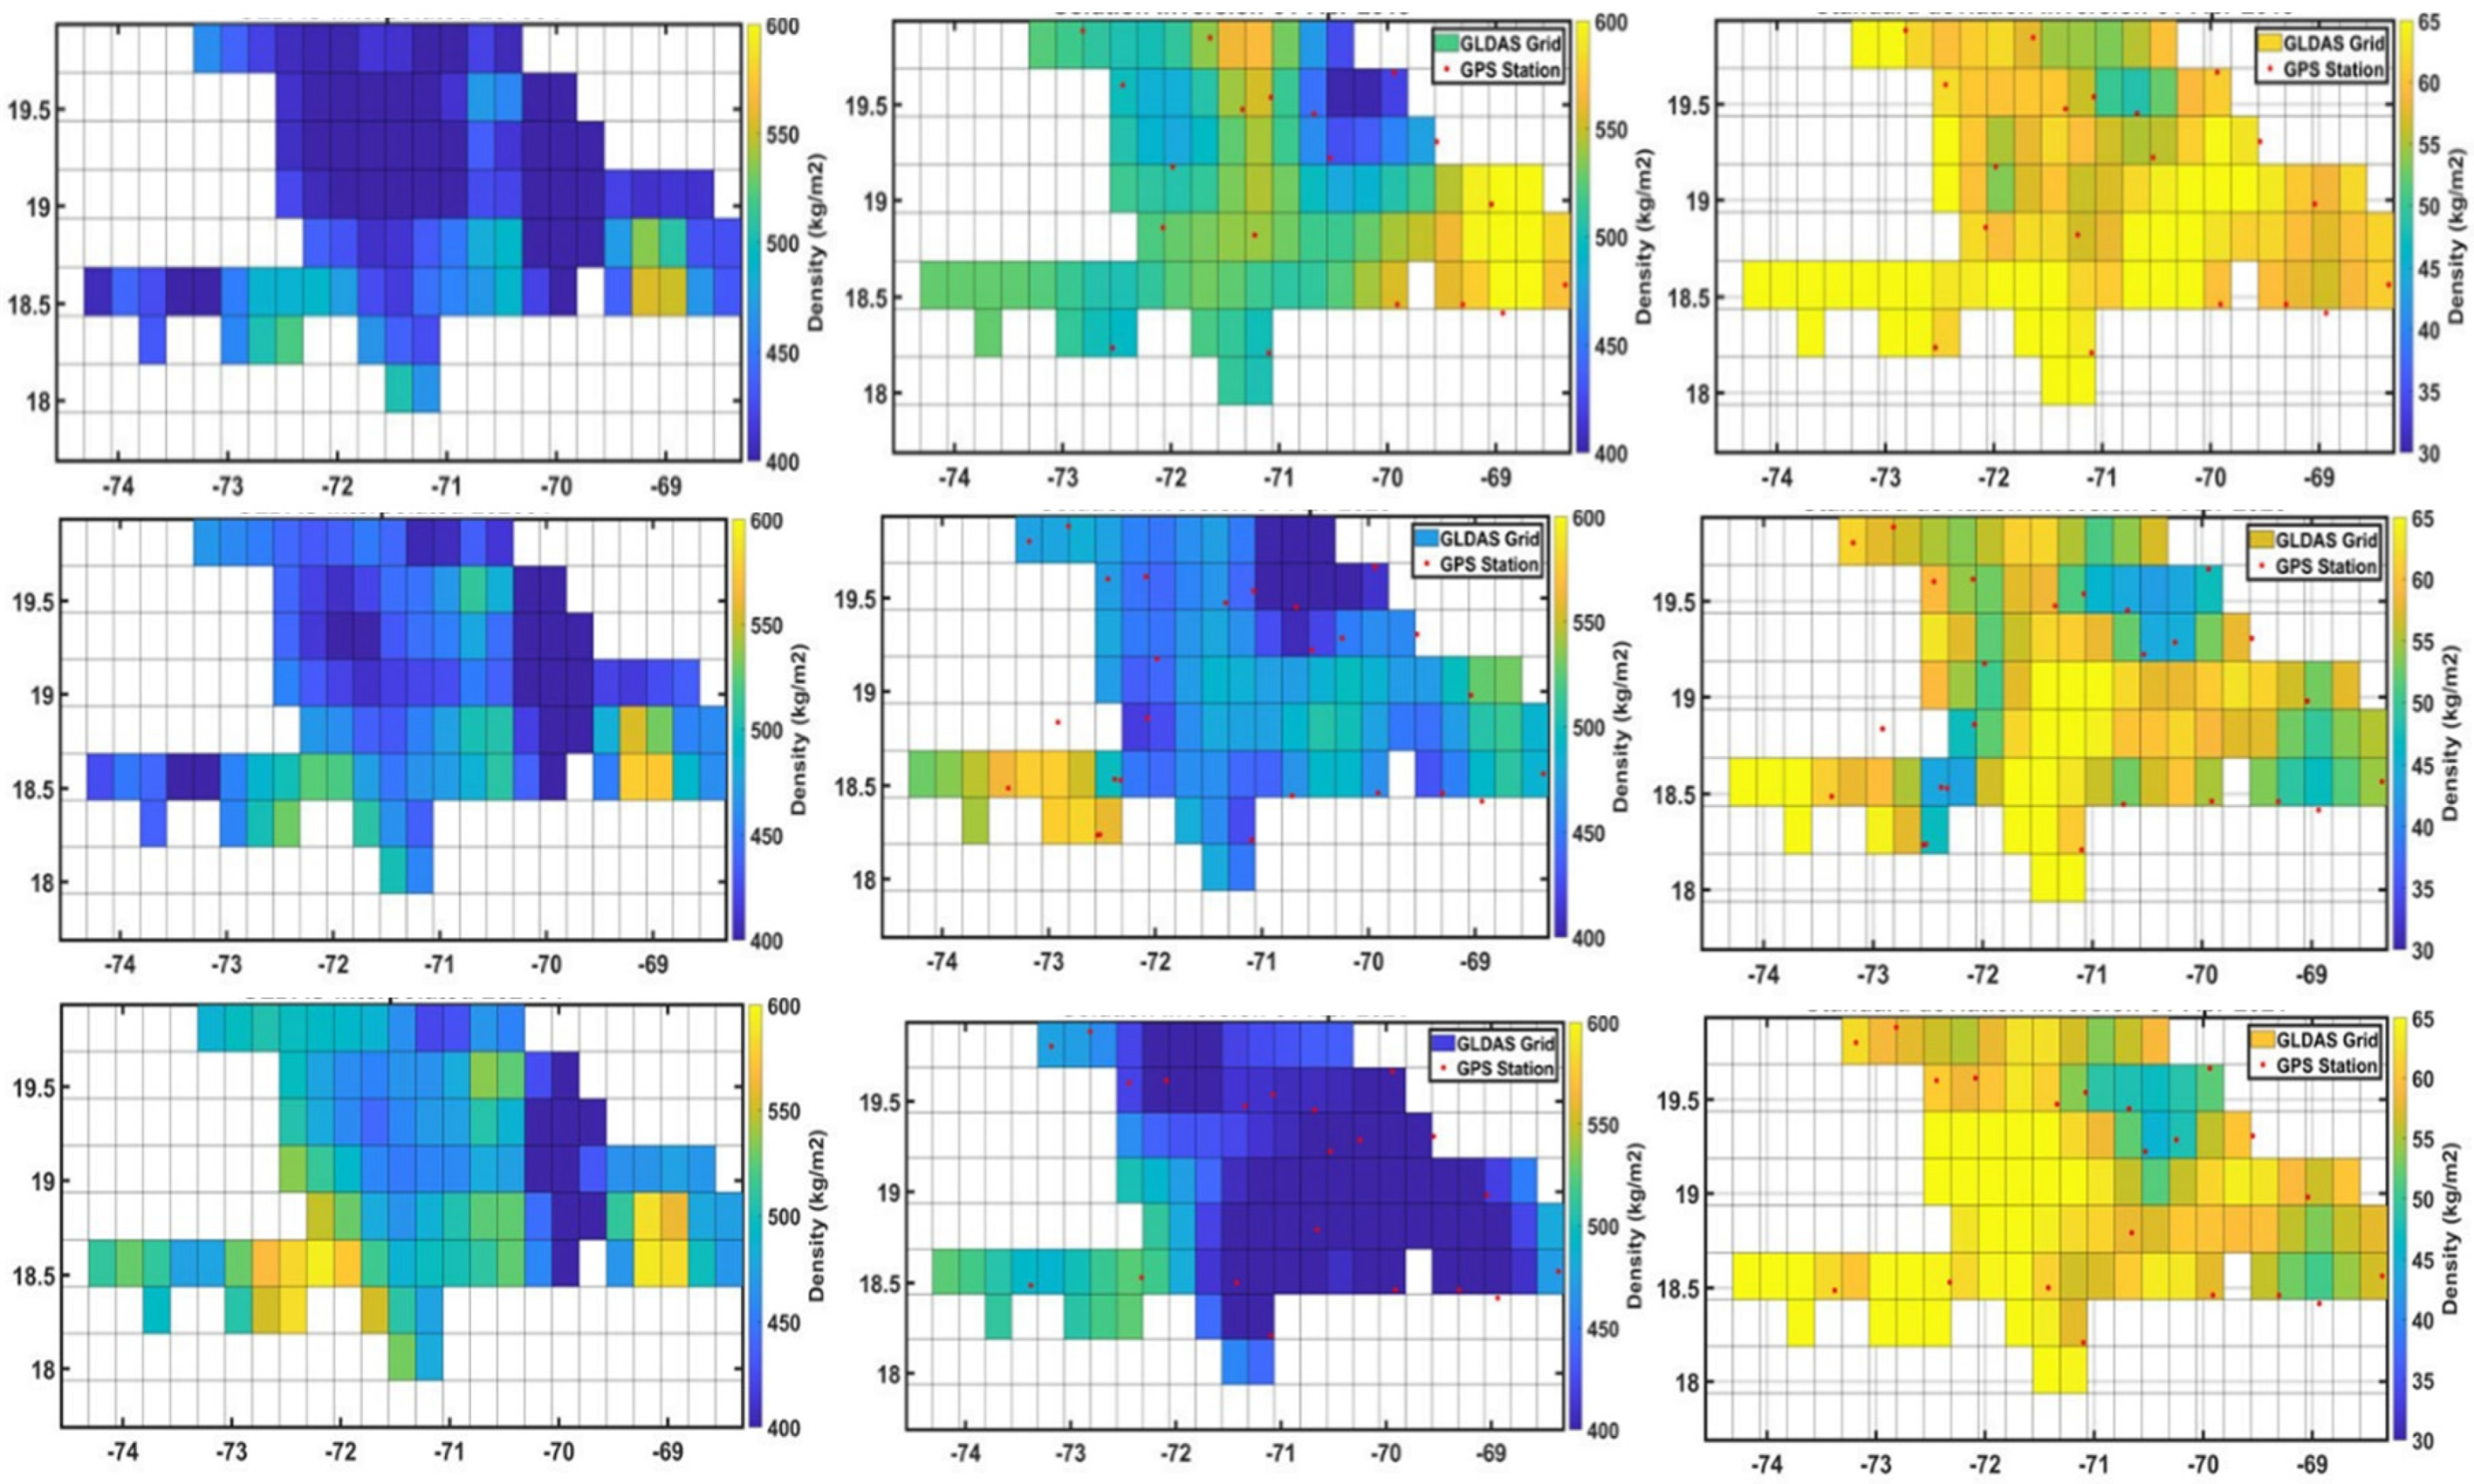
For the comparison, we used monthly GNSS and GLDAS data. With Tsoft software version 2.2.15 [50], the monthly time series for both datasets were detrended and filtered using a low-pass filter with a cut-off frequency of 1/25 cycle per day [11]. The first day of each month was selected from the filtered signals. The LSC method was then applied to invert each filtered monthly GNSS dataset on a specific grid, while the monthly GLDAS data were interpolated onto the same grid. Both datasets utilized a common correlation length of 0.37°. The inversion process was conducted for stations with continuous data throughout the year and the fewest data gaps. Due to the limited number of stations operating simultaneously during the study period, the comparison focused on GLDAS data from 2019, 2020, and 2021. For these years, 19, 27, and 21 stations were used, respectively, with their locations shown as red dots in Figure 15. These stations were unevenly distributed across the island. Monthly GLDAS/NOAH data served as the reference for the spatiotemporal comparison (Figure 15, left column).

3.3.1. Spatiotemporal Result

Figure 15 (middle column) presents the inverted solutions for April 2019, 2020, and 2021. April was selected due to its highest correlation 0.3 between the inversion and the interpolated GLDAS model, which reduced by 73% and showed an RMSE of 115 kg/m2 (Figure 16). The hydrological signal is successfully retrieved in regions near GNSS stations. In areas without GNSS stations, the inverted and a priori solutions are similar, as expected. Overall, the solution does not always align perfectly with the GLDAS model. For some months, the solutions and GLDAS model exhibit similar trends, while for others, the inversion either overestimates or underestimates the GLDAS model. The results demonstrate that as the number of stations involved in the inversion increases, the standard deviation of the solution decreases (Figure 15, right column). Additionally, areas with denser GNSS station coverage show lower standard deviations. Figure 16 presents the correlation, reduction, and RMSE monthly results for 2019.

3.3.2. Temporal Inversion by Cell

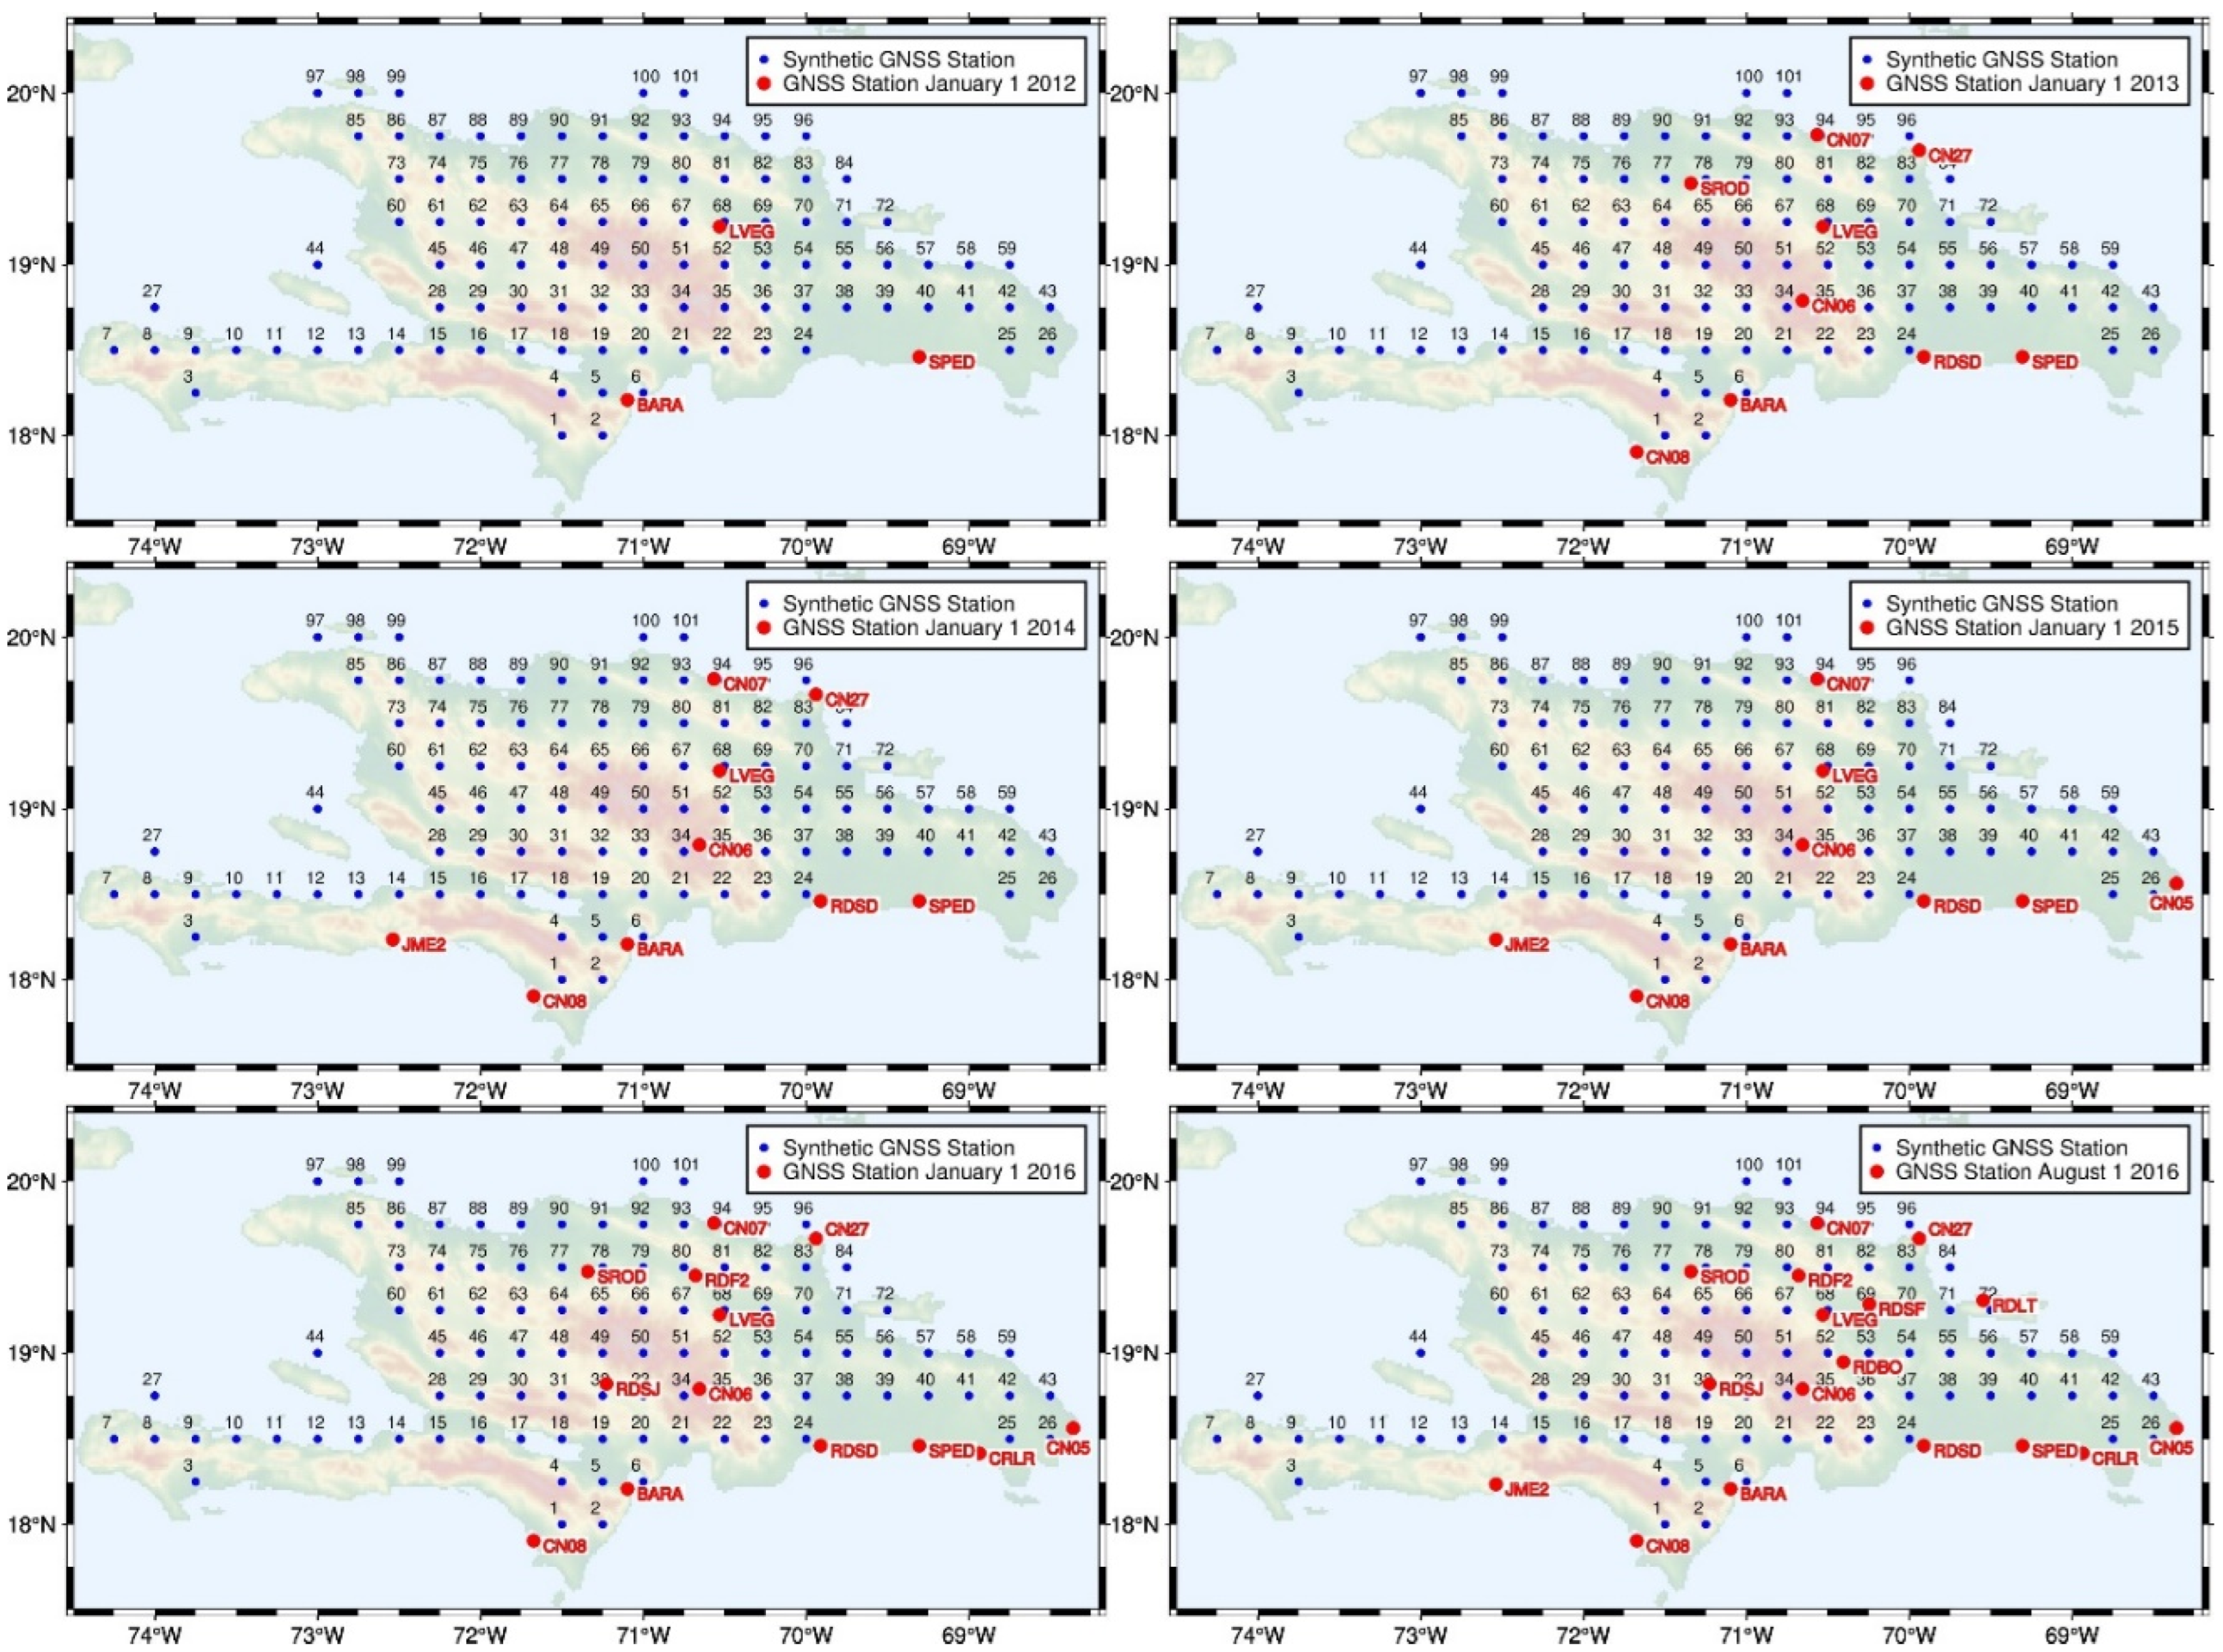
To assess the impact of the number of stations on the amplitude of the inverted signal, we performed a temporal inversion on a cell-by-cell basis, as the number of available GNSS stations was insufficient for reliable spatiotemporal verification. We present the inversion results for cells 15 and 25, considering the influence of stations (JME2, CN05) on the inversion signal for cell 15 and (JME2, CN05, and CRLR) for cell 25. Figure 17 illustrates the GLDAS grid cells, represented by blue dots and numbered from cell 1 to cell 101. The figure also includes a selection of arbitrary operational GNSS stations (shown as red dots) for the period between 2011 and 2016.
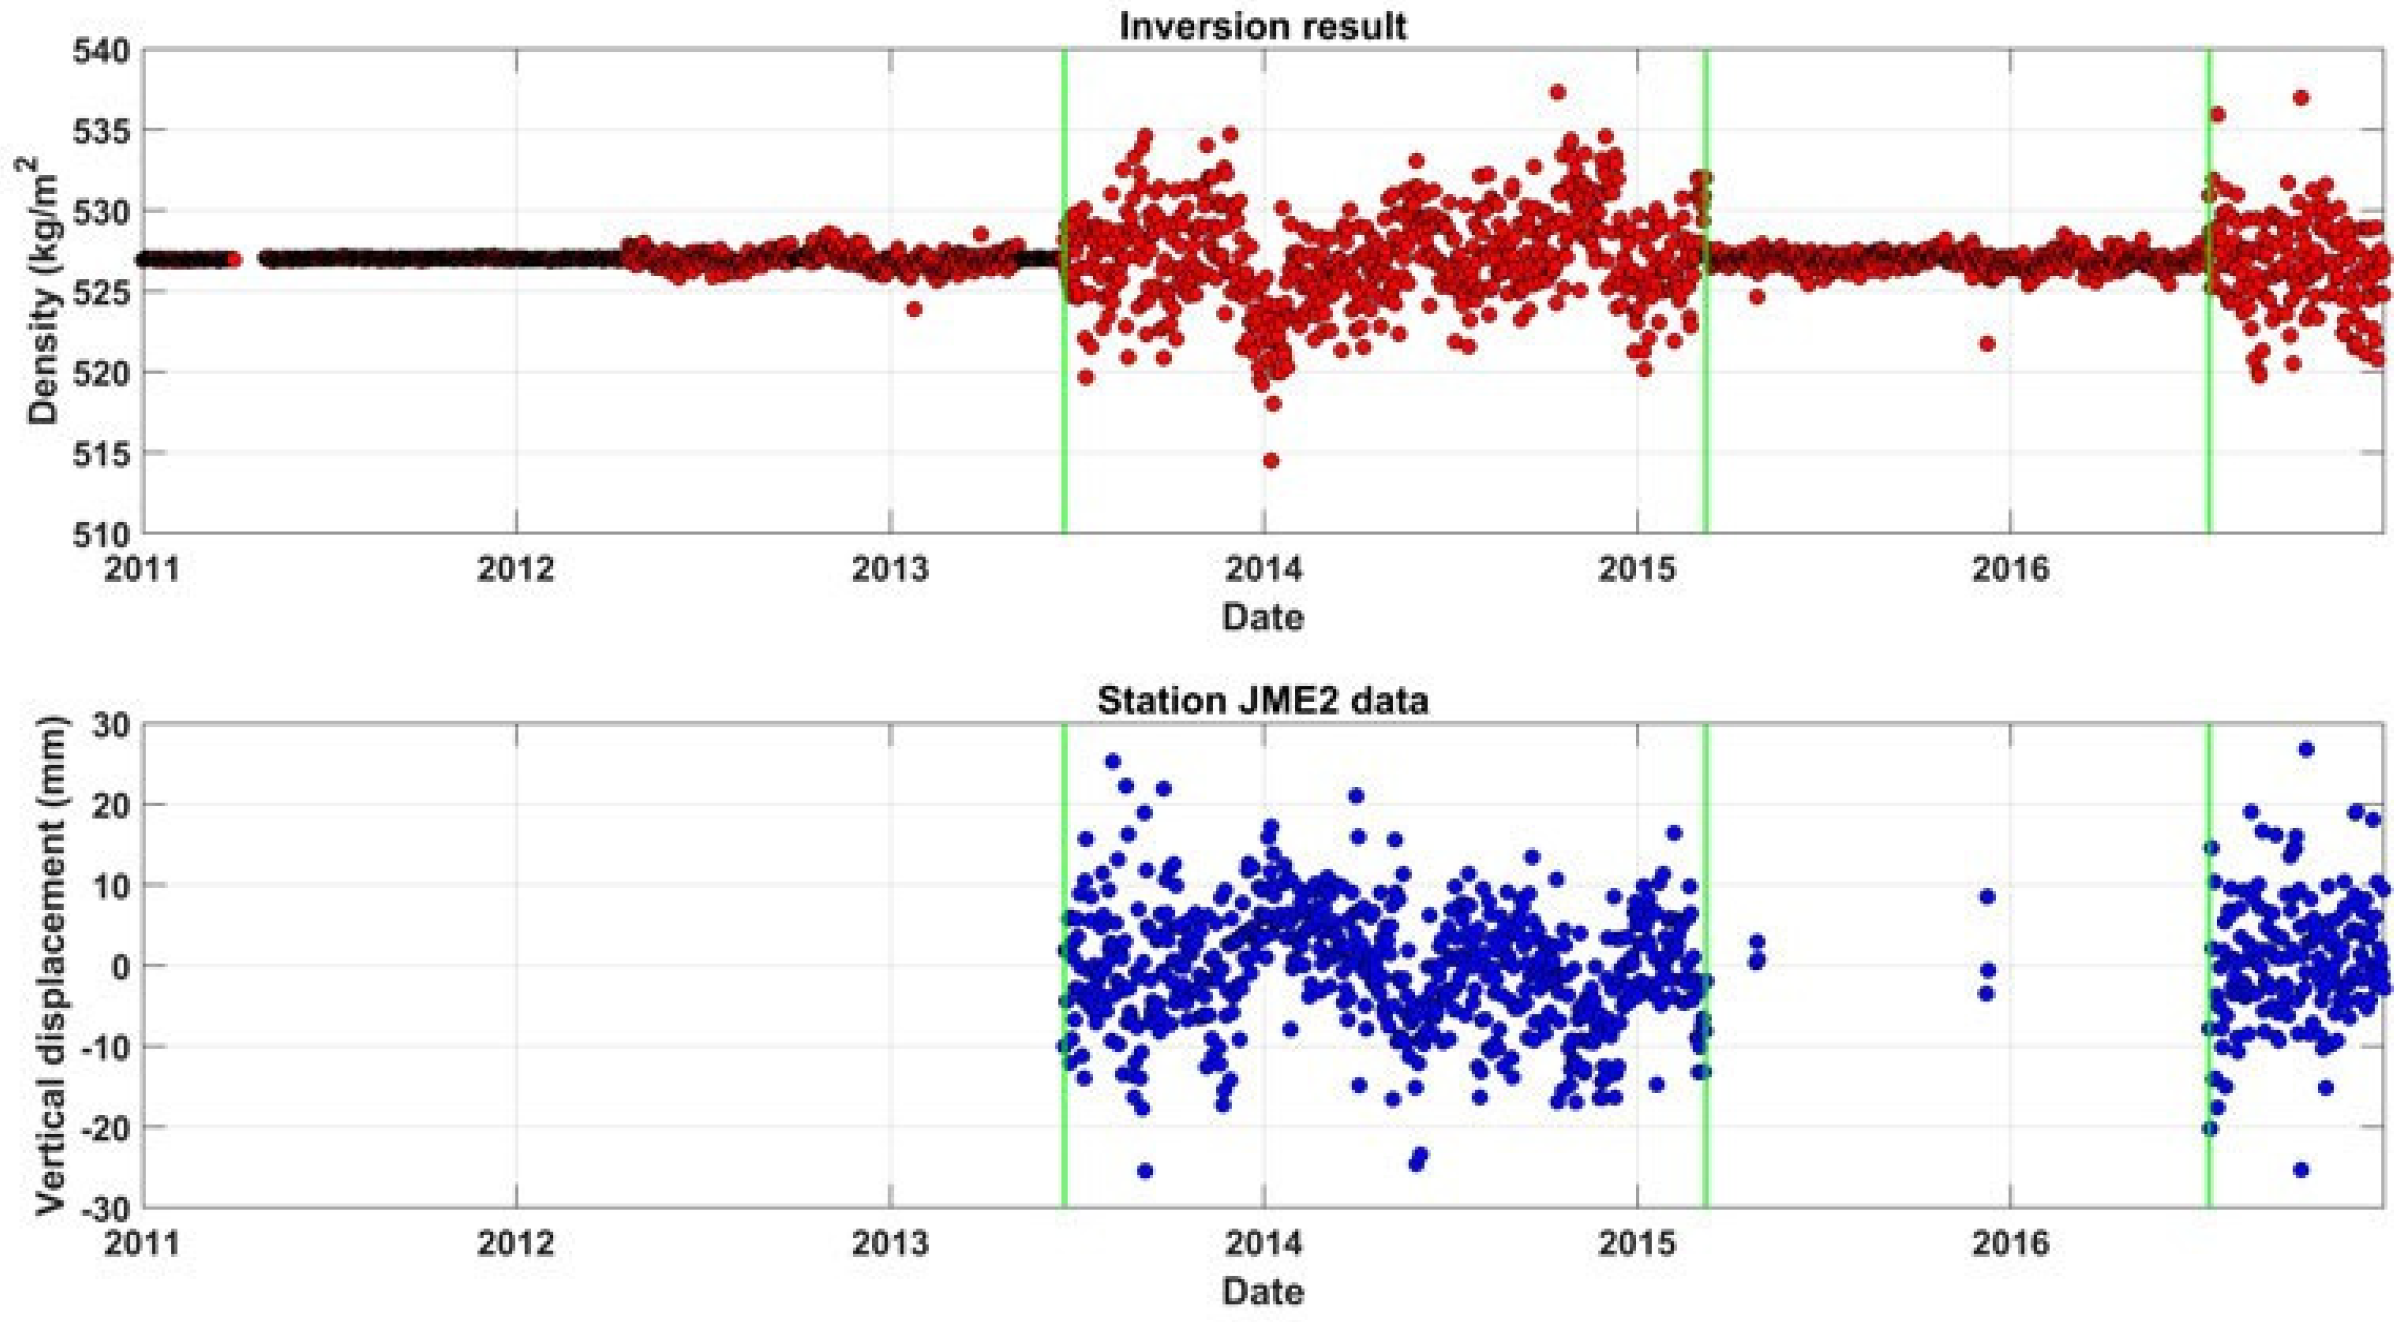
The inversion results shown in Figure 18 (top panel) highlight the influence of GNSS station operations on the hydrological inverted signal at cell 15. During the period when station JME2 was not operational from January 2011 to June 2013 (Figure 17, top panels and Figure 18, bottom panel), the hydrological inverted signal at cell 15 remained flat (Figure 18, top panel). After JME2 resumed operations in June 2013 (Figure 17, middle panels and Figure 18, bottom panel), the amplitude of the hydrological inverted signal at cell 15 increased (Figure 18, top panel). In contrast, when JME2 was again non-operational from February 2015 to June 2016 (Figure 17, bottom-left panel and Figure 18, bottom panel), the amplitude of the inverted signal decreased (Figure 18, top panel). The reactivation of JME2 in June 2016 (Figure 17, bottom-right panel, and Figure 18, bottom panel) resulted in a subsequent increase in the amplitude of the inverted signal (Figure 18, top panel).
A similar trend is observed for cell 25 (Figure 19). Between January 2011 and February 2014, when station CN05 was non-operational, the hydrological inverted signal remained flat (Figure 19, top panel). Once CN05 resumed operations in February 2014 (Figure 19, middle panel), the amplitude of the signal in cell 25 increased (Figure 19, top panel). Similarly, when the CRLR station became operational in December 2015 (Figure 19, bottom panel), there was a notable increase in the hydrological inverted signal amplitude at cell 25 (Figure 19, top panel). This pattern suggests that as the number of operational GNSS stations increases, the hydrological signal retrieval improves, leading to a more accurate inverted solution.
In summary, real GNSS stations can effectively generate hydrological signals in areas where GNSS data are available. The greater the number of stations, the more hydrological signals can be retrieved. However, the spatiotemporal comparison with GLDAS/NOAH data at both daily and monthly scales was not entirely successful. This result is not unexpected, as prior simulations indicated that, due to the limited number of stations across the island, achieving a reliable spatiotemporal inversion for the entire region would be challenging.

4. Conclusions

This study aimed to assess the feasibility of the Least Squares Collocation (LSC) method for estimating terrestrial water storage variations using GNSS-derived vertical displacements in Haiti. The synthetic tests demonstrated that the LSC method, when applied with a Gaussian covariance function, effectively estimates terrestrial water storage from a dense and homogeneous GNSS network. The retrieval of the hydrological signal improves as the number of stations and their spatial coverage increase. Due to the limited number of operational GNSS stations on the island, it was not possible to accurately reproduce the spatiotemporal hydrological signal from the GLDAS/NOAH model. Nevertheless, the LSC approach shows considerable potential for estimating hydrological signals from a dense GNSS network. Future research should focus on testing this method in regions with a higher density of operational GNSS stations and comparing LSC with alternative statistical regularization methods.

Author Contributions

Conceptualization, R.S.; methodology, R.S.; software, R.S.; validation, R.S., S.T. and O.F.; formal analysis, R.S.; investigation, R.S.; resources, R.S., S.T. and O.F.; data curation, R.S.; writing—original draft preparation, R.S.; writing—review and editing, R.S., S.T. and O.F.; visualization, R.S.; supervision, O.F.; project administration, O.F. All authors have read and agreed to the published version of the manuscript.

Funding

This research was carried out at the Geophysics Laboratory of the University of Luxembourg and received no external funding.

Data Availability Statement

The GNSS data analyzed in this study are available from GAGE Facility Data Center (formerly UNAVCO) and at Centre National de l’Information Géo-Spatiale, Haiti. GNSS data were processed using GAMIT/GLOBK [51] and TSoft [50]. The Global Land Data Assimilation System (GLDAS) hydrologic model, as described by [52], is also available. Analyses and graphics were obtained using Matlab version 2022 available at https://www.mathworks.com/ (accessed on 29 June 2025) and Matplotlib version 3.10, available under the Matplotlib license at https://matplotlib.org/ (accessed on 29 June 2025). Maps were created through Generic Mapping Tools [53] version 6.4.0.

Acknowledgments

We kindly acknowledge the Centre National de l’Information Géo-Spatiale in Haiti for providing access to the GNSS data. We express our sincerest gratitude to the Geophysics and Remote Sensing (GRS) Laboratory of the University of Luxembourg for supporting this research.

Conflicts of Interest

The authors declare no conflicts of interest.

References

  1. Tapley, B.D. The Gravity Recovery and Climate Experiment: Mission overview and early results. Geophys. Res. Lett. 2004, 31, L09607. [Google Scholar] [CrossRef]
  2. Wahr, J.; Swenson, S.; Zlotnicki, V.; Velicogna, I. Time-variable gravity from GRACE: First results. Geophys. Res. Lett. 2004, 31, L11501. [Google Scholar] [CrossRef]
  3. Blewitt, G.; Lavallée, D.; Clarke, P.; Nurutdinov, K. A New Global Mode of Earth Deformation Seasonal Cycle Detected. Science 2001, 294, 2342–2345. [Google Scholar] [CrossRef] [PubMed]
  4. Davis, J.L.; Elósegui, P.; Mitrovica, J.X.; Tamisiea, M.E. Climate-Driven Deformation of the Solid Earth from GRACE and GPS. Geophys. Res. Lett. 2004, 31, L24605. [Google Scholar] [CrossRef]
  5. Kusche, J.; Schrama, E.J.O. Surface Mass Redistribution Inversion from Global GPS Deformation and Gravity Recovery and Climate Experiment (GRACE) Gravity Data: Surface Mass Redistribution from GPS and GRACE. J. Geophys. Res. Solid Earth 2005, 110. [Google Scholar] [CrossRef]
  6. Tregoning, P.; Watson, C.; Ramillien, G.; McQueen, H.; Zhang, J. Detecting Hydrologic Deformation Using GRACE and GPS: Hydrologic Deformation from Space. Geophys. Res. Lett. 2009, 36. [Google Scholar] [CrossRef]
  7. Nahmani, S.; Bock, O.; Bouin, M.-N.; Santamaría-Gómez, A.; Boy, J.-P.; Collilieux, X.; Métivier, L.; Panet, I.; Genthon, P.; de Linage, C.; et al. Hydrological Deformation Induced by the West African Monsoon: Comparison of GPS, GRACE and Loading Models: Hydrological Deformation in West Africa. J. Geophys. Res. Solid Earth 2012, 117. [Google Scholar] [CrossRef]
  8. Fu, Y.; Freymueller, J.T.; Jensen, T. Seasonal Hydrological Loading in Southern Alaska Observed by GPS and GRACE. Geophys. Res. Lett. 2012, 39. [Google Scholar] [CrossRef]
  9. Fritsche, M.; Döll, P.; Dietrich, R. Global-Scale Validation of Model-Based Load Deformation of the Earth’s Crust from Continental Watermass and Atmospheric Pressure Variations Using GPS. J. Geodyn. Mass Transp. Mass Distrib. Syst. Earth 2012, 59–60, 133–142. [Google Scholar] [CrossRef]
  10. Doll, P.; Kaspar, F.; Bernhard, L. A global hydrological model for deriving water availability indicators: Model tuning and validation. J. Hydrol. 2003, 270, 105–134. [Google Scholar] [CrossRef]
  11. Sauveur, R.; Tabibi, S.; Francis, O. Hydrological Loading in GNSS Vertical Coordinate Time Series on the Island of Haiti. Pure Appl. Geophys. 2024, 181, 3591–3604. [Google Scholar] [CrossRef]
  12. Wu, X.; Heflin, M.B.; Ivins, E.R.; Argus, D.F.; Webb, F.H. Large-Scale Global Surface Mass Variations Inferred from GPS Measurements of Load-Induced Deformation. Geophys. Res. Lett. 2003, 30. [Google Scholar] [CrossRef]
  13. Ferreira, V.; Ndehedehe, C.E.; Montecino, H.C.; Yong, B.; Yuan, P.; Abdalla, A.; Mohammed, A.S. Prospects for Imaging Terrestrial Water Storage in South America Using Daily GPS Observations. Remote Sens. 2019, 11, 679. [Google Scholar] [CrossRef]
  14. Argus, D.F.; Fu, Y.; Landerer, F.W. Seasonal Variation in Total Water Storage in California Inferred from GPS Observations of Vertical Land Motion. Argus. Geophys. Res. Lett. 2014, 41, 1971–1980. [Google Scholar] [CrossRef]
  15. Adusumilli, S.; Borsa, A.A.; Fish, M.A.; McMillan, H.K.; Silverii, F. A Decade of Water Storage Changes Across the Contiguous United States from GPS and Satellite Gravity. Geophys. Res. Lett. 2019, 46, 13006–13015. [Google Scholar] [CrossRef]
  16. Milliner, C.; Materna, K.; Bürgmann, R.; Fu, Y.; Moore, A.W.; Bekaert, D.; Adhikari, S.; Argus, D.F. Tracking the Weight of Hurricane Harvey’s Stormwater Using GPS Data. Sci. Adv. 2018, 4, 2477. [Google Scholar] [CrossRef]
  17. Tarantola, A. Inverse Problem Theory and Methods for Model Parameter Estimation. 2005. Available online: https://epubs.siam.org/doi/book/10.1137/1.9780898717921 (accessed on 13 August 2025).
  18. Aster, R.C.; Borchers, B.; Thurber, C.H. Rank Deficiency and Ill-Conditioning. In Parameter Estimation and Inverse Problems; Elsevier: Amsterdam, The Netherlands, 2019; pp. 55–91. [Google Scholar] [CrossRef]
  19. Menke, W. Geophysical Data Analysis: Discrete Inverse Theory, 4th ed.; Elsevier Ltd.: London, UK, 2018. [Google Scholar]
  20. Tikhonov, N.; Goncharsky, A.; Stepanov, V.V.; Yagola, A.G. Numerical Methods for the Solution of Ill-Posed Problems; Springer Science & Business Media: Berlin/Heidelberg, Germany, 1995. [Google Scholar]
  21. Fu, Y.; Argus, D.F.; Landerer, F.W. GPS as an Independent Measurement to Estimate Terrestrial Water Storage Variations in Washington and Oregon. J. Geophys. Res. Solid Earth 2015, 120, 552–566. [Google Scholar] [CrossRef]
  22. Fok, H.S.; Liu, Y. An Improved GPS-Inferred Seasonal Terrestrial Water Storage Using Terrain-Corrected Vertical Crustal Displacements Constrained by GRACE. Remote Sens. 2019, 11, 1433. [Google Scholar] [CrossRef]
  23. Young, Z.M.; Kreemer, C.; Blewitt, G. GPS Constraints on Drought-Induced Groundwater Loss Around Great Salt Lake, Utah, with Implications for Seismicity Modulation. J. Geophys. Res. Solid Earth 2021, 126, 022020. [Google Scholar] [CrossRef]
  24. Jiang, Z.; Hsu, Y.-J.; Yuan, L.; Huang, D. Monitoring Time-Varying Terrestrial Water Storage Changes Using Daily GNSS Measurements in Yunnan, Southwest China. Remote Sens. Environ. 2021, 254, 112249. [Google Scholar] [CrossRef]
  25. Hsu, Y.-J.; Fu, Y.; Bürgmann, R.; Hsu, S.-Y.; Lin, C.-C.; Tang, C.-H.; Wu, Y.-M. Assessing Seasonal and Interannual Water Storage Variations in Taiwan Using Geodetic and Hydrological Data. Earth Planet. Sci. Lett. 2020, 550, 116532. [Google Scholar] [CrossRef]
  26. Enzminger, T.L.; Small, E.E.; Borsa, A.A. Accuracy of Snow Water Equivalent Estimated from GPS Vertical Displacements: A Synthetic Loading Case Study for Western U.S. Mt. Water Resour. Res. 2018, 54, 581–599. [Google Scholar] [CrossRef]
  27. Borsa, A.A.; Agnew, D.C.; Cayan, D.R. Ongoing Drought-Induced Uplift in the Western United States. Science 2014, 345, 1587–1590. [Google Scholar] [CrossRef]
  28. Lai, Y.R.; Wang, L.; Bevis, M.; Fok, H.S.; Alanazi, A. Truncated Singular Value Decomposition Regularization for Estimating Terrestrial Water Storage Changes Using GPS: A Case Study over Taiwan. Remote Sens. 2020, 12, 3861. [Google Scholar] [CrossRef]
  29. Bo, Z.; XianPao, L.I.; JianCheng, L.I.; HaiHong, W.; Jian, D. Inversion of regional terrestrial water storage changes using GPS vertical displacements based on TSVD-Tikhonov regularization method. Chin. J. Geophys. Chin. 2023, 66, 997–1014. [Google Scholar] [CrossRef]
  30. Li, X.; Zhong, B.; Li, J.; Liu, R. Inversion of terrestrial water storage changes from GNSS vertical displacements using a priori constraint: A case study of the Yunnan Province. China J. Hydrol. 2023, 617, 129126. [Google Scholar] [CrossRef]
  31. Krarup, T. A Contribution to the Mathematical Foundation of Physical Geodesy. Geod Inst Cph. 1969, 44, 80. Available online: https://ui.adsabs.harvard.edu/abs/1969MeGIC..44.....K (accessed on 13 August 2025).
  32. El-Fiky, G.S.; Kato, T.; Fujii, Y. Distribution of Vertical Crustal Movement Rates in the Tohoku District, Japan, Predicted by Least-Squares Collocation. J. Geod. 1997, 71, 432–442. [Google Scholar] [CrossRef]
  33. Vergos, G.S.; Tziavos, I.N.; Andritsanos, V.D. On the Determination of Marine Geoid Models by Least-Squares Collocation and Spectral Methods Using Heterogeneous Data. In A Window on the Future of Geodesy; Sansò, F., Ed.; International Association of Geodesy Symposia: Berlin/Heidelberg, Germany, 2005; pp. 332–337. [Google Scholar] [CrossRef]
  34. Mikhail, E.M.; Ackermann, F.E. Observations and least squares. In The IEP Series in Civil Engineering; IEP: New York, NY, USA, 1976. [Google Scholar]
  35. Collier, P.A.; Argeseanu, V.S.; Leahy, F.J. Distortion Modelling and the Transition to GDA94. Aust. Surv. 1998, 43, 29–40. [Google Scholar] [CrossRef]
  36. Moritz, H. Advanced Physical Geodesy; Abacus Press: New York, NY, USA, 1980. [Google Scholar]
  37. Goovaerts, P. Geostatistics for Natural Resources Evaluation; Oxford University Press: New York, NY, USA; Oxford, UK, 1997. [Google Scholar]
  38. Francis, O. Introduction aux Problèmes Inverses, Observatoire, (tech. rep., 1991). Available online: https://www.academia.edu/120080324/Introduction_aux_Probl%C3%A8mes_Inverses (accessed on 13 August 2025).
  39. Moritz, H. Covariance Functions—School of Earth Sciences. 1976. Available online: https://geology.osu.edu/sites/earthsciences.osu.edu/files/report-240.pdf (accessed on 13 August 2025).
  40. Duquenne, H.; Everaerts, M.; Lambot, P. Merging a Gravimetric Model of the Geoid with GPS/Levelling data: An Example in Belgium. In Gravity, Geoid and Space Missions; Jekeli, C., Bastos, L., Fernandes, J., Eds.; Springer: Berlin, Germany, 2005; pp. 131–136. [Google Scholar]
  41. Shaw, L.; Paul, I.; Henrikson, P. Statistical models for the vertical deflection from gravity-anomaly models. J. Geophys. Res. 1969, 74, 4259–4265. [Google Scholar] [CrossRef]
  42. Farrell, W.E. Deformation of the Earth by Surface Loads. Rev. Geophys. 1972, 10, 761. [Google Scholar] [CrossRef]
  43. Gneiting, T.; Kleiber, W.; Schlather, M. Matérn Cross-Covariance Functions for Multivariate Random Fields. J. Am. Stat. Assoc. 2010, 11, 1167–1177. [Google Scholar] [CrossRef]
  44. Tabibi, S.; Sauveur, R.; Guerrier, K.; Metayer, G.; Francis, O. SNR-Based GNSS-R for Coastal Sea-Level Altimetry. Geosciences 2021, 11, 391. [Google Scholar] [CrossRef]
  45. Sauveur, R. Estimating Terrestrial Water Storage Variations from GNSS Vertical Displacements in the Island of Haiti. Ph.D. Thesis, Unilu—University of Luxembourg, Luxembourg, 2023. Available online: https://orbilu.uni.lu/handle/10993/55102 (accessed on 13 August 2025).
  46. van Dam, T.; Wahr, J.; Milly, P.C.D.; Shmakin, A.B. Crustal Displacements Due to Continental Water Loading. Geophys. Res. Lett. 2001, 28, 651–654. [Google Scholar] [CrossRef]
  47. Yin, G.; Forman, B.A.; Loomis, B.D.; Luthcke, S.B. Comparison of Vertical Surface Deformation Estimates Derived From Space-Based Gravimetry, Ground-Based GPS, and Model-Based Hydrologic Loading Over Snow-Dominated Watersheds in the United States. J. Geophys. Res. Solid Earth 2020, 125, e2020JB019432. [Google Scholar] [CrossRef]
  48. Tarantola, A.; Valette, B. Generalized Nonlinear Inverse Problems Solved Using the Least Squares Criterion. Rev. Geophys. 1982, 20, 219. [Google Scholar] [CrossRef]
  49. Mosegaard, K.; Tarantola, A. Probabilistic Approach to Inverse Problems. In International Geophysics; Academic Press: Cambridge, MA, USA, 2002. [Google Scholar]
  50. Van Camp, M.; Vauterin, P. Tsoft: Graphical and interactive software for the analysis of time series and Earth tides. Comput. Geosci. 2005, 31, 631–640. [Google Scholar] [CrossRef]
  51. Herring, T.A.; King, R.W.; Floyd, M.A.; McClusky, S.C. Introduction to GAMIT/GLOBK, Release 10.7. Massachusetts Institute of Technology, Department of Earth, Atmospheric and Planetary Sciences, Technical Report, 2018. Available online: http://geoweb.mit.edu/gg/Intro_GG.pdf (accessed on 13 August 2025).
  52. Rodell, M.; Houser, P.R.; Jambor, U.; Gottschalck, J.; Mitchell, K.; Meng, C.-J.; Arsenault, K.; Cosgrove, B.; Radakovich, J.; Bosilovich, M.; et al. The Global Land Data Assimilation System. Bull. Am. Meteorol. Soc. 2004, 85, 381–394. [Google Scholar] [CrossRef]
  53. Wessel, P.; Luis, J.F.; Uieda, L.; Scharroo, R.; Wobbe, F.; Smith, W.H.F.; Tian, D. The Generic Mapping Tools version 6. Geochem. Geophys. Geosyst. 2019, 20, 5556–5564. [Google Scholar] [CrossRef]
Figure 1. Singular values of the design matrix for the forward problem (black dots) and the best-fitting exponential function (red line) (left panel). Histogram of fitting residuals for the exponential decay (right panel).
Geosciences 15 00322 g001
Figure 2. Covariance models with unit value [38,39,40,41].
Geosciences 15 00322 g002
Figure 3. Monthly mean GLDAS/NOAH data for the period 2010–2019 over the island of Haiti.
Geosciences 15 00322 g003
Figure 4. Location of 282 synthetic GNSS stations (red dots) across the island used for covariance function determination.
Geosciences 15 00322 g004
Figure 5. Input data interpolated from the monthly mean in Figure 1 (left panel) and inverted solution using 282 simulated stations (right panel).
Geosciences 15 00322 g005
Figure 6. Empirical (blue line) and analytical (red line) covariance functions for GLDAS (top panel) and for simulated vertical displacement (middle panel), and empirical and analytical cross-covariance functions between GLDAS and simulated vertical displacement (bottom panel).
Geosciences 15 00322 g006
Figure 7. Distribution of GNSS stations across the island of Haiti (red dots), with the Digital Elevation Model (DEM) in the background.
Geosciences 15 00322 g007
Figure 8. GNSS data availability on the island. Overview of the amount of GNSS observations for each station, with red lines indicating the period in which observations are available.
Geosciences 15 00322 g008
Figure 9. Example of the inverse solution as a function of the number of simulated GNSS stations. The left column (from (top) to (bottom)) shows results for station sets of 1, 10, and 20. The right column (from (top) to (bottom)) shows results for station sets of 60, 100, and 200.
Geosciences 15 00322 g009
Figure 10. Correlation coefficient for each synthetic station set (a), reduction coefficient for each synthetic station set (b), and RMSE for each synthetic station set (c).
Geosciences 15 00322 g010
Figure 11. Example of the standard deviation of the inversion solutions for each station set. The left column (from (top) to (bottom)) shows results for station sets of 1, 10, and 20. The right column (from (top) to (bottom)) shows results for station sets of 60, 100, and 200.
Geosciences 15 00322 g011
Figure 12. Location of the stations used for the robustness and stability tests. Black stations are affected by a relative error of 20 percent, and red stations by a 100 percent error.
Geosciences 15 00322 g012
Figure 13. Results of the stability test showing the inversion solution as a function of the relative magnitude of error in the data. The top-left figure represents the solution with a 1/1 error magnitude, the top-right figure with a 1/3 error magnitude, the bottom-left figure with a 1/6 error magnitude, and the bottom-right figure with a 1/9 error magnitude.
Geosciences 15 00322 g013
Figure 14. Robustness test. The left panel displays the inversion results, while the right panel shows the standard deviation of the solution. The top panel represents the results for three stations (red dot in Figure 12) where the error is 100 times the simulated vertical displacement, and for 157 stations (black dots in Figure 12) where the error is one-fifth of the simulated vertical displacement. The bottom panel illustrates the case for all 160 stations, where the error is one-fifth of the simulated vertical displacement.
Geosciences 15 00322 g014
Figure 15. GLDAS initial grid (left column), inversion solution (middle column), and standard deviation of the inversion (right column) for April 2019 (first row), April 2020 (second row), and April 2021 (third row).
Geosciences 15 00322 g015
Figure 16. Correlation coefficient (left panel), reduction (middle panel), and RMSE (right panel) monthly results for the year 2019.
Geosciences 15 00322 g016
Figure 17. Example of arbitrarily chosen dates illustrating the number of daily operational stations. The top-left panel shows that stations JME2, CN05, and CRLR were not operational on 1 January 2012. The top-right panel shows that these same stations were also not operational on 1 January 2013. The middle-left panel indicates that station JME2 was operational on 1 January 2014, but CN05 and CRLR were not. The middle-right panel shows that stations JME2 and CN05 were operational on 1 January 2015, while CRLR was not. The bottom-left panel illustrates that stations CRLR and CN05 were operational on 1 January 2016, but JME2 was not. Finally, the bottom-right panel shows that stations JME2, CRLR, and CN05 were operational on 1 August 2016.
Geosciences 15 00322 g017
Figure 18. Temporal inversion results at cell 15 (red) and daily GNSS observation at station JME2 (blue).
Geosciences 15 00322 g018
Figure 19. Temporal inversion results at cell 25 (first row) and daily GNSS observation at stations CN05 and CRLR (second and third rows).
Geosciences 15 00322 g019
Table 1. List of covariance functions.
Covariance Models
NameFunctionReference
Gaussian C o e r 2 2 α 2 [38]
Hirvonen C o 1 + α 2   r 2 2 [39]
Exponential C o e ( r l n 2 α ) [40]
Exponential C o e r α [41]
Table 2. RMSE, reduction and correlation annual mean for Gaussian, Exponentials, and Hirvonen covariance functions.
RMSE (kg/m2)Reduction (%)Correlation
Gauss [38]116.575.50.06
Exponential [41]104.9177.90.078
Exponential (ln2) [40]121.4874.60.089
Hirvonen [39]223.1053.870.15
Table 3. Summary of the stability test results.
Error (Fraction svd)Max Difference (kg/m2)Min Difference (kg/m2)RMSE (kg/m2)Correlation (%)Reduction (%)
1/1149−1214875.2691
1/3131−1014281.992
1/6117−993983.7693
1/9112−97388493
Table 4. Summary of the robustness test results.
Error (Fraction svd)Max Difference (kg/m2)Min Difference (kg/m2)RMSE (kg/m2)Correlation (%)Reduction (%)
100120−96408393
1/5120−100408392
Disclaimer/Publisher’s Note: The statements, opinions and data contained in all publications are solely those of the individual author(s) and contributor(s) and not of MDPI and/or the editor(s). MDPI and/or the editor(s) disclaim responsibility for any injury to people or property resulting from any ideas, methods, instructions or products referred to in the content.