Article

A Sediment Provenance Study of Middle Jurassic to Cretaceous Strata in the Eastern Sverdrup Basin: Implications for the Exhumation of the Northeastern Canadian-Greenlandic Shield

1
CASP, West Building, Madingley Rise, Madingley Road, Cambridge CB3 0UD, UK
2
Halliburton, 97 Jubilee Avenue, Milton Park, Abingdon OX14 4RW, UK
3
Stratum Reservoir, Nikkelveien 13, 4313 Sandnes, Norway
4
Department of Geology and Geophysics, University of Aberdeen, Aberdeen AB24 3UE, UK
5
Departamento de Biología y Geología, Física y Química Inorgánica, Universidad Rey Juan Carlos, Campus de Móstoles, Calle Tulipán, Móstoles, 28933 Madrid, Spain
6
Department of Geology, School of Natural Sciences, Trinity College Dublin, College Green, D02 PN40 Dublin, Ireland
7
Department of Earth Sciences, University of the Western Cape, Private Bag X17, Cape Town 7530, South Africa
*
Author to whom correspondence should be addressed.
Deceased.
Geosciences 2025, 15(8), 313; https://doi.org/10.3390/geosciences15080313 (registering DOI)
Submission received: 21 May 2025 / Revised: 1 July 2025 / Accepted: 9 July 2025 / Published: 12 August 2025

Abstract

The Sverdrup Basin, Arctic Canada, is ideally situated to contain an archive of tectono-magmatic and climatic events that occurred within the wider Arctic region, including the exhumation of the adjacent (northeastern) part of the Canadian-Greenlandic Shield. To test this, a multi-analytical provenance study of Middle Jurassic to Cretaceous sandstones from the eastern Sverdrup Basin was undertaken. Most of the samples analysed were recycled from sedimentary rocks of the Franklinian Basin, with possible additional contributions from the Mesoproterozoic Bylot basins and metasedimentary shield rocks. The amount of high-grade metamorphic detritus in samples from central Ellesmere Island increased from Middle Jurassic times. This is interpreted to reflect exhumation of the area to the southeast/east of the Sverdrup Basin. Exhumation may have its origins in Middle Jurassic extension and uplift along the northwest Sverdrup Basin margin. Rift-flank uplift along the Canadian–West Greenland conjugate margin and lithospheric doming linked with the proximity of the Iceland hotspot and/or the emplacement of the Cretaceous High Arctic Large Igneous Province may have contributed to exhumation subsequently. The southeast-to-northwest thickening of Jurassic to Early Cretaceous strata across the Sverdrup Basin may be a distal effect of exhumation rather than rifting in the Sverdrup or Amerasia basins.

1. Introduction

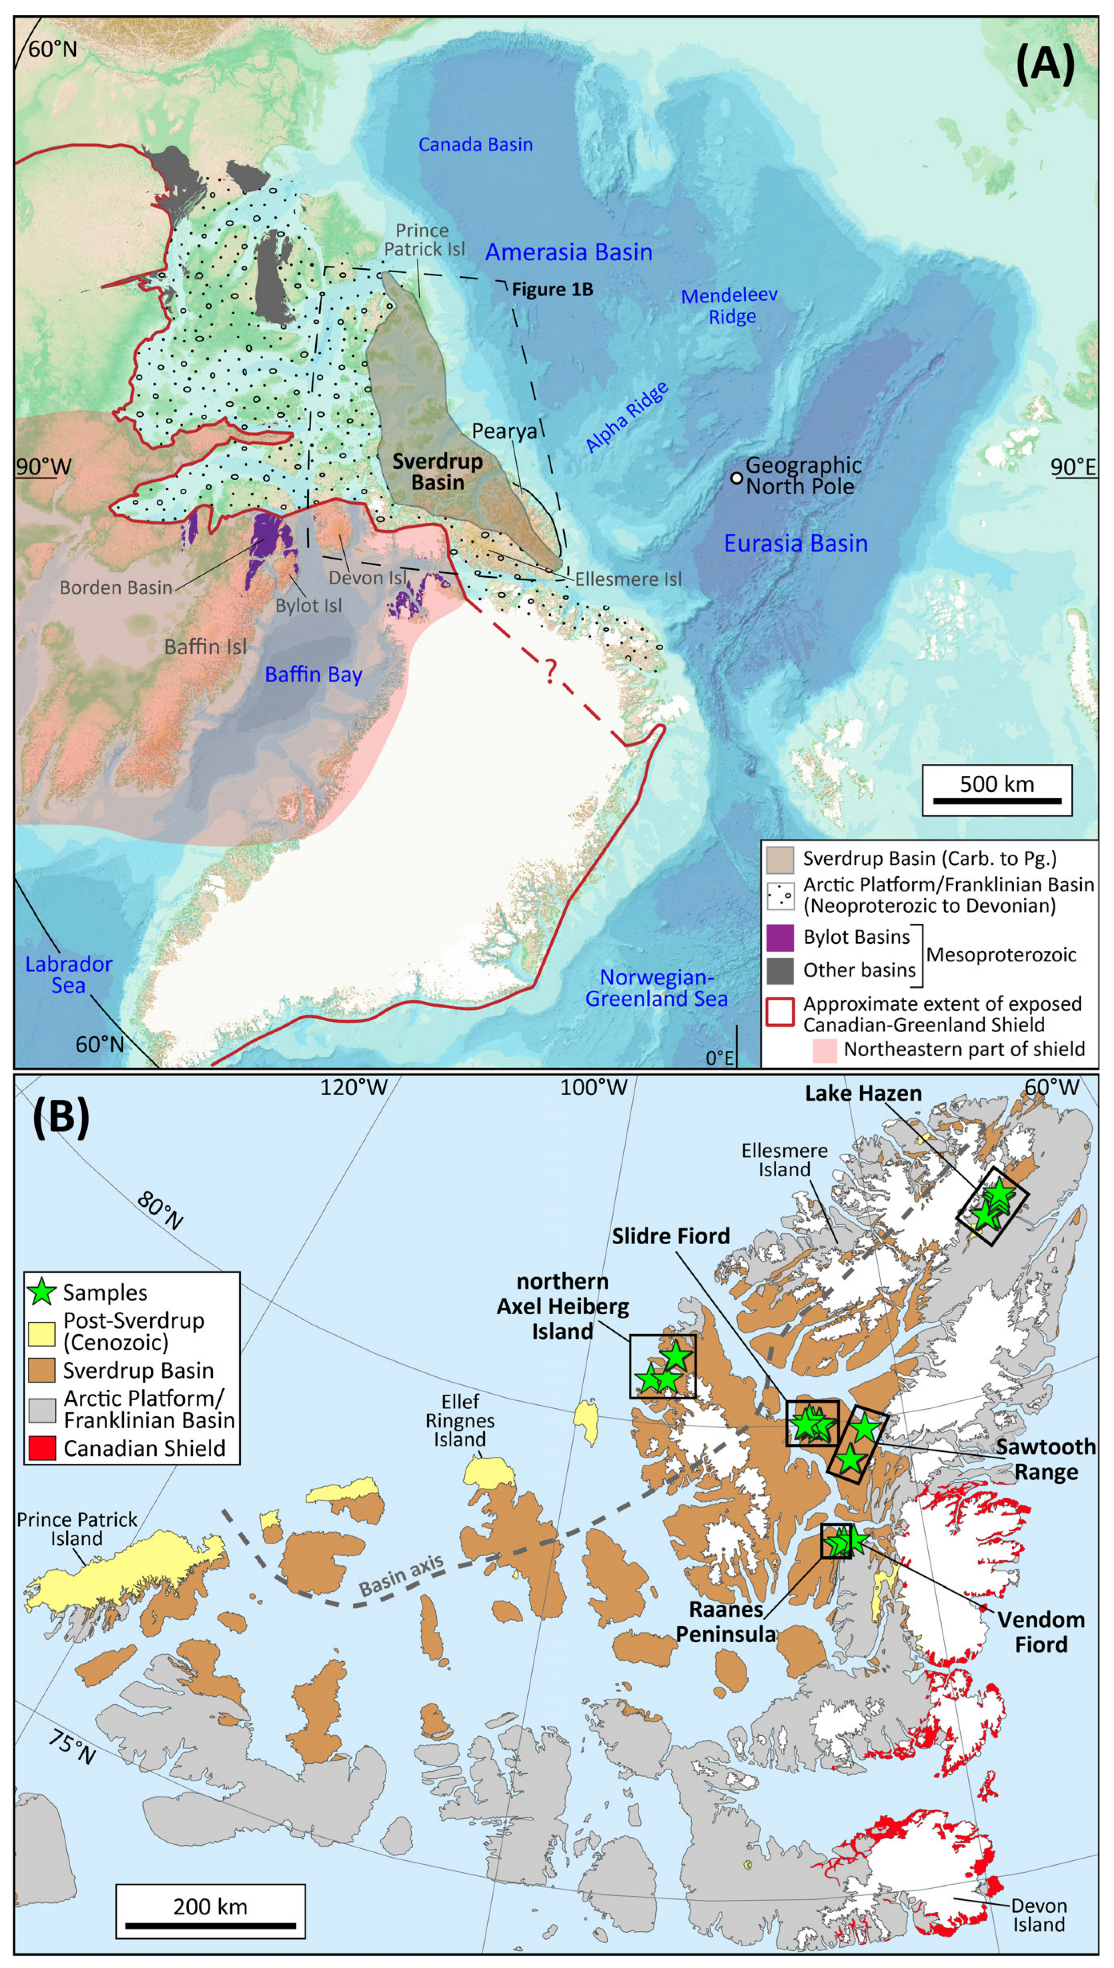
Today, large parts of the highly deformed and metamorphosed northeastern Canadian-Greenlandic Shield are exposed at surface level (Figure 1A). How and when these rocks were unearthed is poorly constrained. On Baffin Island and several small islands near its southeastern coast, as well as on Bylot Island (Figure 1A), Aptian–Albian sedimentary rocks overlie the shield, demonstrating that it was exposed by this time [1,2,3,4]. Neoproterozoic to Silurian strata of the Arctic Platform/Franklinian Basin overlie shield rocks elsewhere on Baffin Island, as well as on southern Ellesmere Island, Devon Island, the Canadian mainland and West Greenland (e.g., [5]). The lack of intervening sedimentary cover makes reconstructing the exhumation history of the northeastern Canadian-Greenlandic Shield during a large part of Paleozoic and Mesozoic times extremely difficult. Detrital apatite and zircon (U–Th–Sm)/He ages from Devonian strata of the Franklinian Basin were tentatively interpreted to record protracted exhumation from Carboniferous to Cretaceous times [6]. Several thermochronology studies utilising apatite fission track analysis and (U–Th–Sm)/He geochronology have been undertaken on southern Ellesmere Island, Baffin Island and northwest Greenland to investigate exhumation (e.g., [7,8,9,10,11]). However, a difficulty of long-timescale thermal-history analysis is the non-uniqueness in modelled thermal histories that depend on diffusion-based observations [9], which compromises interpretations. Computed exhumation models vary from those that infer continuous protracted exhumation through Phanerozoic times (e.g., [10]) to more complex models involving recurrent burial and exhumation (e.g., [9,11]).
It is long established that the sedimentary fill of a basin provides an archive of tectonic, magmatic and climatic events within the surrounding sediment source areas (e.g., [12,13,14] and references therein). The Sverdrup Basin of the Canadian Arctic Islands (Figure 1) is well situated to have captured an expression of the exhumation history of the northeastern Canadian-Greenlandic Shield, as well as wider Arctic tectonic, magmatic and climatic events. The basin contains Early Carboniferous to Paleogene strata (e.g., [15]) and thus spans the missing time interval in the exhumation history of the adjacent shield area. Previous research based on facies trends and palaeocurrent vectors has shown that the Sverdrup Basin received sedimentary detritus from two main directions: (1) from the north/northeast and (2) from the southeast/east (present-day directions; e.g., [15,16]). Sediment was supplied from the southeast/east throughout much of the basin’s lifespan, whereas sediment from the north and/or northeast was delivered more intermittently, from Middle Permian times onwards [16,17]. A number of sediment provenance studies have been undertaken within the Sverdrup Basin to characterise both the northern/northeastern and southeastern/eastern sediment source areas. These have largely employed detrital zircon U–Pb geochronology (e.g., [17,18,19,20,21,22,23,24,25]) and whole-rock Nd isotopes [4]. Through the analysis of mostly fine-grained sediments on the southern limb of the Sverdrup Basin, Patchett et al. [4] inferred that, apart from during Carboniferous and Cretaceous times, sediment supplied from the southeast/east was derived from inverted Silurian and Devonian rocks of the Franklinian Basin (Figure 1A). Patchett et al. [4] thus inferred that the northeastern Canadian-Greenlandic Shield was likely covered by Paleozoic sediments until Cretaceous times, with cover units progressively removed during Mesozoic times. Detrital zircons analysed from southeast/east-derived sandstone units yield U–Pb age spectra consistent with the interpretations of Patchett et al. [4]. Carboniferous and Early Cretaceous strata have lower εNd(t) values, which are inferred to reflect the reworking of shield-derived pre-Late Ordovician strata from the Franklinian Basin during the Carboniferous Period and a direct sediment input from shield rocks during the Cretaceous Period [4].
Figure 1. (A) Overview map of the Arctic region. The base map is the International Bathymetric Chart of the Arctic Ocean (IBCAO, version 4; [26]). The Bylot basins are drawn following Jackson and Iannelli [27]. Isl = island; the Borden Basin comprises one of the Bylot basins. Carb = Carboniferous; Pg = Paleogene. (B) Map of the Sverdrup Basin showing the locations of samples analysed. The basin axis is redrawn from Embry and Beauchamp [15]. In both figures, the geology is simplified from Harrison et al. [5].
Geosciences 15 00313 g001
Whilst the analysis of shales and detrital zircons has yielded important inferences, a greater understanding of sediment provenance can be gained by employing additional analytical techniques. Pointon et al. [28] recently presented a multi-proxy sediment provenance study of Carboniferous to Middle Jurassic strata from the eastern Sverdrup Basin. As part of their study, they combined optical petrographic and conventional heavy mineral analysis, as well as single-grain geochemistry (apatite, garnet and rutile) and detrital zircon U–Pb geochronology to refine sediment provenance models. The aim of this study is to apply the same multi-analytical workflow to the Middle Jurassic to Cretaceous strata of the eastern Sverdrup Basin. New data are integrated with existing whole-rock Nd isotope [4] and detrital zircon U–Pb geochronology data [23,24] to refine sediment provenance interpretations. The new multi-analytical dataset is also combined with that of Pointon et al. [28] to explore for evidence of exhumation in the southeastern/eastern source area. Where exhumation is inferred, the possible underlying causes of exhumation are discussed.

2. Geological Background

The oldest rocks in the vicinity of the Sverdrup Basin are Archean to Paleoproterozoic, deformed and metamorphosed up to granulite facies, metasedimentary and metaigneous rocks of the Canadian-Greenlandic Shield (Figure 1; [29,30,31,32]). These are overlain by a series of intracratonic basins that span from the western Cordillera to East Greenland and contain unmetamorphosed Mesoproterozoic fluvial to shallow marine sedimentary strata [27,33,34]. The basins proximal to the southeast margin of the Sverdrup Basin are thought to be broadly coeval and to share similar geological histories. Therefore, they have been collectively termed the Bylot basins (Figure 1A; [34,35]).
From late Neoproterozoic to Late Devonian times, a thick succession of sedimentary rocks was deposited on the northern margin of Laurentia (Franklinian Basin/Margin succession; Figure 1; [36,37,38,39,40,41]). The lower part of the succession comprises passive margin Neoproterozoic to Ordovician mixed siliciclastic and carbonate shelfal to basinal sediments [38,40,42,43,44]. Siliciclastic strata within this stratigraphic package were derived primarily from the Canadian-Greenlandic Shield [38,42,45]. During Silurian times, the Franklinian Basin received substantial volumes of turbidites sourced from the Caledonian orogenic belt [38,45,46]. By Middle Devonian times, the Franklinian Basin had transitioned into a foreland basin and received fluvial to deltaic sediments, which are often termed the Devonian clastic wedge (e.g., [36,41,47,48,49]). The origin of the foreland basin has been linked to mid-Devonian collisional events that culminated in the Late Devonian to Early Carboniferous Ellesmerian Orogeny [38,39]. Initially, sediments of the Devonian clastic wedge were derived mostly from the East Greenland Caledonides, Pearya and the Ellesmerian orogenic belt; the last area ultimately dominated sediment supply [38,39,48]. Following orogenic collapse and rifting during the Early Carboniferous, sedimentation within the successor Sverdrup Basin commenced (e.g., [15]).

Sverdrup Basin

The Sverdrup Basin covers an area of ~300,000 km2 and contains a Carboniferous to Eocene sedimentary succession of 13–15 km estimated thickness (Figure 1B; [15,29]). It is most widely viewed as an intracratonic basin that was dominated by passive thermal subsidence from Middle Permian until Late Jurassic or Early Cretaceous times and then experienced active rifting and extension until the end of the Albian [15,16,50,51]. Other workers have inferred a short episode of active rifting during Early Triassic times [52] and that rifting started and ended earlier, lasting from Early Jurassic until Valanginian times [53]. Salt tectonics add further complexity: the basin experienced passive salt diapirism from at least Triassic times [52,54,55,56]. During Middle Jurassic times, the southwestern margin of the basin experienced rifting, manifested as normal faulting and the development of narrow rift sub-basins in the Prince Patrick Island area (Figure 1B; [15,57,58]). Following the cessation of Early Cretaceous rifting within the Sverdrup Basin, a passive thermal subsidence regime prevailed until the latest Cretaceous to the early Paleocene when compressional tectonics related to the Eurekan Orogeny began to affect sedimentation patterns [15,59]. Eurekan deformation climaxed during the Eocene and marked the end of sedimentation within the Sverdrup Basin [15,60].
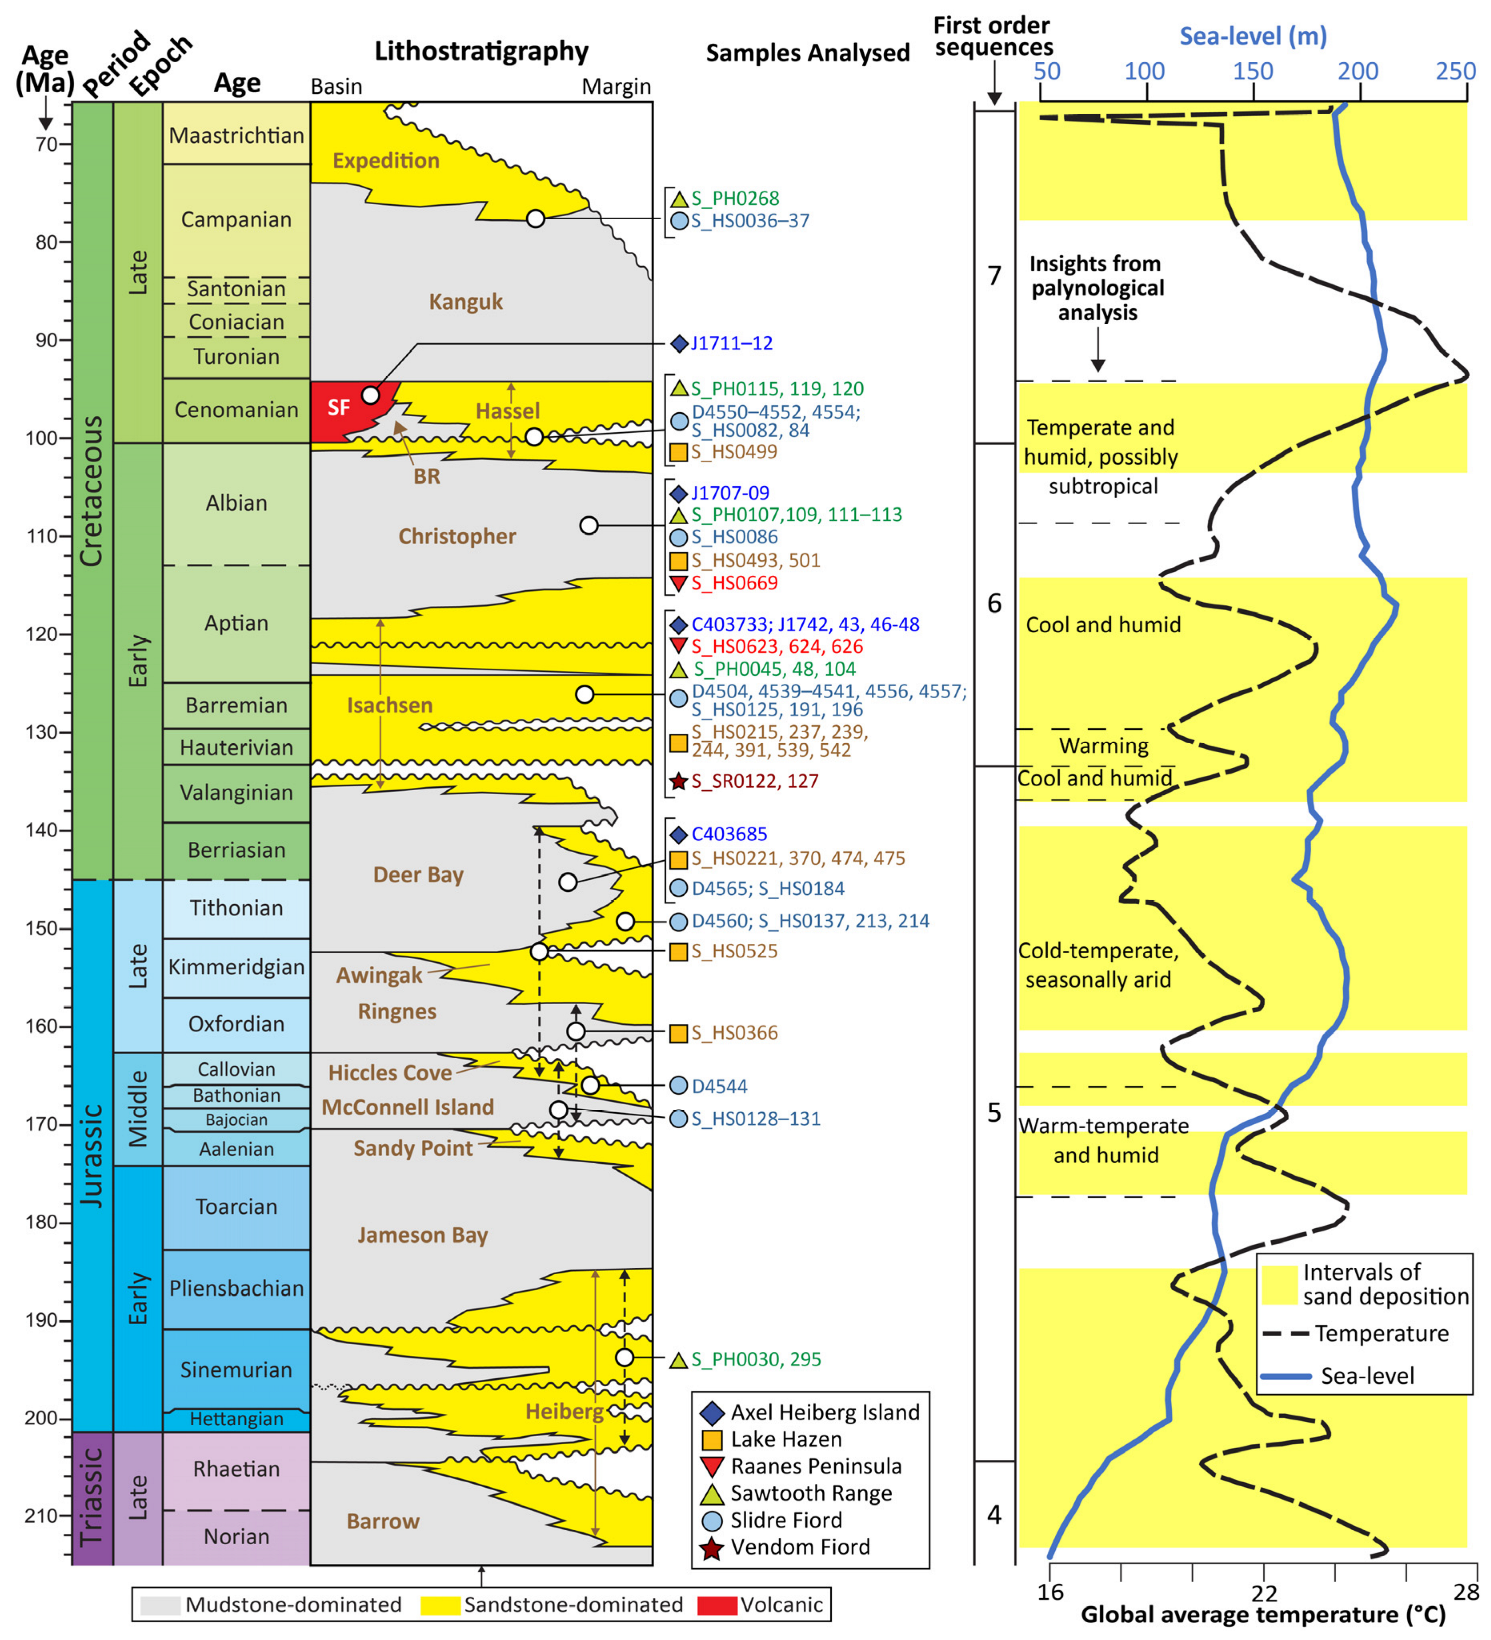
The Sverdrup Basin drifted progressively northwards during Mesozoic times, from around 50–60° N at the start of the Early Jurassic, to 60–70° N by Middle Jurassic times, and then to >70° N by the Early Cretaceous [61,62,63]. As a consequence, the basin’s climate evolved from a wet subtropical one during the Early Jurassic to a more temperate one by Middle Jurassic times [16]. The Late Jurassic to Early Cretaceous world was warm and largely ice-free (e.g., [64,65,66]). However, the presence of dropstones and glendonite-bearing horizons within the Awingak, Deer Bay and Christopher formations (Figure 2; [16,67,68,69,70]) indicates the intermittent presence of seasonal sea ice during climatic cold snaps, and attests to the high latitude of the Sverdrup Basin by this time. The analysis of fossil spore and pollen assemblages has provided additional insight into local Middle Jurassic and Cretaceous climate (Figure 2; [63,71,72,73,74]).
From Jurassic to Paleogene times, sedimentation within the basin was almost exclusively of siliciclastic composition (e.g., [15,16]). The basin margins are characterised by a series of fluvio-deltaic or marine shelfal sand-dominated units that prograded into the basin to varying extents (upper Heiberg Formation through to lower Expedition Formation; sandstone-dominated formations in Figure 2). Meanwhile sedimentation in the basin centre was mud-dominated (Jameson Bay to Kanguk formations; Figure 2).
Apart from several volcanic ash beds that occur interbedded within Triassic strata on northwest Axel Heiberg Island [19,20], records of Triassic to Jurassic magmatism within the Sverdrup Basin are sparse. The basin was more volcanically active from Hauterivian times onwards, as manifest by intermittent tholeiitic and alkaline magmatism, which forms part of the widespread High Arctic Large Igneous Province (HALIP; e.g., [75,76,77,78,79,80,81,82,83]). This includes mafic volcanic and volcaniclastic rocks in the Isachsen, Christopher and Hassel formations, continental flood basalts of the Strand Fiord Formation and numerous felsic altered volcanic ash layers (bentonites) within the Kanguk Formation (Figure 2; e.g., [29,75,77,78,80,84,85,86,87,88,89,90,91]). Several bentonites have also been reported from the Paleocene and younger Eureka Sound Group, which postdate HALIP magmatism and are possibly related to the opening of Baffin Bay, the North Atlantic and/or the Eurasian Basin [92].
Figure 2. Late Triassic to Late Cretaceous lithostratigraphic framework of the eastern Sverdrup Basin shown against global average temperatures [93] and global sea level [94]. The lithostratigraphic framework is redrawn and modified from Hadlari [95] using information from Embry [16,96] and Embry and Beauchamp [15]. Numerical ages are from Cohen et al. [97]. First-order sequences are from Embry and Beauchamp [15]. Sample stratigraphic positions are known to formation level, apart from the following which have more uncertain lithostratigraphic assignments: S_HS0128–0131 (Wilkie Point Group), D4544 (probable Hiccles Cove Formation), S_HS0525 (Hiccles Cove or Awingak Formation) and S_HS0366 (McConnell Island or Ringnes Formation). Note that the boundary between the Kanguk and Expedition formations is transitional [59,98]; consequently, samples S_PH0268, S_HS0036 and S_HS0037 could be from the upper Kanguk or lower Expedition Formation. Climatic inferences derived from palynological analysis are drawn from Galloway et al. [63,72,99], Hopkins Jr and Balkwill [73], Nguyen et al. [71] and Sulphur [74]. BR = Bastion Ridge Formation; SF = Strand Fiord Formation.
Geosciences 15 00313 g002

3. Materials and Methods

3.1. Samples

Seventy-five Middle Jurassic to Cretaceous samples were analysed (Figure 2). The samples are predominantly sandstones, together with a few siltstones and conglomerates (Table S1). They were collected from six main areas of the basin: (1) northern Axel Heiberg Island, (2) the Lake Hazen area, (3) Slidre Fiord, (4) the Sawtooth Range, (5) the Raanes Peninsula and (6) Vendom Fiord (Figure 1B). Samples from Axel Heiberg Island are from the northern limb of the basin; all other samples are from the inferred axial region or the southern limb (Figure 1B). The samples were collected by CASP researchers across several field seasons between 2007 and 2013. This is apart from samples with C3740 prefixes, which were collected by Ashton Embry.

3.2. Methods

The samples were investigated using the same multi-analytical workflow as Pointon et al. [28], commencing with optical petrographic analysis and/or conventional heavy mineral analysis, followed by the chemical analysis of apatite, garnet and rutile grains, and then detrital zircon U–Pb geochronology. Detrital zircon Lu–Hf isotope analysis was subsequently undertaken on one sample (C403685). A breakdown of the analyses conducted on each sample is given in the supplementary materials (Table S1); this is also where the analytical data tables can be found (Tables S2–S8). The methods employed are identical to the ones used by Pointon et al. [28]. These are summarised below, much of which has been rephrased from Pointon et al. [28] at the insistence of the journal’s editorial office, to comply with their anti-plagiarism software.

3.2.1. Optical Petrographic Analysis

Samples were thin-sectioned, vacuum-impregnated with blue-dyed epoxy resin, and then etched and stained with hydrofluoric acid and sodium cobaltinitrite to facilitate the identification of alkali feldspars. Samples from northern Axel Heiberg Island and Slidre Fiord were point-counted using the Gazzi–Dickinson method [100]. Conversely, samples from the Lake Hazen area and the Raanes Peninsula were counted using the traditional/Indiana method [101]. Comparing traditional/Indiana point-count data to Gazzi–Dickinson point-count data can be problematic where samples contain coarse-grained polymineralic grains. Such grains are, however, rare in the studied samples, meaning that comparing the two datasets herein does not introduce a significant bias. This is demonstrated quantitatively through the counting of samples from the Sawtooth Range using both methods. Sandstones were classified by reference to the scheme of Pettijohn et al. [102].

3.2.2. Conventional Heavy Mineral Analysis

Heavy minerals were separated, studied and analysed from the very fine sand (63–125 μm) grain size fraction. A narrow grain size range is commonly employed for several reasons, the most crucial of which is to help distinguish changes in provenance from potential grain-size-dependent compositional variations (see [103,104] for more details). The relative abundance of transparent heavy mineral species was estimated from, ideally, a count of 200 grains using the ribbon counting method [105]. Such a count was not always attainable, however, due to poor heavy mineral recovery. ATi (apatite:tourmaline index), GZi (garnet:zircon index), RuZi (rutile:zircon index), MZi (monazite:zircon index) and CZi (chrome spinel:zircon index) provenance-sensitive heavy mineral indices were determined based on Morton and Hallsworth [104]. These were also determined using the ribbon counting method and preferably from a count of 200 grains.

3.2.3. Mineral Grain Chemical Analysis

The trace element chemistry of apatite and rutile grains was determined by laser ablation inductively coupled plasma mass spectrometry (LA-ICPMS) at Cardiff University. Possible source rock lithology groups were assigned based on the work of O’Sullivan et al. [106]. Rutile grains were classified into metapelite and metamafic types following Meinhold et al. [107]. Rutile metamorphic temperatures were estimated using the Zr-in-rutile thermometer calibration of Watson et al. [108]. Electron microprobe analysis was used to ascertain the major element chemistry of garnet grains. Garnet grains were assigned possible host rock types and metamorphic facies from these data using the garnetRF program (version 1.1; [109]).

3.2.4. Detrital Zircon U–Pb Geochronology

The uranium–lead isotopic compositions of detrital zircon grains were determined using the LA-ICPMS and secondary ion mass spectrometry methods. This work was conducted at University College London (UK), Laurentian University (Ontario, Canada), Stellenbosch University (South Africa) and the NORDSIMS facility (Swedish Natural History Museum, Sweden). All analyses are spot analyses. The data collected at Stellenbosch University were corrected for common lead by employing the 204Pb method and the Stacey and Kramers [110] terrestrial lead evolution model. All of the other U–Pb isotopic data are not corrected for common lead. Concordia ages (sensu [111]) were used in the interpretation to avoid arbitrary switching between the 206Pb/238U and 207Pb/206Pb age systems. Concordia ages were calculated using Isoplot (version 4; [112]). Analyses that are more than 10% discordant (at the limit of the two-sigma confidence level uncertainty ellipse) or that have imprecise concordia ages (arbitrarily defined as greater than 10% uncertainty at the two-sigma confidence level) were omitted from the interpretation.

3.2.5. Detrital Zircon Lu–Hf Isotope Analysis

The Lu-Hf isotopic compositions of detrital zircon grains from sample C403685 were determined at the Geochronology and Tracers Facility, British Geological Survey, UK, using the multi-collector LA-ICPMS method. The methodology used closely followed that of Thomas et al. [113]. Thirty-five μm laser spots were positioned on top of previous U–Pb SIMS analyses reported by Omma et al. [23]. Initial 176Hf/177Hf ratios were calculated by employing a 176Lu decay constant of 1.867 × 10⁻¹¹ a−1 [114] and the U–Pb concordia ages of the corresponding SIMS spot analyses. Initial 176Hf/177Hf ratios were expressed as εHf(t) values using 176Hf/177Hf = 0.282785 and 176Lu/177Hf = 0.0336 for the present-day chondritic uniform reservoir (CHUR; [115]). Two analyses have corresponding U–Pb concordia ages that are more than 10% discordant; these analyses are consequently excluded from the interpretation.

4. Results

4.1. Optical Petrographic Analysis

Fifty-one samples were point counted: forty-eight arenites, one wacke (J1708) and two conglomerates (J1711 and J1742; Figure 3). Samples S_HS0525 (Hiccles Cove or Awingak Formation) and S_H0366 (McConnell Island or Ringnes Formation), together with the majority of samples analysed from the Awingak, Deer Bay and Isachsen formations, are very quartz-rich and are classified as quartz arenites or sublitharenites (Figure 3). Feldspar is almost entirely absent from the Lake Hazen sample set, whilst samples from elsewhere in the basin contain little to no plagioclase (Figure 3C). Rock fragments comprise mostly mudstone, chert and quartzite types, in varying proportions.
Samples from the Christopher Formation on Axel Heiberg Island (J1707–09), the Raanes Peninsula (S_HS0669) and from the lower part of the formation in the Sawtooth Range (S_PH0107) are also very quartz-rich (Figure 3). Sample S_PH0109, in contrast, contains abundant chert rock fragments. All of these samples contain only sparse feldspar. Rock fragments are sparse, apart from in sample S_PH0109, and include chert, mudstone and schistose metamorphic types. Samples S_PH0111 to S_PH0113 from the middle part of the Christopher Formation in the Sawtooth Range and sample S_HS0493 from the same formation near Lake Hazen are arkosic arenites (Figure 3A). Plagioclase is comparatively abundant in these samples, as is alkali feldspar (Figure 3C). Rock fragments comprise mainly mudstone and chert types.
Four Hassel Formation samples analysed from a section near Slidre Fiord show decreasing quartz content up-section (D4554, D4550, D4551 and D4552, from lowest to highest; Figure 3B,C). Feldspar comprises almost entirely alkali types (Figure 3C). Rock fragments are mostly chert, mudstone and semipelitic to psammitic types. Three samples from a section in the Sawtooth Range (S_PH0115, S_PH0119 and S_PH0120), in contrast, are all quartz arenites (Figure 3A,B). Sparse rock fragments in these include chert, siliciclastic sedimentary, felsic plutonic and schistose metamorphic types. Alkali feldspar and muscovite also occur sporadically.
From the Strand Fiord Formation, sample J1711 is a clast-supported conglomerate comprising mostly chert clasts in a poorly sorted, very-fine-grained quartz arenite matrix, whereas sample J1712 is a conglomeratic sublitharenite (Figure 3B). Feldspar is very rare to absent. Sample S_PH0268, from the upper Kanguk Formation or lower Expedition Formation, is a very-fine- to fine-grained arkosic arenite (Figure 3A,B). It contains both alkali feldspar and plagioclase, as well as abundant mica (mostly biotite; Figure 3C). Rock fragments are rare and comprise mudstone and chert types.

4.2. Conventional Heavy Mineral Analysis

The transparent heavy mineral assemblages from 54 samples were counted. RuZi values range from 6.5 to 35.7, whereas CZi values are low (0–8.3). Both show no clear geographic or stratigraphic trends (Figure 4) and are not discussed further. Samples from northern Axel Heiberg Island and Lake Hazen typically have lower MZi values (<2.4) compared to those from Slidre and Vendom Fiords, the Raanes Peninsula and the Sawtooth Range (0–14.5; Figure 4). MZi values are highest in samples from the Hassel Formation (Figure 4).
Samples from the Jurassic Wilkie Point Group (S_HS0128–131) plus samples S_HS0366 (McConnell Island or Ringnes Formation) and S_HS0525 (Hiccles Cove or Awingak Formation) mostly have stable heavy mineral assemblages dominated by zircon, tourmaline and rutile (ZTR values of >84%; Figure 4). Samples D4544, S_HS0129 and S_HS0366 also contain sizeable amounts of garnet (14.5–39.4%; Figure 4) and have correspondingly high GZi values. Sample S_HS0129 is the only one to contain significant amounts of apatite (12.4%) and chrome spinel (2.2%).
Garnet is very common in samples from Awingak, Deer Bay, Isachsen and younger formations (Figure 4). Staurolite and kyanite are present in several samples from the Isachsen and younger formations. Six samples, in contrast, contain little to no garnet and staurolite and are instead characterised by zircon-, tourmaline- and rutile-dominated assemblages (>90%; S_HS0474, S_HS0475, S_HS0125, S_PH0045, S_PH0104 and S_PH0115; Figure 4).
Apatite is generally poorly represented in the Awingak, Deer Bay and younger formations. This with the exception of samples investigated from the Christopher Formation, which all contain appreciable apatite (2.6–49.5%; Figure 4). ZTR values are generally low in this formation (<40). Samples S_HS0499, S_HS0036 and S_HS0037 (Hassel and Kanguk formations) contain sizeable amounts of epidote (Figure 4). Samples S_HS0036 and S_HS0037 are characterised by a high abundance of zircon but comparatively low amounts of rutile and tourmaline. They also have moderate to high ATi values (37.6–63; Figure 4).

4.3. Apatite Chemistry

Apatite grains were analysed from two samples of the Hassel (S_HS0499) and upper Kanguk to lower Expedition (S_HS0036) formations. Between 49 and 58 grains were analysed per sample. Both samples are characterised by a large proportion of grains from mafic/intermediate igneous rocks (53–55%), together with smaller proportions of metamorphic and ultramafic grains, as well as sparse grains potentially from felsic granitoids and alkaline rocks (Figure 5).

4.4. Garnet Chemistry

Garnet grains from sixteen samples were analysed (50 to 59 grains per sample). Fourteen of these samples are Middle Jurassic or younger; two Late Triassic to Early Jurassic sandstone samples from the Sawtooth Range (S_PH0030 and S_PH0295) were analysed to redress a gap in the Pointon et al. [28] dataset. The vast majority of grains are of metamorphic origin (80–100%; Figure 6). These were derived from intermediate/felsic metaigneous rocks or metasedimentary rocks, although grains from metamafic rocks are present in many of the samples. The latter grains are classified predominantly as eclogite/ultra-high pressure and granulite-facies grade.
Garnet grains in samples S_PH0030 and S_PH0295 from the Late Triassic to Early Jurassic Heiberg Formation were predominantly sourced from greenschist- and amphibolite-facies rocks (Figure 6). Granulite-facies grains comprise the largest fraction in nearly all of the other samples analysed, followed by amphibolite-facies grains (Figure 6). Apart from J1712, samples analysed from northern Axel Heiberg generally have a lower proportion of granulite-facies grains than the rest of the Middle Jurassic and younger samples. Eclogite/ultra-high-pressure facies grains are particularly well represented in sample J1708; many of these are metamafic grains. Samples S_HS0624 and S_HS0366 contain 16–20% igneous grains; all other Late Jurassic and Cretaceous samples contain <9% igneous grains (Figure 6). The igneous grains are inferred to originate from rocks of intermediate to felsic composition.

4.5. Rutile Chemistry

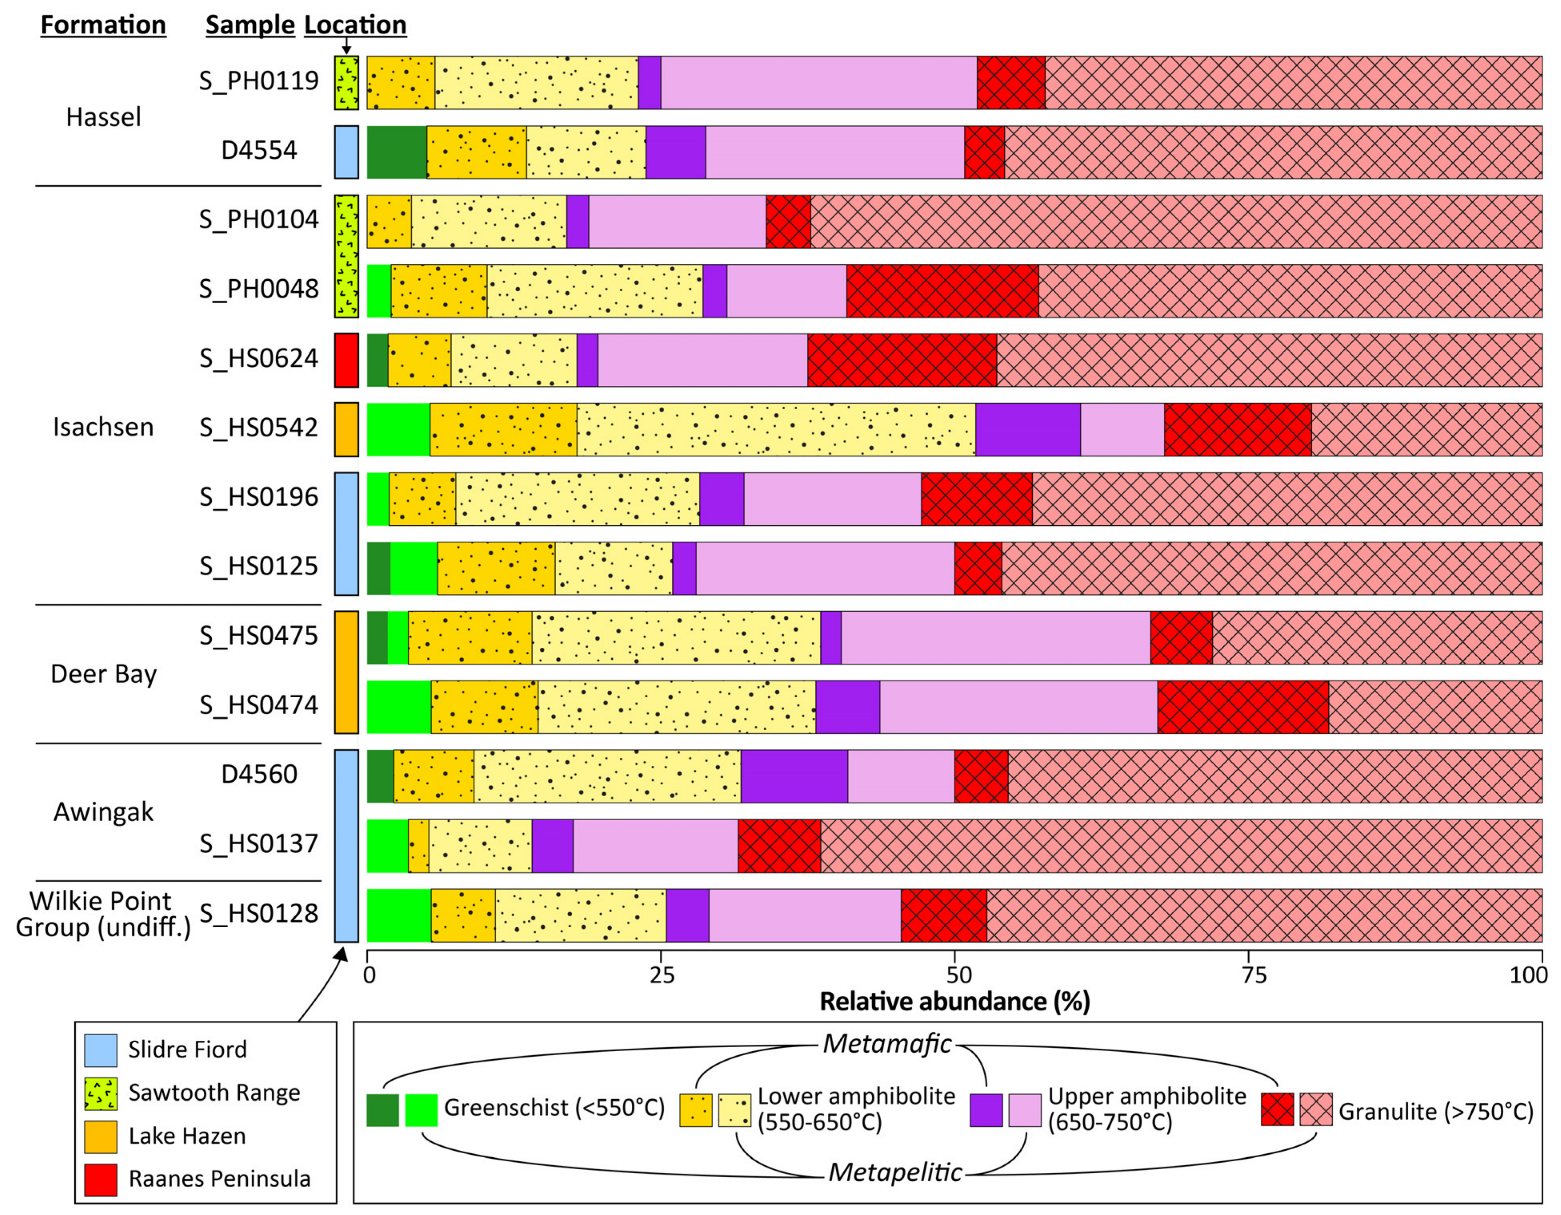
Rutile grains from 13 samples were analysed for their trace element geochemistry (44 to 59 grains per sample). Metapelitic grains are more abundant than metamafic grains throughout (66–91% of grains; Figure 7). With the exception of samples from Lake Hazen, all samples are characterised by a high proportion of granulite-facies grains (48–68%), together with generally fewer amphibolite-facies grains (28–52%; Figure 7). In contrast, samples from Lake Hazen, from the Deer Bay (S_HS0474 and S_HS0475) and Isachsen (S_HS0542) formations, contain markedly fewer granulite-facies grains (32–33%) and a greater proportion of amphibolite grains (61–63%; Figure 7).

4.6. Detrital Zircon U–Pb Geochronology

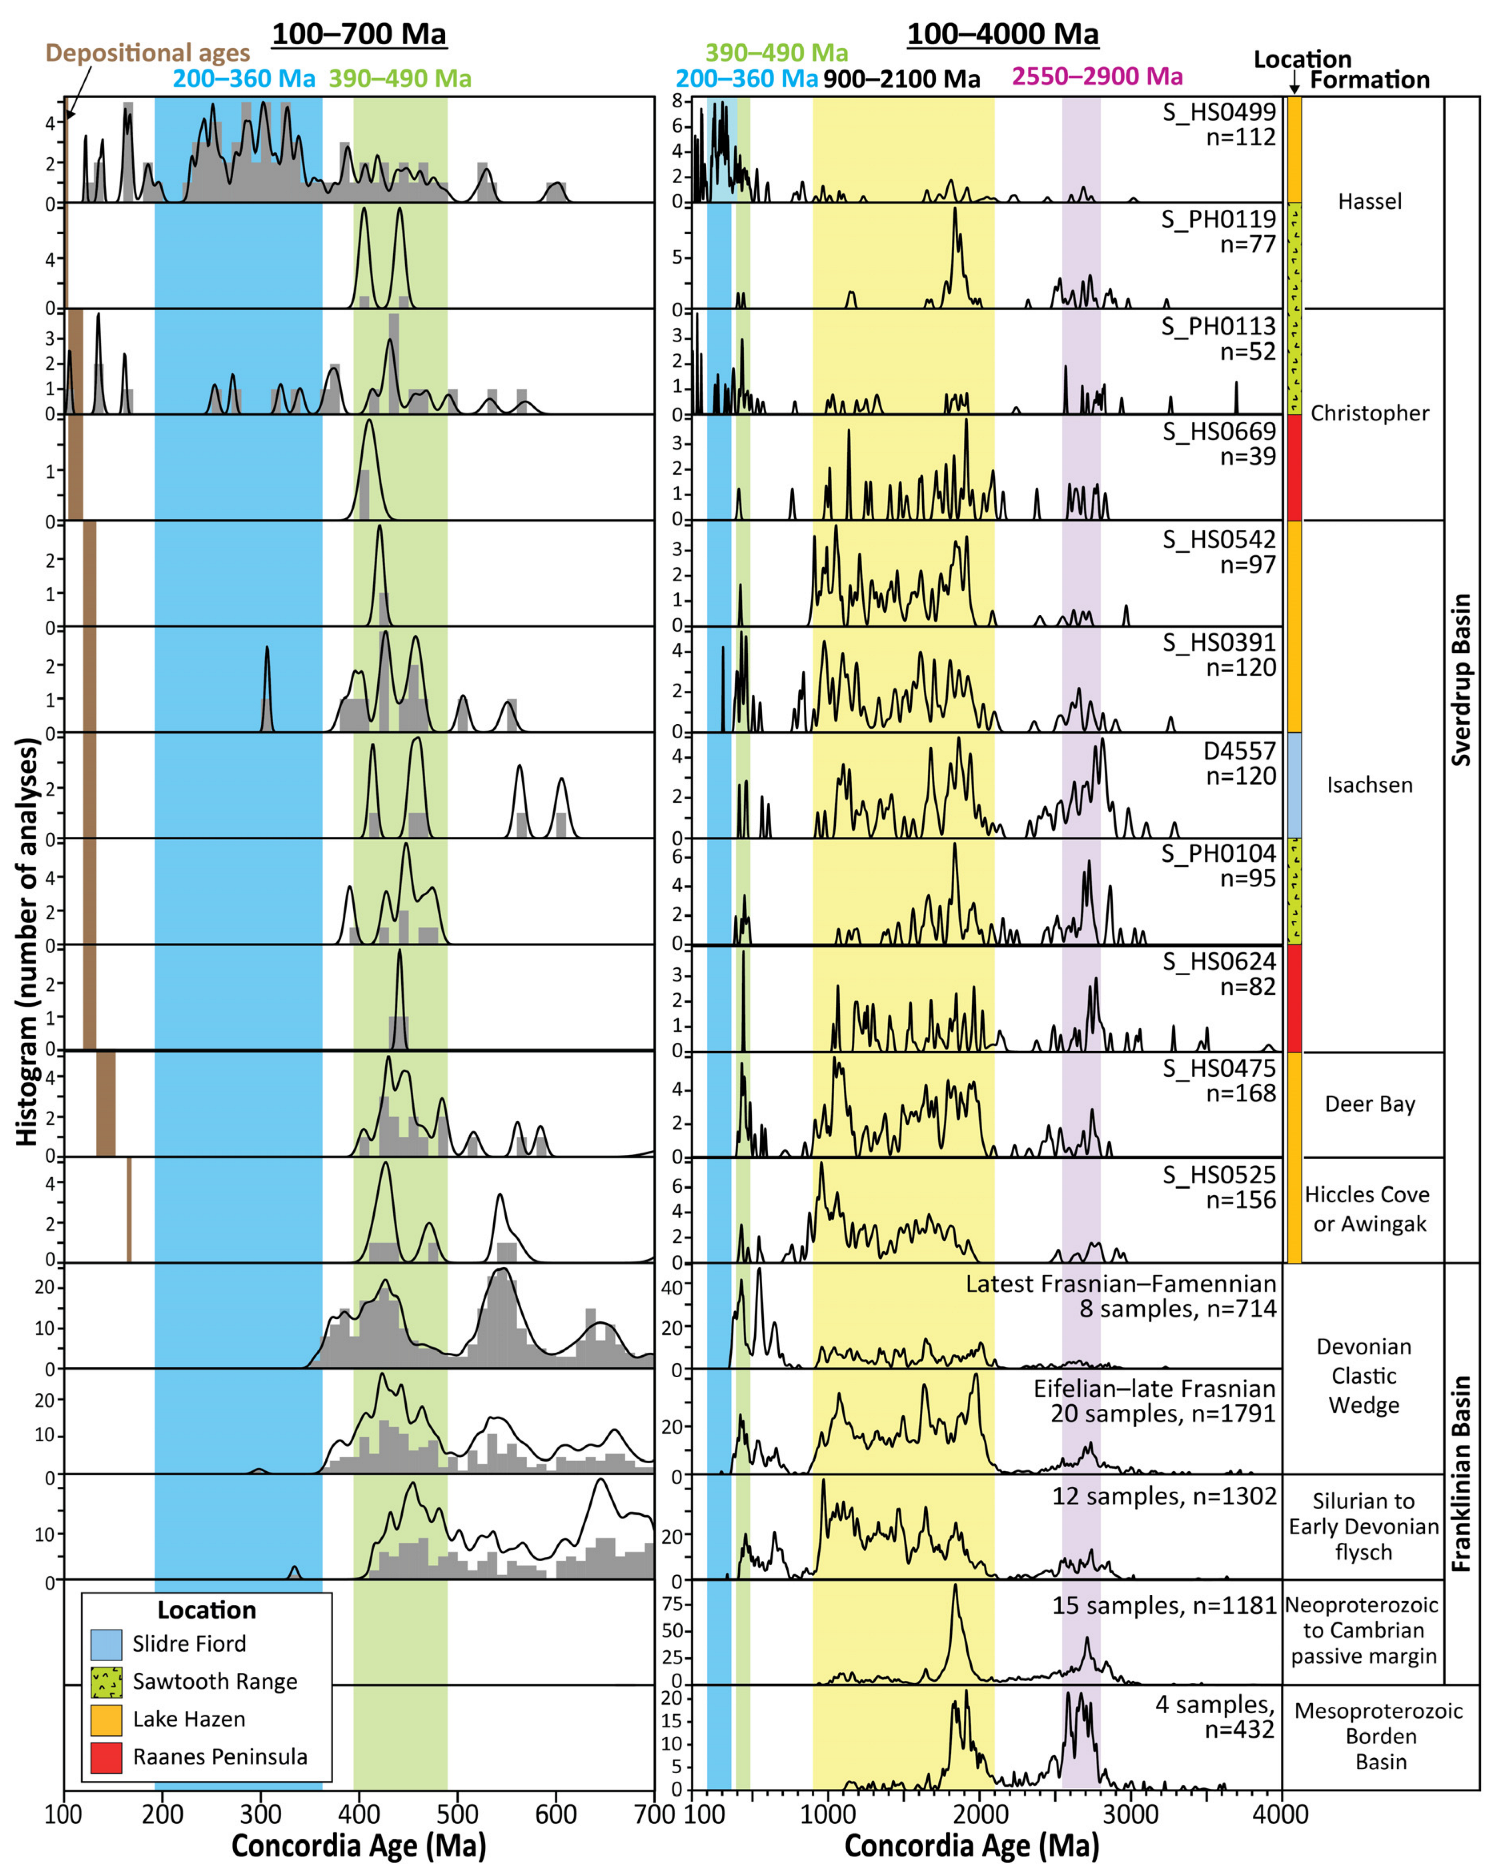
Detrital zircon U–Pb age data have been obtained from 11 samples (Figure 8). Samples from the Hiccles Cove or Awingak Formation (S_HS0525), Deer Bay Formation (S_HS0475) and the Isachsen Formation (S_HS0391, S_HS0542) near Lake Hazen all have similar age spectra dominated by large c. 900–2100 Ma age groups, with fewer c. 380–490 Ma and sparse 2320–3000 Ma grains. Samples D4557, S_PH0104 and S_HS0624 contain a larger proportion of >2300 Ma grains than the other Isachsen Formation samples (Figure 8). Samples S_PH0113 and S_HS0669 (Christopher Formation) have contrasting age spectra (Figure 8); sample S_PH0113 contains a number of <600 Ma grains, including four Late Jurassic to Early Cretaceous grains (c. 105–161 Ma). Sample S_HS0669, instead, has a very similar age spectrum to S_HS0624 (nearby Isachsen Formation; Figure 8), although the spectrum from sample S_HS0669 is based on comparatively few analyses, in part because of a poor zircon yield. Sample S_HS0499 (Hassel Formation, Lake Hazen area) contains a high abundance of <600 Ma grains. In detail, these comprise numerous Carboniferous to Triassic (c. 229–341 Ma) grains, together with fewer older Paleozoic (c. 353–486 Ma) and Early Jurassic to Early Cretaceous ones (c. 121–196 Ma). In contrast, sample S_PH0119 (Hassel Formation, Sawtooth Range) is dominated by >1750 Ma ages; an age spectrum similar to sample S_PH0104 (nearby Isachsen Formation).

4.7. Detrital Zircon Lu–Hf Isotopes

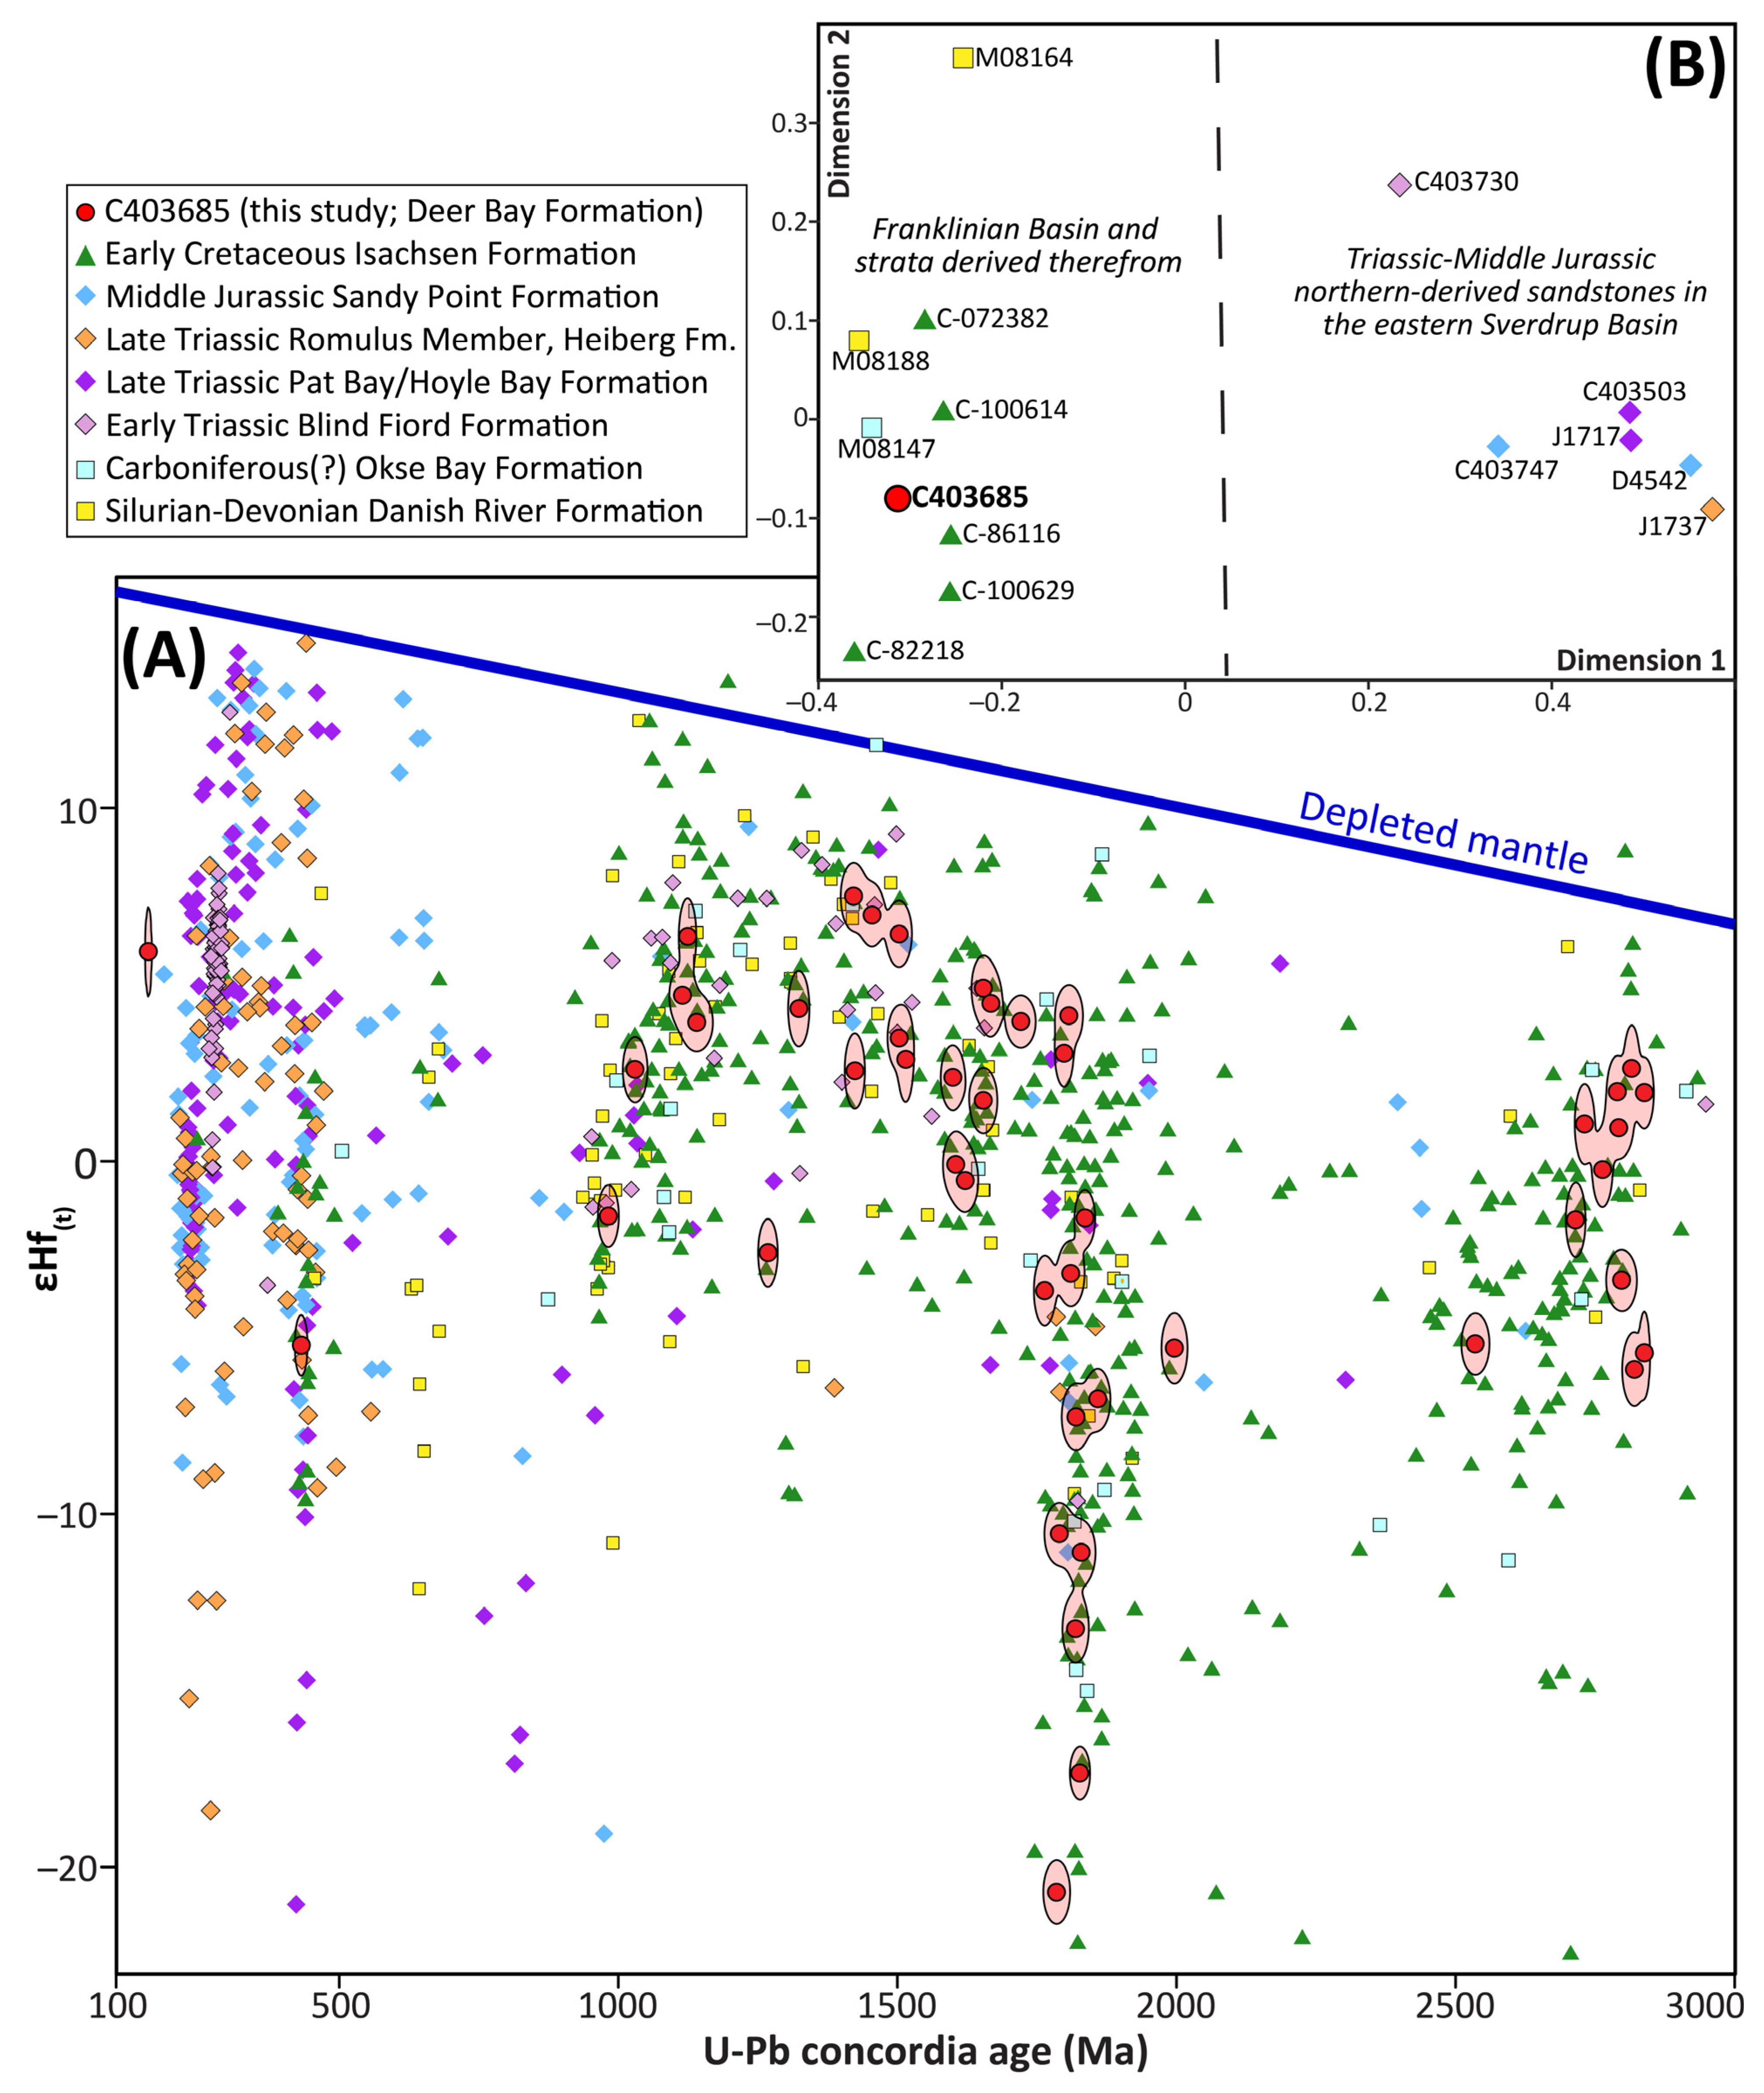
Forty-eight detrital zircons from Deer Bay Formation sample C403685 were analysed. Forty-six of these have corresponding U–Pb ages that meet the quality-control criteria defined in Section 3.2.4 and are considered robust; these are plotted in Figure 9A. Grains of 982–1721 Ma age yield −2.6 to +7.5 εHf(t) values, whilst 1764–1860 Ma grains yield a wide range of εHf(t) values from −20.7 to +4.1. Archean grains (2536–2839 Ma) yield −5.9 to +2.6 εHf(t) values.

5. Discussion

5.1. Sediment Provenance

5.1.1. Middle Jurassic to Early Aptian (Wilkie Point Group to Isachsen Formation)

Samples from the Wilkie Point Group, as well as the Deer Bay, Awingak and Isachsen formations, are overwhelmingly quartz-rich, have restricted rock/lithic fragment assemblages dominated by mudstone, chert and quartzite types, and have stable heavy mineral assemblages dominated by zircon, tourmaline and rutile, with or without garnet. All of this is consistent with a predominantly sedimentary/metasedimentary provenance. The Awingak Formation is interpreted as being sourced from the southeast to east based on lateral thickness variations [16,123]. Facies trends and palaeocurrent vectors from the Isachsen Formation support the same sediment supply directions [16,124,125,126,127]. The Wilkie Point Group samples are compositionally similar to those from the Awingak, Deer Bay and Isachsen formations. They are also markedly different in composition from northern-derived samples of the Sandy Point Formation on northern Axel Heiberg Island, which contain abundant apatite, plagioclase and detrital zircons of Carboniferous to Triassic age [28]. Collectively, this supports a southeastern/eastern provenance for the Wilkie Point Group samples.
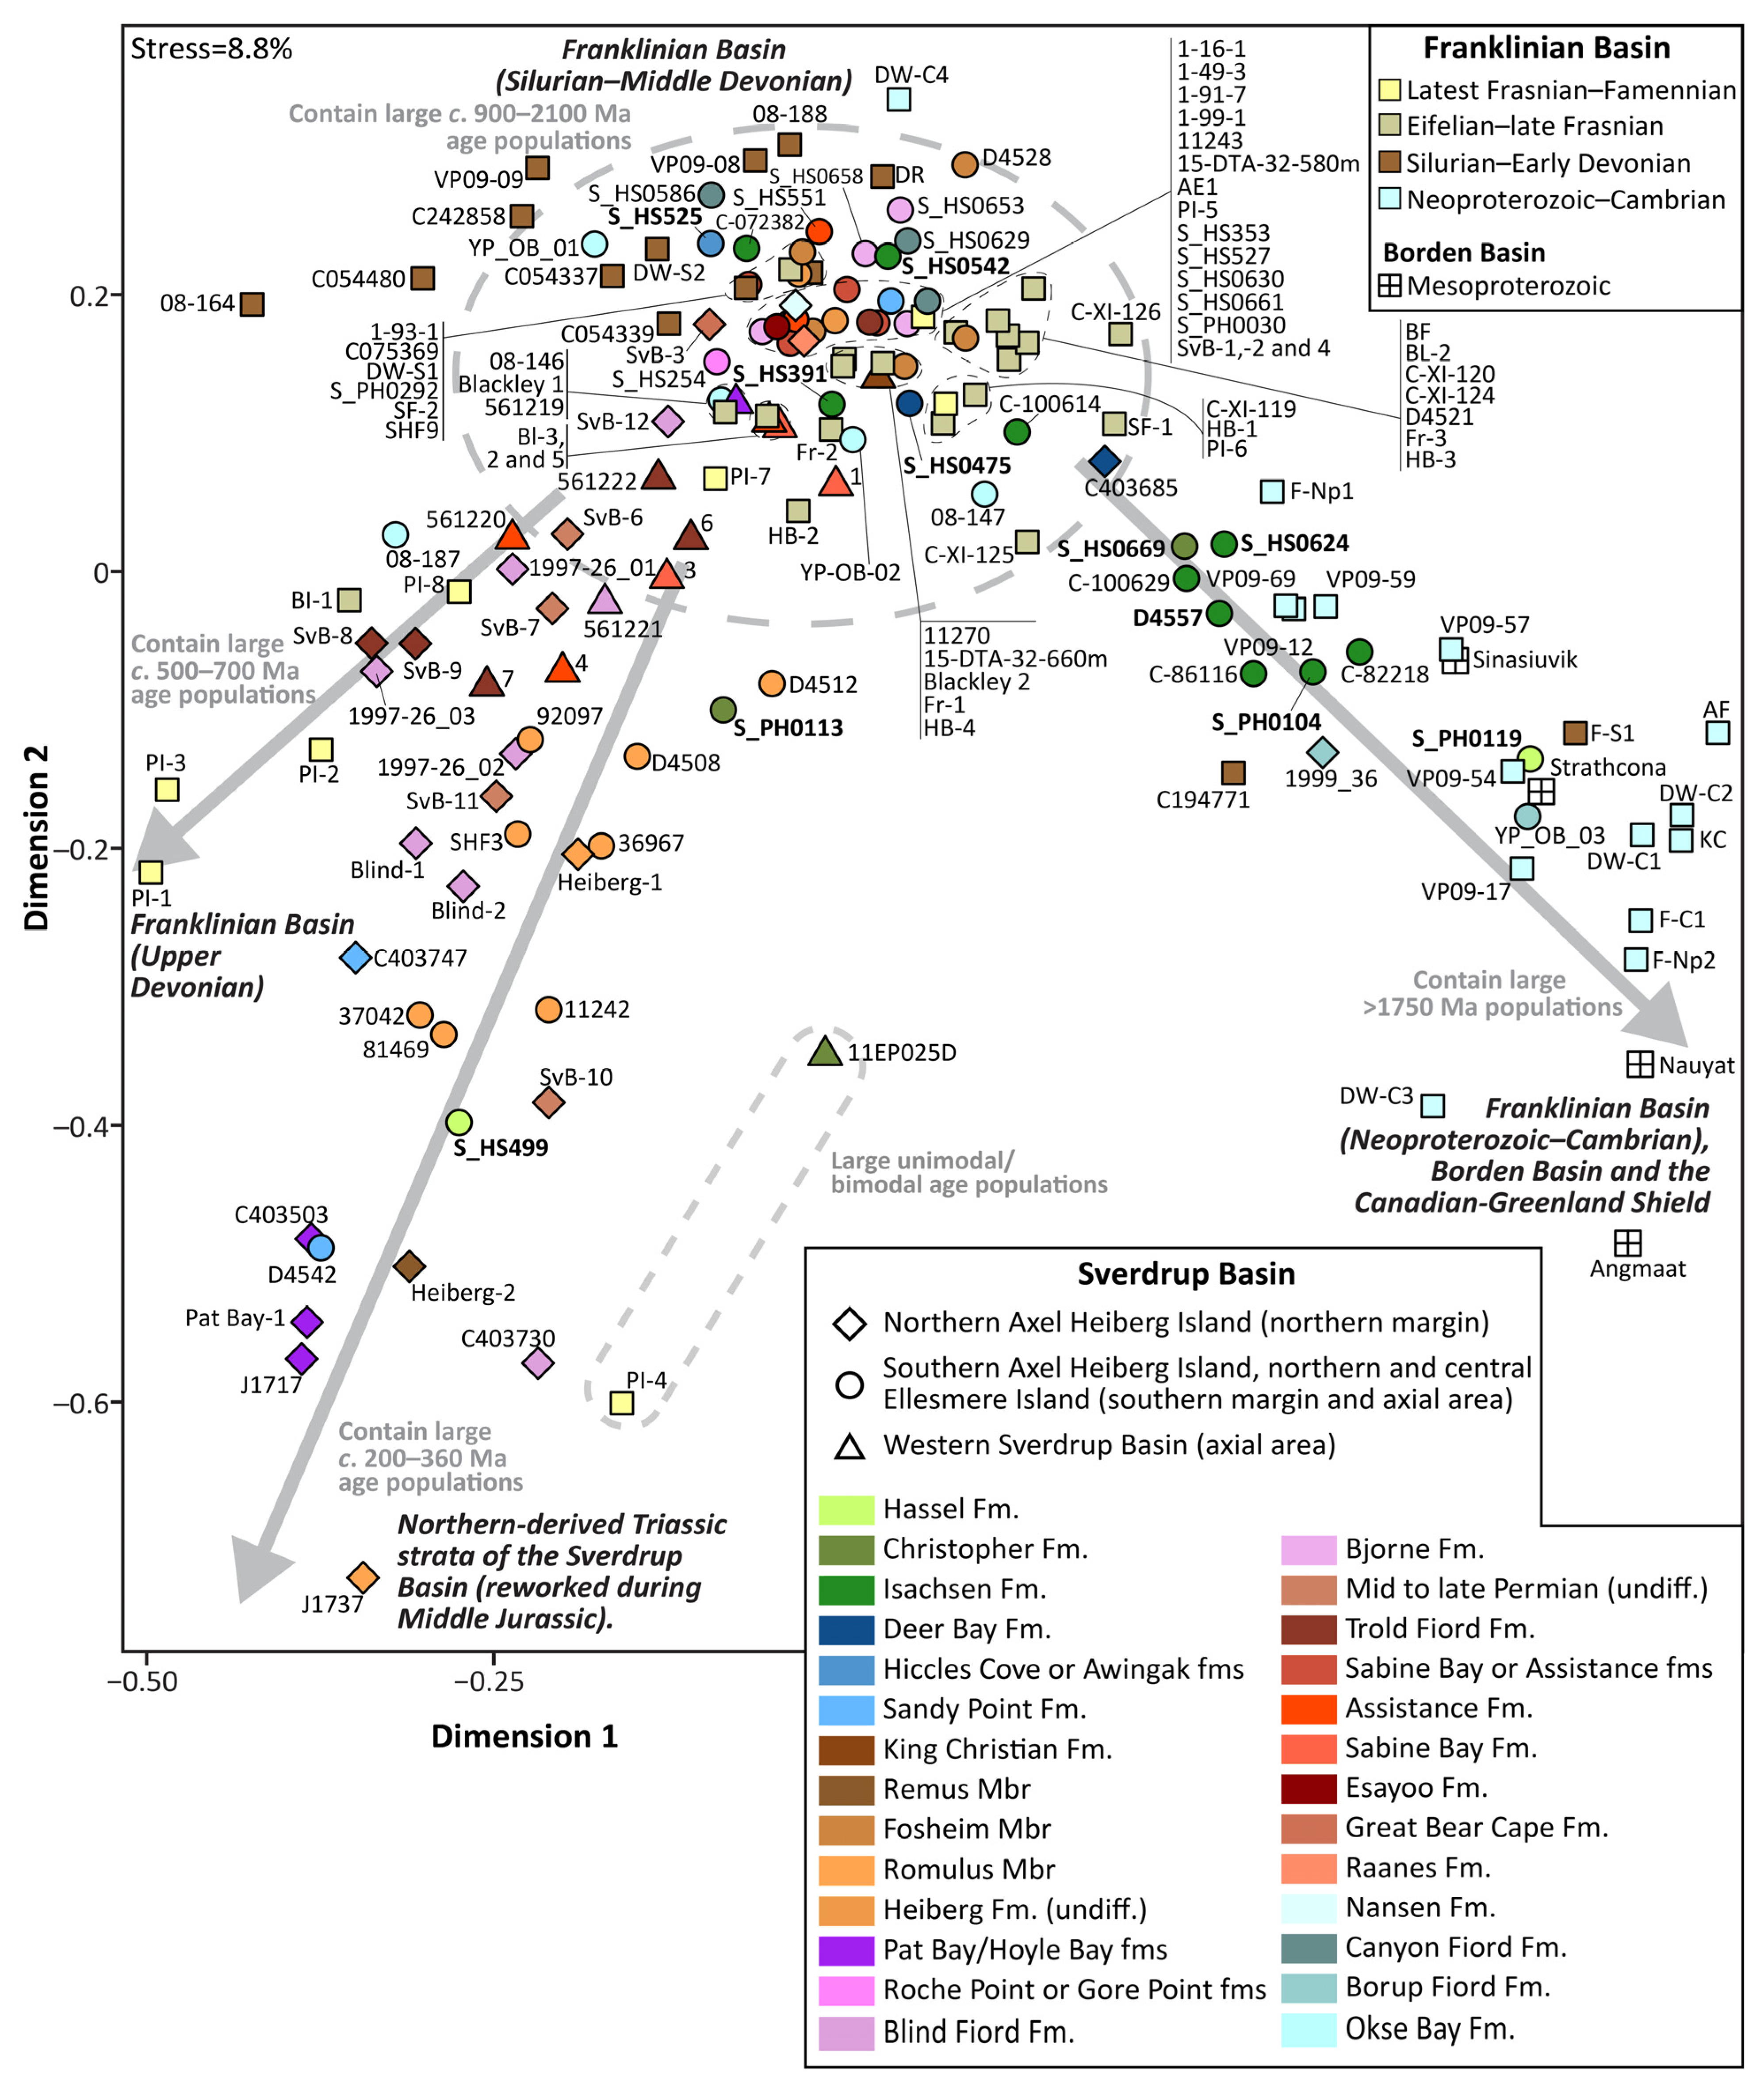
In detail, there are compositional differences between samples from: (1) northern Axel Heiberg, (2) the Lake Hazen area and (3) central Ellesmere Island (Raanes Peninsula, Slidre Fiord, Vendom Fiord and the Sawtooth Range). Samples from the Lake Hazen area generally contain less garnet, whilst kyanite and staurolite are almost entirely absent (Figure 4). They also contain a smaller proportion of granulite-facies rutile grains and more amphibolite-facies rutile grains compared to samples from central Ellesmere Island (Figure 7), although the garnet chemistry data indicates most of the garnet was sourced from granulite-facies rocks (Figure 6). Samples from the Hiccles Cove or Awingak (S_HS0525), Deer Bay (S_HS0475) and Isachsen formations (samples S_HS0391 and S_HS0542, and C-072382 from Røhr et al. [24]) from the Lake Hazen area have detrital zircon age spectra characterised by large c. 900–2100 Ma age populations (Figure 8 and Figure 10). These are comparable to the Silurian to Middle Devonian strata of the Franklinian Basin succession. This is apparent through visual inspection of the respective probability density curves (Figure 8) and also through dissimilarity analysis (Figure 10). It follows that the Sverdrup Basin samples were likely reworked from this interval of the Franklinian Basin succession.
Samples analysed from central Ellesmere Island generally contain a higher proportion of garnet, staurolite, kyanite, monazite and granulite-facies rutile grains than coeval samples from the Lake Hazen area. Isachsen Formation samples from central Ellesmere Island are characterised by larger c. 2500–2800 Ma detrital zircon age populations than those from the Lake Hazen area (Figure 8; [24]) and are similar to Neoproterozoic to Cambrian strata within the Franklinian Basin succession (Figure 8). The high chemical stability of zircon and rutile excludes local diagenetic conditions as the root cause of these spatial compositional variations. In detail, the detrital zircon U–Pb age spectra from samples from central Ellesmere Island share age groups with both Neoproterozoic to Cambrian strata and Silurian to Middle Devonian strata of the Franklinian Basin, hence their intermediate position between these two stratigraphic packages in Figure 10. This mirrors whole-rock εNd(t) values from the Isachsen Formation on central/southern Ellesmere Island and Axel Heiberg Island (−11 to −21), which lie between Silurian and Devonian strata (−5 to −14) and late Neoproterozoic to Ordovician strata of the Franklinian Basin (−17.8 to −25.5; all quoted εNd(t) values are from Patchett et al. [4,45]). Taken together, the detrital zircon U–Pb age and whole-rock εNd(t) datasets support the derivation of sediment on central Ellesmere Island from multiple levels within the Franklinian Basin succession. It has been argued that the Isachsen Formation was at least partially derived from the Canadian-Greenlandic Shield because it contains pebble- to cobble-sized clasts of vein quartz that are absent from the Franklinian Basin succession [4,16,126]. The available data from the Isachsen Formation overwhelmingly indicate a recycled (meta)sedimentary source; thus, whilst a direct contribution from metasedimentary units of the shield cannot be excluded, a detrital contribution from metaigneous rocks is unlikely. Pebbly sandstone and conglomeratic strata rich in quartz clasts are known from the Mesoproterozoic Bylot basins (e.g., [27,33,131]). Strata of the Borden Basin have yielded very similar detrital zircon U–Pb age spectra to Neoproterozoic–Cambrian strata of the Franklinian Basin succession (Figure 8 and Figure 10). Erosion of Bylot basins’ strata therefore offers a possible alternative source of quartz pebbles.
Samples from the Deer Bay and Isachsen formations on northern Axel Heiberg Island are also quartz-rich and have similar stable heavy mineral assemblages to coeval samples analysed from central Ellesmere Island. The detrital zircon U–Pb spectrum and Hf isotope signature from sample C403685 are consistent with a reworked provenance from predominantly Silurian and younger strata of the Franklinian Basin. The northern Axel Heiberg Island samples lack sizeable amounts of apatite, feldspar and/or Permo-Triassic detrital zircon, which characterise northern-derived sediments [28], and were most likely derived from the southeast/east. This was suggested previously for sample C403685 by Omma et al. [23]. The Deer Bay (C403685) and Isachsen Formation samples (J1743 and C403733) generally contain fewer granulite-facies garnet grains than many of the coeval samples from Slidre Fiord, the Lake Hazen area and the Raanes Peninsula (D4560, S_HS0391, S_HS0542, S_HS0624; Figure 6). The reasons for this are unclear, but downstream mixing of sediment supplied from different systems that sampled different levels within the Franklinian Basin succession cannot be excluded.
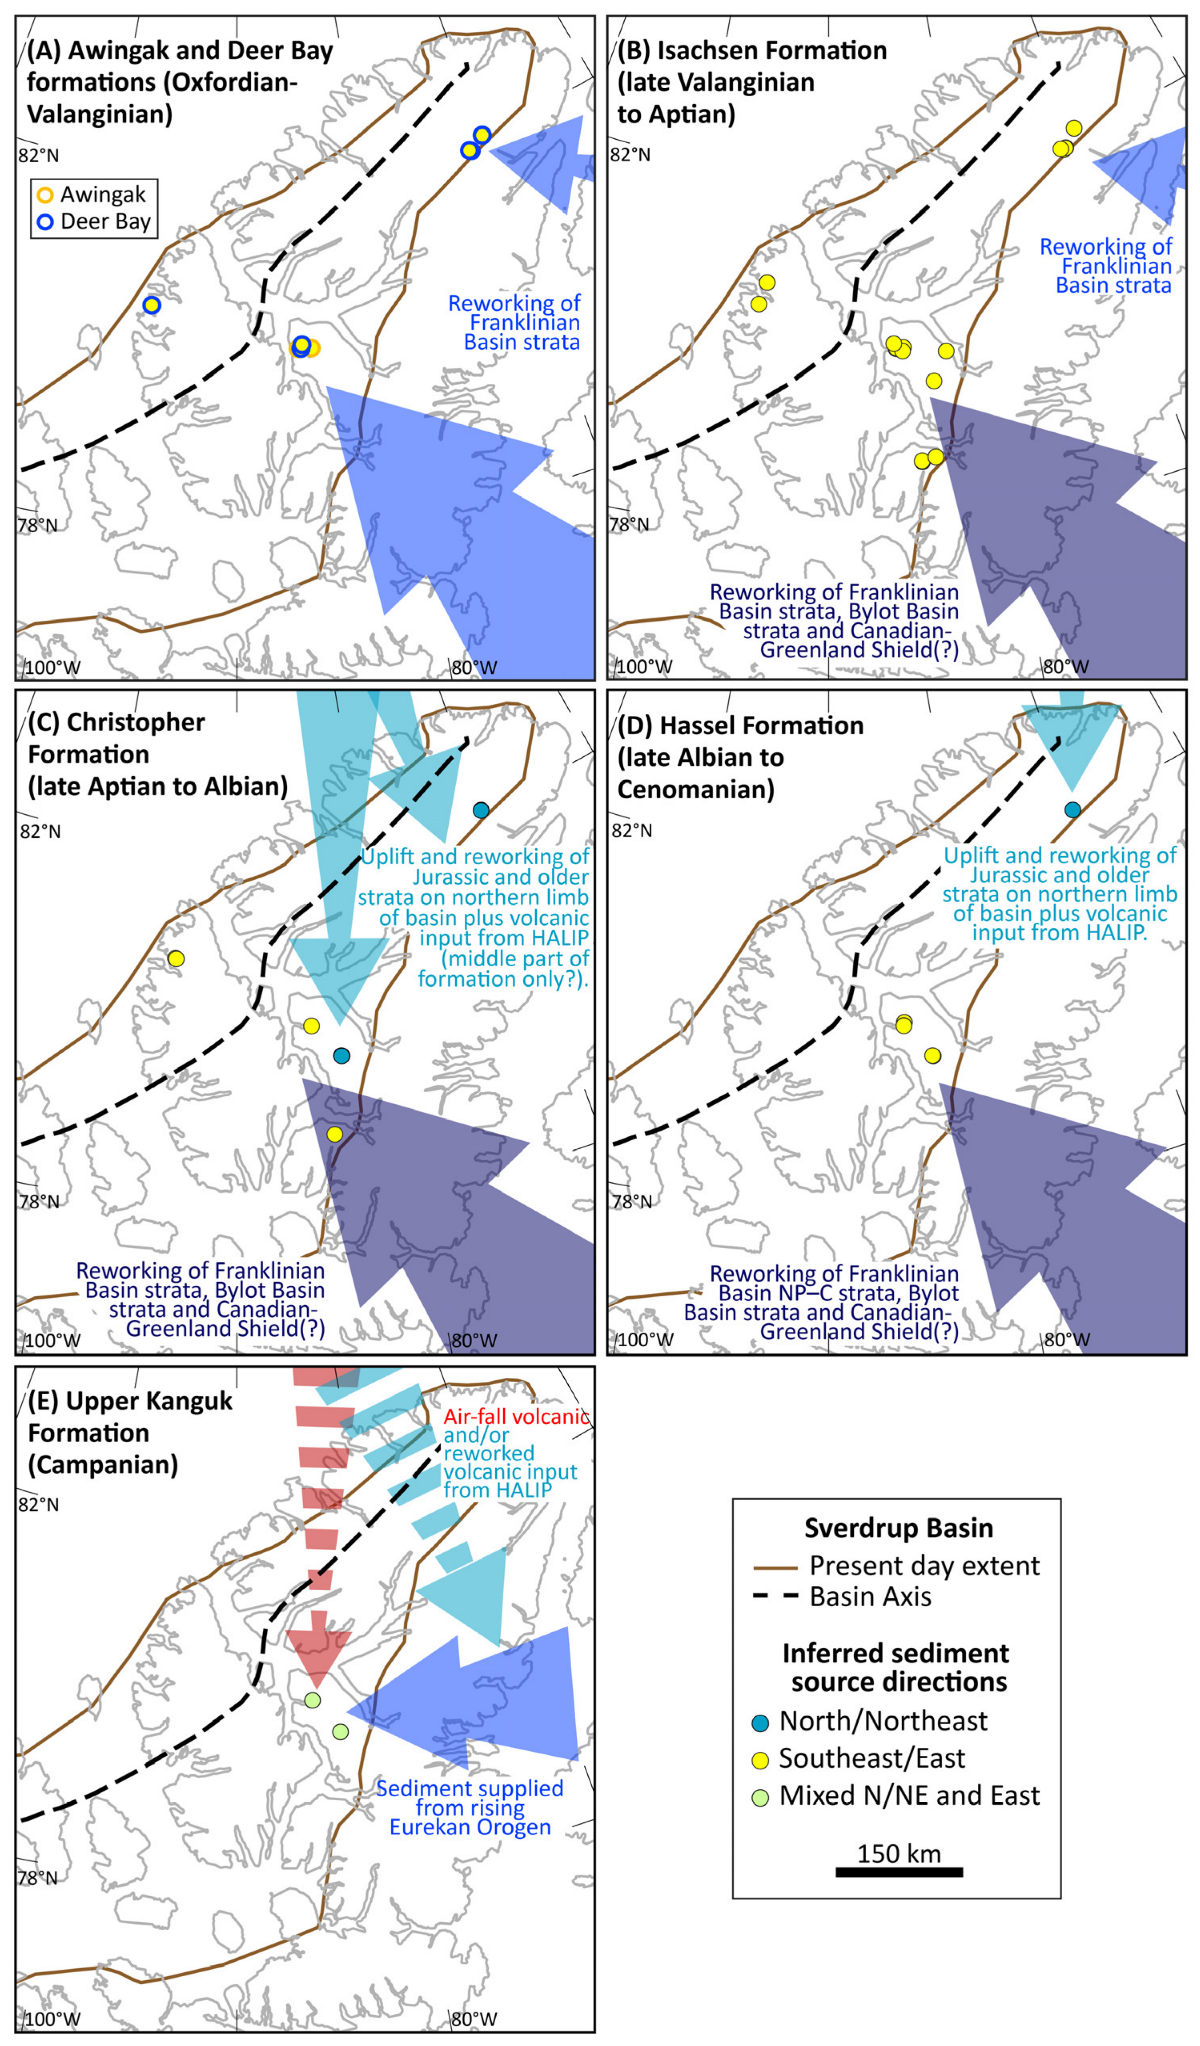
In summary, the available data from the Lake Hazen area support a dominant detrital input from Silurian and younger levels within the Franklinian Basin succession to the southeast/east (Figure 11A,B). An additional, smaller detrital contribution from lower levels within the succession is still likely, however, to account for the granulite-facies garnet and rutile grains. Conversely, samples from central Ellesmere Island contain a much greater proportion of higher-grade, granulite-facies detritus. This suggests that these areas were likely fed from a distinct sediment supply system (Figure 11A,B). The higher-grade, granulite-facies detritus was likely supplied from the Neoproterozoic–Cambrian levels of the Franklinian Basin succession and/or the Bylot basins, although a direct input from metasedimentary units of the Canadian-Greenlandic Shield cannot be excluded. The data from the northern Axel Heiberg Island samples are also consistent with a southeast/eastern sediment source (Figure 11A,B).

5.1.2. Late Aptian to Albian (Christopher Formation)

Samples S_HS0669, J1707–J1709, S_PH0107 and S_PH0109 from the Christopher Formation on central Ellesmere and northern Axel Heiberg Islands are quartz-rich (Figure 3) and compositionally similar to local Isachsen Formation samples (Section 5.1.1). Consequently, they likely share predominantly the same sediment source area. These samples, however, contain slightly greater amounts of apatite than the underlying local Isachsen Formation, which may indicate a first-cycle input from the Canadian-Greenlandic Shield or alternatively an air-fall volcanic input from HALIP volcanic centres to the north of the basin. U–Pb isotope dates from the apatite grains are needed to differentiate between these possibilities.
Samples S_PH0111–0113 from the middle of the Christopher Formation in the Sawtooth Range have markedly more immature (arkosic) composition than samples S_PH0107 and S_PH0109 from lower in the formation (Figure 3). Sample S_PH0113 contains several <360 Ma detrital zircons, which are characteristic of northern-derived Late Triassic to Middle Jurassic strata [28] and strongly support sediment supply from the north/northeast at this time (Figure 11C). One of these grains (105.5 Ma) is indistinguishable in age to a hyalotuff at the top of the Invincible Point Member on Ellef Ringnes Island [80]. This, together with the immature composition of these samples, points to an influx of volcanic detritus at this time, which was likely supplied from HALIP volcanic centres to the north and/or northeast of the basin [16,75,80]. Volcanic-rich sandstones of the middle Christopher Formation are known from Ellef Ringnes Island and northern Axel Heiberg Island (Figure 1B; [16,75,80]); the data from samples S_PH0111–0113 support that volcanic detritus was transported at least as far south as the Sawtooth Range at this time (Figure 11C). Samples S_HS0086 and S_HS0501, from Slidre Fiord and Lake Hazen, respectively, are both very apatite-rich (Figure 4) and probably contain a first-cycle volcanic component, although further analysis is needed to confirm this.
Sample S_PH0113 also contains some >600 Ma detrital zircons (Figure 8), which likely reflect a recycled detrital contribution from Franklinian Basin strata. The >600 Ma age populations are poorly resolved in the limited dataset from this sample; dissimilarity analysis tentatively supports the reworking of Silurian to Middle Devonian Franklinian Basin strata (Figure 10). Consequently, these grains were likely reworked from older, mixed (north/northeast and southeast/east)-provenance Sverdrup Basin rocks rather than sourced from Franklinian Basin strata to the southeast/east directly. This is because, by this time, sediment supplied to central Ellesmere Island from the southeast/east contained a greater proportion of >1750 Ma detrital zircons (e.g., samples S_H0669 and S_PH0104; Figure 8 and Figure 10), which are indicative of detritus eroded from Neoproterozoic–Cambrian levels of the Franklinian Basin succession, the Bylot basins and the Canadian-Greenlandic Shield (Figure 11C).

5.1.3. Late Albian to Cenomanian (Hassel and Strand Fiord Formations)

Hassel Formation samples analysed from the Sawtooth Range and Slidre Fiord have dissimilar quartz abundance but similar rock/lithic fragment and heavy mineral assemblages (Figure 3 and Figure 4). Rutile and garnet chemistry data indicate a high proportion of detritus from granulite-facies metasedimentary rocks (Figure 6 and Figure 7). On balance, these samples were likely derived from sedimentary and metasedimentary rocks. Sample S_PH0119 has a detrital zircon age spectrum that is similar to Neoproterozoic–Cambrian strata of the Franklinian Basin succession (Figure 8 and Figure 10). Consequently, sediment supplied from the southeast/east was now largely, or entirely, sourced from the Neoproterozoic–Cambrian part of the Franklinian Basin succession, the Bylot basins and/or the Canadian-Greenlandic Shield directly (Figure 11D).
Sample S_HS0499 (Lake Hazen area), in contrast to the other Hassel Formation samples analysed, has a more diverse heavy mineral assemblage and contains numerous Carboniferous to Triassic grains that are common in northern-derived Late Triassic and Middle Jurassic sandstones (Figure 10; [18,19,20,23,28]). The apatite grains in this sample were derived from predominantly mafic/intermediate igneous rocks (Figure 5). These data collectively support a dominant sediment input from the north and/or northeast at this time, from an area comprising Early Cretaceous volcanic rocks and Late Triassic and/or Middle Jurassic sandstones bearing Carboniferous–Triassic detrital zircons (Figure 11D).
Conglomeratic samples intercalated with basaltic lavas of the Strand Fiord Formation on northern Axel Heiberg Island (J1711 and J1712) are compositionally similar to nearby samples from the underlying Deer Bay and Isachsen formations. The overall coarse grain size of these samples unequivocally indicates local derivation. They were probably reworked from Late Jurassic to Early Cretaceous strata that were themselves derived from the southeast/east of the basin.

5.1.4. Campanian (Upper Kanguk Formation to Lower Expedition Formation)

Sandstone samples from the upper Kanguk Formation or the Lower Member of the Expedition Formation at Slidre Fiord and in the Sawtooth Range are compositionally immature (S_PH0268) and have diverse heavy mineral assemblages that include epidote and apatite (S_HS0036, S_HS0037 and S_PH0268). Sample S_HS0036 also contains trace amounts of arfvedsonite, which is common in peralkaline granites and syenites (e.g., [132]). Chemical analysis of apatite grains in sample S_HS0036 suggests that they were largely derived from mafic/intermediate igneous rocks (Figure 5). Diagenetically altered volcanic ash layers (bentonites) occur within the adjacent 30 m above and below sample S_PH0268, demonstrating an air-fall volcanic input to the basin during this time interval, from HALIP volcanic centres to the north of the basin [90,91]. Aside from the clear volcanic component, the sedimentary rock fragments and probably also the garnet content suggest a recycled detrital contribution from sedimentary and metasedimentary rocks. The Lower Member of the Expedition Formation has been interpreted as the product of a west- or southwest-prograding wave-dominated delta system [59,133]. The data strongly indicate a mixed volcanic and reworked provenance for these samples, although it is unclear whether the volcanic component was air-fall or reworked (as reflected by the two dashed arrows shown in Figure 11E). It is likely that the rejuvenation in sediment supply represented by this member records an early expression of Eurekan deformation (e.g., [134]).

5.2. Regional Implications

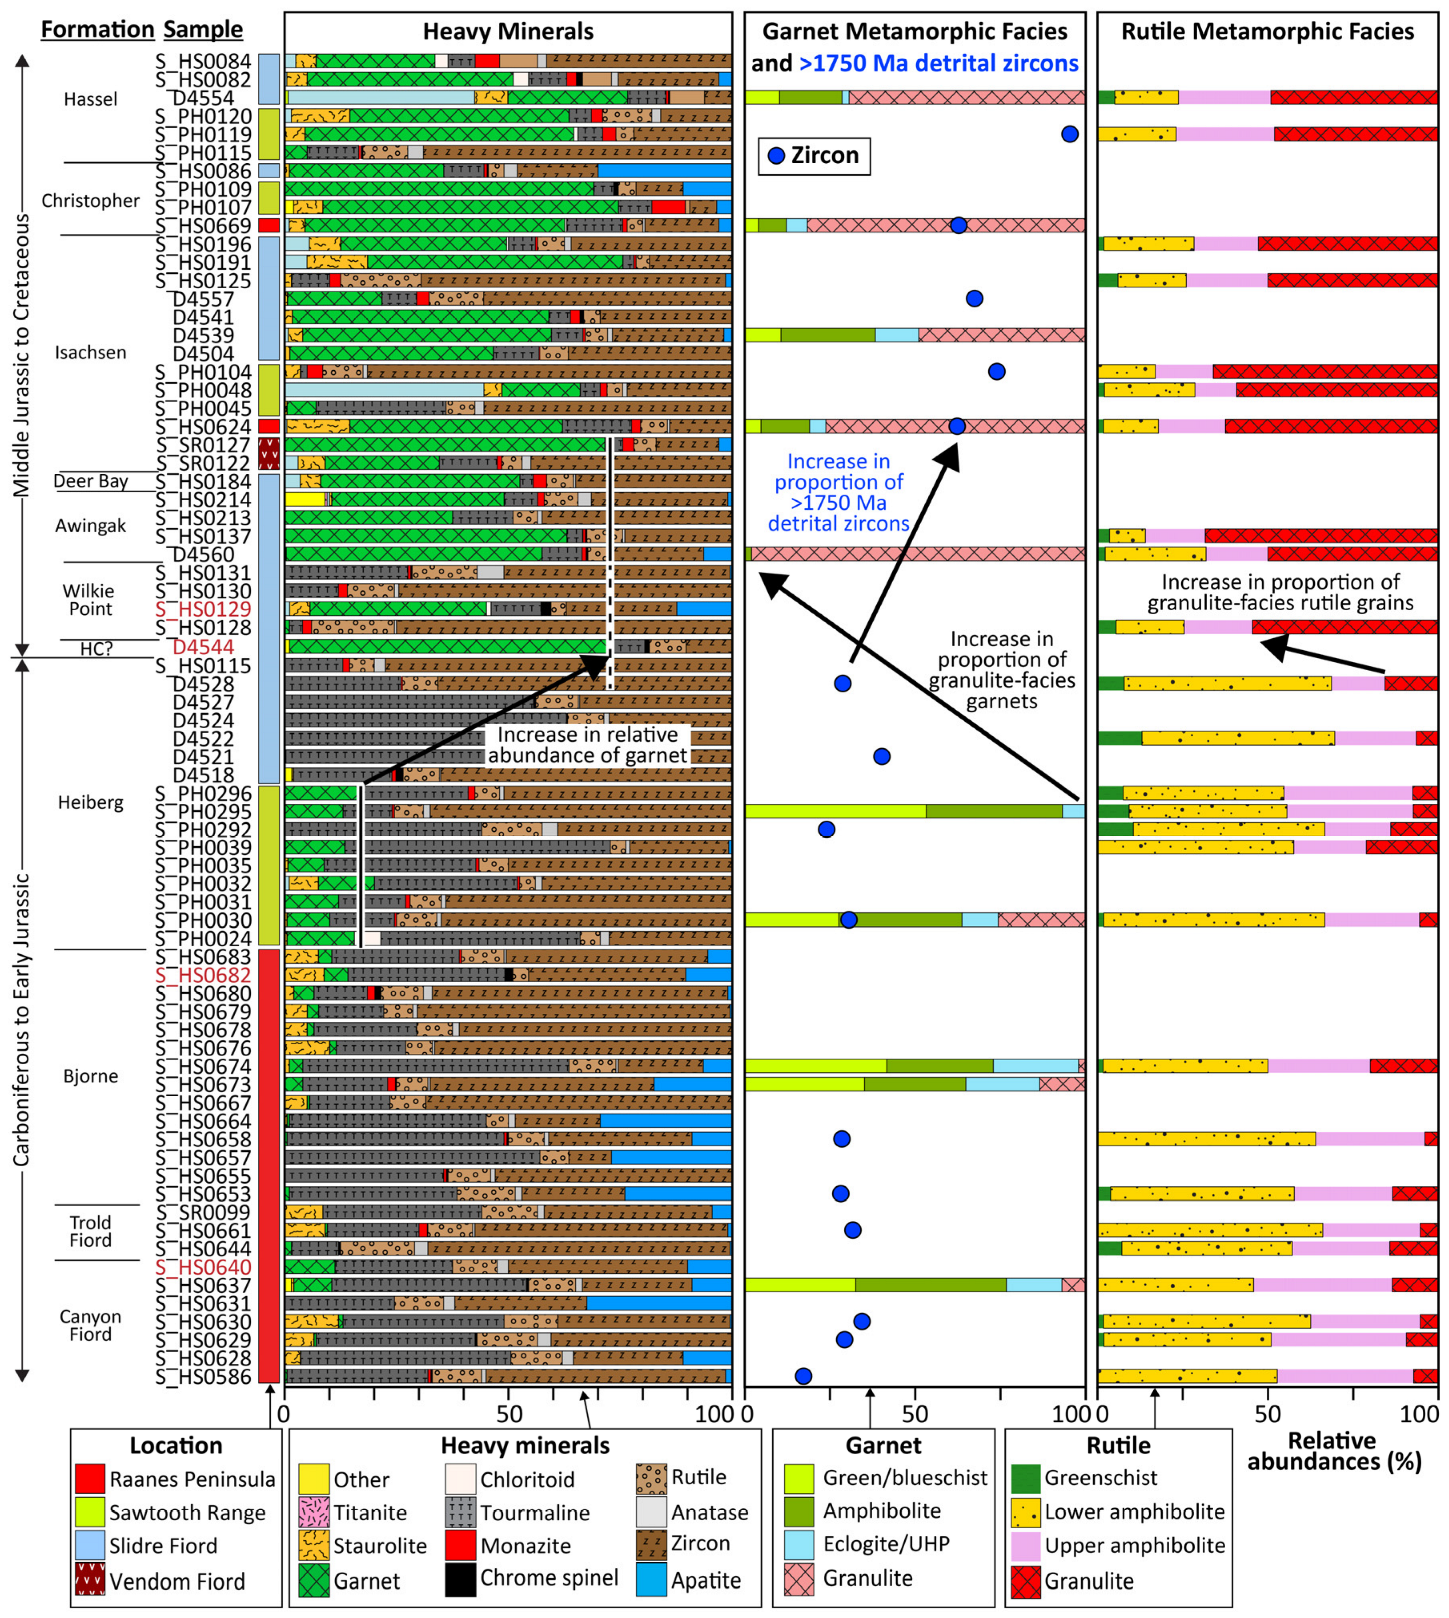
Before Middle Jurassic times, detritus originating from the southeast to east of the Sverdrup Basin was sourced predominantly from the upper (Silurian and Devonian) levels of the Franklinian Basin [28]. From Middle Jurassic times, samples from central Ellesmere Island contain an increased proportion of high-grade metamorphic detritus, as indicated by an increased abundance of garnet, granulite-facies garnet and rutile grains, and Paleoproterozoic and older detrital zircon grains (Figure 12). This is interpreted to reflect provenance change driven by exhumation within the sediment source area. Exhumation is first apparent within the Wilkie Point Group and is marked by an increase in the proportion of granulite-facies rutile grains (S_HS0128; Figure 12). Samples D4544 and S_HS0129 (both Wilkie Point Group) contain much more garnet than all of the older samples analysed by Pointon et al. [28], although only a limited number of heavy minerals were recovered from these two samples. Furthermore, the other samples analysed from the same discontinuous section as sample S_HS0129 (i.e., S_HS0128, S_HS0130 and S_HS0131) lack significant garnet. This could reflect fluctuations in the intensity of acidic weathering or indicate that garnet-rich sediment was only supplied intermittently at this time. Garnet is generally abundant in samples from the Late Jurassic onwards (Awingak and Deer Bay formations, and younger; Figure 12). By at least Early Cretaceous times (Isachsen Formation) there was a shift in detrital zircon U–Pb ages, which is consistent with a greater proportion of detritus derived from the lower levels of the Franklinian Basin succession, the Mesoproterozoic Bylot basins and/or the Canadian-Greenlandic Shield (Figure 8 and Figure 10). By Albian to Cenomanian times (Hassel Formation), the detrital contribution from the upper levels of the Franklinian Basin was greatly diminished, based on the reduction in number of <1750 Ma detrital zircons (Figure 8). Consequently, exhumation of the southeastern/eastern source area was underway from least Middle Jurassic times and continued into the Late Cretaceous, spanning at least 70 Myrs.
The increase in garnet abundance upwards through the stratigraphy, in isolation, could record burial diagenesis, with older, more deeply buried samples having lost garnet preferentially. However, the strong correlation between the increased abundance of garnet and granulite-facies rutile grains argues against this possibility. Moreover, several studies have shown that as burial depth increases, Ca-rich garnet is preferentially lost (e.g., [104,135,136]); however, in this instance, Ca concentrations are, on average, highest in the oldest samples analysed from the eastern Sverdrup Basin (Carboniferous; [28]), and there is no significant inverse correlation between Ca concentration and stratigraphic age. Therefore, the change in garnet grain chemistry up-stratigraphy, from Fe-Mn dominated types (greenschist- and amphibolite-facies types; Figure 12) to those containing more Mg (granulite-facies types; Figure 12), is probably not the result of diagenesis.
Whilst the case for exhumation is clear, the size of the southeastern/eastern source area and the mechanisms driving exhumation are not. The compositional data presented herein can be reconciled by a solely Franklinian Basin succession source, therefore necessitating only a relatively small catchment area. However, the presence of vein quartz pebbles and cobbles in the Isachsen Formation has been argued to indicate derivation from the Canadian-Greenlandic Shield [4,16,126], whilst isotopic data argue against sediment derivation from the closest exposed parts of the shield on Ellesmere Island [24]. Thus, a much larger catchment area is required from at least Early Cretaceous times. Based on the inferred sediment supply direction and the available compositional data, the source region for these Sverdrup Basin strata was likely the area now occupied by at least northwestern Greenland, northern Baffin Bay and Baffin Island, as envisaged by Balkwill [29]. The lack of Jurassic to Barremian strata in these areas lends weight to the idea that they may have been exposed and undergoing erosion at this time.
Complicating matters further, the Jurassic and Cretaceous were times of abundant tectonic and magmatic activity in the Arctic realm, including the opening of the Baffin Bay–Labrador Sea, the North Atlantic Ocean and the Amerasia Basin. Furthermore, the emplacement of the HALIP and, latterly, the onset of the Eurekan Orogeny also occurred. All of these processes could potentially have driven exhumation. Our understanding of Arctic geological history is fragmentary, with several points of contention existing. For example, it is generally accepted that the Amerasia Basin opened by Arctic Alaska and Chukotka rotating counter-clockwise away from Arctic Canada [137]. However, when rifting started is debated (cf. [21,57,137,138,139]), as is the timing and duration of sea floor spreading (cf. [95,137,140,141]).
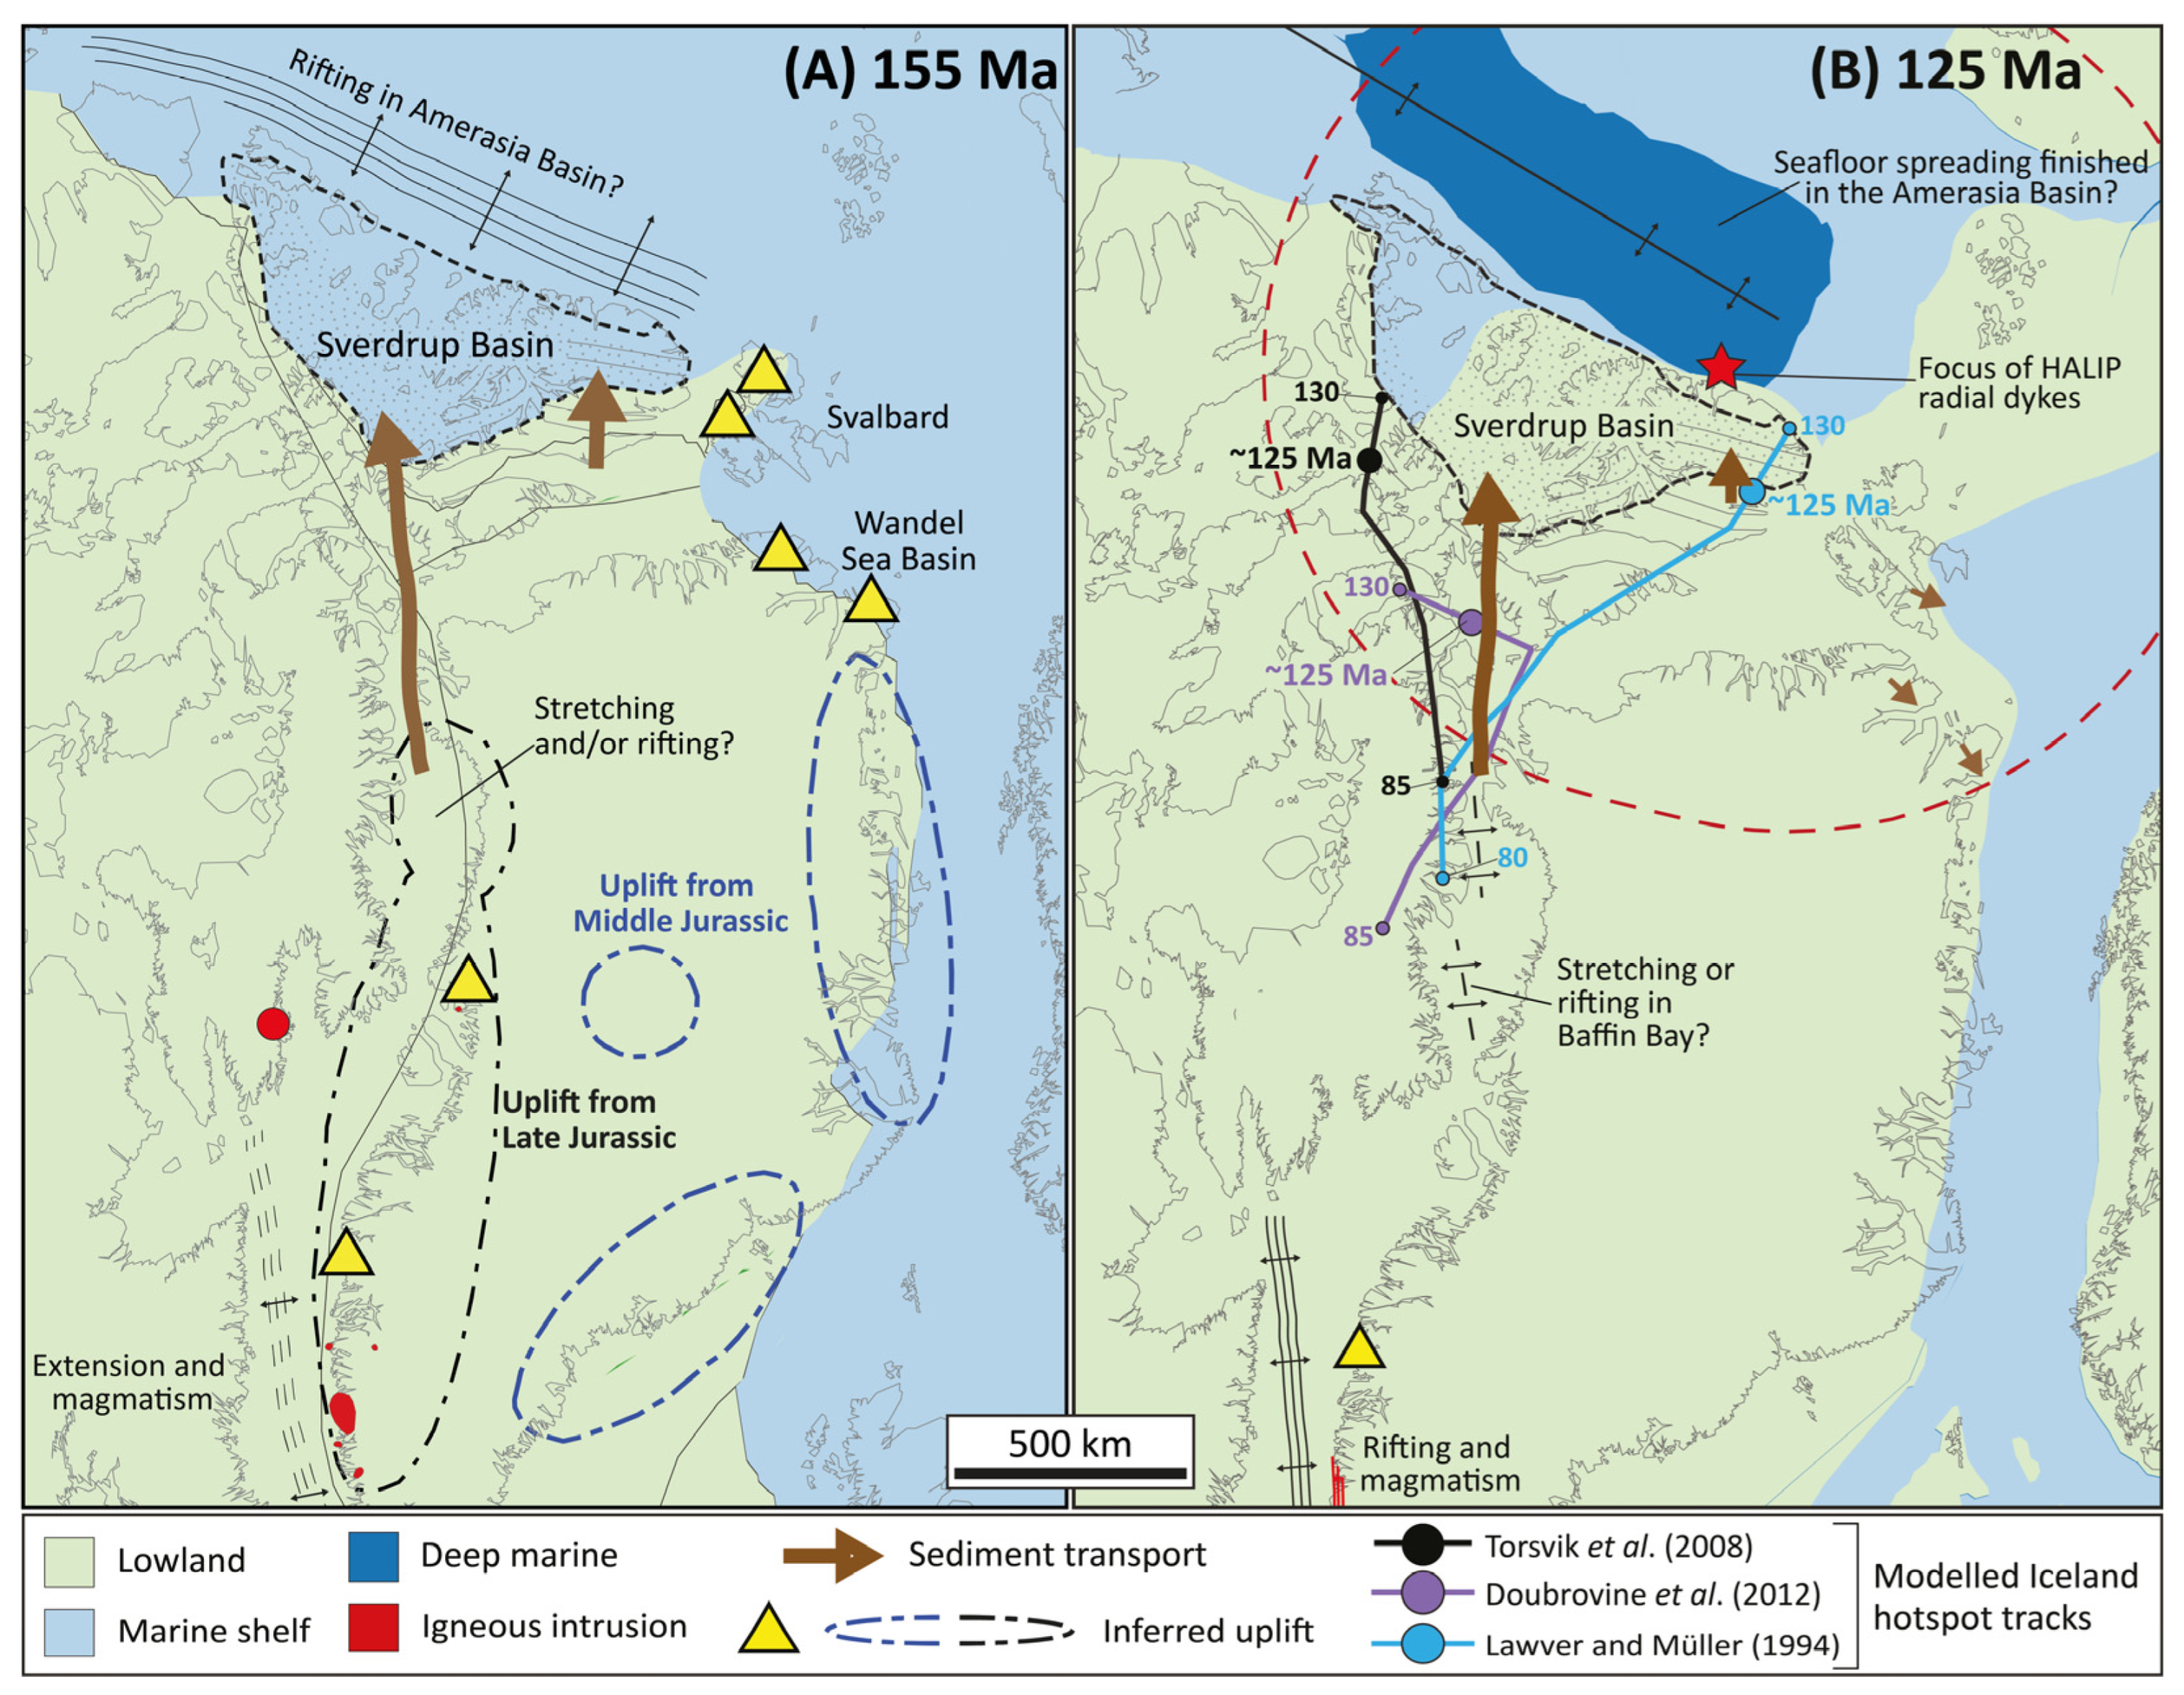
The appearance of higher-grade metamorphic detritus in the samples from central Ellesmere Island broadly correlates with the deposition of northern-derived sandstones of the Sandy Point Formation on the northern limb of the basin (e.g., [16,28,142]). The composition of the latter sandstones is consistent with the reworking of local Triassic strata [28], suggesting uplift along at least part of the Sverdrup Basin margin at this time. Moreover, in the southwest corner of the Sverdrup Basin (Prince Patrick Island area; Figure 1B), there is evidence of extension and subbasin development at this time [58,143], which has been interpreted to mark the onset of rifting in the adjacent Amerasia Basin [15,57]. Uplift and exhumation in the Sverdrup Basin southeast/east source area could be a distal response to rifting. In which case, uplift elsewhere along the rifting margin would be expected. Both northern Svalbard and eastern North Greenland are interpreted to have experienced uplift during the Late Jurassic (Figure 13A; [144,145,146]), although only two of the Svalbardian samples analysed by Dörr et al. [144] yielded Jurassic fission track ages; the rest have Cretaceous and younger ages, several of which overlap with HALIP magmatism (cf. [76]). Sediment supplied to the Lake Hazen area of the Sverdrup Basin lacks an obvious exhumation trend. Consequently, if the Amerasia Basin started to open during the Middle Jurassic, then its effect on exhumation rates to the southeast/east of the Sverdrup Basin was limited.
The Canadian–West Greenland conjugate margin also experienced extension and uplift during Late Jurassic and Cretaceous times (e.g., [153,155]), although unravelling the pre-Cenozoic exhumation history of the section proximal to the Sverdrup Basin is complicated by subsequent Eurekan orogenesis. Farther south along the West Greenland margin, dyke emplacements and changes in dyke composition indicate extension from Late Triassic times, with increased intensity during the Late Jurassic (c. 150 Ma), followed by regional rifting and further dyke emplacement during Early Cretaceous times (c. 133–140 Ma; [155]). (U–Th–Sm)/He isotope data from central West Greenland point to Middle Jurassic to Early Cretaceous uplift, which is interpreted as rift-flank uplift [149]. Late Jurassic and Early Cretaceous exhumation of southern and central West Greenland has also been inferred from apatite fission track data [152,153,161,162]. Whether extension and associated uplift within the West Greenland incipient rift zone propagated sufficiently far north to affect the inferred source area for the Sverdrup Basin is uncertain, although the timing of these events correlates with the deposition of the Awingak Formation (Figure 13A) and the lower part of the Isachsen Formation in the Sverdrup Basin, suggesting that the two may be related.
The emplacement of the Cretaceous HALIP also caused regional-scale uplift. This is clear from the input of north/northeastern-derived volcanic-rich sediments into the Sverdrup Basin during the deposition of the Christopher and Hassel formations (Figure 11C,D). Moreover, regressive sedimentation patterns during Hauterivian and younger times in the Canadian Arctic Islands, northern Greenland and Svalbard have been correlated and attributed to HALIP-related regional thermal doming, centred to the north of present-day Ellesmere Island [81,150,163]. Radiating dykes of c. 120–138 Ma age converge at a similar location (Figure 13B; [156]), which has been interpreted to mark the location of a mantle plume head [75,81,156,163]. Ineson et al. [150] inferred that HALIP uplift reached at least as far as northeast Greenland. This distance, when extended as a radius from the HALIP dyke convergence point, is sufficient to have affected the area to the southeast and east of the Sverdrup Basin (Figure 13B). Numerical and fluid dynamic models predict domal uplift of up to 1–2 km as a mantle plume impinges on the base of the lithosphere (e.g., [164,165,166]). The amount of uplift is notoriously difficult to measure, however, as reflected by widely varying estimates from the same large igneous province; for example, uplift estimates for the Emeishan Traps range from 0 to more than 1000 m (cf. [167,168]). Consequently, whilst there is evidence to support some regional-scale uplift from the emplacement of the HALIP, its overall magnitude and how much of this reached the south to east periphery are unconstrained. Conversely, the Iceland plume, which may or may not be related to HALIP magmatism [158,160,169,170], has been modelled as passing underneath the area to the south and/or east of the Sverdrup Basin during the Cretaceous (Figure 13B), on the way to its present location. If this is broadly correct, then the Iceland plume is perhaps more likely to have promoted uplift and exhumation of the inferred sediment source area than the emplacement of the HALIP magmatism farther to the north, by virtue of its closer proximity.
There is also the possibility that more cryptic crustal and/or mantle processes contributed to exhumation. The Sverdrup Basin succession contains numerous widespread unconformities [15,171,172], which have been inferred to record the effects of epeirogenic uplift, possibly due to intermittent changes in the speed and direction of tectonic plates [172]. The formation of intraplate inversion structures is controversial, however (e.g., [173] and references therein). Whilst the action of such processes cannot be excluded, in this instance, unequivocal geological evidence for their existence is lacking.
The progradations of the Sandy Point, Hiccles Cove, Awingak, Isachsen and Hassel formations into the Sverdrup Basin record intervals of increased sediment supply (e.g., [7,16]). Forced eustatic regression can be excluded as a driving mechanism since these progradational episodes occurred during an interval of rising sea levels (Figure 2; [174,175,176,177]). They could reflect pulses of uplift in the sediment source area arising from one or more of the aforementioned tectono-magmatic events, although the possibility that they are partly climate-controlled merits consideration. The exhumation trend is first apparent in samples from the Wilkie Point Group, although these could be from the Sandy Point (late Toarcian to Aalenian; [16,96]) or Hiccles Cove (Bathonian to Callovian; [96]) formations. A comparison with global temperature records suggests that both formations were deposited during intervals of inferred climatic cooling (Figure 2; e.g., [71,93,178,179,180,181]). Several studies have documented an increase in erosion rates during late Cenozoic cooling (e.g., [182,183,184,185,186]). The underlying driving mechanisms are debated; however, there is general agreement that it is linked to the presence of glacial ice. There is a lack of physical evidence for ice in the proximity of the Sverdrup Basin during Middle Jurassic times. Based on estimated palaeotemperatures [93], significant ice likely only occurred if there was existing topography. Conversely, the initial deposition of the Awingak, Isachsen and Hassel formations occurred during warming intervals (Figure 2). The Awingak and Isachsen formations were deposited under more variable temperatures (Figure 2); this is likely in part a reflection of the longer duration of deposition, although the possibility that a transitory, more variable climate facilitated enhanced denudation and sediment supply cannot be excluded. Precipitation trends are more difficult to assess. In broad terms, numerous reconstructions have inferred that sea level was relatively low during the Triassic Period, rose during Jurassic times and was high during the Cretaceous Period (e.g., [94,174,175,176,187,188,189,190,191,192]). In detail, estimates as to when the sea level started to rise range from Late Triassic (e.g., [94]) to Late Jurassic (e.g., [191]) times. Rising sea levels have been linked with the southward expansion of humid climate belts across North America during Late Jurassic to Cretaceous times [65,193]. It is possible that the deposition of sand-rich Middle Jurassic to Cretaceous units in the Sverdrup basin (Sandy Point to Hassel formations; Figure 2) is a reflection of this, with these units recording enhanced erosion of the sediment source area and/or sediment supply to the basin brought about by increased humidity, precipitation and ultimately sea level. The palynology dataset from the Sverdrup Basin also offers some support for this by indicating that humid conditions prevailed during at least the deposition of the Sandy Point, Isachsen and Hassel formations [63,71,73,74,99]. As climate exerts a fundamental control on physical erosion and chemical weathering rates, it is highly likely that it contributed to exhumation. Its significance relative to the other potential tectono-magmatic driving forces is, however, obfuscated by the resolution of the local climate record and sample ages. The effects of climate change would have been felt more severely in the sediment source area if significant topography existed. This would have increased the chance of alpine glacial ice formation and promoted orographic rainfall. Therefore, it may have been that climate modulated longer-term exhumation driven by tectono-magmatic processes.
Setting aside its uncertain origins, recognition of exhumation in the area to the southeast/east of the Sverdrup Basin from at least Middle Jurassic times offers a possible resolution as to whether the basin underwent rifting during Jurassic times. The Jurassic to Early Cretaceous sedimentary fill of the basin has been shown to thicken northwestwards and has been interpreted to record syn-rift sedimentation [53]. This has been used to argue in favour of Jurassic rifting in both the Sverdrup Basin and the adjacent Amerasia Basin [53,95]. Jurassic rifting in the Sverdrup Basin is contentious because, apart from in the southwest corner of the basin [58], there is no clear evidence of normal faulting within the basin at this time [15]. If exhumation and uplift affecting the southeastern Sverdrup Basin source area propagated northwards and impinged on the Sverdrup Basin, then it follows that its effects would have been felt more severely in the southeast of the basin compared to the northwest. Consequently, the asymmetric geometry of the Jurassic to Early Cretaceous sedimentary fill could reflect a reduced subsidence rate in the southeastern part of the basin rather than rifting in either the Sverdrup Basin or the adjacent Amerasia Basin.

6. Conclusions

Middle Jurassic to Cretaceous sandstones were analysed from the eastern Sverdrup Basin using a combination of optical petrography, conventional heavy mineral analysis, mineral grain chemistry, detrital zircon U–Pb geochronology and detrital zircon Hf isotope analysis. Samples from the Wilkie Point Group to the lower Christopher Formation and from the Hassel Formation are overwhelmingly quartz-rich and have restricted heavy mineral assemblages. They were predominantly to entirely reworked from strata of the Franklinian Basin and the Bylot basins to the southeast and/or east. Samples from central Ellesmere Island contain an increasing proportion of high-grade metamorphic detritus from Middle Jurassic times onwards. This is interpreted to reflect exhumation of the area to the southeast of the Sverdrup Basin from Middle Jurassic to Late Cretaceous times. The mechanisms driving exhumation are less clear owing to there being several processes that could have contributed. Exhumation may have its origins in Middle Jurassic extension and uplift along the northwest Sverdrup Basin margin. Samples from northern Ellesmere Island show no such exhumation trend, however, possibly arguing against large-scale rifting at this time. Late Jurassic to Early Cretaceous rift-flank uplift along the Canadian–West Greenland conjugate margins likely augmented exhumation subsequently. Early Cretaceous lithospheric doming linked with the proximity of the Iceland hotspot and the emplacement of the Cretaceous HALIP may also have contributed. Climate change also likely played a role in driving the exhumation of the Sverdrup Basin sediment source area, possibly by modulating the effects of longer term tectono-magmatic processes. The asymmetric thickness of Jurassic to Early Cretaceous strata across the Sverdrup Basin, interpreted elsewhere to record rifting in the Sverdrup and Amerasia basins, may instead be a distal effect of exhumation.

Supplementary Materials

The following supporting information can be downloaded at https://www.mdpi.com/article/10.3390/geosciences15080313/s1: Table S1: A list of the samples studied, their locations and the analyses undertaken, Table S2: Optical petrography point-count data, Table S3: Conventional heavy mineral data, Table S4: Apatite trace element data, Table S5: Garnet major element data, Table S6: Rutile trace element data, Table S7: Detrital zircon U–Pb isotope data, Table S8: Detrital zircon Lu–Hf isotope data.

Author Contributions

Conceptualisation, H.S., J.E.O., M.A.P., M.J.F. and A.C.M.; Methodology, A.C.M., D.F. and Q.G.C.; Formal Analysis, M.A.P., H.S., J.E.O., A.C.M., S.J.R. and B.L.-M.; Investigation, A.C.M., H.S., J.E.O., M.A.P., M.J.F., Q.G.C., S.S., S.J.R. and D.F.; Data Curation, M.A.P., H.S., J.E.O., A.C.M., S.J.R. and B.L.-M.; Writing—Original Draft Preparation, M.A.P.; Writing—Review and Editing, J.E.O., M.J.F., S.S., A.C.M., B.L.-M. and Q.G.C.; Visualisation, M.A.P. and S.S.; Project Administration and Supervision, H.S. and M.J.F. Author Stephen J. Rippington passed away prior to the publication of this manuscript. All other authors have read and agreed to the published version of the manuscript.

Funding

This research received no external funding.

Data Availability Statement

The data presented in this study are available in the Supplementary Materials.

Acknowledgments

This research was funded by CASP’s industrial sponsors. Ashton Embry (formerly Geological Survey of Canada; since retired) is acknowledged for kindly providing samples C403685 and C403733. We are grateful to several people who helped with the collection of the data presented herein, including: Rob Duller (University of Liverpool) and Peter Hülse (Munich Aerospace) for helping to collect samples from Slidre Fiord and the Sawtooth Range, respectively; Fiona Hyden (Oil Quest) for collecting some of the optical petrography data; Andy Carter (University College London), Joe Petrus (formerly Laurentian University, now Elemental Scientific Lasers), Heejin Jeon and Martin Whitehouse (both at the NORDSIMS facility, Swedish Natural History Museum), who helped to collect the detrital zircon U–Pb age data; Iain McDonald (Cardiff University) for collecting the apatite and rutile geochemical data; and Ian Millar (Geochronology and Tracers Facility, British Geological Survey), who helped to collect the detrital zircon Lu–Hf isotope data. Balz Kamber (Queensland University of Technology) is thanked for facilitating access to the ICP facility at Laurentian University. Constructive comments from three anonymous reviewers have helped to improve this paper and are very much appreciated.

Conflicts of Interest

The authors declare no conflicts of interest.

References

  1. Burden, E.T.; Langille, A.B. Stratigraphy and sedimentology of Cretaceous and Paleocene strata in half-grabens on the southeast coast of Baffin Island, Northwest Territories. Bull. Can. Pet. Geol. 1990, 38, 185–196. [Google Scholar]
  2. Haggart, J.W.; Dafoe, L.T.; Bell, K.M.; Williams, G.L.; Burden, E.T.; Currie, L.D.; Fensome, R.A.; Sweet, A.R. Historical development of a litho- and biostratigraphic framework for onshore Cretaceous-Paleocene deposits along western Baffin Bay. Geol. Surv. Can. Bull. 2022, 608, 107–135. [Google Scholar]
  3. Miall, A.D.; Balkwill, H.; Hopkins, W.S. Cretaceous and Tertiary Sediments of Eclipse Trough, Bylot Island Area, Arctic Canada, and Their Regional Setting. Geol. Surv. Can. Pap. 1980, 79, 1–20. [Google Scholar]
  4. Patchett, P.J.; Embry, A.F.; Ross, G.M.; Beauchamp, B.; Harrison, J.C.; Mayr, U.; Isachsen, C.E.; Rosenberg, E.J.; Spence, G.O. Sedimentary Cover of the Canadian Shield through Mesozoic Time Reflected by Nd Isotopic and Geochemical Results for the Sverdrup Basin, Arctic Canada. J. Geol. 2004, 112, 39–57. [Google Scholar] [CrossRef]
  5. Harrison, J.C.; St-Onge, M.; Petrov, O.; Strelnikov, S.; Lopatin, B.; Wilson, F.; Tella, S.; Paul, D.; Lynds, T.; Shokalsky, S. Geological Map of the Arctic; Geological Survey of Canada: Ottawa, ON, Canada, 2011; Map 2159A.
  6. Anfinson, O.A.; Leier, A.L.; Dewing, K.; Guest, B.; Stockli, D.F.; Embry, A.F. Insights into the Phanerozoic tectonic evolution of the northern Laurentian margin: Detrital apatite and zircon (U–Th)/He ages from Devonian strata of the Franklinian Basin, Canadian Arctic Islands. Can. J. Earth Sci. 2013, 50, 761–768. [Google Scholar] [CrossRef]
  7. Grist, A.M.; Zentilli, M. The thermal history of the Nares Strait, Kane Basin, and Smith Sound region in Canada and Greenland: Constraints from apatite fission-track and (U-Th-Sm)/He dating. Can. J. Earth Sci. 2005, 42, 1547–1569. [Google Scholar] [CrossRef]
  8. Grist, A.M.; Zentilli, M. Preliminary Apatite Fission Track Thermal History Modelling of the Nares Region of Eastern Ellesmere Island and Northwestern Greenland. Polarforschung 2006, 74, 113–127. [Google Scholar]
  9. McDannell, K.T.; Schneider, D.A.; Zeitler, P.K.; O’Sullivan, P.B.; Issler, D.R. Reconstructing deep-time histories from integrated thermochronology: An example from southern Baffin Island, Canada. Terra Nova 2019, 31, 189–204. [Google Scholar] [CrossRef]
  10. McGregor, E.D.; Nielsen, S.B.; Stephenson, R.A.; Petersen, K.D.; MacDonald, D.I.M. Long-term exhumation of a Palaeoproterozoic orogen and the role of pre-existing heterogeneous thermal crustal properties: A fission-track study of SE Baffin Island. J. Geol. Soc. 2013, 170, 877–891. [Google Scholar] [CrossRef]
  11. Spiegel, C.; Sohi, M.S.; Reiter, W.; Meier, K.; Ventura, B.; Lisker, F.; Estrada, S.; Piepjohn, K.; Berglar, K.; Koglin, N.; et al. Phanerozoic Tectonic and Sedimentation History of the Arctic: Constraints From Deep-Time Low-Temperature Thermochronology Data of Ellesmere Island and Northwest Greenland. Tectonics 2023, 42, e2022TC007579. [Google Scholar] [CrossRef]
  12. Allen, P.A. From landscapes into geological history. Nature 2008, 451, 274–276. [Google Scholar] [CrossRef]
  13. Caracciolo, L. Sediment generation and sediment routing systems from a quantitative provenance analysis perspective: Review, application and future development. Earth Sci. Rev. 2020, 209, 103226. [Google Scholar] [CrossRef]
  14. Whittaker, A.C.; Attal, M.; Allen, P.A. Characterising the origin, nature and fate of sediment exported from catchments perturbed by active tectonics. Basin Res. 2010, 22, 809–828. [Google Scholar] [CrossRef]
  15. Embry, A.F.; Beauchamp, B. Sverdrup Basin. In The Sedimentary Basins of the United States and Canada, 2nd ed.; Miall, A.D., Ed.; Elsevier: Amsterdam, The Netherlands, 2019; pp. 559–592. [Google Scholar]
  16. Embry, A.F. Mesozoic History of the Arctic Islands. In Geology of the Innuitian Orogen and Arctic Platform of Canada and Greenland; Trettin, H.P., Ed.; Geology of Canada no. 3; Geological Survey of Canada: Ottawa, ON, Canada, 1991; pp. 371–433. [Google Scholar]
  17. Galloway, B.J.; Dewing, K.; Beauchamp, B.; Matthews, W. Upper Paleozoic stratigraphy and detrital zircon geochronology along the northwest margin of the Sverdrup Basin, Arctic Canada: Insight into the paleogeographic and tectonic evolution of Crockerland. Can. J. Earth Sci. 2021, 58, 164–187. [Google Scholar] [CrossRef]
  18. Anfinson, O.A.; Embry, A.F.; Stockli, D.F. Geochronologic Constraints on the Permian–Triassic Northern Source Region of the Sverdrup Basin, Canadian Arctic Islands. Tectonophysics 2016, 691, 206–219. [Google Scholar] [CrossRef]
  19. Hadlari, T.; Dewing, K.; Matthews, W.A.; Alonso-Torres, D.; Midwinter, D. Early Triassic development of a foreland basin in the Canadian high Arctic: Implications for a Pangean Rim of Fire. Tectonophysics 2018, 736, 75–84. [Google Scholar] [CrossRef]
  20. Midwinter, D.; Hadlari, T.; Davis, W.J.; Dewing, K.; Arnott, R.W.C. Dual provenance signatures of the Triassic northern Laurentian margin from detrital-zircon U-Pb and Hf-isotope analysis of Triassic–Jurassic strata in the Sverdrup Basin. Lithosphere 2016, 8, 668–683. [Google Scholar] [CrossRef]
  21. Midwinter, D.; Hadlari, T.; Dewing, K.; Matthews, W.A. Disruption and localization of sediment pathways by continental extension: Detrital-zircon provenance change from upper Triassic to lower Jurassic in the northern Sverdrup Basin, Nunavut. Geol. Mag. 2024, 160, 2057–2066. [Google Scholar] [CrossRef]
  22. Miller, E.L.; Toro, J.; Gehrels, G.; Amato, J.M.; Prokopiev, A.; Tuchkova, M.I.; Akinin, V.V.; Dumitru, T.A.; Moore, T.E.; Cecile, M.P. New insights into Arctic paleogeography and tectonics from U-Pb detrital zircon geochronology. Tectonics 2006, 25, TC3013. [Google Scholar] [CrossRef]
  23. Omma, J.E.; Pease, V.; Scott, R.A. U–Pb SIMS zircon geochronology of Triassic and Jurassic sandstones on northwestern Axel Heiberg Island, northern Sverdrup Basin, Arctic Canada. In Arctic Petroleum Geology: Geological Society, London, Memoir; Spencer, A.M., Embry, A.F., Gautier, D.L., Stoupakova, A.V., Sørensen, K., Eds.; Geological Society of London: London, UK, 2011; Volume 35, pp. 559–566. [Google Scholar]
  24. Røhr, T.S.; Davis, W.; Andersen, T.; Dypvik, H.; Embry, A.F. Detrital zircon characteristics of the Lower Cretaceous Isachsen Formation, Sverdrup Basin: Source constraints from age and Hf isotope data. Can. J. Earth Sci. 2010, 47, 255–271. [Google Scholar] [CrossRef]
  25. Alonso-Torres, D.; Beauchamp, B.; Guest, B.; Hadlari, T.; Matthews, W. Late Paleozoic to Triassic arc magmatism north of the Sverdrup Basin in the Canadian Arctic: Evidence from detrital zircon U-Pb geochronology. Lithosphere 2018, 10, 426–445. [Google Scholar] [CrossRef]
  26. Jakobsson, M.; Mayer, L.A.; Bringensparr, C.; Castro, C.F.; Mohammad, R.; Johnson, P.; Ketter, T.; Accettella, D.; Amblas, D.; An, L.; et al. The International Bathymetric Chart of the Arctic Ocean Version 4.0. Sci. Data 2020, 7, 176. [Google Scholar] [CrossRef] [PubMed]
  27. Jackson, G.; Iannelli, T. Rift-related cyclic sedimentation in the Neohelikian Borden Basin, northern Baffin Island. Geol. Surv. Can. Pap. 1981, 81, 269–302. [Google Scholar]
  28. Pointon, M.A.; Smyth, H.; Omma, J.E.; Morton, A.C.; Schneider, S.; Hülse, P.; Rippington, S.J.; Lopez-Mir, B.; Crowley, Q.G.; Millar, I.; et al. A Multi-proxy Provenance Study of Late Carboniferous to Middle Jurassic Sandstones in the Eastern Sverdrup Basin and Its Bearing on Arctic Palaeogeographic Reconstructions. Geosciences 2023, 13, 10. [Google Scholar] [CrossRef]
  29. Balkwill, H.R. Evolution of Sverdrup Basin, Arctic Canada. Am. Assoc. Pet. Geol. Bull. 1978, 62, 1004–1028. [Google Scholar]
  30. Frisch, T. Reconnaissance Geology of the Precambrian Shield of Ellesmere, Devon and Coburg Islands, Arctic Archipelago: A Preliminary Account. Geol. Surv. Can. Pap. 1983, 82, 1–11. [Google Scholar]
  31. Frisch, T.; Hunt, P.A. U-Pb Zircon and Monazite Ages from the Precambrian Shield of Ellesmere and Devon Islands, Artic Archipelago. Geol. Surv. Can. Pap. 1988, 88, 117–125. [Google Scholar]
  32. St-Onge, M.R.; Van Gool, J.A.M.; Garde, A.A.; Scott, D.J. Correlation of Archaean and Palaeoproterozoic units between northeastern Canada and western Greenland: Constraining the pre-collisional upper plate accretionary history of the Trans-Hudson orogen. In Earth Accretionary Systems in Space and Time: Geological Society, London, Special Publication; Cawood, P.A., Kröner, A., Eds.; Geological Society of London: London, UK, 2009; Volume 318, pp. 193–235. [Google Scholar]
  33. Dawes, P.R. The proterozoic thule supergroup, Greenland and Canada: History, lithostratigraphy and development. Geol. Greenl. Surv. Bull. 1997, 174, 1–150. [Google Scholar] [CrossRef]
  34. Turner, E.C.; Long, D.G.F.; Rainbird, R.H.; Petrus, J.A.; Rayner, N.M. Late Mesoproterozoic rifting in Arctic Canada during Rodinia assembly: Impactogens, trans-continental far-field stress and zinc mineralisation. Terra Nova 2016, 28, 188–194. [Google Scholar] [CrossRef]
  35. Fahrig, W.; Christie, K.; Jones, D. Paleomagnetism of the Bylot basins: Evidence for Mackenzie continental tensional tectonics. Geol. Surv. Can. Pap. 1981, 81, 303–312. [Google Scholar]
  36. Thorsteinsson, R.; Tozer, E. Summary Account of Structural History of the Canadian Arctic Archipelago Since Precambrian Time. Geol. Surv. Can. Pap. 1960, 60–67, 1–25. [Google Scholar]
  37. Trettin, H.P. The Proterozoic to Late Silurian Record of Pearya. In Geology of the Innuitian Orogen and Arctic Platform of Canada and Greenland; Trettin, H.P., Ed.; Geology of Canada no.3; Geological Survey of Canada: Ottawa, ON, Canada, 1991; pp. 241–260. [Google Scholar]
  38. Anfinson, O.A.; Leier, A.L.; Embry, A.F.; Dewing, K. Detrital zircon geochronology and provenance of the Neoproterozoic to Late Devonian Franklinian Basin, Canadian Arctic Islands. Geol. Soc. Am. Bull. 2012, 124, 415–430. [Google Scholar] [CrossRef]
  39. Anfinson, O.A.; Leier, A.L.; Gaschnig, R.; Embry, A.F.; Dewing, K.; Colpron, M. U–Pb and Hf isotopic data from Franklinian Basin strata: Insights into the nature of Crockerland and the timing of accretion, Canadian Arctic Islands. Can. J. Earth Sci. 2012, 49, 1316–1328. [Google Scholar] [CrossRef]
  40. Dewing, K.; Hadlari, T. Franklinian Composite Tectono-Sedimentary Element, Canadian Arctic Islands. In Sedimentary Successions of the Arctic Region and Their Hydrocarbon Prospectivity: Geological Society, London, Memoir; Drachev, S.S., Brekke, H., Henriksen, E., Moore, T., Eds.; Geological Society of London: London, UK, 2024; Volume 57, M57–2016-2014. [Google Scholar]
  41. Thorsteinsson, R.; Tozer, E. Geology of the Arctic archipelago. In Geology and Economic Minerals of Canada: Econmic Geology Report No. 1, 5th ed.; Douglas, R.J.W., Ed.; Department of Energy, Mines and Resources: Ottawa, ON, Canada, 1970; pp. 547–590. [Google Scholar]
  42. Beranek, L.P.; Pease, V.; Scott, R.A.; Thomsen, T.B.; Mahoney, J.B. Detrital zircon geochronology of Ediacaran to Cambrian deep-water strata of the Franklinian basin, northern Ellesmere Island, Nunavut: Implications for regional stratigraphic correlations. Can. J. Earth Sci. 2013, 50, 1007–1018. [Google Scholar] [CrossRef]
  43. Dewing, K.; Harrison, J.C.; Pratt, B.R.; Mayr, U. A probable late Neoproterozoic age for the Kennedy Channel and Ella Bay formations, northeastern Ellesmere Island and its implications for passive margin history of the Canadian Arctic. Can. J. Earth Sci. 2004, 41, 1013–1025. [Google Scholar] [CrossRef]
  44. Trettin, H.P.; Mayr, U.; Long, G.D.F.; Packard, J.J. Cambrian to Early Devonian Basin Development, Sedimentation, and Volcanism, Arctic Islands. In Geology of the Innuitian Orogen and Arctic Platform of Canada and Greenland; Trettin, H.P., Ed.; Geology of Canada no. 3; Geological Survey of Canada: Ottawa, ON, Canada, 1991; pp. 165–238. [Google Scholar]
  45. Patchett, P.J.; Roth, M.A.; Canale, B.S.; de Freitas, T.A.; Harrison, J.C.; Embry, A.F.; Ross, G.M. Nd isotopes, geochemistry, and constraints on sources of sediments in the Franklinian mobile belt, Arctic Canada. GSA Bull. 1999, 111, 578–589. [Google Scholar] [CrossRef]
  46. Beranek, L.P.; Pease, V.; Hadlari, T.; Dewing, K. Silurian flysch successions of Ellesmere Island, Arctic Canada, and their significance to northern Caledonian palaeogeography and tectonics. J. Geol. Soc. 2015, 172, 201–212. [Google Scholar] [CrossRef]
  47. Embry, A.F. Middle-Upper Devonian Clastic Wedge of the Arctic Islands. In Geology of the Innuitian Orogen and Arctic Platform of Canada and Greenland; Trettin, H.P., Ed.; Geology of Canada no. 3; Geological Survey of Canada: Ottawa, ON, Canada, 1991; pp. 263–280. [Google Scholar]
  48. Embry, A.F. Middle-Upper Devonian sedimentation in the Canadian Arctic Islands and the Ellesmerian Orogeny. In Devonian of the World: Proceedings of the 2nd International Symposium on the Devonian System—Volume II: Sedimentation: Canadian Society of Petroleum Geologists, Memoir; McMillan, N.J., Embry, A.F., Glass, D.J., Eds.; Canadian Society of Petroleum Geologists: Calgary, AB, Canada, 1988; Volume 14, pp. 15–28. [Google Scholar]
  49. Embry, A.F.; Klovan, J.E. The Middle-Upper Devonian clastic wedge of the Franklinian geosyncline. Bull. Can. Pet. Geol. 1976, 24, 485–639. [Google Scholar]
  50. Embry, A.F. Petroleum prospectivity of the Triassic–Jurassic succession of Sverdrup Basin, Canadian Arctic Archipelago. In Arctic Petroleum Geology: Geological Society, London, Memoir; Spencer, A.M., Embry, A.F., Gautier, D.L., Stoupakova, A.V., Sørensen, K., Eds.; Geological Society of London: London, UK, 2011; Volume 35, pp. 545–558. [Google Scholar]
  51. Stephenson, R.; Boerstoel, J.; Embry, A.F.; Ricketts, B.D. Subsidence analysis and tectonic modeling of the Sverdrup Basin. In 1992 Proceedings, International Conference on Arctic Margins; Thurston, D.K., Fujita, K., Eds.; U.S. Department of the Interior, Minerals Management Service: Anchorage, AK, USA, 1994; pp. 149–154. [Google Scholar]
  52. Lopez-Mir, B.; Schneider, S.; Hülse, P. Fault activity and diapirism in the Mississippian to Late Cretaceous Sverdrup Basin: New insights into the tectonic evolution of the Canadian Arctic. J. Geodyn. 2018, 118, 55–65. [Google Scholar] [CrossRef]
  53. Hadlari, T.; Midwinter, D.; Galloway, J.M.; Dewing, K.; Durbano, A.M. Mesozoic rift to post-rift tectonostratigraphy of the Sverdrup Basin, Canadian Arctic. Mar. Pet. Geol. 2016, 76, 148–158. [Google Scholar] [CrossRef]
  54. Boutelier, J.; Cruden, A.; Brent, T.; Stephenson, R. Timing and mechanisms controlling evaporite diapirism on Ellef Ringnes Island, Canadian Arctic Archipelago. Basin Res. 2011, 23, 478–498. [Google Scholar] [CrossRef]
  55. Harrison, J.C.; Jackson, M.P.A. Exposed evaporite diapirs and minibasins above a canopy in central Sverdrup Basin, Axel Heiberg Island, Arctic Canada. Basin Res. 2014, 26, 567–596. [Google Scholar] [CrossRef]
  56. Jackson, M.P.A.; Harrison, J.C. An allochthonous salt canopy on Axel Heiberg Island, Sverdrup Basin, Arctic Canada. Geology 2006, 34, 1045–1048. [Google Scholar] [CrossRef]
  57. Embry, A.F.; Dixon, J. The age of the Amerasia Basin. In 1992 Proceedings, International Conference on Arctic Margins; Thurston, D.K., Fujita, K., Eds.; U.S. Department of the Interior, Minerals Management Service: Anchorage, AK, USA, 1994; pp. 289–295. [Google Scholar]
  58. Harrison, J.C.; Brent, T.A. Basins and fold belts of Prince Patrick Island and adjacent areas, Canadian Arctic Islands. Geol. Surv. Can. Bull. 2005, 560, 1–208. [Google Scholar]
  59. Ricketts, B. Basin analysis, Eureka Sound Group, Axel Heiberg and Ellesmere Islands, Canadian Arctic archipelago. Geol. Surv. Can. Mem. 1994, 439, 1–119. [Google Scholar]
  60. Piepjohn, K.; von Gosen, W.; Tessensohn, F. The Eurekan deformation in the Arctic: An outline. J. Geol. Soc. 2016, 173, 1007–1024. [Google Scholar] [CrossRef]
  61. Vaes, B.; van Hinsbergen, D.J.J.; van de Lagemaat, S.H.A.; van der Wiel, E.; Lom, N.; Advokaat, E.L.; Boschman, L.M.; Gallo, L.C.; Greve, A.; Guilmette, C.; et al. A global apparent polar wander path for the last 320 Ma calculated from site-level paleomagnetic data. Earth Sci. Rev. 2023, 245, 104547. [Google Scholar] [CrossRef]
  62. van Hinsbergen, D.J.J.; de Groot, L.V.; van Schaik, S.J.; Spakman, W.; Bijl, P.K.; Sluijs, A.; Langereis, C.G.; Brinkhuis, H. A Paleolatitude Calculator for Paleoclimate Studies. PLoS ONE 2015, 10, e0126946. [Google Scholar] [CrossRef] [PubMed]
  63. Galloway, J.M.; Sweet, A.R.; Swindles, G.T.; Dewing, K.; Hadlari, T.; Embry, A.F.; Sanei, H. Middle Jurassic to Lower Cretaceous paleoclimate of Sverdrup Basin, Canadian Arctic Archipelago inferred from the palynostratigraphy. Mar. Pet. Geol. 2013, 44, 240–255. [Google Scholar] [CrossRef]
  64. Wang, Y.; Huang, C.; Sun, B.; Quan, C.; Wu, J.; Lin, Z. Paleo-CO2 variation trends and the Cretaceous greenhouse climate. Earth Sci. Rev. 2014, 129, 136–147. [Google Scholar] [CrossRef]
  65. Hallam, A. A review of Mesozoic climates. J. Geol. Soc. 1985, 142, 433–445. [Google Scholar] [CrossRef]
  66. Sellwood, B.W.; Valdes, P.J. Mesozoic climates: General circulation models and the rock record. Sediment. Geol. 2006, 190, 269–287. [Google Scholar] [CrossRef]
  67. Kemper, E.; Schmitz, H.H. Stellate Nodules from the Upper Deer Bay Formation (Valanginian) of Arctic Canada. Geol. Surv. Can. Pap. 1975, 75–1C, 109–119. [Google Scholar]
  68. Schneider, S.; Kelly, S.R.A.; Mutterlose, J.; Herrle, J.O.; Hülse, P.; Jolley, D.W.; Schröder-Adams, C.J.; Lopez-Mir, B. Macrofauna and biostratigraphy of the Rollrock Section, northern Ellesmere Island, Canadian Arctic Islands—A comprehensive high latitude archive of the Jurassic–Cretaceous transition. Cretac. Res. 2020, 114, 104508. [Google Scholar] [CrossRef]
  69. Grasby, S.E.; McCune, G.E.; Beauchamp, B.; Galloway, J.M. Lower Cretaceous cold snaps led to widespread glendonite occurrences in the Sverdrup Basin, Canadian High Arctic. GSA Bull. 2017, 129, 771–787. [Google Scholar] [CrossRef]
  70. Price, G.D. The evidence and implications of polar ice during the Mesozoic. Earth Sci. Rev. 1999, 48, 183–210. [Google Scholar] [CrossRef]
  71. Nguyen, A.V.; Galloway, J.M.; Poulton, T.P.; Dutchak, A.R. Calibration of Middle to Upper Jurassic palynostratigraphy with Boreal ammonite zonations in the Canadian Arctic. Bull. Can. Pet. Geol. 2020, 68, 65–90. [Google Scholar]
  72. Galloway, J.M.; Tullius, D.N.; Evenchick, C.A.; Swindles, G.T.; Hadlari, T.; Embry, A. Early Cretaceous vegetation and climate change at high latitude: Palynological evidence from Isachsen Formation, Arctic Canada. Cretac. Res. 2015, 56, 399–420. [Google Scholar] [CrossRef]
  73. Hopkins, W.S., Jr.; Balkwill, H.R. Description, Palynology and Paleoecology of the Hassel Formation (Cretaceous) on Eastern Ellef Ringnes Island, District of Franklin. Geol. Surv. Can. Pap. 1973, 72, 1–21. [Google Scholar]
  74. Sulphur, K.C. Quantitative Palynological Analyses of Albian-Cenomanian (Lower to Upper Cretaceous) Strata in the Sverdrup Basin: Insights into Paleoecology, Paleoclimatology and Palynostratigraphy. Master’s Thesis, University of Calgary, Calgary, AB, Canada, 2015. [Google Scholar]
  75. Embry, A.F.; Osadetz, K.G. Stratigraphy and tectonic significance of Cretaceous volcanism in the Queen Elizabeth Islands, Canadian Arctic Archipelago. Can. J. Earth Sci. 1988, 25, 1209–1219. [Google Scholar] [CrossRef]
  76. Dockman, D.M.; Pearson, D.G.; Heaman, L.M.; Gibson, S.A.; Sarkar, C. Timing and origin of magmatism in the Sverdrup Basin, Northern Canada—Implications for lithospheric evolution in the High Arctic Large Igneous Province (HALIP). Tectonophysics 2018, 742–743, 50–65. [Google Scholar] [CrossRef]
  77. Estrada, S. Geochemical and Sr–Nd isotope variations within Cretaceous continental flood-basalt suites of the Canadian High Arctic, with a focus on the Hassel Formation basalts of northeast Ellesmere Island. Int. J. Earth Sci. 2015, 104, 1981–2005. [Google Scholar] [CrossRef]
  78. Estrada, S.; Damaske, D.; Henjes-Kunst, F.; Schreckenberger, B.; Oakey, G.N.; Piepjohn, K.; Eckelmann, K.; Linnemann, U. Multistage Cretaceous magmatism in the northern coastal region of Ellesmere Island and its relation to the formation of Alpha Ridge—Evidence from aeromagnetic, geochemical and geochronological data. Norw. J. Geol. 2016, 96, 65–95. [Google Scholar] [CrossRef]
  79. Estrada, S.; Henjes-Kunst, F. 40Ar-39Ar and U-Pb dating of Cretaceous continental rift-related magmatism on the northeast Canadian Arctic margin. Z. Dtsch. Ges. Geowiss. 2013, 164, 107–130. [Google Scholar] [CrossRef] [PubMed]
  80. Evenchick, C.A.; Davis, W.J.; Bédard, J.H.; Hayward, N.; Friedman, R.M. Evidence for protracted High Arctic large igneous province magmatism in the central Sverdrup Basin from stratigraphy, geochronology, and paleodepths of saucer-shaped sills. GSA Bull. 2015, 127, 1366–1390. [Google Scholar] [CrossRef]
  81. Maher, J.H.D. Manifestations of the Cretaceous High Arctic Large Igneous Province in Svalbard. J. Geol. 2001, 109, 91–104. [Google Scholar] [CrossRef]
  82. Naber, T.V.; Grasby, S.E.; Cuthbertson, J.P.; Rayner, N.; Tegner, C. New constraints on the age, geochemistry, and environmental impact of High Arctic Large Igneous Province magmatism: Tracing the extension of the Alpha Ridge onto Ellesmere Island, Canada. GSA Bull. 2020, 133, 1695–1711. [Google Scholar] [CrossRef]
  83. Bédard, J.H.; Troll, V.R.; Deegan, F.M.; Tegner, C.; Saumur, B.M.; Evenchick, C.A.; Grasby, S.E.; Dewing, K. High Arctic Large Igneous Province Alkaline Rocks in Canada: Evidence for Multiple Mantle Components. J. Petrol. 2021, 62, 1–31. [Google Scholar] [CrossRef]
  84. Osadetz, K.; Moore, P.R. Basic Volcanics in the Hassel Formation (Mid-Cretaceous) and Associated Intrusives, Ellesmere Island, District of Franklin, Northwest Territories. Geol. Surv. Can. Pap. 1988, 87, 1–19. [Google Scholar]
  85. Jowitt, S.M.; Williamson, M.-C.; Ernst, R.E. Geochemistry of the 130 to 80 Ma Canadian High Arctic Large Igneous Province (HALIP) Event and Implications for Ni-Cu-PGE Prospectivity. Econ. Geol. 2014, 109, 281–307. [Google Scholar] [CrossRef]
  86. Estrada, S.; Henjes-Kunst, F. Volcanism in the Canadian. Zeitschrift der Deutschen Geologischen Gesellschaft 2004, 154, 579–603. [Google Scholar] [CrossRef]
  87. Kingsbury, C.G.; Kamo, S.L.; Ernst, R.E.; Söderlund, U.; Cousens, B.L. U-Pb geochronology of the plumbing system associated with the Late Cretaceous Strand Fiord Formation, Axel Heiberg Island, Canada: Part of the 130–90 Ma High Arctic large igneous province. J. Geodyn. 2018, 118, 106–117. [Google Scholar] [CrossRef]
  88. Tarduno, J.A.; Brinkman, D.B.; Renne, P.R.; Cottrell, R.D.; Scher, H.; Castillo, P. Evidence for Extreme Climatic Warmth from Late Cretaceous Arctic Vertebrates. Science 1998, 282, 2241–2243. [Google Scholar] [CrossRef] [PubMed]
  89. Villeneuve, M.; Williamson, M.-C. 40Ar-39Ar dating of mafic magmatism from the Sverdrup Basin magmatic province. In Proceedings of the Fourth International Conference on Arctic Margins; Scott, R.A., Thurston, D.K., Eds.; U.S. Department of the Interior, Minerals Management Service: Anchorage, AK, USA, 2003; pp. 206–216. [Google Scholar]
  90. Davis, W.J.; Schröder-Adams, C.J.; Galloway, J.M.; Herrle, J.O.; Pugh, A.T. U–Pb geochronology of bentonites from the Upper Cretaceous Kanguk Formation, Sverdrup Basin, Arctic Canada: Constraints on sedimentation rates, biostratigraphic correlations and the late magmatic history of the High Arctic Large Igneous Province. Geol. Mag. 2017, 154, 757–776. [Google Scholar] [CrossRef]
  91. Pointon, M.A.; Flowerdew, M.J.; Hülse, P.; Schneider, S.; Whitehouse, M.J. Mixed local and ultra-distal volcanic ash deposition within the Upper Cretaceous Kanguk Formation, Sverdrup Basin, Canadian Arctic Islands. Geol. Mag. 2019, 156, 2067–2084. [Google Scholar] [CrossRef]
  92. Reinhardt, L.; Estrada, S.; Andruleit, H.; Dohrmann, R.; Piepjohn, K.; von Gosen, W.; Davis, D.W.; Davis, B. Altered volcanic ashes in Palaeocene and Eocene sediments of the Eureka Sound Group (Ellesmere Island, Nunavut, Arctic Canada). Z. Dtsch. Ges. Geowiss. 2013, 164, 131–147. [Google Scholar] [CrossRef]
  93. Scotese, C.R.; Song, H.; Mills, B.J.W.; van der Meer, D.G. Phanerozoic paleotemperatures: The earth’s changing climate during the last 540 million years. Earth Sci. Rev. 2021, 215, 103503. [Google Scholar] [CrossRef]
  94. van der Meer, D.G.; Scotese, C.R.; Mills, B.J.W.; Sluijs, A.; van den Berg van Saparoea, A.-P.; van de Weg, R.M.B. Long-term Phanerozoic global mean sea level: Insights from strontium isotope variations and estimates of continental glaciation. Gondwana Res. 2022, 111, 103–121. [Google Scholar] [CrossRef]
  95. Hadlari, T. Rift to Post-Rift Tectonostratigraphy of the Sverdrup Basin in Relation to Onset of the High Arctic Large Igneous Province (HALIP) in the Early Cretaceous, Arctic Canada. Geochem. Geophys. Geosyst. 2024, 25, e2023GC011411. [Google Scholar] [CrossRef]
  96. Embry, A.F. The Wilkie Point Group (Lower-Upper Jurassic), Sverdrup Basin, Arctic Islands. Geol. Surv. Can. Pap. 1984, 84–1B, 299–308. [Google Scholar]
  97. Cohen, K.M.; Finney, S.C.; Gibbard, P.L.; Fan, J.-X. The ICS international chronostratigraphic chart. Episodes 2013, 36, 199–204. [Google Scholar] [CrossRef]
  98. Ricketts, B. New formations in the Eureka Sound Group, Canadian Arctic Islands. Geol. Surv. Can. Pap. 1986, 86–1B, 363–374. [Google Scholar]
  99. Galloway, J.M.; Sweet, A.R.; Pugh, A.; Schröder-Adams, C.J.; Swindles, G.T.; Haggart, J.W.; Embry, A.F. Correlating middle Cretaceous palynological records from the Canadian High Arctic based on a section from the Sverdrup Basin and samples from the Eclipse Trough. Palynology 2012, 36, 277–302. [Google Scholar] [CrossRef]
  100. Ingersoll, R.V.; Bullard, T.F.; Ford, R.L.; Grimm, J.P.; Pickle, J.D.; Sares, S.W. The effect of grain size on detrital modes: A test of the Gazzi-Dickinson point-counting method. J. Sediment. Res. 1984, 54, 103–116. [Google Scholar]
  101. Folk, R.L. Petrology of Sedimentary Rocks; Hemphill Publishing Company: Austin, TX, USA, 1980; pp. 1–182. [Google Scholar]
  102. Pettijohn, F.J.; Potter, P.E.; Siever, R. Sand and Sandstone; Springer: New York, NY, USA, 1987; pp. 1–553. [Google Scholar]
  103. Morton, A.C. Chapter 8: Value of heavy minerals in sediments and sedimentary rocks for provenance, transport history and stratigraphic correlation. In Quantitative Mineralogy and Microanalysis of Sediments and Sedimentary Rocks: Mineralogical Association of Canada Short Course; Sylvester, P., Ed.; Mineralogical Association of Canada: Quebec, QC, Canada, 2012; Volume 42, pp. 133–165. [Google Scholar]
  104. Morton, A.C.; Hallsworth, C. Identifying provenance-specific features of detrital heavy mineral assemblages in sandstones. Sediment. Geol. 1994, 90, 241–256. [Google Scholar] [CrossRef]
  105. Galehouse, J.S. Point counting. In Procedures in Sedimentary Petrology; Carver, R.E., Ed.; John Wiley & Sons: Hoboken, NJ, USA, 1971; pp. 385–407. [Google Scholar]
  106. O’Sullivan, G.J.; Chew, D.; Kenny, G.; Henrichs, I.; Mulligan, D. The trace element composition of apatite and its application to detrital provenance studies. Earth Sci. Rev. 2020, 201, 103044. [Google Scholar] [CrossRef]
  107. Meinhold, G.; Anders, B.; Kostopoulos, D.; Reischmann, T. Rutile chemistry and thermometry as provenance indicator: An example from Chios Island, Greece. Sediment. Geol. 2008, 203, 98–111. [Google Scholar] [CrossRef]
  108. Watson, E.B.; Wark, D.A.; Thomas, J.B. Crystallization thermometers for zircon and rutile. Contrib. Mineral. Petrol. 2006, 151, 413–433. [Google Scholar] [CrossRef]
  109. Schönig, J.; von Eynatten, H.; Tolosana-Delgado, R.; Meinhold, G. Garnet major-element composition as an indicator of host-rock type: A machine learning approach using the random forest classifier. Contrib. Mineral. Petrol. 2021, 176, 98. [Google Scholar] [CrossRef]
  110. Stacey, J.S.; Kramers, J.D. Approximation of terrestrial lead isotope evolution by a two-stage model. Earth Planet. Sci. Lett. 1975, 26, 207–221. [Google Scholar] [CrossRef]
  111. Ludwig, K.R. On the Treatment of Concordant Uranium-Lead Ages. Geochim. Cosmochim. Acta 1998, 62, 665–676. [Google Scholar] [CrossRef]
  112. Ludwig, K.R. User’s Manual for Isoplot 3.75: A Geochronological Toolkit for Microsoft Excel; Berkeley Geochronological Centre: Berkeley, CA, USA, 2012; Volume 5, p. 75. [Google Scholar]
  113. Thomas, R.J.; Spencer, C.; Bushi, A.M.; Baglow, N.; Boniface, N.; de Kock, G.; Horstwood, M.S.A.; Hollick, L.; Jacobs, J.; Kajara, S.; et al. Geochronology of the central Tanzania Craton and its southern and eastern orogenic margins. Precambrian Res. 2016, 277, 47–67. [Google Scholar] [CrossRef]
  114. Söderlund, U.; Patchett, P.J.; Vervoort, J.D.; Isachsen, C.E. The 176Lu decay constant determined by Lu–Hf and U–Pb isotope systematics of Precambrian mafic intrusions. Earth Planet. Sci. Lett. 2004, 219, 311–324. [Google Scholar] [CrossRef]
  115. Bouvier, A.; Vervoort, J.D.; Patchett, P.J. The Lu–Hf and Sm–Nd isotopic composition of CHUR: Constraints from unequilibrated chondrites and implications for the bulk composition of terrestrial planets. Earth Planet. Sci. Lett. 2008, 273, 48–57. [Google Scholar] [CrossRef]
  116. Hamilton, N.E.; Ferry, M. ggtern: Ternary Diagrams Using ggplot2. J. Stat. Softw. Code Snippets 2018, 87, 1–17. [Google Scholar] [CrossRef]
  117. Andersen, T.; Kristoffersen, M.; Elburg, M.A. Visualizing, interpreting and comparing detrital zircon age and Hf isotope data in basin analysis—A graphical approach. Basin Res. 2017, 30, 132–147. [Google Scholar] [CrossRef]
  118. Hadlari, T.; Davis, W.J.; Dewing, K. A pericratonic model for the Pearya terrane as an extension of the Franklinian margin of Laurentia, Canadian Arctic. Geol. Soc. Am. Bull. 2014, 126, 182–200. [Google Scholar] [CrossRef]
  119. Malone, S.J.; McClelland, W.C.; Gosen, W.v.; Piepjohn, K. Detrital zircon U-Pb and Lu-Hf analysis of Paleozoic sedimentary rocks from the Pearya terrane and Ellesmerian Fold Belt (northern Ellesmere Island): A comparison with Circum-Arctic datasets and their implications on terrane tectonics. In Circum-Arctic Structural Events: Tectonic Evolution of the Arctic Margins and Trans-Arctic Links with Adjacent Orogens: Geological Society of America, Special Paper; Piepjohn, K., Strauss, J.V., Reinhardt, L., McClelland, W.C., Eds.; Geological Society of America: Boulder, CO, USA, 2018; Volume 541, pp. 231–254. [Google Scholar]
  120. Sircombe, K.N. Mountains in the shadows of time: Three-dimensional density distribution mapping of U-Pb isotopic data as a visualization aid for geochronological information in concordia diagrams. Geochem. Geophys. Geosyst. 2006, 7, Q07013. [Google Scholar] [CrossRef]
  121. Griffin, W.L.; Wang, X.; Jackson, S.E.; Pearson, N.J.; O’Reilly, S.Y.; Xu, X.; Zhou, X. Zircon chemistry and magma mixing, SE China: In-situ analysis of Hf isotopes, Tonglu and Pingtan igneous complexes. Lithos 2002, 61, 237–269. [Google Scholar] [CrossRef]
  122. Sundell, K.E.; Saylor, J.E. Two-Dimensional Quantitative Comparison of Density Distributions in Detrital Geochronology and Geochemistry. Geochem. Geophys. Geosyst. 2021, 22, e2020GC009559. [Google Scholar] [CrossRef]
  123. Embry, A.F. Stratigraphic subdivision of the Awingak Formation (Upper Jurassic) and revision of the Hiccles Cove Formation (Middle Jurassic), Sverdrup Basin, Arctic Islands. Geol. Surv. Can. Pap. 1986, 86–1B, 341–349. [Google Scholar]
  124. Roy, K. Isachsen Formation, Amund Ringnes Island, District of Franklin. Geol. Surv. Can. Pap. 1973, 73, 269–273. [Google Scholar]
  125. Roy, K. Transport Directions in the Isachsen Formation (Lower Cretaceous), Sverdrup Islands, District of Franklin. Geol. Surv. Can. Pap. 1974, 75, 351–353. [Google Scholar]
  126. Tullius, D.; Leier, A.; Galloway, J.; Embry, A.; Pedersen, P. Sedimentology and stratigraphy of the Lower Cretaceous Isachsen Formation: Ellef Ringnes Island, Sverdrup Basin, Canadian Arctic Archipelago. Mar. Pet. Geol. 2014, 57, 135–151. [Google Scholar] [CrossRef]
  127. Embry, A.F. Stratigraphy of the Early Cretaceous Isachsen Formation, Sverdrup Basin and postulated sandstone occurrence on the Arctic continental shelf. In Proceedings of the GeoCanada 2010—Working with the Earth, Calgary, AB, Canada, 10–14 May 2010. [Google Scholar]
  128. Vermeesch, P. Dissimilarity measures in detrital geochronology. Earth Sci. Rev. 2018, 178, 310–321. [Google Scholar] [CrossRef]
  129. Beauchamp, B.; Alonso-Torres, D.; Piepjohn, K.; Thériault, P.; Grasby, S.E. Early Carboniferous syn-rift sedimentation in the Sverdrup Basin (Yelverton Pass area, northern Ellesmere Island, Arctic Canada): A solution to the Okse Bay problem. In Circum-Arctic Structural Events: Tectonic Evolution of the Arctic Margins and Trans-Arctic Links with Adjacent Orogens: Geological Society of America, Special Paper; Piepjohn, K., Strauss, J.V., Reinhardt, L., McClelland, W.C., Eds.; Geological Society of America: Boulder, CO, USA, 2018; Volume 541, pp. 255–284. [Google Scholar]
  130. Vermeesch, P.; Resentini, A.; Garzanti, E. An R package for statistical provenance analysis. Sediment. Geol. 2016, 336, 14–25. [Google Scholar] [CrossRef]
  131. Frisch, T.; Morgan, W.; Dunning, G. Reconnaissance geology of the Precambrian Shield on Ellesmere and Coburg Islands, Canadian Arctic Archipelago. Geol. Surv. Can. Pap. 1978, 78-1A, 135–138. [Google Scholar]
  132. Deer, W.A.; Howie, R.A.; Zussman, J. An Introduction to the Rock-Forming Minerals, 3rd ed.; Mineralogical Society of Great Britain and Ireland: London, UK, 2013; pp. 1–498. [Google Scholar]
  133. Ricketts, B. Delta evolution in the Eureka Sound Group, western Axel Heiberg Island: The transition from wave-dominated to fluvial-dominated deltas. Geol. Surv. Can. Bull. 1991, 402, 1–72. [Google Scholar]
  134. Núñez-Betelu, L.; Hills, L.; Krause, F.F.; Mclntyre, D. Upper Cretaceous paleoshorelines of the northeastern Sverdrup Basin, Ellesmere Island, Canadian Arctic Archipelago. In 1994 Proceedings, International Conference on Arctic Margins; Simakov, K.V., Thurston, D.K., Eds.; Russian Academy of Sciences Far East Branch: Magadan, Russia, 1994; pp. 43–49. [Google Scholar]
  135. Morton, A.C.; Hallsworth, C. Chapter 7 Stability of Detrital Heavy Minerals During Burial Diagenesis. In Heavy Minerals in Use: Developments in Sedimentology; Mange, M.A., Wright, D.T., Eds.; Elsevier: Amsterdam, The Netherlands, 2007; Volume 58, pp. 215–245. [Google Scholar]
  136. Morton, A.C. Influences of provenance and diagenesis on detrital garnet suites in the Paleocene Forties Sandstone, central North Sea. J. Sediment. Res. 1987, 57, 1027–1032. [Google Scholar] [CrossRef]
  137. Grantz, A.; Hart, P.E.; Childers, V.A. Geology and tectonic development of the Amerasia and Canada Basins, Arctic Ocean. In Arctic Petroleum Geology: Geological Society, London, Memoir; Spencer, A.M., Embry, A.F., Gautier, D.L., Stoupakova, A.V., Sørensen, K., Eds.; Geological Society of London: London, UK, 2011; Volume 35, pp. 771–799. [Google Scholar]
  138. Nikishin, A.M.; Petrov, E.I.; Cloetingh, S.; Malyshev, N.A.; Morozov, A.F.; Posamentier, H.W.; Verzhbitsky, V.E.; Freiman, S.I.; Rodina, E.A.; Startseva, K.F.; et al. Arctic ocean mega project: Paper 2—Arctic stratigraphy and regional tectonic structure. Earth Sci. Rev. 2021, 217, 103581. [Google Scholar] [CrossRef]
  139. Miller, E.L.; Meisling, K.E.; Akinin, V.V.; Brumley, K.; Coakley, B.J.; Gottlieb, E.S.; Hoiland, C.W.; O’Brien, T.M.; Soboleva, A.; Toro, J. Circum-Arctic Lithosphere Evolution (CALE) Transect C: Displacement of the Arctic Alaska–Chukotka microplate towards the Pacific during opening of the Amerasia Basin of the Arctic. In Circum-Arctic Lithosphere Evolution: Geological Society, London, Special Publication; Pease, V., Coakley, B., Eds.; Geological Society of London: London, UK, 2018; Volume 460, pp. 57–120. [Google Scholar]
  140. Alvey, A.; Gaina, C.; Kusznir, N.J.; Torsvik, T.H. Integrated crustal thickness mapping and plate reconstructions for the high Arctic. Earth Planet. Sci. Lett. 2008, 274, 310–321. [Google Scholar] [CrossRef]
  141. Shephard, G.E.; Müller, R.D.; Seton, M. The tectonic evolution of the Arctic since Pangea breakup: Integrating constraints from surface geology and geophysics with mantle structure. Earth Sci. Rev. 2013, 124, 148–183. [Google Scholar] [CrossRef]
  142. Embry, A.F. Crockerland—The northwest source area for the Sverdrup Basin, Canadian Arctic Islands. In Arctic Geology and Petroleum Potential: Norwegian Petroleum Society, Special Publication; Vorren, T.O., Bergsager, E., Dahl-Stamnes, Ø.A., Holter, E., Johansen, B., Lie, E., Lund, T.B., Eds.; Norwegian Petroleum Society: Stavanger, Norway, 1993; Volume 2, pp. 205–216. [Google Scholar]
  143. Harrison, J.C.; Embry, A.F.; Poulton, T.P. Field Observations on the Structural and Depositional History of Prince Patrick Island and Adjacent Areas, Canadian Arctic Islands. Geol. Surv. Can. Pap. 1988, 88–1D, 41–49. [Google Scholar]
  144. Dörr, N.; Lisker, F.; Clift, P.D.; Carter, A.; Gee, D.G.; Tebenkov, A.M.; Spiegel, C. Late Mesozoic–Cenozoic exhumation history of northern Svalbard and its regional significance: Constraints from apatite fission track analysis. Tectonophysics 2012, 514–517, 81–92. [Google Scholar] [CrossRef]
  145. Olaussen, S.; Larssen, G.B.; Helland-Hansen, W.; Johannessen, E.P.; Nøttvedt, A.; Riis, F.; Rismyhr, B.; Smelror, M.; Worsley, D. Mesozoic strata of Kong Karls Land, Svalbard, Norway; a link to the northern Barents Sea basins and platforms. Norw. J. Geol. 2018, 98, 1–69. [Google Scholar] [CrossRef]
  146. Japsen, P.; Green, P.F.; Chalmers, J.A. Thermo-tectonic development of the Wandel Sea Basin, North Greenland. GEUS Bull. 2021, 45, 5299. [Google Scholar] [CrossRef]
  147. Müller, R.D.; Cannon, J.; Qin, X.; Watson, R.J.; Gurnis, M.; Williams, S.; Pfaffelmoser, T.; Seton, M.; Russell, S.H.J.; Zahirovic, S. GPlates: Building a Virtual Earth Through Deep Time. Geochem. Geophys. Geosyst. 2018, 19, 2243–2261. [Google Scholar] [CrossRef]
  148. Zahirovic, S.; Eleish, A.; Doss, S.; Pall, J.; Cannon, J.; Pistone, M.; Tetley, M.G.; Young, A.; Fox, P. Subduction and carbonate platform interactions. Geosci. Data J. 2022, 9, 371–383. [Google Scholar] [CrossRef]
  149. Cao, W.; Zahirovic, S.; Flament, N.; Williams, S.; Golonka, J.; Müller, R.D. Improving global paleogeography since the late Paleozoic using paleobiology. Biogeosciences 2017, 14, 5425–5439. [Google Scholar] [CrossRef]
  150. Ineson, J.R.; Hovikoski, J.; Sheldon, E.; Piasecki, S.; Alsen, P.; Fyhn, M.B.W.; Bjerager, M.; Dybkjær, K.; Guarnieri, P.; Lauridsen, B.W.; et al. Regional impact of Early Cretaceous tectono-magmatic uplift in the Arctic: Implications of new data from eastern North Greenland. Terra Nova 2021, 33, 284–292. [Google Scholar] [CrossRef]
  151. Danišík, M.; Kirkland, C.L. Thermochronometry constraints on south West Greenland passive continental margin development. Commun. Earth Environ. 2023, 4, 124. [Google Scholar] [CrossRef]
  152. Japsen, P.; Green, P.F.; Chalmers, J.A.; Bonow, J.M. Episodes of post-Caledonian burial and exhumation in Greenland and Fennoscandia. Earth Sci. Rev. 2024, 248, 104626. [Google Scholar] [CrossRef]
  153. Jess, S.; Stephenson, R.; Roberts, D.H.; Brown, R. Differential erosion of a Mesozoic rift flank: Establishing the source of topography across Karrat, central West Greenland. Geomorphology 2019, 334, 138–150. [Google Scholar] [CrossRef]
  154. Heaman, L.M.; Pell, J.; Grütter, H.S.; Creaser, R.A. U–Pb geochronology and Sr/Nd isotope compositions of groundmass perovskite from the newly discovered Jurassic Chidliak kimberlite field, Baffin Island, Canada. Earth Planet. Sci. Lett. 2015, 415, 183–199. [Google Scholar] [CrossRef]
  155. Larsen, L.M.; Heaman, L.M.; Creaser, R.A.; Duncan, R.A.; Frei, R.; Hutchison, M. Tectonomagmatic events during stretching and basin formation in the Labrador Sea and the Davis Strait: Evidence from age and composition of Mesozoic to Palaeogene dyke swarms in West Greenland. J. Geol. Soc. 2009, 166, 999–1012. [Google Scholar] [CrossRef]
  156. Buchan, K.L.; Ernst, R.E. A giant circumferential dyke swarm associated with the High Arctic Large Igneous Province (HALIP). Gondwana Res. 2018, 58, 39–57. [Google Scholar] [CrossRef]
  157. Doubrovine, P.V.; Steinberger, B.; Torsvik, T.H. Absolute plate motions in a reference frame defined by moving hot spots in the Pacific, Atlantic, and Indian oceans. J. Geophys. Res. Solid Earth 2012, 117, B09101. [Google Scholar] [CrossRef]
  158. Lawver, L.A.; Müller, R.D. Iceland hotspot track. Geology 1994, 22, 311–314. [Google Scholar] [CrossRef]
  159. Torsvik, T.H.; Müller, R.D.; Van der Voo, R.; Steinberger, B.; Gaina, C. Global plate motion frames: Toward a unified model. Rev. Geophys. 2008, 46, 2007RG000227. [Google Scholar] [CrossRef]
  160. Gaina, C.; Medvedev, S.; Torsvik, T.H.; Koulakov, I.; Werner, S.C. 4D Arctic: A Glimpse into the Structure and Evolution of the Arctic in the Light of New Geophysical Maps, Plate Tectonics and Tomographic Models. Surv. Geophys. 2014, 35, 1095–1122. [Google Scholar] [CrossRef]
  161. Japsen, P.; Bonow, J.M.; Green, P.F.; Chalmers, J.A.; Lidmar-Bergström, K. Elevated, passive continental margins: Long-term highs or Neogene uplifts? New evidence from West Greenland. Earth Planet. Sci. Lett. 2006, 248, 330–339. [Google Scholar] [CrossRef]
  162. Japsen, P.; Green, P.F.; Bonow, J.M.; Rasmussen, E.S.; Chalmers, J.A.; Kjennerud, T. Episodic uplift and exhumation along North Atlantic passive margins: Implications for hydrocarbon prospectivity. In Petroleum Geology: From Mature Basins to New Frontiers—Proceedings of the 7th Petroleum Geology Conference; Vining, B.A., Pickering, S.C., Eds.; Geological Society of London: London, UK, 2010; pp. 979–1004. [Google Scholar]
  163. Døssing, A.; Jackson, H.R.; Matzka, J.; Einarsson, I.; Rasmussen, T.M.; Olesen, A.V.; Brozena, J.M. On the origin of the Amerasia Basin and the High Arctic Large Igneous Province—Results of new aeromagnetic data. Earth Planet. Sci. Lett. 2013, 363, 219–230. [Google Scholar] [CrossRef]
  164. Campbell, I.H.; Griffiths, R.W. Implications of mantle plume structure for the evolution of flood basalts. Earth Planet. Sci. Lett. 1990, 99, 79–93. [Google Scholar] [CrossRef]
  165. Farnetani, C.G.; Richards, M.A. Numerical investigations of the mantle plume initiation model for flood basalt events. J. Geophys. Res. Solid Earth 1994, 99, 13813–13833. [Google Scholar] [CrossRef]
  166. White, R.; McKenzie, D. Magmatism at rift zones: The generation of volcanic continental margins and flood basalts. J. Geophys. Res. Solid Earth 1989, 94, 7685–7729. [Google Scholar] [CrossRef]
  167. He, B.; Xu, Y.-G.; Chung, S.-L.; Xiao, L.; Wang, Y. Sedimentary evidence for a rapid, kilometer-scale crustal doming prior to the eruption of the Emeishan flood basalts. Earth Planet. Sci. Lett. 2003, 213, 391–405. [Google Scholar] [CrossRef]
  168. Ukstins Peate, I.; Bryan, S.E. Re-evaluating plume-induced uplift in the Emeishan large igneous province. Nat. Geosci. 2008, 1, 625–629. [Google Scholar] [CrossRef]
  169. Forsyth, D.A.; Morel-A-L’Huissier, P.; Asudeh, I.; Green, A.G. Alpha Ridge and iceland-products of the same plume? J. Geodyn. 1986, 6, 197–214. [Google Scholar] [CrossRef]
  170. Asudeh, I.; Green, A.G.; Forsyth, D.A. Canadian expedition to study the Alpha Ridge complex: Results of the seismic refraction survey. Geophys. J. Int. 1988, 92, 283–301. [Google Scholar] [CrossRef]
  171. Embry, A.F. A tectonic origin for Third-order depositional sequences in extensional basins–Implications for basin modeling. In Quantitative Dynamic Stratigraphy; Cross, T., Ed.; Prentice Hall: Hoboken, NJ, USA, 1990; pp. 491–501. [Google Scholar]
  172. Embry, A.F.; Beauchamp, B.; Dewing, K.; Dixon, J. Episodic tectonics in the Phanerozoic succession of the Canadian High Arctic and the “10-million-year flood”. In Circum-Arctic Structural Events: Tectonic Evolution of the Arctic Margins and Trans-Arctic Links with Adjacent Orogens: Geological Society of America, Special Paper; Piepjohn, K., Strauss, J.V., Reinhardt, L., McClelland, W.C., Eds.; Geological Society of America: Boulder, CO, USA, 2019; Volume 541. [Google Scholar]
  173. Lasabuda, A.P.E.; Johansen, N.S.; Laberg, J.S.; Faleide, J.I.; Senger, K.; Rydningen, T.A.; Patton, H.; Knutsen, S.-M.; Hanssen, A. Cenozoic uplift and erosion of the Norwegian Barents Shelf—A review. Earth Sci. Rev. 2021, 217, 103609. [Google Scholar] [CrossRef]
  174. Haq, B.U. Jurassic sea-level variations: A reappraisal. GSA Today 2018, 28, 4–10. [Google Scholar] [CrossRef]
  175. Haq, B.U. Cretaceous eustasy revisited. Glob. Planet. Chang. 2014, 113, 44–58. [Google Scholar] [CrossRef]
  176. Marcilly, C.M.; Torsvik, T.H.; Conrad, C.P. Global Phanerozoic sea levels from paleogeographic flooding maps. Gondwana Res. 2022, 110, 128–142. [Google Scholar] [CrossRef]
  177. van der Meer, D.G.; van den Berg van Saparoea, A.P.H.; van Hinsbergen, D.J.J.; van de Weg, R.M.B.; Godderis, Y.; Le Hir, G.; Donnadieu, Y. Reconstructing first-order changes in sea level during the Phanerozoic and Neoproterozoic using strontium isotopes. Gondwana Res. 2017, 44, 22–34. [Google Scholar] [CrossRef]
  178. Reolid, M.; Ruebsam, W.; Reolid, J.; Benton, M.J. Impact of early Toarcian climatic changes on marine reptiles: Extinction and recovery. Earth Sci. Rev. 2024, 259, 104965. [Google Scholar] [CrossRef]
  179. Rogov, M.A.; Zverkov, N.G.; Zakharov, V.A.; Arkhangelsky, M.S. Marine Reptiles and Climates of the Jurassic and Cretaceous of Siberia. Stratigr. Geol. Correl. 2019, 27, 398–423. [Google Scholar] [CrossRef]
  180. Korte, C.; Hesselbo, S.P.; Ullmann, C.V.; Dietl, G.; Ruhl, M.; Schweigert, G.; Thibault, N. Jurassic climate mode governed by ocean gateway. Nat. Commun. 2015, 6, 10015. [Google Scholar] [CrossRef] [PubMed]
  181. Scotese, C.R.; Vérard, C.; Burgener, L.; Elling, R.P.; Kocsis, A.T. The Cretaceous world: Plate tectonics, palaeogeography and palaeoclimate. In Cretaceous Project 200 Volume 1: The Cretaceous World: Geological Society, London, Special Publication; Hart, M.B., Batenburg, S.J., Huber, B.T., Price, G.D., Thibault, N., Wagreich, M., Walaszczyk, I., Eds.; Geological Society of London: London, UK, 2025; Volume 544, pp. 31–202. [Google Scholar]
  182. Herman, F.; Seward, D.; Valla, P.G.; Carter, A.; Kohn, B.; Willett, S.D.; Ehlers, T.A. Worldwide acceleration of mountain erosion under a cooling climate. Nature 2013, 504, 423–426. [Google Scholar] [CrossRef] [PubMed]
  183. Peizhen, Z.; Molnar, P.; Downs, W.R. Increased sedimentation rates and grain sizes 2–4 Myr ago due to the influence of climate change on erosion rates. Nature 2001, 410, 891–897. [Google Scholar] [CrossRef] [PubMed]
  184. Molnar, P. Late Cenozoic increase in accumulation rates of terrestrial sediment: How might climate change have affected erosion rates? Annu. Rev. Earth Planet. Sci. 2004, 32, 67–89. [Google Scholar] [CrossRef]
  185. Herman, F.; Champagnac, J.-D. Plio-Pleistocene increase of erosion rates in mountain belts in response to climate change. Terra Nova 2016, 28, 2–10. [Google Scholar] [CrossRef]
  186. Molnar, P.; England, P. Late Cenozoic uplift of mountain ranges and global climate change: Chicken or egg? Nature 1990, 346, 29–34. [Google Scholar] [CrossRef]
  187. Hallam, A. Pre-Quaternary Sea-Level Changes. Annu. Rev. Earth Planet. Sci. 1984, 12, 205–243. [Google Scholar] [CrossRef]
  188. Haq, B.U. Triassic eustatic variations reexamined. GSA Today 2018, 28, 4–9. [Google Scholar] [CrossRef]
  189. Vérard, C.; Hochard, C.; Baumgartner, P.O.; Stampfli, G.M.; Liu, M. Geodynamic evolution of the Earth over the Phanerozoic: Plate tectonic activity and palaeoclimatic indicators. J. Palaeogeogr. 2015, 4, 167–188. [Google Scholar] [CrossRef]
  190. Wright, N.M.; Seton, M.; Williams, S.E.; Whittaker, J.M.; Müller, R.D. Sea-level fluctuations driven by changes in global ocean basin volume following supercontinent break-up. Earth Sci. Rev. 2020, 208, 103293. [Google Scholar] [CrossRef]
  191. Young, A.; Flament, N.; Williams, S.E.; Merdith, A.; Cao, X.; Müller, R.D. Long-term Phanerozoic sea level change from solid Earth processes. Earth Planet. Sci. Lett. 2022, 584, 117451. [Google Scholar] [CrossRef]
  192. Karlsen, K.S.; Domeier, M.; Gaina, C.; Conrad, C.P. A tracer-based algorithm for automatic generation of seafloor age grids from plate tectonic reconstructions. Comput. Geosci. 2020, 140, 104508. [Google Scholar] [CrossRef]
  193. Hallam, A. Continental humid and arid zones during the Jurassic and Cretaceous. Palaeogeogr. Palaeoclimatol. Palaeoecol. 1984, 47, 195–223. [Google Scholar] [CrossRef]
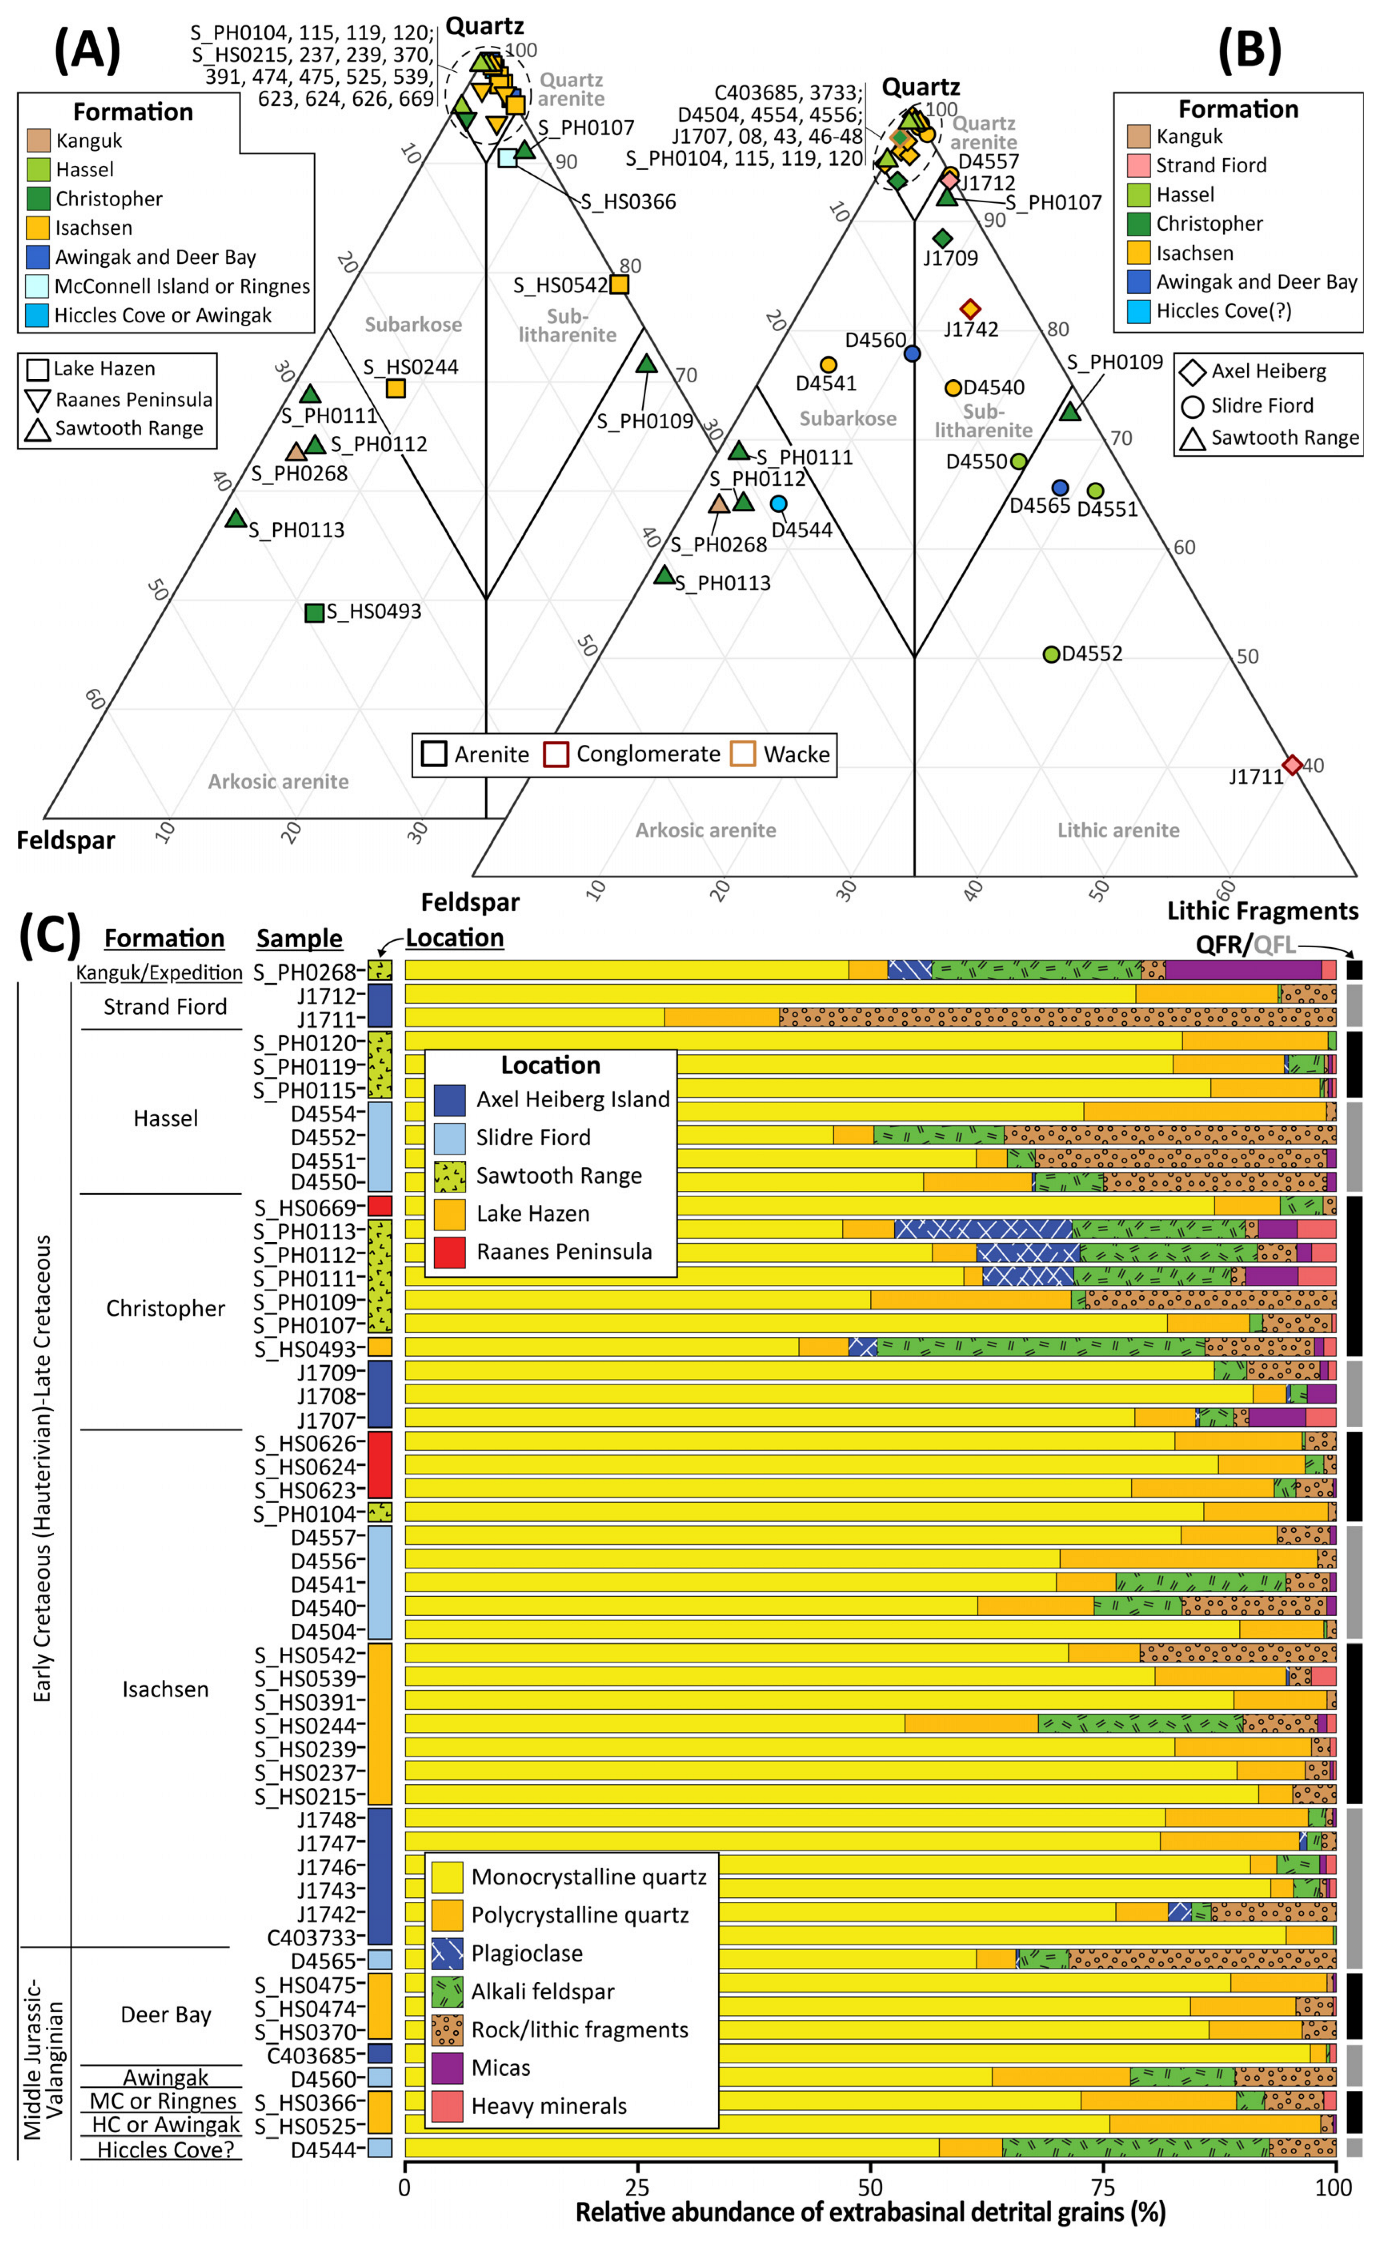
Figure 3. (A) Quartz–feldspar–rock fragment (QFR) ternary diagram showing point-count data collected using the traditional/Indiana counting method. (B) Quartz–feldspar–lithic fragment (QFL) ternary diagram showing point-count data collected using the Gazzi–Dickinson method. Samples from the Sawtooth Range were counted using both methods and are consequently drawn in figures A and B; these samples plot in near identical locations in both plots, supporting that, in this instance, comparing data from the two methods does not introduce a significant bias. Compositional fields shown are from Pettijohn et al. [102]. Both ternary diagrams were drawn in R version 4.3 using the ggtern package [116] and are partially clipped, with the area comprising 0–30% quartz not shown because it contains no samples. (C) Bar charts showing the relative abundance of extrabasinal detrital grains as determined by point counting. QFR = quartz, feldspar and rock fragments (traditional/Indiana method data); QFL = quartz, feldspar and lithic fragments (Gazzi–Dickinson method data). HC = Hiccles Cove; MC = McConnell Island. The traditional/Indiana point-count data are drawn for the Sawtooth Range samples.
Geosciences 15 00313 g003
Figure 4. Conventional heavy mineral data. Sample numbers in red indicate assemblages based on <100 counts. Minerals plotted as “other” comprise calcic amphibole, clinopyroxene, gahnite and orthopyroxene. ATi = apatite:tourmaline index, GZi = garnet:zircon index, RuZi = rutile:zircon index, MZi = monazite:zircon index and CZi = chrome spinel:zircon index (after [104]). ZTR index = sum of zircon, tourmaline and rutile as a percentage of total transparent heavy minerals. Open circles denote provenance-sensitive index values based on fewer than 30 counts. Data from sample C403685 are redrawn from Omma et al. [23]. Cr-spinel = chrome spinel; HC = Hiccles Cove; Isl = Island; MC = McConnell Island.
Geosciences 15 00313 g004
Figure 5. Bar chart summarising the likely source rocks from which the apatite grains were derived. Apatite grains were classified following O’Sullivan et al. [106].
Geosciences 15 00313 g005
Figure 6. Bar chart summarising the likely source rocks from which the garnet grains were derived. Garnet grains were classified following Schönig et al. [109]. J = Jurassic; MC = McConnell Island; Tr = Triassic.
Geosciences 15 00313 g006
Figure 7. Bar chart summarising the likely source rocks from which the rutile grains were derived. The grains were classified into metapelite and metamafic types following Meinhold et al. [107]. Rutile temperatures were estimated using the Zr-in-rutile thermometer [108]. undiff = undifferentiated.
Geosciences 15 00313 g007
Figure 8. Probability density plots showing the detrital zircon U–Pb age data obtained from the Middle Jurassic to Cretaceous samples analysed. Data >10% discordant are not shown. Approximate depositional ages shown in the left-hand panel (brown bars) are from Figure 2. Histograms are also drawn in the left-hand plots (grey bars; 10 Ma bin width). The plots were drawn in R version 4.3 using the Detzrcr package [117]. Published data from the Franklinian Basin succession are from Anfinson et al. [38,39], Beranek et al. [42,46], Hadlari et al. [118], Malone et al. [119] and Spiegel et al. [11]. Data from the Borden Basin (one of the Bylot basins) are from Turner et al. [34]. n is the number of analyses used to construct each age spectrum.
Geosciences 15 00313 g008
Figure 9. (A) U–Pb age versus εHf(t) scatter plot showing data from sample C403685. Detrital zircon U–Pb age data from sample C403685 are from Omma et al. [23], whilst the combined U–Pb age and Lu–Hf isotope data from the Danish River, Okse Bay and Isachsen formations are from Malone et al. [119] and Røhr et al. [24]; all literature data were reprocessed using U–Pb concordia ages. Analyses with U–Pb ages >10% discordant are not shown. The red ellipses surrounding sample C403685 data points are two-dimensional probability distributions drawn using analytical uncertainties in R version 4.3 using code modified from Sircombe [120]; they are drawn at the 2s confidence level. The depleted mantle trend is drawn assuming a present-day composition of 176Lu/177Hf = 0.0384 and 176Hf/177Hf = 0.28325 [121]. (B) Two-dimensional multidimensional scaling plot of U–Pb age and Lu–Hf isotope likeness. The analysis helps to visualise similarities and differences in detrital zircon U–Pb ages and εHf(t) values for the data plotted in Figure 9A by reducing each sample dataset to a single point; samples that plot closer together have more similar U–Pb ages and εHf(t) values than those that plot farther away. Dimension 1 primarily records the difference in zircon U–Pb ages and εHf(t) values between: (1) northern-derived Triassic and Middle Jurassic sandstones of the eastern Sverdrup Basin, which are dominated by <600 Ma ages and include juvenile (positive) εHf(t) values, and (2) samples of the Franklinian Basin or derived therefrom, which are characterised by older U–Pb ages and lack very juvenile εHf(t) values. Dimension 2 reveals differences in U–Pb age and/or εHf(t) values between samples within these two groups. Through this analysis, the dataset from sample C403685 is shown to be similar to the majority of samples from the Franklinian Basin or derived therefrom, supporting a Franklinian Basin provenance. This was indicated by the detrital zircon U–Pb age dataset and is corroborated by the new Hf isotope dataset. The plot was drawn using DZstats2D [122]. The data and symbology used are the same in both figures.
Geosciences 15 00313 g009
Figure 10. A two-dimensional multi-dimensional scaling plot showing the dissimilarity in U–Pb age spectra between samples from the Sverdrup, Franklinian and Borden basins. This analysis reveals that there are four distinct provenance-indicative age groups within the dataset, which, through inspection of the underlying data, are identified as c. 200–360, 500–700, 900–2100 and >1750 Ma. These lie towards the margins of the plot. Large c. 200–360 Ma age populations are prevalent in Triassic strata on the northern limb of the eastern Sverdrup Basin, whilst large c. 500–700 Ma age populations are common in the Upper Devonian levels of the Franklinian Basin. These two age groups are inferred as recording sediment input from the north of the Sverdrup and Franklinian basins, respectively; their sources are both enigmatic and contentious (e.g., see [18,20,28,38]). More importantly, however, by Middle Jurassic times, the enigmatic sediment transport systems supplying these zircons were no longer in operation. Consequently, where such detrital zircons are encountered in the Middle Jurassic and younger samples of this study, they were likely reworked from local older strata (bold italic labels in the plot). Samples dominated by c. 900–2100 Ma ages are the most common within the available detrital zircon U–Pb age dataset. This group comprises samples from the Silurian to Middle Devonian strata of the Franklinian Basin and numerous Sverdrup Basin samples ranging from Carboniferous to Cretaceous age. Samples from the Borden Basin and Neoproterozoic–Cambrian levels of the Franklinian Basin are characterised by large >1750 Ma age groups (specifically c. 1750–2100 and 2250–2900 Ma age populations). As the Borden basins samples are inferred as being sourced from the Canadian-Greenlandic Shield [34], this age group likely also reflects direct shield sediment input. It is not possible to differentiate between a recycled (Franklinian/Bylot basins) and a direct shield input using detrital zircon U–Pb geochronology. Several samples form linear arrays between the end-member provenance-indicative age groups, which are picked out in the plot by the grey arrows. These samples possess more mixed age spectra; where they plot provides insight as to which sediment sources likely contributed detritus. Dissimilarity was estimated using the Kolmogorov–Smirnov statistic [128]. Samples analysed as part of this study have bold labels. All other samples are from the following literature sources: Sverdrup Basin = Alonso-Torres et al. [25], Anfinson et al. [18], Beauchamp et al. [129], Evenchick et al. [80], Galloway et al. [17], Hadlari et al. [19], Malone et al. [119], Midwinter et al. [20,21], Miller et al. [22], Omma et al. [23], Pointon et al. [28] and Røhr et al. [24]; Franklinian Basin = Anfinson et al. [38,39], Beranek et al. [42,46], Hadlari et al. [118], Malone et al. [119] and Spiegel et al. [11]; Borden Basin (one of the Bylot basins) = Turner et al. [34]. The figure was drawn in R version 4.3 using code from the Provenance package [130].
Geosciences 15 00313 g010
Figure 11. (AE). Maps showing inferred sediment supply directions and sources for Late Jurassic to Cretaceous lithostratigraphic units of the Sverdrup Basin. The basin axis is redrawn from Embry and Beauchamp [15]. All plots are drawn at the same scale. NP–C = Neoproterozoic–Cambrian.
Geosciences 15 00313 g011
Figure 12. A summary diagram illustrating the main changes in sediment composition that are interpreted to indicate exhumation of the sediment source area. Only samples from central Ellesmere Island with an inferred southern/eastern provenance direction are included in the figure. The black arrows indicate the stratigraphic resolution of the changes in composition observed; a shift towards increasing metamorphic grade, through inferred exhumation, is first recorded in Middle Jurassic sandstones of the Wilkie Point Group, as an increase in abundance of garnet and granulite-facies rutile grains. The increase in abundance of >1750 Ma detrital zircons up-section marks a decreasing sediment contribution from Silurian–Middle Devonian strata of the Franklinian Basin and an increasing contribution from Neoproterozoic–Cambrian strata of the Franklinian Basin, strata of the Bylot basins and/or the Canadian-Greenlandic Shield. Sample numbers in red mark heavy mineral assemblages based on <100 counts. Data from the Heiberg and older formations are redrawn from Pointon et al. [28]. HC = Hiccles Cove; UHP = ultra-high pressure.
Geosciences 15 00313 g012
Figure 13. Schematic palaeogeographic reconstruction at (A) 155 Ma (Kimmeridgian) and (B) 125 Ma (Barremian–Aptian). The figures were drawn in GPlates v. 2.5 [147,148]. The palaeogeography is from Cao et al. [149]; the palaeogeography drawn in (B) was modified according to Embry [16], Ineson et al. [150] and Olaussen et al. [145]. Instances of inferred uplift are drawn from the works of Danišík and Kirkland [151], Dörr et al. [144], Japsen et al. [152], Jess et al. [153] and Olaussen et al. [145]. Igneous intrusions on Baffin Island and southwest Greenland are redrawn from Heaman et al. [154] and Larsen et al. [155], respectively. The focus of the HALIP radiating dyke swarm (red star) is redrawn from Buchan and Ernst [156]; the red dashed circle in (B) denotes the approximate radius of uplift from this focal point inferred from the work of Ineson et al. [150]. Inferred Iceland hotspot tracks [157,158,159] are also illustrated; note that the Doubrovine et al. [157] and Torsvik et al. [159] models are redrawn from Gaina et al. [160]. (A,B) are drawn at the same scale and use the same symbology.
Geosciences 15 00313 g013
Disclaimer/Publisher’s Note: The statements, opinions and data contained in all publications are solely those of the individual author(s) and contributor(s) and not of MDPI and/or the editor(s). MDPI and/or the editor(s) disclaim responsibility for any injury to people or property resulting from any ideas, methods, instructions or products referred to in the content.