Review

Impact of Aerosols on Cloud Microphysical Processes: A Theoretical Review

by
Kécia Maria Roberto da Silva
1,*,
Dirceu Luís Herdies
1,*,
Paulo Yoshio Kubota
1,
Caroline Bresciani
2 and
Silvio Nilo Figueroa
1
1
National Institute for Space Research, Cachoeira Paulista, São Paulo 12630-000, Brazil
2
Federal Institute of Santa Catarina, Florianópolis 88020-300, Brazil
*
Authors to whom correspondence should be addressed.
Geosciences 2025, 15(8), 312; https://doi.org/10.3390/geosciences15080312
Submission received: 8 June 2025 / Revised: 23 July 2025 / Accepted: 23 July 2025 / Published: 11 August 2025
(This article belongs to the Section Climate and Environment)

Abstract

The direct relationship between aerosols and clouds strongly influences the effects of clouds on the global climate. Aerosol particles act as cloud condensation nuclei (CCN) and ice nuclei (IN), affecting cloud formation, microphysics, and precipitation, as well as increasing the reflection of solar radiation at the cloud tops. Processes such as gas-to-particle conversion and new particle formation (NPF) control aerosol properties that, together with meteorological conditions, regulate cloud droplet nucleation through Köhler theory and related effects. The indirect aerosol effects described by Twomey and Albrecht demonstrate how changes in aerosols impact droplet number, cloud lifetime, and precipitation efficiency. Cloud microphysical processes, including droplet growth, collision-coalescence, and solid-phase mechanisms such as riming, vapor diffusion, and aggregation, shape precipitation development in warm, cold, and mixed-phase clouds. Ice nucleation remains a significant uncertainty due to the diversity of aerosol types and nucleation modes. This work synthesizes these physical interactions to better understand how the chemical and physical properties of aerosols influence cloud and precipitation processes, supporting improvements in weather and climate prediction models despite numerical challenges arising from the complexity of aerosol–cloud interactions.

1. Introduction

Understanding the influence of aerosols on cloud droplet formation is essential to clarifying the effects of human activities on the climate system and the hydrological cycle [1], whose impacts can manifest across different spatial and temporal scales, from hours to centuries, due to changes in cloud microphysical processes, energy deposition in the atmosphere, and surface temperature [2]. These particles can significantly influence cloud composition and alter the Earth’s albedo [3].
In thick clouds, where the base is warm and the top is cold, small droplets activated by aerosols ascend easily, releasing latent heat and freezing upon reaching the freezing height [1]. This phenomenon favors both the expansion of cloud cover and the increase in cloud top height [4,5,6]. Additionally, latent heat exchange and compositional changes during convective upward and downward transport lead to various transformations in particle size [7]. In contrast, in clouds composed solely of liquid water, an increase in aerosol concentration leads to the formation of a larger number of smaller droplets, which hinders precipitation and prolongs cloud lifetime [8,9]. In this regard, Khatri et al. (2022) [1] highlight that aerosol-induced changes in cloud properties occur primarily through modifications in droplet size.
The inverse relationship between droplet size and cloud lifetime is described by the second indirect aerosol effect. This second indirect effect, known as the “Albrecht effect” or the cloud lifetime effect, refers to the impact of aerosols on cloud formation, lifetime, and precipitation development [10,11,12].
The formation of cloud droplets up to the raindrop stage involves several microphysical processes, such as nucleation growth, condensation growth, growth through the collection of similarly sized droplets, and collision-coalescence, where larger drops collect smaller ones. The collision-coalescence process is observed as the primary mechanism responsible for rain formation in warm clouds. Without this process, the cloud’s lifetime is extended, retaining more water without precipitation [7,13,14]. Subsequently, the growth of raindrops leaves the environment subsaturated, inhibiting the formation of new cloud droplets and forcing cloud dissipation, marking the end of its lifecycle.
Typically, large cloud condensation nuclei (CCN, large aerosols) form cloud droplets first. These droplets fall at a velocity determined by their radius, growing through collision and coalescence with other droplets. When a droplet reaches its terminal velocity, it attains a sufficient size for precipitation, typically ranging from 100 μm to 1 mm, occurring on a timescale of minutes.
Global climate models struggle to capture the complex interactions of cloud and aerosol microphysical processes because they rely on parameterizations that can be empirical and incomplete [15]. These representations remain a challenge, and since they are not yet well represented in current climate models, they cause large variations in weather and climate change predictions [16,17].
Recent studies have shown cloud responses to aerosols under effects in the entrainment interface layer (EIL), widely observed in stratocumulus clouds, with the main effects being (i) sedimentation–entrainment, where smaller droplets prolong liquid water retention, and (ii) evaporation–entrainment, which accelerates evaporation. According to [17], the EIL is a thin layer, a few tens of meters thick, located between the cloud top and the upper boundary of turbulent mixing influence. This layer has intermediate properties between the cloud and the layer above it, acting as a source of dry and warm air entrained into the cloud.
Yeom et al. (2025) [15] conducted experiments in the Pi chamber to investigate the microphysical responses of stratocumulus clouds under different entrainment conditions. They observed that when aerosols are entrained at the top of stratocumulus clouds, they can act as CCN, altering droplet size distribution, cloud lifetime, and precipitation efficiency. Furthermore, they indicated that the presence of aerosols in the free troposphere tends to break up stratocumulus clouds, strengthening the evaporation–entrainment feedback. Additionally, they concluded that the sign and magnitude of aerosol-induced effects on clouds are sensitive to environmental conditions as well as energy and water budget constraints [18,19].
In this context, a study by Jiwen Fan et al. (2013) [6] provides a comprehensive analysis of how aerosols affect deep convective cloud (DCC) coverage, cloud-top height, and radiative forcing. The authors observed that even without thermodynamic growth, associated with additional latent heat release during freezing, aerosols significantly impact cloud evolution. This impact is linked to the microphysical effect of aerosols, which plays a crucial role in the maturity and dissipation stages of clouds, leading to a significant increase in cloud coverage and thickness while promoting the formation of smaller and more persistent ice particles in the stratiform regions of DCCs. The analyses indicate that the thermodynamic effect contributes approximately 27% to the total increase in cloud coverage, while the indirect aerosol effect manifests as atmospheric radiative heating of 3– 5   W·m 2 and surface cooling between 5 and 8   W·m 2 . These findings were corroborated by extensive measurements conducted in three different environments.
Both liquid water and ice particles, as well as aerosols in clear-sky conditions, influence the planet’s radiation balance by scattering or absorbing shortwave and longwave radiation. In the case of aerosols, this process is known as the direct effect [20,21]. Indirectly, aerosols mainly impact cloud radiative properties, particularly albedo. This effect, known as the “albedo effect” or simply the “Twomey effect” (first indirect effect), suggests that an increase in droplet concentration and a reduction in their effective radius enhance cloud reflectivity and brightness [7,22].
Considering the diversity of atmospheric aerosols in terms of composition, origin, and response to environmental conditions, this study presents an analysis of the main mechanisms through which these particles affect cloud formation and evolution. The indirect effects of aerosols, as proposed by Twomey (1977) [23] and Albrecht (1989) [10] are discussed, as well as droplet activation (both homogeneous and heterogeneous), Köhler theory, the modes of ice nucleation (homogeneous and heterogeneous), and the microphysical processes associated with the growth of droplets and ice crystals. Aspects such as droplet size distribution, terminal velocity of hydrometeors, aerosol sources, cloud phases, and the impact of aerosols on precipitation are also addressed, highlighting the uncertainties and complexities of aerosol–cloud interactions.

2. General Theoretical Aspects of Aerosol-Cloud Interaction

Research on atmospheric aerosols has advanced substantially in recent decades, particularly regarding their characterization, including sources, chemical compositions, transformations, trajectories, and interactions with radiation [24]. These aerosols, of both anthropogenic and biogenic origin, with organic and inorganic chemical nature, exhibit high heterogeneity, which complicates the understanding of activation processes such as their role as cloud condensation nuclei (CCN) and ice nuclei (IN). The molecular diversity and complexity of these particles pose challenges to numerical modeling, thereby limiting the representation of their effects on cloud microphysics and climate [25].
Figure 1 describes the main climatic effects of aerosols, highlighting their modification of the optical properties of clouds, impact on precipitation, and the resulting climate cooling effect [26].
It is well established that high concentrations of aerosols acting as CCN inhibit precipitation by redistributing water vapor among a greater number of nuclei, resulting in smaller droplets, increased optical thickness, enhanced albedo, and prolonged cloud lifetime [7,10,27].
Beyond their effects on liquid clouds, empirical evidence also highlights the role of aerosols in the formation of glaciated clouds. A study by Creamean et al. (2013) [28], for instance, presented direct measurements of biogenic aerosols and mineral dust involved in the formation of ice and mid-level clouds over the western United States, demonstrating their significant influence on precipitation processes.
Desert dust particles, in particular, are relevant to climate feedback mechanisms, as they absorb and scatter radiation and act as ice-nucleating particles [29,30,31]. In this context, Mahowald et al. (2014) [32] identified Saharan dust as the main atmospheric source of iron and phosphorus, key nutrients for phytoplankton productivity in oligotrophic oceanic regions, underscoring its role in marine biogeochemistry and global oxygen production.
Figure 2 shows the chemical composition of submicron particles at the Earth’s surface, expressed as mass mixing ratios. Organic compounds and sulfate are widespread, while nitrate and ammonium are more frequent in regions with higher air pollution due to the short atmospheric lifetime of their precursors. In contrast, compounds that lead to sulfate and organic aerosols, such as SO 2 , dimethyl disulfide, and terpenes, are more persistent in the atmosphere or broadly distributed. Seasonal variation was observed only over the northeastern Atlantic, with the larger pie chart representing summer and the smaller one representing winter. The data were obtained primarily through aerosol mass spectrometry during field campaigns conducted around the world [24].

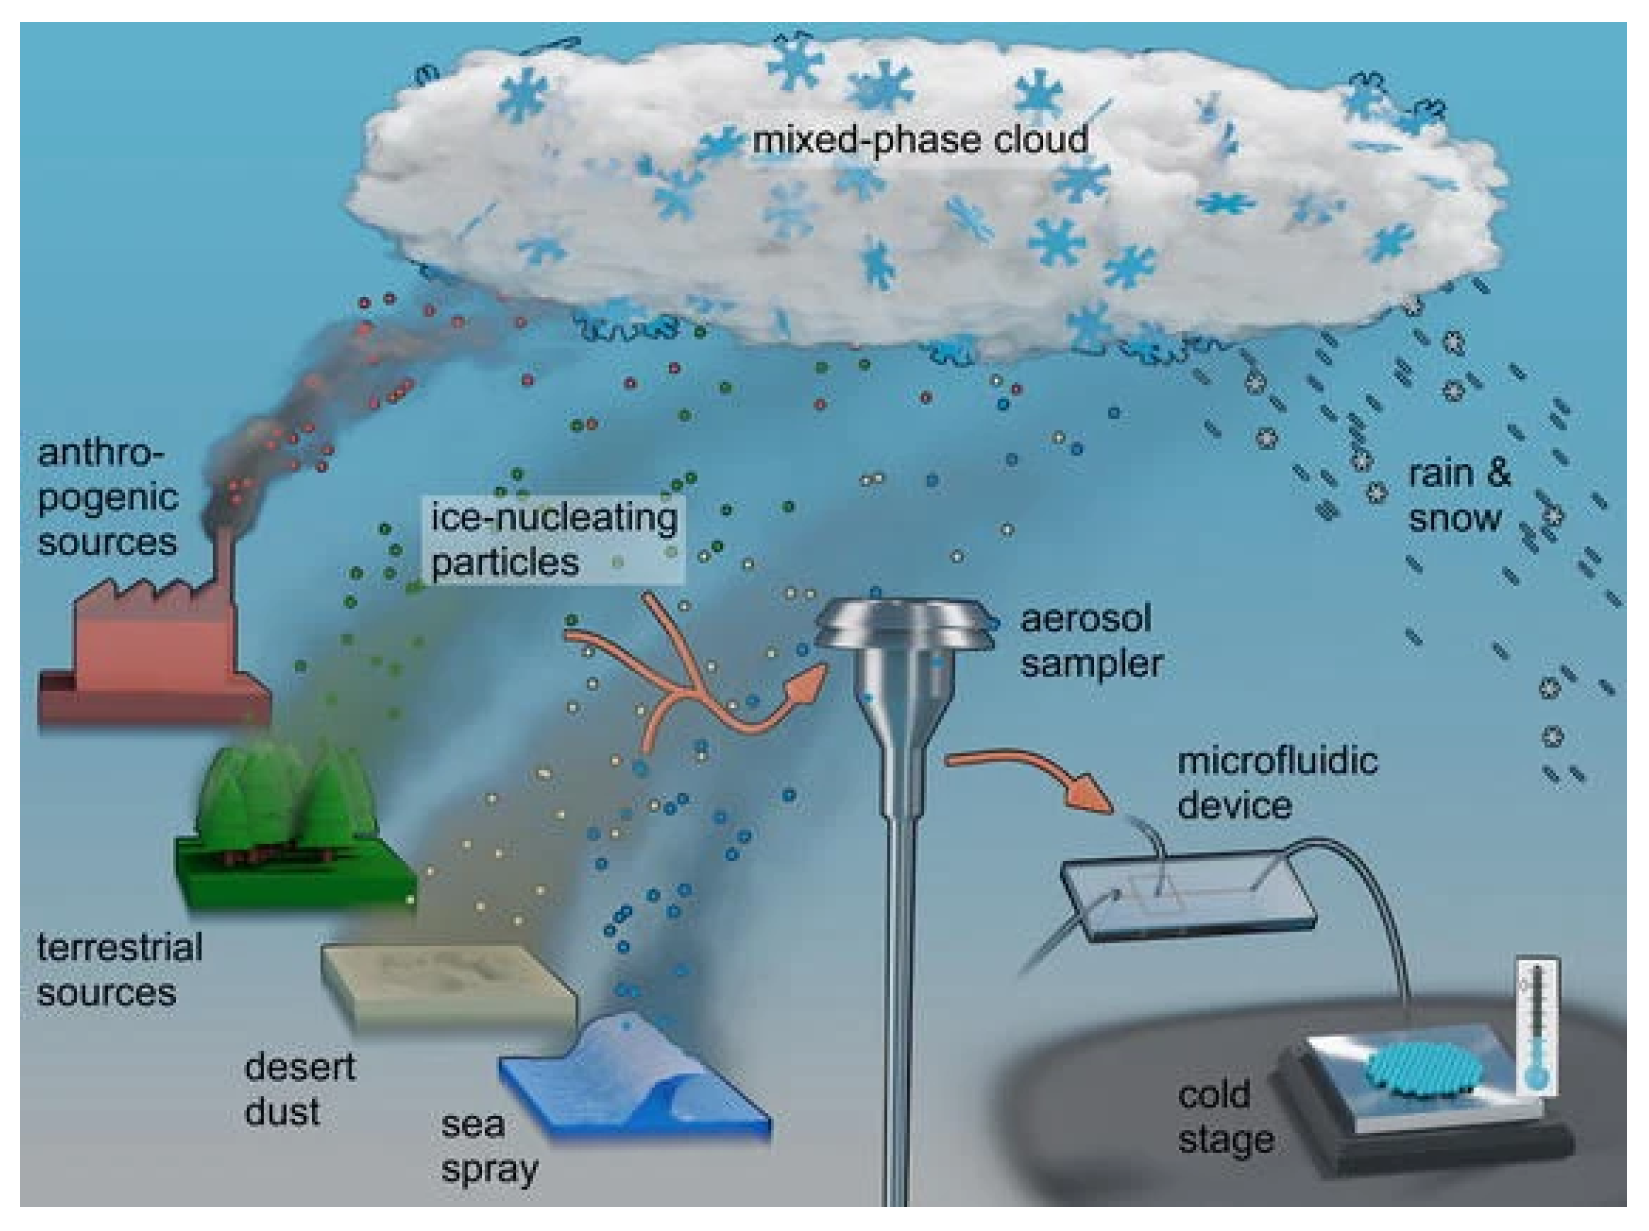
2.1. Aerosols

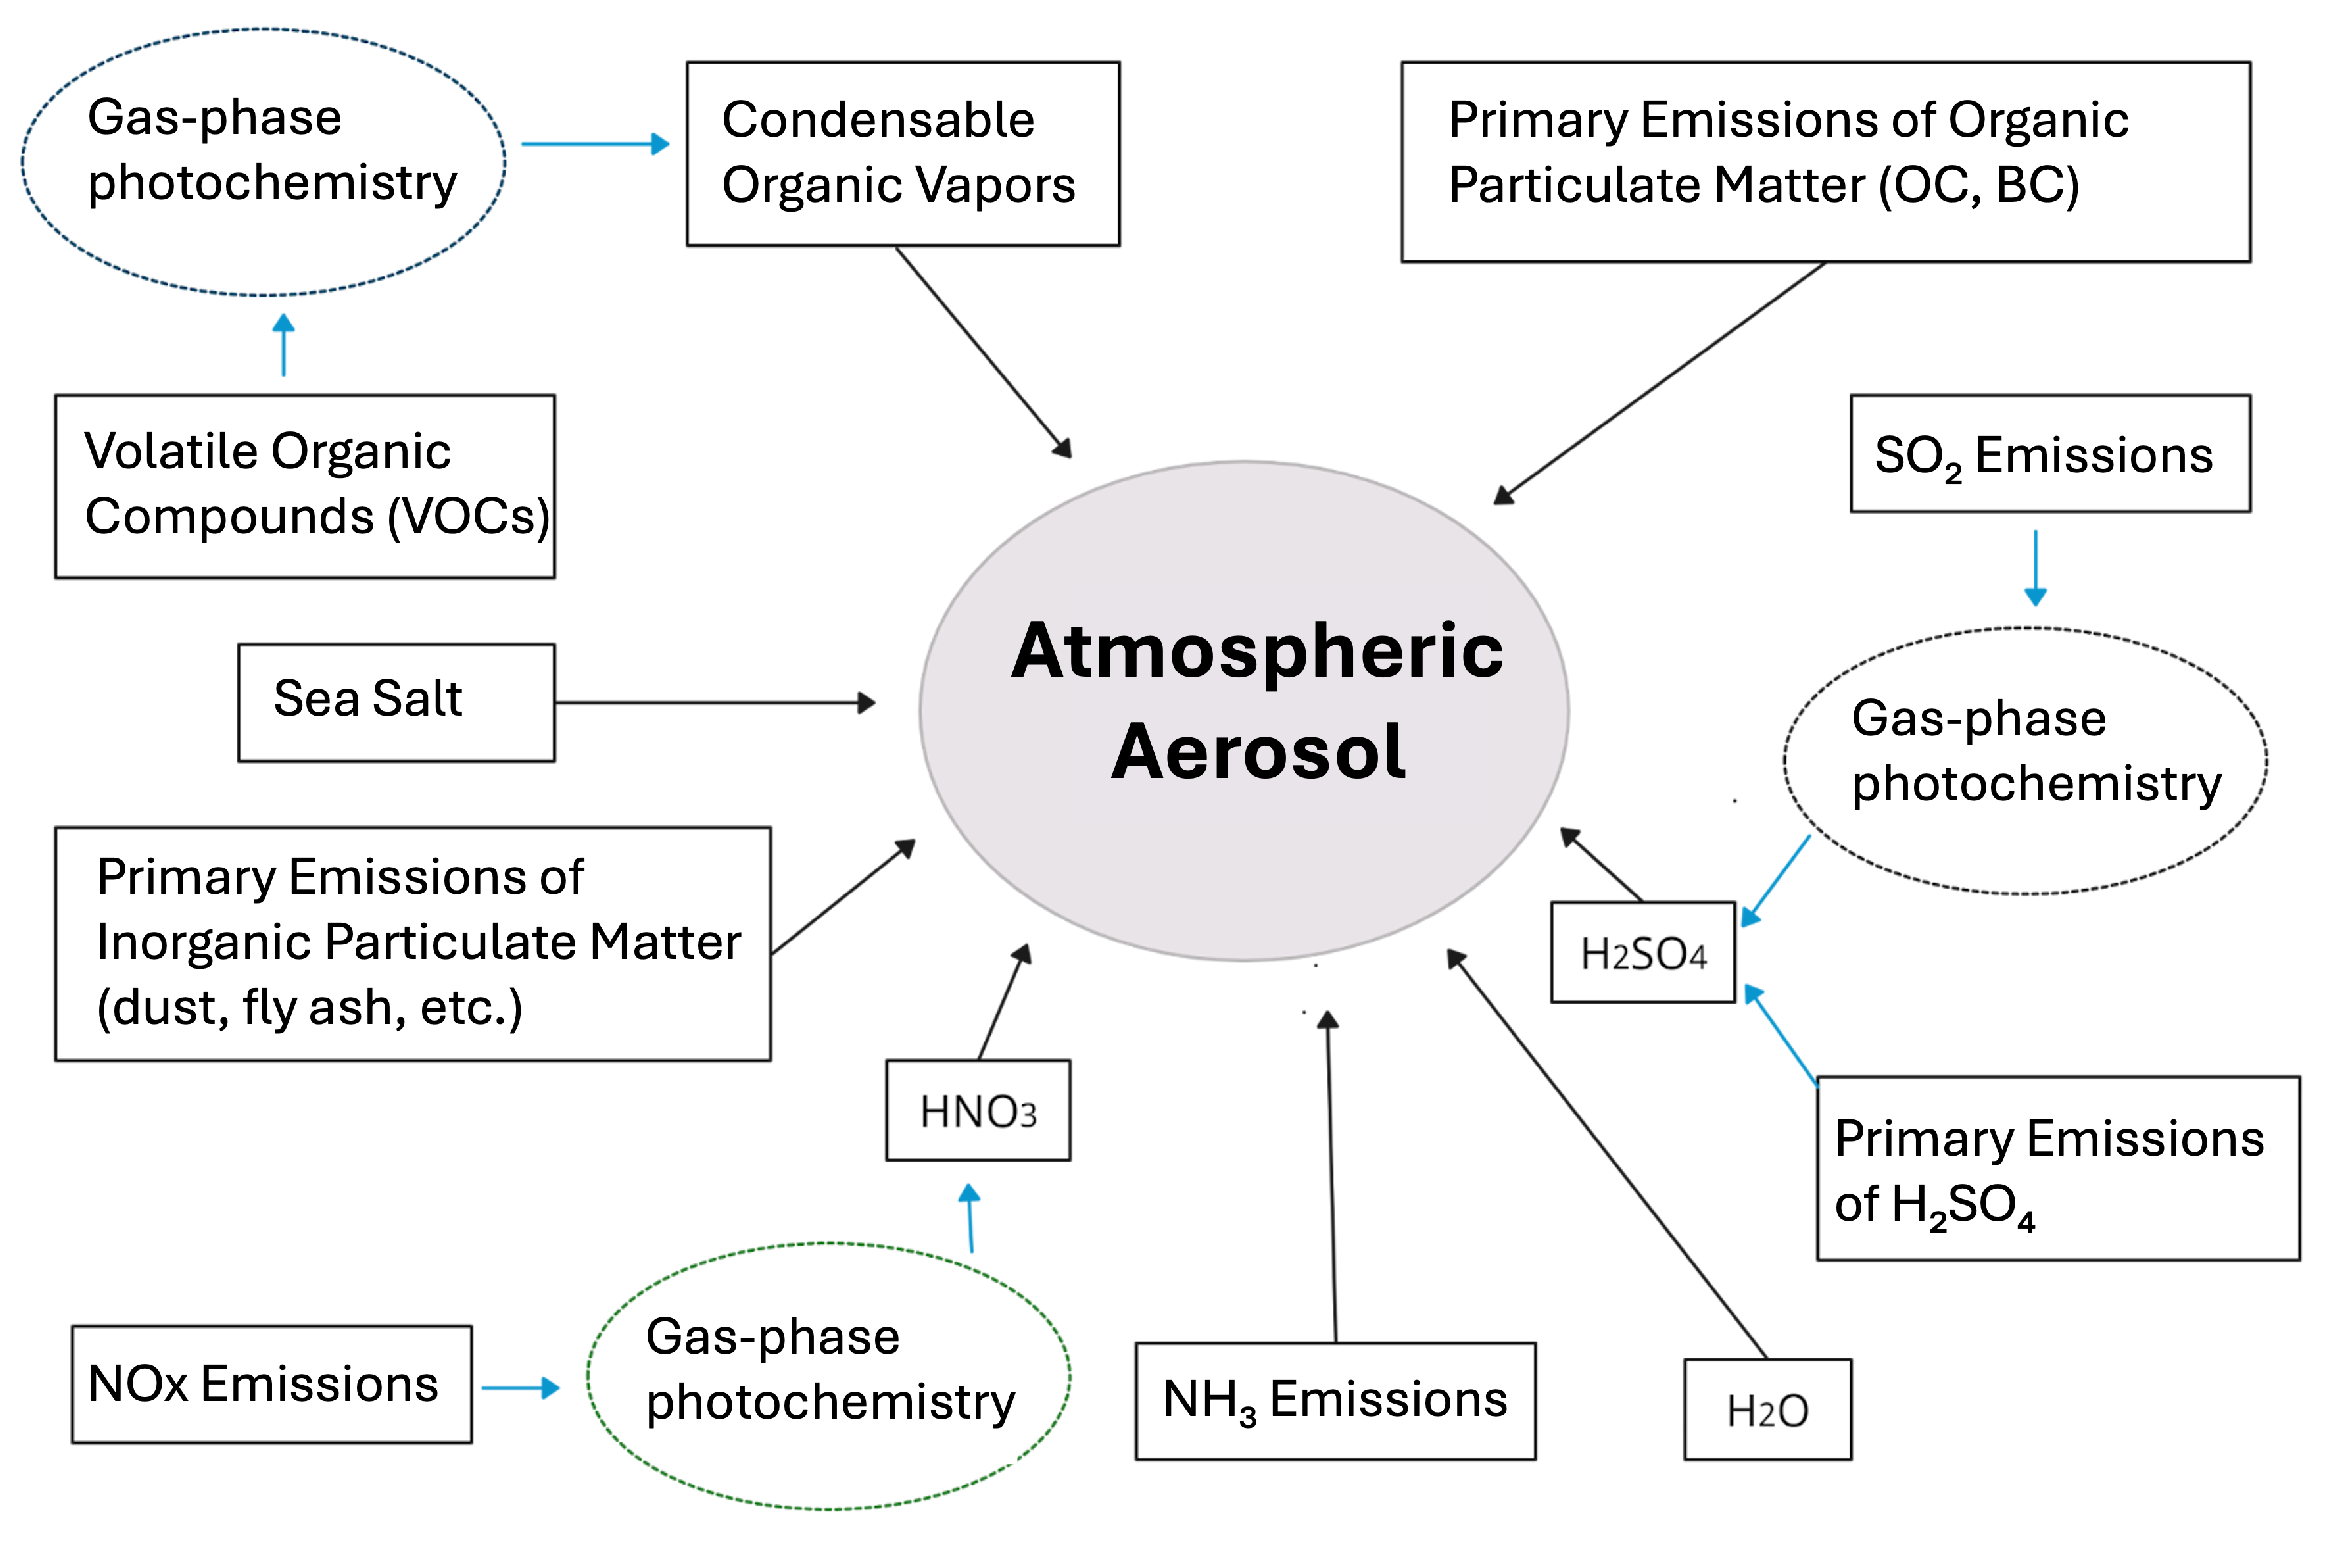
Atmospheric aerosols originate from a variety of sources, including natural processes such as sea spray, mineral dust, volcanic activity, and biogenic emissions from vegetation and marine organisms, as well as anthropogenic activities such as combustion and industrial processes (e.g. Figure 3). These aerosols can be classified as primary [24] when they are directly emitted into the atmosphere or secondary when they are formed through chemical transformations of condensable precursor gases. Primary emissions, which are predominantly natural, dominate the total global aerosol mass and consist of particles larger than 1 μ m in diameter, such as mineral dust and sea spray aerosols. Secondary aerosols, in turn, result from the physicochemical transformation of volatile organic and inorganic compounds, which activate particles in the liquid or solid phases [33].

2.1.1. Primary Aerosols

The input of particles into the atmosphere occurs mainly through primary emissions from the surface, such as sea spray, mineral dust, and combustion products of natural or anthropogenic origin [34]. Combustion releases carbonaceous aerosols, composed of inorganic carbon (e.g., CO 2 and graphite), organic carbon (associated with living or decomposing biomass), and particles rich in light-absorbing carbon, such as black carbon (BC) and elemental carbon (EC), which result from the incomplete combustion of organic material [33].
Among primary inorganic aerosols, mineral dust from deserts like the Sahara stands out. Easily detected by satellite, it acts as an ice-nucleating particle (IN), accelerating snowmelt and contributing nutrients such as iron and phosphorus to the fertilization of terrestrial and marine ecosystems [30].
The efficiency of aerosols as CCN or IN depends on their chemical composition, solubility, and particle size. Mineral dust aerosols, rich in silicates and poorly soluble, do not act as CCN under supersaturated conditions but may function as IN at higher tropospheric levels [35]. Atmospheric processing that coats these particles with soluble salts (e.g., sulfate, nitrate, chloride) can promote CCN activation [36,37].
Sea salt aerosols, primarily emitted by bubble-bursting processes at the ocean surface, have atmospheric residence times ranging from minutes to a week and form clouds with larger and fewer droplets, favoring precipitation by coalescence below the freezing level due to typically weak oceanic updrafts [38]. In biologically active regions, their composition may include both soluble and insoluble organic fractions, which can comprise up to 90% of the submicron fraction (around 100 nm) [39].
Among the emissions of primary biogenic aerosols (PBAs) are pollen, bacteria, spores, algae, plant fragments, and humic substances derived from organic decomposition. Although PBAs contribute approximately 10–20% of the organic aerosol content in the Amazon, their small size (0– 2 μm) and low concentration generally indicate limited effectiveness as CCN or ice nucleating particles (INPs) [33,34].
In this context, Hill et al. (2014) [40] demonstrated that bacteria with ice nucleation activity (INA) exhibit high genetic diversity, with 18 alleles of the ina gene identified, and occur at high concentrations on cereal leaves ( 10 8 genes g 1 ). Although these INA bacteria represented only a fraction of IN in snow samples at 10   ° C , their contribution was significant during a hail event ( 0.3 INA/IN), suggesting that under certain conditions, they may play a relevant atmospheric role. In one of the pioneering studies, Maki (1974) [41] demonstrated that strains of Pseudomonas syringae, isolated from alder leaves, are highly efficient ice nucleators, capable of initiating freezing at relatively warm temperatures ( 1.8   ° C to 3.8   ° C ), with nucleating activity strongly associated with intact bacterial cells at high concentrations (107–108 cells/mL).

2.1.2. Secondary Aerosols

According to Hansson Bhend (2015) [42], secondary sources account for less than 10% of the global natural aerosol mass but dominate in number, especially fine particles smaller than 1 μ m . This numerical predominance makes them crucial for climate, given the greater influence of particle number on radiation and cloud formation compared to mass. Secondary aerosols primarily form through the atmospheric oxidation of sulfur dioxide, nitrogen oxides, and volatile organic compounds, which lead to the formation of sulfate, nitrate, and secondary organic matter.
  • Sulfate aerosol
Most sulfate aerosol (sulfuric acid, H2SO4) is formed by the gas-phase oxidation of sulfur dioxide (SO2), its main volatile precursor, while the biogenic dimethyl sulfide (DMS, CH3-S-CH3) contributes indirectly by oxidizing to SO2 over a slow timescale (1–2 days), favoring its transport and atmospheric persistence [24,43]. SO2 originates from natural sources (volcanoes) and anthropogenic sources (fossil fuels), producing about 75% of the global sulfate aerosol mass and a portion of the secondary organic aerosol. Other precursors include hydrogen sulfide (H2S), of biological and volcanic origin [37]. Nucleation and condensation of sulfuric acid, which has sufficiently low volatility to continuously condense on particle surfaces, form Aitken particles (0.1– 1 μm), essential for aerosol growth [24,33].
  • Nitrate aerosol
The formation of nitrate aerosols depends on the thermodynamic equilibrium of the precursor gases, nitric oxide (NO), nitrogen dioxide ( NO 2 ), nitric acid ( HNO 3 ), and ammonia ( NH 3 ), as well as on environmental conditions and microphysical processes. Nitric acid, resulting from the oxidation of nitrogen oxides ( NO x ), reacts with ammonia to form ammonium nitrate (NH4NO3), whose formation is favored under high reactant concentrations, low sulfate content, and relative humidity above the deliquescence point [44,45].
  • Organic aerosol
Secondary organic aerosols (SOA) are formed by the condensation of products generated in the atmosphere from the oxidation of volatile organic compounds (VOCs), such as isoprene and terpenes. These VOCs are directly emitted by vegetation, especially trees, and react with atmospheric oxidants (OH, O 3 , NO 3 ), forming low vapor pressure compounds that condense onto preexisting particles [38,46,47,48]. Isoprene, for example, accounts for about 50% of global SOA formation [49]. Although SOA do not initiate nucleation, they are fundamental for the growth of newly nucleated particles, dominate the global submicron fraction, and influence activation as cloud condensation nuclei (CCN) through their solubility, surface tension reduction, and hydrophobic effects [50]. The oxidation of BVOCs is intensified by anthropogenic pollutants, favoring their transition to the condensed phase [49]. Furthermore, atmospheric nucleation, especially in the boundary layer, shows an almost linear dependence on the simultaneous presence of sulfuric acid ( H 2 SO 4 ) and organic compounds [47], indicating that both are essential for CCN formation and growth.

2.1.3. Gas-to-Particle Conversion (Partitioning)

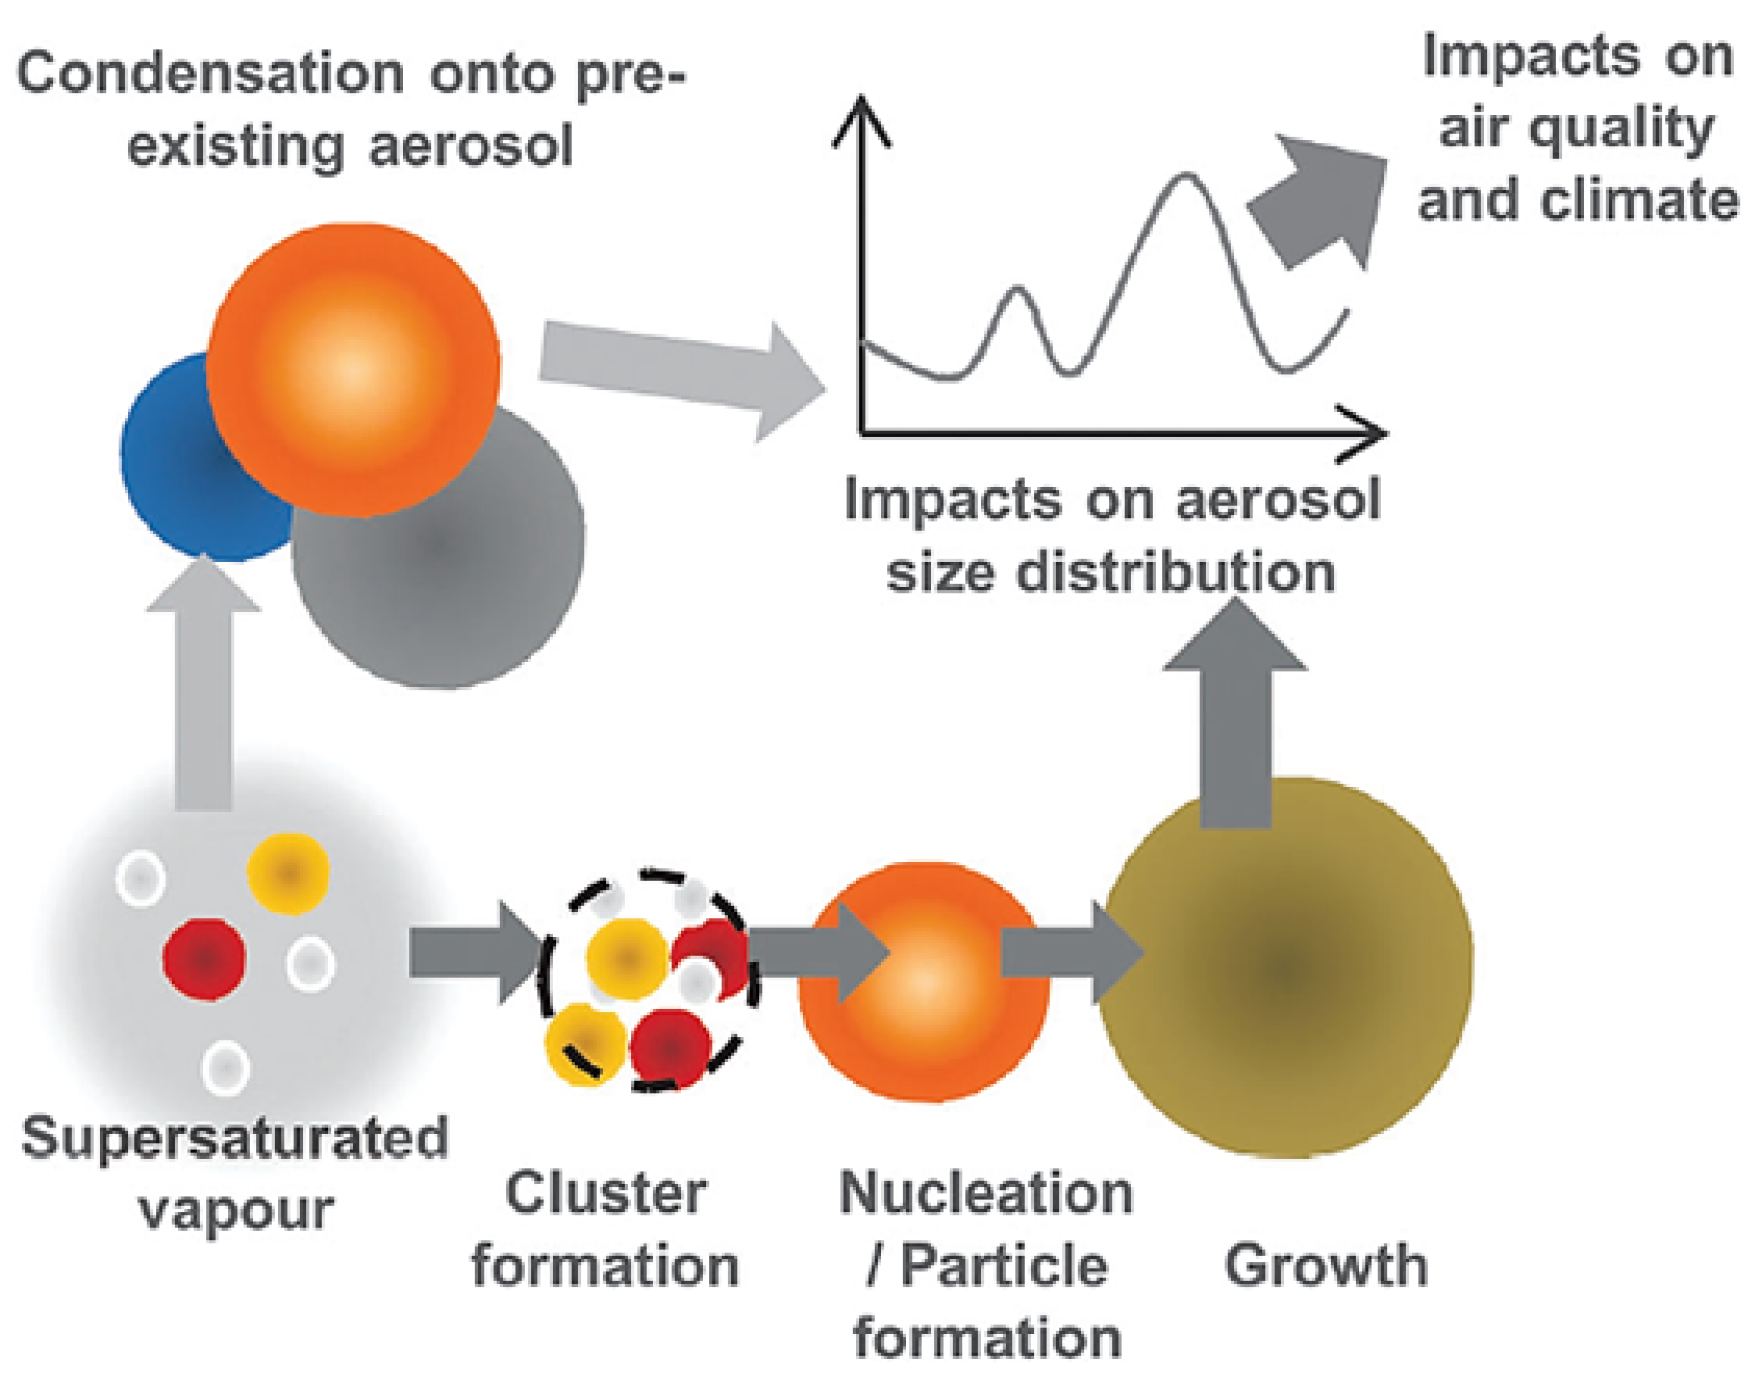
The initial formation of particles occurs through nucleation, a stochastic process in which gas molecules, under supersaturated conditions, collide to form clusters that overcome the energy barrier to become stable nanometric liquid droplets [42,50]. These critical nuclei, which are thermodynamically favorable, tend to grow due to greater stability and chemical composition, persisting in the atmosphere as stable particles [51]. Globally, nucleation accounts for more than 50% of atmospheric particles, reaching up to 90% in the upper troposphere, and about 50% of CCN originate from this process [20]. After nucleation, particles grow by condensation and coagulation, increasing their mass and chemical diversity within minutes to hours, influencing the particle number distribution, essential for atmospheric microphysics, although it has little impact on total mass [42,50].
Figure 4 shows the particle formation process from two mechanisms: nucleation and vapor condensation on preexisting particles, which implies mass addition and size increase, affecting the particle size distribution function.

2.1.4. New Particle Formation (NPF)

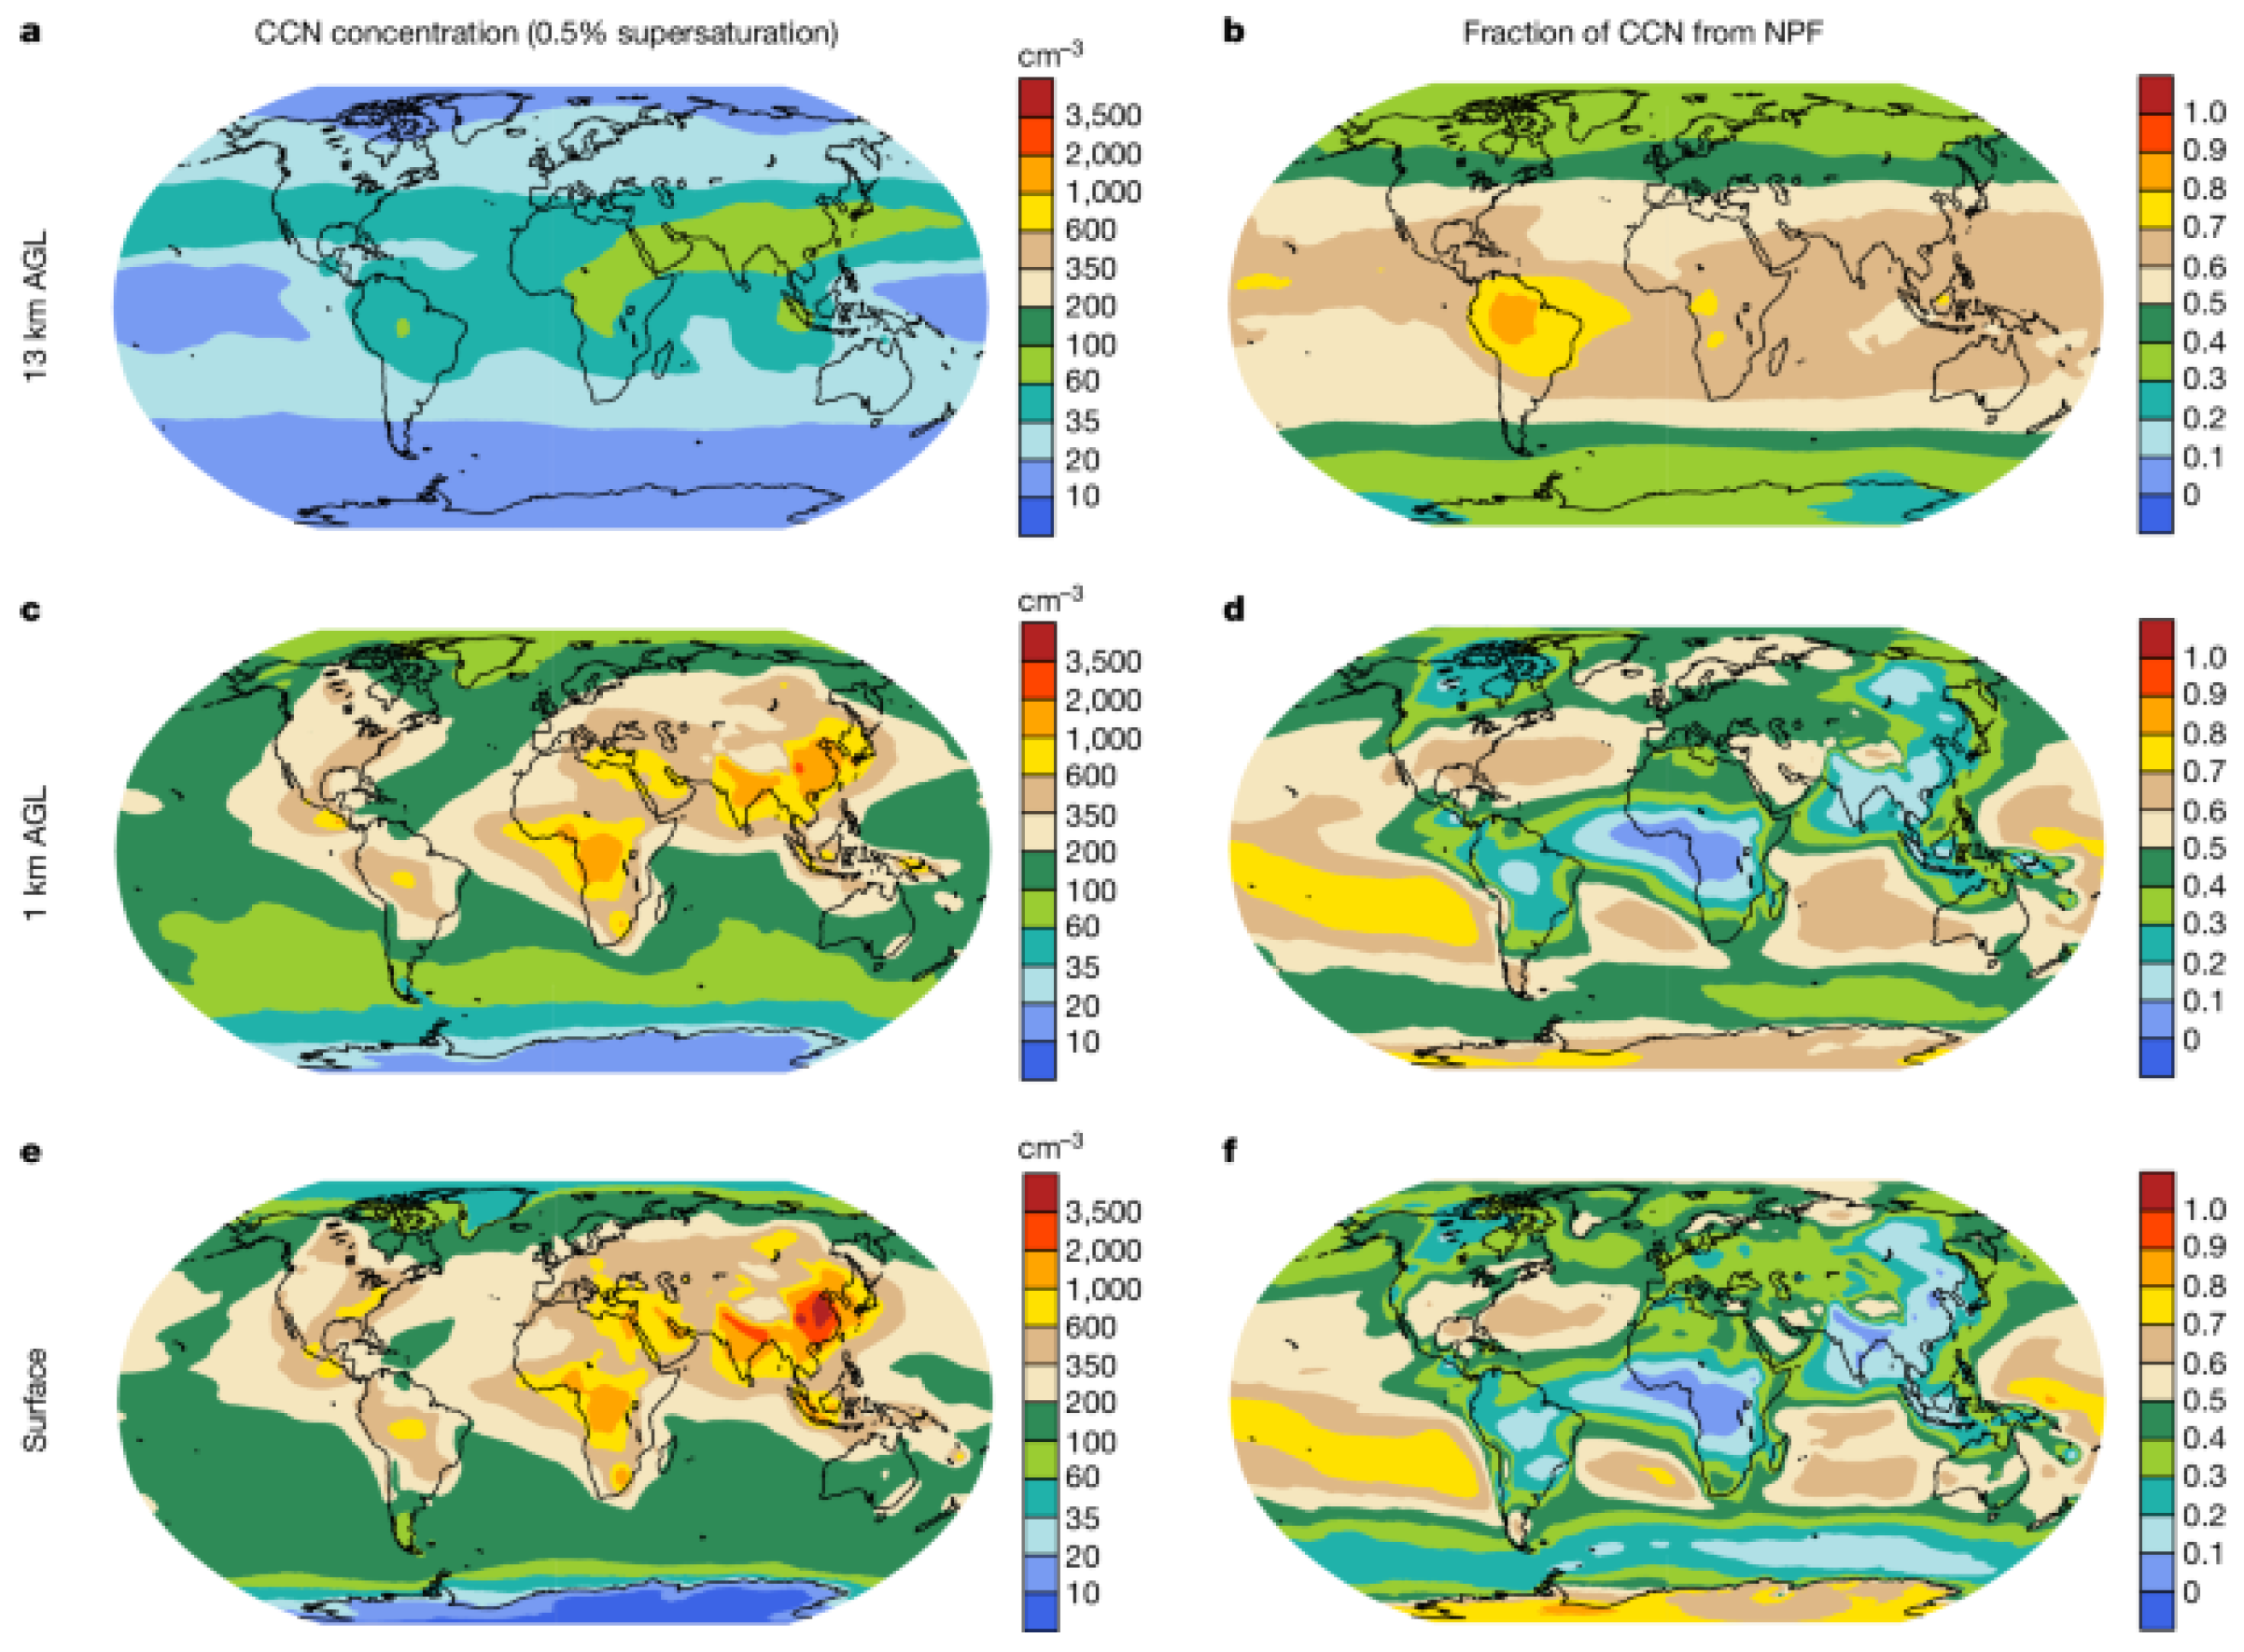
On average, about 50% of CCN are derived from new particle formation (NPF) globally [24,52]. (Figure 5 shows the impact of NPF on CCN). NPF plays a crucial role in the atmospheric particle size distribution, affecting cloud formation and, consequently, Earth’s radiative balance, hydrological cycle, and climate (e.g., [23]).
Despite its well-known importance, NPF processes remain poorly understood owing to their chemical complexity and the variability of atmospheric conditions [53]. In other words, NPF rates are non-linear with respect to ambient conditions and precursor gas concentrations, introducing uncertainties into numerical simulations of NPF physicochemical processes and underscoring the need for improvement.
These uncertainties span the spectrum of nucleation pathways, particularly inorganic versus organic nucleation [54,55,56,57], the particle formation rate from the oxidation of biogenic volatile organic compounds (BVOCs), and the gas–particle phase transition [56,58,59,60,61].
Meteorological factors that govern the onset and growth of NPF, such as the role of deep convection in secondary organic aerosol (SOA) production [62,63] and the activation or enhancement of CCN number concentrations [55,64,65,66] further compound these uncertainties. An integrated approach is therefore required to elucidate particle microphysics, from gas-phase nucleation (often overlooked in models) through aerosol growth, cloud formation, and precipitation, as a chain of interdependent processes. In the Amazon rainforest, noted for its biodiversity and extensive atmospheric studies, a striking departure from classical NPF behavior is observed: ultrafine particles predominate in the upper troposphere, contrary to the usual pattern [67].

3. Indirect Aerosol Effects: Twomey and  Albrecht

Before microphysical processes can be explored, it is necessary to address classical theories about the indirect role of aerosols in climate, particularly concerning clouds and precipitation.

3.1. First Indirect Effect, Twomey (1977) [23]

According to Twomey (1977) [23], by the 1970s, the relationship between the increase in cloud albedo due to the increase in aerosol particle concentrations in the atmosphere was already known to scientists. However, a detailed description was provided only by Twomey in 1977, when he concluded that a greater increase in atmospheric pollutant aerosols implied an increase in the optical thickness of clouds. In this case, more aerosols result in a larger number of CCN and, consequently, a higher quantity of cloud droplets with an effective radius above the critical radius. More precisely, an increase in active aerosols in the atmosphere results in greater cloud optical thickness, assuming a standard depth of 1 km, as studied. Consequently, increasing the concentration of smaller cloud droplets contributes to greater reflectivity of incident solar radiation at the cloud top (albedo), leading to surface cooling [23].
The optical thickness was calculated using two formulas. The first is a simple method based on Trabert (1901) and Aufm and Weickmann (1952) [68,69], which measures the liquid water content for a known droplet spectrum (Equation (1)). The second is a more detailed formula based on integrated Mie scattering over a droplet size distribution (Equation (2)). The simple equation proved adequate and efficient in representing the relationship observed in Figure 6.
τ = 2 π N r 2 h
τ = 0 h k e d z = π 0 h 0 r e 2 Q e r e λ n ( r e , z ) d r e d z
where τ is the cloud optical depth, h is the cloud height, k e is the extinction coefficient, d z is the height interval, π is the constant pi, r e is the mean effective radius of the water droplets in the cloud [70], Q e is the droplet scattering efficiency, λ is the wavelength of the incident light, and n ( r , z ) is the number distribution of water droplets in the cloud.
In the equation based on Trabert (1901) [68], τ is the optical thickness of the aerosol layer, N is the aerosol particle concentration in the layer, r is a representative mean radius of the aerosol particles (conveniently and sufficiently accurately taken as the volume-mean radius), and h is the height of the aerosol layer.
A direct proportional relationship between the cloud optical thickness and the aerosol particle or CCN concentration can be observed (e.g., Figure 6). In other words, the cloud optical thickness increases with the particle concentration per cubic centimeter. This occurs because the more particles are present in the cloud, the greater the probability of light interacting with them and being scattered or absorbed. Therefore, Twomey (1970) [23] pointed out that pollution can either increase or decrease cloud brightness, depending on the optical thickness and how the CCN concentration interacts with the absorption of optical thickness. The author demonstrated that planetary albedo increases with higher pollution levels, a scenario particularly favorable in shallow clouds.
To illustrate, according to Hansson (2015) [42], ship tracks are the most obvious evidence of the Twomey effect. These tracks are easily observed from space as streaks of white clouds resulting from emissions.

3.2. Second Indirect Effect, Albrecht (1989) [10]

The second indirect effect concerns the processes that initiate precipitation, in which aerosols are referred to as precipitation embryos [42]. The report presented by Albrecht (1989) [10] discusses the relationship of CCN with two types of clouds in continental and maritime regions, where known differences in aerosol concentration were observed as a function of precipitation. In the maritime scenario, the atmosphere is usually cleaner than that in continental regions, where a low concentration of CCN contributes to the localized formation of clouds with larger droplets, as there are fewer aerosols competing for water vapor, favoring faster precipitation. Considering this, sensitivity tests were conducted by modifying the size of aerosols and, consequently, the numerical concentration over this region, and it was observed that such an increase decreased drizzle formation, inhibiting precipitation, verifying that a greater amount of available aerosol contributes to the increase in the cloud’s life cycle, as it favors a greater amount of water available in the cloud without precipitation.
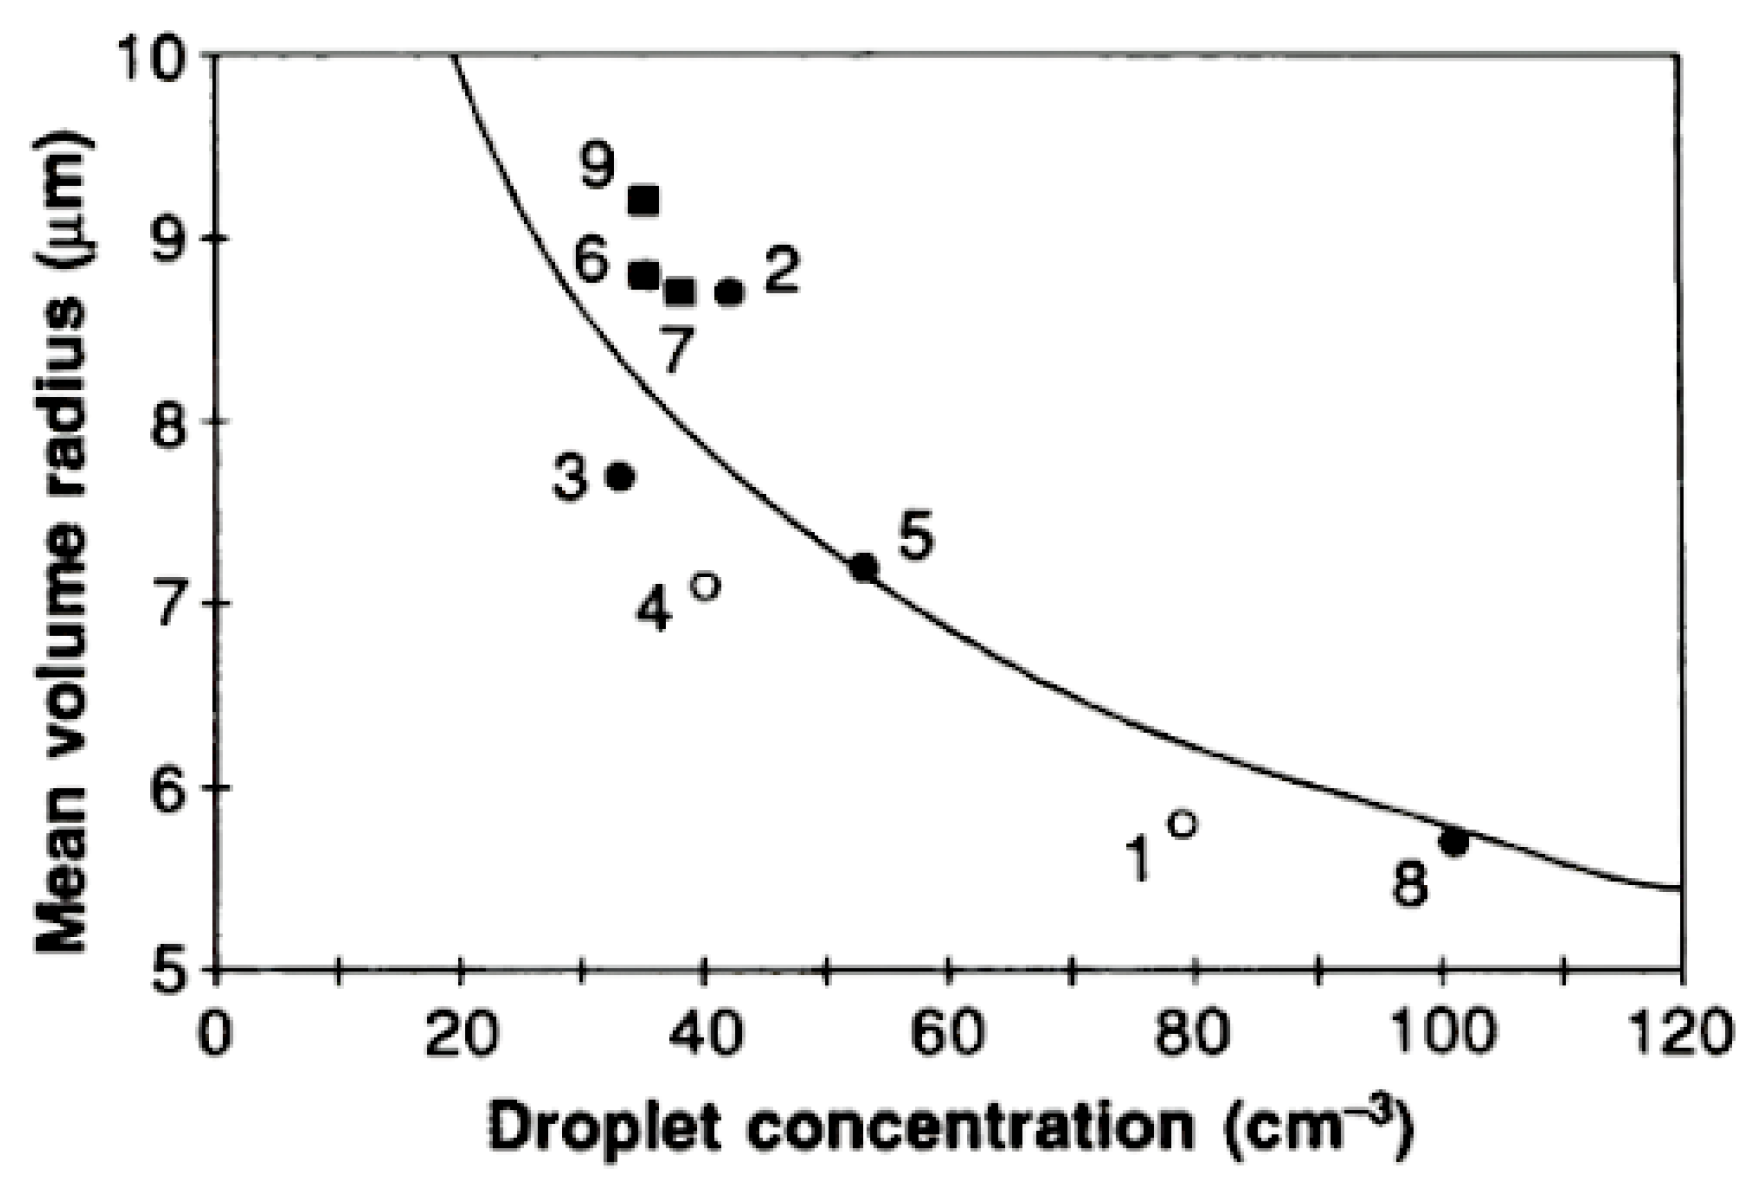
Figure 7 presents an inverse relationship between the droplet radius and the concentration of these hydrometeors, indicating that as the effective radius of cloud droplets increases, their concentration decreases, while smaller radii correspond to higher concentrations. The droplet concentration was measured as a function of the average volume of the droplet radius r for different sizes in the range of r = 1 to 16 μ m for a given liquid water content L and numerical density N, with N , L = 4 3 π r v 3 ρ N , where ρ is the water density, which was kept constant.
The shaded symbols correspond to cases where drizzle (circles) or significant drizzle (squares) was observed. Notably, significant drizzle cases occur at lower droplet concentrations and higher hydrometeor radii.
This study showed that when there is a high concentration of aerosols, wet removal by drizzle is inhibited, which may help retain them in the atmosphere. Additionally, the water content in clouds decreases when the precipitation efficiency factor specified in the model increases, understood, according to Liu et al. 2020 [71], as the ratio between the amount of precipitation and the sum of the liquid water path (LWP) and the ice water path (IWP). This increase in efficiency implies a greater conversion of condensed water into precipitation and is associated with larger particle sizes and a decrease in CCN concentration.
Sensitivity tests indicated that the precipitation efficiency of low clouds decreases with increasing aerosol concentration. This is because competition for water vapor increases with increasing CCN concentration, leading to a more uniform distribution of cloud droplets. As a result, the number of droplets increases, whereas the average droplet size decreases. Another consequence is that it promotes surface cooling, as the cloud’s life cycle is prolonged with high reflectivity from small water droplets [7,14,72].

4. Droplet Nucleation

4.1. Homogeneous Nucleation and Heterogeneous Nucleation

The activation of cloud droplets in the Earth’s atmosphere is explained by homogeneous nucleation, driven by the condensation of pure water, and heterogeneous nucleation, where aerosols and water are fractions of the formed hydrometeor [73,74].
According to the theory of homogeneous nucleation, particle activation occurs when pure water molecules, in the absence of aerosols, randomly cluster to form small molecule aggregates. Due to their nanometric size (around 1 nm), these particles require supersaturated air ( ln e e s > 0 ) to grow. Studies indicate that the environmental supersaturation rate would need to range from 3.5 to 8.0 for a cloud to form through the growth of small clusters of water molecules (“embryos”). Therefore, homogeneous nucleation cannot be the source of cloud droplets in the real atmosphere [37]. Thus, aerosols are essential for cloud formation, as they exist in sufficient quantities to make heterogeneous nucleation the predominant process.
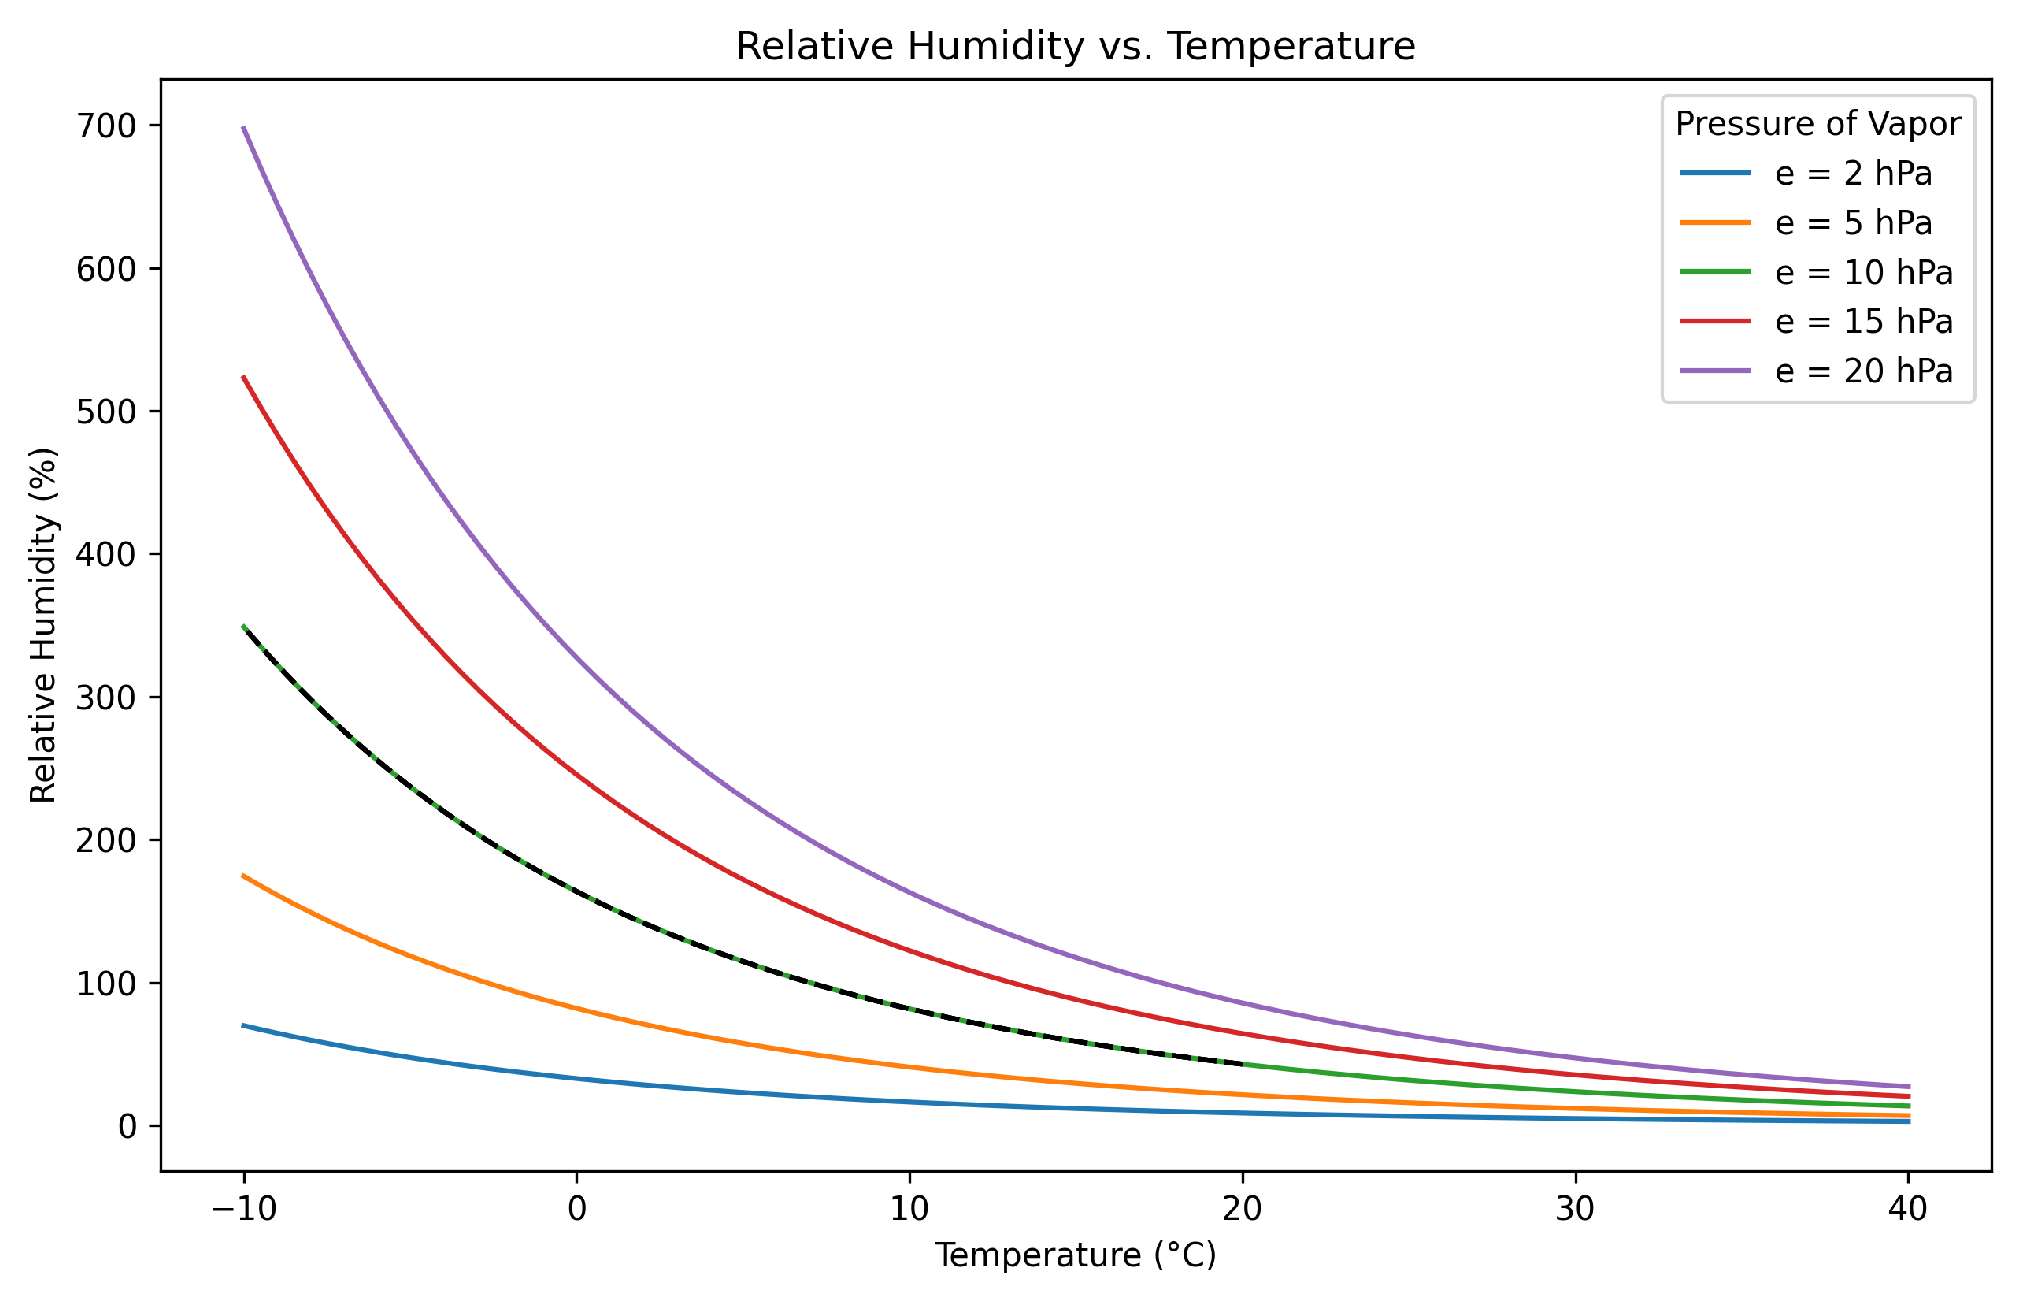
The maximum amount of water vapor that the atmosphere can hold, called the saturation vapor pressure, is primarily determined by temperature, as described by the Clausius–Clapeyron relation. Although the saturation vapor pressure depends almost exclusively on temperature and increases rapidly with it, the actual vapor pressure varies more slowly as a function of temperature [75]. During the adiabatic ascent of air, the temperature decreases, causing an approximately exponential reduction in the saturation vapor pressure. Since the absolute vapor content (actual vapor pressure) remains practically constant, the relative humidity progressively increases until saturation is reached, at which point condensation may occur [76,77]. The saturation vapor pressure was calculated using the formulation recommended by the World Meteorological Organization (WMO) [78], based on Goff (1957) [79] (Figure 8):
log 10 e w = 10.79574 1 273.16 T 5.02800 log 10 T 273.16 +   1.50475 × 10 4 1 10 8.2969 T 273.16 1 +   0.42873 × 10 3 10 4.76955 1 273.16 T 1 +   0.78614
where T is in kelvin [K] and e w is in hectopascals [hPa].
In the real atmosphere, the relative humidity (RH = e e s × 100 > 0 ) only slightly exceeds 100%, typically maintaining a critical supersaturation below 1.02 [77] in the case of droplet activation. However, it is important to highlight that relative humidity with respect to ice (RHi) can significantly exceed this value under certain conditions, such as a decrease in temperature ( d T < 0 ), an increase in pressure ( d p > 0 ), or an increase in specific humidity ( d q > 0 ) [80,81]. Otherwise, an increase in relative humidity would result in the activation of fog droplets, which are in saturation equilibrium (where condensation equals evaporation), leading to cloud formation at the surface level [73]. Thus, for CCN to be activated and transform into cloud droplets, the ambient supersaturation must exceed the critical supersaturation of the aerosol. Additionally, the presence of aerosol particles contributes to the reduction in the air’s vapor content to a relative level at which 100% humidity is reached and maintained in equilibrium, at which point the droplets can no longer consume the water vapor [73]. With regard to the nature of aerosols, they can be hygroscopic, meaning they have an affinity for water and thus act as potential collectors of water molecules, or hydrophobic, which are water-repellent nuclei and therefore cannot serve as condensation sites [80]. For this reason, only hygroscopic aerosols that activate droplets under atmospheric saturation conditions with S < 1.02 are considered CCN and are important for cloud formation.
In the following sections, a detailed analysis of Köhler’s theory is presented, which is based on the Kelvin and Raoult effects, which are integral to the theory and describe the mechanism of particle activation in CCN.

4.2. Köhler Theory or Köhler Curve

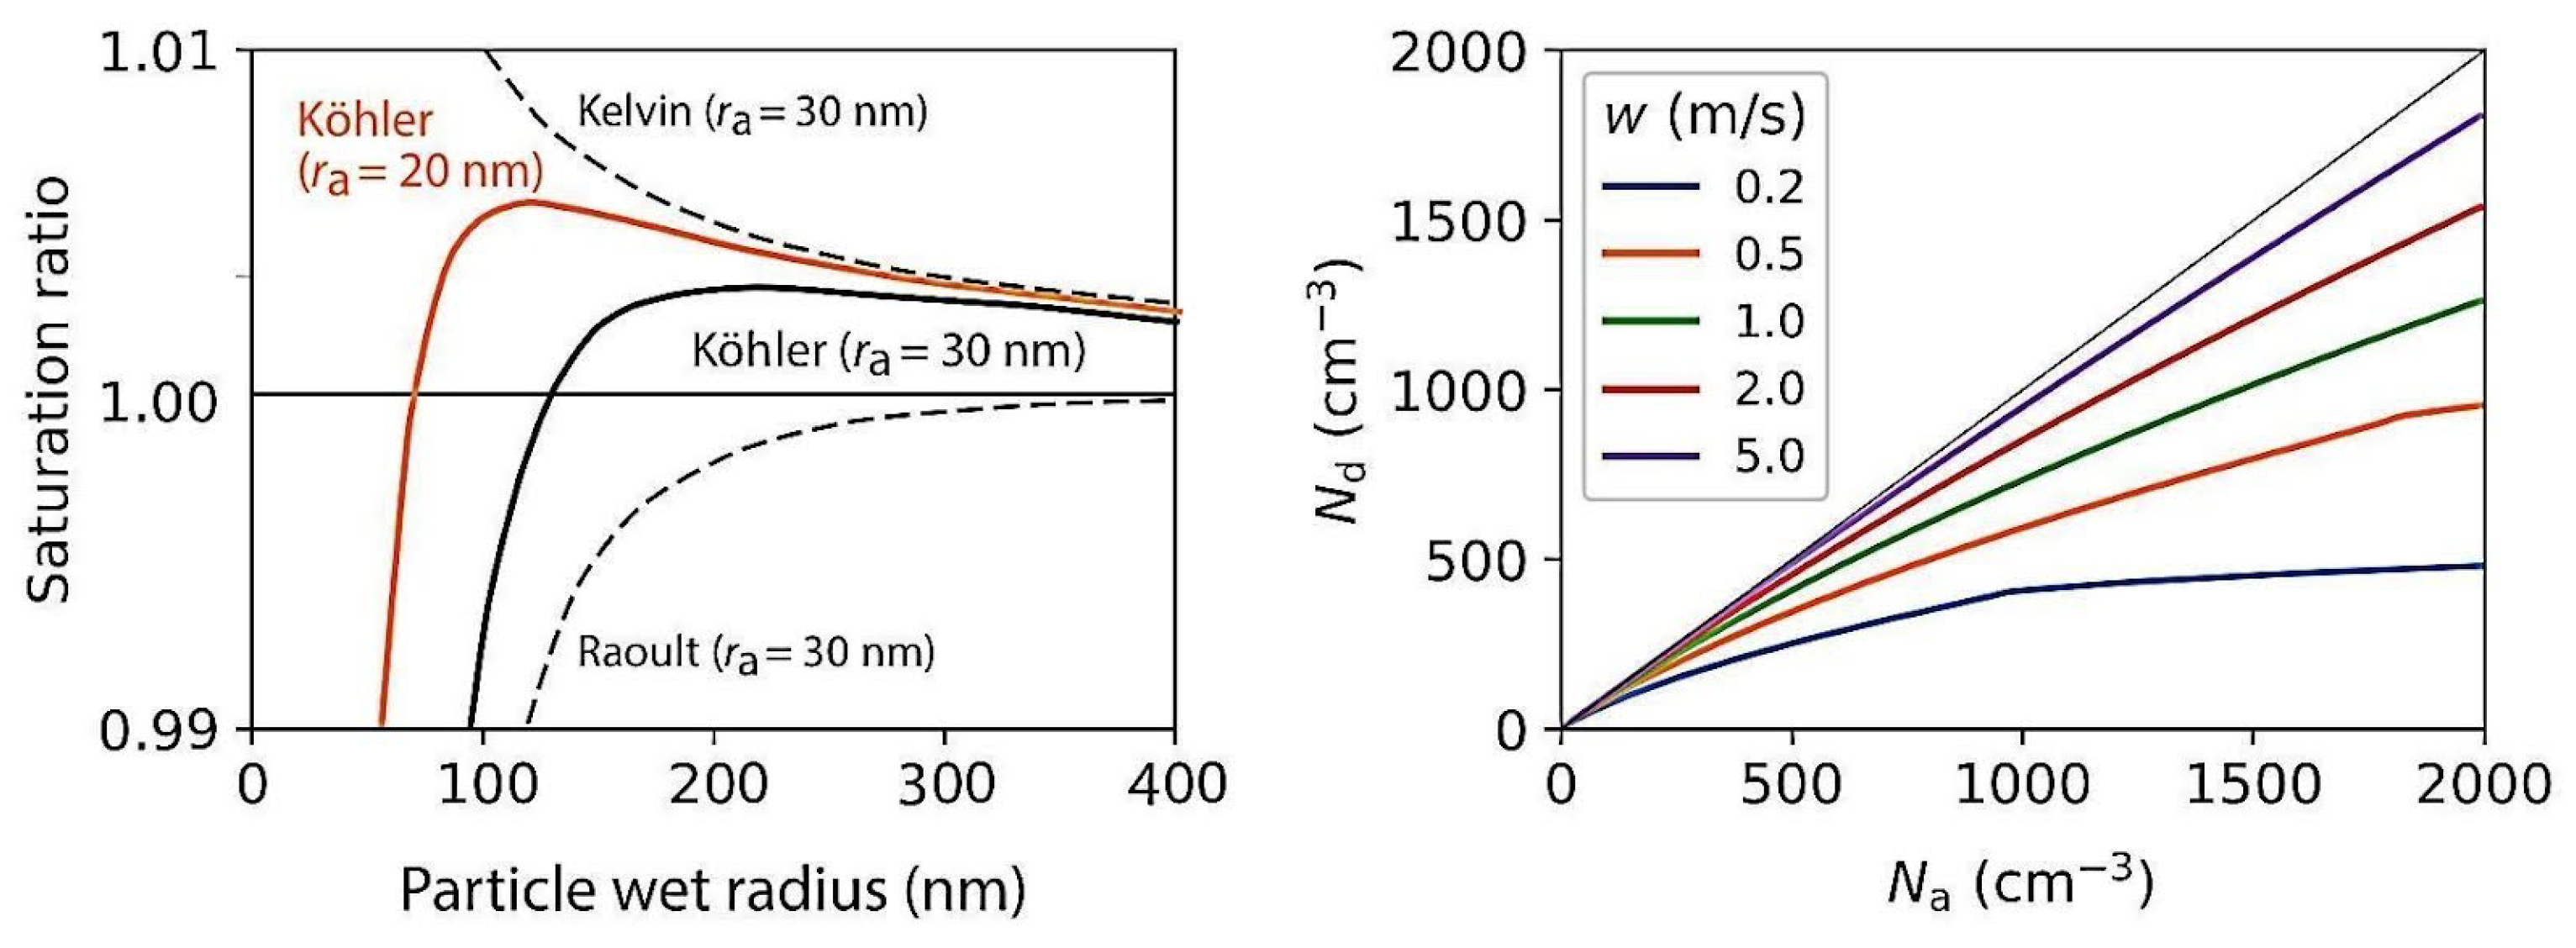
Köhler’s theory represents the relationship between equilibrium supersaturation and the aerosol’s wet diameter, as shown in Figure 9. The inflection point of the curve allows for the determination of the aerosol’s critical radius, which depends on the particle’s composition and initial diameter, meaning that it reflects the environmental saturation at which a given aerosol will activate a hydrometeor [74].
The Köhler curve describes the hygroscopic growth resulting from the presence of solutes. In general terms, it combines the effects of Kelvin and Raoult, illustrating the relationship between the water vapor saturation above a droplet’s surface (Sd) and the droplet’s diameter (d) [82,83]. These combined effects control the formation of CCN under different conditions for various particles [77]. This theory predicts that the CCN is a subset of the general aerosol population, which can be activated as cloud droplets under supersaturation conditions (relative to the droplet) based on the amount of soluble material present in the particle [37].
In general, cloud droplets form when an ascending air parcel (updraft) transports aerosol particles to altitudes where the atmosphere reaches the saturation point. In this process, the particles compete for the available water vapor, which limits the increase in atmospheric supersaturation [77]. As shown in Figure 9, larger particles have a lower critical supersaturation and are therefore activated first. As a result of this competition, the number of droplets formed at the cloud base varies with the aerosol number concentration. Depending on the intensity of the updraft, the number of droplets may be equivalent to and limited by the number of available CCN. Under weak updraft conditions, this restricts activation to a subset of the total CCN (e.g., Figure 9). Beyond the competition among particles, the resulting supersaturation within the cloud is strongly modulated by the vertical updraft velocity, which controls the adiabatic cooling of the air and, consequently, the balance between the supply of vapor and its removal by condensation. As demonstrated by Grabowski (2009) [84], droplet concentration also significantly influences the equilibrium supersaturation, especially in regions of intense turbulence, potentially enhancing or limiting it, and thereby directly affecting the growth of new droplets.

4.2.1. Kelvin Effect

The Kelvin effect has a direct relationship with the surface tension of droplets and indicates that the higher the curvature, meaning the smaller the droplet, the higher the relative humidity must be to promote droplet growth (>100%), as curved droplets have higher saturation rates than flat surfaces (where saturation = 100%) [85,86,87]. This is due to the surface tension effect or curvature effect, through which the surface of small droplets more easily releases molecules into the air, promoting evaporation and reducing the surface tension of the droplets (e.g., Figure 10) [88]. This effect shows that, at any temperature, the vapor pressure of saturation over a spherical surface, such as a water droplet, is higher than over a flat surface [89], as lower surface tension requires extra energy to increase the surface area as the droplet grows at a constant temperature [73,77,90].
According to the curvature effect, the condensation rate of the droplet is higher than the condensation rate of the flat water surface, as the droplet releases water molecules more easily. Therefore, e s , drop > e s , flat . Thus, if R H flat = 100 % , then R H drop > 100 % , indicating that the air surrounding the droplet must be supersaturated.
According to Yau et al. (1996) [90], the liquid growth rate of a droplet with radius r is proportional to the difference e e s ( r ) , where e is the real vapor pressure of the environment. Thus, droplets with radii r such that e e s ( r ) < 0 indicate that the vapor pressure of the environment e is lower than the saturation vapor pressure over the radius ( e s ( r ) ) , i.e., e < e s ( r ) , which suggests a tendency for the droplet to shrink through evaporation in a subsaturated atmosphere. On the other hand, for a droplet radius where e e s ( r ) > 0 , the environment is supersaturated with respect to the droplet ( e > e s ( r ) ), favoring its growth. Consequently, the critical size r c is defined for the radius at which e = e s ( r c ) , where the difference is 0 (according to the Kelvin equation), defining the saturation rate.
The equilibrium vapor pressure over the surface of a droplet, therefore, depends on its curvature (it is higher the greater the curvature), which is given by the Kelvin equation, which determines the rate at which water molecules reach the surface of the water [89]:
e s ( r ) = e s ( ) exp 2 σ r R v ρ L T
In this context, e s ( r ) represents the saturation vapor pressure over the surface of a spherical droplet with radius r, σ represents the surface tension, and ρ L, T, and R v are the liquid water density, temperature, and the gas constant for water vapor, respectively. e and e s ( ) are the real vapor pressure and the saturation vapor pressure over water, respectively.
Thus, the critical radius required for a droplet to form from potential collisions between water molecules and reach stability [90] is calculated by r c :
r c = 2 σ R v Q L T l n S
where S = e e s ( ) and Q L is the density ρ L at temperature T.

4.2.2. Raoult Effect

On the other hand, the Raoult effect expresses the hygroscopic capacity of a solute, that is, the water activity in the solution [77,90]. Water activity ( a w ) is defined as the ratio between the vapor pressure of water over the solution and that over pure water. The aerosol’s potential to dissolve in water and swell particles can cause their saturation ratio to be lower than 1.0 ( U R < 100 % ). As cooling occurs, the critical supersaturation decreases as the amount of solute increases. With this increase, the particle grows, and a larger aerosol is activated first (upon reaching the critical radius) [73,91].
In summary, Raoult’s law represents the fractional reduction in water vapor pressure adjacent to a solution droplet, meaning water containing some dissolved material, such as sodium chloride or ammonium sulfate. This reduction is lower than the water vapor pressure adjacent to a pure water droplet of the same size.
This law is expressed as:
e s , solution e s = y w x w
For : x w = n w n s + n w
where n w indicates the number of moles of water and n s the number of moles of solute, e s is the saturation vapor pressure of water adjacent to a solution droplet containing a mole fraction x w of pure water, and e s is the saturation vapor pressure of water adjacent to a pure water droplet of the same size and temperature. y w represents the non-ideal behavior.
By combining these two equations, Köhler’s equation is obtained:
e s ( D p ) e s y w x w = exp 2 σ r R v ρ L T
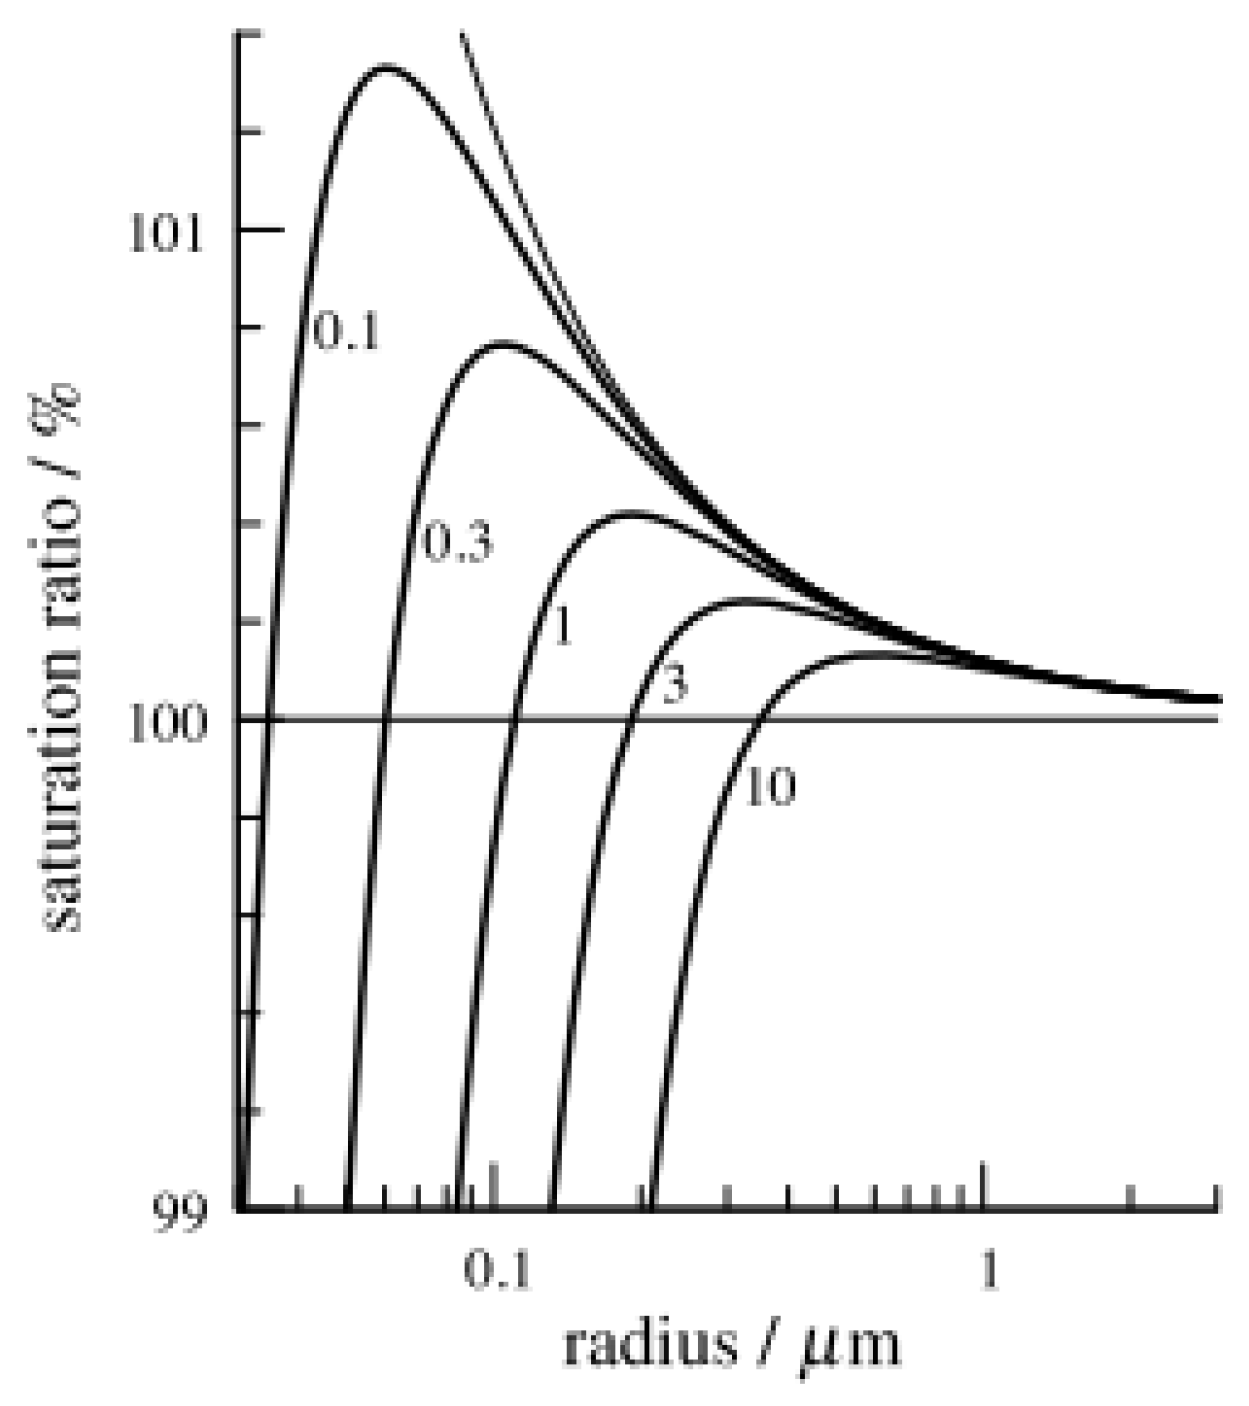
As the amount of solute in the equation decreases, the Raoult curve and, consequently, the Köhler curve converge toward the Kelvin effect for the condensation of small pure water droplets [77] (e.g., Figure 11).
According to Wex et al. (2008) [82], successful results using the Köhler equation were achieved when analyzing particles consisting of well-known and understood substances (usually inorganic), such as ammonium sulfate or sodium chloride, in contrast to the results obtained for organic particles. Typically, sulfates and salts are well-studied due to their abundance in nature and their well-known affinity for water.
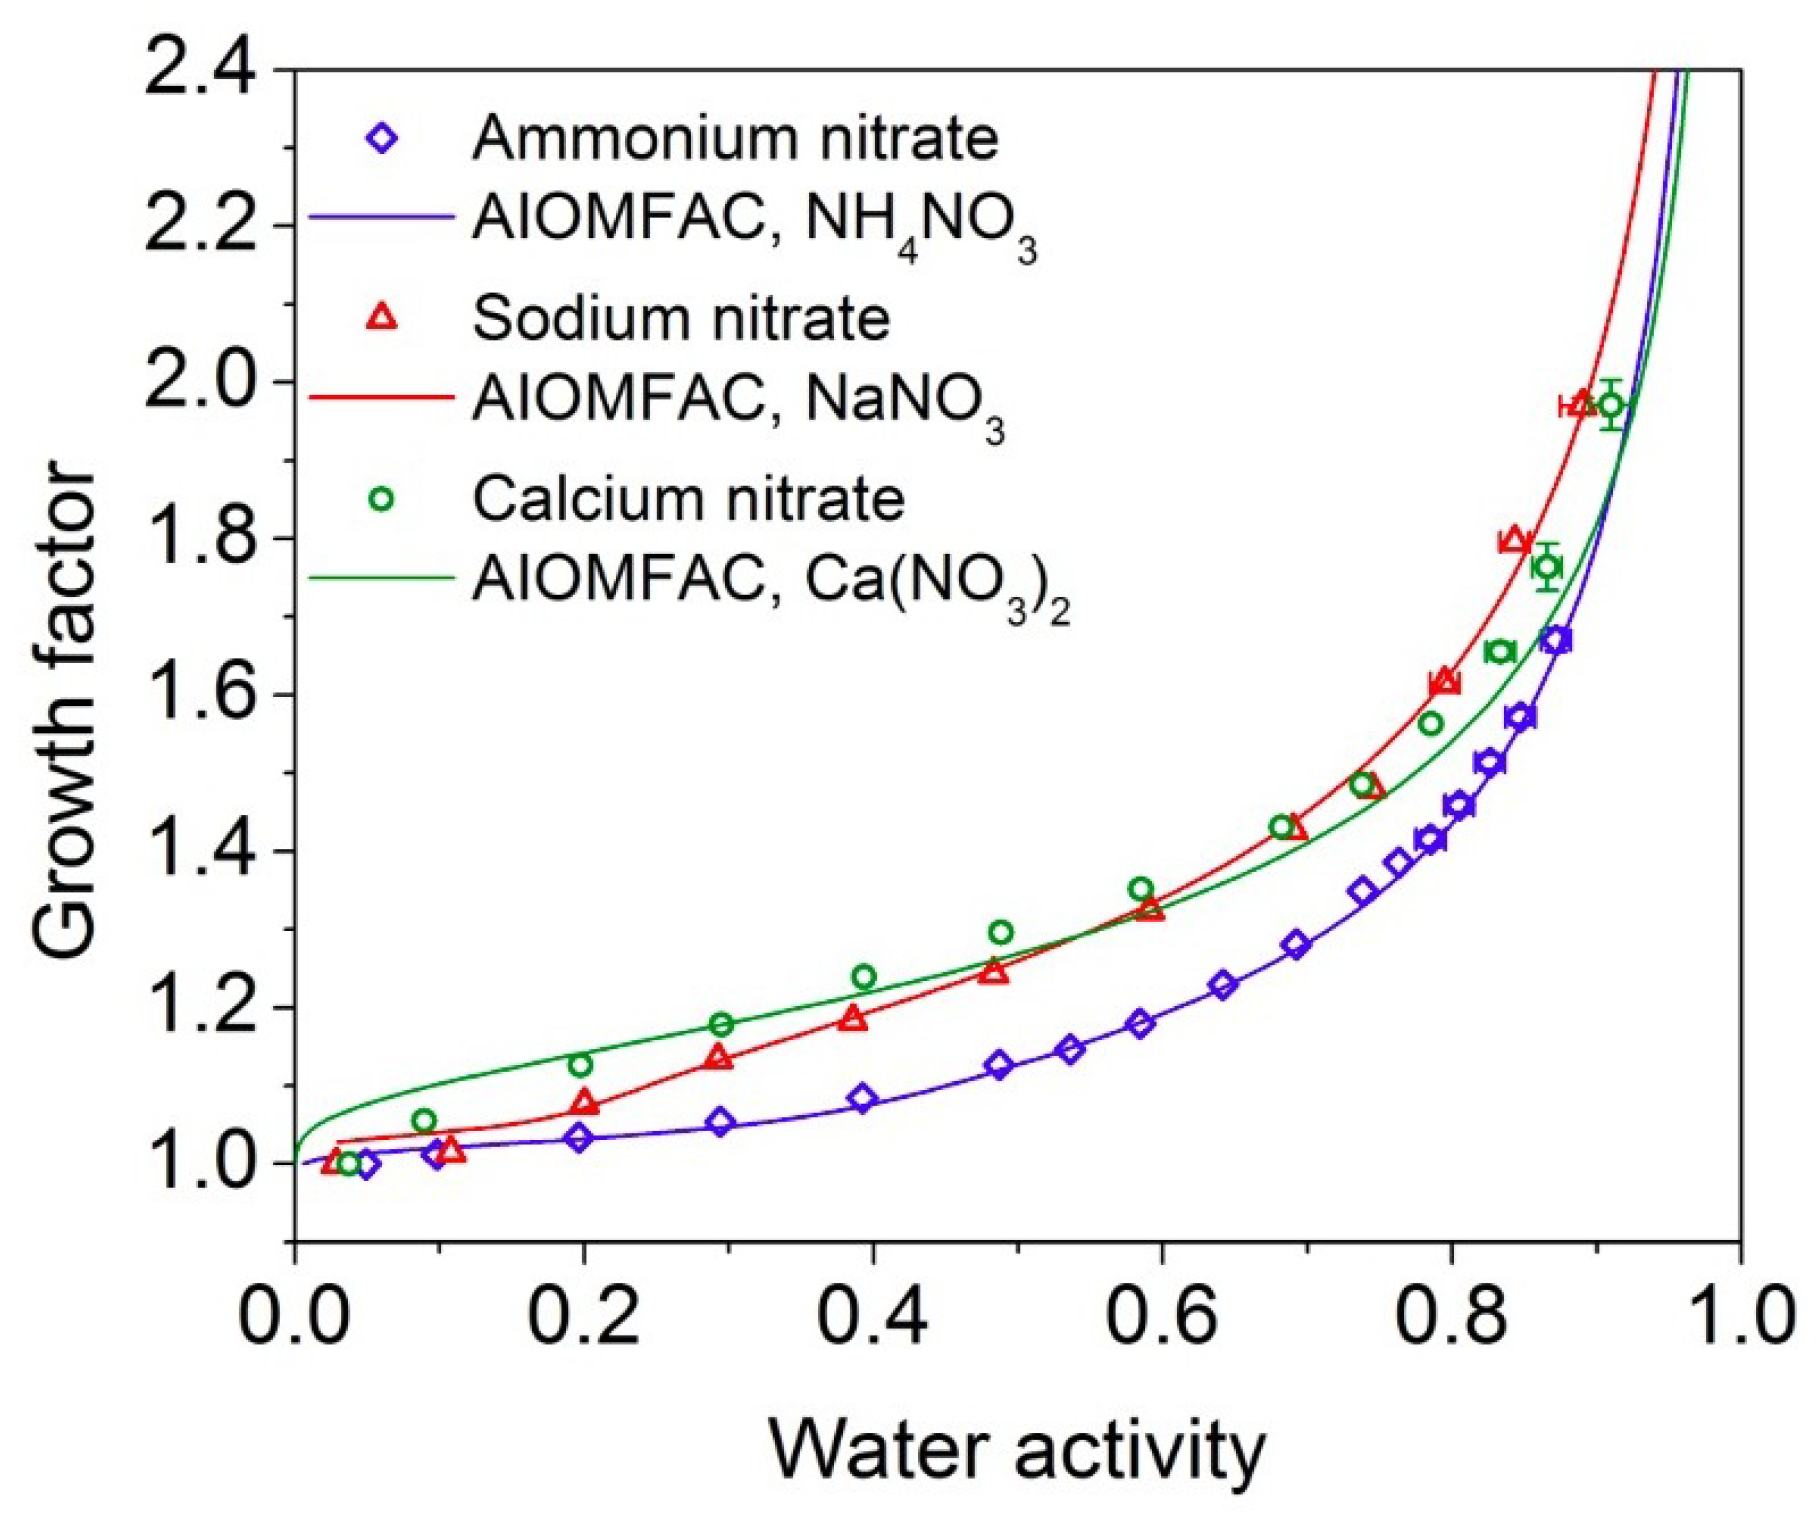
Figure 12 illustrates how ammonium nitrate (NH4NO3), sodium nitrate (NaNO3), and calcium nitrate (Ca(NO3)2) exhibit distinct behaviors regarding water absorption and particle growth accelerated by hygroscopicity, as predicted by the Aerosol Inorganics–Organics Model for Aerosols and Clouds (AIOMFAC).

4.2.3. Hygroscopicity Factor

The ability of aerosols to absorb water vapor, known as hygroscopic growth, directly influences a range of key atmospheric processes, including radiative balance modulation, cloud nucleation, visibility reduction, multiphase chemical interactions, and impacts on air quality with implications for human health. Therefore, understanding this behavior is essential for studies on the climatic and environmental effects associated with aerosols [93,94].
A widely used approach to quantify aerosol hygroscopicity is through the hygroscopicity parameter κ , which characterizes the ability of an atmospheric particle to act as a CCN. This parameter was introduced by Petters & Kreidenweis (2007) [95] using a semi-empirical formulation derived from the modified Köhler theory (also known as κ -Köhler theory).
The parameter κ integrates the solute effect (Raoult’s law) and the curvature effect (Kelvin term) into a single dimensionless value, which simplifies the prediction of the critical supersaturation required for cloud droplet activation. This simplification is especially useful in large-scale models, where full Köhler theory calculations would be very computationally costly.
The formula for calculating κ is:
κ = 4 A 3 σ s / a ( T ) 27 T 3 D d 3 ln 2 S c
where κ = hygroscopicity parameter (dimensionless); A = M w R T ρ w 8.692 × 10 6 K · m 3 · J 1 , a constant derived from the Kelvin equation (for water); σ s / a ( T ) = surface tension of the solution/air interface [ N · m 1 ] (typically assumed to be 0.072   J·m 2 for water at 298 K); T = temperature [K]; D d = dry particle diameter [m]; and S c = critical saturation ratio [96].
The hygroscopicity parameter κ is directly related to the chemical composition of aerosol particles and is widely used as an indicator of their hygroscopic growth capacity. Highly soluble compounds, such as ammonium sulfate, typically exhibit values of κ 0.6 ; moderately hygroscopic organic compounds show intermediate values ( κ 0.1 0.3 ), while hydrophobic species, such as soot, tend to have κ < 0.05 [95]. In a recent study, Polker et al. (2023) [97] reported representative global mean values of κ org = 0.12 ± 0.02 for organic matter and κ inorg = 0.63 ± 0.01 for inorganic ions. These values support the usefulness of the linear mixing approach for parameterizing κ in climate models and observational analyses.

4.2.4. Water Activity Coefficient and Solution Ideality

Hygroscopic growth of aerosols and gas–particle partitioning of volatile compounds are influenced by the non-ideal behavior of the liquid phase, commonly described by activity coefficients [98]. Although most thermodynamic models are developed for electrolyte solutions, the organic fraction, which can account for up to 50% of aerosol dry mass, is often ignored or treated as an ideal solute or an insoluble solid phase. This simplification can lead to significant deviations in model estimates. Most organic compounds, such as dicarboxylic acids, have complex structures and are less studied than inorganic species like sulfates, nitrate, hydrogen, and ammonium [99,100].
According to Raatikainen & Laaksonen (2005) [99], water activity is defined as:
a w = γ w · c w
relating the effective water activity a w to the actual concentration c w , where γ w is the activity coefficient of water and c w is the molar concentration of water in the solution. In solutions containing salts or organic compounds, it is generally the case that γ w < 1 , which reduces the water activity.
For dilute solutions, it is reasonable to approximate γ w 1 , indicating that the water activity is close to its ideal value. However, in more concentrated solutions, there is a significant reduction in γ w , reflecting the increasing non-ideality due to complex interactions among the dissolved components.
Thus, the relative humidity (RH) equation related to water activity can be applied to all volatile species, including ammonia, some acids (such as HCl and HNO 3 ), and certain organic compounds. It is generally expressed as [99]:
RH 100 % = a w · exp 4 σ M w R T ρ D p
where σ (N/m) is the surface tension, M w (kg/mol) is the molecular weight of water, R is the universal gas constant, T (K) is the temperature, ρ ( kg/m 3 ) is the solution density, and D p (m) is the droplet diameter.
To capture the non-ideal behavior of aqueous solutions present in aerosols, advanced activity coefficient models such as the Aerosol Inorganic–Organic Mixtures Functional Groups Activity Coefficients (AIOMFAC) model [98,100,101] and E-AIM [102] are used. These models allow for accurate estimation of the activity coefficients of water and solutes in highly concentrated and organic/inorganic mixed solutions.

5. Ice Nucleation

Ice nucleation in the atmosphere can occur through two distinct mechanisms: heterogeneous nucleation, mediated by ice-nucleating particles (INPs), and homogeneous nucleation, which requires high supersaturations with respect to ice and extremely low temperatures (≈ 40   ° C). The latter occurs from supercooled aqueous solution droplets [89,103]; in other words, it involves the spontaneous formation of ice directly from vapor [104].
Under normal atmospheric conditions, ice formation predominantly occurs via heterogeneous nucleation, typically within the temperature range between 0   ° C and 35   ° C. On the other hand, homogeneous nucleation can only produce additional ice particles when the water vapor saturation ratio exceeds a critical threshold [104], and the newly formed ice crystals may coexist in equilibrium with supersaturated water vapor with respect to ice [105,106,107] at high altitudes.
The evolution of the saturation ratio during the adiabatic ascent of an air parcel depends on the decrease in temperature and the vapor deposition onto preexisting ice crystals. This behavior is described by equations based on the Clausius–Clapeyron relationship, Equation (12).
Clausius–Clapeyron approximation for the saturation vapor pressure of water over ice at temperature T:
d ln e s , i d t = d ln e s , i d T · d T d t = L s R v T 2 · d T d t
where L s is the latent heat of sublimation and R v is the gas constant for water vapour.
However, when the concentration of INPs exceeds a critical value, heterogeneous nucleation becomes efficient enough to deplete the excess vapor before supersaturation reaches the levels required for homogeneous nucleation, thereby inhibiting the latter process [104]. This process can be described mathematically as follows:
d S d t = d d t e e s , i = 1 e s , i d e d t S d ln e s , i d t
The water vapour pressure e changes through two processes: the deposition/sublimation process and the expansion that changes the partial pressure without changing the mixing ratio, i.e.,
d e d t = e e s , i τ g ( t ) + e p d p d t
where
τ g 1 ( t ) = 4 π N D r i ( t )
is a parameter (bearing the dimension of the inverse of time) determined by the diffusivity of water molecules in air, D, the radius of ice particles, r i ( t ) , and the number density of ice particles, N. Please note that these ice particles are assumed to form one-to-one from ice nuclei.
It is widely recognized that, in addition to the chemical characteristics and variability of INPs, other factors play a crucial role in ice activation in cirrus-type clouds, such as the velocity of updrafts and the associated adiabatic cooling rates [103,108].
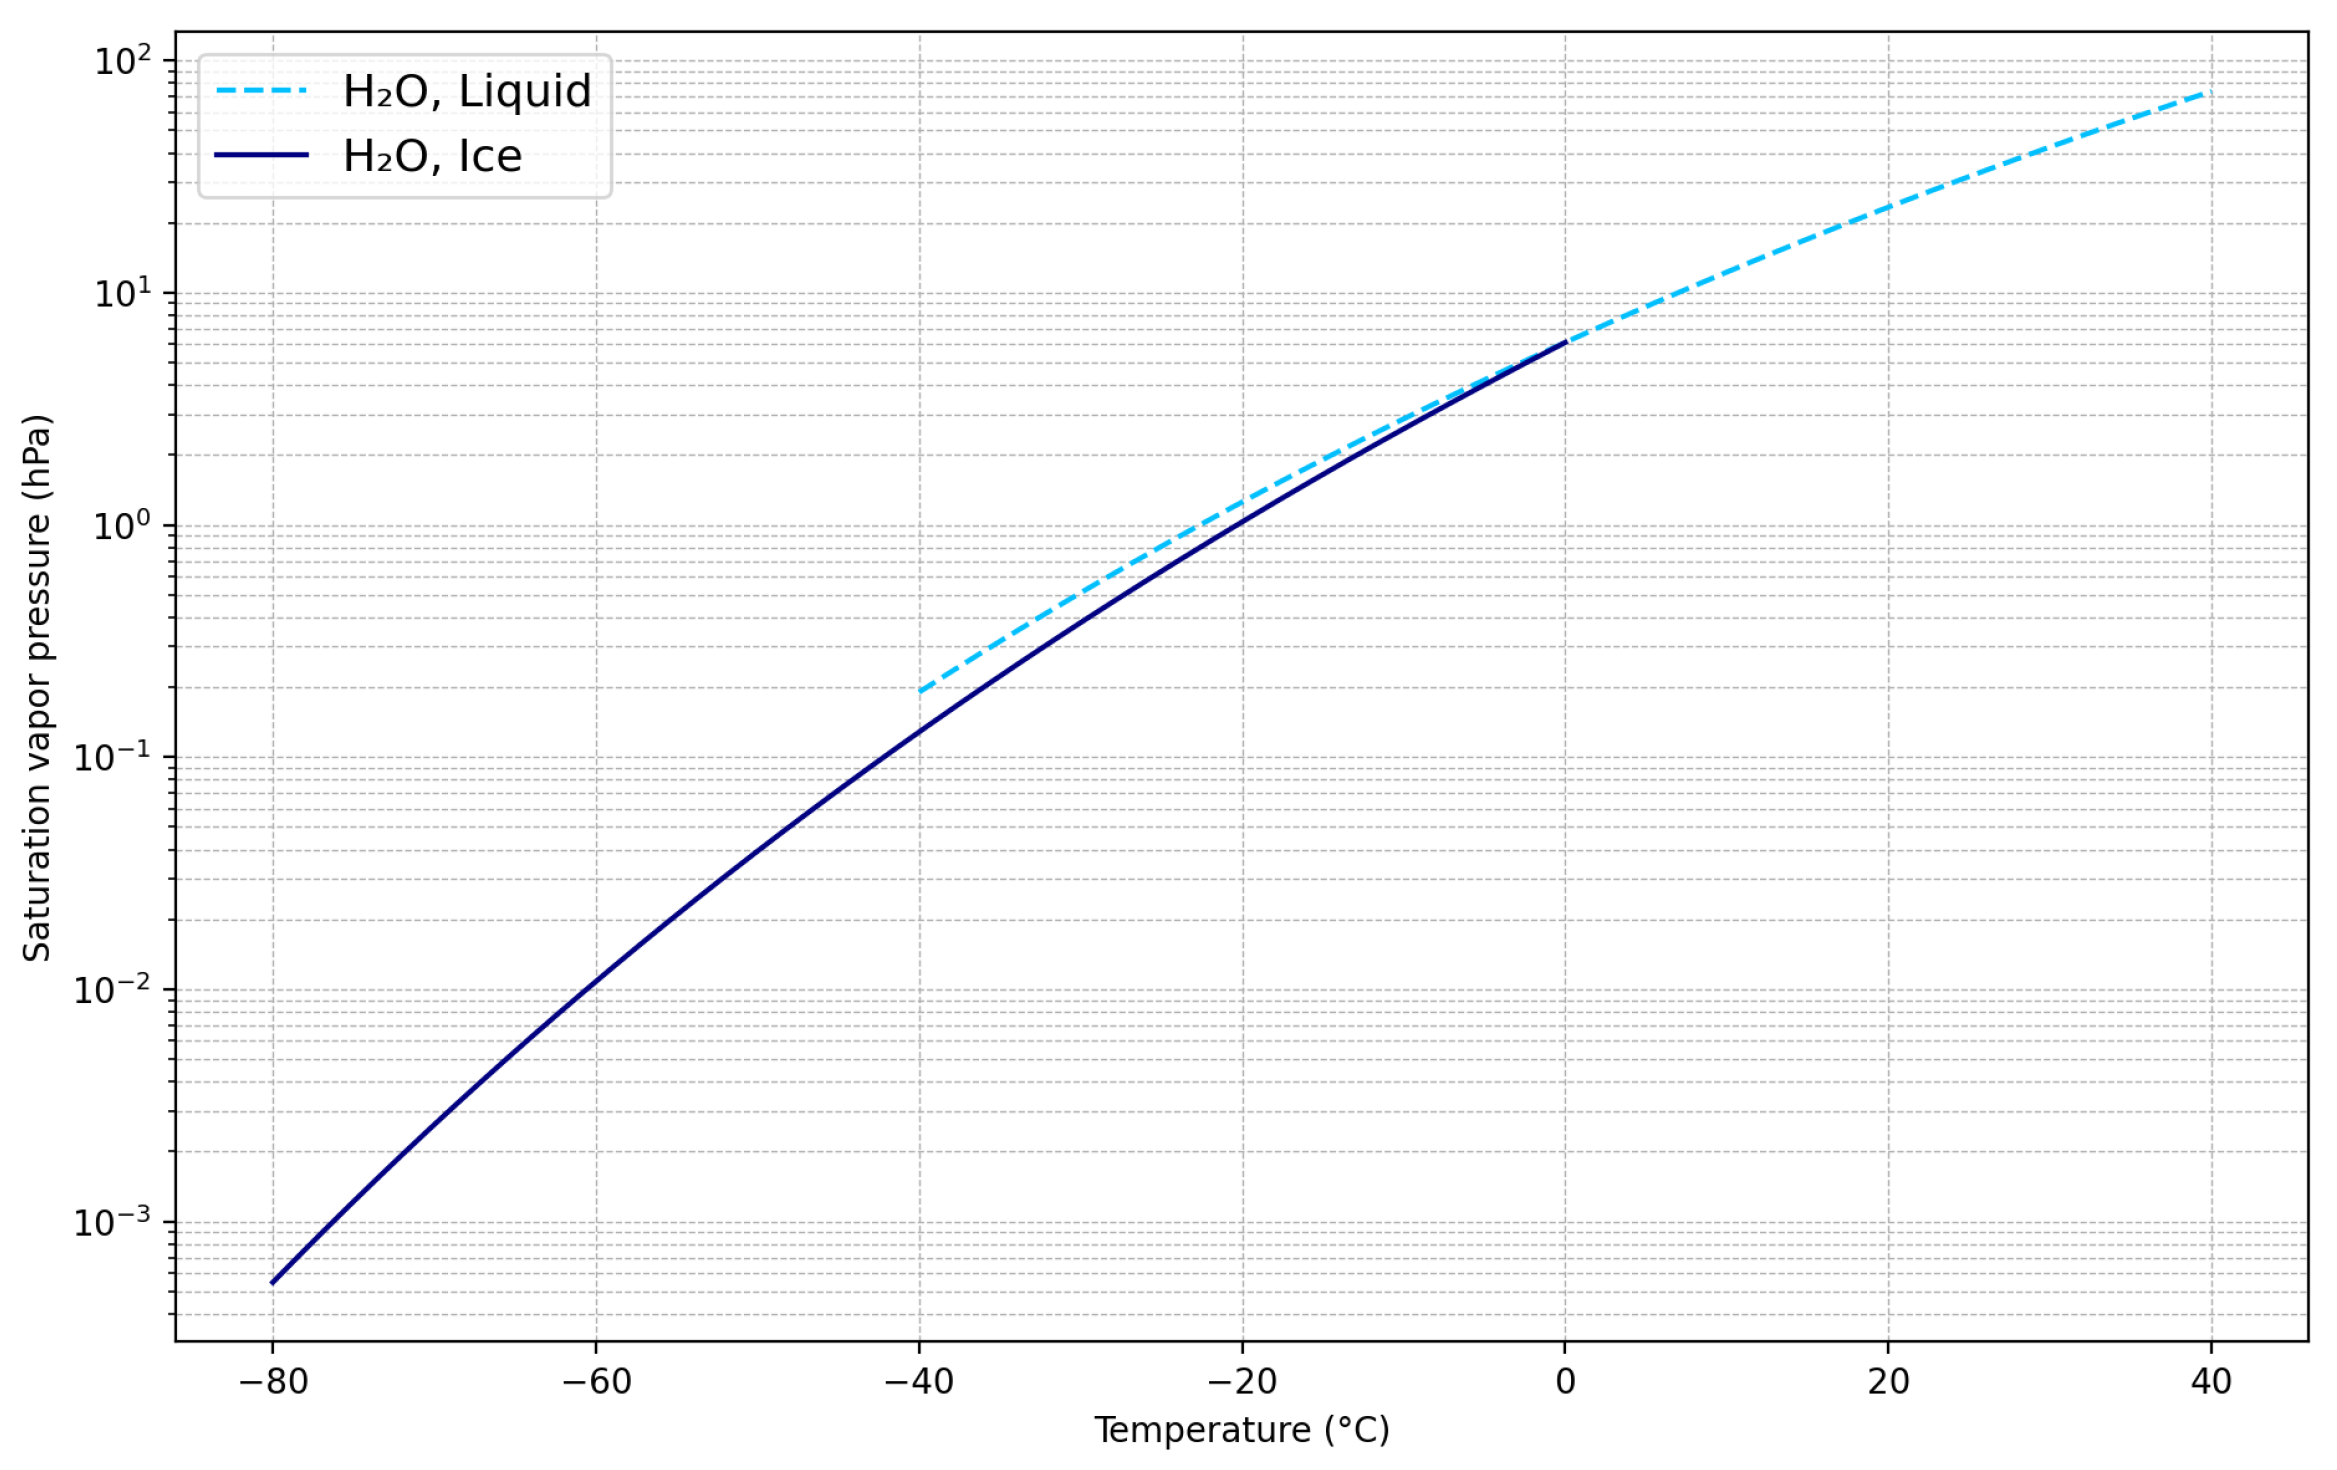
Figure 13 shows the saturation vapor pressure as a function of temperature for both ice and liquid water. The curves indicate that, at any temperature below 0 °C, the vapor pressure over liquid water is consistently higher than that over ice. This means that water vapor tends to deposit more readily onto ice surfaces, favoring ice formation over liquid water, a fundamental aspect of snow and frost formation.
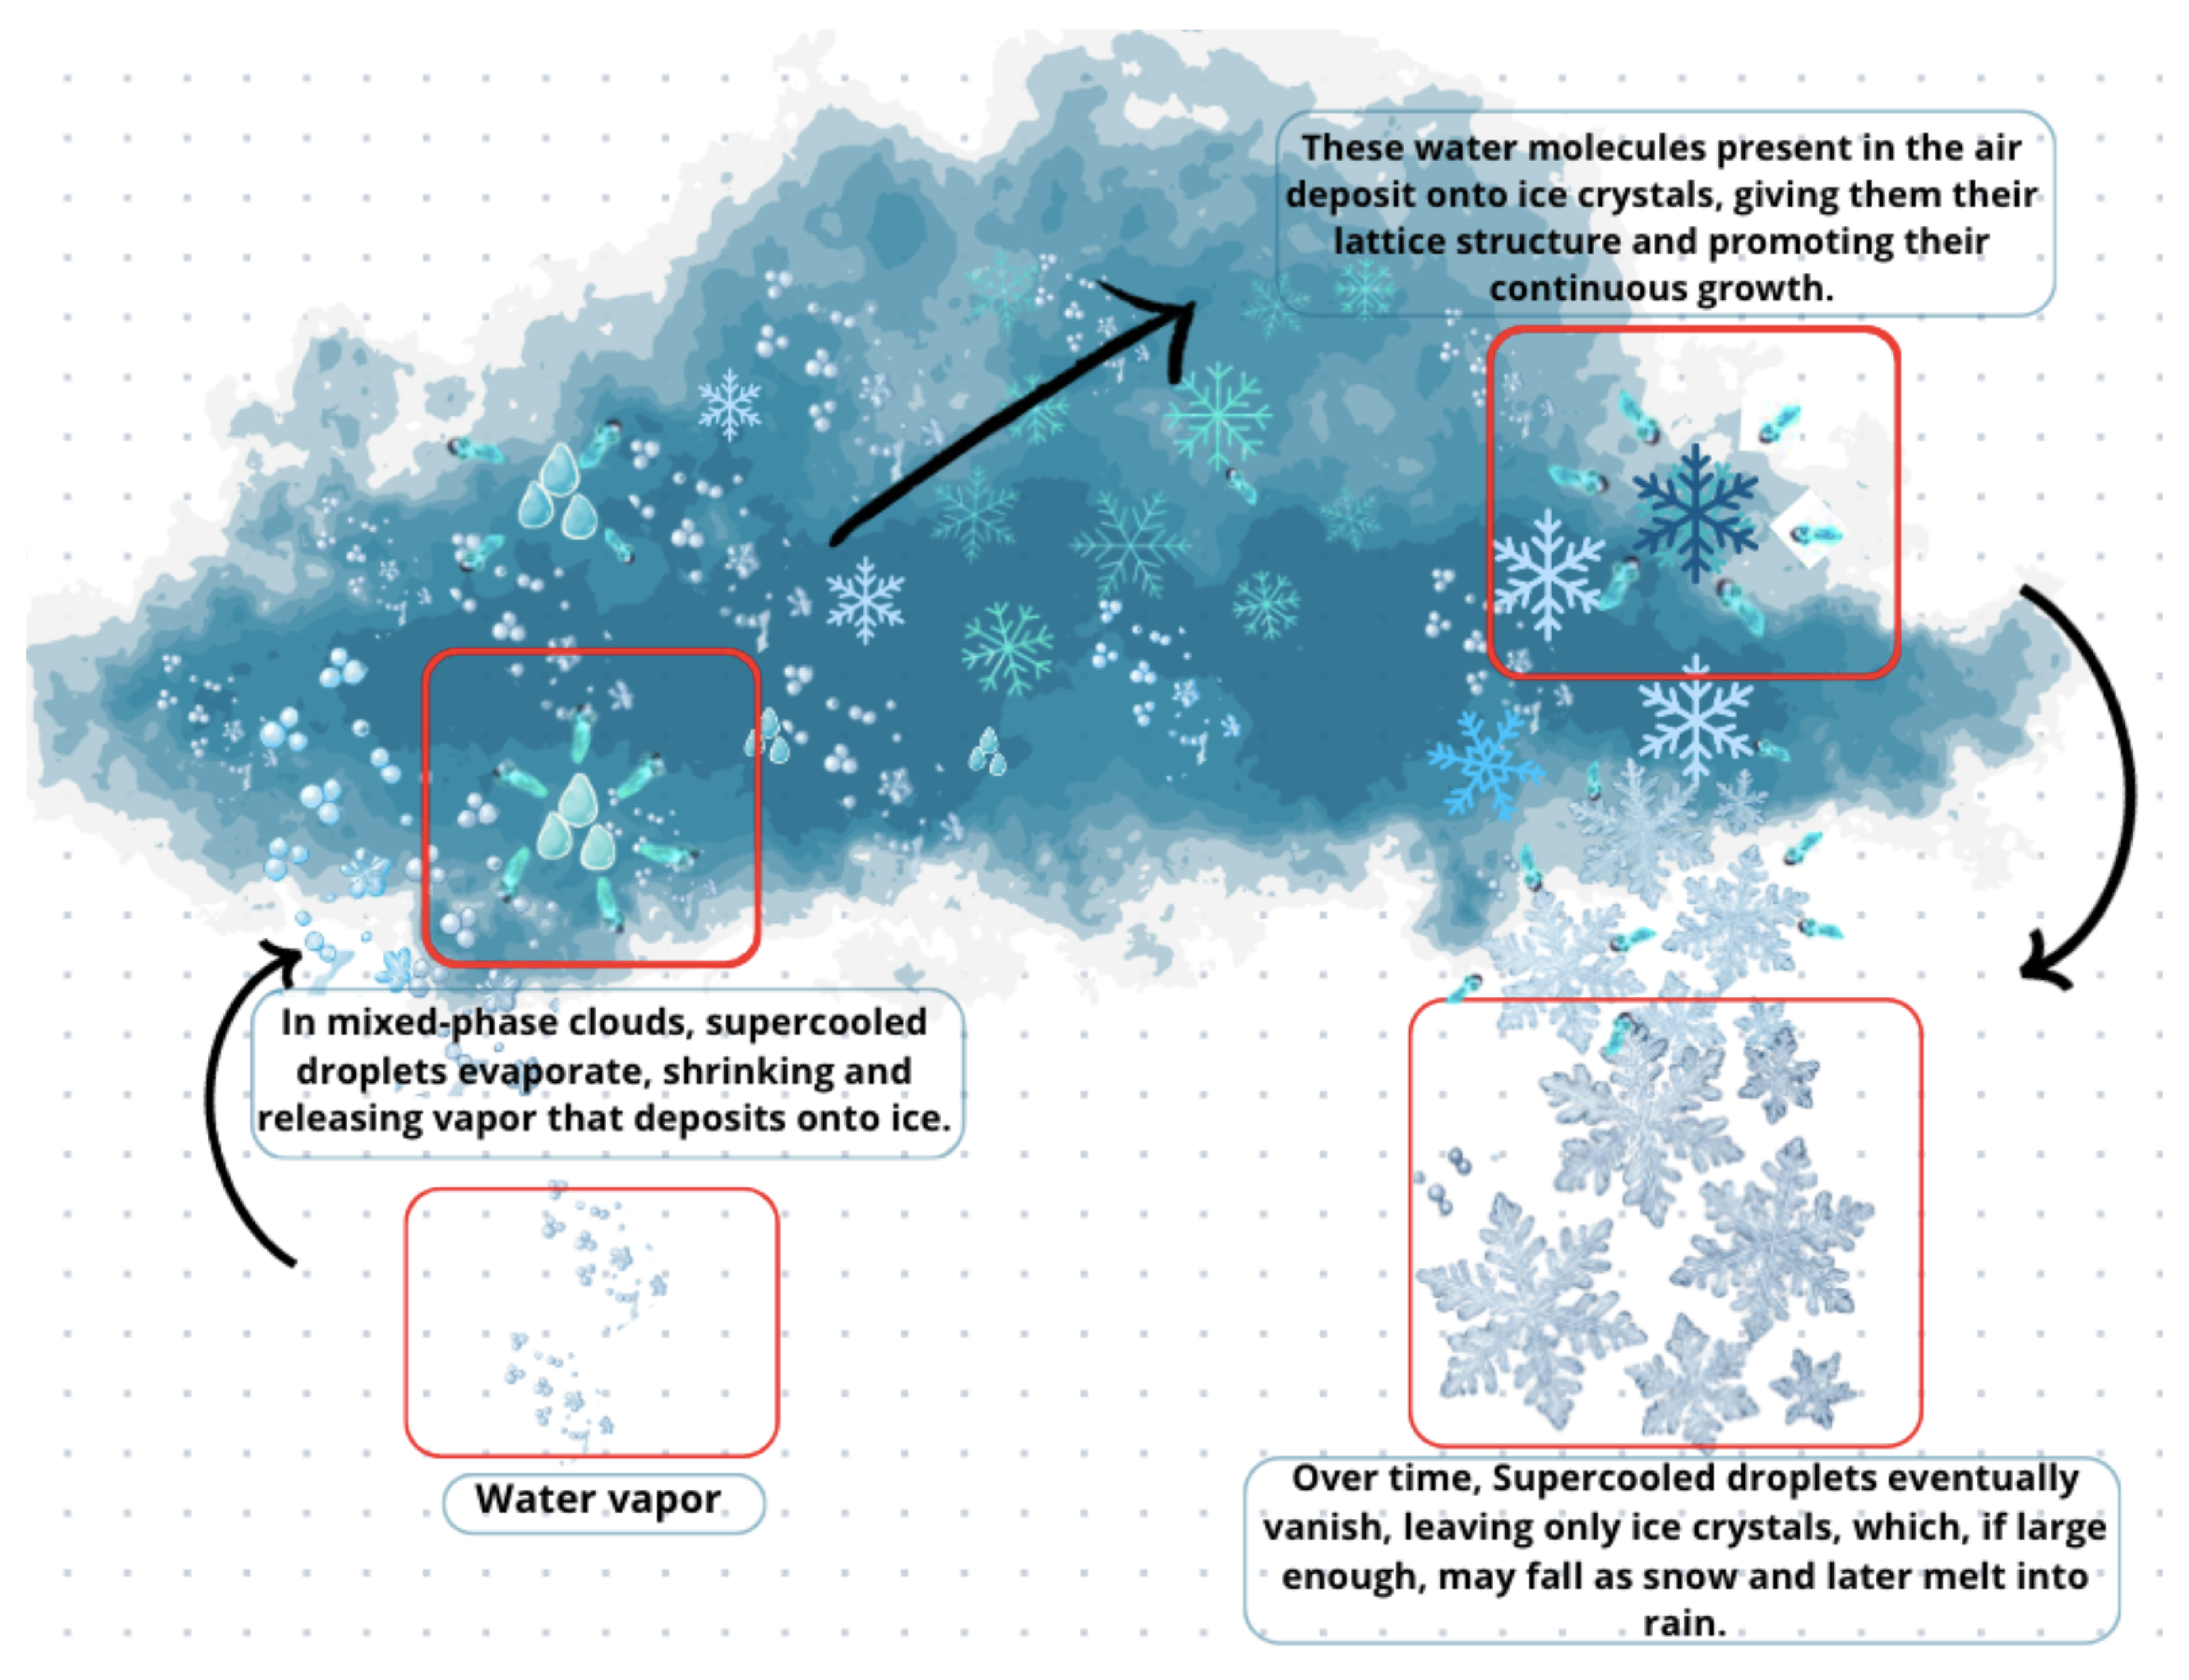
This physical principle also has important implications for mixed-phase clouds. In such clouds, ice crystals play a crucial role in redistributing water by promoting the loss of supercooled liquid water through vapor deposition [110,111]. This mechanism is known as the Wegener–Bergeron–Findeisen process (see Section 6.3.2 for more details).
In this way, the presence of ice crystals in mixed-phase clouds accelerates the precipitation process, reducing their lifetime compared to clouds composed solely of liquid droplets. This occurs because ice crystals grow rapidly through vapor deposition and riming, which promotes their early sedimentation [112,113].

5.1. Modes of Ice Nucleation

The thermodynamic barrier to ice formation can be overcome by extremely low temperatures (below −40 °C), high supersaturation in the air, or the presence of ice nuclei (IN). These aspects underpin the main ice nucleation mechanisms, as described by [114,115], and are summarized as follows:
  • Freezing nucleation—homogeneous: This process involves the formation of ice in a supercooled liquid environment, occurring at temperatures below 238 K, and is predominantly controlled by water activity (or ambient relative humidity—RH), temperature, particle size, and hygroscopicity [116,117].
  • Immersion freezing: In this process, an insoluble particle (IN), such as mineral dust, is immersed in a supercooled water body. This is dominant in the atmosphere [118].
  • Condensation freezing: Similar to immersion freezing, but it occurs when a particle acts as a CCN, e.g., salt, and immediately induces the freezing of the water condensate [119].
  • Deposition nucleation: Deposition ice nucleation occurs when ice forms on an INP from the supersaturated vapor phase, requiring low values of supersaturation and ice temperature [117].
  • Freezing—contact nucleation: Induced by a particle (IN) approaching the air–water interface and coming into contact with the supercooled liquid phase or aqueous solution droplet [117,120].
  • Inside-out freezing: When a residual solid core (organic aerosol) is coated with a water shell and immersion freezing can proceed [121].
Figure 14 illustrates different pathways of ice nucleation as a function of temperature, relative humidity, and supersaturation with respect to ice in a general schematic view.

5.2. Aerosol Types Involved in Ice Nucleation

INPs represent a specific and relatively rare subset of atmospheric aerosols, with estimates indicating that only one in every 100,000 to 1,000,000 aerosol particles has the potential to act as an INP [118].
These particles can originate from a wide variety of sources and exhibit diverse chemical compositions and morphologies, including mineral dust [122], combustion byproducts [123], organic aerosols, ammonium sulfate, bioaerosols (such as bacteria, spores, and pollen), and sea spray aerosols (SSA) [114,124,125,126,127].
INPs play a fundamental role in the formation of ice crystals in atmospheric clouds, influencing cloud phase state, associated microphysics, and, consequently, climate dynamics [118].
According to Franks (2003) [128], an effective ice nucleation catalyst must exhibit three key characteristics: low structural mismatch with ice, low surface charge, and a certain degree of hydrophobicity. For instance, Mehndiratta et al. (2024) [118] demonstrated that fatty alcohols exhibit nucleation temperatures dependent on the carbon chain length, with longer chains resulting in higher immersion freezing efficiency.
Although anthropogenic aerosols contain INPs in concentrations several orders of magnitude lower than those of natural origin [125], recent evidence suggests that these compounds may still have a relevant potential as ice-nucleating agents [129].
Mineral dust, in particular, is widely recognized as an effective INP, acting through both immersion and deposition nucleation, and can initiate freezing at temperatures ranging from 40   ° C to 60   ° C , depending on relative humidity and particle surface area [130]. Bioaerosols, such as certain bacterial species, stand out for triggering nucleation at relatively high temperatures (close to 0   ° C , often due to their large size and the presence of specific surface structures [124].
Soot exhibits more variable behavior, with nucleation efficiency strongly influenced by factors such as atmospheric aging. According to Korhonen et al. (2020) [123], in two modified combustion experiments, soot particles activated ice up to 5.9   ° C above the homogeneous freezing temperature, with no clear correlation to their physicochemical properties [131], leaving room for an as-yet poorly understood mechanism influencing INP effectiveness. Freshly emitted black carbon, for instance, tends to be ineffective as an INP, although its potential increases after cloud processing, particularly in regions with low concentrations of other ice-nucleating aerosols or under specific meteorological conditions, such as fog [132]. Organic aerosols, especially secondary organic aerosols (SOA), generally show low efficiency for heterogeneous ice nucleation but remain under investigation due to their abundance in the upper troposphere and possible role in cirrus cloud formation. While some studies have suggested heterogeneous ice nucleation by SOA, Kasparoglu et al. (2022) [117] argue that such events occur near the homogeneous freezing threshold, making it inappropriate to apply parameterizations based on sulfuric acid [133], given the lower hygroscopicity of SOA ( κ org = 0.12 ± 0.02 ; [97]).
Marine aerosols also represent an important class of INPs [134]. Sea spray aerosols (SSA), formed by wind-driven processes at the ocean surface, can act as ice nuclei via immersion or deliquescence freezing, especially at temperatures below 220 K [130]. These aerosols are among the most abundant on a global scale, having even been detected in the upper troposphere. Additionally, secondary marine aerosols (SMA), formed from the oxidation of ocean-emitted volatile compounds, such as dimethyl sulfide (DMS), have shown potential as INPs in mixed-phase clouds and possibly in cirrus clouds [130].
Other types of particles have also been identified as potential INPs, including metallic particles, volcanic ash, and anthropogenic dust (e.g., road dust), as well as solid-phase ammonium sulfate. Despite their individually low efficiency, the high atmospheric abundance of these particles can lead to significant impacts on cloud formation [129].
Figure 15 shows some of the possible sources of ice-nucleating particles (INPs). Their relative contributions may vary depending on the time period and location, as indicated by Tarn et al. (2018) [135].

5.3. Uncertainties in Ice Nucleation Understanding

Ice nucleation still suffers from imprecise measurements and limited representation in climate models, often relying on overly simplified assumptions regarding particle composition. Herbert et al. (2024, 2025) [136,137] show that including organic components improves simulations, highlighting deficiencies in traditional parameterizations. Miller et al. (2025) [138] emphasize the need for in situ validation of well-characterized laboratory substances, such as silver iodide (AgI), whose effectiveness as an ice-nucleating particle (INP) in the real atmosphere diverges from laboratory results.
Gardner & Wang (2025) [139] note that neither classical nucleation theory nor empirical models adequately predict ice formation on real surfaces, given the experimental variability and the complexity of interfacial conditions. In this context, Schrod & Bingemer (2025) [113] identify major experimental challenges: the rarity and spatiotemporal variability of INPs render their measurement uncertain, and even small temperature errors can lead to deviations of up to an order of magnitude in estimated nucleation efficiency. Ren & Mackenzie (2005) [104] further highlight that the critical nucleation density is highly sensitive to temperature and supersaturation, parameters that are difficult to quantify in the upper troposphere.
According to Gardner & Wang (2025) [139], the scarcity of data, absence of standardized methodologies, and dependence on poorly constrained environmental conditions limit robust predictions and hinder advances in process modeling. Regarding data acquisition, Zhang (2018) [116] emphasizes the difficulty in obtaining reliable values for the water–ice interfacial free energy, a key parameter for describing homogeneous nucleation, as its occurrence is rare due to the unavoidable presence of dust particles.
Beyond experimental limitations, the nature of INPs remains chemically and morphologically diverse and poorly understood. Gettelman et al. (2012) [140] for instance, highlight uncertainties in activation thresholds under varying humidity conditions, particularly regarding the controversial role of black carbon (BC). While some studies suggest that BC can act as an efficient INP, others have failed to detect its activity under controlled conditions.
There is also a clear need for more realistic microphysical models [103] to improve the understanding of ice crystal growth, especially under variable supersaturation regimes. It must be considered that interactions between droplets of different sizes influence the evolution of freezing and supersaturation, complicating precise estimates of homogeneous nucleation. Moreover, current models fail to adequately represent the role of stacking-disordered ice. According to Zhang (2018) [116], stacking-disordered ice is more stable than hexagonal ice (ice Ih, the most common form in nature) and should replace it in future ice parameterizations.
As shown, current knowledge of INPs is still marked by major uncertainties, both in the characterization of their activation mechanisms and in their representation within climate models.
In summary, there is an urgent need to:
  • Improve the accuracy of INP measurements in both field and laboratory settings;
  • Understand heterogeneous and homogeneous nucleation mechanisms across different environments;
  • Incorporate more realistic parameterizations of ice formation and evolution into climate models;
  • Investigate the effects of different aerosol types (e.g., BC, SSA) and their surface properties;
  • Include stacking-disordered ice in microphysical approaches to nucleation and ice growth.

6. Cloud Microphysical Processes

Among the main microphysical processes in clouds, according to Song et al. (2012) [141], are droplet activation, or the condensation process on a nucleus; ice nucleation by aerosols; and the autoconversion of cloud water/ice into rain or snow, i.e., precipitation development. In addition, the broadening of the size distribution of water and ice droplets in clouds, the Bergeron–Findeisen process, and finally, the deposition and self-aggregation of snow are also considered. These processes are further detailed and illustrated in Figure 16.
This section presents the different microphysical processes that interact with and affect cloud dynamics, such as cloud formation and lifespan and precipitation intensity. The main mechanisms are discussed below.

6.1. Droplet Growth by Condensation

After the processes of nucleation and coagulation of particles are understood [20], the processes occurring inside the clouds follow. Aerosol particles with CCN potential activate cloud droplets through the condensation process under supersaturated conditions [77,105]. Growth by condensation, according to Khain (2000) [72], begins below the cloud base ( S c < 0 ) and continues when S c > 0 . The physical stages for this growth are as follows:
  • Growth of aerosol particles to their equilibrium size;
  • Nucleation or activation of droplets;
  • Growth by diffusion of droplets.
The growth of cloud droplets by condensation is governed by the balance between the heat released due to the condensation of water vapor on the droplet surface and the heat removed from the droplet by thermal conduction to the surrounding air [142]. The formulations used to describe this growth rate assume isotropic behavior and that each droplet grows independently of the others, with no mutual interactions. This process is described by Fick’s law (mass diffusion) and Fourier’s law (heat conduction). By applying these laws, along with the Clausius–Clapeyron equation, the ideal gas law, and the Kelvin–Köhler equation to account for curvature and solute effects, the explicit growth equation for the droplet radius can be written as:
r d r d t = D v ρ v L v R v T 1 L v 2 K T R v T + R v T e s ( T ) exp L v δ R v T a r b r 3
where r is the droplet radius (m), ρ v is the ambient vapor density (kg/m3), D v is the diffusivity of water vapor in air (m2/s), L v is the latent heat of vaporization (J/kg), R v is the specific gas constant for water vapor (J/kg·K), T is the ambient temperature (K), e s ( T ) is the saturation vapor pressure at temperature T, K is the thermal conductivity of air (W/m·K), a and b are constants related to droplet curvature (Kelvin effect) and solute concentration, and δ 1 is a small correction accounting for the temperature difference between the droplet and the environment.
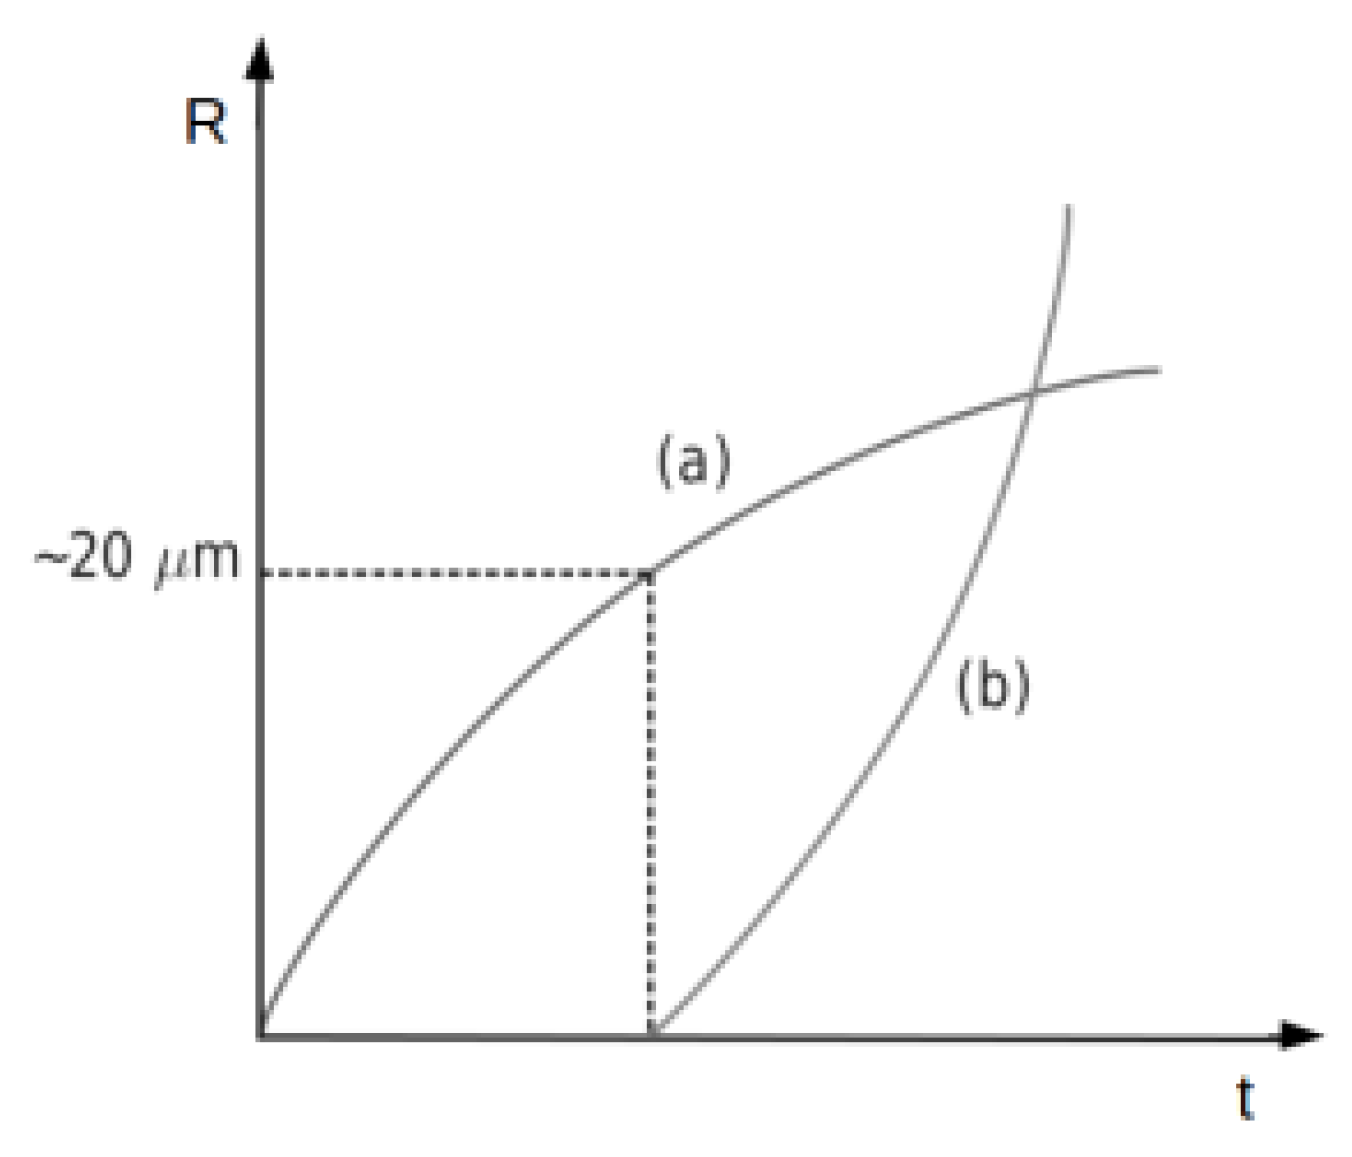
As shown by Wallace (2006) [143] (e.g., Figure 17), in the initial growth interval by condensation (a), the radius increases more rapidly than in the subsequent interval because the growth rate is inversely proportional to the particle radius. When the cloud droplet reaches a large radius, around 20 μm, it starts to collect smaller droplets with negligible mass and little inertia (b) [144].

6.2. Droplet Growth by Collision-Coalescence

When growth initiated by condensation reaches a collision efficiency radius, the additional process of collision-coalescence growth occurs [145]. In this process, the droplets, carried by vertical air currents within the cloud, collide and grow by assimilating other droplets. According to Jonas (1996) [146], growth by collision-coalescence is slow and negligible until some droplets (collection nuclei) reach a radius greater than 20 μm, as shown in Figure 17. Subsequent growth to the raindrop size can take just a few minutes, about 30 min in deep clouds with high liquid water content. As observed in the figure, droplets cannot grow to reach precipitable drop size by condensation alone [146].
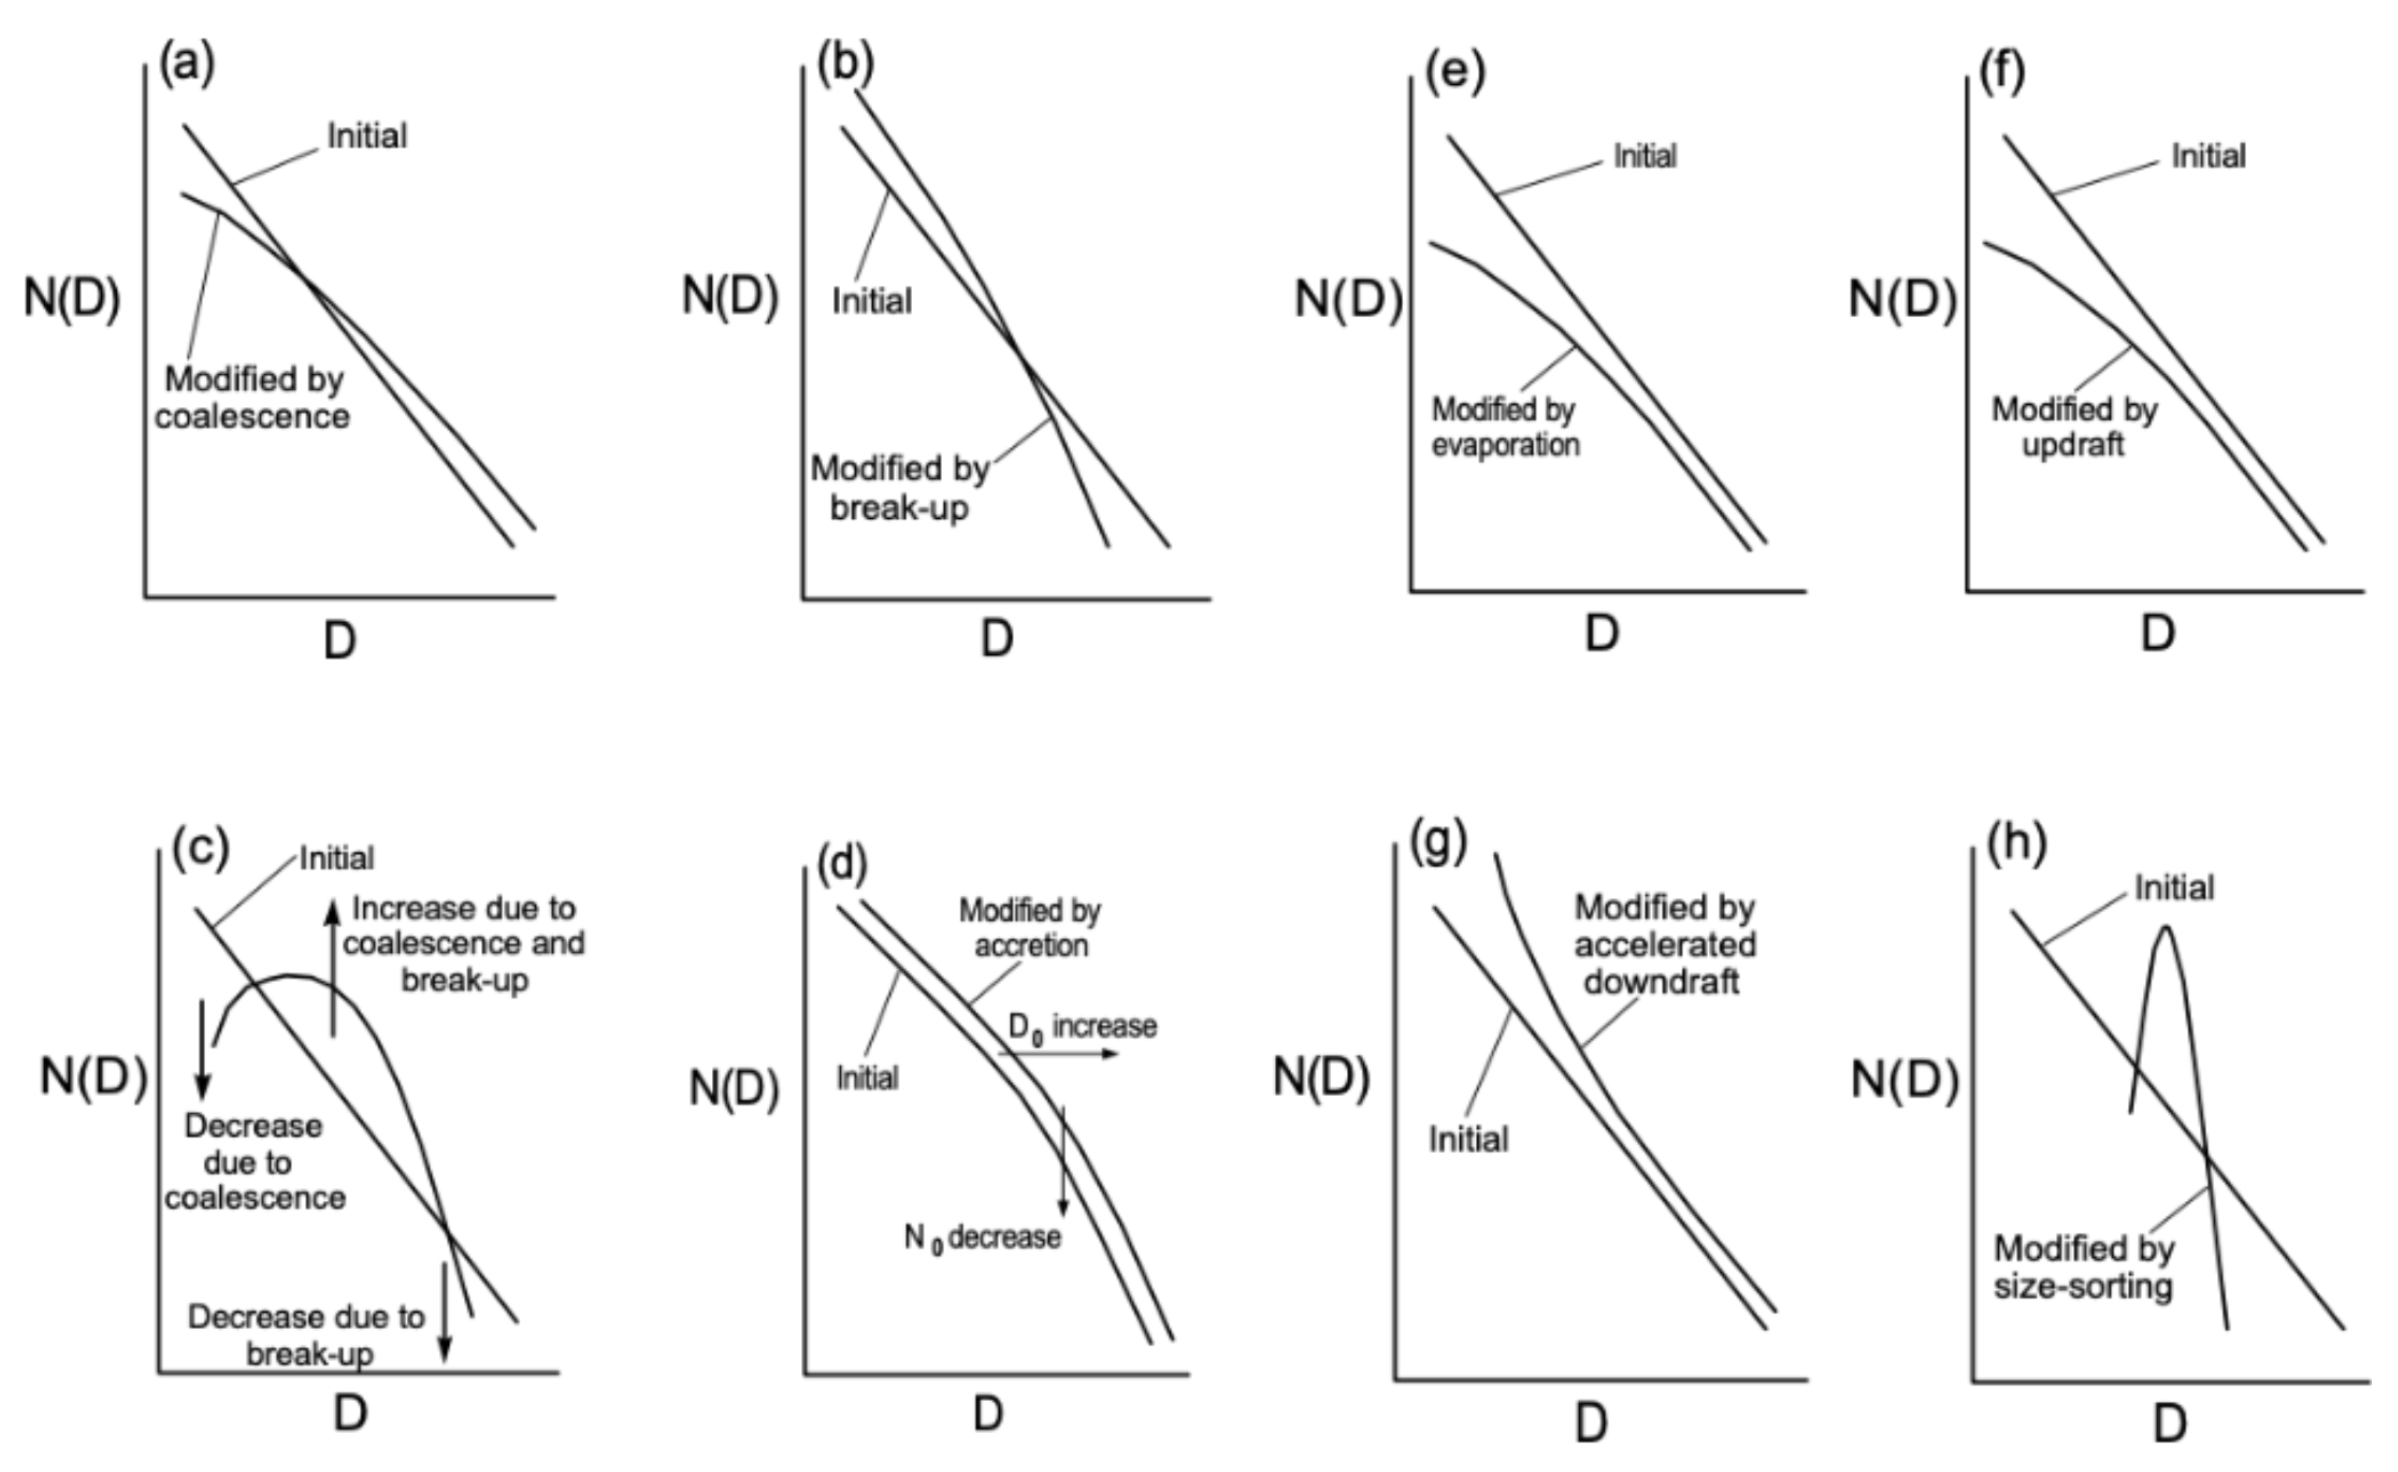
Collision-coalescence growth is the main mechanism controlling raindrop formation in warm clouds [72,147]. Furthermore, this process is related to the increase in size of the larger drops at the expense of the reduction in the number of smaller drops. Therefore, autoconversion is a mechanism responsible for the decrease in the total number of drops distributed within the clouds [148].
Equation (17), known as the simplified coalescence growth formulation, is used to describe droplet growth by collision-coalescence, where E ( R , r ) is the collision efficiency, defined as the fraction of droplets with radius r (< 20 μm) that are effectively collected by a larger droplet with radius R (> 20 μm) during the collision process. This efficiency represents the fraction of successful collisions between droplets and depends on the respective radii and velocities of the interacting particles. V 2 represents the highest fall velocity during the collision, resulting from the differential drag between the particles, relative to the total number of droplets swept. W is a constant defined as the liquid water content, that is, the mass of liquid water per unit volume, and ρ is the liquid density [10].
d r d t = V 2 E ( R , r ) W l 4 ρ 1
Regarding warm-phase microphysics, according to [105], the greatest numerical uncertainty is derived from a general parametrization for collision-coalescence and droplet breakup, effects included in the warm precipitation process. Droplet breakup occurs when the surface tension of the raindrop is broken by the effect of air resistance on the droplet when it becomes large, causing it to fragment. This process is characterized as a challenge to measure and is typically represented in simulations based on the average size of the raindrop [149].
In a recent study, Zmijewski et al. (2024) [150] modeled the collision-coalescence process using the All-or-Nothing (AON) algorithm, originally developed by Shima et al. (2009) [151]. This is a Lagrangian implementation based on the stochastic approach of Gillespie et al. (1975) [152], where the collision between pairs of droplets is treated as a probabilistic event.
The probability of collision between two super-droplets i and j during a time interval Δ t is given by:
P i j ( s ) = max ( ξ i , ξ j ) · P i j
with
P i j = K i j Δ t Δ V
where K i j is the collision-coalescence kernel (dependent on the droplet radii and relative velocity); Δ V is the volume of the computational cell; and ξ i and ξ j are the multiplicities of super-droplets i and j, respectively.
If P i j ( s ) > 1 , multiple coalescence events may occur between the super-droplet pair, as long as their multiplicity ratio allows it.
The authors used the linear sampling technique [150,151], in which only non-overlapping pairs are tested at each time step. This approach allows for more computationally efficient simulations, with all pairs being processed in parallel. To maintain the correct expected number of collisions while testing fewer pairs, the collision probability is adjusted in the linear sampling as follows:
P i j ( s , l ) = P i j ( s ) · N S D ( N S D 1 ) 2 / N S D 2
where N S D is the number of super-droplets, and only non-overlapping pairs of super-droplets are considered per time step.

6.3. Growth of Ice by Vapor Diffusion, Bergeron, Riming, and Aggregation

In summary, ice growth can occur in three main ways, based on the states of water: vapor deposition on ice, the addition of cooled water to ice, and the aggregation of ice on ice [10].

6.3.1. Vapor Diffusion

The growth of ice crystals in the atmosphere constitutes an intrinsically complex physical process that remains poorly understood, largely due to gaps in the fundamental physics governing the evolution of these crystals. Such growth is influenced by a wide variety of crystal shapes [153], with water vapor diffusivity and the thermal conductivity of the gas being important determinants of morphology and growth rate at micrometric scales [154], in addition to the well-known influences of temperature and supersaturation.
The transport of water vapor in dry snow layers plays an essential role in snow metamorphism and its mass and energy balance. This transport occurs predominantly via molecular diffusion through the interstitial pores, which is identified as the dominant mechanism by Fourteau et al. (2021) [155]. Thus, the physical-mathematical models describing the snow microstructure strongly depend on an accurate quantification of the effective vapor diffusion coefficient in this porous matrix.
The equation that describes the growth rate of ice crystals, considering an approximate spherical geometry, uses the concept of capacitance, which represents the influence of the crystal’s shape on the diffusive flux by electrostatic analogy. The rate of change of the ice crystal’s mass is given by [142,156]:
d M d t = 4 π C ( S i 1 ) L s R T 2 1 L s K T + R T e i ( T ) D v
where M is the mass of the ice crystal (kg), L s is the latent heat of sublimation (J kg 1 ), e i is the saturation vapor pressure over ice at temperature T (Pa), and T is the temperature (K).
However, to more accurately describe the anisotropic growth of ice crystals, Zhang and Harrington (2014) [157] developed the KLAH (Kinetically Limited Adaptive Habit) model. This model mechanistically estimates the deposition coefficients ( α ) along each crystal axis, based on experimentally obtained critical supersaturations. KLAH successfully reproduces the behavior observed both in laboratory experiments and in the atmosphere, where axial growth is inhibited under low supersaturation conditions, overcoming the limitations of the previous capacitance-based adaptive habit model. Due to its relative simplicity and its ability to capture essential aspects of kinetically limited growth, KLAH stands out as a promising tool for microphysical parameterizations in cloud models, providing consistent first-order estimates for these processes.

6.3.2. Wegener–Bergeron–Findeisen (WBF)

When liquid water and ice coexist, one of the physical processes governing the interaction between the liquid and solid phases in clouds is the growth of ice crystals at the expense of cloud droplets [158], which forms the basis of this theory (Figure 18). In other words, an environment saturated with respect to liquid water is highly supersaturated with respect to ice [159] at the same subfreezing temperature, and the relative difference in supersaturation becomes more pronounced as temperature decreases (as shown in Figure 18). It is worth noting that the maximum relative difference between the saturation vapor pressures over liquid water and ice occurs near −12 °C, where liquid water has a vapor pressure 20–25% higher than that of ice. Below −20 °C, this ratio stabilizes around 1.1–1.2.
This process can occur in both ascending and descending air currents within mixed-phase clouds. As the differences in saturation vapor pressures become more pronounced below 0   ° C, abrupt glaciation may occur at temperatures between 40   ° C and 0   ° C [159] (see Figure 19).
According to Khain et al. (2022) [160], ice crystal concentrations below 1.0   L 1 (1 ice crystal per liter of air) have a limited impact on water vapor condensation and particle evolution, contributing to the microphysical equilibrium of clouds under these conditions. The authors also emphasize that the WBF process requires the simultaneous presence of both liquid droplets and ice crystals in the same cloud region, being more efficient when there is direct interaction between these phases. Furthermore, an increase in ice concentration reduces the amount of available liquid water and intensifies ice formation, significantly influencing the structure and persistence of mixed-phase clouds.
In this context, a study by Yang et al. (2025) [161] proposes an innovative parameterization of the heterogeneous mixture of liquid water and ice in mixed-phase clouds. This approach, based on airborne observations and the theory of information entropy, enables quantification of the mixture’s homogeneity and improves the representation of ice growth via the WBF process in global climate models, such as CAM6. This results in significant impacts on cloud phase simulation and the radiative balance.
As previously mentioned, Korolev et al. (2007) [158] pointed out that the WBF process is not the only possible scenario for a cloud composed of liquid water, ice, and vapor, that is, a three-phase cloud. Based on their study, the following are three possible scenarios for the evolution of mixed-phase clouds, considering the vapor pressure in the cloud (e) and the equilibrium vapor pressures over liquid water ( e s ) and over ice ( e i ):
  • For e > e s > e i and u z * = e s e i e i η N i r , both droplets and ice particles grow simultaneously when the upward velocity u z exceeds u z * .
  • For e s > e > e i , the WBF process can occur in both upward and downward currents when u z < u z < u z * .
  • For e s > e i > e , and u z = e i e s e s χ N w r , the simultaneous evaporation of ice particles and liquid droplets can occur in downward currents when u z < u z e .
Here, η and χ are coefficients dependent on the temperature T and pressure P, and N and r are the number concentration and mean radius of the particles, respectively.

6.3.3. Riming

The Riming process occurs in mixed-phase clouds within a temperature range of approximately 5 to 15   ° C, where the liquid water content in the cloud varies between 1 and 1.5   g/m 3 , coexisting with the ice phase [162]. In this process, ice particles grow at the expense of supercooled droplets, leading to the formation of graupel and hail, with the former being a moderate case and the latter being the extreme case of ice growth (Figure 20).
The collection efficiency of water by riming is still poorly understood experimentally and theoretically. For this reason, it is assumed that the collection efficiency is the same as that for droplet collection [72,162].
In experiments by Blohn et al. (2009) [162], the kernel collection equation for ice was used, which is calculated from the mass increase d m ̲ d t and the liquid water content, as described in the following equation:
K i c e = d m ̲ d t L W C ̲
The degree of riming of the hydrometeor was estimated by Garrett & Yuter (2014) [163] as:
x = P 2 π r e q ( 1 + σ )
where x is the geometric complexity parameter and P is the perimeter of the hydrometeor. The radius equivalent to the circular area is r e q = A π , where A is the cross-sectional area of the particles. In addition, σ represents the average variability of pixel brightness, which depends on the measurement angle.
Garrett & Yuter (2014) [163] classified the degree of riming into the following categories, ranging from simpler particle shapes to more complex particle structures:
  • x 1.35 —rimed particles (graupel);
  • 1.35 < x 1.75 —moderately rimed particles;
  • x > 1.75 —aggregates with insignificant riming.
However, despite its relevance for observational and qualitative characterization, the practical application of Equation (12) is limited by the requirement for multi-angle imaging and three-dimensional information of the hydrometeor to retrieve its properties, such as geometric shape and degree of riming, which restricts its broader usability.
According to Maherndl et al. (2023) [164], there is still no exact mathematical description of ice crystals due to their high morphological and physical variability. Moreover, characterizing individual particles within a population observed by radar is impractical. Consequently, it is a widely adopted approach to represent the average geometry of these particles through empirical relationships between particle size, mass, and cross-sectional area.
In remote sensing of ice particles, estimating their electromagnetic scattering properties requires specific theoretical approximations. The Rayleigh–Gans Approximation (RGA) is commonly employed in this context, as it provides accurate estimates for particles without riming at low computational cost. This theoretical framework underpins the development of the Self-similar Rayleigh–Gans Approximation (SSRGA), which describes the internal mass distribution of ice particles using a reduced set of dimensionless parameters. Despite its improvements, SSRGA has limitations, particularly in simulating polarization-dependent scattering, due to its neglect of dipole–dipole interactions inherent to the RGA [164,165].
To overcome these constraints, Maherndl et al. (2023) [164] proposed a riming-dependent parameterization for the scattering properties of ice and snow particles based on SSRGA. Their approach links backscattering to riming degree, particle mass, and cross-sectional area, and it is validated using numerical simulations of rimed aggregates and various ice crystal habits. The results demonstrate a significant reduction in backscattering bias, especially at 35.6 GHz and 94 GHz, with errors generally below 2 dB. Furthermore, the method better captures microphysical variability, particularly for heavily rimed or large particles.
The degree of riming was quantified using the normalized rime mass, as defined by Seifert et al. (2019) [166]:
M = m rime m g
where the graupel mass is given by:
m g = π 6 ρ rime D max 3
According to Fitch et al. (2022) [167], microphysical parameterization schemes have evolved from the binning technique (discrete intervals or compartments) to the use of predefined categories of hydrometeors, aiming to describe the evolving properties of hydrometeor particles distributed in a continuous spectrum, such as the riming process [168]. These properties include the density, shape, and fall speed of hydrometeors [169].

6.3.4. Aggregation

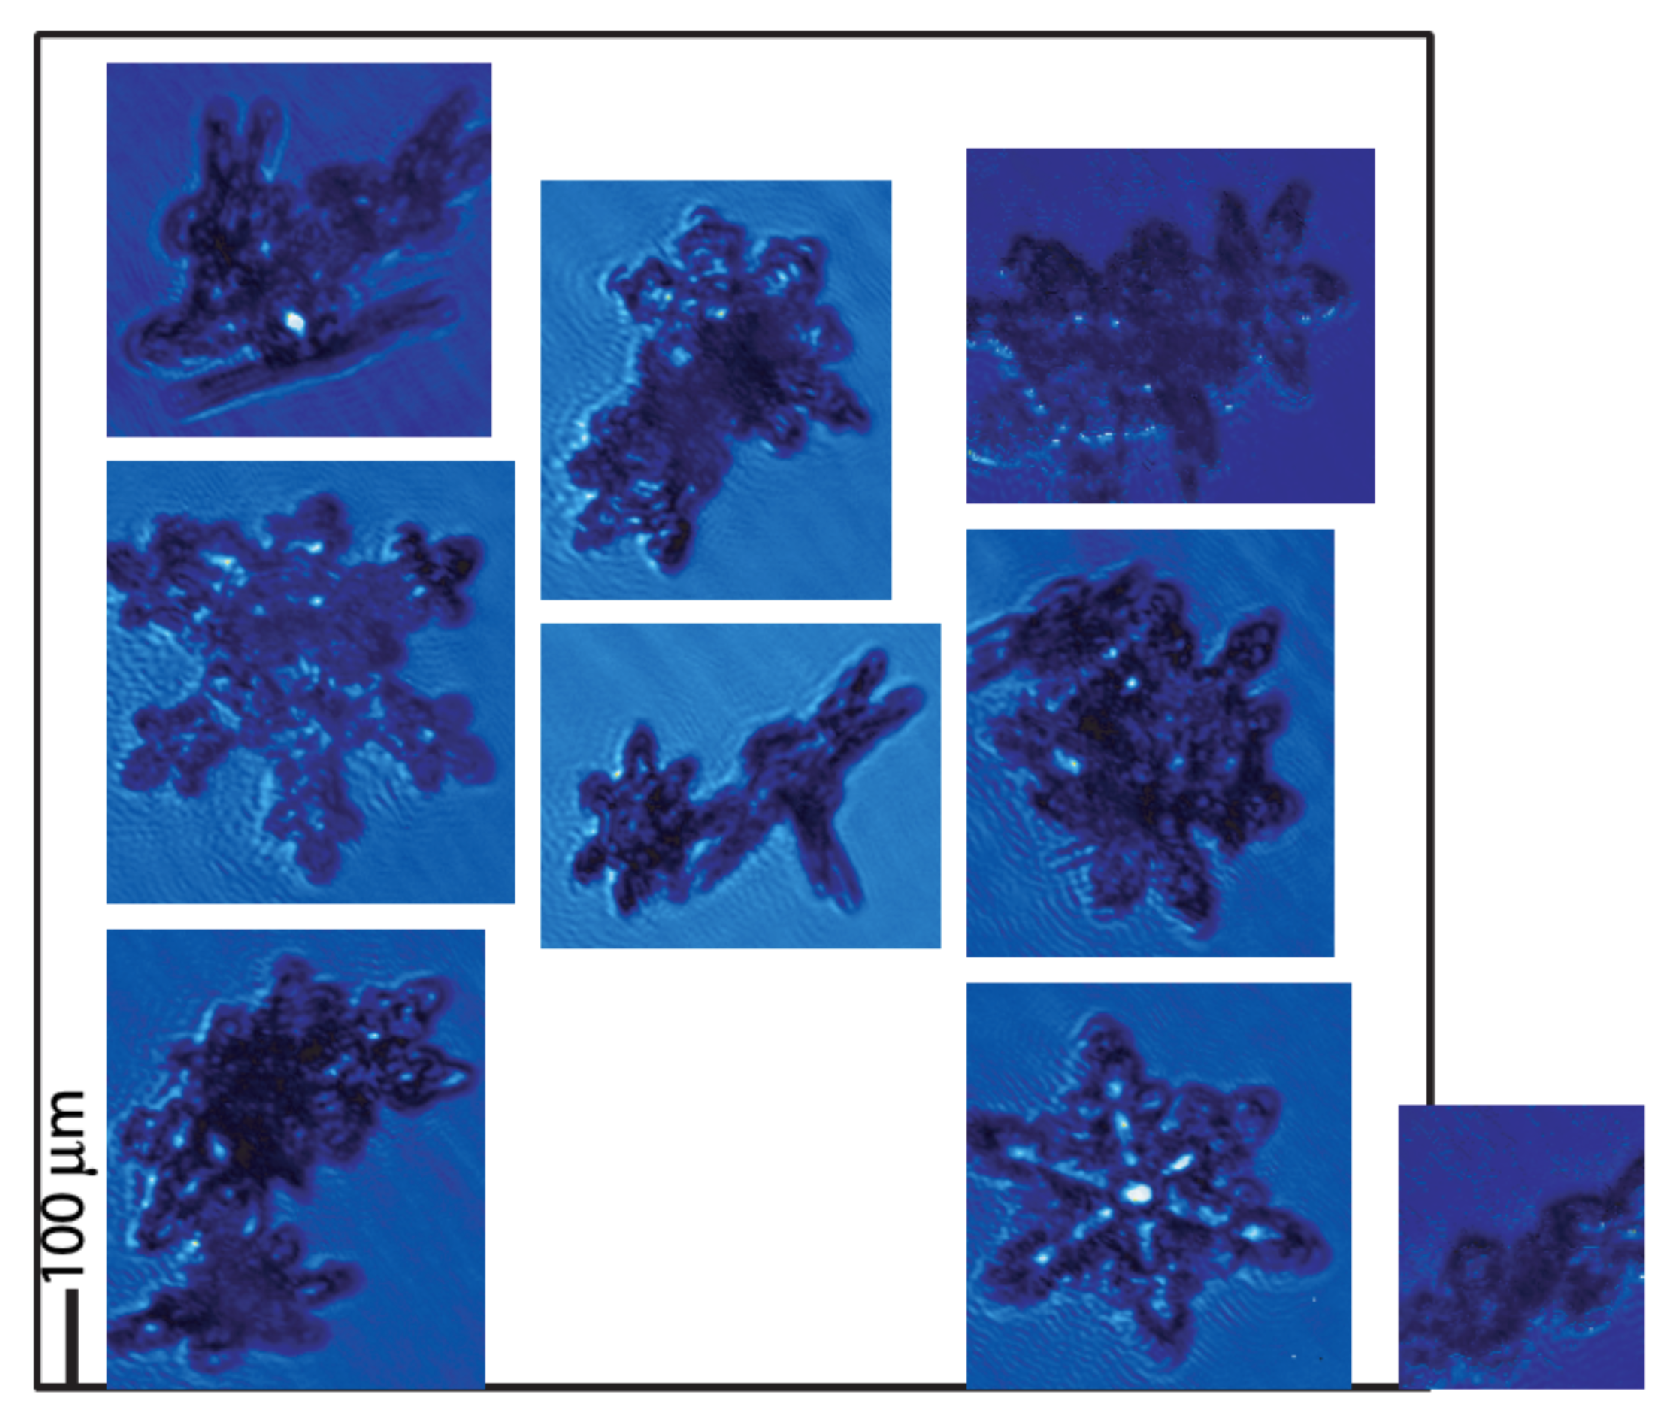
Ice crystal chains (e.g., Figure 21) result from the aggregation process and tend to form more frequently when there is a high concentration of crystals in the cloud. According to Sulia et al. (2021) [170], the adhesive properties of ice crystals intensify at temperatures close to 0 °C, favoring aggregation, and decrease as the temperature drops. This behavior is especially evident between 0 °C and −10 °C, when crystals acquire more branched structures and surfaces prone to adhesion. The process is influenced by factors such as temperature, particle size, and the presence of liquid water. It is also known as snow autoconversion and differs from accretion, which refers to the collision of cloud droplets that coalesce to form raindrops.
According to Korolev et al. (2020) [172], ice crystals can grow by aggregation and riming after reaching a critical size. Waitz et al. (2021) [173] add that crystals with edges smaller than 500 µm play an essential role in nucleation in mixed-phase clouds (MPCs).
Representing the diversity of ice crystal shapes and sizes is fundamental to accurately simulating the microphysical and optical properties of clouds. Baran (2009) [174] showed that models based on individual crystals are inadequate for representing cirrus clouds. Instead, he proposed the use of ensemble models, which consider the variability of crystal shapes associated with the particle size distribution (PSD), providing a more physically consistent approach to simulating both microphysical properties (such as ice water content, IWC, and the extinction coefficient) and radiation scattering.
Yang et al. (2011) [175] developed a representation based on in situ observations, composed of chains of hexagonal plates with smooth or rough surfaces. The authors showed that neglecting these structures in models can lead to significant errors in estimating reflectance, directly influencing the calculation of effective particle size and the optical thickness of ice clouds.
To properly represent aggregation among nonspherical ice crystals, Sulia et al. (2021) [170] proposed a modified collection equation based on the classical hydrodynamic kernel of Pruppacher and Klett (1997) [89], expanding it to include dependence on shape (axes a and c) and thermodynamic conditions:
d m x e = π ρ um u m x min u m x max c x min c x max u m e min u m e max c e min c e max ρ e u V x e U M | v x v e | N x N e E d c e d u m e d c x d u m x
where d m x e is the rate of change in mass mixing ratio (kg kg 1 s 1 ) due to the aggregation of two populations of ice crystals, denoted by subscripts x and y; ρ um is the density associated with the mass unit used for hydrometeor representation; u m x and u m e are the lengths (e.g., major axis) of the collector and collected ice crystals, respectively; c x and c e are the secondary lengths (e.g., minor axis) of the collector and collected crystals, respectively; ρ e is the density of the collected ice crystal; V x e is the effective interaction volume, defined as V x e = ( u m x 2 c x + u m e 2 c e ) ; U M is the unit mass; | v x v e | is the magnitude of the difference in terminal velocities between the collector and collected ice particles; N x and N e are the number concentrations of the collector and collected ice crystals, respectively; E is the collection efficiency; d c x , d u m x , d c e , and d u m e are differential elements for integration over the characteristic dimensions of the collector and collected crystals.
The ice phase in cloud microphysics still presents the greatest uncertainties, according to Morrison et al. (2020) [105], mainly due to the wide variety and morphological complexity of crystals, especially in secondary formation processes, i.e., those that occur after the initial ice formation. Such uncertainties directly impact numerical simulations, compromising weather forecasts and climate projections. Therefore, microphysical schemes face the ongoing challenge of adequately representing the individual properties and shapes of particles in mixed-phase clouds and precipitation processes.

6.4. Secondary Ice Production (SIP)

Han et al. (2024) and Cholette et al. (2024) [176,177] emphasize that the cloud phase has a significant influence on cloud evolution, radiative properties, and precipitation; however, phase simulation remains challenging due to inadequate representation in models.
Secondary ice production (SIP) is a frequent phenomenon in various cloud types, ranging from polar regions to the tropics [178]. Examples include mixed-phase orographic clouds [179,180], polar clouds [180,181], cold frontal rainbands [182], cold marine boundary layer clouds [183], and stratiform clouds on a global scale [181]. According to Cholette et al. (2024) [177], studies on the impacts of SIP in stratiform clouds and winter storms are still scarce.
Currently, seven main mechanisms describe SIP: freezing droplet fragmentation (FFD), the Hallett–Mossop (HM) process, ice–ice collisions, thermal shock, sublimation, activation of INPs during transient supersaturation around freezing droplets, and the shattering of freezing water droplets upon collision with ice particles. Korolev & Leisner (2020) [184] provide a detailed review of these mechanisms and the state of laboratory studies (Figure 22).
  • Shattering during droplet freezing: During the freezing of a supercooled droplet, an ice shell forms around the liquid core. As freezing progresses inward, the volumetric expansion of ice traps the remaining liquid water under increasing internal pressure. Once a critical threshold is exceeded, the shell may rupture, releasing ice fragments that act as secondary ice crystals [185,186].
  • Rime-splintering (Hallett–Mossop) process: This occurs when supercooled droplets collide with and freeze upon falling ice particles, such as graupel or ice crystals. During this process, small droplets, typically with diameters greater than 24 μ m , freeze upon impact with the ice surface. Under certain conditions, typically between 3   ° C and 8   ° C , this freezing can generate small ice fragments (splinters) that detach and act as secondary ice crystals, significantly increasing the ice concentration in the cloud [187].
  • Fragmentation due to ice–ice collision: Process by which ice particles mechanically break upon collision, producing small fragments that act as secondary ice [188].
  • Ice particle fragmentation due to thermal shock: Process by which ice particles break due to internal stresses generated by rapid localized heating caused by the freezing of a supercooled droplet attached to the surface of the ice crystal. When the droplet freezes, it releases latent heat that raises the local temperature of the crystal to the melting point, causing differential expansion of the ice and generating thermal stresses that can lead to cracking and fragmentation of the crystal [189].
  • Fragmentation of sublimating ice: Process in which ice particles, especially those with edges or dendritic shapes, mechanically break apart while sublimating in cloud regions with relative humidity below saturation (subsaturated). During sublimation, the transition from solid ice to vapor creates stresses within the crystal structure, which can lead to the detachment of fragments [190].
  • Activation of ice-nucleating particles in transient supersaturation around freezing drops: Process in which freezing droplets temporarily create a region around them with high water vapor supersaturation, activating ice nuclei (INPs) that would normally not be activated, leading to the formation of new ice crystals [189,191].
Zhao & Liu (2022) [181] point out that in mixed-phase clouds with temperatures ranging approximately from 38   ° C to 0   ° C , ice crystals can originate either from heterogeneous ice nucleation on INPs or through SIP processes, which often amplify the number of ice crystals initiated by primary ice [111,178,192]. Measurements reveal a discrepancy of up to five orders of magnitude between ice crystal concentrations and INP concentrations, indicating a potentially significant contribution of SIP mechanisms to atmospheric ice formation. Complementing this perspective, Zhao and Liu (2022) [181], using simulations with the CESM2 model, demonstrated that SIP can account for up to 80% of total ice crystal formation in single-layer mixed-phase clouds, often surpassing primary nucleation. They also showed that SIP transforms up to 30% of clouds, originally simulated as liquid-only when SIP is excluded, into mixed-phase clouds, thus modulating cloud phase and affecting precipitation microphysics.
The relevance of SIP for realistic model representation has been further emphasized by several simulation-based studies. Qu et al. (2022) [178], using high-resolution simulations of a tropical mesoscale convective system (MCS), demonstrated that including SIP processes is essential for reproducing observed high ice crystal concentrations and elevated ice water content (IWC), particularly in regions of low radar reflectivity at upper levels. Their results show that SIP enhances secondary convection above the melting layer by increasing buoyancy due to latent heat release during vapor deposition onto secondary ice particles, thereby prolonging MCS lifetime and sustaining regions of high IWC. Additionally, they observed that aggregation processes reduce both ice particle number and IWC at high altitudes, although these processes are highly sensitive to uncertain model parameters like collection efficiency.
Similarly, Han et al. (2024) [176] evaluated the role of SIP in deep convective clouds by implementing three SIP mechanisms—rime splintering, droplet shattering during freezing of supercooled drops, and ice–ice collisions—in a two-moment microphysics scheme. Their simulations revealed that SIP can increase ice crystal number concentrations (ICNCs) by up to 20 times and reduce surface precipitation by up to 20%. Among the mechanisms, ice–ice collisions dominated, with rates up to four orders of magnitude higher than rime splintering. SIP significantly altered cloud phase and ice enhancement factors (IEFs), underscoring the importance of representing these processes in numerical models.
It is important to note that secondary ice production (SIP) processes can obscure the primary role of aerosol particles acting as ice-nucleating particles (INPs), particularly in mixed-phase clouds, where SIP may dominate the ice crystal population [192]. In this context, Zhao & Liu (2021) [193] demonstrated, through global climate model simulations, that SIP is the dominant ice formation mechanism in moderately cold clouds (warmer than 15   ° C ), increasing ice crystal number concentrations (ICNCs) by up to three orders of magnitude. SIP also reduced the liquid water path by 22%, increased the solid-phase water path by 23%, and modified the global mean cloud radiative forcings, highlighting its crucial role in cloud representation at the climate scale.

6.5. Drop Size Distribution (DSD)

Several physical factors influence drop size distribution, including the type of precipitation (e.g., stratiform, orographic, or convective), rainfall rate, position relative to the rain core, and ambient relative humidity [194]. Commonly, the drop size distribution n ( D ) is considered a function of the precipitation rate, which is sufficient to describe a given volume of liquid cloud, considering the very different radius intervals for droplets and raindrops (bimodal) [77].
However, the region of small droplets is poorly observed by many detection instruments, while large droplets are present in low concentrations and therefore require sampling over large volumes to obtain statistically reliable measurements [195,196,197]. This reduces the local representativeness of size distributions and introduces uncertainties, especially in deep convective clouds, where in situ measurements are limited by operational constraints. As a result, representing these regions of the spectrum in bulk microphysical schemes is challenging, and the K-theory [198] is often used to describe turbulent mixing at unresolved scales [197].
Smith et al. (2003) [195] analyzed some advantages and disadvantages of the gamma and Marshall–Palmer exponential distributions, particularly the insensitivity to the variability of large droplet sizes, which may be lost when choosing one of these functions, and the loss of information about small droplets, respectively. The authors inferred that the differences in estimates of relevant quantities such as water content, precipitation rate, or radar reflectivity fall within a plausible range of sampling uncertainty, referencing Marshall & Palmer (1948) [199]. Therefore, the distinction between exponential and gamma functions has little practical consequence, as the observed differences do not justify the additional computational cost or mathematical complexity. The main distinction lies in the fact that the gamma function is mathematically more complex and, consequently, computationally more expensive, though this difference is minimal and, according to the authors, often not warranted. For this reason, due to its simplicity and effectiveness in representing drop size distributions, the distribution derived from the Marshall–Palmer model is widely accepted [147].
The Marshall–Palmer exponential distribution of cloud droplets [199] can be mathematically described as:
n ( D ) = n 0 exp ( Λ D ) = n 0 exp 4 D D m
where D represents the drop diameter, and n 0 and Λ are the concentration and size parameters, respectively. The last form is expressed in terms of the mass-weighted mean diameter, D m , determined as the ratio of the fourth to the third moment of the distribution (see Table in [195] and Chapter 6 of the book Aerosols and Climate by Rasch et al. (2022) [200] for a discussion of moments).
Figure 23 shows the main processes that alter the drop size distribution and the number of droplets [148]:
The processes in the figure are as follows:
  • Coalescence: Decreases the number of small drops, thus reducing the total number of drops in the distribution n ( D ) [201].
  • Break-up: As the number of larger drops decreases, the number of smaller drops increases [202].
  • Combined coalescence and break-up: The increase and decrease in drop size, through coalescence and break-up, respectively, impact the reduction of very small and very large droplets, increasing the number of medium-sized droplets [202].
  • Accretion: Works to increase size, and the drops grow at the same rate [203].
  • Evaporation: Leads to a greater loss of small droplets compared to larger ones. Consequently, the total number of drops should decrease [204].
  • Updrafts: Eliminate smaller drops at lower levels of the cloud. The effect is the same as evaporation [205].
  • Downdraft: A downdraft would increase the downward flow of particles of all diameters, especially the smaller ones. A change in the shape is likely, but the details of these changes are uncertain [206].
  • Size sorting: Tends to make the distribution narrower, significantly increasing the average drop size and decreasing the total drop concentration [207].

Gamma Function

According to Shan et al. (2020) [208], there are two widely used distribution functions for fitting atmospheric particle size distributions: the lognormal and the gamma distribution function (GDF). The former is most commonly used to represent small particles such as aerosols, whereas the latter is used for larger spectra such as hydrometeors, including raindrops, graupel, and hail.
The numerical distribution function n ( D ) for a gamma distribution is generally given by:
n ( D ) = N 0 D μ e λ D
where n ( D ) is the concentration of droplets per cubic centimeter of air; N 0 ( cm 3 μ m 1 ) is the intercept parameter; D is the diameter bin interval; μ is the shape parameter (dimensionless), which determines the slope of the distribution curve; and λ ( μ m 1 ) is the slope parameter, which regulates the decay rate of the curve with increasing size.
According to Khain et al. (2015) [197], atmospheric droplet size distributions exhibit two distinct modes: cloud droplets (radii < 20–25 µm, centered around 10–15 µm) and raindrops (up to 3–4 mm). Due to this scale difference, a single gamma distribution does not adequately represent both modes. Thus, bulk microphysical schemes distinguish between cloud droplets, typically described by gamma distributions, and raindrops, often approximated by exponential functions. The separation between these modes commonly adopts a radius of 30 µm as the threshold. Accordingly, the DSD (droplet size distribution) refers to cloud droplets (Figure 24), while the RSD (rain size distribution) corresponds to raindrops. Despite the practicality of these approximations, uncertainties remain regarding the transition between modes and the most appropriate functional form for each regime.
A study by Cecchini et al. (2017) [210] presented an approach in phase space, focusing on the microphysical properties of tropical clouds in the Amazon region, in the warm phase and in the transition to the mixed-phase layer. This study used the moments of order zero, two, and three to facilitate the analysis of DSD properties in the gamma function (i.e., droplet number concentration, LWC, and effective diameter, respectively). The gamma parameters were calculated as:
μ = 6 G 3 + 1 + 8 G 2 ( 1 G )
λ = ( μ + 3 ) M 2 M 3
N 0 = λ μ + 1 M 0 Γ ( μ + 1 )
where M is the pth moment of the DSD. The symbol G is a nondimensional ratio, given as follows:
G = M 2 3 M 3 2 M 0
Gamma distributions are widely used to represent particle sizes (SDs) in mesoscale and high-resolution models, which estimate one to three moments associated with hydrometeor species. These models use the variable parameters N 0 , λ , and μ , where μ is equal to zero for an exponential distribution, known as the Marshall–Palmer distribution ( μ = 0 ). According to Shan et al. (2020) [208], the values of μ should be limited within a certain range of 0 to 8 to ensure the computational stability of the iterative secant method used to solve μ and other moments. These parameters exhibit mutual dependence and can be directly calculated by the schemes or inferred based on adjustments made from direct SD measurements in clouds [211].
According to Igel et al. (2017) [196], there is still much to learn about what the most appropriate value is for the shape parameter and how it may depend on the microphysical properties of clouds. Furthermore, correctly specifying the values in the shape parameters contributes not only to a more accurate simulation of basic cloud and radiation properties but also to a better understanding of cloud–aerosol interactions.
For example, simpler mass-based schemes consider only one moment of the PSD for each hydrometeor, usually the third moment or the mixing ratio of hydrometeor mass Q, while N 0 and α are kept as specified constants [212]. In a double-moment parameterization scheme, as per Mc farquhar et al. (2015) [211], it is possible to determine two parameters from predicted moments, requiring additional assumptions for the third.
Milbrandt et al. (2016) [213] expanded the two-moment P3 scheme, predicting particle properties in mass to include multiple categories of ice, allowing ice particles with different mass properties to coexist. To improve, other studies showed that three-moment simulations of rain and ice categories indicated more realistic results, for instance, a better gravitational classification of ice, and also helped address the underestimation of radar reflectivity in the scheme.

6.6. Terminal Velocity of Hydrometeors

The balance between the gravitational and drag forces determines the terminal fall velocities. The gravitational force, which is independent of the fall velocity, is proportional to the mass of the drop (cubic in the particle radius). On the other hand, the drag force increases linearly with the drop radius and fall velocity. In other words, smaller drops experience more air resistance and tend to delay precipitation [77].
Considering a spherical particle with radius r and the drag force given by Stokes’ law, the simplified terminal velocity [214] is:
A = 6 π r η v
6 π r η v = m g
6 π r η v = ρ 4 3 π r 3 g
v = 2 ρ r 2 g 9 η
where η is the coefficient of viscosity, the velocity of the particle is v, and the mass m is equal to the product of the density by the volume 4 3 π r 3 ; ρ = ρ p ρ a , taking into account the buoyant force.
Figure 25 shows the variation in terminal velocity for different sizes of hydrometeors and their respective concentrations in a volume of one cubic decimeter. It can be observed that as the droplet radius increases, the terminal velocity also increases, while the particle concentration decreases; this occurs because the atmospheric lifetime of larger particles is shorter.

7. Clouds and Precipitation

7.1. Warm-Phase Clouds

These are clouds with temperatures above the freezing point of water (0 °C) containing only liquid water droplets, with no ice crystals [216]. The transition from pristine to slightly polluted conditions forms clouds with higher water mass values, thus promoting rejuvenation. Cloud growth tends to continue until it reaches an optimal concentration of aerosol particles. Once this threshold is exceeded, further increases in aerosols lead to the suppression of warm clouds, causing more intense evaporation and reducing precipitation formation efficiency [216].
Some studies indicate that increased aerosol concentrations favor the formation of small cloud droplets with a narrow spectrum, indicating little size variation [7]. These two factors inhibit collision and coalescence processes, resulting in a delay in the initiation of warm precipitation [14,148].
Other studies suggest that natural and anthropogenic dust aerosols potentially reduce the cloud optical depth and liquid water path by increasing evaporation and contributing to the so-called semi-direct effect [217].
Notably, the droplet size distribution is the main property of liquid clouds, as it can be used to derive other properties [77]. Furthermore, an increase in the aerosol number distribution in clouds is an important factor for understanding the apparent contradictions resulting from numerical simulations. For this reason, it is important to emphasize that there is no linearly dependent relationship between aerosol quantity and precipitation, as this relationship is controlled by many dynamic, thermodynamic, and microphysical factors [7].

7.2. Cold/Mixed-Phase Clouds

Cold clouds are those that contain only ice crystals, with temperatures below the freezing point of water (0 °C), typically below −20 °C. On the other hand, mixed-phase clouds consist of both ice crystals and supercooled water droplets at temperatures between 0 °C and approximately −38 °C [218].
Several observational studies have shown that aerosols have a rejuvenating effect on clouds, indicating that an increase in aerosols, compared with pristine atmospheric conditions, favors cloud and storm growth [7,218]. It is also related to an increase in the cloud top height and its spatial coverage, as seen in Figure 26 [219].
The increase in cloud anvils is typically associated with increases in smoke and heat from the surface due to biomass burning and the enhancement of cold rain processes. This analysis was conducted by Andreae et al. (2004) [38] in the Amazon Basin, based on in situ observations made during the LBA-SMOCC campaign. The formation of these deep clouds results in greater formation of ice hydrometeors and more vigorous convection, leading to heavy downpours, thunderstorms, and sometimes hail. Furthermore, it was observed that aerosol pollution, biomass burning, and desert dust are also linked to the intensification of convective clouds, especially over the Atlantic Ocean.
According to Lohmann et al. (2016) [218], mixed-phase clouds are more common than previously thought, and they can form when air updraft speeds are high enough to allow for the simultaneous growth of supercooled liquid droplets and ice crystals, i.e., when the saturation exceeds the saturation with respect to liquid water. Thus, there is no direct dependence on IN in the atmosphere for the formation of mixed-phase clouds. It has been commonly observed that this effect is frequent in orographic terrain, especially in the Swiss Alps. The effect of orographic lifting of air slowly to high altitudes, where the temperature is typically below −40 °C, is also linked to the formation of cirrus clouds and cold clouds [7].
In general, the microphysical processes that occur in mixed-phase clouds are considerably more complex because gases and aerosol particles interact with various types of ice hydrometeors [24]. These interactions are thermodynamically unstable because the saturation vapor pressure over ice is lower than that over supercooled liquid water, so that during the freezing of droplets, part of the gas evaporates into the air, while another part is retained in the ice and subsequently removed in precipitation [220].

7.3. Warm and Cold Precipitation

Gupta et al. (2023) [221] reported that both warm and cold processes coexist in any storm, with the balance between them being determined by the temperature at the base of the cloud and the conditions of solute aerosols.
Tao et al. (2012) [7] summarize the main effects of CCN on warm precipitation processes and cold precipitation processes. The increase in aerosols acting as cloud condensation nuclei leads to a reduction in the collision efficiency between particles due to their decreased size. This reduces growth by diffusion and the autoconversion of cloud droplets into raindrops, as well as the efficiency of the riming process. These two factors cause the reduction effects of warm and cold rain, respectively, in the warm rain process.
On the other hand, the increase in aerosols in the atmosphere favors cold rain formation, as shown in the diagram on the right. This happens due to the increased liquid water content in the cloud, which aids the riming process and therefore enhances freezing for the cold precipitation process [7].
Van den Heever et al. (2006) [222] showed that an increase in the IN concentration, associated with the freezing process, produces more rainfall at the surface, whereas increased CCN concentrations, associated with the warm rain process, reduce surface rainfall.
Wang et al. (2024) [223] investigated the effects of dust aerosols on precipitation, demonstrating that these aerosols exert distinct modulations depending on the intensity of rainfall. During the day, they inhibit light precipitation by increasing atmospheric stability, reducing the Convective Available Potential Energy (CAPE) and increasing the Convective Inhibition (CIN), as well as hindering the transformation of cloud droplets into raindrops. At night, however, the presence of dust aerosols makes the atmosphere more unstable, intensifying convection and facilitating the growth of small droplets into larger raindrops through coalescence. In mountainous regions at higher altitudes, smaller droplets ascend and freeze, forming ice particles which, through the Bergeron–Findeisen process, amplify nighttime precipitation.
Henao et al. (2023) [224] showed that anthropogenic aerosols emitted from the urban area of Phoenix can reduce frozen precipitation by about 9% on the windward slopes and increase it by approximately 8% on the leeward side of nearby mountains, a phenomenon known as the “spillover” effect. These aerosols interact with supercooled liquid water, altering the distribution of precipitation in a region with limited water resources. In flat areas, Chen et al. (2021) [225] observed that aerosols suppress convection by blocking solar radiation and reducing surface heating.

8. Aerosol–Cloud Interactions (ACI) in Current and Future Climate Models

Atmospheric aerosols introduce significant uncertainty in climate change due to variability in their sources, composition, and direct and indirect effects [226,227]. This uncertainty is amplified by variations in aerosol load influenced by meteorological patterns and long-range transport [228]. During long-distance transport [229], the physicochemical properties of aerosols change through phase transitions, photochemical reactions, and alterations in mixing state, complicating accurate assessment of their climate impacts [230].
Globally, Rosenfeld et al. (2023) [231] highlighted that the effective radiative forcing due to aerosol–cloud interactions ( ERF a c i ) offsets approximately one quarter of the warming caused by greenhouse gases, although with considerable uncertainty. Estimating ERF a c i requires combining the radiative sensitivity of clouds to aerosol changes with anthropogenic variations in aerosol concentrations. Recent advances emphasize the importance of satellite observations and improved methodologies to quantify aerosols in cloudy atmospheres, which are critical to reducing uncertainties in global climate models.
The estimate of equilibrium climate sensitivity (ECS) remains highly uncertain despite advances in Phase 6 models of the Coupled Model Intercomparison Project (CMIP6) [232]. Although some models indicate a significant increase in ECS, with values exceeding 5 K, much of this rise is attributed to positive feedbacks related to cloud representation [233], particularly a weaker response of extratropical low cloud cover and albedo to unforced surface temperature variations. These results, while not statistically significant, raise concerns about the robustness of cloud microphysics parameterizations and their implications for future climate projections.
Tiwari et al. (2023) [234] reviewed aerosol–cloud interactions over the northern Indian Ocean (NIO). The study emphasizes that ACI is not random but affected by multiple meteorological and dynamic factors, making its impact on the ocean ecosystem and the Indian Summer Monsoon (ISM) an unresolved issue. The authors conclude that uncertainties associated with ACI remain among the largest challenges in regional climate forecasting [227], reinforcing the need for synergistic studies combining observational data and advanced modeling.
At regional scales, the impact of aerosols also manifests through aerosol–radiation interactions (ARI) and ACI, affecting precipitation patterns. For example, Romero et al. (2021) [226] demonstrated that including ARI and ACI in regional climate simulations modifies both the spatial distribution and intensity of precipitation, causing reductions over Central Europe, associated with high fine aerosol levels, and increases over the eastern Mediterranean, linked to natural aerosols. These aerosol effects are sensitive to aerosol composition, rainfall intensity, and local atmospheric dynamics, rendering regional climate responses highly uncertain and model-dependent.
Furthermore, recent work by Su et al. (2024) [227] revealed the critical role of cloud–surface coupling in aerosol–cloud interactions. Their integrated approach, combining field observations, satellite data, and modeling, showed that conventional surface or satellite measurements often underestimate ACI effects by missing aerosols at cloud level. In coupled regimes, aerosols enhance cloud droplet number more uniformly, while in decoupled regimes, aerosols transported from the free troposphere induce stronger cooling effects. Neglecting such coupling introduces significant biases and may lead to underestimation of ACI radiative forcing in traditional assessments.

9. Observational Limitations

According to Cairo et al. (2024) [235], passive sensors offer broad spatial coverage and long temporal records, making them valuable for global monitoring, but they have limitations such as low vertical resolution, dependence on sunlight, and uncertainties in retrieval algorithms. Active sensors like radar and lidar provide detailed vertical profiles and operate continuously, allowing for high-resolution distinction of atmospheric layers, although they have more limited spatial coverage and higher costs. Radars are effective in detecting precipitation and internal structures of dense clouds but are less sensitive to fine particles. On the other hand, lidars detect aerosols and droplets with high precision, making them ideal for microphysical studies despite their limited range and reduced penetration through thick clouds. Additionally, quantifying multiple scattering in liquid clouds remains a challenge for lidar techniques, as it significantly affects extinction and depolarization measurements and depends on the receiver’s field of view [236,237].
Lv et al. 2017 [238] used lidar and radiosonde profiles to derive the hygroscopic backscatter enhancement factor f ( RH ( z ) ) and infer aerosol hygroscopicity at different altitudes and wavelengths. The results, validated using a humidified nephelometer, showed good agreement in the range 85 % < RH < 95 % . Lidars proved effective, especially under high relative humidity and near cloud bases, where nephelometers tend to fail. Although f ( RH ) and the hygroscopic growth factor measured by HTDMA represent distinct aspects, both characterize aerosol–water vapor interactions.
Limitations associated with particle sampling and measurement during cloud formation events still introduce significant uncertainties in the characterization of chemical composition and size distribution, as discussed by Shen et al. (2025) [239].
Jiang et al. (2025) [240] emphasize that accurately predicting aerosol mixing states in real-world environments is hindered by several limitations. First, observational data suffer from spatiotemporal gaps and rely on costly in situ measurements that demand complex infrastructure. Furthermore, the practical application of particle, resolved models, despite their ability to simulate individual transformations in composition and size, is constrained by the limited availability of sufficiently detailed input data, such as realistic emission inventories. The authors propose an alternative machine learning approach involving the pre-training of models on particle-resolved simulations, followed by fine-tuning using limited observational data. This strategy proved robust and stable across various datasets, offering a promising solution to the challenges posed by the scarcity of high-resolution observational inputs.

10. Conclusions

Continuous research is being conducted to investigate the complex interactions among aerosols, clouds, precipitation, and radiation. Understanding these processes plays a crucial role in improving climate models and weather forecasting. These particles, combined with physical processes in the atmosphere, are key components in controlling cloud formation, its phases, and precipitation systems, as they serve as nucleators of liquid droplets and ice in clouds. Understanding the dynamics and physical aspects of these particles, such as their numerical concentration and chemical properties, among others, is essential for improving microphysics parameterizations in numerical modeling. Thus, changes in aerosols, whether due to human activities or their natural variability, affect the climate by altering energy flows within the atmosphere and between the surface.

Author Contributions

Conceptualization, K.M.R.d.S. and S.N.F.; formal analysis, D.L.H., P.Y.K., S.N.F. and C.B.; investigation, K.M.R.d.S.; resources, K.M.R.d.S.; writing—original draft preparation, K.M.R.d.S.; writing—review and editing, S.N.F., P.Y.K., D.L.H. and C.B.; visualization, S.N.F., P.Y.K. and D.L.H.; supervision, S.N.F., P.Y.K. and D.L.H.; project administration, K.M.R.d.S. and D.L.H. All authors have read and agreed to the published version of the manuscript.

Funding

This research received no external funding.

Data Availability Statement

No new data were created or analyzed in this study.

Acknowledgments

Special thanks to Eder Vendrasco and Simone Sievert from the Graduate Program in Meteorology (PGMET/INPE) for their support and initial contributions to this work.

Conflicts of Interest

The authors declare no conflicts of interest.

References

  1. Khatri, P.; Hayasaka, T.; Holben, B.N.; Singh, R.P.; Letu, H.; Tripathi, S.N. Increased aerosols can reverse Twomey effect in water clouds through radiative pathway. Sci. Rep. 2022, 12, 20666. [Google Scholar] [CrossRef] [PubMed]
  2. Carslaw, K.S.; Lee, L.A.; Reddington, C.L.; Pringle, K.J.; Pierce, J.R.; Gordon, H.; Mann, G.W.; Spracklen, D.V. The global impact of aerosols on cloud condensation nuclei and the role of new particle formation. Nature 2022, 610, 557–562. [Google Scholar]
  3. McCoy, D.T.; Burrows, S.M.; Wood, R.; Grosvenor, D.P.; Elliott, S.M.; Ma, P.L.; Rasch, P.J.; Hartmann, D.L. Natural aerosols explain seasonal and spatial patterns of Southern Ocean cloud albedo. Sci. Adv. 2015, 1, e1500157. [Google Scholar] [CrossRef]
  4. Rosenfeld, D.; Lohmann, U.; Raga, G.B.; O’Dowd, C.D.; Kulmala, M.; Fuzzi, S.; Reissell, A.; Andreae, M.O. Flood or drought: How do aerosols affect precipitation? Science 2008, 321, 1309–1313. [Google Scholar] [CrossRef]
  5. Williams, E.; Rosenfeld, D.; Madden, N.; Gerlach, J.; Gears, N.; Atkinson, L.; Dunnemann, N.; Frostrom, G.; Antonio, M.; Biazon, B.; et al. Contrasting convective regimes over the Amazon: Implications for cloud electrification. J. Geophys. Res. Atmos. 2002, 107, LBA 50-1–LBA 50-19. [Google Scholar] [CrossRef]
  6. Fan, J.; Leung, L.R.; Rosenfeld, D.; Chen, Q.; Li, Z.; Zhang, J.; Yan, H. Microphysical effects determine macrophysical response for aerosol impacts on deep convective clouds. Proc. Natl. Acad. Sci. USA 2013, 110, E4581–E4590. [Google Scholar] [CrossRef]
  7. Tao, W.K.; Chen, J.P.; Li, Z.; Wang, C.; Zhang, C. Impact of aerosols on convective clouds and precipitation. Rev. Geophys. 2012, 50, RG2001. [Google Scholar] [CrossRef]
  8. Nakajima, T.; Higurashi, A.; Kawamoto, K.; Penner, J.E. A possible correlation between satellite-derived cloud and aerosol microphysical parameters. Geophys. Res. Lett. 2001, 28, 1171–1174. [Google Scholar] [CrossRef]
  9. Fan, J.; Wang, Y.; Rosenfeld, D.; Liu, X. Review of aerosol–cloud interactions: Mechanisms, significance, and challenges. J. Atmos. Sci. 2016, 73, 4221–4252. [Google Scholar] [CrossRef]
  10. Albrecht, B.A. Aerosols, cloud microphysics, and fractional cloudiness. Science 1989, 245, 1227–1230. [Google Scholar] [CrossRef] [PubMed]
  11. Lohmann, U.; Diehl, K. Sensitivity studies of the importance of dust ice nuclei for the indirect aerosol effect on stratiform mixed-phase clouds. J. Atmos. Sci. 2006, 63, 968–982. [Google Scholar] [CrossRef]
  12. Stohl, A.; Forster, C.; Huntrieser, H.; Mannstein, H.; McMillan, W.; Petzold, A.; Schlager, H.; Weinzierl, B. Aircraft measurements over Europe of an air pollution plume from Southeast Asia–aerosol and chemical characterization. Atmos. Chem. Phys. 2007, 7, 913–937. [Google Scholar] [CrossRef]
  13. Khain, A.; Pokrovsky, A.; Sednev, I. Some effects of cloud–aerosol interaction on cloud microphysics structure and precipitation formation: Numerical experiments with a spectral microphysics cloud ensemble model. Atmos. Res. 1999, 52, 195–220. [Google Scholar] [CrossRef]
  14. Liu, S.; Chen, M.; Zhuang, Q. Aerosol effects on global land surface energy fluxes during 2003–2010. Geophys. Res. Lett. 2014, 41, 7875–7881. [Google Scholar] [CrossRef]
  15. Yeom, J.M.; Fahandezh Sadi, H.; Anderson, J.C.; Yang, F.; Cantrell, W.; Shaw, R.A. Cloud microphysical response to entrainment of dry air containing aerosols. Npj Clim. Atmos. Sci. 2025, 8, 8. [Google Scholar] [CrossRef]
  16. Wang, Z.; Zhang, H.; Lu, P. Improvement of cloud microphysics in the aerosol-climate model BCC_AGCM2. 0.1 _CUACE/Aero, evaluation against observations, and updated aerosol indirect effect. J. Geophys. Res. Atmos. 2014, 119, 8400–8417. [Google Scholar] [CrossRef]
  17. La, I.; Yum, S.S. Relationship between vertical variation of cloud microphysical properties and thickness of the entrainment interfacial layer in Physics of Stratocumulus Top stratocumulus clouds. Q. J. R. Meteorol. Soc. 2024, 150, 5037–5056. [Google Scholar] [CrossRef]
  18. Lee, S.; Donner, L.; Penner, J. Thunderstorm and stratocumulus: How does their contrasting morphology affect their interactions with aerosols? Atmos. Chem. Phys. 2010, 10, 6819–6837. [Google Scholar] [CrossRef]
  19. Storer, R.L.; Van Den Heever, S.C.; Stephens, G.L. Modeling aerosol impacts on convective storms in different environments. J. Atmos. Sci. 2010, 67, 3904–3915. [Google Scholar] [CrossRef]
  20. Carslaw, K.; Boucher, O.; Spracklen, D.; Mann, G.; Rae, J.; Woodward, S.; Kulmala, M. A review of natural aerosol interactions and feedbacks within the Earth system. Atmos. Chem. Phys. 2010, 10, 1701–1737. [Google Scholar] [CrossRef]
  21. Artaxo, P.; Rizzo, L.V.; Paixão, M.; De Lucca, S.; Oliveira, P.H.; Lara, L.L.; Wiedemann, K.T.; Andreae, M.O.; Holben, B.; Schafer, J.; et al. Aerosol particles in Amazonia: Their composition, role in the radiation balance, cloud formation, and nutrient cycles. Amazon. Glob. Chang. 2009, 186, 233–250. [Google Scholar] [CrossRef]
  22. Koren, I.; Feingold, G.; Jiang, H.; Altaratz, O. Aerosol effects on the inter-cloud region of a small cumulus cloud field. Geophys. Res. Lett. 2009, 36, L14805. [Google Scholar] [CrossRef]
  23. Twomey, S. The influence of pollution on the shortwave albedo of clouds. J. Atmos. Sci. 1977, 34, 1149–1152. [Google Scholar] [CrossRef]
  24. Carslaw, K.S.; Pringle, K. Global aerosol properties. In Aerosols and Climate; Elsevier: Amsterdam, The Netherlands, 2022; pp. 101–133. [Google Scholar] [CrossRef]
  25. Kalkavouras, P.; Bougiatioti, A.; Grivas, G.; Stavroulas, I.; Pilinis, C.; Pandis, S.N.; Nenes, A.; Mihalopoulos, N. Regional new particle formation as modulators of cloud condensation nuclei and cloud droplet number in the eastern Mediterranean. Atmos. Chem. Phys. 2019, 19, 6185–6203. [Google Scholar] [CrossRef]
  26. Mahowald, N.; Carslaw, K.S. Aerosol in the Earth System. In Aerosols and Climate; Carslaw, K.S., Ed.; Elsevier: Amsterdam, The Netherlands, 2022; Chapter 3; pp. 53–99. [Google Scholar] [CrossRef]
  27. Ramanathan, V.; Crutzen, P.J.; Kiehl, J.T.; Rosenfeld, D. Aerosols, climate, and the hydrological cycle. Science 2001, 294, 2119–2124. [Google Scholar] [CrossRef]
  28. Creamean, J.M.; Suski, K.J.; Rosenfeld, D.; Cazorla, A.; DeMott, P.J.; Sullivan, R.C.; White, A.B.; Ralph, F.M.; Minnis, P.; Comstock, J.M.; et al. Dust and biological aerosols from the Sahara and Asia influence precipitation in the western US. Science 2013, 339, 1572–1578. [Google Scholar] [CrossRef]
  29. Schrod, J.; Thomson, E.S.; Weber, D.; Kossmann, J.; Pöhlker, C.; Saturno, J.; Weller, R.; Ullrich, R.; Schneider, J.; Tatzelt, C.; et al. Long-term deposition and condensation ice-nucleating particle measurements from four stations across the globe. Atmos. Chem. Phys. 2020, 20, 15983–16006. [Google Scholar] [CrossRef]
  30. Schulz, M.; McConnell, J.R. Historical changes in aerosol. In Aerosols and Climate; Elsevier: Amsterdam, The Netherlands, 2022; pp. 249–297. [Google Scholar]
  31. Murray, B.J.; Liu, X. Ice-nucleating particles and their effects on clouds and radiation. In Aerosols and Climate; Elsevier: Amsterdam, The Netherlands, 2022; pp. 619–649. [Google Scholar] [CrossRef]
  32. Mahowald, N.; Albani, S.; Kok, J.F.; Engelstaeder, S.; Scanza, R.; Ward, D.S.; Flanner, M.G. The size distribution of desert dust aerosols and its impact on the Earth system. Aeolian Res. 2014, 15, 53–71. [Google Scholar] [CrossRef]
  33. Alves, C. Aerossóis atmosféricos: Perspectiva histórica, fontes, processos químicos de formação e composição orgânica. Química Nova 2005, 28, 859–870. [Google Scholar] [CrossRef]
  34. Holanda, B.A. Absorção da Radiação por Aerossóis na Amazônia. Master’s Thesis, Instituto de Física, Departamento de Física Aplicada, Universidade de São Paulo, São Paulo, Brazil, 2015. [Google Scholar]
  35. Zender, C.S.; Bian, H.; Newman, D. Mineral Dust Entrainment and Deposition (DEAD) model: Description and 1990s dust climatology. J. Geophys. Res. Atmos. 2003, 108, 4416. [Google Scholar] [CrossRef]
  36. Sullivan, R.C. Heterogeneous Chemistry of Atmospheric Mineral Dust Particles and Their Resulting Cloud-Nucleation Properties. Ph.D. Thesis, University of California, San Diego, San Diego, CA, USA, 2008. [Google Scholar]
  37. Andreae, M.; Rosenfeld, D. Aerosol–cloud–precipitation interactions. Part 1. The nature and sources of cloud-active aerosols. Earth-Sci. Rev. 2008, 89, 13–41. [Google Scholar] [CrossRef]
  38. Andreae, M.O.; Rosenfeld, D.; Artaxo, P.; Costa, A.A.; Frank, G.P.; Longo, K.M.; Silva-Dias, M.A.F. Smoking rain clouds over the Amazon. Science 2004, 303, 1337–1342. [Google Scholar] [CrossRef]
  39. Cavalli, F.; Facchini, M.C.; Decesari, S.; Mircea, M.; Emblico, L.; Fuzzi, S.; Ceburnis, D.; Yoon, Y.J.; Putaud, P. Advances in characterization of size-resolved organic matter in marine aerosol over the North Atlantic. J. Geophys. Res. Atmos. 2004, 109, D24. [Google Scholar] [CrossRef]
  40. Hill, T.C.J.; Wilson, T.W.; Hill, S.; Rangno, A.L.; Leck, C.; Bigg, E.K.; Svensson, A.; Rogers, D.C.; Orellana, M.V.; Murray, B.J. Measurement of Ice Nucleation-Active Bacteria on Plants and in Precipitation by Quantitative PCR. Appl. Environ. Microbiol. 2014, 80, 1256–1267. [Google Scholar] [CrossRef]
  41. Maki, L.R.; Galyan, E.L.; Chang-Chien, M.M.; Caldwell, D.R. Ice Nucleation Induced by Pseudomonas syringae. Appl. Microbiol. 1974, 28, 456–459. [Google Scholar] [CrossRef]
  42. Hansson, H.C.; Bhend, J. Causes of Regional Change—Aerosols. In Second Assessment of Climate Change for the Baltic Sea Basin; Springer International Publishing: Cham, Switzerland, 2015; pp. 441–452. [Google Scholar]
  43. Dentener, F.; Kinne, S.; Bond, T.; Boucher, O.; Cofala, J.; Generoso, S.; Ginoux, P.; Gong, S.; Hoelzemann, J.J.; Ito, A.; et al. Emissions of primary aerosol and precursor gases in the years 2000 and 1750 prescribed data-sets for AeroCom. Atmos. Chem. Phys. 2006, 6, 4321–4344. [Google Scholar] [CrossRef]
  44. Orel, A.E.; Seinfeld, J.H. Nitrate formation in atmospheric aerosols. Environ. Sci. Technol. 1977, 11, 1000–1007. [Google Scholar] [CrossRef]
  45. Ayres, B.R.; Allen, H.M.; Draper, D.C.; Brown, S.S.; Wild, R.J.; Jimenez, J.L.; Fry, J.L. Organic nitrate aerosol formation via NO3 + biogenic volatile organic compounds in the southeastern United States. Atmos. Chem. Phys. 2015, 15, 13377–13392. [Google Scholar] [CrossRef]
  46. Seinfeld, J.H.; Pankow, J.F. Organic atmospheric particulate material. Annu. Rev. Phys. Chem. 2003, 54, 121–140. [Google Scholar] [CrossRef] [PubMed]
  47. Metzger, A.; Verheggen, B.; Dommen, J.; Duplissy, J.; Prevot, A.S.; Weingartner, E.; Baltensperger, U. Evidence for the role of organics in aerosol particle formation under atmospheric conditions. Proc. Natl. Acad. Sci. USA 2010, 107, 6646–6651. [Google Scholar] [CrossRef] [PubMed]
  48. Fuzzi, S.; Andreae, M.O.; Huebert, B.J.; Kulmala, M.; Bond, T.C.; Boy, M.; Doherty, S.J.; Guenther, A.; Kanakidou, M.; Kawamura, K.; et al. Critical assessment of the current state of scientific knowledge, terminology, and research needs concerning the role of organic aerosols in the atmosphere, climate, and global change. Atmos. Chem. Phys. 2006, 6, 2017–2038. [Google Scholar] [CrossRef]
  49. Shrivastava, M.; Cappa, C.D.; Fan, J.; Goldstein, A.H.; Guenther, A.B.; Jimenez, J.L.; Kuang, C.; Laskin, A.; Martin, S.T.; Ng, N.L.; et al. Recent advances in understanding secondary organic aerosol: Implications for global climate forcing. Rev. Geophys. 2017, 55, 509–559. [Google Scholar] [CrossRef]
  50. Kanakidou, M.; Seinfeld, J.H.; Pandis, S.N.; Barnes, I.; Dentener, F.J.; Facchini, M.C.; Dingenen, R.V.; Ervens, B.; Nenes, A.; Nielsen, C.J.; et al. Organic aerosol and global climate modelling: A review. Atmos. Chem. Phys. 2005, 5, 1053–1123. [Google Scholar] [CrossRef]
  51. Vehkamäki, H.; Riipinen, I. Thermodynamics and kinetics of atmospheric aerosol particle formation and growth. Chem. Soc. Rev. 2012, 41, 5160–5173. [Google Scholar] [CrossRef]
  52. Zhao, B.; Donahue, N.M.; Zhang, K.; Mao, L.; Shrivastava, M.; Ma, P.L.; Shen, J.; Wang, S.; Sun, J.; Gordon, H.; et al. Global variability in atmospheric new particle formation mechanisms. Nature 2024, 631, 98–105. [Google Scholar] [CrossRef]
  53. Artaxo, P.; Hansson, H.C.; Andreae, M.O.; Bäck, J.; Alves, E.G.; Barbosa, H.M.J.; Bender, F.; Bourtsoukidis, E.; Carbone, S.; Chi, J. Tropical and Boreal Forest–Atmosphere Interactions: A review. Tellus B Chem. Phys. Meteorol. 2022, 74, 24. [Google Scholar] [CrossRef]
  54. Matsui, H.; Koike, M.; Takegawa, N.; Kondo, Y. Spatial and temporal variations of new particle formation in East Asia using an NPF-explicit WRF-chem model: North-south contrast in new particle formation frequency. J. Geophys. Res. Atmos. 2013, 118, 11649–11663. [Google Scholar] [CrossRef]
  55. Yu, F.; Luo, G.; Nair, A.A.; Schwab, J.J.; Sherman, J.P.; Zhang, Y. Wintertime new particle formation and its contribution to cloud condensation nuclei in the Northeastern United States. Atmos. Chem. Phys. 2020, 20, 2591–2601. [Google Scholar] [CrossRef]
  56. Zhao, B.; Shrivastava, M.; Donahue, N.M.; Gordon, H.; Schervish, M.; Shilling, J.E.; Zaveri, R.A.; Wang, J.; Andreae, M.O.; Zhao, C. High concentration of ultrafine particles in the Amazon free troposphere produced by organic new particle formation. Proc. Natl. Acad. Sci. USA 2020, 117, 25344–25351. [Google Scholar] [CrossRef]
  57. Dada, L.; Stolzenburg, D.; Simon, M.; Fischer, L.; Heinritzi, M.; Wang, M.; Xiao, M.; Vogel, A.L.; Ahonen, L.; Amorim, A.; et al. Role of sesquiterpenes in biogenic new particle formation. Sci. Adv. 2023, 9, eadi5297. [Google Scholar] [CrossRef] [PubMed]
  58. Scott, C.E.; Spracklen, D.V.; Pierce, J.R.; Riipinen, I.; D’Andrea, S.D.; Rap, A.; Carslaw, K.S.; Forster, P.M.; Artaxo, P.; Kulmala, M.; et al. Impact of gas-to-particle partitioning approaches on the simulated radiative effects of biogenic secondary organic aerosol. Atmos. Chem. Phys. 2015, 15, 12989–13001. [Google Scholar] [CrossRef]
  59. Schulz, C.; Schneider, J.; Holanda, B.A.; Appel, O.; Costa, A.; Sá, S.S.d.; Dreiling, V.; Fütterer, D.; Jurkat-Witschas, T.; Klimach, T. Aircraft-based observations of isoprene-epoxydiol-derived secondary organic aerosol (IEPOX-SOA) in the tropical upper troposphere over the Amazon region. Atmos. Chem. Phys. 2018, 18, 14979–15001. [Google Scholar] [CrossRef]
  60. Bardakov, R.; Thornton, J.A.; Riipinen, I.; Krejci, R.; Ekman, A.M.L. Transport and chemistry of isoprene and its oxidation products in deep convective clouds. Tellus B Chem. Phys. Meteorol. 2021, 73, 1–21. [Google Scholar] [CrossRef]
  61. Zhang, C.; Hai, S.; Gao, Y.; Wang, Y.; Zhang, S.; Sheng, L.; Zhao, B.; Wang, S.; Jiang, J.; Huang, X.; et al. Substantially positive contributions of new particle formation to cloud condensation nuclei under low supersaturation in China based on numerical model improvements. Atmos. Chem. Phys. 2023, 23, 10713–10730. [Google Scholar] [CrossRef]
  62. Pöhlker, C.; Wiedemann, K.T.; Sinha, B.; Shiraiwa, M.; Gunthe, S.S.; Smith, M.; Su, H.; Artaxo, P.; Chen, Q.; Cheng, Y.; et al. Biogenic potassium salt particles as seeds for secondary organic aerosol in the Amazon. Science 2012, 337, 1075–1078. [Google Scholar] [CrossRef]
  63. Palmer, P.I.; Marvin, M.R.; Siddans, R.; Kerridge, B.J.; Moore, D.P. Nocturnal survival of isoprene linked to formation of upper tropospheric organic aerosol. Science 2022, 375, 562–566. [Google Scholar] [CrossRef]
  64. Franco, M.A. Transporte Vertical, Processos de Crescimento e Caracterização de Aerossóis na Amazônia. Ph.D. Thesis, Universidade de São Paulo, Sao Paulo, Brazil, 2021. Available online: https://web.archive.org/web/20211102183215id_/https://teses.usp.br/teses/disponiveis/43/43134/tde-07102021-174257/publico/MarcoAureliodeMenezesFranco_DO_Thesis_Final.pdf (accessed on 22 July 2025).
  65. Liu, Y.; Su, H.; Wang, S.; Wei, C.; Tao, W.; Pöhlker, M.L.; Pöhlker, C.; Holanda, B.A.; Krüger, O.O.; Hoffmann, T. Strong particle production and condensational growth in the upper troposphere sustained by biogenic VOCs from the canopy of the Amazon Basin. Atmos. Chem. Phys. 2023, 23, 251–272. [Google Scholar] [CrossRef]
  66. Shrivastava, M.; Fan, J.; Zhang, Y.; Rasool, Q.Z.; Zhao, B.; Shen, J.; Pierce, J.R.; Jathar, S.H.; Akherati, A.; Zhang, J.; et al. Intense formation of secondary ultrafine particles from Amazonian vegetation fires and their invigoration of deep clouds and precipitation. One Earth 2024, 7, 1029–1043. [Google Scholar] [CrossRef]
  67. Andreae, M.O.; Afchine, A.; Albrecht, R.; Holanda, B.A.; Artaxo, P.; Barbosa, H.M.J.; Borrmann, S.; Cecchini, M.A.; Costa, A.; Dollner, M. Aerosol characteristics and particle production in the upper troposphere over the Amazon Basin. Atmos. Chem. Phys. 2018, 18, 921–961. [Google Scholar] [CrossRef]
  68. Trabert, W. Die Extinktion des Lichtes in einem trüben Medium (Sehweite in Wolken). Meteor. Z 1901, 18, 518–520. [Google Scholar]
  69. Aufm Kampe, H.; Weickmann, H. Trabert’s formula and the determination of the water content in clouds. J. Atmos. Sci. 1952, 9, 167–171. [Google Scholar] [CrossRef]
  70. Kim, B.G.; Schwartz, S.E.; Miller, M.A.; Min, Q. Effective radius of cloud droplets by ground-based remote sensing: Relationship to aerosol. J. Geophys. Res. Atmos. 2003, 108, 4740. [Google Scholar] [CrossRef]
  71. Liu, Y.; Zhang, Y.; Zhou, W.; Ma, X.; Li, S.; Wang, X. Cloud ability to produce precipitation over arid and semiarid regions of Central and East Asia. Int. J. Climatol. 2020, 40, 1824–1837. [Google Scholar] [CrossRef]
  72. Khain, A.; Ovtchinnikov, M.; Pinsky, M.; Pokrovsky, A.; Krugliak, H. Notes on the state-of-the-art numerical modeling of cloud microphysics. Atmos. Res. 2000, 55, 159–224. [Google Scholar] [CrossRef]
  73. Ambaum, M.H. Thermal Physics of the Atmosphere; Elsevier: Amsterdam, The Netherlands, 2021; Volume 1. [Google Scholar]
  74. Benoit, J.B.; McCluney, K.E.; DeGennaro, M.J.; Dow, J.A. Dehydration dynamics in terrestrial arthropods: From water sensing to trophic interactions. Annu. Rev. Entomol. 2023, 68, 129–149. [Google Scholar] [CrossRef]
  75. Saha, K. Water Vapour in the Atmosphere: Thermodynamics of Moist Air. In The Earth’s Atmosphere; Springer: Berlin/Heidelberg, Germany, 2008; pp. 43–58. [Google Scholar]
  76. Braga, R.C. Influências das Concentrações de Aerossóis na Microfísica de Nuvens Convectivas Formadas Sobre a Amazônia. Ph.D. Thesis, Graduate Program in Meteorology, National Institute for Space Research (INPE), São José dos Campos, SP, Brazil, 2017. Available online: http://urlib.net/8JMKD3MGP3W34P/3PELPDE (accessed on 22 July 2025).
  77. Quaas, J.; Gryspeerdt, E. Aerosol-cloud interactions in liquid clouds. In Aerosols and Climate; Elsevier: Amsterdam, The Netherlands, 2022; pp. 489–544. [Google Scholar] [CrossRef]
  78. World Meteorological Organization. Guide to Meteorological Instruments and Methods of Observation; WMO-No. 8; World Meteorological Organization: Geneva, Switzerland, 2008; Appendix 4B (CIMO Guide).
  79. Goff, J.A. Saturation Pressure of Water on the New Kelvin Temperature Scale. In Transactions of the American Society of Heating and Ventilating Engineers: Proceedings of the Semi-Annual Meeting of the American Society of Heating and Ventilating Engineers, Murray Bay, QC, Canada, 24–26 June 1957; American Society of Heating and Ventilating Engineers (ASHVE): New York, NY, USA, 1957; pp. 347–354. [Google Scholar]
  80. Davies, J.F.; Wilson, K.R. Heterogeneous reactions in aerosol. In Physical Chemistry of Gas-Liquid Interfaces; Elsevier: Amsterdam, The Netherlands, 2018; pp. 403–433. [Google Scholar] [CrossRef]
  81. Spichtinger, P.; Leschner, M. Horizontal scales of ice-supersaturated regions. Tellus B Chem. Phys. Meteorol. 2016, 68, 1. [Google Scholar] [CrossRef]
  82. Wex, H.; Stratmann, F.; Topping, D.; McFiggans, G. The Kelvin versus the Raoult term in the Köhler equation. J. Atmos. Sci. 2008, 65, 4004–4016. [Google Scholar] [CrossRef]
  83. Wex, H.; Stratmann, F.; Hennig, T.; Hartmann, S.; Niedermeier, D.; Nilsson, E.; Ocskay, R.; Rose, D.; Salma, I.; Ziese, M. Connecting hygroscopic growth at high humidities to cloud activation for different particletypes. Environ. Res. Lett. 2008, 3, 035004. [Google Scholar] [CrossRef]
  84. Grabowski, W.W.; Wang, L.P. Growth of Cloud Droplets in a Turbulent Environment. Annu. Rev. Fluid Mech. 2009, 41, 231–254. [Google Scholar] [CrossRef]
  85. Lewis, E.R. The effect of surface tension (Kelvin effect) on the equilibrium radius of a hygroscopic aqueous aerosol particle. J. Aerosol Sci. 2006, 37, 1605–1617. [Google Scholar] [CrossRef]
  86. Heidenreich, S.; Büttner, H. Investigations about the influence of the Kelvin effect on droplet growth rates. J. Aerosol Sci. 1995, 26, 335–339. [Google Scholar] [CrossRef]
  87. Kim, S.; Kim, D.; Kim, J.; An, S.; Jhe, W. Direct evidence for curvature-dependent surface tension in capillary condensation: Kelvin equation at molecular scale. Phys. Rev. X 2018, 8, 041046. [Google Scholar] [CrossRef]
  88. Durigon, A.; Rodriguez, C.A.M.; Biscaro, T.S.; Massambani, O. Impacto da distribuição de tamanho de hidrometeoros no cálculo das temperaturas de brilho na região de microondas. In Anais. A Meteorologia a Serviço da Sociedade; Sociedade Brasileira de Meteorologia: Florianópolis, Brazil, 2006; Available online: https://repositorio.usp.br/item/001590153 (accessed on 22 July 2025).
  89. Pruppacher, H.R.; Klett, J.D.; Wang, P.K. Microphysics of clouds and precipitation. Aerosol Sci. Technol. 1998, 28, 381–382. [Google Scholar] [CrossRef]
  90. Yau, M.K.; Rogers, R.R. A Short Course in Cloud Physics, 3rd ed.; Butterworth-Heinemann (Elsevier Science): Oxford, UK, 1996; pp. 60–96. [Google Scholar]
  91. Krueger, S.K. Equilibrium droplet size distributions in a turbulent cloud chamber with uniform supersaturation. Atmos. Chem. Phys. 2020, 20, 7895–7909. [Google Scholar] [CrossRef]
  92. Jing, B.; Wang, Z.; Qi, L.; Zhang, Y.; Sun, Y.; Wang, X.; He, H. Hygroscopic behavior of atmospheric aerosols containing nitrate salts and water-soluble organic acids. Atmos. Chem. Phys. 2018, 18, 5115–5127. [Google Scholar] [CrossRef]
  93. Kuang, Y.; He, Y.; Xu, W.; Zhao, P.; Cheng, Y.; Zhao, G.; Tao, J.; Ma, N.; Su, H.; Zhang, Y.; et al. Distinct diurnal variation in organic aerosol hygroscopicity and its relationship with oxygenated organic aerosol. Atmos. Chem. Phys. 2020, 20, 865–880. [Google Scholar] [CrossRef]
  94. Kang, H.; Jung, C.H.; Lee, B.Y.; Krejci, R.; Heslin-Rees, D.; Aas, W.; Yoon, J.J. Aerosol hygroscopicity influenced by seasonal chemical composition variations in the Arctic region. J. Aerosol Sci. 2025, 186, 106551. [Google Scholar] [CrossRef]
  95. Petters, M.D.; Kreidenweis, S.M. A single parameter representation of hygroscopic growth and cloud condensation nucleus activity. Atmos. Chem. Phys. 2007, 7, 1961–1971. [Google Scholar] [CrossRef]
  96. Petters, M.D.; Kreidenweis, S.M. A single parameter representation of hygroscopic growth and cloud condensation nucleus activity—Part 3: Including surfactant partitioning. Atmos. Chem. Phys. 2013, 13, 1081–1091. [Google Scholar] [CrossRef]
  97. Pöhlker, M.L.; Shiraiwa, M.; Yli-Juuti, T.; Cheng, Y.; Petters, M.D.; Rastak, N.; Gunthe, S.S.; Carbone, S.; Zaveri, R.A.; Andreae, M.O.; et al. Global organic and inorganic aerosol hygroscopicity and its effect on radiative forcing. Nat. Commun. 2023, 14, 6139. [Google Scholar] [CrossRef] [PubMed]
  98. Yin, H.; Dou, J.; Klein, L.; Krieger, U.K.; Bain, A.; Wallace, B.J.; Preston, T.C.; Zuend, A. Extension of the AIOMFAC model by iodine and carbonate species: Applications for aerosol acidity and cloud droplet activation. Atmos. Chem. Phys. 2022, 22, 973–1013. [Google Scholar] [CrossRef]
  99. Raatikainen, T.; Laaksonen, A. Application of several activity coefficient models to water-organic-electrolyte aerosols of atmospheric interest. Atmos. Chem. Phys. 2005, 5, 2475–2495. [Google Scholar] [CrossRef]
  100. Hemming, B.L.; Seinfeld, J.H. On the Hygroscopic Behavior of Atmospheric Organic Aerosols. Ind. Eng. Chem. Res. 2001, 40, 4162–4171. [Google Scholar] [CrossRef]
  101. Zuend, A.; Marcolli, C.; Peter, T.; Krieger, U.K. New and extended parameterization of the thermodynamic model AIOMFAC: Calculation of activity coefficients for organic–inorganic mixtures containing carboxyl, hydroxyl, carbonyl, ether, ester, alkenyl, alkyl, and aromatic functional groups. Atmos. Chem. Phys. 2011, 11, 9155–9206. [Google Scholar] [CrossRef]
  102. Clegg, S.L.; Qiu, C.; Zhang, R. The deliquescence behaviour, solubilities, and densities of aqueous solutions of five methyl- and ethyl-aminium sulphate salts. Atmos. Environ. 2013, 73, 145–158. [Google Scholar] [CrossRef]
  103. Kärcher, B.; DeMott, P.J.; Jensen, E.J.; Harrington, J.Y. Studies on the Competition Between Homogeneous and Heterogeneous Ice Nucleation in Cirrus Formation. J. Geophys. Res. Atmos. 2022, 127, e2021JD035805. [Google Scholar] [CrossRef]
  104. Ren, C.; Mackenzie, A.R. Cirrus parametrization and the role of ice nuclei. Q. J. R. Meteorol. Soc. 2005, 131, 1585–1605. [Google Scholar] [CrossRef]
  105. Morrison, H.; van Lier-Walqui, M.; Fridlind, A.M.; Grabowski, W.W.; Harrington, J.Y.; Hoose, C.; Korolev, A.; Kumjian, M.R.; Milbrandt, J.A.; Pawlowska, H.; et al. Confronting the challenge of modeling cloud and precipitation microphysics. J. Adv. Model. Earth Syst. 2020, 12, e2019MS001689. [Google Scholar] [CrossRef]
  106. Burrows, S.M.; McCluskey, C.S.; Cornwell, G.; Steinke, I.; Zhang, K.; Zhao, B.; Zawadowicz, M.; Raman, A.; Kulkarni, G.; China, S.; et al. Ice-nucleating particles that impact clouds and climate: Observational and modeling research needs. Rev. Geophys. 2022, 60, e2021RG000745. [Google Scholar] [CrossRef]
  107. Krämer, M.; Rolf, C.; Spelten, N.; Afchine, A.; Fahey, D.; Jensen, E.; Khaykin, S.; Kuhn, T.; Lawson, P.; Lykov, A.; et al. A microphysics guide to cirrus–Part 2: Climatologies of clouds and humidity from observations. Atmos. Chem. Phys. 2020, 20, 12569–12608. [Google Scholar] [CrossRef]
  108. DeMott, P.J.; Kreidenweis, S.M.; Rogers, D.C. The susceptibility of ice formation in upper tropospheric clouds to insoluble aerosol components. J. Geophys. Res. 1997, 102, 19575–19584. [Google Scholar] [CrossRef]
  109. Martinsson, B. Aerosol, Water and Clouds. Extract from a Textbook on Airborne Particles by the Consortium of Aerosol Science and Technology (CAST), Lund University, 1992. Available online: https://www.nuclear.lu.se/fileadmin/nuclear/Undervisning/Atmosfaerskurs/Aerosol_water_and_clouds.pdf (accessed on 22 July 2025).
  110. Korolev, A.; McFarquhar, G.; Field, P.R.; Franklin, C.; Lawson, P.; Wang, Z.; Williams, E.; Abel, S.J.; Axisa, D.; Borrmann, S.; et al. Mixed-Phase Clouds: Progress and Challenges. In Formation and Evolution of Ice in Clouds and Precipitation: Measurement and Modeling Challenges; Meteorological Monographs, 58; American Meteorological Society: Boston, MA, USA, 2017; pp. 5.1–5.50. [Google Scholar] [CrossRef]
  111. Kanji, Z.A.; Ladino, L.A.; Wex, H.; Boose, Y.; Burkert-Kohn, M.; Cziczo, D.J.; Krämer, M. Overview of Ice Nucleating Particles. Meteorol. Monogr. 2017, 58, 1.1–1.33. [Google Scholar] [CrossRef]
  112. Pruppacher, H.R.; Klett, J.D. Microphysics of Clouds and Precipitation; Springer: Dordrecht, The Netherlands, 2010; p. 954. [Google Scholar]
  113. Schröd, J.; Bingemer, H.G. A view on recent ice-nucleating particle intercomparison studies: Why the uncertainty of the activation temperature matters. Atmos. Meas. Tech. 2025, 18, 2591–2605. [Google Scholar] [CrossRef]
  114. Knopf, D.A.; Alpert, P.A.; Wang, B. The role of organic aerosol in atmospheric ice nucleation: A review. ACS Earth Space Chem. 2018, 2, 168–202. [Google Scholar] [CrossRef]
  115. Karlsruher Institut für Technologie (KIT). Modes of Ice Nucleation—IMK-AAF, n.d. Available online: https://www.imk-aaf.kit.edu/417.php (accessed on 10 March 2025).
  116. Zhang, Z.; Liu, X.Y. Control of ice nucleation: Freezing and antifreeze strategies. Chem. Soc. Rev. 2018, 47, 7116–7139. [Google Scholar] [CrossRef]
  117. Kasparoglu, S.; Perkins, R.; Ziemann, P.J.; DeMott, P.J.; Kreidenweis, S.M.; Finewax, Z.; Deming, B.L.; DeVault, M.P.; Petters, M.D. Experimental Determination of the Relationship Between Organic Aerosol Viscosity and Ice Nucleation Under Upper Tropospheric Conditions. J. Geophys. Res. Atmos. 2022, 127, e2021JD036296. [Google Scholar] [CrossRef]
  118. Mehndiratta, L.; Lyp, A.E.; Slade, J.H.; Grassian, V.H. Immersion ice nucleation of atmospherically relevant lipid particles. Environ. Sci. Atmos. 2024, 4, 1239–1254. [Google Scholar] [CrossRef]
  119. Rinaldi, M.; Nicosia, A.; Paglione, M.; Mansour, K.; Decesari, S.; Mazzola, M.; Belosi, F. Seasonal Trends of Ice Nucleating Particles at Ny-Ålesund: A Study of Condensation-Freezing by the Dynamic Filter Processing Chamber. Aerosol Res. Discuss. 2025, 1–29. [Google Scholar] [CrossRef]
  120. Ladino Moreno, L.A.; Stetzer, O.; Lohmann, U. Contact freezing: A review of experimental studies. Atmos. Chem. Phys. 2013, 13, 9745–9769. [Google Scholar] [CrossRef]
  121. Durant, A.J.; Shaw, R.A. Evaporation freezing by contact nucleation inside-out. Geophys. Res. Lett. 2005, 32, L20814. [Google Scholar] [CrossRef]
  122. Zhao, L.; Xue, J.; Wang, S.; Tian, P.; Huang, M.; Bi, K.; Wang, B. Single particle characteristics and ice nucleation potential of particles collected during Asian dust storms in 2021. Sci. Total Environ. 2024, 948, 174829. [Google Scholar] [CrossRef] [PubMed]
  123. Korhonen, K.; Kristensen, T.B.; Falk, J.; Lindgren, R.; Andersen, C.; Carvalho, R.L.; Malmborg, V.; Eriksson, A.; Boman, C.; Pagels, J.; et al. Ice-nucleating ability of particulate emissions from solid-biomass-fired cookstoves: An experimental study. Atmos. Chem. Phys. 2020, 20, 4951–4968. [Google Scholar] [CrossRef]
  124. Hoose, C.; Möhler, O. Heterogeneous ice nucleation on atmospheric aerosols: A review of results from laboratory experiments. Atmos. Chem. Phys. 2012, 12, 9817–9854. [Google Scholar] [CrossRef]
  125. Yang, F.; Liu, X. The Role of Anthropogenic Aerosols in Heterogeneous Ice Nucleation: A Review. Atmosphere 2022, 13, 286. [Google Scholar]
  126. Cziczo, D.J.; Froyd, K.D.; Hoose, C.; Jensen, E.J.; Diao, M.; Zondlo, M.A.; Hudson, P.K.; Stone, E.M.; Danforth, W. Clarifying the dominant sources and mechanisms of cirrus cloud formation. Science 2013, 340, 1320–1324. [Google Scholar] [CrossRef]
  127. Hill, T.C.J.; DeMott, P.J.; Tobo, Y.; Fröhlich-Nowoisky, J.; Moffett, B.F.; Franc, G.D.; Kreidenweis, S.M. Sources of organic ice nucleating particles in soils. Atmos. Chem. Phys. 2016, 16, 7195–7211. [Google Scholar] [CrossRef]
  128. Franks, F. Nucleation of ice and its management in ecosystems. Philos. Trans. R. Soc. Lond. Ser. A Math. Phys. Eng. Sci. 2003, 361, 557–574. [Google Scholar] [CrossRef]
  129. Li, T.; Yu, Y.; Wang, X.; Liu, X.; Mao, Q.; Yuan, Y. A review of aerosol–cloud interactions: Mechanisms, climate effects, and observational methods. Atmos. Res. 2025, 325, 108267. [Google Scholar] [CrossRef]
  130. Patnaude, R.J.; Moore, K.A.; Perkins, R.J.; Hill, T.C.J.; DeMott, P.J.; Kreidenweis, S.M. Low-temperature ice nucleation of sea spray and secondary marine aerosols under cirrus cloud conditions. Atmos. Chem. Phys. 2024, 24, 911–926. [Google Scholar] [CrossRef]
  131. Schill, G.P.; Jathar, S.H.; Kodros, J.K.; Levin, E.J.T.; Galang, A.M.; Friedman, B.; Link, M.F.; Farmer, D.K.; Pierce, J.R.; Kreidenweis, S.M.; et al. Ice-nucleating particle emissions from photochemically aged diesel and biodiesel exhaust. Geophys. Res. Lett. 2016, 43, 5524–5531. [Google Scholar] [CrossRef]
  132. Mahrt, F.; Wang, B.; Wang, C.; Shen, H.; Martin, S.T.; Knopf, D.A. Aging induced changes in ice nucleation activity of combustion aerosol as determined by near edge X-ray absorption fine structure (NEXAFS) spectroscopy. Environ. Sci. Process. Impacts 2020, 22, 895–907. [Google Scholar] [CrossRef]
  133. Rapp, C.N.; Niu, S.; Armstrong, N.C.; Shen, X.; Berkemeier, T.; Surratt, J.D.; Zhang, Y.; Cziczo, D.J. Ice-nucleating properties of glassy organic and organosulfate aerosol. Atmos. Chem. Phys. 2025, 25, 5519–5536. [Google Scholar] [CrossRef]
  134. Sato, K.; Inoue, J. Seasonal Change in Satellite-Retrieved Lower-Tropospheric Ice-Cloud Fraction over the Southern Ocean. Geophys. Res. Lett. 2021, 48, e2021GL095295. [Google Scholar] [CrossRef]
  135. Tarn, M.D.; Sikora, S.N.; Porter, G.C.; O’Sullivan, D.; Adams, M.; Whale, T.F.; Harrison, A.D.; Vergara-Temprado, J.; Wilson, T.W.; Shim, J.u.; et al. The study of atmospheric ice-nucleating particles via microfluidically generated droplets. Microfluid. Nanofluid. 2018, 22, 52. [Google Scholar] [CrossRef] [PubMed]
  136. Herbert, R.J.; Sanchez-Marroquin, A.; Grosvenor, D.P.; Pringle, K.J.; Arnold, S.R.; Murray, B.J.; Carslaw, K.S. Gaps in our understanding of ice-nucleating particle sources exposed by global simulation of the UK climate model. EGUsphere 2024, 1–47. [Google Scholar] [CrossRef]
  137. Herbert, R.J.; Sanchez-Marroquin, A.; Grosvenor, D.P.; Pringle, K.J.; Arnold, S.R.; Murray, B.J.; Carslaw, K.S. Gaps in our understanding of ice-nucleating particle sources exposed by global simulation of the UK Earth System Model. Atmos. Chem. Phys. 2025, 25, 291–325. [Google Scholar] [CrossRef]
  138. Miller, A.J.; Fuchs, C.; Ramelli, F.; Zhang, H.; Omanovic, N.; Spirig, R.; Marcolli, C.; Kanji, Z.A.; Lohmann, U.; Henneberger, J. Quantified ice-nucleating ability of AgI-containing seeding particles in natural clouds. Atmos. Chem. Phys. 2025, 25, 5387–5407. [Google Scholar] [CrossRef]
  139. Gardner, D.B.; Wang, H. Critical review of modeling, measurement, and prediction of ice nucleation on surfaces. Int. J. Refrig. 2024, 163, 32–44. [Google Scholar] [CrossRef]
  140. Gettelman, A.; Liu, X.; Barahona, D.; Lohmann, U.; Chen, C. Climate impacts of ice nucleation. J. Geophys. Res. Atmos. 2012, 117, D20. [Google Scholar] [CrossRef]
  141. Song, X.; Zhang, G.J.; Li, J.L. Evaluation of microphysics parameterization for convective clouds in the NCAR Community Atmosphere Model CAM5. J. Clim. 2012, 25, 8568–8590. [Google Scholar] [CrossRef]
  142. McFarquhar, G.M. Rainfall microphysics. In Rainfall: Modeling, Measurement and Applications; Elsevier: Amsterdam, The Netherlands, 2022; pp. 1–26. ISBN 978-0-12-822544-8. [Google Scholar]
  143. Wallace, J.M.; Hobbs, P.V. Atmospheric Science: An Introductory Survey, 2nd ed.; Elsevier: Amsterdam, The Netherlands, 2006; Volume 92. [Google Scholar]
  144. Barnet, P. Rain Drop Growth by Collision and Coalescence. Ph.D. Thesis, University of Reading, 2011. Available online: https://citeseerx.ist.psu.edu/document?repid=rep1&type=pdf&doi=68cd79b4440ea3d547008d31bbb3e85f05f07d4a (accessed on 22 July 2025).
  145. Xue, Y.; Wang, L.P.; Grabowski, W.W. Growth of cloud droplets by turbulent collision–coalescence. J. Atmos. Sci. 2008, 65, 331–356. [Google Scholar] [CrossRef]
  146. Jonas, P.R. Turbulence and cloud microphysics. Atmos. Res. 1996, 40, 283–306. [Google Scholar] [CrossRef]
  147. Fowler, L.D.; Randall, D.A. Liquid and ice cloud microphysics in the CSU general circulation model. Part III: Sensitivity to modeling assumptions. J. Clim. 1996, 9, 561–586. [Google Scholar] [CrossRef]
  148. Rosenfeld, D.; Ulbrich, C.W. Cloud Microphysical Properties, Processes, and Rainfall Estimation Opportunities. Meteorol. Monogr. 2003, 30, 237–258. [Google Scholar] [CrossRef]
  149. Stevens, B.; Seifert, A. Understanding macrophysical outcomes of microphysical choices in simulations of shallow cumulus convection. J. Meteorol. Soc. Jpn. Ser. II 2008, 143–162. [Google Scholar] [CrossRef]
  150. Zmijewski, P.; Dziekan, P.; Pawlowska, H. Modeling collision–coalescence in particle microphysics: Numerical convergence of mean and variance of precipitation in cloud simulations using the University of Warsaw Lagrangian Cloud Model (UWLCM) 2.1. Geosci. Model Dev. 2024, 17, 759–780. [Google Scholar] [CrossRef]
  151. Shima, S.; Kusano, K.; Kawano, A.; Sugiyama, T.; Kawahara, S. The super-droplet method for the numerical simulation of clouds and precipitation: A particle-based and probabilistic microphysics model coupled with a non-hydrostatic model. Q. J. R. Meteorol. Soc. 2009, 135, 1307–1320. [Google Scholar] [CrossRef]
  152. Gillespie, D.T. Exact Method for Numerically Simulating the Stochastic Coalescence Process in a Cloud. J. Atmos. Sci. 1975, 32, 1977–1989. [Google Scholar] [CrossRef]
  153. Bailey, M.; Hallett, J. Growth Rates and Habits of Ice Crystals between −20° and −70 °C. J. Atmos. Sci. 2004, 61, 514–544. [Google Scholar] [CrossRef]
  154. Gonda, T. The influence of vapor and heat diffusion on the morphology of ice crystals grown from the vapor phase. J. Cryst. Growth 1980, 49, 173–181. [Google Scholar] [CrossRef]
  155. Fourteau, K.; Domine, F.; Hagenmuller, P. Macroscopic water vapor diffusion is not enhanced in snow. Cryosphere 2021, 15, 389–406. [Google Scholar] [CrossRef]
  156. Chiruta, M.; Wang, P.K. The Capacitance of Rosette Ice Crystals. J. Atmos. Sci. 2003, 60, 836–846. [Google Scholar] [CrossRef]
  157. Zhang, C.; Harrington, J.Y. Including Surface Kinetic Effects in Simple Models of Ice Vapor Diffusion. J. Atmos. Sci. 2014, 71, 372–390. [Google Scholar] [CrossRef]
  158. Korolev, A. Limitations of the Wegener-Bergeron-Findeisen mechanism in the evolution of mixed-phase clouds. J. Atmos. Sci. 2007, 64, 3372–3375. [Google Scholar] [CrossRef]
  159. Storelvmo, T.; Tan, I. The Wegener-Bergeron-Findeisen process - Its discovery and vital importance for weather and climate. Meteorol. Z. 2015, 24, 455–461. [Google Scholar] [CrossRef]
  160. Khain, A.; Pinsky, M.; Korolev, A. Combined Effect of the Wegener–Bergeron–Findeisen Mechanism and Large Eddies on Microphysics of Mixed-Phase Stratiform Clouds. J. Atmos. Sci. 2022, 79, 383–407. [Google Scholar] [CrossRef]
  161. Yang, J.; Lu, J.; Deng, Y.; Wang, Y.; Lu, C.; Yin, Y.; Yang, K. Parameterizing the heterogeneous liquid-ice mixing in modeling ice growth through the Wegener-Bergeron-Findeisen process in CAM6. Geophys. Res. Lett. 2025, 52, e2024GL114036. [Google Scholar] [CrossRef]
  162. von Blohn, N.; Diehl, K.; Mitra, S.K.; Borrmann, S. Riming of graupel: Wind tunnel investigations of collection kernels and growth regimes. J. Atmos. Sci. 2009, 66, 2359–2366. [Google Scholar] [CrossRef]
  163. Garrett, T.J.; Yuter, S.E. Observed influence of riming, temperature, and turbulence on the fallspeed of solid precipitation. Geophys. Res. Lett. 2014, 41, 6515–6522. [Google Scholar] [CrossRef]
  164. Maherndl, N.; Maahn, M.; Tridon, F.; Leinonen, J.; Ori, D.; Kneifel, S. A riming-dependent parameterization of scattering by snowflakes using the self-similar Rayleigh–Gans approximation. Q. J. R. Meteorol. Soc. 2023, 149, 3562–3581. [Google Scholar] [CrossRef]
  165. Hogan, R.J.; Honeyager, R.; Tyynelä, J.; Kneifel, S. Calculating the millimetre-wave scattering phase function of snowflakes using the self-similar Rayleigh–Gans Approximation. Q. J. R. Meteorol. Soc. 2016, 143, 834–844. [Google Scholar] [CrossRef]
  166. Seifert, A.; Leinonen, J.; Siewert, C.; Kneifel, S. The Geometry of Rimed Aggregate Snowflakes: A Modeling Study. J. Adv. Model. Earth Syst. 2019, 11, 712–731. [Google Scholar] [CrossRef]
  167. Fitch, K.E.; Garrett, T.J. Measurement and analysis of the microphysical properties of Arctic precipitation showing frequent occurrence of riming. J. Geophys. Res. Atmos. 2022, 127, e2022JD037609. [Google Scholar] [CrossRef]
  168. Morrison, H.; Milbrandt, J.A. Parameterization of cloud microphysics based on the prediction of bulk ice particle properties. Part I: Scheme description and idealized tests. J. Atmos. Sci. 2015, 72, 287–311. [Google Scholar] [CrossRef]
  169. Lin, Y.; Donner, L.J.; Colle, B.A. Parameterization of riming intensity and its impact on ice fall speed using ARM data. Mon. Weather Rev. 2011, 139, 1180–1193. [Google Scholar] [CrossRef]
  170. Sulia, K.J.; Lebo, Z.J.; Przybylo, V.M.; Schmitt, C.G. A New Method for Ice–Ice Aggregation in the Adaptive Habit Model. J. Atmos. Sci. 2021, 78, 133–154. [Google Scholar] [CrossRef]
  171. Connolly, P.J.; Emersic, C.; Field, P.R. A laboratory investigation into the aggregation efficiency of small ice crystals. Atmos. Chem. Phys. 2012, 12, 2055–2076. [Google Scholar] [CrossRef]
  172. Korolev, A.; Heckman, I.; Wolde, M.; Ackerman, A.S.; Fridlind, A.M.; Ladino, L.A.; Williams, E. A new look at the environmental conditions favorable to secondary ice production. Atmos. Chem. Phys. 2020, 20, 1391–1429. [Google Scholar] [CrossRef]
  173. Waitz, F.; Afchine, A.; Wendisch, M.; Spichtinger, P.; Rolf, D.E.P.; Schwarzenboeck, A.; Schnaiter, M. PHIPS-HALO: The airborne Particle Habit Imaging and Polar Scattering probe–Part 3: Single-particle phase discrimination and particle size distribution based on the angular-scattering function. Atmos. Meas. Tech. 2021, 14, 3049–3070. [Google Scholar] [CrossRef]
  174. Baran, A.J. A review of the light scattering properties of cirrus. J. Quant. Spectrosc. Radiat. Transf. 2009, 110, 1239–1260. [Google Scholar] [CrossRef]
  175. Xie, Y.; Yang, P.; Kattawar, G.W.; Baum, B.A.; Hu, Y. Optical properties of plate aggregates for remote sensing applications in cirrus clouds. Appl. Opt. 2011, 50, 1065–1081. [Google Scholar] [CrossRef]
  176. Han, C.; Lower, C.; Dürlich, V. Secondary Ice Production in Simulated Deep Convective Clouds: A Sensitivity Study. J. Atmos. Sci. 2024, 81, 903–921. [Google Scholar] [CrossRef]
  177. Cholette, M.; Milbrandt, J.A.; Morrison, H.; Kirk, S.; Lalonde, L.-É. Secondary Ice Production Improves Simulations of Freezing Rain. Geophys. Res. Lett. 2024, 51, e2024GL108490. [Google Scholar] [CrossRef]
  178. Qu, Z.; Korolev, A.; Milbrandt, J.A.; Heckman, I.; Huang, Y.; McFarquhar, G.M.; Morrison, H.; Wolde, M.; Nguyen, C. The impacts of secondary ice production on microphysics and dynamics in tropical convection. Atmos. Chem. Phys. 2022, 22, 12287–12310. [Google Scholar] [CrossRef]
  179. Dedekind, Z.; Lauber, A.; Ferrachat, S.; Lohmann, U. Sensitivity of precipitation formation to secondary ice production in mixed-phase winter orographic clouds. Atmos. Chem. Phys. 2021, 21, 15115–15134. [Google Scholar] [CrossRef]
  180. Georgakaki, P.; Sotiropoulou, G.; Vignon, É.; Billault-Roux, A.C.; Berne, A.; Nenes, A. Secondary Ice Production Processes in Wintertime Alpine Mixed-Phase Clouds. Atmos. Chem. Phys. 2022, 22, 1965–1988. [Google Scholar] [CrossRef]
  181. Zhao, X.; Liu, X. Primary and secondary ice production: Interactions and their relative importance. Atmos. Chem. Phys. 2022, 22, 2585–2600. [Google Scholar] [CrossRef]
  182. Sullivan, S.C.; Barthlott, C.; Crosier, J.; Zhukov, I.; Nenes, A.; Hoose, C. The effect of secondary ice production parameterization on the simulation of a cold frontal rainband. Atmos. Chem. Phys. 2018, 18, 16461–16480. [Google Scholar] [CrossRef]
  183. Karalis, M.; Sotiropoulou, G.; Abel, S.J.; Bossioli, E.; Georgakaki, P.; Methymaki, G.; Nenes, A.; Tombrou, M. Effects of secondary ice processes on a stratocumulus to cumulus transition during a cold-air outbreak. Atmos. Res. 2022, 277, 106302. [Google Scholar] [CrossRef]
  184. Korolev, A.; Leisner, T. Review of experimental studies of secondary ice production. Atmos. Chem. Phys. 2020, 20, 11767–11790. [Google Scholar] [CrossRef]
  185. Langham, E.J.; Mason, B.J. Heterogeneous and homogeneous nucleation of supercooled water. Proc. R. Soc. Lond. Ser. A. Math. Phys. Sci. 1958, 247, 493–504. [Google Scholar]
  186. Mason, B.J.; Maybank, J. The fragmentation and electrification of freezing water drops. Q. J. R. Meteorol. Soc. 1960, 86, 176–185. [Google Scholar] [CrossRef]
  187. Heymsfield, A.J.; Mossop, S.C. Temperature dependence of secondary ice crystal production during soft hail growth by riming. Q. J. R. Meteorol. Soc. 1984, 110, 765–770. [Google Scholar] [CrossRef]
  188. Vardiman, L. The Generation of Secondary Ice Particles in Clouds by Crystal–Crystal Collision. J. Atmos. Sci. 1978, 35, 2168–2180. [Google Scholar] [CrossRef]
  189. Dye, J.E.; Hobbs, P.V. The Influence of Environmental Parameters on the Freezing and Fragmentation of Suspended Water Drops. J. Atmos. Sci. 1968, 25, 82–96. [Google Scholar] [CrossRef]
  190. Oraltay, R.G.; Hallett, J. Evaporation and melting of ice crystals: A laboratory study. Atmos. Res. 1989, 24, 169–189. [Google Scholar] [CrossRef]
  191. Muchnik, V.M.; Rudko, J.S. Peculiarities of freezing supercooled water drops. Trans. Ukr. Hydro Meteorol. Inst. (Trudi UkrNIGMI) 1961, 26, 64–73. [Google Scholar]
  192. Field, P.R.; Lawson, R.P.; Brown, P.R.A.; Lloyd, G.; Westbrook, C.; Moisseev, D.; Miltenberger, A.; Nenes, A.; Blyth, A.; Choularton, T.; et al. Secondary Ice Production: Current State of the Science and Recommendations for the Future. Meteorol. Monogr. 2017, 58, 7.1–7.20. [Google Scholar] [CrossRef]
  193. Zhao, X.; Liu, X. Global Importance of Secondary Ice Production. Geophys. Res. Lett. 2021, 48, e2021GL092581. [Google Scholar] [CrossRef]
  194. Best, A.C. The size distribution of raindrops. Q. J. R. Meteorol. Soc. 1950, 76, 16–36. [Google Scholar] [CrossRef]
  195. Smith, P.L. Raindrop Size Distributions: Exponential or Gamma—Does the Difference Matter? J. Appl. Meteorol. 2003, 42, 1031–1034. [Google Scholar] [CrossRef]
  196. Igel, A.L.; van den Heever, S.C. The role of the gamma function shape parameter in determining differences between condensation rates in bin and bulk microphysics schemes. Atmos. Chem. Phys. 2017, 17, 4599–4609. [Google Scholar] [CrossRef]
  197. Khain, A.P.; Beheng, K.D.; Heymsfield, A.; Korolev, A.; Krichak, S.O.; Levin, Z.; Pinsky, M.; Phillips, V.; Prabhakaran, T.; Teller, A.; et al. Representation of microphysical processes in cloud-resolving models: Spectral (bin) microphysics versus bulk parameterization. Rev. Geophys. 2015, 53, 247–322. [Google Scholar] [CrossRef]
  198. Benmoshe, N.; Reisin, G.; Khain, A.; Koren, I. Turbulent effects on the microphysics and initiation of warm rain in deep convective clouds: 2-D simulations by a spectral mixed-phase microphysics cloud model. J. Geophys. Res. Atmos. 2012, 117, D06205. [Google Scholar] [CrossRef]
  199. Marshall, J.S.; Palmer, W.M.K. The distribution of raindrops with size. J. Meteorol. 1948, 5, 165–166. [Google Scholar] [CrossRef]
  200. Rasch, P.J.; Carslaw, K.S. Aerosol–Climate Modeling. In Aerosols and Climate; Carslaw, K.S., Ed.; Elsevier: Amsterdam, The Netherlands, 2022; Chapter 6; pp. 187–248. [Google Scholar]
  201. Chandrakar, K.K.; Morrison, H.; Grabowski, W.W.; Lawson, R.P. Are turbulence effects on droplet collision–coalescence a key to understanding observed rain formation in clouds? Proc. Natl. Acad. Sci. USA 2024, 121, e2319664121. [Google Scholar] [CrossRef]
  202. Singh, N.; Das, S.; Sahoo, U.K.; Kundu, S.S.; Chakraborty, S. On collisional drop breakup in orographic rain. Atmos. Res. 2024, 300, 107232. [Google Scholar] [CrossRef]
  203. Jin, H.G. Development of New Accretion Parameterizations and Their Applications to Cloud and Precipitation Modeling. Ph.D. Thesis, Seoul National University Graduate School, 2021. Available online: https://dcollection.snu.ac.kr/common/orgView/000000165497 (accessed on 20 July 2025).
  204. Lu, C.; Zhang, J.; Li, R.; Wang, S.; Fan, J.; Zhang, L. Reconciling contrasting relationships between relative dispersion and volume-mean radius of cloud droplet size distributions. J. Geophys. Res. Atmos. 2020, 125, e2019JD031868. [Google Scholar] [CrossRef]
  205. Gupta, S.; Rodrigues, E.S.; Silva, M.T.; Oliveira, C.A.; Souza, L.F. Lifecycle of Updrafts and Mass Flux in Isolated Deep Convection over the Amazon Forest: Insights from Cell Tracking. Atmos. Chem. Phys. 2024, 24, 4487–4510. [Google Scholar] [CrossRef]
  206. Rooney, G.G.; Shipway, B.J.; Parker, D.J. Rain in Convective Downdraughts. Quart. J. Roy. Meteorol. Soc. 2025, 151, e4923. [Google Scholar] [CrossRef]
  207. Terrell, M.L. Investigating the Effect of Size Sorting on the Vertical Variation of Rain Drop Size Distributions Using Parsivel Disdrometers and WSR-88D Radars During Vortex-SE. Master’s Thesis, Purdue University, West Lafayette, IN, USA, 2021. Available online: https://hammer.purdue.edu/articles/thesis/INVESTIGATING_THE_EFFECT_OF_SIZE_SORTING_ON_THE_VERTICAL_VARIATION_OF_RAIN_DROP_SIZE_DISTRIBUTIONS_USING_PARSIVEL_DISDROMETERS_AND_WSR-88D_RADARS_DURING_VORTEX-SE/15067314?utm_source=chatgpt.com&file=28973964 (accessed on 15 July 2025).
  208. Shan, Y.; Wilcox, E.M.; Gao, L.; Lin, L.; Mitchell, D.L.; Yin, Y.; Zhao, T.; Zhang, L.; Shi, H.; Gao, M. Evaluating Errors in Gamma-Function Representations of the Raindrop Size Distribution: A Method for Determining the Optimal Parameter Set for Use in Bulk Microphysics Schemes. J. Atmos. Sci. 2020, 77, 513–529. [Google Scholar] [CrossRef]
  209. Noppel, H.; Pokrovsky, A.; Lynn, B.; Khain, A.; Beheng, K. A spatial shift of precipitation from ocean to land induced by submicron soluble aerosol: Numerical modeling. J. Geophys. Res. Atmos. 2010, 115, D18212. [Google Scholar] [CrossRef]
  210. Cecchini, M.A.; Machado, L.A.T.; Wendisch, M.; Costa, A.; Krämer, M.; Andreae, M.O.; Afchine, A.; Albrecht, R.I.; Artaxo, P.; Borrmann, S.; et al. Illustration of microphysical processes in Amazonian deep convective clouds in the gamma phase space: Introduction and potential applications. Atmos. Chem. Phys. 2017, 17, 14727–14746. [Google Scholar] [CrossRef]
  211. McFarquhar, G.M.; Hsieh, T.; Freer, M.; Mascio, J.; Jewett, B.F. The Characterization of Ice Hydrometeor Gamma Size Distributions as Volumes in N0–rλ–μ Phase Space: Implications for Microphysical Process Modeling. J. Atmos. Sci. 2015, 72, 892–909. [Google Scholar] [CrossRef]
  212. Luo, L.; Xue, M.; Zhu, K.; Wang, Z. Diagnosing the shape parameters of the gamma particle size distributions in a two-moment microphysics scheme and improvements to explicit hail prediction. Atmos. Res. 2021, 258, 105651. [Google Scholar] [CrossRef]
  213. Milbrandt, J.A.; Morrison, H. Parameterization of cloud microphysics based on the prediction of bulk ice particle properties. Part III: Introduction of multiple free categories. J. Atmos. Sci. 2016, 73, 975–995. [Google Scholar] [CrossRef]
  214. Gunn, R.; Kinzer, G.D. The terminal velocity of fall for water droplets in stagnant air. J. Meteorol. 1949, 6, 243–248. [Google Scholar] [CrossRef]
  215. McDonald, J.E. The physics of cloud modification. Adv. Geophys. 1958, 5, 223–303. [Google Scholar] [CrossRef]
  216. Costa, A.A.; Campos Filho, M.C.; Santos, A.C.S. Características de cristais de gelo observados em um sistema de nuvens na Amazônia durante o experimento TRMM-LBA. Rev. Bras. Meteorol. 2012, 27, 139–151. [Google Scholar] [CrossRef]
  217. Huang, J.; Minnis, P.; Yan, H.; Yi, Y.; Chen, B.; Zhang, L.; Ayers, J.K. Dust aerosol effect on semi-arid climate over Northwest China detected from A-Train satellite measurements. Atmos. Chem. Phys. 2010, 10, 6863–6872. [Google Scholar] [CrossRef]
  218. Lohmann, U.; Lüönd, F.; Mahrt, F. An Introduction to Clouds: From the Microscale to Climate; Cambridge University Press: Cambridge, UK, 2016; ISBN 9781139087513. [Google Scholar] [CrossRef]
  219. Koren, I.; Remer, L.A.; Altaratz, O.; Martins, J.V.; Davidi, A. Aerosol-induced changes of convective cloud anvils produce strong climate warming. Atmos. Chem. Phys. 2010, 10, 5001–5010. [Google Scholar] [CrossRef]
  220. Diehl, K.; Mitra, S.K.; Pruppacher, H.R. A laboratory study of the uptake of HNO3 and HCl vapor by snow crystals and ice spheres at temperatures between 0 and −40 C. Atmos. Environ. 1995, 29, 975–981. [Google Scholar] [CrossRef]
  221. Gupta, A.K.; Deshmukh, A.; Waman, D.; Patade, S.; Jadav, A.; Phillips, V.T.J.; Bansemer, A.; Martins, J.A.; Gonçalves, F.L.T. The microphysics of warm-rain and ice-crystal precipitation processes in simulated continental convective storms. Earth Environ. Commun. Nat. 2023, 4, 226. [Google Scholar] [CrossRef]
  222. van den Heever, S.C.; Carrió, G.G.; Cotton, W.R.; Demott, P.J.; Prenni, A.J. Impacts of nucleating aerosol on Florida storms. Part I: Mesoscale simulations. J. Atmos. Sci. 2006, 63, 1752–1775. [Google Scholar] [CrossRef]
  223. Wang, J.; Wang, T.; Yasheng, D.; Wang, X.; Lei, Y.; Li, X.; Wang, Z.; Shi, B. Modulations of dust aerosols on precipitation: Evidence from a typical heavy sandstorm event. Atmos. Res. 2024, 304, 107411. [Google Scholar] [CrossRef]
  224. Henao, J.J.; Mejia, J.F.; McDonough, F. Impacts of anthropogenic aerosols on orographic precipitation in Arizona. Urban Clim. 2023, 49, 101561. [Google Scholar] [CrossRef]
  225. Chen, T.; Li, Z.; Kahn, R.A.; Zhao, C.; Rosenfeld, D.; Guo, J.; Han, W.; Chen, D. Potential impact of aerosols on convective clouds revealed by Himawari-8 observations over different terrain types in eastern China. Atmos. Chem. Phys. 2021, 21, 6199–6220. [Google Scholar] [CrossRef]
  226. López-Romero, J.M.; Montávez, J.P.; Jerez, S.; Lorente-Plazas, R.; Palacios-Peña, L.; Jiménez-Guerrero, P. Precipitation response to aerosol–radiation and aerosol–cloud interactions in regional climate simulations over Europe. Atmos. Chem. Phys. 2021, 21, 415–430. [Google Scholar] [CrossRef]
  227. Su, T.; Li, Z.; Roldan Henao, N.; Luan, Q.; Yu, F. Restrictive Effects of Aerosol–Cloud Interaction When Considering Cloud–Surface Coupling. Sci. Adv. 2024, 10, eadl5044. [Google Scholar] [CrossRef]
  228. Kumar, H.; Tiwari, S. Aerosol loading over the Northern Indian Ocean using space-borne measurements. In Atmospheric Remote Sensing; Elsevier: Amsterdam, The Netherlands, 2023; pp. 191–210. [Google Scholar] [CrossRef]
  229. Rautela, K.S.; Singh, S.; Goyal, M.K. Aerosol atmospheric rivers: Patterns, impacts, and societal insights. In Environmental Science and Pollution Research; Springer Nature: Heidelberg, Germany, 2024; pp. 1–16. [Google Scholar] [CrossRef]
  230. Rautela, K.S.; Singh, S.; Goyal, M.K. Characterizing the spatio-temporal distribution, detection, and prediction of aerosol atmospheric rivers on a global scale. J. Environ. Manag. 2024, 351, 119675. [Google Scholar] [CrossRef]
  231. Rosenfeld, D.; Kokhanovsky, A.; Goren, T.; Gryspeerdt, E.; Hasekamp, O.; Jia, S.; Lopatin, A.; Quaas, J.; Zengxin, P.; Sourdeval, O. Frontiers in Satellite-Based Estimates of Aerosol-Cloud-Mediated Forcing. Rev. Geophys. 2023, 61, e2022RG000799. [Google Scholar] [CrossRef]
  232. Zelinka, M.D.; Myers, T.A.; McCoy, D.T.; Po-Chedley, S.; Caldwell, P.M.; Ceppi, P.; Klein, S.A.; Taylor, K.E. Causes of Higher Climate Sensitivity in CMIP6 Models. Geophys. Res. Lett. 2020, 47, e2019GL085782. [Google Scholar] [CrossRef]
  233. Lutsko, N.J.; Luongo, M.T.; Wall, C.J.; Myers, T.A. Correlation Between Cloud Adjustments and Cloud Feedbacks Responsible for a Greater Spread in Climate Sensitivities in CMIP6. J. Geophys. Res. Atmos. 2022, 127, e2022JD037486. [Google Scholar] [CrossRef]
  234. Tiwari, S.; Kumar, H.; Singh, S.; Kumar, A. Current state of aerosol–cloud interactions and their impact over the northern Indian Ocean: A comprehensive review. Atmos. Res. 2023, 283, 106555. [Google Scholar] [CrossRef]
  235. Cairo, F.; Liberto, L.D.; Dionisi, D.; Snels, M. Understanding Aerosol-Cloud Interactions Using Lidar Techniques: A Review. Remote Sens. 2024, 16, 2788. [Google Scholar] [CrossRef]
  236. Wang, Z.; Zhang, J.; Gao, H. Impacts of laser beam divergence on lidar multiple scattering polarization returns from water clouds. J. Quant. Spectrosc. Radiat. Transf. 2021, 268, 107618. [Google Scholar] [CrossRef]
  237. Li, T.; Yu, Y.; Wang, X.; Liu, X.; Mao, Q.; Yuan, Y. Uma revisão das interações aerossol-nuvem: Mecanismos, efeitos climáticos e métodos de observação. Pesqui. Atmosférica 2025, 325, 108267. [Google Scholar]
  238. Lv, M.; Wang, T.; Huang, J.; Sun, Y.; Wang, Z.; Chen, L.; Zhang, J.; Zhao, C.; Shen, L.; Wu, Z. Hygroscopic growth of atmospheric aerosol particles based on lidar, radiosonde, and in situ measurements: Case studies from the Xinzhou field campaign. J. Quant. Spectrosc. Radiat. Transf. 2017, 188, 60–70. [Google Scholar] [CrossRef]
  239. Shen, X.; Liu, Q.; Sun, J.; Kong, W.; Ma, Q.; Qi, B.; Han, L.; Zhang, Y.; Liang, L.; Liu, L.; et al. Measurement report: The influence of particle number size distribution and hygroscopicity on the microphysical properties of cloud droplets at a mountain site. Atmos. Chem. Phys. 2025, 25, 5711–5725. [Google Scholar] [CrossRef]
  240. Jiang, F.; Zheng, Z.; Coe, H.; Healy, R.M.; Poulain, L.; Gros, V.; Zhang, H.; Li, W.; Liu, D.; West, M.; et al. Integrating Simulations and Observations: A Foundation Model for Estimating the Aerosol Mixing State Index. ACS ES&T Air 2025, 2, 877–890. [Google Scholar] [CrossRef]
Figure 1. Representation of the main effects of aerosols interacting with radiation and clouds. Source: Reprinted with permission from Mahowald & Carslaw (2022) [26]. © 2022 Elsevier B.V. All rights reserved.
Geosciences 15 00312 g001
Figure 2. Distribution of major chemical aerosols on a global scale. Source: Reprinted with permission from Carslaw e Pringle (2022) [24]. © 2022 Elsevier B.V. All rights reserved.
Geosciences 15 00312 g002
Figure 3. Diagram of the atmospheric aerosol formation mechanisms. Source: Adapted with permission from Alves (2005) [33]. © 2005 Brazilian Chemical Society (SBQ). All rights reserved.
Geosciences 15 00312 g003
Figure 4. Gas-to-particle conversion processes and the impact of atmospheric vapors on aerosol particle formation and growth. Source: Reprinted with permission from Vehkamaaki and Riipinen (2012) [51]. © 2012 Royal Society of Chemistry (RSC). All rights reserved.
Geosciences 15 00312 g004
Figure 5. CCN concentrations and NPF contributions at different altitudes in 2016. (a,c,e) CCN concentrations at 0.5% supersaturation (CCN0.5%) at 13 km (a), 1 km (c), and surface level (e). (b,d,f) Fraction of CCN0.5% from NPF at 13 km (b), 1 km (d), and surface level (f). All values are normalized to standard temperature and pressure. Maps generated using NCAR tools. Source: Reprinted from Zhao et al., 2024 [52]. Licensed under CC BY 4.0.
Geosciences 15 00312 g005
Figure 6. Relationship between the particle concentration per cubic centimeter and optical thickness for a cloud depth of 1 km. Source: Adapted with permission from Twomey (1977) [23]. © 1977 American Meteorological Society. All rights reserved.
Geosciences 15 00312 g006
Figure 7. Relationship between the droplet concentration per cubic centimeter and the average volume of the droplet radius. Source: Reprinted with permission from Albrecht (1989) [10]. © 1989 American Association for the Advancement of Science. All rights reserved.
Geosciences 15 00312 g007
Figure 8. Relative humidity as a function of temperature during adiabatic cooling for different vapor pressure values. The dashed (black) line represents the adiabatic cooling process and shows the increase in relative humidity as the air cools.
Geosciences 15 00312 g008
Figure 9. Köhler curve and the hydrometeor activation process. On the left: the rate of environmental saturation as a function of particle size is shown. On the right: the droplet number concentration (Nd) after activation as a function of the sulfate aerosol number concentration for different vertical wind speeds. Source: Reprinted with permission from Quaas e Gryspeerd (2022) [77]. © 2022 Elsevier B.V. All rights reserved.
Geosciences 15 00312 g009
Figure 10. Effect of surface tension on a flat surface and a curved surface.
Geosciences 15 00312 g010
Figure 11. Köhler curves for different quantities of NaCl solute (in 10 16 g). The Köhler curve approaches the Kelvin effect (thin line) as the solute quantity decreases. Source: Reprinted with permission from Ambaum (2022) [73]. © 2022 Elsevier B.V. All rights reserved.
Geosciences 15 00312 g011
Figure 12. Hygroscopic growth factors of different nitrate particles, 100 nm in size, as a function of water availability. Water activity ranges from 0 (no water availability) to 1 (maximum water availability) in an ambient solution. Source: Reprinted from Jing et al. (2018) [92]. Licensed under CC BY 4.0.
Geosciences 15 00312 g012
Figure 13. Saturation vapor pressure over liquid water (−40 to +40 °C) and solid ice (−80 to 0 °C) as a function of temperature. Source: Adapted with permission from Martinsson (1992) [109].
Geosciences 15 00312 g013
Figure 14. In the illustration, (A) shows homogeneous ice nucleation, (B) immersion freezing, (C) deliquescence and water absorption followed by immersion freezing, (D) ice nucleation by deposition, (E) ice nucleation by contact, and (F) freezing from the inside out. Source: Reprinted with permission from Knopf (2018) [114]. © 2018 American Chemical Society. All rights reserved.
Geosciences 15 00312 g014
Figure 15. Diagram illustrating different sources of INPs. Sources through which INPs can originate. The figure also exemplifies the use of a microfluidic platform to quantify INP concentrations, which consists of an aerosol sampler with a cutoff > 10 µm, polycarbonate filters to wash the particles, and controlled cooling for droplet freezing and experimental analysis. Source: Reprinted from Tarn et al. (2018) [135]. Creative Commons CC BY.
Geosciences 15 00312 g015
Figure 16. Main microphysical processes schematically represented in a mixed-phase cloud formed from CCN and IN. The processes include condensation, Bergeron, riming, aggregation, sublimation, and vapor deposition. In red, processes involving only liquid droplets are shown, and in purple, processes involving only ice particles or both liquid and ice are shown. The figure illustrates the phases of hydrometeors. Source: Reprinted from Morrison et al. (2020) [105]. Creative Commons CC BY 3.0.
Geosciences 15 00312 g016
Figure 17. Droplet growth by condensation (a) and collision-coalescence (b), considering the droplet radius (R) as a function of time (t). Source: Reprinted with permission from Wallace & Hobbs (2006) [143]. © 2006 Elsevier B.V. All rights reserved.
Geosciences 15 00312 g017
Figure 18. Wegener–Bergeron–Findeisen process.
Geosciences 15 00312 g018
Figure 19. Snow crystal, Bergeron–Findeisen process. Bergeron–Findeisen process illustrated by means of a snow crystal of 400 µm diameter growing at the expense of surrounding supercooled water drops. Source: Reprinted with permission from Pruppacher and Klett (1998) [89]. © 1998 MDPI AG. All rights reserved.
Geosciences 15 00312 g019
Figure 20. Riming: Collision of ice crystals and droplets. Droplet size: ∼10– 40   μ m . Crystal size: 100– 400   μ m .
Geosciences 15 00312 g020
Figure 21. Images of aggregated ice crystals obtained with the Cloud Particle Imager (CPI) in a laboratory study. Source: Reprinted from Connoly (2012) [171]. Creative Commons CC BY 3.0.
Geosciences 15 00312 g021
Figure 22. A conceptual diagram illustrates six SIP mechanisms: (a) droplet fragmentation during freezing, (b) rime splintering (Hallett–Mossop process), (c) ice–ice collision-induced fragmentation, (d) thermal shock fragmentation from freezing drops, (e) sublimation-induced ice fragmentation, and (f) activation of supersaturation-sensitive INPs near freezing drops or wet graupel. Blue indicates ice phase; red indicates liquid phase. Source: Reprinted from Korolev & Leisner (2020) [184]. Creative Commons Attribution 4.0 License.
Geosciences 15 00312 g022
Figure 23. Schematic representations of the effects of various processes on the shape of the DSD. The processes illustrated are (a) coalescence, (b) raindrop break-up, (c) coalescence and break-up, (d) accretion, (e) evaporation, (f) updraft, (g) an accelerated downdraft, and (h) size sorting. Source: Reprinted with permission from Rosenfeld and Ulbrich (2002) [148]. © 2003 Meteorological Monographs. All rights reserved.
Geosciences 15 00312 g023
Figure 24. Gamma distributions representing broad (left) and narrow (right) DSDs, with parameters ν and μ indicated. The intercept values were adjusted to produce the shown droplet concentrations. Solid, dashed, and dotted lines correspond to maritime, intermediate, and continental conditions, respectively. Source: Reprinted from Noppel et al. (2010) [209]. ©2010 American Geophysical Union.
Geosciences 15 00312 g024
Figure 25. Comparison of the size, concentration, and terminal fall velocity of some of the particles involved in the cloud and precipitation processes. Source: Adapted with permission from McDonald (1958) [215]. © 1958 Academic Press Incorporated. All rights reserved.
Geosciences 15 00312 g025
Figure 26. Cloud phase response for pristine conditions and conditions with high aerosol concentrations. Source: Reprinted with permission from Rosenfeld et al. (2008) [4]. © 2008 American Association for the Advancement of Science (AAAS). All rights reserved.
Geosciences 15 00312 g026
Disclaimer/Publisher’s Note: The statements, opinions and data contained in all publications are solely those of the individual author(s) and contributor(s) and not of MDPI and/or the editor(s). MDPI and/or the editor(s) disclaim responsibility for any injury to people or property resulting from any ideas, methods, instructions or products referred to in the content.