Article

Assessing the Geothermal Potential of a Fractured Carbonate Reservoir (Southern Apennines, Italy): Relationships Between Structural Control and Heat Flow

1
Department of Earth and Environmental Sciences, University of Pavia, via Ferrata, 1, 27100 Pavia, Italy
2
School of Mining & Metallurgical Engineering, National Technical University of Athens, Iroon Polytechniou 9 Str., Zografou Campus, 15773 Athens, Greece
3
Department of Geology, University of Patras, 26504 Rio, Greece
4
Delta Energy Ltd., Central Court, 25 Southampton Buildings, London WC2A 1AL, UK
5
G.E. Plan Consulting, via Ariosto, 58, 44121 Ferrara, Italy
*
Author to whom correspondence should be addressed.
Geosciences 2025, 15(8), 311; https://doi.org/10.3390/geosciences15080311
Submission received: 26 June 2025 / Revised: 29 July 2025 / Accepted: 6 August 2025 / Published: 11 August 2025
(This article belongs to the Section Structural Geology and Tectonics)

Abstract

As part of the energy transition needed to mitigate global warming, the study and sustainable exploitation of geothermal resources—a largely underutilized form of energy and heat production—is crucial. The availability of subsurface data acquired for oil and gas exploration purposes provides an opportunity to reconsider these data to enhance the use of geothermal potential. This is the case of a fractured carbonate reservoir in the Southern Apennines (Italy). All available subsurface data were gathered, homogenized, and reinterpreted to build a 3D geological model of the study area, where a positive thermal anomaly is known, yet the mechanisms and pathways of heat transport were previously unclear. By integrating subsurface, temperature, and literature data, a geological model is proposed that explains how high temperatures and heat propagation are closely linked to specific geological features. By cross-referencing and weighing the relevance of data for geothermal purposes, an attempt is made to rank the geothermal potential of existing wells in the area. This study demonstrates how a well-constrained geological model and the joint analysis of multidisciplinary data can provide the necessary knowledge base for conducting further technical, engineering, and economic analyses to assess the commercial viability of the identified geothermal resource.

1. Introduction

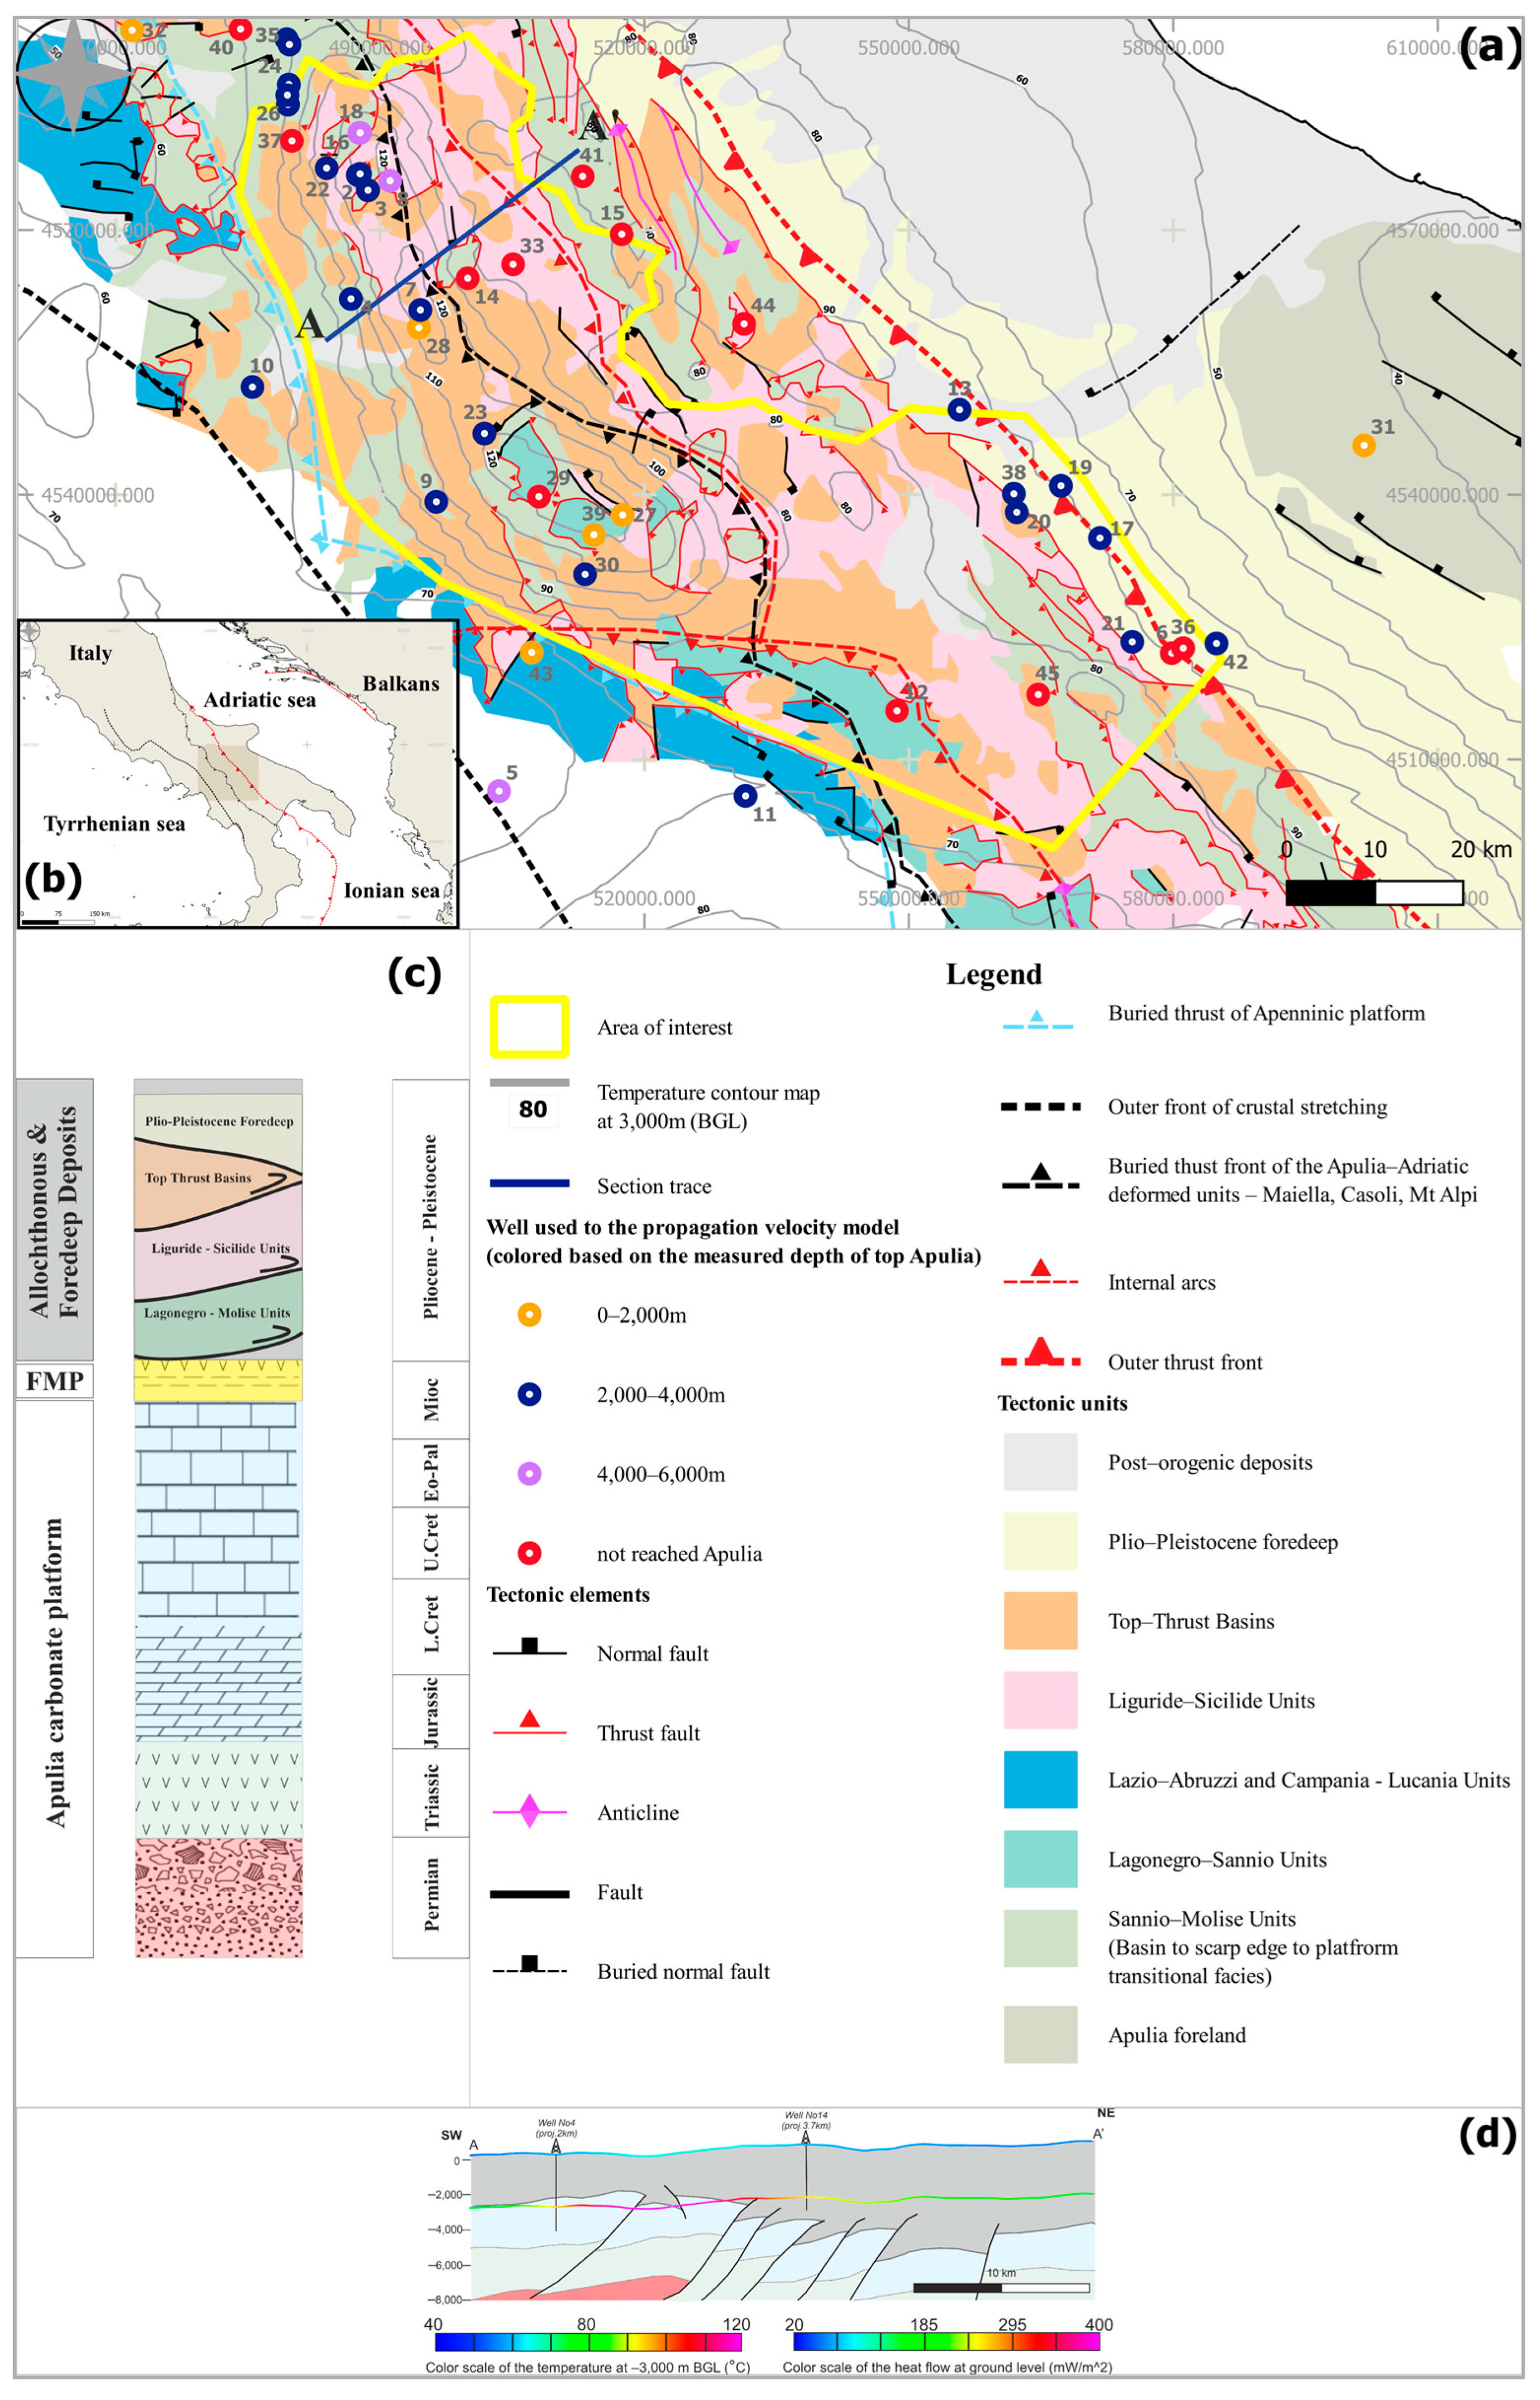
Deep geothermal energy is a renewable source with vast potential for electricity production and heating–cooling activities in Europe. Italy, celebrating the 110th anniversary of its first geothermal plant in Larderello, has demonstrated how to harness clean geothermal energy by using the Earth’s geological potential. Notable examples include Casaglia, Euganei hills, and Friuli-Venezia Giulia in the north and Naples, Campi Flegrei, Ischia, Alcamo, Sciacca, Aeolian Islands, and Pantelleria in the south [1] (Figure 1). However, despite Italy’s advantageous position and strengths on this sector compared to other European countries, there are still resources that are not fully understood and that need investigation and likely exploration to support future energy transitions and meet the UN 2030 Agenda and REPowerEU goals.
Most cases across Italy have been linked to specific geological characteristics, such as shallow basement, volcanism, or aquifers in carbonate sections at various depths. In general, a thorough multiscale understanding of the structural and geological context is essential for geothermal site development, firstly at a regional scale and then at a local one, where specific geological conditions, parameters, and variables must be considered [3]. Due to the increasing scientific interest in geothermal resources, recent studies produced a comparative analysis between heat flow maps and thermal conductivity measurements of well cores to produce a regional framework of the heat distribution [4]. Detailed studies regarding specific tectonic lineaments have been conducted in the Albanides [5], and the parameters for well constrained geothermal models have been studied in active and fossil geothermal systems [6]. Additionally, the heat transport physical laws were described by Gudmunsson [7], who considered dikes and fault zones to be preferential ways for hot fluid to migrate.
This paper focuses on a selected area of the Campania-Lucania sector in Southern Apennines (Italy, Figure 1). During the late 1980s and early 1990s, due to hydrocarbon exploration and development in the area, a positive temperature anomaly was detected and mapped close to 3000 m BGL [8,9]. Recent national studies on geothermal potential have confirmed this positive thermal anomaly [2,10]. The host rock of this anomaly is the Cretaceous-Eocene naturally fractured carbonate stratigraphic succession of the Apulia platform. The presence of this anomaly, particularly the heat transfer mechanism involving fluid migration, thermal conductivity, and fractures, has not been thoroughly explained from a structural perspective. The present study addresses this anomaly and examines how high temperatures at specific depths relate to geological structures.
A comprehensive dataset obtained from the Videpi project [11], the Vigor project [10], and the Geothopica project [12], in conjunction with extensive research from the academic literature and the oil and gas Industry, as well as confidential data including 2D seismic profiles and well data, enabled the re-interpretation and 3D reconstruction of geological structures. An analytical velocity model was constructed using the available data to convert the time domain to depth. The resulting 3D structural model, particularly the fault network, was compared with the thermal anomaly. A series of cross-sections were created that covered the area of the thermal anomaly observed within the study region and correlated with the corresponding temperature and surface heat flow profiles. The detailed workflow and the analysis of key geological elements support the establishment of a conceptual integrated geothermal model that elucidates the thermal positive anomaly in the region and highlights specific structural domains of greater interest in terms of geothermal potential.

2. Geological Framework

The Southern Apennines were formed during the late Paleogene period due to the westward subduction of the Tethys oceanic lithosphere beneath the European margin. The Campano-Lucano arch of the Apennine-Maghrebide chain evolved from the early Miocene till the late Pliocene-Pleistocene and is now characterized by a NE-verging fold-and-thrust belt with co-existing contractional and extensional structures, where the latter are attributed to the opening of the Tyrrhenian back-arc basin to the west from the Tortonian period till today [13,14,15,16,17]. The Southern Apennines consist of the following units: (a) Liguiride and Sicilide units, (b) Apennine Platform carbonates, (c) Lagonegro-Molise basin pelagic successions, and (d) Apulian platform shelf carbonates and evaporites. These units are covered by syn-orogenic piggy-back terrigenous deposits of Neogene foredeep and wedge-top basins [18,19].
According to Shiner et al. [20], the following four tectonic phases have occurred, shaping the current structural setting: (a) pre-Tortonian deformation of internal basinal units (Liguridi and Sicilidi nappes), (b) thin-skinned thrusting of basin and platform units (Lagonegro basin and Apennine Platform units) and overthrusting above the foredeep basin (Upper Miocene-Pliocene), (c) compressional deformation of the Inner AP (Late Pliocene–Early Pleistocene), and (d) post-orogenic extension (Middle Pleistocene–ongoing). The late stages of compression and extension have played a key role in shaping the recent tectonic activity within the orogen, with both transtensional and transpressional movements observed in the region. The tectonic system evolved from primarily compressional forces in the early Miocene to a combination of extension and compression by the late Pliocene–Pleistocene. These phases of crustal-scale deformation caused the west-to-east migration of the associated structural and sedimentary features of the chain, foredeep, and foreland [21].
The AOI is predominantly covered by the Sicilide unit, which structurally overlays the Mesozoic–Cenozoic carbonates of the Apenninic Platform and the Lagonegro–Sannio–Molise units. The former (Lazio–Abruzzi and Campania–Lucania units, Figure 2) are exposed only to the southwest of the study area, whereas the latter are extensively exposed and scattered from the northwest to the southeast as tectonic windows across the AOI. Superimposed on these units are top-thrust basins of the Middle Pliocene to late Tortonian and deposits from the Plio-Pleistocene Bradanic foredeep, together with post-orogenic terrestrial deposits and volcanic rocks from Mt. Vulture, which primarily spread along the southeastern boundary of the region. The description of the surface geology across the study area is based on the published structural scheme 1:250.000 by Vezzani et al. [22] (Figure 2).
The subsurface structure has been divided into two levels, allochthonous and autochthonous. Allochthonous includes the Sicilide unit, the Apennine carbonate platform, the Lagonegro-Sannio, Molise basinal units, the top-thrust basins, and the foredeep terrigenous units. Autochthonous refers to the Apulia platform carbonates and evaporites that rest on Permian volcaniclastic deposits (e.g., Puglia 1 well) or carbonate/terrigenous deposits from the Ladinian–Carnian period (e.g., Gargano 1 well). In general, it is an extensively studied area, and various ideas have been published about the compressional involvement of the crystalline basement and the total shortening of the prism, particularly regarding the inner Apulia thrust sheets. Some propose a “thin-skinned” style, with significant shortening in the Apulian carbonate units [23,24]. Conversely, others suggest a “thick-skinned” style and/or a combination of the two styles, with the Apulian basement involved in deformation through ramp-dominated thrust faults [20,21,25,26,27,28,29,30].
This study does not aim to endorse either structural style but seeks to understand the heat transfer mechanism and the temperature anomaly observed in the area and how they are connected to the structures of the buried Apulia platform at specific depths. Therefore, the primary objective is the three-dimensional reconstruction of the deep Apulian platform carbonate structures alongside the thermal anomaly. Nevertheless, the 3D reconstruction of the Apulia platform and the steep dip of the reverse faults, as derived from the re-interpretation and the depth conversion (35–60° depending on the position across the AOI and the fault type), align with previous and recent interpretations published by Shiner et al. [20], Vezzani et al. [22], Ferranti et al. [31,32], Vitale and Ciarcia [33], and Feriozzi et al. [34]. These publications integrate available datasets in the area, including wells, public and confidential seismic profiles, surface geological data, and high-quality data of background seismicity from 2007 to 2020, providing insights into crustal structure from the surface down to a depth of 12 km.

3. Materials and Methods

3.1. Subsurface Data and Interpretation

A total of 165 public and private seismic reflection profiles, covering approximately 2264.8 km (including the regional CROP 04 line), along with 45 wells, have been utilized to reconstruct the structures of Apulia. The sources for these vintage datasets include ViDEPI’s official home page [11], the Geothopica database [12], and private companies that participate in this project, such as G.E Plan srl. and Delta Energy Ltd. Regarding lithostratigraphy information obtained from the same sources, the top of the Apulian platform has primarily been extracted to tie the seismic interpretation. Out of the 45 wells, 33 (as detailed in Table 1) drilled into it, with the majority reaching it at depths between 2000 m and 4000 m (as seen in Table 2). The population and distribution of the data are illustrated on the map in Figure 3.
Before the seismic interpretation, a well-to-seismic tie was carried out using the appropriate module available in Petrel software (v. 2021.2.1, Figure 4). The essential input data required to calculate the acoustic impedance and generate a synthetic seismogram include check-shot surveys, sonic logs, and density logs [35]. In our study area, four wells possessed this complete set of data, and although the density logs only covered the deeper sections of Apulia’s unit, it was sufficient to tie our seismic reflector to time with the well’s stratigraphy in depth (Figure 4). For the allochthonous unit above the Apulia Platform, synthetic densities were calculated using Gardner’s equation [36], with the default suggested parameters of a = 0.3 and m = 0.25. The interpretation of the top Apulia carbonates was based on the analysis of the seismic facies described by other authors regionally [20,29,32] and the calibration of the well-to-seismic tie shown in Figure 4.
In addition to reconstructing Apulia’s carbonates, the following two deeper horizons known from the literature, outcrop, and well data were interpreted: the Triassic Burano formation and the Permian volcaniclastic formation [20,23,24,29] (Figure 4). Interpreting these horizons was challenging, and uncertainties emerged due to the quality and sparse distribution of the 2D vintage seismic profiles and the absence of wells that have drilled these two deeper levels within the AOI. Only one well in the surrounding area of interest, Puglia-1, drilled these intervals and was used to further constrain the structures (Figure 4). These two stratigraphical levels, besides their lithological differences with Apulia’s carbonates, are expected to have differing thermal conductivity properties and consequently affect heat transmission and preservation from the deep heat source up to the top of the carbonate reservoir. Therefore, their rough reconstruction was considered an additional key element to understanding the thermal anomaly observed in the study area.
Eighteen structural blocks of the Apulia platform, separated by fault planes, were interpreted in time. By using Move software (v. IPM 13), a 3D geological model was created by interpolating seismic horizons across the fault network to address gaps in the 2D seismic profiles. This was performed before depth conversion to minimize potential errors.

3.2. Temperature Data

All data concerning the temperature, heat flow, and geothermal potential of the Italian territory were sourced from the official site of the Geothopica project, the Italian geothermal database [12], the Vigor Project [10], the website of the Environmental and Energy Security Ministry [2], and their respective references. This dataset included temperature maps at depths of 1000 m, 2000 m, 3000 m, 4000 m, and 5000 m BGL; surface heat flow maps (both regional and per community); H/C exploration wells with temperature data (corrected and uncorrected); and lithostratigraphic information. The datasets were cross-checked, and in instances where information was contentious, the most recent publication was utilized as a reference. No additional processing was conducted to ensure unbiased correlation with the seismic interpretation and the final three-dimensional structural model. In the case of the well temperature data and the calculation of the thermal gradient at well locations (1D profiles), but also at a regional scale, the authors have taken into consideration the corrected ones, as provided by the Geothopica database [12].

3.3. Velocity Model and Time–Depth Conversion

A macro-layer model with multiple layers was implemented, where each layer represents a relatively uniform geological unit maintaining internal homogeneity. However, a simplified “layer-cake” model consisting of sheets defined by constant velocity values, particularly for the allochthonous level, was found to be inadequate due to the complex nature of the layer’s internal tectonics and variability of facies and lithologies. Therefore, a propagation velocity model was established, allowing the velocity of the layer to vary both laterally and vertically and aligning more closely with local geological peculiarities. To accurately reflect geological reality, depth-dependent variations in instantaneous velocity, check shot surveys, and sonic log records available in the area were taken into consideration.
The velocity function employed for constructing the propagation velocity model was derived from Robein’s recommendation [37], which utilizes the linear interval velocity function corresponding to the mid-depth of a layer, and it is shown as follows:
Vint (Zmid depth) = V0_int + k (Ztop + Zbase)/2
Specifically, the interval velocity and the layer midpoint depth are estimated from well data, using time–depth curves. By performing a linear regression on the Vint = f(MPZ) cross-plot, the parameters V0 and the gradient k are determined, thus defining the pertinent regional velocity function.
This expression provides an alternative to the simplest function of instantaneous velocity, accounting for linear depth variation, compaction, and burial effects over geological time, and it is shown as follows:
Vinst(Z) = V0 + k Z
The model describes the increase in velocity with depth using two parameters, which are V0, the surface velocity, and k, the compaction/burial gradient. For simplicity, kcompaction is assumed to equal kburial, although this may vary due to changes over geological time and lateral differences [37].
In total, 45 well points were used for the velocity model. The wells were subdivided into three categories based on the accessible data, which were used for the construction of the time–depth curve at the specific point. In the study area and the surroundings, four (4) check-shots surveys were available (accompanied with the sonic logs, which have been calibrated), along with eleven (11) sonic logs (uncalibrated). In order to create a homogeneously distributed map covering the study area, thirty (30) well points were added, even though we did not have the required information to directly construct a time–depth relationship (no check-shots or sonic log). For this reason, an approximation of this curve at this position was designed by using information from the other well points. To select the proper dataset at these points, the following specific criteria were used: the lithostratigraphy as was described in the composite logs provided by the Videpi project and the Geothopica database [11,12], the drilled thickness of the units, and in certain cases, the seismic character in combination with the log responses. A full list of wells used in the propagation velocity model is available in Supplementary Material S1.
The geometry of the “layer-cake” model was founded on the following four regional horizons: (a) the topography from the Tinitaly website [38] of 10 m resolution (gray solid line in Figure 4), (b) the top of the Apulia platform (light blue solid line in Figure 4), (c) the top of the Triassic Burano formation (light green solid line in Figure 4), and (d) the top of the Permian volcaniclastic deposits (red solid line Figure 4). For the three regional horizons result from the seismic interpretation, different input parameters were used for the velocity model depending on the availability and the analysis of the well data. Using Petrel Software (v. 2021.2.1), the model was shaped, allowing input parameters as functions or constants, corrected at well positions by including lithostratigraphic surface tops from composite logs [11,12].

3.3.1. Allochthonous Input Parameters

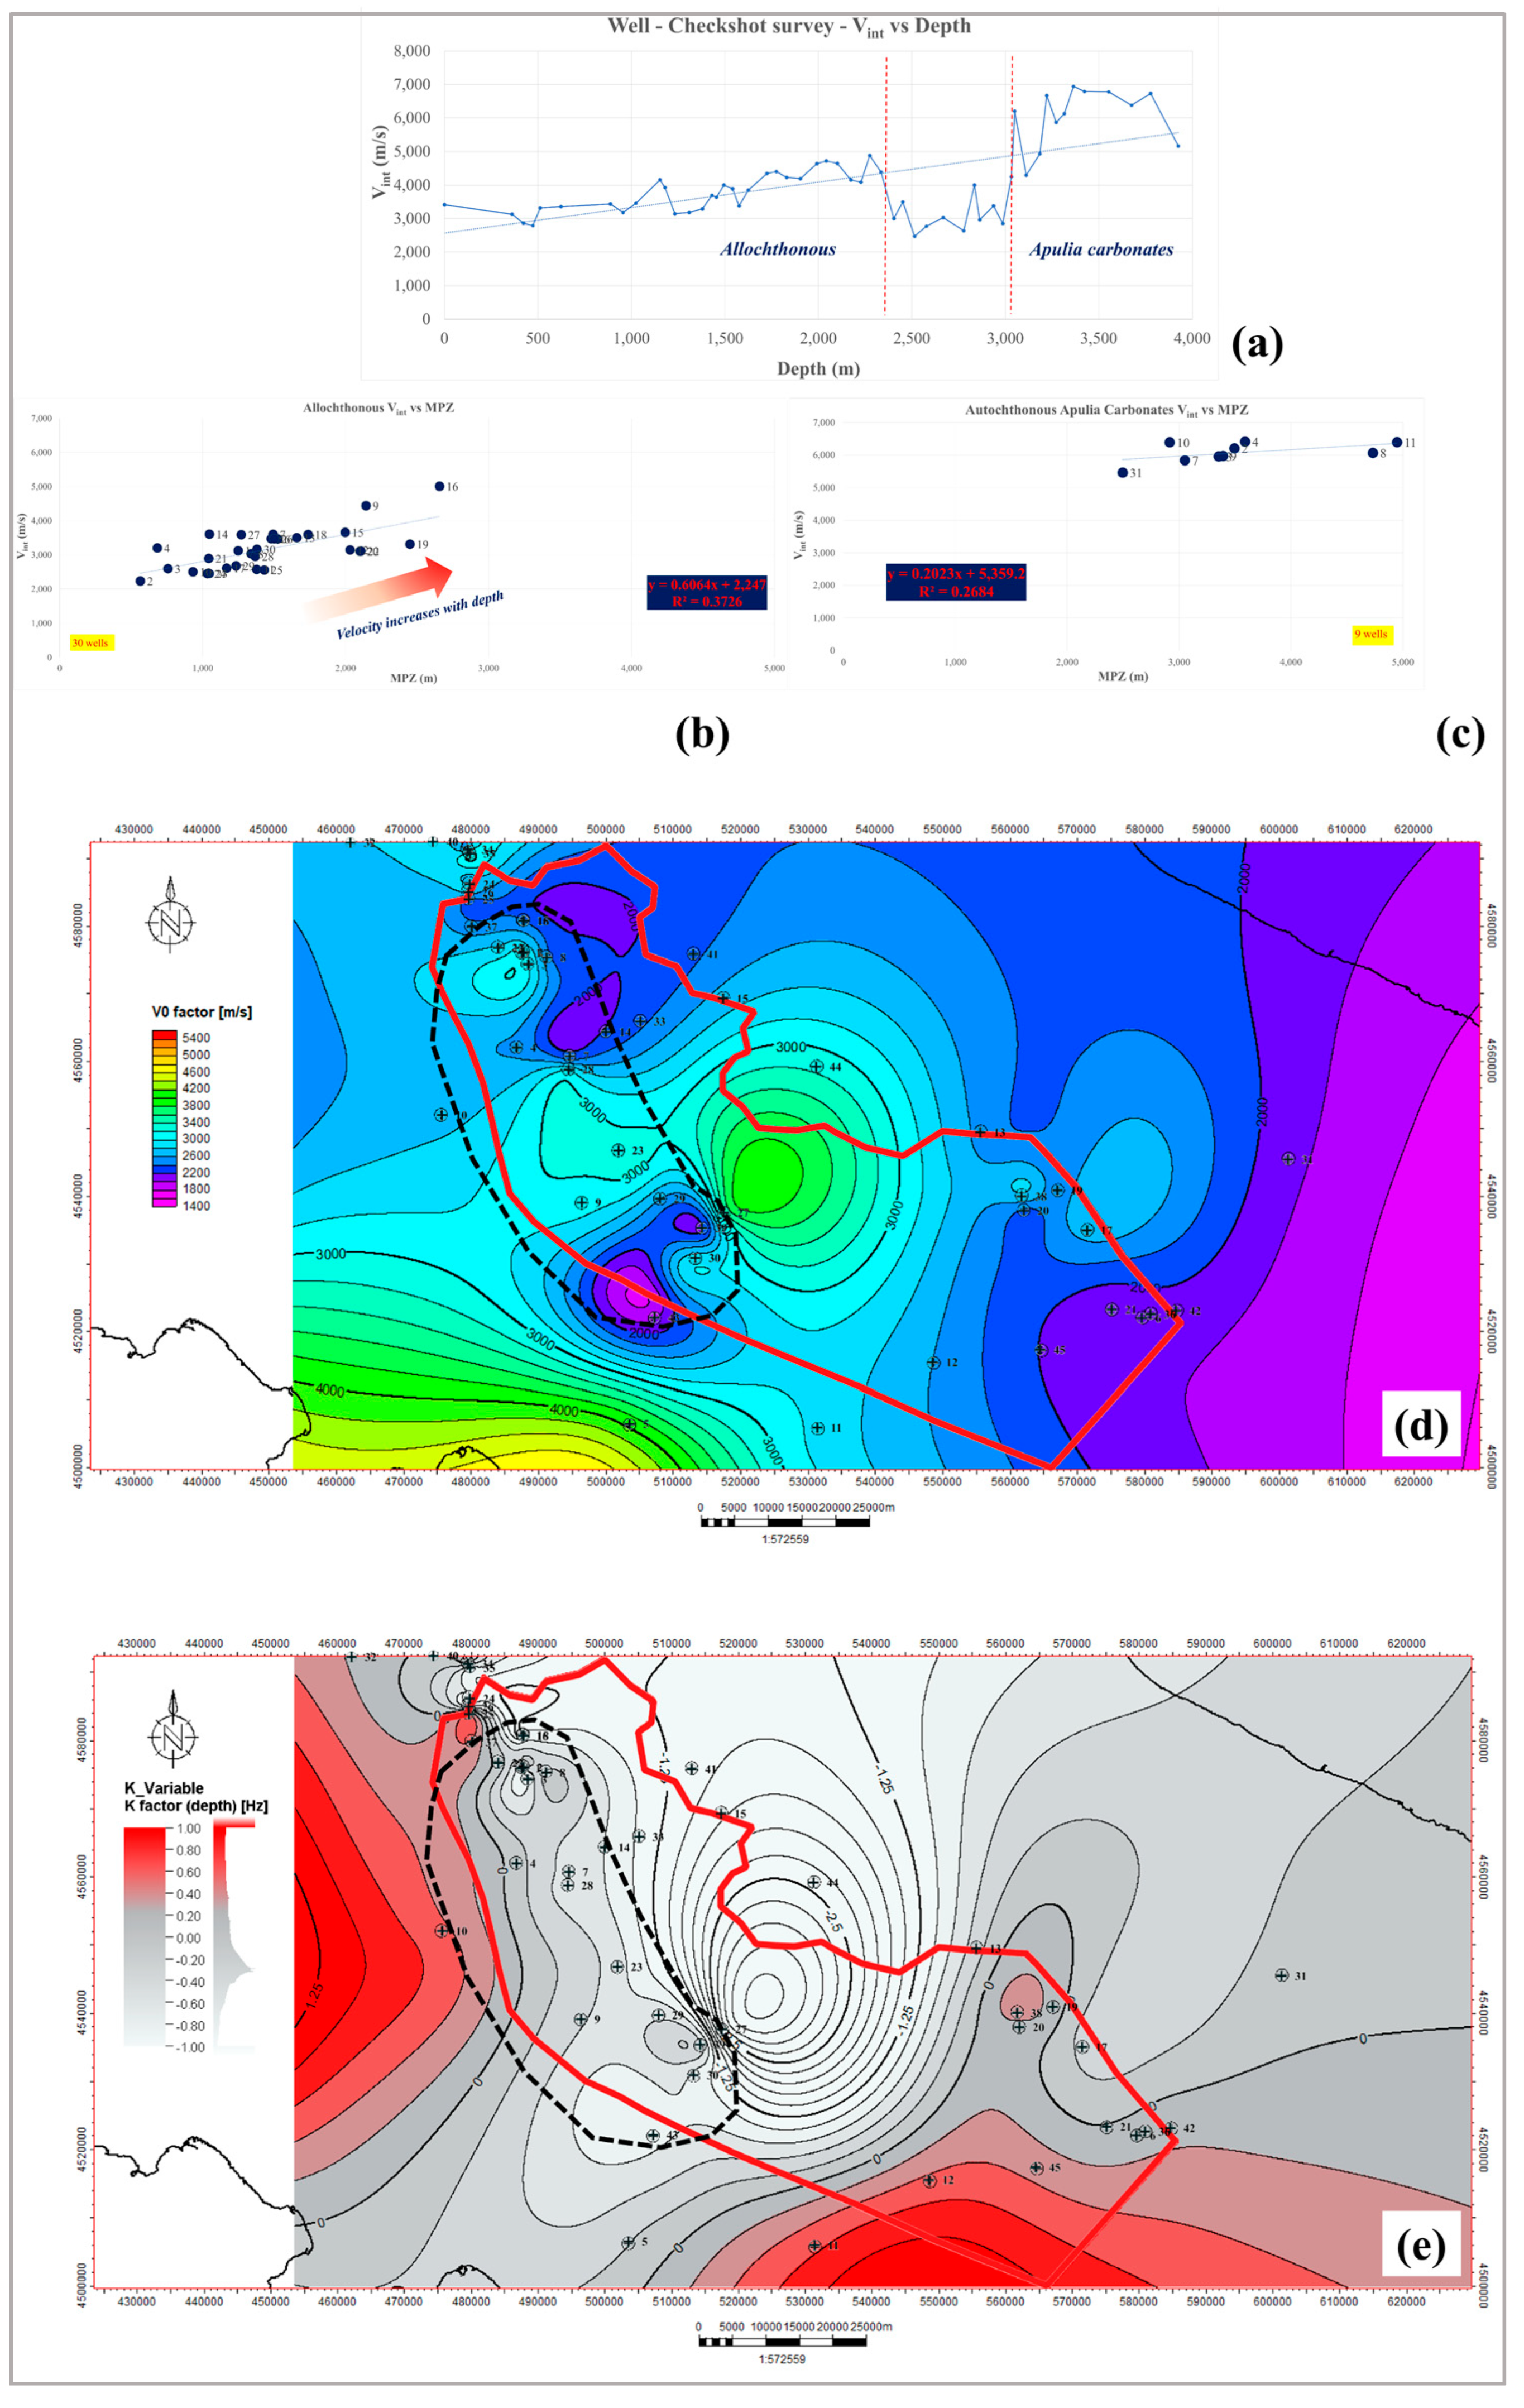
For the determination of the regional velocity function related to the allochthonous level, 30 out of 45 well points were used. The interval velocity and the midpoint Z (MPZ) were calculated, and the results were cross plotted to define the V0 and gradient k parameters. Despite this, it was not possible to establish a regional velocity function with an acceptable error margin (R2 = 0.37, Figure 5), even though the interval velocity of the wells increases with depth (Figure 5).
Several factors could account for this preliminary result, primarily the lithological variability across and within the unit (comprising the Apennine carbonate platform, Lagonegro–Molise basin units, top-thrust basins, and siliciclastic foredeep deposits). This variability affects the V0 value laterally and influences the gradient k at depth. A characteristic interval velocity inversion observed in specific check-shot surveys and sonic logs between the allochthonous unit and the autochthonous Apulia carbonates impacts the calculation of the gradient k at well points (Figure 5). Additionally, the total drilled thickness of the allochthonous unit in cases of shallow wells did not yield efficient results at specific points across the AOI, further influencing the computation of the k-factor.
The interval velocity was calculated by constructing a V0 map (Figure 5) and a k-factor map (Figure 5), derived from the time–depth curves of the well points within the AOI. Upon analyzing these maps with respect to the k-factor value distribution, it was noted that the variability was minimal compared to the V0 values (Figure 5). Consequently, a constant value of k = 0.39 (Figure 5) was adopted, representing the mean of its Gaussian distribution and a suitable value for the region where the temperature anomaly is observed (black dashed polygon, shown in Figure 5). Furthermore, it was observed that the available well dataset (number of well points, interval thickness, etc.) was insufficient to accurately determine the k-factor for each position, and combinations of extrapolated k and V0 values away from the wells resulted in nonsensical outcomes (Figure 5).

3.3.2. Autochthonous Input Parameters

The autochthonous Apulia unit has been subdivided into the following three layers: the platform carbonates, the Triassic dolomites and evaporites (Burano formation), and the Permian volcaniclastic deposits. In each sheet, different input parameters have been applied in the final “layer-cake” velocity model depending on data availability and limitations.
For the Apulia platform carbonates, only nine wells were available to construct the propagation velocity model. For this reason, even if the dataset’s quality was sufficient to produce reasonable results, the linear regression least square error was not that high (R2 = 0.27). This value is mainly due to the low number of points and also to the fact that some of the wells drilled the carbonates for a few tens of meters only. The final linear velocity function yielded a V0 parameter of 5400 m/s and a k-factor of 0.2 (see Figure 5).
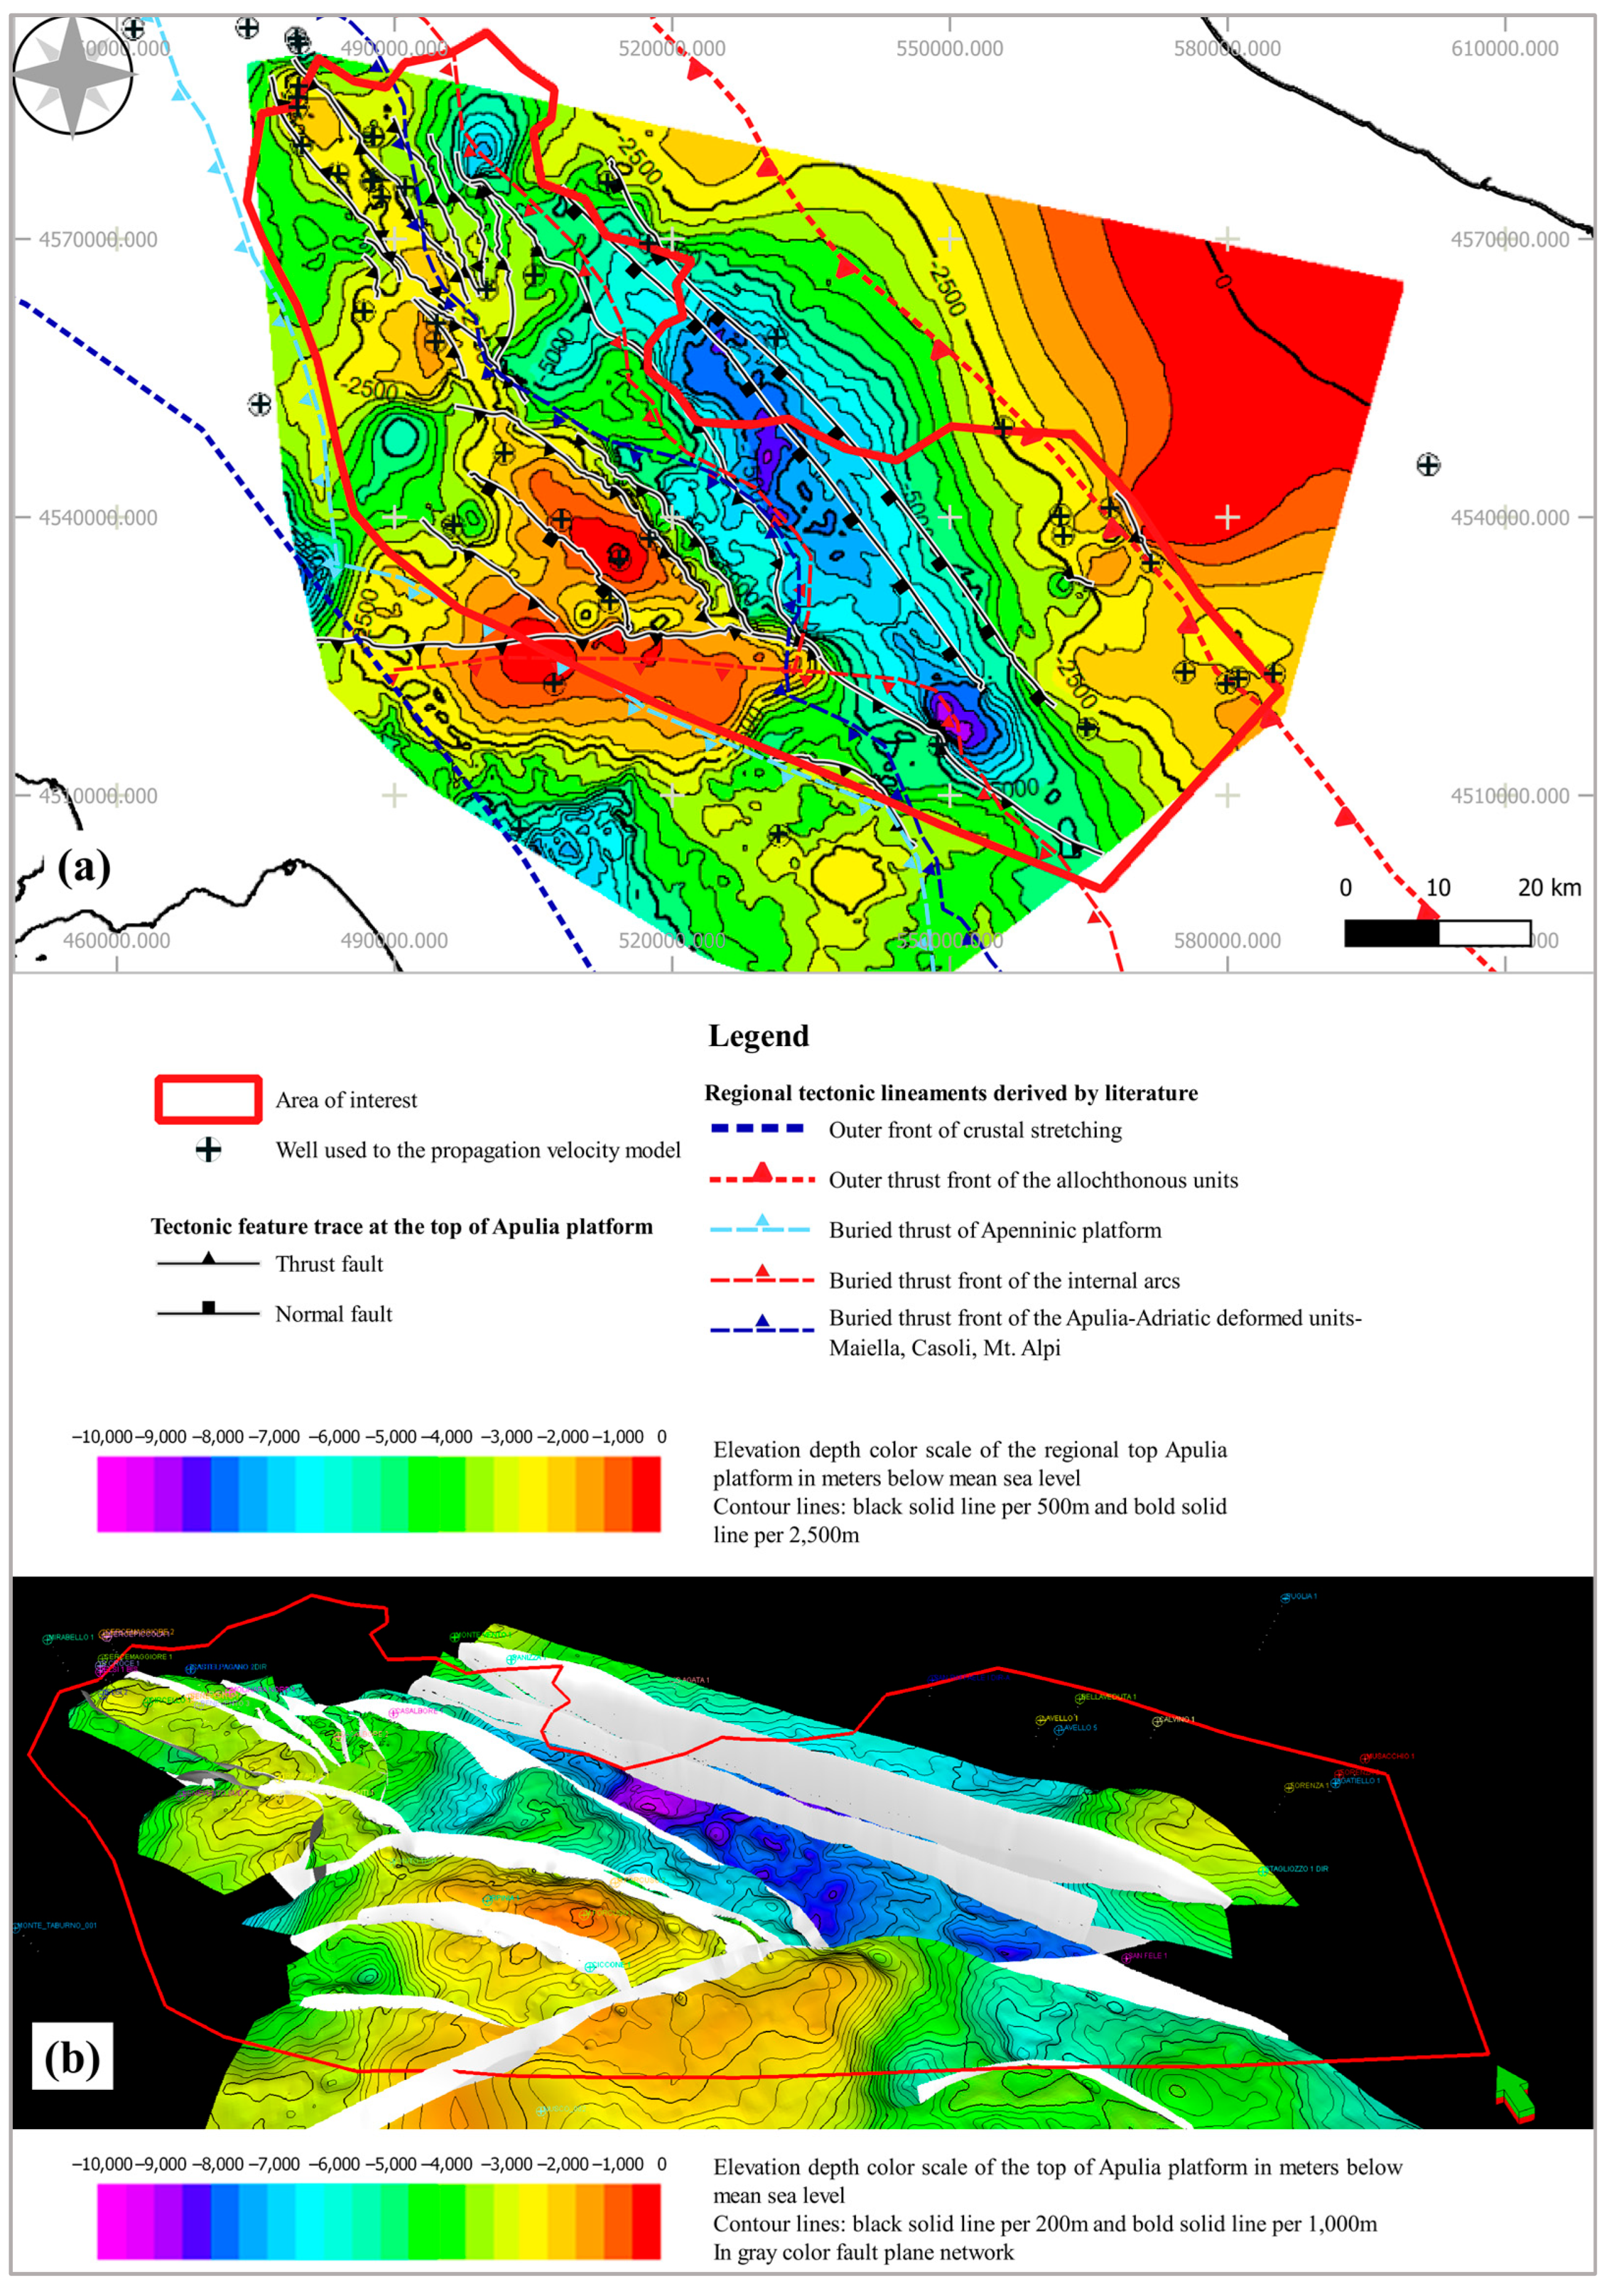
Due to data limitations for the Triassic layer and the Permian layer, constant values of 6800 m/s and 5200 m/s, respectively, were used, representing the calculated interval velocity derived from the only well in the surrounding area that drilled these two intervals, the Puglia 1 well (uncalibrated sonic log). A summary table of the velocity model input parameters for each given layer is shown in Table 3. Figure 6 shows the depth-converted TWT regional horizons and structural blocks of the Apulia platform, including interpreted faults. The fault network is shown in gray, and the structure contour map indicates the top of the Apulia carbonates.

4. Results

4.1. 3D Geological Model

The 2D subsurface interpretation led to a 3D geological model in time, converted to depth using the velocity model from Section 3.3. The final 3D depth model includes three main regional horizons of the Apulian unit (tied and constrained at well locations) and a network of thrust, back-thrust, and normal faults inherited from the tectonic evolution from the early Miocene to the late-Pliocene–Pleistocene. The three regional surfaces are (a) the top of the Apulia carbonates, (b) Triassic dolomites and evaporites (Burano formation), and (c) Permian volcaniclastic deposits. This paper primarily focuses on the Apulia carbonates, the host reservoir of the area’s thermal anomaly.
The regional top Apulia carbonate surface (Figure 6) covers an area of almost 8579 km2, and it is a result of an integration of public and confidential data with the abundant literature; it generally confirms the tectonic complexity of the subsurface in the region, as has been studied and analyzed by various authors over the decades since the 1980s [21,22,25,29,32,39,40,41].
To the north, the surface is roughly bounded by the lateral ramp of the northern arc front [29] and the buried thrust front of the Apulia–Adriatic deformed units, including Maeilla, Casoli, and Mt Alpi [22]. On the western side, the borders are near the buried thrust of the Apenninic platform [21,22,29] and the current extensional front [17,31,32]. The southern boundary features the lateral ramp and major thrust fault, distinguishing the northern sector from the central arc of the thrust belt [29]. To the east, the surface extends to the Apulia foreland, tracing the external thrust front of the allochthonous units [22,25,29,39,40,42] which practically defines the edge between the external buried thrust fold belt and the marginal domain [21] of the Bradano trough–foredeep and the Apulia ridge–foreland [20,21,43,44].
The elevation depths (Figure 6) indicate the fault structures, including their distribution and orientation, and the overall geometries of the subsurface at both local and large scales in the region. The deepest zones, at −8500 m (MSL, purple areas), are concentrated toward the central and southeastern portions of the map, forming trough-like shapes and representing part of the outer fold and thrust belt. These areas indicate subsiding regions or deeper fault blocks. In contrast, the most elevated structural blocks or plateaus (yellow–orange–red areas) are located along the northeastern boundary of the mapped area towards the Adriatic–Apulia foreland and the southwestern part of the study area, specifically the internal arc of Benevento–Monte Forcuso highs [22,29].
The AOI (Figure 6) lies between the buried Apenninic Platform thrust front trace [21,29,43,45] and the external thrust front of the buried Apenninic thrust sheets and frontal ramp [21,29,43]. The 2D and 3D visualizations of the top Apulia platform (Figure 6) highlight distinct tectonic blocks and their bounding faults. The subsurface exhibits primarily NW-SE trending thrust and back-thrust faults, along with normal faults in the same direction. The final 3D structural model integrates results from various fields and publications, including gravity, magnetics, seismicity distribution, earthquake focal mechanisms, strain rates, and present-day deformation [31,32,43,46,47,48,49,50] (Supplementary Material S2, Figures S5–S16). This integration led to the subdivision of the subsurface into the following four major structural blocks: two inner blocks A and B, the external block C at their footwall, and the foreland block D (Figure 6).
The inner structural block A, shown in purple in Figure 6, is in the southern region of the AOI. This moderately deep area is primarily affected by thrust faults TF5 and TF4 (Figure 6), which have a W-E to NW-SE orientation and average dips of 35−45°. The depth ranges from −4000 to −1000 m (MSL). The most pronounced culmination in this block aligns W-E to NW-SE and is controlled by the major regional thrust front TF4. This thrust front separates the northern arc from the central sector and divides the internal domain within the AOI into two blocks, A and B.
Block B, located in the southwest region of the AOI and shown in pink (Figure 6), is an intermediate to shallow structural block (−4000 to 0 m from MSL), shallower than blocks A and C. It is bounded by thrust faults TF16 and TF17 (average dip 48–50°) and influenced by the current extensional regime [31,51,52]. A recent normal fault (NF1, average dip 40°) cuts through its center, causing tilting and vertical displacement. The orientation of the tectonic features generally trends in a NW-SE direction, while the most outstanding culmination Monte Forcuso and thrust-related fold at the eastern part of the block follows the general orientation of the fault elements. The geometry of normal fault NF1, based on seismic interpretation (Figure 4), aligns with the literature [17] (Supplementary Material S2, Figure S4). At this orographic division, normal faults display listric geometry and, at depth dip, decrease till they merge with the Late Triassic Burano anhydrites’ basal detachment horizon.
Block C is situated in the northwestern and central part of the AOI, shown in orange (Figure 6). It lies at the footwall of the two internal blocks A and B, with depth variations from −5000 to −1500 m (MSL). This external district is considered the most intricate division from a structural point of view, since its configuration is characterized by a stack of thrust sheets controlled mainly by two major thrust faults, TF6 and TF7a (Figure 6). Thrust (TF8, TF9, TF10, TF11, TF12, TF15, Figure 6) and back-thrust faults (a main with two segments, BTF13, BTF14, Figure 6) were interpreted with dips ranging from 45° to 50°. Their general orientation is NW-SE; however, there are cases of thrust faults, such as TF10 and TF11, that deviate from this direction and present a N-S trend, forming lateral/oblique ramps and developing consequently arc-shaped geometries inside the internal part of the block. Both back-thrust surfaces (BTF13 and BTF14), as have been understood, primarily affect the Apulia platform’s top, causing local uplift without significantly impacting the deeper layers (Triassic and Permian intervals).
Two noticeable culminations are located at the western and central part of this external domain. The first is mainly controlled by the thrust fault TF8 and trends NW-SE, following the orientation of the major thrust TF7, while the second is constrained between the thrust fault TF15 and the back-thrust BTF14 and is oriented along the same direction of the faults. The latter case appears to have two thrust-related folds, along the strike, one to the northwest part of the overall structure and the other to the southeast, and they are separated by a small-scale depression area. Regarding the interpretation of the northwestern part and the northern culmination, there is a possibility that it is part of another separate structure, as has been suggested by Nicolai and Gambini [29], but due to the lack of enough seismic data, it was not possible to confirm it. Pressure data from Ielsi 001 Bis well (only a single data point, Composite log) [11] indicate that this well possibly belongs to a different pressure regime than that of the wells towards the south (Circello 1, Benevento 2 and 3 wells). Additionally, it should be noted that less pronounced thrust-related highs of northwest-to-southeast trending are present at the subsiding blocks too, yet they appear to be discontinuous due to the existence of small and narrow low areas across the same longitudinal section.
Domain D, shown in green (Figure 6), extends northeast within the AOI and contains the study area’s deepest parts. The transition from the external domain C to the marginal domain and Apulia’s foreland reveals depth variations from −8000 to −1500 m (MSL). On the depth structural map (Figure 6), even deeper areas are presented in light purple color at the southeast, but they are considered an artifact result attributed to the limitations of the velocity model at the tip of the thrust faults (i.e., TF4). From the southwest to the northeast, the autochthonous Apulia unit gradually inclines towards the foreland and the Murge region, where it finally outcrops. High-angle normal faults were interpreted at positions where steep marginal scarps were evident; however, their lateral extension and continuity, as presented within the AOI (Figure 6), are a result of the simplification of the various interpretations provided by the literature [21,29].
Overall, the new 3D reconstructed model confirms the intricate structural evolution of the region, shaped by thrusting, extension, and subsidence, and it integrates multiple datasets to enhance understanding of the Apulia carbonate reservoir and its broader tectonic setting. The subsurface Apulian structures are subdivided into four major blocks, (A, B, C, and D). The main scientific interest of this paper is mainly restricted to the regions where the thermal anomaly has been mapped and is associated with two of them, the internal B block and the external C block (Figure 7).

4.2. Comparison with Published Temperature, Surface Heat Flow Maps, and Deep Well Temperature Data

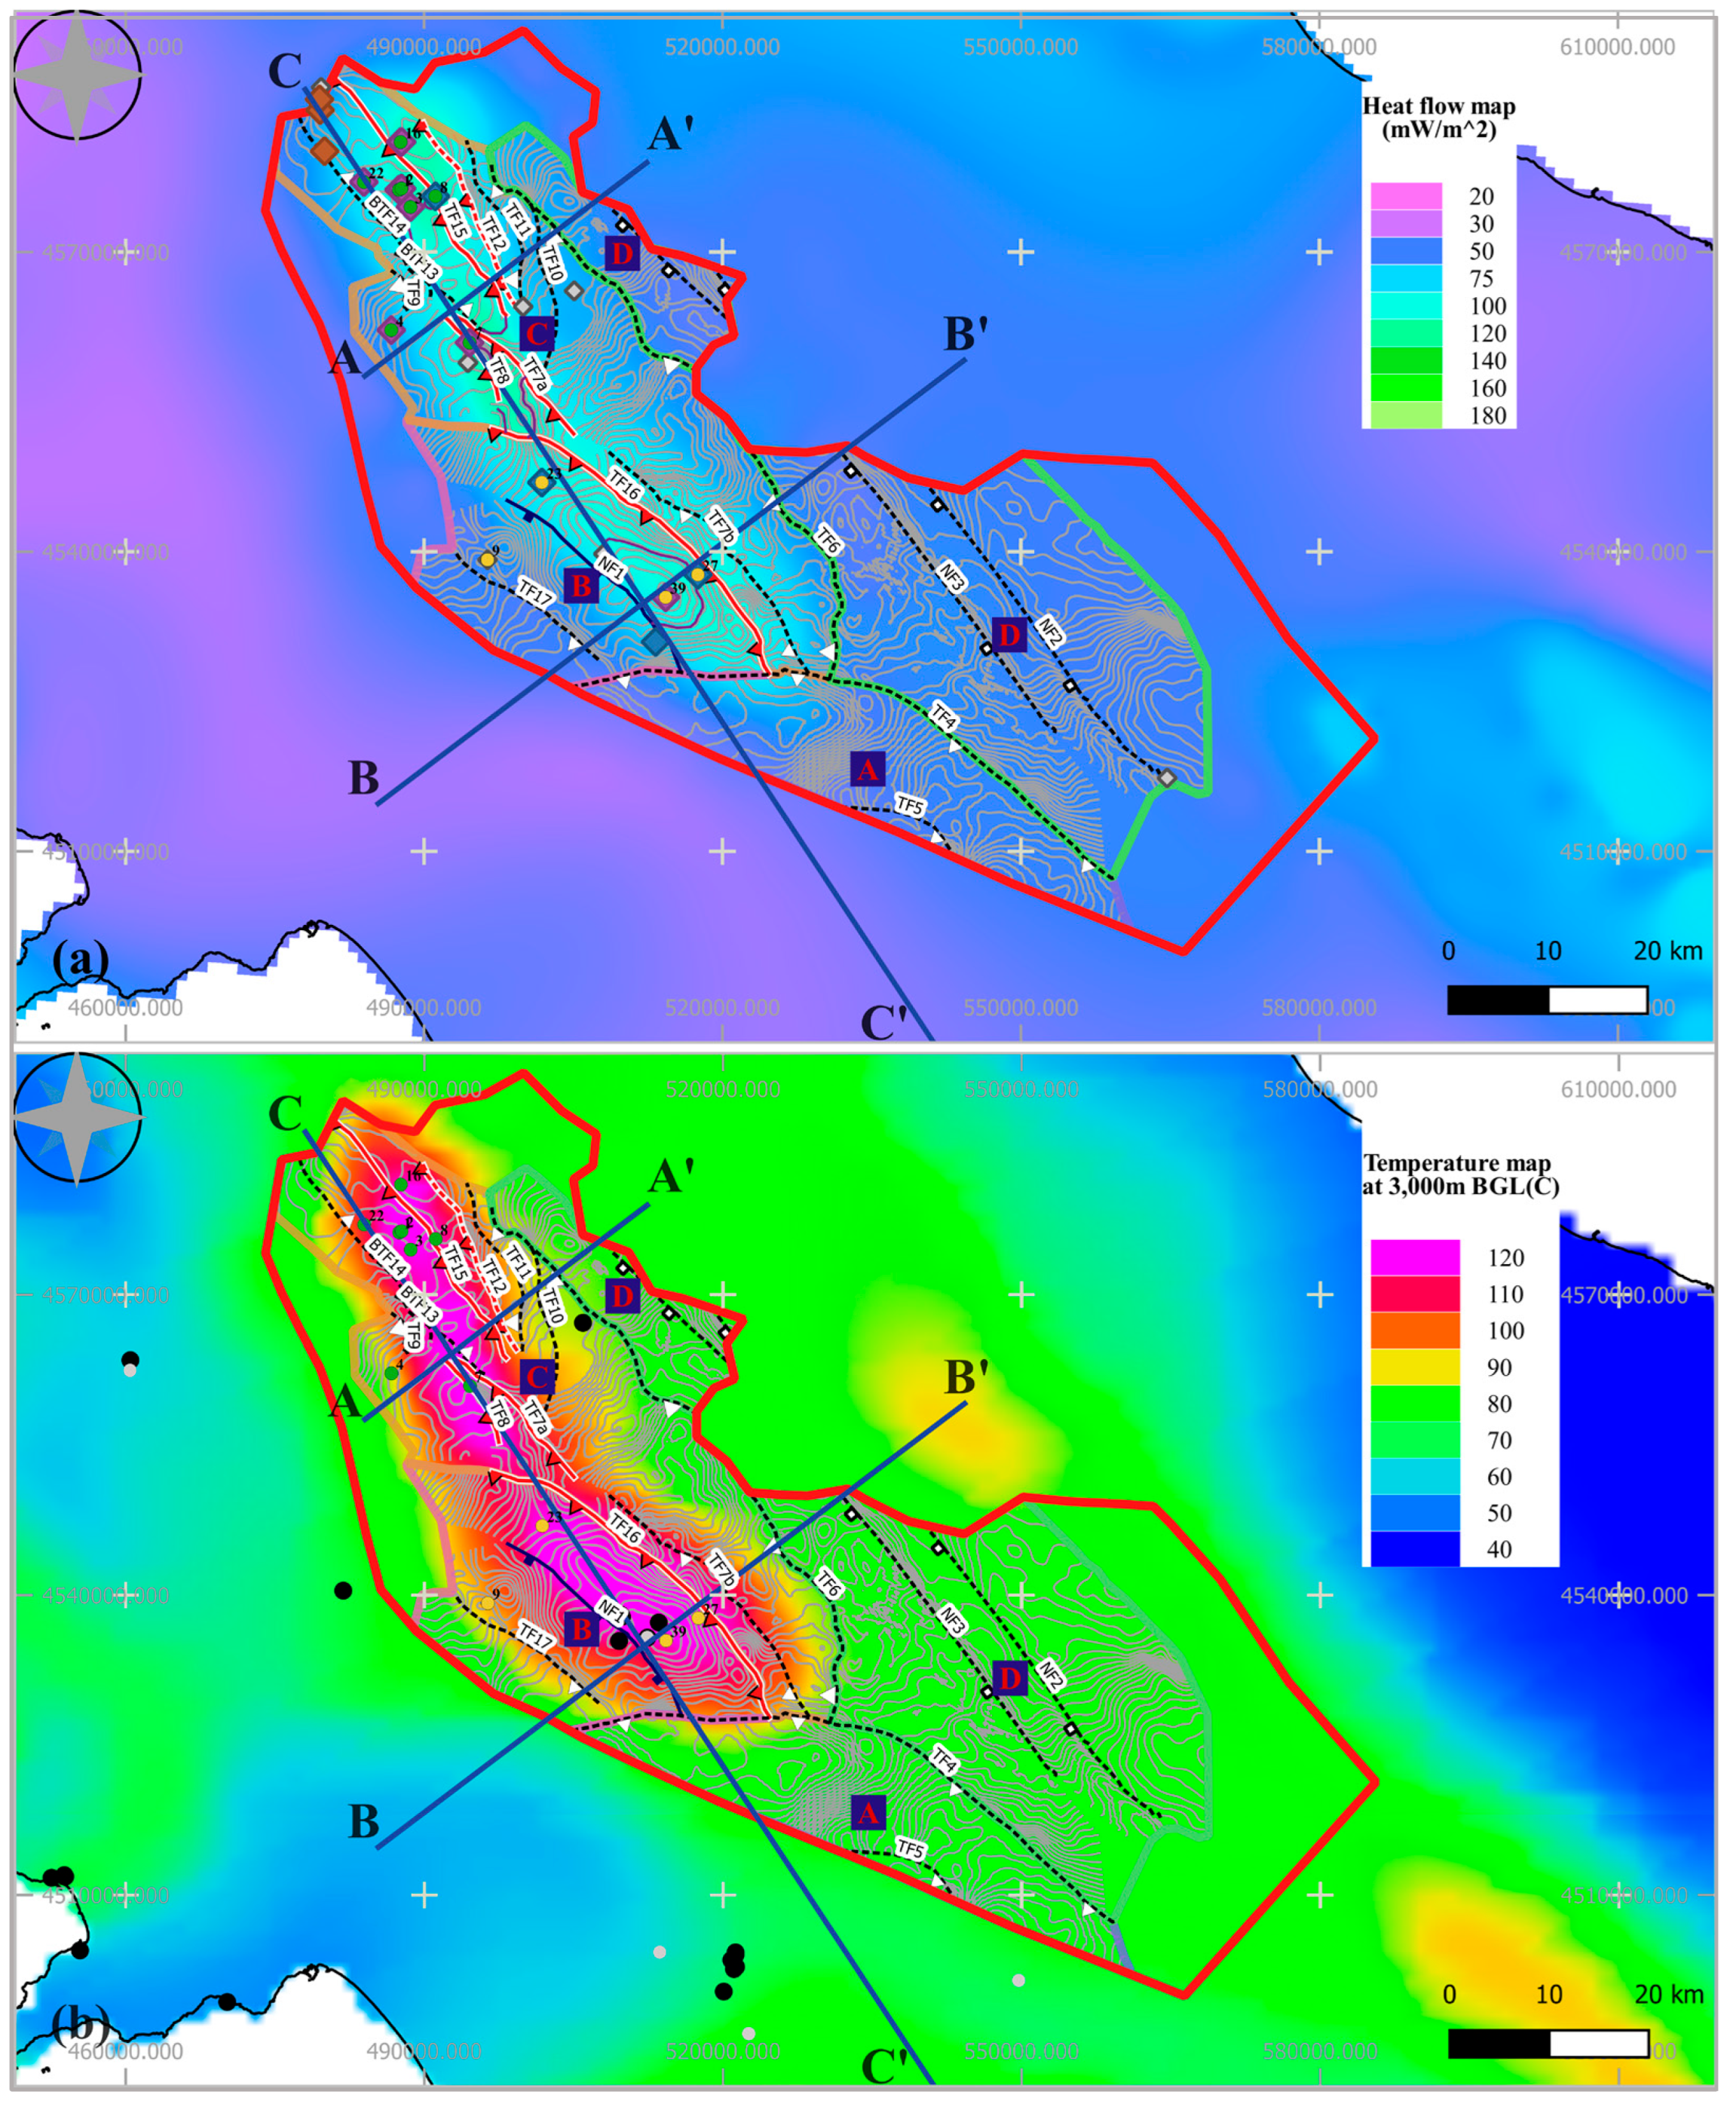
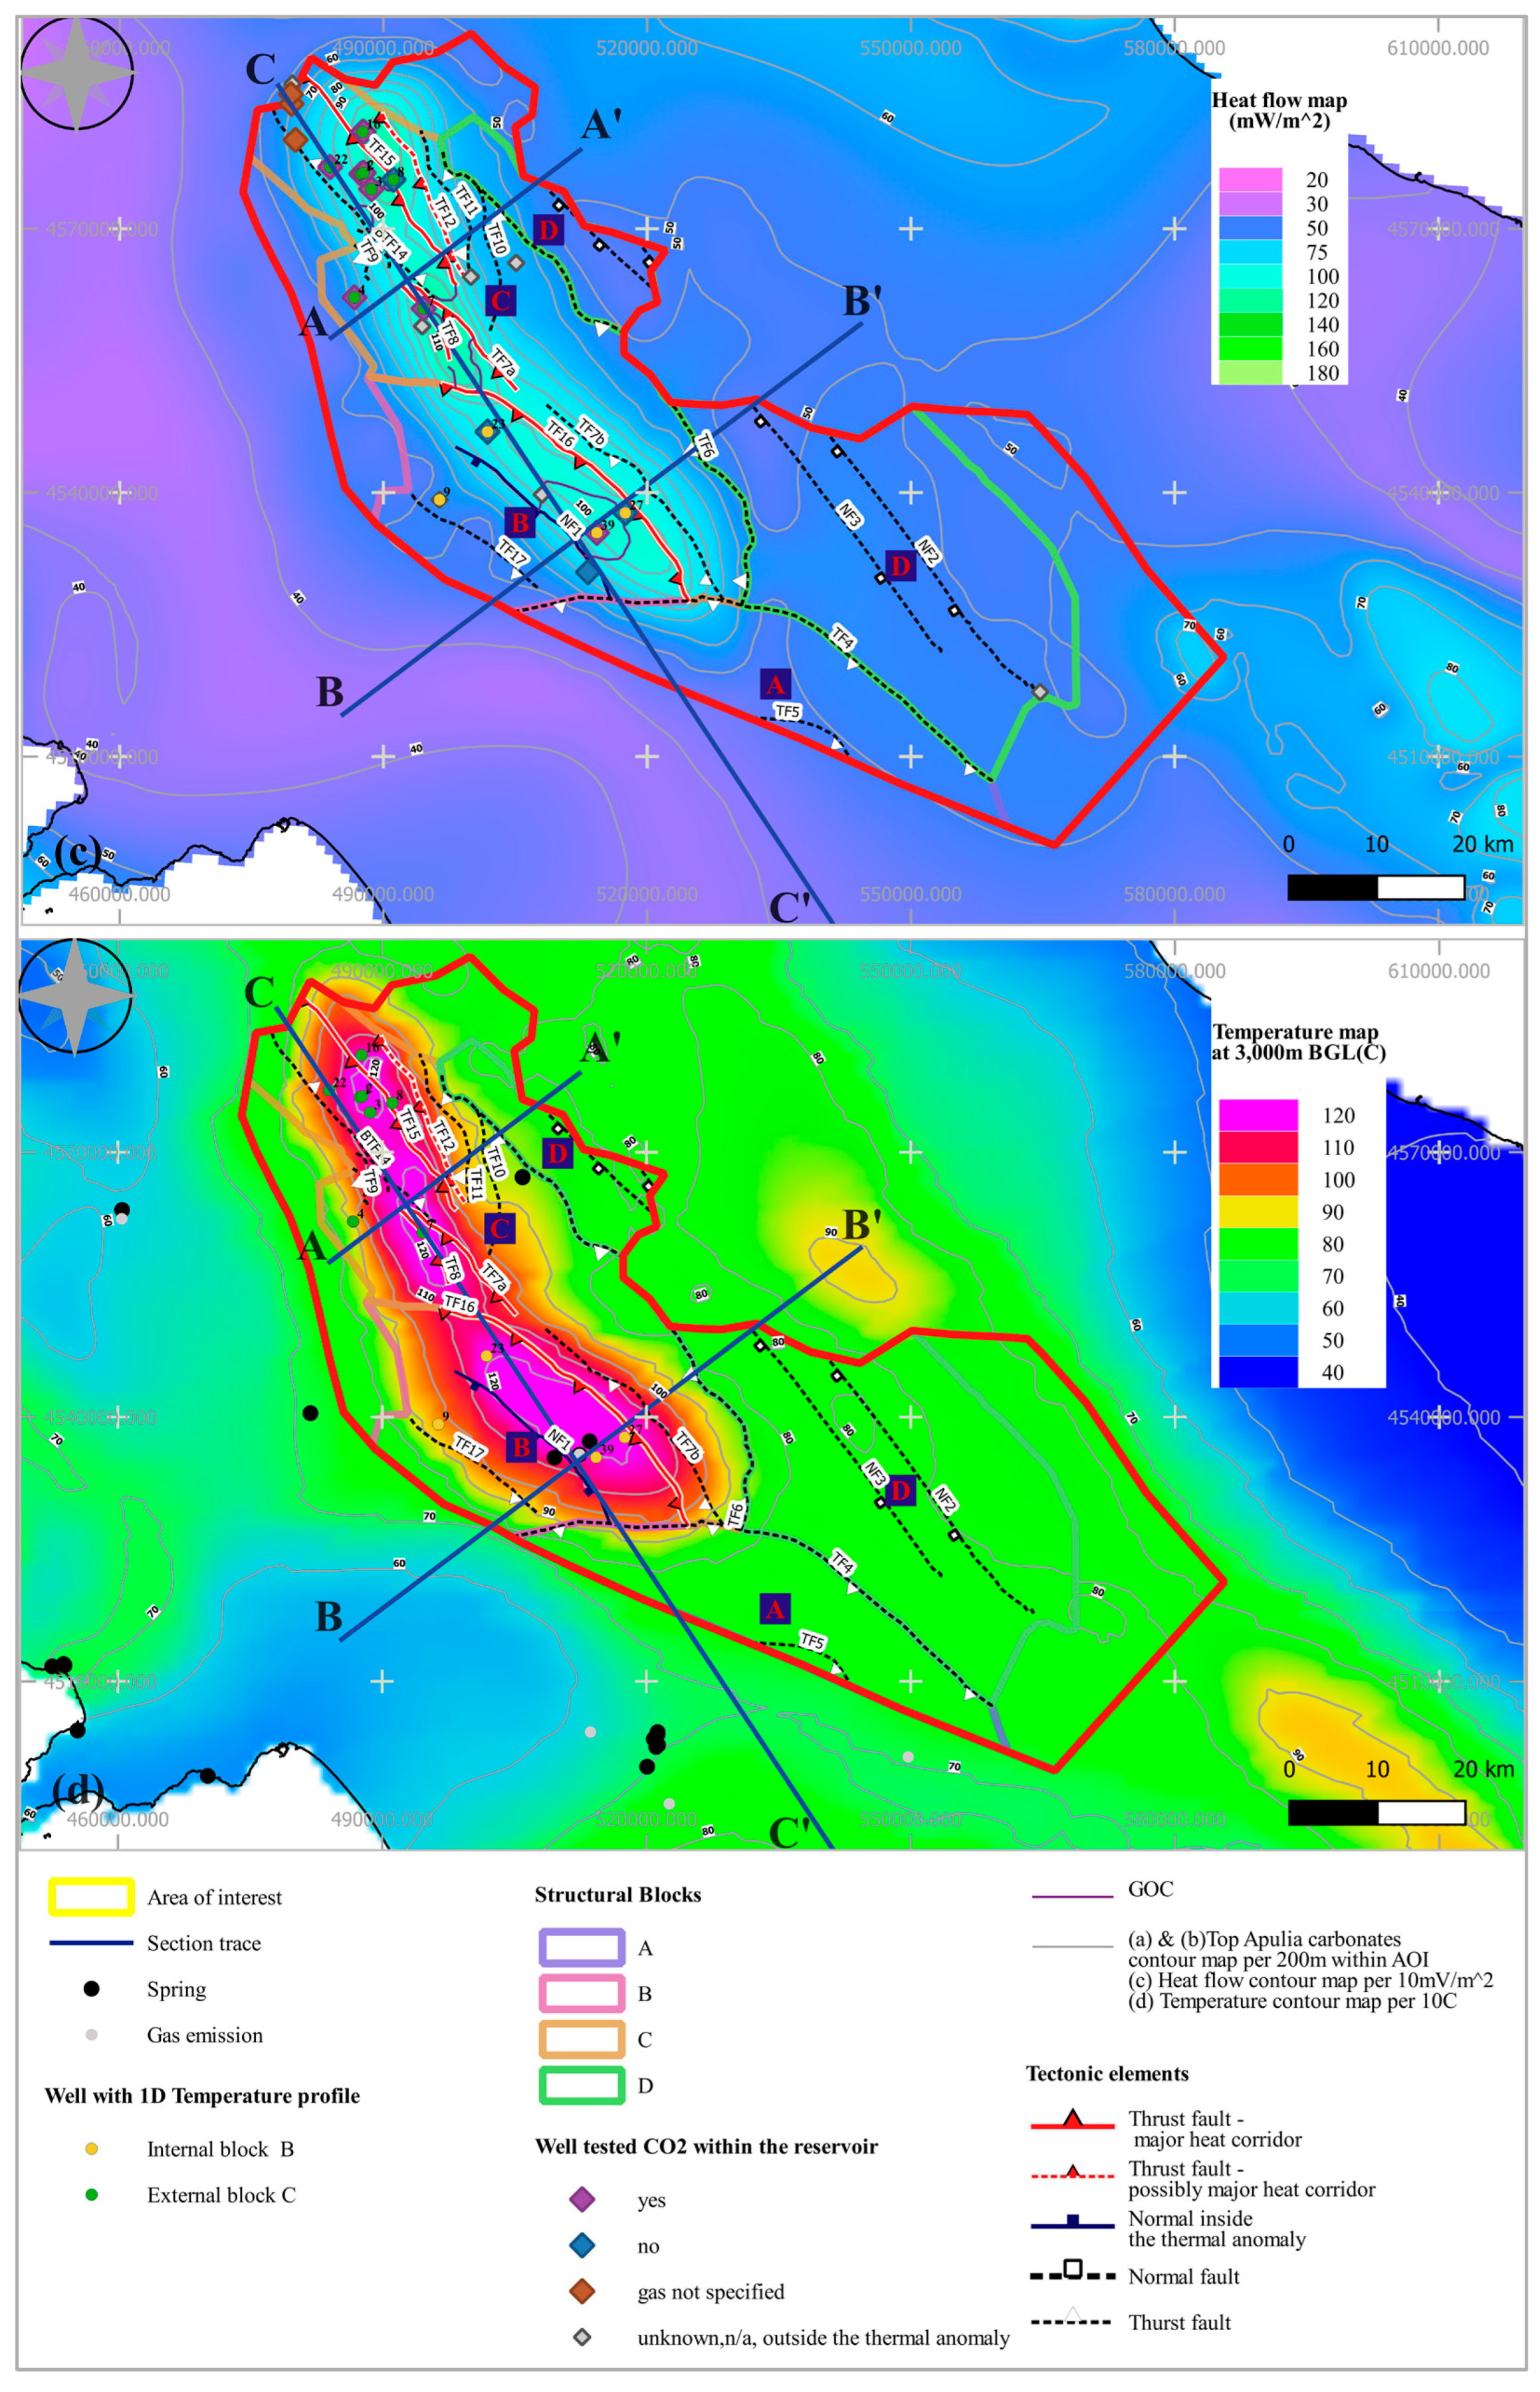
Within the AOI, a positive temperature anomaly (temperature higher than 90 °C, Figure 7 and Supplementary Material S2, Figure S2) has been detected and mapped [8,9] at 3000 m BGL, while recent national studies related to geothermal potential confirmed the presence of this thermal anomaly [2]. It is located at the northwestern part of the AOI and, as mentioned in Section 4.1, exclusively occupies the two major structural blocks, B and C (Figure 7 and Supplementary Material S2, Figure S2). Geometrically, based on the latest map published by the Ministry of Environmental and Energy [2], it exhibits an elongation that manifests an N-S orientation and then changes slightly to an NW-SE trend (Figure 7 and Supplementary Material S2, Figure S2).
According to this observation, the surface heat flow map (Figure 7 and Supplementary Material S2, Figure S1), also presents an anomaly (higher than 80 mW/m2 and less than 115 mW/m2) of two different trends N-S and NW-SE following a similar segmentation to the temperature map. The two branches vary in terms of size and lateral extension in both maps. In the temperature map, the northern branch spans a narrow area along the dip, covering approximately 565.4 km2, while the southern branch is broader and more expansive, encompassing roughly 651.5 km2. Regarding the surface heat flow map, the northern part covers an area of about 370 km2, whereas the southern component of the anomaly extends over a wider area of 396 km2. Notably, the highest heat flow values, exceeding 110 mW/m2, are observed exclusively in the northern region.
The superposition of Apulia’s fault network on both maps, temperature at 3 km depth (BGL) and heat flow, reveals a strong relationship between these elements. In detail, starting with the temperature (Figure 7 and Supplementary Material S2, Figure S2), the major thrust fault TF4 bounds and clearly constrains the anomaly to the south, while the change of the anomaly’s orientation coincides with the switch from the inner domain, B, to the external domain, C, and the presence of the TF16. Additionally, the faults related to block B (TF16, NF1, TF17) reveal a good match with the anomaly, showing an alignment mainly with orientation and secondary with its extent locally. The tectonic features within external block C also show a satisfying match. Especially the Apulian faults, TF6, TF7b, TF10, TF11, and TF12, despite not intersecting the temperature map at 3 km depth (BLG), based on their 3D geometry at the subsurface, they do have a good fit with the NW-SE and N-S orientation and the comprehensible boundaries of the anomaly. The major NW-SE oriented thrust fault TF6 (boundary between the external B block and the foreland domain D) regionally encloses the anomaly with precisely its northern and southern limits to bound it clearly, while the central area of the anomaly becomes more constrained by other faults such as TF7a and TF7b. Unfortunately, the comparison with temperature maps at deeper levels (4 km BGL or 5 km BGL), as provided by the Vigor project and Geothopica database [10,12], was not feasible because they were lacking the resolution needed for this type of operation. Finally, based on their 3D geometry at the subsurface, specific faults from the network, TF7a, TF8, TF15, and BTF14, meet the temperature map at 3 km (BGL), while their traces intersect the 120 °C temperature contour line and concur with the region where the maximum temperature values are observed within the blocks.
Alongside the preceding correlation, a comparison was conducted between Apulia’s anticlinal features (thrust folds and culminations) and the spatial distribution of temperature (Figure 7 and Supplementary Material S2, Figure S2). In block B, the predominant Monte Forcuso culmination [29] aligns geometrically with the temperature anomaly, particularly the 120 °C contour line, while moving from northeast to southwest, the temperature gradually decreases following the downfaulted segment (NF1’s hanging wall). Conversely, in block C, a more complex relationship exists between the anticlinal features and the maximum temperatures. The culmination controlled by TF8 appears to be correlated with high temperatures in the area, especially around the 120 °C contour line, though not geometrically aligned. Instead of following the structural configuration, the contour line shifts toward the dense fault network and the stack of thrust sheets predominantly influenced by thrust faults TF8, TF9, TF15, and BT14. Similar observations are noted along the culmination governed by TF15 and BT14 faults. Despite the NW-SE orientation of the culmination, the N-S oriented shape of the 120 °C contour line persists, indicating high temperatures across certain sections, such as the southeast thrust-related fold and the central relatively low area (Benevento 1, 2, and 3 area). The temperature anomaly trend remains primarily N-S, following the fault network pattern (TF12, TF11, TF10), excluding the northwest part of the culmination where the temperature distinctly declines. As mentioned in Section 4.1, this part shows differentiations also in the pressure regime compared to the south and, most likely, is another and has its own pressure and thermal regime.
The heat flow map, in relation to the 3D Apulian structural map (Figure 7 and Supplementary Material S2, Figure S1), shows that the heat flow anomaly aligns closely with fault patterns compared to the structural contour map and the anticlinal features observed in both internal and external domains B and C, respectively. Specifically, in block B, the shape of the heat flow contour line 100 mW/m2 is in perfect agreement with the NW-SE oriented thrust fault trace TF16, while an NE shift of the heat flow maximum, bringing it closer to the fault traces of TF16 and TF7b of the footwalls’ (block C), is evident opposed to the temperature distribution where the maximum temperature values are more homogeneously distributed within the M. Forcuso culmination and throughout block B, following its structural configuration. In the northern block C, the high heat flow values (>110 mW/m2) correlate with the dense fault network and its patterns rather than the structural contour map, where the two elements demonstrate an arbitrary correlation.
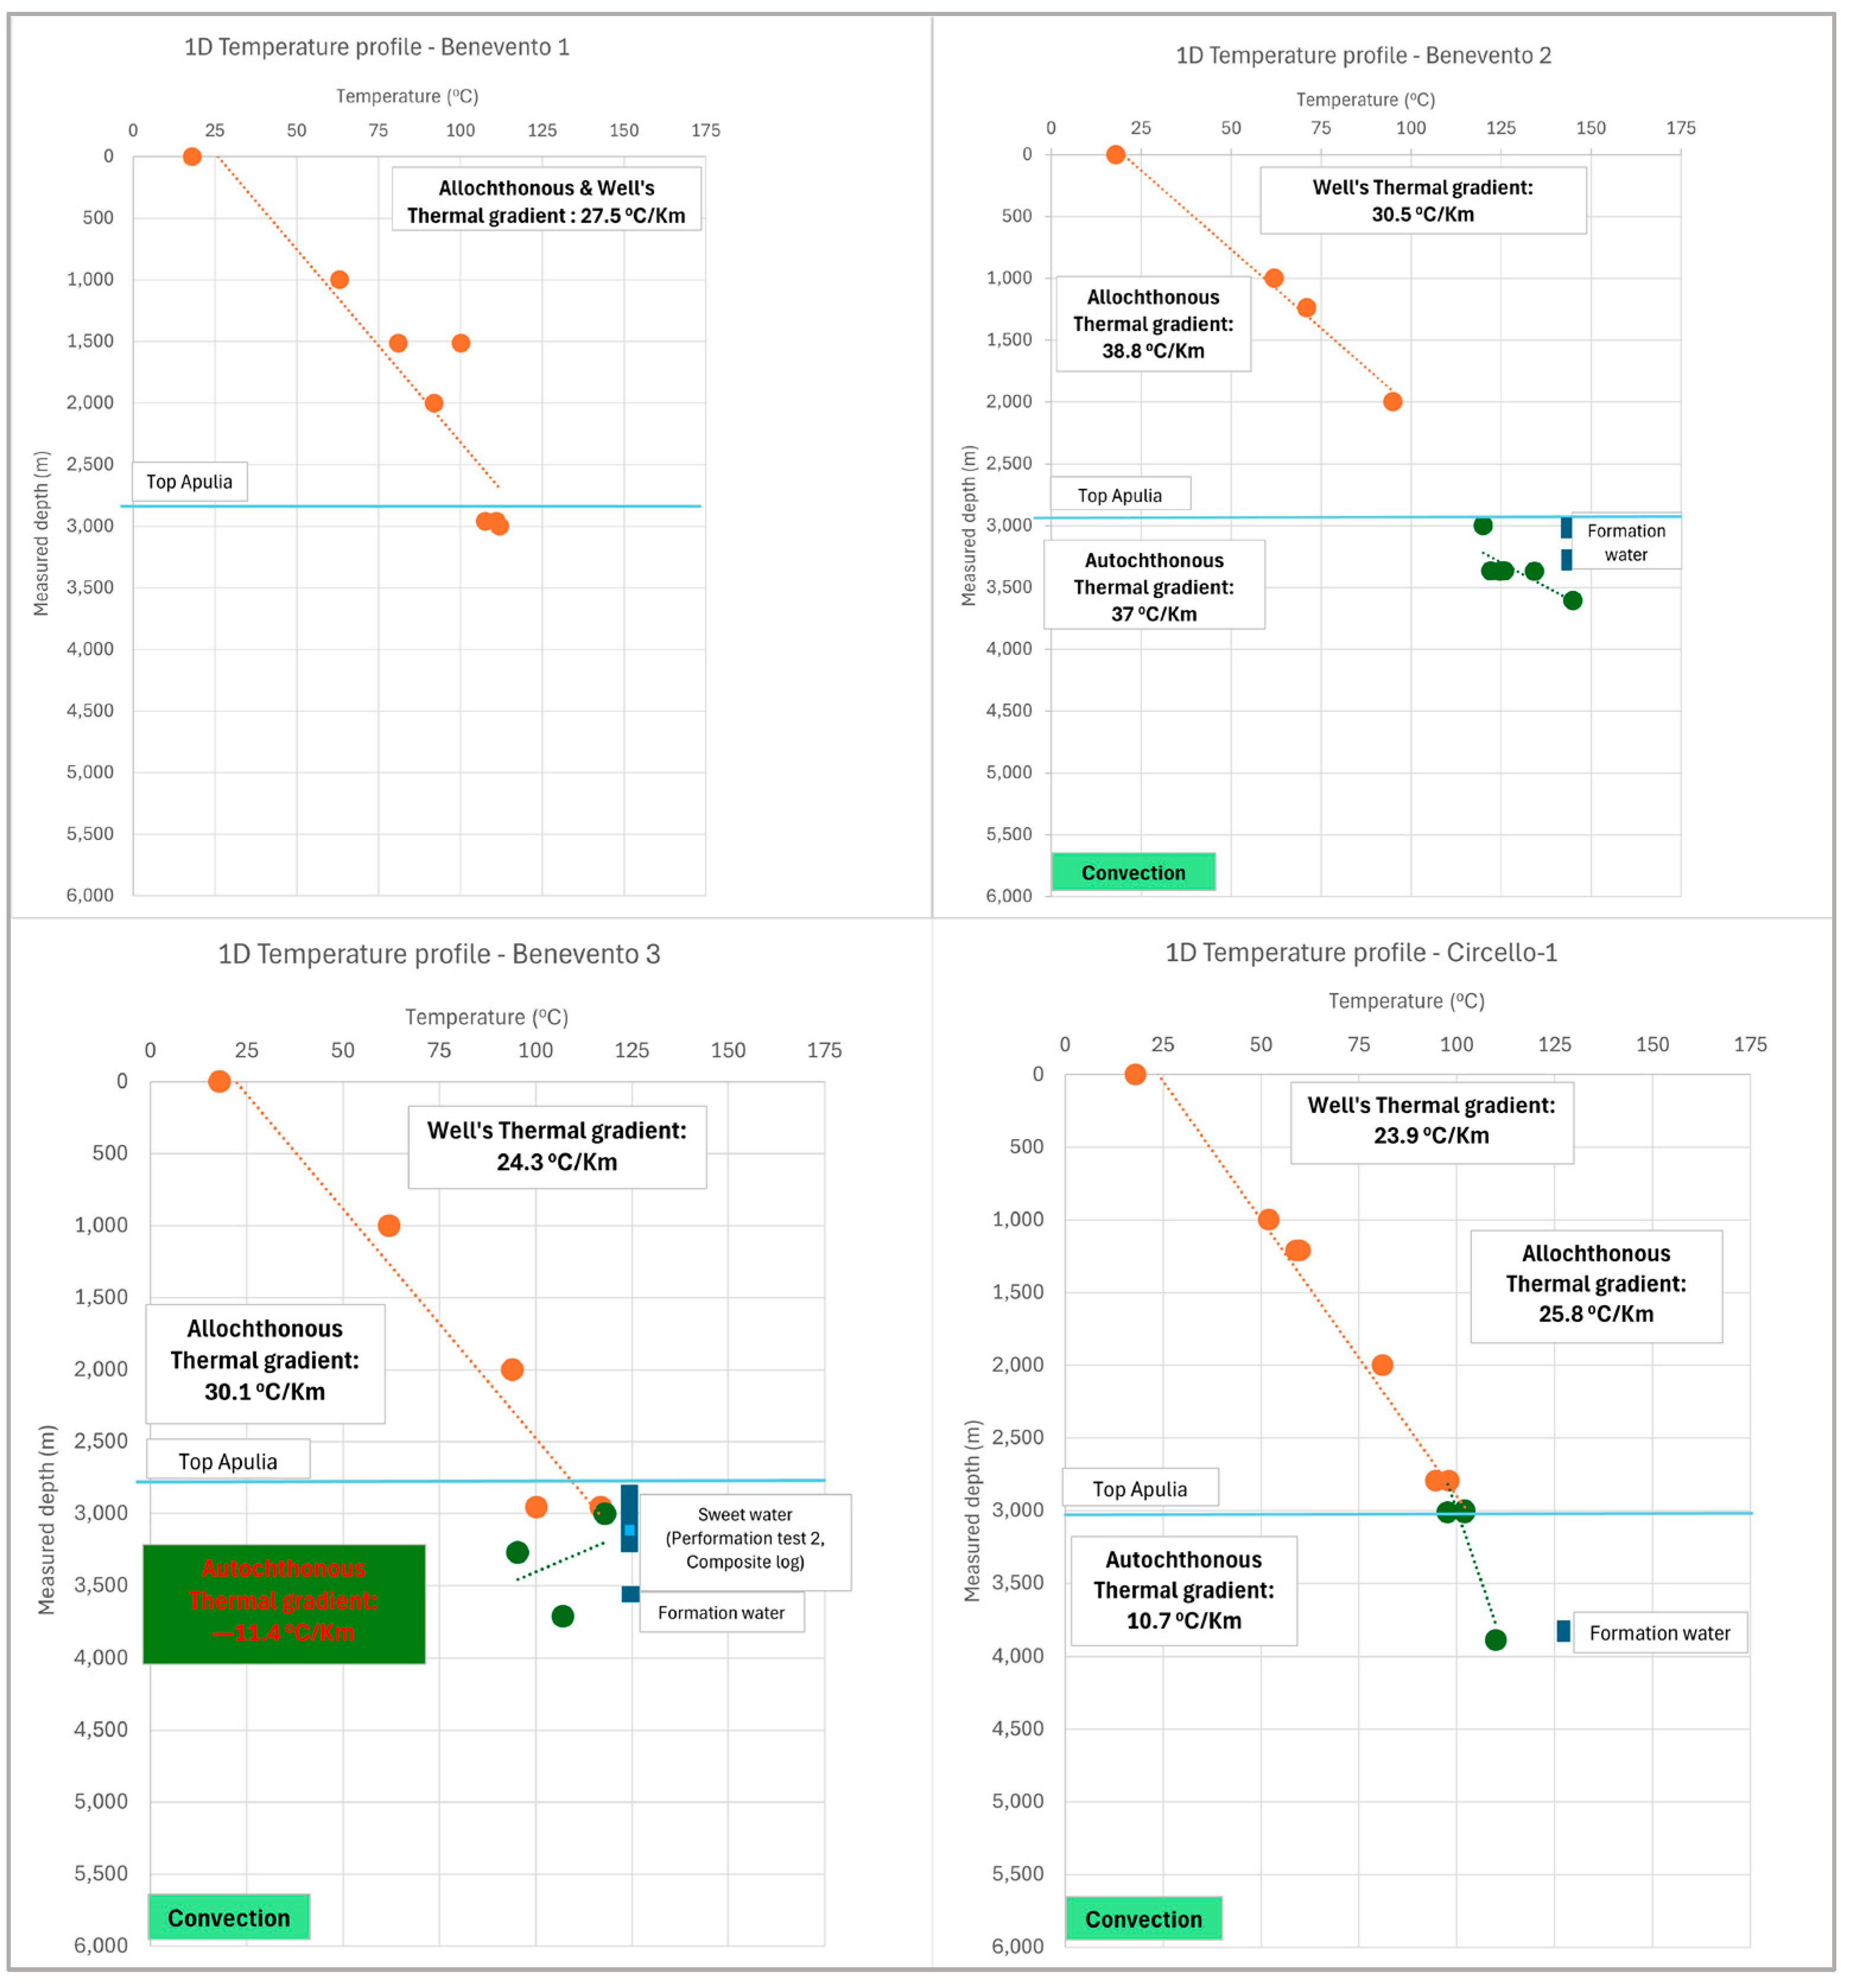
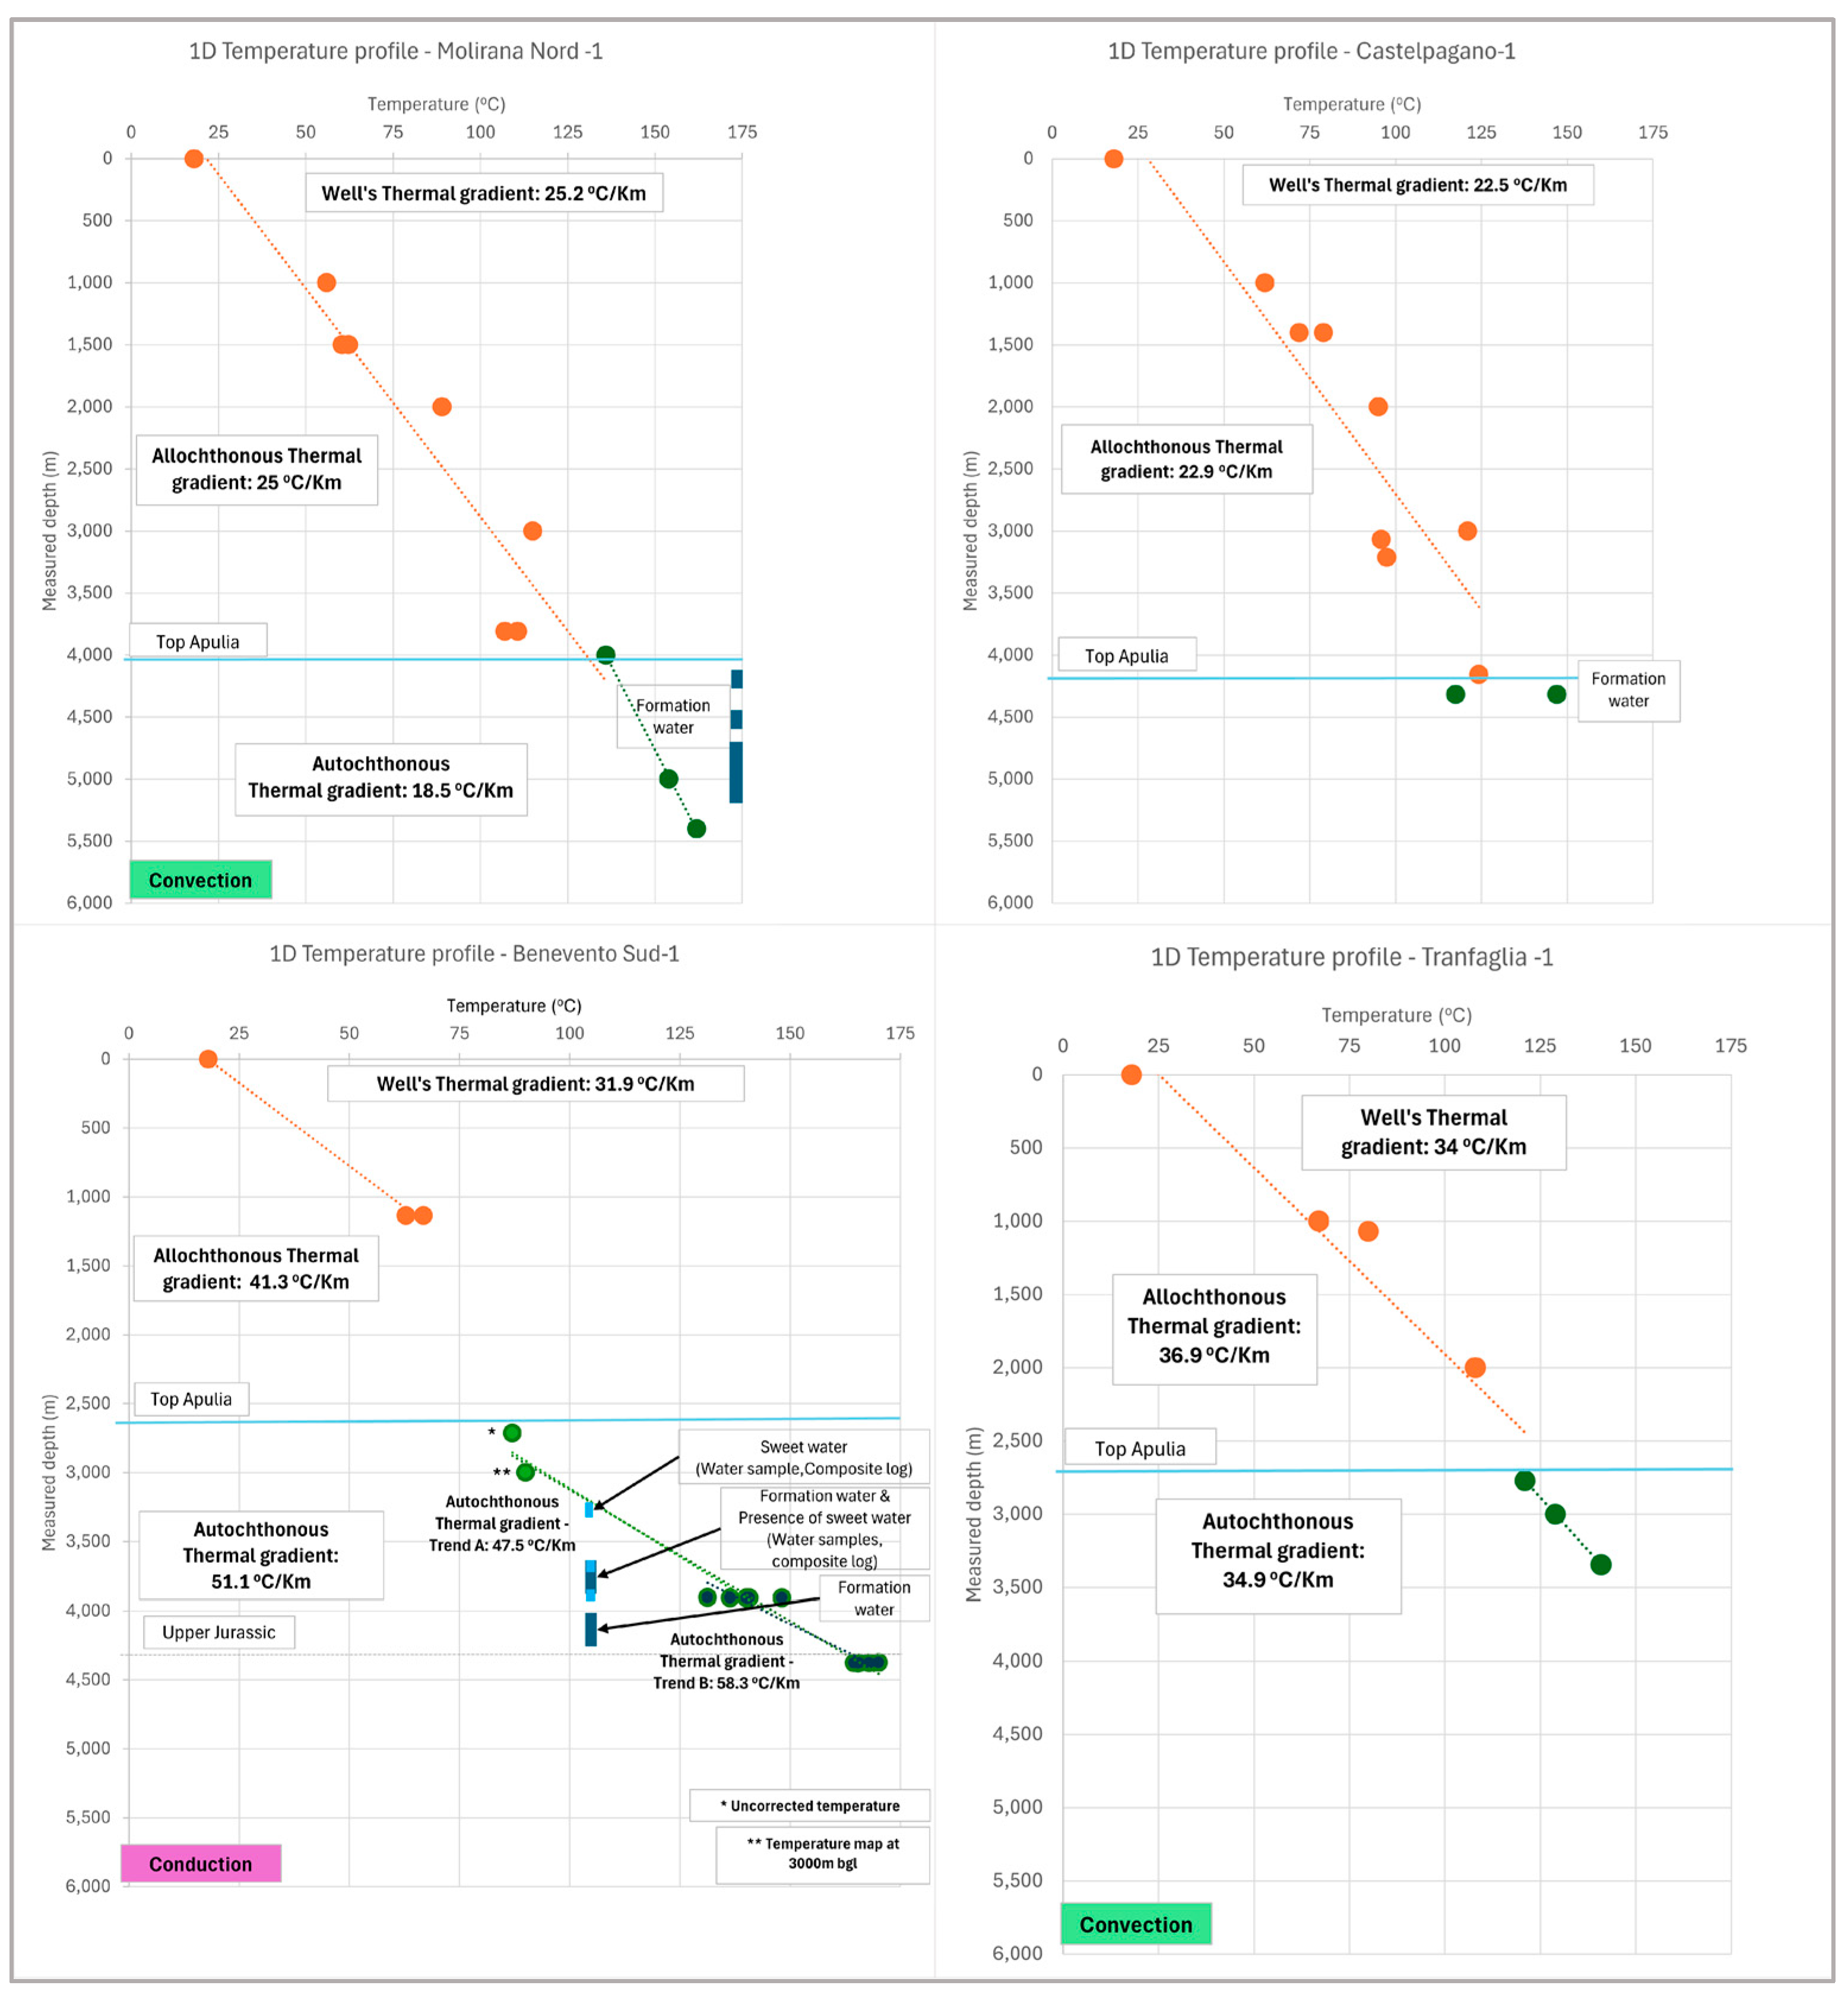
Twelve (12) one-dimensional temperature profiles at the well’s location were constructed using the corrected temperature values from deep well data provided by the Geothopica database [12] (Figure 8 and Figure 9). The thermal gradient was calculated too, for the allochthonous and the autochthonous subsurface levels (if possible, depending on the availability of the data). By comparing the thermal gradients of the two domains regionally, we observed that block B exhibits one that is slightly higher (28.5 °C/km, Figure 10) than that of block C (27.6 °C/km, Figure 10), which is almost equal to the regional value (27.5 °C/km, Figure 10). Based on the calculated thermal gradient of the two subsurface levels, in the majority of cases, the allochthonous level presents a higher thermal gradient than the autochthonous Apulian carbonates, indicating that mainly convection phenomena between the two levels take place across the two domains (Figure 8 and Figure 9). The exception belongs to the Benevento Sud 1 well, where the thermal gradient increases progressively from the top to the bottom, indicating that predominant conduction occurs at this point (Figure 8). Section 5.3.2 describes the differences between conduction, convection, and advection, which are the primary heat transfer mechanisms on Earth. The indicators required to identify the dominant mechanisms are also analyzed, with temperature gradient being one of the main ones.

5. Discussion

5.1. Structural Model and the Propagation Velocity Approach

The 3D geological model constructed from 2D subsurface interpretation reveals the structural complexity of the Apulia unit. The model, depth-converted using a propagation velocity approach, incorporates three key regional horizons—the top of the Apulia carbonates, the Triassic Burano Formation, and the Permian volcaniclastic deposits—while integrating thrust, back-thrust, and normal fault systems. The constructed interval velocity cube at a certain depth of 4 km has been compared with Feriozzi et al. [34] (Supplementary Material S2, Figure S3). Major discrepancies related to calculated velocities are not observed, more specifically where the top of the Apulia is expected within the area of the thermal anomaly (Figure 5 dashed black polygon). Any divergences were attributed to the following two main reasons: (a) the variances to the author’s perspective regarding the horizon interpretation and the picking of the faults (mainly the dips) and (b) the type of different resolution datasets used for the definition of the p-wave velocity model.

5.2. Temperature Gradient Variations Between the Structural Domains B and C

The subdivision of the domains B and C is marked by insignificant differences in the temperature gradient between them (28.5 °C/km and 27.6 °C/km respectively, Figure 10). However, by comparing the magnitude of the differences between the thermal gradient of the allochthonous and the autochthonous across the internal and the external domains (Table 4), it strongly props the idea that convection phenomena are more intense in domain B between the two subsurface levels, while in domain C, they are more constrained within the reservoir. This can be attributed to the structural configuration or the depth variations of the subsurface Apulian structures but also to the lithological heterogenies within the allochthonous. Detailed analysis and discussion of the key geological elements and their variances that shape the active geothermal systems within the two domains follow in the next sections.

5.3. Geothermal Systems Within Structural Domains B and C

A geothermal system is defined as a complex system that involves high temperatures, water in deep rocks, and permeable/fractured rock formations, allowing geothermal energy to flow into production wells for commercial development [53]. Geothermal systems are categorized in different ways, depending on the perspective. Geologists classify them based on the geological environment and the processes that led to their development; reservoir engineers approach geothermal systems by emphasizing heat transfer mechanisms and techniques for evaluating system performance during well testing and predictions of how the system will behave during sustained production [53]. Following the geological view, a complete geothermal system is composed of a reservoir volume with a void space, a heat source, a dominant heat flux mechanism, a water source and its migration pathway in and out of the reservoir, and finally a cap rock, which thermally insulates the reservoir and prevents cold water downflow. In this section, we discuss the geothermal systems and their elements as expected to be found within the structural blocks B and C and highlight their diversities by integrating the literature and the published data from wells with the three-dimensional structural model of this study and its comparison with the thermal data (maps and thermal gradients).

5.3.1. Heat Source

Structural and geochemical data ([22,54,55]) strongly suggest mantle elevation and melt intrusions into the crust via lithospheric tensile faults (related to the latest Tyrrhenian extensional regime). They are not associated with the volcanism of central and southern Italy along the peri-Tyrrhenian margin since they do not reach the surface but pond in depth and deeply modify the thermal equilibrium of the lower crust [22] (Supplementary Material S2, Figure S4).

5.3.2. Heat Flux in the Reservoir

Heat in Earth is transferred mainly by conduction, convection, and advection. Conduction transfers heat through solid materials from high to low temperatures without moving the material itself, occurring in solid rock layers [56]. Convection transfers heat through fluid movement, with heated material rising and cooler material sinking, forming circulation patterns [57]. Advection carries heat with the physical movement of fluids through porous rocks or fractures [57,58]. These mechanisms are essential in Earth’s crust and geothermal energy systems.
To identify the dominant type of heat flow mechanism in a geothermal system—whether conduction, convection, or advection—it is essential to consider several interrelated physical and geological factors. One of the primary indicators is the temperature gradient, which is a steady, linear gradient that often signifies conduction, while deviations or anomalies can point to convective processes [58,59]. The permeability of the subsurface rocks plays a critical role, as high permeability allows fluids to circulate, enabling convective or advective heat transport, whereas low permeability restricts movement, favoring conduction [58,60,61]. Closely related is the presence and movement of fluids; circulating fluids are necessary for convection and advection, while stagnant fluids indicate conduction [56,58,60,61].
The thermal conductivity of the rocks also affects how efficiently heat can be conducted through solid material [59]. Additionally, pressure and depth conditions influence fluid phase and mobility, affecting the viability of convection in particular [62]. Geological structures such as faults, fractures, and porous formations can provide pathways for fluid flow, enhancing the potential for convective or advective transfer [58,62]. The nature and location of the heat source—for example, a shallow magmatic intrusion—can drive vigorous convection, while a deep, diffuse heat source may result in conduction-dominated systems [61]. Lastly, geochemical and isotopic indicators can reveal past and present fluid flow pathways and interactions, providing indirect evidence of the heat transport mode [62]. Together, these elements form a comprehensive framework for diagnosing the dominant heat flow mechanism in any geothermal system.
Using deep temperature data from boreholes in the area, the analysis of subsurface thermal gradients of the allochthonous and the autochthonous units in structural domains B and C suggests convection as the primary heat flux mode, which occurs laterally within the reservoir (Figure 8 and Figure 9). Previous studies have classified these geothermal reservoirs within the AOI as low-temperature convective systems [63], while, more recently, the term “non-magmatic convention-dominated geothermal play type related to extensional domains” has also been suggested [64].
Heat flow likely follows a two-step pathway (Figure 11). Exploration wells in these domains show predominantly supercritical CO2, water of various salinities, and occasional hydrocarbons. The first pathway can be from the deep heat source via large faults up to the top of the reservoir (advection). The main fluid that participates in this pathway is CO2. Heat transmission and gas migration align with fault structures and are supported by the comparison map of the heat flow with the fault patterns (Figure 7 and Supplementary Material S2, Figure S1). High heat flow in Domain C is near thrust faults TF12, TF15, TF7a, and TF8, while in Domain B, it is near TF16. Despite limited fluid migration due to the lack of extensive fracture networks [22] (Supplementary Material S2, Figure S4), preexisting thrust faults facilitate enough migration to account for high heat flow values (>110 mW/m2). These faults are possibly the main corridors to fluids and could hence work as the key conduit paths for the CO2 migration and the heat transmission.
CO2 occurrences [11,65] correlate with fault corridors and heat flow anomalies, though elevated CO2 does not directly cause thermal anomalies (Figure 7 and Supplementary Material S2, Figure S1). CO2 after its arrival at the reservoir, as a low-density fluid (i.e., compared to other fluids that are also present within the structure), migrates at the top following culmination geometry, contributing to lateral heat circulation. For example, at M. Forcuso in Domain B, surface heat flow anomalies follow fault geometry rather than CO2 concentration [60] (Figure 7 and Figure S1, Supplementary Material S2). Similarly, at Benevento Sud in Domain C, high CO2 content and gas pressures (Composite log, [11]) do not correspond to increased heat flow (Figure 7 and Supplementary Material S2, Figure S1).
The second heat flow pathway occurs laterally within the reservoir, where water appears to dynamically convey heat, possibly via the fracture networks (convection, Figure 11). This is supported by the correlation between the temperature distribution at a 3 km depth (BGL, Figure 7 and Supplementary Material S2, Figure S2) and the Apulian structural map. Specifically, in the eastern part of domain B or the “Guardia Lombardi” site, as referenced by Inversi et al. [65], the Vigor project [66], and Livani et al. [67], there is a strong correlation between the geometry of the Monte Forcuso culmination and the homogeneous distribution of the temperature anomaly within the structure (Figure 7 and Supplementary Material S2, Figure S2). In contrast, block C exhibits a more heterogeneous temperature distribution (Figure 7 and Supplementary Material S2, Figure S2).
The configuration of temperature distribution within the reservoir is likely related to the overall structural configuration of the two blocks (i.e., fault type and dips [68]). Although reverse faults are generally associated with wider lateral amplitudes of thermal anomalies along anticline hinges [68], in the Monte Forcuso structure, the combination of normal faults near the thrust fault system enhances the amplitude of the thermal anomaly towards the west. This results in a broader lateral anomaly and a more uniform temperature distribution at a 3 km depth (BGL, Figure 7, Figure 11 section BB′ and, Supplementary Material S2, Figure S2).
Furthermore, the presence or absence of an effective fracture system within the reservoir as mentioned is a crucial geological factor that influences fluid circulation and consequently impacts lateral heat transmission across structures [69,70,71]. In block C, the temperature distribution aligns with the fault pattern and appears constrained by specific thrust sheets and structures controlled by the TF8, TF9, TF15, and BT14 thrusts (Figure 7 and Supplementary Material S2, Figure S2). Heat delivery and temperature rearrangement likely occur near fault zones with more developed and interconnected fault and fracture networks. Previous research has highlighted fluid movements along major fault and fracture systems in the same area, correlating with micro-seismicity at depths less than 4–6 km or fluid pressure distribution from wells [31,72,73]. The analysis of P-wave velocities (Vp) and the Vp/Vs ratio strongly support the connection between shallow micro-seismicity and pore fluid pressure perturbation within the fractured and brine-saturated Mesozoic rocks of the Apulia platform [72,74,75,76].
Conduction phenomena are evident from the Benevento Sud 1 well in domain C (Figure 8). The thermal gradient increases vertically from the top to bottom. Within the carbonate reservoir, the following two different gradients appear: 47.5 °C/km in the Upper Cretaceous–Miocene section and 58.3 °C/km in the deeper Upper Jurassic–Upper Cretaceous section. The difference could be attributed to the presence of fresh water at the upper interval of the reservoir (Figure 8). Chemical analysis links the structure to meteoric water, likely disturbing the thermal status and causing vertical diversity in the gradient. Another hypothesis suggests that low permeability anhydrites and dolomites (high conductive rocks) deeper in the well could preserve and transfer heat into the Apulian carbonate reservoir. This would result in local conduction impacts, excluding this part of domain C from the regional convection heat mechanism that causes thermal anomalies. Given the lack of deeper information (i.e., lithology and temperature), the hypothesis of a naturally vertical heat transmission could ultimately be considered a “second order heat sources”, contingent on the presence of these formations at depth.

5.3.3. Fluid Source and Migration Pathway in and out Through the Geothermal Reservoir

This section examines potential water and CO2 sources and their migration pathways using the literature, DST results, production tests, and water analysis from well samples (Composite logs) [11]. Ten wells in domains B and C were analyzed to determine water origin. DSTs revealed formation water with varying salinities in most wells, namely water trapped within the carbonates at the time of deposition. Exceptions include Benevento 3, Benevento Sud 1, and Monte Forcuso 1, which also contain sweet water within the reservoir.
In the Benevento 3 well, all production tests except for one produced formation water. Some DSTs mention “sweetish water” but lack analysis. Production test 2 at 3287–3321 m clearly states sweet water with 0.8–0.9 g/L salinity, again without chemical analysis for source identification. Temperature data and the thermal gradient provided indices about the water’s origin. At the same depth where sweet water was reported, the reservoir temperature notably declined, with a value deviating notably from the main regression (corrected temperature, [12] Figure 8). The anomalous thermal gradient (−11.4 °C/km) suggests that the temperature decreases with depth, implying a cool fluid disturbance, possibly linking the water to the Earth’s surface.
Chemical results from the Benevento Sud 1 well show exposure of the carbonate structure to meteoric water, which seeps through subsurface pathways to the reservoir. Previous structural interpretations [29] link the Benevento–Sud structure with recent normal faulting, which could contribute to the water migration from the surface; however, in this interpretation, such an element was not identified. In contrast, for the M. Forcuso structure, recent tensional faults above Monte Forcuso are confirmed [29,34,51,52] and possibly work as key channels for water migration to the carbonate reservoir. For both Benevento wells, the exact mechanism of meteoric water entering the reservoir is unclear. However, it appears that the lithological units above do not act as efficient hydraulic insulators. Thus, fresh water can migrate from the surface into the reservoir through permeable formations, faults, fractures, and interconnected joints.
Regarding the CO2 source, as mentioned in Section 5.3.1, the heat source that causes the thermal anomaly in the area has been linked to melt intrusions into the lower crust, which remain at depth and modify its thermal status. Geochemical analysis of gas surface emissions [54,55] supports this interpretation and associates the presence of CO2 with this non-volcanic source environment. Considering its migration pathway, as discussed in Section 5.3.3, it can be stated that the dominant heat flow mechanism taking place from the source to the reservoir is advection, with the CO2 acting as the heat “carrier”. Although heat flow can be considered independently of the fluid migration path, in this case, they coincide, meaning that the fluid transmits the heat into the reservoir, so their migration paths are the same.
Regarding the fluid migration pathway out of the geothermal reservoir, in block C, fluids in the geothermal reservoir seem to be part of a thermally driven convection cell that recirculates within the Apulian carbonate reservoir without reaching the surface. No springs or gas leakages have been reported in block C that correlate with the subsurface fluids. In contrast, block B has been extensively researched for CO2 emissions and water springs linked to subsurface structures, indicating a hydraulic connection and fluid migration out of the reservoir towards the Earth’s surface [54,55,65,67,77] (Figure 7 and Supplementary Material S2, Figure S2).

5.3.4. Reservoir

The expected geothermal reservoir is the Apulian Miocene–Cretaceous fractured carbonates. This reservoir has been a target of research from academia and the oil and gas industry for at least six decades, due to its complex structural setting and significant hydrocarbon potential. These carbonates, deeply buried beneath the Southern Apennines, have acted as prolific reservoirs, especially in fields like Val d’ Agri [11]. Their porosity is largely secondary, enhanced by intense fracturing often linked to regional thrust tectonics. Exploration has been challenging due to seismic imaging difficulties in thrust belts and heterogeneous reservoir behavior. Nevertheless, advances in seismic interpretation and reservoir modeling have helped unlock their potential. Today, their geothermal prospects are being revisited, leveraging decades of hydrocarbon exploration data to assess deep heat extraction opportunities.
Based on the core descriptions of the various wells across the two domains, B and C, reservoir facies are typical of a wide monotonous and persistent low energy peritidal lagoon environment (U. Cretaceous) to a high energy ramp with reworked facies environment (Tertiary–Miocene). Core porosity and permeability analysis from two wells within block C, Benevento 2 and Benevento 3 (Composite logs) [11], and four wells within block B, Monte Forcuso 1, Monte Forcuso 2, Bonito 1 Dir, and Ciccone 1 [66] reveal low primary porosity and permeability. However, based on the Benevento wells, even though the Turonian–Lower Miocene sections are characterized as tight carbonates, with an av. core porosity of 1.4% (the maximum reaching 9%) and av. core permeability of 1.5 mD, (maximum reaching 73 mD), reservoir petrophysical characteristics seem to be enhanced by intense fracturing.
The analysis of the DSTs at various depths within the reservoir zone and their evaluation of the pressure built-up curves (Composite log Benevento-2) [11,66,67], along with the reported mud losses during the drilling process or even the total loss of circulation and the limited core recovery (Composite log Benevento 3) [11,66,67], raise the expectations of improved in situ poro-perm properties attributed to the presence of interconnected faults and fractures. Such a reservoir improvement is reported for the “Guardia Lombardi” site (block B) with the effective permeability values ranging from 100 to 150 mD [65,66,67].
Carbonates in general are considered high thermal conductive formations [78]; hence, they are capable of conducting heat for which, given a stable thermal system with an even distribution of the heat, the thermal gradient will be low. The analysis of ten wells drilled into the Apulian carbonates in blocks B and C indicates varying thermal gradients. Benevento 3, Bonito 1 Dir, and Circello 1 (Figure 8 and Figure 9) show very low thermal gradients, suggesting thermal stability, except for Benevento 3 (Figure 8), where fresh water disturbs thermal equilibrium and presents a negative thermal gradient.
Molirana Nord 1 and Taurasi 1 (Figure 8 and Figure 9) have higher thermal gradients, with Molirana Nord 1 affected by lithological variations (presence of marls, Eocene age) and the heat flow corridors (TF15). On the other hand, Taurasi 1 remains relatively stable away from the fault network linked to the hot fluid and heat migration, demonstrating an average thermal gradient close to that of the domain. The highest thermal gradients (31.5–37.5 °C/km) are observed in M. Forcuso 1, M. Forcuso 2, Tranfaglia 1, and Benevento 2 (Figure 8 and Figure 9), due to the proximity to fault heat corridors and the intense lateral hot fluid circulation. The reservoir section in the Benevento 2 well, likewise the Molirana Nord 1 well, is also characterized by a 90 m interval of marls (Eocene age), which, cumulatively with the other factors, can contribute to the increase of reservoir’s geothermal gradient at these point areas.

5.3.5. Cap Rock—Thermal and Hydraulic Reservoir Insulation

Reservoir insulation occurs when the cap rock prevents heat loss and the entry of cooler water. The thermal and hydraulic insulation results from the full thickness of rock between the reservoir and the Earth’s surface. In the most potential domains, B and C blocks, this insulation is expected to be established by the presence of two main units above the reservoir: (a) the Mio–Pliocene foredeep marine deposits that stratigraphically overlain on top of the Apulia carbonates and represent, regionally, the cover of the buried platform (Figure 2), [19,26,32,45] and (b) the overthrusted allochthonous level with varying lithostratigraphic characteristics laterally (Figure 2). Composite logs from twelve wells [11] within the internal B and external C domains were analyzed qualitatively to assess if the lithology variability affects thermal and hydraulic diversity. Due to a lack of petrophysical datasets, no quantitative analyses were conducted, but few available GR logs (Composite logs) [11] supplemented the study (Benevento Sud 1 Tranfaglia 1 Molirana Nord 1).
Domain B’s hydraulic breach in the Monte Forcuso area likely results from its shallow depth, recent normal faulting, and lithological variations. These factors allow meteoric water to access the reservoir. In the Bonito 1 Dir area, the situation differs from what is observed at the crest of the Monte Forcuso culmination. Above the reservoir lies a 115 m interval of clays and friable limestones and a 10 m anhydrite layer from the Mio–Pliocene age, while the rest of the allochthonous section is composed of marls with alternating calcarenites, chalky limestones, and sandstones up to the surface (Composite log, Daunia unit [11,79]). The marls’ high porosity and low permeability, thermally and hydraulically, insulate the reservoir and, in combination with the other formations (low and high conductive ones), lead to a steep temperature increase (40.2 °C/km, Figure 9) in this lithological section while maintaining an insulated system (8 °C/km, Figure 9) within the reservoir.
Comparatively, the Monte Forcuso 2 well, at a similar flank position, shows lithostratigraphic differences that affect thermal and hydraulic insulation. It lacks Mio–Pliocene deposits and has a 107 m section of sands, clays, and marls atop the reservoir, with more clays and marly carbonates up to the surface (Mio–Eocene flysch, Lagonegro unit). The M. Forcuso-1 well has a similar lithological profile, which drilled the crest of the structure. Variations between the three wells are due to allochthonous thickness (more than 1000 m difference), the dominant lithology, and their positions relative to main fault systems affecting hot fluid flow. These are imprinted on the thermal gradient of the cap rock locally (Figure 9), with the Bonito 1 Dir well exhibiting lower thermal gradient (40.2 °C/km) compared to M. Forcuso wells 1 and 2 (44 °C/km and 49 °C/km respectively). The latter’s thin, permeable allochthonous enables lateral hot fluid circulation, increasing the geothermal gradient, unlike Bonito 1 Dir, where the gradient is influenced by lithology and thermophysical properties.
In domain C, the cap rock generally acts as a good thermal and hydraulic insulator for the underlying reservoir, except near the Benevento Sud 1 and Benevento 3 wells. At Benevento Sud 1, the presence of sweet water suggests that the carbonate aquifer is recharged by meteoric water. Lithological analysis reveals a 2678 m thick allochthonous unit, primarily composed of clay with some muddy limestones, calcarenites, and sandstones. The Miocene foredeep deposits (35 m) are mainly clay with a thin anhydrite layer on top. The frequent permeable lithologies and the limited thickness of the Miocene foredeep deposits likely cause thermal and hydraulic breaches, affecting the local temperature gradient from the top of the allochthonous unit to the base of the autochthonous Apulian carbonates.
The remaining wells within the block have been categorized into two groups. The first group comprises Tranfaglia 1, the Benevento wells (1, 2, and 3), and Circello 1, while the second group includes Molirana Nord 1 and the Castelpagano wells (1 and 2 Dir). The primary distinction between these groups is the total thickness of the allochthonous layer, ranging from 2700 to 3000 m in the former and approximately 4000 m in the latter. The Mio–Pliocene foredeep interval atop the reservoir is generally absent in the first group, except for Benevento 2 and Tranfaglia 1. In Benevento 2, the Mio–Pliocene deposits are composed of 15 m of marls, while in Tranfaglia 1, this interval consists of fine clay, sand, and limestone alterations, with 20 m of anhydrite above the reservoir. In the second group, the Miocene foredeep deposits predominantly consist of 10–30 m of anhydrite.
In both groups, the allochthonous unit is primarily mud-dominated and occasionally interspersed with intervals of marls, sandstones, and limestones. Thermal and hydraulic insulation of the reservoir is potentially achieved with a thick clay-dominated layer ranging from 150 to 850 m, depending on the case, which is overthrusted either atop the reservoir or the Mio–Pliocene deposits. Benevento 3 has the thinnest occurrence of this unit, whereas Castelpagano 1 has the thickest. Notably, the Benevento 3 well tested meteoric water within the reservoir. Despite its location in an area where thermal and hydraulic insulation is likely established lithologically, it lacks components that could explain the partial hydraulic breaching of the structure at this position. Specifically, it lacks the Mio–Pliocene marine deposits above the reservoir and has a thin clay-dominated allochthonous interval, unlike other wells in domain C.
The variations in the allochthonous thermal gradient across block C (Figure 8) do not appear to be directly related to its overall thickness or dominant lithology, as was evident in domain B. However, local lithological heterogeneity above the reservoir could contribute to an increased gradient (e.g., marls in Benevento 2 or anhydrite in Tranfaglia 1 and Molirana Nord 1). In some instances, proximity to primary heat fault corridors may justify the localized increase, as seen in Tranfaglia 1 or possibly Molirana Nord 1. Conversely, other wells, such as Benevento 1, Castelpagano 1, and Circello 1, do not seem to be influenced by factors impacting the thermal status of the cap rock, resulting in a stable thermal gradient representative of the area.

5.4. Conceptual Geothermal Model

The 3D reconstruction of Apulian geological structures, combined with thermal data analysis and the assessment of potential geothermal systems within the AOI, led to an integrated conceptual geothermal model for the region (Figure 11). Additionally, a catalog was developed to identify and rank existing wells as potential analogues or representative scenarios of active geothermal systems within the two most promising domains (B and C, Table 4).
Heat migration primarily occurs from deep sources to reservoirs through crustal tensional faults and the pre-existing thrust fault network, with the main heat carrier possibly being CO2 (advection). The significant thrust faults involved in this process include TF15, TF7a, TF8, and possibly TF12 in domain C, as well as TF16 in domain B (Figure 11). Upon reaching the reservoir, the incoming CO2 interacts with resident fluids, mainly water, which then continue to transfer heat dynamically within the reservoir (convection). This promotes lateral circulation and redistribution of heat within the reservoir, primarily along a fracture network inherited from the region’s tectonic evolution.
An exception to this general heat transfer mechanism is observed in the Benevento Sud 1 area, where conductive heat transfer dominates (Figure 9 and Figure 11). The high thermal conductivity of the carbonate reservoir within the Apulian platform, spanning across both structural blocks, results in local variations in the thermal gradient. These variations reflect the thermal equilibrium status of the reservoir, which, in some cases, appears to have been locally achieved. They are also influenced by the reservoir’s relative position to major thrust fault heat corridors and the density of fracturing within the carbonate sequence.
The highest geothermal potential is associated with structures located near these fault-related heat corridors, where elevated temperatures coincide with intense fracturing. Both hanging walls and footwalls, regardless of their structural elevation along strike (i.e., high or low positions), can be considered viable targets for geothermal exploitation, provided that they are within an accessible depth, typically less than 3 km, to ensure economic feasibility.
According to deep well data (Figure 8 and Figure 9, Table 4), temperatures at the top of the reservoir exceed 100 °C, except in the M. Forcuso (1 and 2) and Benevento Sud 1 wells, where the infiltration of meteoric water significantly disrupts the thermal regime. The interaction and movement of meteoric and formation waters within and around the reservoir offer valuable indicators of the thermal and hydraulic properties of the cap rock, including its effectiveness in containing heat and fluids. Domain C features low thermal conductive formations mixed with high conductive ones, causing localized high thermal gradients. Domain B’s Monte Forcuso area has thin allochthonous sections, leading to heat dispersion and losses on top of the local geothermal system.
The Bonito area exhibits the most favorable characteristics for geothermal exploitation (Table 4). The reservoir depth (2540 m BGL), combined with its thermal stability, temperature, and the absence of fluid contamination—with only formation water present—positions this system as the most promising within the thermal anomaly. Additionally, the thermophysical properties of the cap rock contribute to its high geothermal potential.
The classification of geothermal potential within the AOI was primarily guided by the evaluation of well data across the two identified domains. Key criteria included fluid composition and contamination, reservoir depth, temperature, pressure conditions, and the overall thermal status of the system (Table 4). The presence of CO2 within certain structures is considered a potential risk factor, particularly due to its pressure condition. In some cases, the supercritical condition (near-bubble-point pressure of CO2 closely matches the reservoir pressure) can complicate reservoir management. However, CO2 is not necessarily a deterrent to geothermal development, provided that the gas cap is well-defined and the water-bearing aquifer remains within an exploitable depth range.
Hydrocarbon exploration drilling in Italy has revealed CO2 accumulation at a range of depths [80,81], as well as widespread surface CO2 degassing in hundreds of gas seeps in mainland Italy and Sicily [77]. A number of orogen-perpendicular deeper fault systems in the Apennines have been suggested as pathways for the rise of thermally anomalous fluids and CO2 [82] and are commonly interpreted as possible near-surface expressions of slab tears [83]. The CO2 emissions in Italy are considered to originate at different depths by at least two different primary processes: (a) melts from the anatexis of carbonate rocks at relatively shallow depths (−8 km), which dominates in areas of mantle upwelling due to high heat flow, and (b) degassing from the mantle lithosphere or melt intrusions in lower crust [82,84] or reflecting a combination of these two sources, with the upper crustal component dominating in high-heat-flow areas, while, in the rest, the mantle component prevails [85]. These fluids can infiltrate upwards through the interconnected extensional fault network and fracture damage zones, while locally, the presence of low-permeability stratigraphic and hydrothermal cemented horizons (e.g., in the geothermal fields) can contribute to maintain fluid pore overpressures [86], which appears to be episodic and ephemeral, since geochemical evidence for the mixing of meteoric and deep fluids in the geothermal reservoirs, together with the escape of the free gas phase at the surface, attest for enhanced permeability of the fractured thinned crust [87]. The CO2 presence in reservoirs represents a high-risk zone for geothermal exploration, and integrating a well-constrained 3D subsurface model such as the one presented in this study, combined with more detailed, structural, geochemical, and isotopic data can delineate “safe’’ areas for a geothermal energy production assessment.
Systems where hydrocarbons are also present pose a potential risk, especially when the water aquifer lies deeper than desired for economic extraction. For example, the Benevento 1, 2, and 3 wells are ranked lower due to this combination of deeper aquifers and hydrocarbon presence. The Castel Pagano area receives the lowest geothermal potential rating, primarily because of its significantly deep reservoir and the confirmed presence of CO2 in the associated wells. In contrast, Molirana Nord 1 is ranked highly despite its deep reservoir, due to its favorable fluid composition. This well has encountered only formation water, which is an advantage over other sites, where even shallower aquifers are associated with CO2 and hydrocarbons. A summary of the evaluation parameters and the complete geothermal potential ranking of the existing wells is presented in Table 4.

6. Conclusions

This study provided a comprehensive structural and geothermal analysis of the Campania–Lucania sector in the Southern Apennines, revealing the complex interplay between tectonic architecture and thermal anomalies. Through the integration of 2D seismic interpretation and well data, a high-resolution 3D geological model was developed in time and was depth converted using a regional velocity model, which was built based on the analytical V0-K method. The reconstructed structural model highlights the significant role of thrust and normal fault systems in shaping the subsurface heat distribution. The identification of four major structural blocks, particularly blocks B and C, allowed for a focused examination of the mechanisms behind the observed positive thermal anomaly.
The well deep temperature data, along with the comparison results between the structural model and published thermal maps (temperature at 3 km BGL and surface heat flow), confirm that convection phenomena are taking place within the reservoir. The primary heat source is likely associated with CO2 migration through recent tensional crustal faults and the pre-existing thrust fault network, which serve as conduits for heat from a deep, non-magmatic mantle-related source up to the reservoir (advection). Variability in thermal gradients across structural domains underscores the importance of fault connectivity, reservoir fracturing, and lithological composition in controlling heat flow and fluid circulation. Moreover, the presence of sweet water in selected wells points to localized hydraulic breaching, particularly in shallower domains affected by recent faulting or lithological heterogeneity. These findings underline the necessity of evaluating both thermal and hydraulic insulation characteristics when assessing geothermal viability.
The study concludes that the Bonito structure within block B presents the most favorable conditions for geothermal exploitation, given its optimal depth, thermal stability, and insulation properties. Understanding the combination of key factors such as the structural setting, the physical characteristics of the reservoir rocks, the chemical–physical properties of the fluids in the deep subsurface, and the dispersion of the heat is critical for designing effective geothermal exploration and development programs. A thorough analysis of the specific site to be potentially used for geothermal purposes is required, as various issues may be present. The aspects that need to be examined in advance include, among others, the presence of CO2, the amount of circulating water in the fractured aquifers, as well as environmental issues related to the industrial plants. Nevertheless, the conceptual geothermal model established here not only enhances our understanding of the geothermal systems in this region but also provides a scientific basis for targeted exploration and sustainable development in line with Italy’s renewable energy goals.

Supplementary Materials

The following supporting information can be downloaded at: https://www.mdpi.com/article/10.3390/geosciences15080311/s1, Table S1: well list. Document S2: maps and sections of the AOI.

Author Contributions

Conceptualization, C.P. and G.T.; methodology, C.P., G.T., I.V. and S.K.; validation, G.T. and C.P.; formal analysis, C.P., I.V. and S.K.; investigation, C.P.; resources, R.D.C. and A.R.; data curation, C.P.; writing—original draft preparation, C.P.; writing—review and editing, C.P., G.T., I.V., S.K., R.D.C. and A.R.; visualization, C.P.; supervision, G.T.; project administration, G.T.; funding acquisition, G.T. All authors have read and agreed to the published version of the manuscript.

Funding

This research was partially funded by the MUR (PRIN2022-project 20225MLCRS, P.I. Giovanni Toscani).

Data Availability Statement

The original contributions presented in this study are included in the article/Supplementary Material. Further inquiries can be directed to the corresponding author(s).

Acknowledgments

This paper is a result of the PON project of Chrysanthi Pontikou granted by MUR and the University of Pavia. GePlan srl. and Delta Energy Ltd. are acknowledged for hosting and sharing subsurface data and for the technical support provided. For the data used retrieved by public sources (ViDEPI and Geothopica project), the responsibility for their interpretation rests exclusively with the authors. PE Limited and Schlumberger are kindly acknowledged for providing the academic licenses of the Move Suite and the academic licenses of Petrel (www.petex.com (accessed on 1 May 2025), https://www.software.slb.com/products/petrel accessed 10 January 2022). The authors express their sincere gratitude to the developers and community behind QGIS (Quantum Geographic Information System). The open-source nature, extensive functionality, and user-friendly interface of QGIS significantly contributed to the spatial analysis and mapping components of this study (https://qgis.org/, accessed on 1 May 2025). The authors would like to thank the anonymous reviewers for the revision of the paper and the related valuable suggestions. C. Pontikou and G. Toscani thank also C. Turrini for the fruitful discussions and his critical input on an early draft of the manuscript and D. Dimitropoulos for the technical support on the building of the velocity model presented in this paper.

Conflicts of Interest

Author Raffaele Di Cuia was employed by the company Delta Energy Ltd. The remaining authors declare that the research was conducted in the absence of any commercial or financial relationships that could be construed as a potential conflict of interest.

Abbreviations

The following abbreviations are used in this manuscript:
AOIArea of interest
BGLBelow ground level
MSLMean sea level
MPZMidpoint Z
TFThrust fault
BTFBack-thrust fault
NFNormal fault
SBStructural block
HFMHeat flow mechanism
CVConvection
CDConduction
DSTDrill steam test
HCHydrocarbons
VpP-wave velocity
Vp/VsP-wave velocity and S-wave velocity ratio
TWTTwo–way time

References

  1. ENEL Gren Power Home Page, Geothermal Energy in Italy: Where and How It Is Produced. Available online: https://www.enelgreenpower.com/learning-hub/renewable-energies/geothermal-energy/italy (accessed on 12 June 2025).
  2. Ministero dello Sviluppo Economico. Zonazione Geotermica del Territorio Italiano; Direzione Generale per la Sicurezza Anche Ambientale delle Attività Minerarie ed Energetiche–UNMIG: Roma, Italy, 2017; Available online: http://unmig.mise.gov.it/unmig/geotermia/zonazione.asp (accessed on 16 June 2025).
  3. Mazzoli, S. Geothermal Energy and Structural Geology. Energies 2022, 15, 8074. [Google Scholar] [CrossRef]
  4. Majorowicz, J. Review of the Heat Flow Mapping in Polish Sedimentary Basin across Different Tectonic Terrains. Energies 2021, 14, 6103. [Google Scholar] [CrossRef]
  5. Santini, S.; Basilici, M.; Invernizzi, C.; Mazzoli, S.; Megna, A.; Pierantoni, P.P.; Spina, V.; Teloni, S. Thermal Structure of the Northern Outer Albanides and Adjacent Adriatic Crustal Sector, and Implications for Geothermal Energy Systems. Energies 2020, 13, 6028. [Google Scholar] [CrossRef]
  6. Liotta, D.; Brogi, A.; Ruggieri, G.; Zucchi, M. Fossil vs. Active Geothermal Systems: A Field and Laboratory Method to Disclose the Relationships between Geothermal Fluid Flow and Geological Structures at Depth. Energies 2021, 14, 933. [Google Scholar] [CrossRef]
  7. Gudmundsson, A. Transport of Geothermal Fluids along Dikes and Fault Zones. Energies 2022, 15, 7106. [Google Scholar] [CrossRef]
  8. Enel: Inventario Delle Risorse Geotermiche Nazionali: Regione Campania. Rapporto Tecnico, (1987), 53pp., 8 tav. Disponibile sul sito Web dell’UNMIG, Ultimo. Available online: https://unmig.mase.gov.it/inventario-delle-risorse-geotermiche-nazionali-rapporti-regionali/ (accessed on 2 March 2022).
  9. Enel/Eni/Cnr/Enea: Inventario Delle Risorse Geotermiche Nazionali. Valutazione del Potenziale Geotermico Nazionale (1994). Aggiornamento 1994. Rapporto Tecnico, 194 pp., 6 tav. Disponibile Presso il sito web dell’UNMIG. Available online: https://unmig.mase.gov.it/inventario-delle-risorse-geotermiche-nazionali-rapporti-regionali/ (accessed on 2 March 2022).
  10. Botteghi, S.; Bruno, D.; Caielli, G.; Caiozzi, F.; Caputi, A.; Catalano, R.; Chiesa, S.; Contino, A.; D’Arpa, S.; De Alteriis, G.; et al. VIGOR: Sviluppo Geotermico Nelle Regioni Della Convergenza; CNR-IGG: Pisa, Italy, 2014; p. 161. ISBN 9788879580113. Available online: https://www.vigor-geotermia.it/images/download/volumi/VIGOR-Sviluppo-geotermico-regioni-convergenza.pdf (accessed on 2 March 2022).
  11. ViDEPI Project. Visibilità dei Dati Afferenti All’attività di Esplorazione Petrolifera in Italia; Ministero dello Sviluppo Economico, DGRME; Società Geologica Italiana; Assomineraria: Roma, Italy, 2009–2023; Available online: https://www.videpi.com/ViDEPI/ViDEPI.asp (accessed on 30 August 2024).
  12. Trumpy, E.; Manzella, A. Geothopica and the interactive analysis and visualization of the updated Italian National Geothermal Database. Int. J. Appl. Earth Obs. Geoinf. 2017, 54, 28–37. [Google Scholar] [CrossRef]
  13. Hippolyte, J.-C.; Angelier, J.; Roure, F. A major geodynamic change revealed by Quaternary stress patterns in the southern Apennines (Italy). Tectonophysics 1994, 230, 199–210. [Google Scholar] [CrossRef]
  14. Monaco, C.; Tortorici, L.; Paltrinieri, W. Structural evolution of the Lucanian Apennines, southern Italy. J. Struct. Geol. 1998, 20, 617–638. [Google Scholar] [CrossRef]
  15. Ferranti, L.; Oldow, J.S. Latest Miocene to Quaternary horizontal and vertical displacement rates during simultaneous contraction and extension in the Southern Apennines orogen, Italy. Terra Nova 2005, 17, 209–214. [Google Scholar] [CrossRef]
  16. Scrocca, D.; Sciamanna, S.; Di Luzio, E.; Tozzi, M.; Nicolai, C.; Gambini, R. Structural Setting along the CROP-04 Deep Seismic Profile (Southern Apennines-Italy). Boll. Soc. Geol. Ital. 2007, 7, 283–296. [Google Scholar]
  17. Brozzetti, F. The Campania-Lucania Extensional Fault System, Southern Italy: A Suggestion for a Uniform Model of Active Extension in the Italian Apennines. Tectonics 2011, 30, TC5009. [Google Scholar] [CrossRef]
  18. Patacca, E.; Scandone, P. Late Thrust Propagation and Sedimentary Response in the Thrust Belt-Foredeep System of the Southern Apennines. In Anatomy of an Orogen: The Apennines and Adjacent Mediterranean Basin; Vai, G.B., Martini, I.P., Eds.; Kluwer Academic Publishers: Dordrecht, The Netherlands, 2001; pp. 401–440. [Google Scholar]
  19. Scrocca, D. Southern Apennines: Structural Setting and Tectonic Evolution. J. Virtual Explor. 2010, 36, 14. [Google Scholar] [CrossRef]
  20. Shiner, P.; Beccacini, A.; Mazzoli, S. Thin-Skinned versus Thick-Skinned Structural Models for Apulian Carbonate Reservoirs: Constraints from the Val d’Agri Fields, S. Apennines, Italy. Mar. Pet. Geol. 2004, 21, 805–827. [Google Scholar] [CrossRef]
  21. Turrini, C.; Rennison, P. Structural Style from the Southern Apennines’ Hydrocarbon Province—An Integrated View. In Thrust Tectonics and Hydrocarbon Systems; McClay, K.R., Ed.; American Association of Petroleum Geologists: Tulsa, OK, USA, 2004; Volume 82, pp. 558–578. ISBN 978-0-89181-363-7. [Google Scholar]
  22. Vezzani, L.; Festa, A.; Ghisetti, F.C. Geology and Tectonic Evolution of the Central–Southern Apennines, Italy. In Geological Society of America Special Paper 469; Geological Society of America: Boulder, CO, USA, 2010; pp. 1–58. ISBN 978-0-8137-2469-0. [Google Scholar] [CrossRef]
  23. Patacca, E.; Scandone, P. Geology of the Southern Apennines. Boll. Soc. Geol. Ital. 2007, 7, 75–119. [Google Scholar]
  24. Scrocca, D.; Carminati, E.; Doglioni, C. Deep Structure of the Southern Apennines, Italy: Thin-skinned or Thick-skinned? Tectonics 2005, 24, 2004TC001634. [Google Scholar] [CrossRef]
  25. Menardi Noguera, A.; Rea, G. Deep Structure of the Campanian–Lucanian Arc (Southern Apennine, Italy). Tectonophysics 2000, 324, 239–265. [Google Scholar] [CrossRef]
  26. Mazzoli, S.; Corrado, S.; De Donatis, M.; Scrocca, D.; Butler, R.W.H.; Di Bucci, D.; Naso, G.; Scrocca, D.; Nicolai, C.; Zucconi, V. Time and Space Variability of “Thin-Skinned” and “Thick-Skinned” Thrust Tectonics in the Apennines (Italy). Rend. Lincei Sci. Fis. Nat. 2000, 11, 5–39. [Google Scholar] [CrossRef]
  27. Mazzoli, S. Subduction and Continental Collision Events in the Southern Apennines: Constraints from Two Crustal Cross-Sections. Rend. Online Soc. Geol. Ital. 2013, 25, 78–84. [Google Scholar] [CrossRef]
  28. Improta, L.; Corciulo, M. Controlled Source Non-Linear Tomography: A Powerful Tool to Constrain Tectonic Models of the Southern Apennines Orogenic Wedge, Italy. Geology 2006, 34, 941–944. [Google Scholar] [CrossRef]
  29. Nicolai, C.; Gambini, R. Structural Architecture of the Adria Platform-and-Basin System. Boll. Soc. Geol. Ital. 2007, 7, 21–37. [Google Scholar]
  30. Pace, P.; Di Cuia, R.; Mascolo, V. Revitalizing Exploration and Redevelopment of Deep Carbonate Targets in the Southern Apennines Thrust Belt (Southern Italy): Reappraising Vintage Data with Modern Approaches. Geol. Soc. Lond. Spec. Publ. 2020, 490, 221–240. [Google Scholar] [CrossRef]
  31. Ferranti, L.; Palano, M.; Cannavò, F.; Mazzella, M.E.; Oldow, J.S.; Gueguen, E.; Mattia, M.; Monaco, C. Rates of Geodetic Deformation across Active Faults in Southern Italy. Tectonophysics 2014, 621, 101–122. [Google Scholar] [CrossRef]
  32. Ferranti, L.; Carboni, F.; Akimbekova, A.; Ercoli, M.; Bello, S.; Brozzetti, F.; Bacchiani, A.; Toscani, G. Structural Architecture and Tectonic Evolution of the Campania-Lucania Arc (Southern Apennines, Italy): Constraints from Seismic Reflection Profiles, Well Data and Structural-Geologic Analysis. Tectonophysics 2024, 879, 230313. [Google Scholar] [CrossRef]
  33. Vitale, S.; Ciarcia, S. Tectono-Stratigraphic Setting of the Campania Region (Southern Italy). J. Maps 2018, 14, 9–21. [Google Scholar] [CrossRef]
  34. Feriozzi, F.; Improta, L.; Maesano, F.E.; De Gori, P.; Basili, R. The 3D Crustal Structure in the Epicentral Region of the 1980, Mw 6.9, Southern Apennines Earthquake (Southern Italy): New Constraints from the Integration of Seismic Exploration Data, Deep Wells, and Local Earthquake Tomography. Tectonics 2024, 43, e2023TC008056. [Google Scholar] [CrossRef]
  35. Castagna, J.P.; Batzle, M.L.; Kan, T.K. Rock Physics: The Link between Rock Properties and AVO Response. In Offset-Dependent Reflectivity–Theory and Practice of AVO Analysis; Castagna, J.P., Backus, M.M., Eds.; Investigations in Geophysics Society of Exploration Geophysicists: Houston, TX, USA, 1993; Investigations in Geophysics; Volume 8, pp. 135–171. [Google Scholar] [CrossRef]
  36. Gardner, G.H.F.; Gardner, L.W.; Gregory, A. Formation velocity and density—The diagnostic basics for stratigraphic traps. Geophysics 1974, 39, 770–780. [Google Scholar] [CrossRef]
  37. Robein, E. Velocities, Time-Imaging, and Depth-Imaging: Principles and Methods; EAGE Publications: Houten, The Netherlands, 2003; pp. 64–70. ISBN 978-90-73781-28-3. [Google Scholar]
  38. Tinitaly Official Home Page. Available online: https://tinitaly.pi.ingv.it/Download_Area1_1.html (accessed on 4 March 2022).
  39. Mostardini, F.; Merlini, S. Appennino Centro-Meridionale: Sezioni Geologiche e Proposta di Modello Strutturale. Mem. Soc. Geol. Ital. 1986, 35, 177–202. [Google Scholar]
  40. Casero, P.; Roure, F.; Muller, C.; Moretti, I.; Sage, L.; Vially, R. Evoluzione Geodinamica Neogenica dell’Appennino Meridionale. In L’Appennino Campano-Lucano nel Quadro Geologico dell’Italia Meridionale, Proceedings of the Atti del 74° Congresso della Società Geologica Italiana, Sorrento, Italy, 13–17 September 1988; Cocco, E., D’Argenio, B., Eds.; Scienze e Lettere S.r.l.: Roma, Italy, 1988; pp. 59–66. ISBN RMS 0058002. [Google Scholar]
  41. Patacca, E.; Scandone, P. Geological Interpretation of the CROP-04 Seismic Line (Southern Apennines, Italy). Boll. Soc. Geol. It. Spec. Issue 2007, 7, 297–315. [Google Scholar]
  42. Casciello, E.; Esestime, P.; Cesarano, M.; Pappone, G.; Snidero, M.; Vergés, J. Lower Plate Geometry Controlling the Development of a Thrust-Top Basin: The Tectonosedimentary Evolution of the Ofanto Basin (Southern Apennines). J. Geol. Soc. 2013, 170, 147–158. [Google Scholar] [CrossRef]
  43. Improta, L.; Iannaccone, G.; Capuano, P.; Zollo, A.; Scandone, P. Inferences on the Upper Crustal Structure of Southern Apennines (Italy) from Seismic Refraction Investigations and Subsurface Data. Tectonophysics 2000, 317, 273–298. [Google Scholar] [CrossRef]
  44. Di Bucci, D.; Massa, B.; Tornaghi, M.; Zuppetta, A. Structural Setting of the Southern Apennine Fold-and-Thrust Belt (Italy) at Hypocentral Depth: The Calore Valley Case History. J. Geodyn. 2006, 42, 175–193. [Google Scholar] [CrossRef]
  45. Butler, R.W.H.; Mazzoli, S.; Corrado, S.; De Donatis, M.; Di Bucci, D.; Gambini, R.; Naso, G.; Nicolai, C.; Scrocca, D.; Shiner, P.; et al. Applying Thick-Skinned Tectonic Models to the Apennine Thrust Belt of Italy—Limitations and Implications. In Thrust Tectonics and Hydrocarbon Systems; McClay, K.R., Ed.; AAPG Memoir: Tulsa, OK, USA, 2004; Volume 82, pp. 647–667. [Google Scholar]
  46. ISPRA, ENI, OGS. Digital Gravimetric Cartography of Italy at A Scale of 1:250,000. 2009. Available online: https://www.isprambiente.gov.it/it/progetti/cartella-progetti-in-corso/suolo-e-territorio-1/cartografia-gravimetrica-digitale (accessed on 10 March 2022).
  47. INGV Official Home Page. Available online: https://terremoti.ingv.it/en (accessed on 16 February 2022).
  48. Vannoli, P.; Bernardi, F.; Palombo, B.; Vannucci, G.; Console, R.; Ferrari, G. New Constraints Shed Light on Strike-Slip Faulting beneath the Southern Apennines (Italy): The 21 August 1962 Irpinia Multiple Earthquake. Tectonophysics 2016, 691, 375–384. [Google Scholar] [CrossRef]
  49. Kelemework, Y.; Milano, M.; La Manna, M.; de Alteriis, G.; Iorio, M.; Fedi, M. Crustal Structure in the Campanian Region (Southern Apennines, Italy) from Potential Field Modelling. Sci. Rep. 2021, 11, 14510. [Google Scholar] [CrossRef]
  50. Akimbekova, A.; Mancinelli, P.; Pozo, M.; Pauselli, C.; Minelli, G.; Barchi, M.R. Forward Modelling of Bouguer Anomalies along a Transect of the Southern Apennines and the Southern Tyrrhenian Sea (Italy). Ital. J. Geosci. 2021, 140, 411–421. [Google Scholar] [CrossRef]
  51. Bello, S.; de Nardis, R.; Scarpa, R.; Brozzetti, F.; Cirillo, D.; Ferrarini, F.; di Lieto, B.; Arrowsmith, R.J.; Lavecchia, G. Fault Pattern and Seismotectonic Style of the Campania–Lucania 1980 Earthquake (Mw 6.9, Southern Italy): New Multidisciplinary Constraints. Front. Earth Sci. 2021, 8, 608063. [Google Scholar] [CrossRef]
  52. Lavecchia, G.; Bello, S.; Andrenacci, C.; Cirillo, D.; Pietrolungo, F.; Talone, D.; Ferrarini, F.; Cascone, C.; D’Addezio, G.; De Donatis, M.; et al. QUIN 2.0–New Release of the QUaternary Fault Strain INdicators Database from the Southern Apennines of Italy. Sci. Data 2024, 11, 189. [Google Scholar] [CrossRef] [PubMed]
  53. Zarrouk, S.J.; McLean, K. Chapter 2: Geothermal Systems. In Geothermal Well Test Analysis: Fundamentals, Applications and Advanced Techniques; Academic Press: Oxford, UK, 2019; pp. 13–38. [Google Scholar]
  54. Italiano, F.; Martelli, M.; Martinelli, G.; Nuccio, P.M. Geochemical Evidence of Melt Intrusions along Lithospheric Faults of the Southern Apennines, Italy: Geodynamic and Seismogenic Implications. J. Geophys. Res. Solid Earth 2000, 105, 13569–13578. [Google Scholar] [CrossRef]
  55. Chiodini, G.; Granieri, D.; Avino, R.; Caliro, S.; Costa, A.; Minopoli, C.; Vilardo, G. Non-Volcanic CO2 Earth Degassing: Case of Mefite d’Ansanto (Southern Apennines), Italy. Geophys. Res. Lett. 2010, 37, L11304. [Google Scholar] [CrossRef]
  56. Turcotte, D.L.; Schubert, G. Geodynamics, 3rd ed.; Cambridge University Press: Cambridge, UK, 2014; pp. 105–120, 161–200, 201–230. [Google Scholar]
  57. Ingebritsen, S.E.; Sanford, W.E.; Neuzil, C.E. Groundwater in Geologic Processes, 2nd ed.; Cambridge University Press: Cambridge, UK, 2006; pp. 31–69, 95–125, 166–199. [Google Scholar]
  58. Grant, M.A.; Donaldson, I.G.; Bixley, P.F. Geothermal Reservoir Engineering; Academic Press: New York, NY, USA, 1982; pp. 25–65, 123–146. [Google Scholar]
  59. Lachenbruch, A.H.; Sass, J.H. Heat Flow in the United States and the Thermal Regime of the Crust; U.S. Geological Survey Professional Paper 1386; U.S. Government Printing Office: Washington, DC, USA, 1977; pp. 3–34, 55–72. [Google Scholar]
  60. Hochstein, M.P. Classification and Assessment of Geothermal Resources. In High Enthalpy Geothermal Resources: A Global Overview; United Nations University, Geothermal Training Programme: Reykjavik, Iceland, 1990; pp. 7–32. [Google Scholar]
  61. Ingebritsen, S.E.; Sanford, W.E. Groundwater in Geologic Processes; Cambridge University Press: Cambridge, UK, 1998; pp. 31–69, 166–199. [Google Scholar]
  62. Dickson, M.H.; Fanelli, M. Geothermal Energy: Utilization and Technology; Earthscan/UNESCO: London, UK, 2003; pp. 15–38. [Google Scholar]
  63. Della Vedova, B.; Bellani, S.; Pellis, G.; Squarci, P. Deep Temperatures and Surface Heat Flow Distribution. In Anatomy of an Orogen: The Apennines and Adjacent Mediterranean Basins; Vai, G.B., Martini, I.P., Eds.; Springer: Dordrecht, The Netherlands, 2001; pp. 65–76. [Google Scholar] [CrossRef]
  64. Moeck, I.S. Catalog of Geothermal Play Types Based on Geologic Controls. Renew. Sustain. Energy Rev. 2014, 37, 867–882. [Google Scholar] [CrossRef]
  65. Inversi, B.; Scrocca, D.; Montegrossi, G.; Livani, M.; Petracchini, L.; Brandano, M.; Brilli, M.; Giustini, F.; Recanati, R.; Gola, G.; et al. 3D Geological Modelling of a Fractured Carbonate Reservoir for the Study of Medium Enthalpy Geothermal Resource in Southern Apennines (Campania Region, Italy). In Proceedings of the European Geothermal Congress, Pisa, Italy, 3–8 June 2013; pp. 3–7. [Google Scholar]
  66. Amoresano, A.; Angelino, A.; Anselmi, M.; Bianchi, B.; Botteghi, S.; Brandano, M.; Brilli, M.; Bruno, P.P.; Caielli, G.; Caputi, A.; et al. VIGOR: Sviluppo geotermico nella regione Campania-Studi di Fattibilità a Mondragone e Guardia Lombardi. In Progetto VIGOR-Valutazione del Potenziale Geotermico delle Regioni della Convergenza, POI Energie Rinnovabili e Risparmio Energetico 2007–2013; CNR-IGG: Pisa, Italy, 2015; ISBN 9788879580151. Available online: www.vigor-geotermia.it/images/download/fatt_volumi/CAMPANIA/Campania.pdf (accessed on 2 March 2022).
  67. Livani, M.; Inversi, B.; Montegrossi, G.; Petracchini, L.; Alimonti, C.; Scrocca, D. Reusing Oil and Gas Exploration Data to Derisk Geothermal Projects: The Guardia Lombardi Case Study (Southern Italy). Renew. Energy 2025, 242, 122401. [Google Scholar] [CrossRef]
  68. Frottier, L.; Milesi, G.; Roche, V.; Duwiquet, H.; Taillefer, A. Heat Flow, Thermal Anomalies, Tectonic Regimes and High-Temperature Geothermal Systems in Fault Zones. Compt. Rendus Geosci. 2023, 356 (Suppl. 2), 389–421. [Google Scholar] [CrossRef]
  69. Questiaux, J.-M.; Couples, G.D.; Ruby, N. Fractured Reservoirs with Fracture Corridors. Geophys. Prospect. 2010, 58, 279–295. [Google Scholar] [CrossRef]
  70. Jolie, E.; Scott, S.; Faulds, J.; Chambefort, I.; Axelsson, G.; Gutiérrez-Negrín, L.C.; Regenspurg, S.; Ziegler, M.; Ayling, B.; Richter, A. Geological Controls on Geothermal Resources for Power Generation. Nat. Rev. Earth Environ. 2021, 2, 324–339. [Google Scholar] [CrossRef]
  71. Fadel, M.; Meneses Rioseco, E.; Bruna, P.-O.; Moeck, I. Pressure Transient Analysis to Investigate a Coupled Fracture Corridor and a Fault Damage Zone Causing an Early Thermal Breakthrough in the North Alpine Foreland Basin. Geoenergy Sci. Eng. 2023, 229, 212072. [Google Scholar] [CrossRef]
  72. Improta, L.; De Gori, P.; Chiarabba, C. New Insights into Crustal Structure, Cenozoic Magmatism, CO2 Degassing, and Seismogenesis in the Southern Apennines and Irpinia Region from Local Earthquake Tomography. J. Geophys. Res. Solid Earth 2014, 119, 8283–8311. [Google Scholar] [CrossRef]
  73. Vitagliano, E.; Improta, L.; Pizzino, L.; D’Agostino, N. Study of Well Data Reveals Fluid Pressure Distribution and Origin in the Upper Crust of the Irpinia Region (Southern Apennines, Italy). Tectonophysics 2025, 908, 230761. [Google Scholar] [CrossRef]
  74. Amoroso, O.; Ascione, A.; Mazzoli, S.; Virieux, J.; Zollo, A. Seismic Imaging of a Fluid Storage in the Actively Extending Apennine Mountain Belt, Southern Italy. Geophys. Res. Lett. 2014, 41, 3802–3809. [Google Scholar] [CrossRef]
  75. Amoroso, O.; Russo, G.; De Landro, G.; Zollo, A.; Garambois, S.; Mazzoli, S.; Parente, M.; Virieux, J. From Velocity and Attenuation Tomography to Rock Physical Modeling: Inferences on Fluid-driven Earthquake Processes at the Irpinia Fault System in Southern Italy. Geophys. Res. Lett. 2017, 44, 6752–6760. [Google Scholar] [CrossRef]
  76. De Landro, G.; Amoroso, O.; Russo, G.; D’Agostino, N.; Esposito, R.; Emolo, A.; Zollo, A. Decade-Long Monitoring of Seismic Velocity Changes at the Irpinia Fault System (Southern Italy) Reveals Pore Pressure Pulsations. Sci. Rep. 2022, 12, 1247. [Google Scholar] [CrossRef]
  77. Chiodini, G.; Valenza, M.; Cardellini, C.; Frigeri, A. A New Web-Based Catalog of Earth Degassing Sites in Italy. Eos Trans. AGU 2008, 89, 341–342. [Google Scholar] [CrossRef]
  78. Robertson, C.E. Thermal Properties of Rocks; United States Department of the Interior Geological Survey: Reston, VA, USA, 1988. [Google Scholar]
  79. Matano, F.; Critelli, S.; Barone, M.; Muto, F.; Di Nocera, S. Stratigraphic and Provenance Evolution of the Southern Apennines Foreland Basin System during the Middle Miocene to Pliocene (Irpinia-Sannio Successions, Italy). Mar. Pet. Geol. 2014, 57, 652–670. [Google Scholar] [CrossRef]
  80. Collettini, C.; Cardellini, C.; Chiodini, G.; De Paola, N.; Holdsworth, R.E.; Smith, S.A.F. Fault weakening due to CO2 degassing in the Northern Apennines: Short- and long-term processes. In The Internal Structure of Fault Zones: Implications for Mechanical and Fluid-Flow Properties; Wibberley, C.A.J., Kurz, W., Imber, J., Holdsworth, R.E., Collettini, C., Eds.; Geological Society, London, Special Publications: London, UK, 2008; Volume 299, pp. 175–194. [Google Scholar] [CrossRef]
  81. Trippetta, F.; Collettini, C.; Barchi, M.R.; Lupattelli, A.; Mirabella, F. A multidisciplinary study of a natural example of a CO2 geological reservoir in central Italy. Int. J. Greenh. Gas Control 2013, 12, 72–83. [Google Scholar] [CrossRef]
  82. Vannoli, P.; Martinelli, G.; Valensise, G. The Seismotectonic Significance of Geofluids in Italy. Front. Earth Sci. 2021, 9, 579390. [Google Scholar] [CrossRef]
  83. Rosenbaum, G.; Piana Agostinetti, N. Crustal and upper mantle responses to lithospheric segmentation in the northern Apennines. Tectonics 2015, 34, 648–661. [Google Scholar] [CrossRef]
  84. Italiano, F.; Martinelli, G.; Plescia, P. CO2 degassing over seismic areas: The role of mechanochemical production at the study case of Central Apennines. In Terrestrial Fluids, Earthquakes and Volcanoes: The Hiroshi Wakita Volume III. Pageoph Topical Volumes; Pérez, N.M., Gurrieri, S., King, C.Y., Taran, Y., Eds.; Birkhäuser: Basel, Switzerland, 2008; pp. 75–94. [Google Scholar]
  85. Chiodini, G.; Cardellini, C.; Amato, A.; Boschi, E.; Caliro, S.; Frondini, F.; Ventura, G. Carbon dioxide Earth degassing and seismogenesis in central and southern Italy. Geophys. Res. Lett. 2004, 31, L07615. [Google Scholar] [CrossRef]
  86. Chiodini, G.; Frondini, F.; Kerrick, D.M.; Rogie, J.; Parello, F.; Peruzzi, L.; Zanzari, A.R. Quantification of deep CO2 fluxes from central Italy: Examples of carbon balance for regional aquifers and of soil diffuse degassing. Chem. Geol. 1999, 159, 205–222. [Google Scholar] [CrossRef]
  87. Ghisetti, F.; Vezzani, L. Normal faulting, transcrustal permeability and seismogenesis in the Apennines (Italy). Tectonophysics 2002, 348, 155–168. [Google Scholar] [CrossRef]
Figure 1. Geothermal potential map per community based on the mean surface heat flow (mW/m2, modified after UNMIG, [2]). Yellow stars represent the present-day exploited geothermal resources in Italy [1]. The yellow polygon shows the area of interest (AOI).
Geosciences 15 00311 g001
Figure 2. (a) Structural map of the Southern Apennines modified after Vezzani et al. [22]. Only tectonic lineaments are reported based on the literature [21,22]; the temperature anomaly contour map at 3 km comes from UNMIG (°C), [2]. Wells are colored based on the measured depth of top Apulian carbonates and are labeled with an order number linked to the velocity model parameters. A full list of wells used in the propagation velocity model is available in Supplementary Material S1. The yellow polygon shows the area of interest (AOI). (b) Location of the study area in the geodynamic setting of the Italian peninsula and the major thrust fronts of the Southern Apennines. (c) Simplified stratigraphy of the main tectono-stratigraphic units in the AOI [22]. (d) Sketch section showing the structural configuration of the subsurface Apulian platform overlaid by the temperature at 3 km depth (BGL) and the surface heat flow profiles [2].
Geosciences 15 00311 g002
Figure 3. Data distribution examined in this work. The gray dotted lines represent the public seismic reflection profiles (from [11]), and the gray dashed polygon defines the area of the private data. Wells are colored based on the measured depth of top Apulian carbonates. The yellow polygon shows the area of interest (AOI). The color map demonstrates the geothermal potential in the area per community based on the expected maximum temperature at 3 km (BGL, °C, modified after [2]).
Geosciences 15 00311 g003
Figure 4. (a) Well-to-seismic tie of Apulian top carbonate at the Benevento 3 well (Well No 3, for location see Figure 2 and Figure 3). Allochthonous and autochthonous sections are noted. (b) Seismic facies analysis of Triassic Burano formation (green dashed line) and Permian volcaniclastics (red dashed line), as suggested by the projected stratigraphy of the Puglia 1 well (on CROP 04 line, Well No 31, for location see Figure 2 and Figure 3) and sonic log’s response. (c) Seismic interpretation in the time domain on a seismic line from the private dataset and (d) seismic interpretation in the time domain on a seismic line from the public dataset. Monte Forcuso 1 and 2 wells are shown (Wells No 39 and No 27, respectively; for location, see Figure 2 and Figure 3). Seismic interpretation follows the stratigraphy presented in Figure 2b: the white solid lines represent the fault network, the light blue solid lines represent the top of the Apulian platform, the light green solid lines represent the top of the Triassic Burano formation, and the red solid lines represent the top of the Permian volcaniclastics. The gray solid line represents the topography.
Geosciences 15 00311 g004
Figure 5. (a) Check-shot survey showing the characteristic interval velocity inversion above the top of Apulian carbonates observed in specific wells across the area. (b) Allochthonous unit Vint = f (Mid-Point Z) cross-plot and the least-square linear regression curve, showing that the interval velocity increases with depth. (c) Vint = f (Mid-Point Z) cross-plot and the least-square linear regression curve defining the V0 and the k-gradient parameters regionally for the autochthonous Apulian platform that are used in the propagation velocity model. (d) Allochthonous V0 map constructed using the time–depth relationship at the well points within the AOI. (e) Allochthonous variable k-factor map constructed using the time–depth relationship at the well points within the AOI.
Geosciences 15 00311 g005
Figure 6. (a) Regional top Apulia carbonate surface as derived by the depth conversion, superposed by the model’s depth converted fault network traces, the buried thrust fronts, and the regional crustal stretching front, as suggested by the literature [17,21,22,29,31]. (b) Three-dimensional view of the structural model in depth. The fault network is shown in gray, and the structure contour map indicates the top of the Apulia carbonates. (c) Map view of Apulia’s platform structural blocks within the AOI in gray color, with contour lines every 500 m. (d) Subdivision of the subsurface into the following four major structural blocks: two inner blocks A (purple) and B (pink), the external block C (orange) at their footwall, and the foreland block D (green).
Geosciences 15 00311 g006aGeosciences 15 00311 g006b
Figure 7. Comparison between the subsurface structural model and the thermal anomaly within the AOI. The thermal anomaly is mainly associated with two out of the four main structural blocks, the internal B (pink polygon) and the external C (orange polygon). (a,b) Surface heat flow map (mW/m2, [2]) and temperature map at 3 km (BLG, °C, [2]), respectively, superimposed by the fault network traces and the Apulian contour map (solid gray line). (c,d) Surface heat flow (mW/m2, [2]) and temperature map at 3 km (BLG, °C, [2]) contour maps (solid gray line) superimposed by the fault network traces. The major thrust fault corridors are highlighted in red solid and dashed lines, with black triangles filled with red color demonstrating the most important heat migration paths. CO2 occurrences are noted at the well position inside the AOI if they occur, along with the gas–oil contacts (GOCs). Springs and gas emissions are also pointed, showing the relationship of the fluid migration out of the reservoir in regard to the structural configuration and geometry of the subsurface reservoir.
Geosciences 15 00311 g007aGeosciences 15 00311 g007b
Figure 8. One-dimensional temperature profiles constructed using borehole temperature data within the external structural block C. The light blue horizontal line indicates the boundary between the allochthonous (orange dots) and the autochthonous (green dots) Apulian platform. Variations in the thermal gradient between the two levels are shown. The type of tested water is noted in the graph and correlated with the temperature data (DSTs, production tests, and borehole water samples sourced by composite logs [11]). The distinction between conduction and convection is described in Section 5.3.2.
Geosciences 15 00311 g008aGeosciences 15 00311 g008b
Figure 9. One-dimensional temperature profiles constructed using borehole temperature data within the internal structural block B. The light blue horizontal line indicates the boundary between the allochthonous (orange dots) and the autochthonous (green dots) Apulian platform. Variations in the thermal gradient between the two levels are shown. The type of tested water is noted in the graph and correlated with the temperature data (DSTs, production tests, and borehole water samples sourced by composite logs [11]). The distinction between conduction and convection is described in Section 5.3.2.
Geosciences 15 00311 g009
Figure 10. Scatterplot of temperature versus depth, including corrected temperature data, as provided by the Geothopica database. The dotted gray line shows the least square linear regression curve for both structural blocks, B and C, associated with the thermal anomaly in the area. The dotted orange and green lines show the least square linear regression curves for the structural blocks B and C, respectively.
Geosciences 15 00311 g010
Figure 11. Proposed geothermal model. (a) Geological sections AA′, BB′, and CC′ (for location see Figure 7) showing that the dominant heat transfer mechanisms are advection and convection, with the only exception being the Benevento Sud-1 area, where conduction phenomena take place, as suggested by the vertical changing of the thermal gradient. The red arrows indicate the CO2 preferred migration paths and the corresponding heat transmission from the deep up to the reservoir (advection), and the blue arrows indicate the meteoric water migration path down toward the reservoir. Circulated arrows represent the convection cell phenomena laterally within the reservoir and in cases onwards within the allochthonous unit. The calculated thermal gradients are noted at the wells’ location. Wells are labeled with their name and are tied with the top of the Apulian if they have reached it. Wells’ corresponding order numbers are as follows: Benevento Sud 1 well: No4, Casalbore 2: No14, M. Forcuso 1: No39, M Forcuso 2: No27, Ielsi 1 Bis: No25, Circello 1: No22, Benevento 2: No2, Benevento 3: No3, Tranfaglia-1: No7, Bonito 1 Dir: No23. For well location see Figure 2 and Figure 3. (b) Three-dimensional view of the main fault network (in gray color) and Apulian structural contour map (black contour lines per 200 m) with the temperature anomaly at 3 km (BGL, °C [2]). Specific faults crosscut the thermal anomaly within the AOI.
Geosciences 15 00311 g011
Table 1. Well categorization based on their maximum drilling depth (in meters BGL) and whether they reached the Apulia carbonate formation.
Total Depth Max (m, BGL)0–20002000–40004000–60006000–8000
Wells that drilled Apulia’s carbonate42171
Wells that did not reach Apulia’s carbonate453-
Table 2. Number of wells that encountered the Apulia carbonate formation, categorized by the measured depth at which the formation was reached (in meters BGL).
Measured Depth Reached Apulia Platform (m, BGL)0–20002000–40004000–6000
Wells that drilled Apulia’s carbonate6234
Table 3. Input parameter summary table used into the propagation velocity model.
UnitModelV0 (m/s)K-FactorVint (m/s)RMS ErrorSource
AllochthonousV0-kV0 map0.39-function depending on the well pointTD curves—30 wells inside and surrounding area
Carbonates of Apulia PlatformV0-k54000.2-26.80%TD curves—9 wells inside and surrounding area
Triassic Burrano fm of Apulia platformVint--6800-TD curve—Puglia-1 well
Permian volcaniclastics of Apulia platformVint--5200-TD curve—Puglia-1 well
Table 4. Summary table of the parameters, taking into consideration the geothermal potential ranking of the existing wells within the two structural blocks, B and C.
Well/AreaSBAv. Th. Gradient (°C/km)Cap Rock Thermal Gradient (°C/km)Reservoir Thermal Gradient (°C/km)Dif. Thermal Gradient Between Cap and Reservoir (°C/km)HFMTop Carbo Reservoir (m, BGL)Temperature at the Top of the Reservoir (°C)CO2HCMeteoric H2ORank
Regional-27.526.216.89.4CV---- -
Domain B-28.531.71615.7CV---- -
Domain C-27.625.417.67.8CV---- -
Ben_1C27.527.5---2959107–112yesyesno6(b)
Cast.Pag_1C22.522.9---4201118–147yesnono10
Ben_3C24.330.1−1141.5CV2986118yesyesyes7
Bon_1DirB36.740.2832.2CV2540120nonono1
Circ_1C23.925.810.715.1CV300297–102yesnono2
M.For_1B35.64431.512.5CV112862yesnoyes9
M.For_2B43.54937.511.5CV136667nonono8
Mol_Nord_1C25.22518.56.5CV4063136nonono5
Taurasi_1B27.426.6224.6CV3318105nonono3
Tranfaglia_1C3436.934.92CV2756121yesnono4
Ben_2C30.538.8371.8CV3050120yesyesno6(a)
Ben_Sud_1C31.941.351.1−9.8CD267887yesnoyes-
Disclaimer/Publisher’s Note: The statements, opinions and data contained in all publications are solely those of the individual author(s) and contributor(s) and not of MDPI and/or the editor(s). MDPI and/or the editor(s) disclaim responsibility for any injury to people or property resulting from any ideas, methods, instructions or products referred to in the content.