1. Introduction
Glacier collapse refers to the process by which a significant amount of ice suddenly detaches from the glacier tongue, triggering an ice–rock debris flow. Such instability typically occurs in glaciers with a relatively soft bed and abundant subglacial liquid water. The ice–rock debris flow caused by glacier collapse can travel several kilometers, resulting in devastating impacts on people, livestock, and infrastructure in its moving path [
1]. In recent years, multiple glacier collapse events have occurred in western China. On 17 July 2016, the Aru-1 Glacier in the Aru Mountains, in the western Qinghai–Tibetan Plateau, collapsed, with numerous ice blocks breaking off and shattering. The ice–rock debris surged toward Arucuo Lake, located 6 km downstream from the glacier terminus, generating a deafening roar. As a result, nine herders and hundreds of livestock on the opposite shore of the lake lost their lives [
2,
3]. On 21 September of the same year, a similar collapse occurred at the Aru-2 Glacier, located 2.6 km south of the Aru-1 Glacier. On 16 October 2018, a glacier collapse occurred in the Sedongpu Gully, located on the west bank of the Yarlung Zangbo River in Tibet. A substantial volume of ice–rock debris blocked the Yarlung Zangbo River. The barrier lake formed by the deposited debris damaged a cross-river bridge, submerged riverside roads, and forced nearly 6000 residents to evacuate [
4,
5]. In the 21st century, the Xiaomagou Glacier in the Amnye Machen Mountains, Qinghai–Tibetan Plateau, has experienced five collapses. The first to the fourth collapses occurred in January–February 2004, October 2007, October 2016, and July 2019, respectively, causing serious damage to downstream roads and pastures [
6,
7,
8,
9]. During the authors’ investigation of the Xiaomagou Glacier on 7 August 2024, local herders told the authors that another collapse occurred on 3 August 2024. At that time, the collapsed ice melted, forming a flood that washed away a temporary road built over the previous collapse deposits, thereby interrupting the road connecting Guigou Town and Qiemada Town in Maqin County. Since glacier collapse can cause large-scale disasters, it is imperative to conduct disaster prevention and mitigation efforts against glacier collapse. Collapse scenario simulations intuitively present the collapse process and its consequences, facilitating the assessment of the possible range and severity of a glacier collapse’s impacts. Hence, it can provide essential guidance for formulating disaster prevention and mitigation strategies as well as emergency response measures.
With the help of advanced physical models, researchers can simulate the flow velocity, path, depth, impact force, and other factors of multiphase debris in a three-dimensional environment [
10,
11,
12,
13,
14]. The main debris-flow simulation models include the Coulomb [
15], Voellmy [
16], Bingham [
17], and Manning models [
18]. These models describe the movement of debris based on different frictional and rheological properties. Based on the principle of static friction, the Coulomb model simulates the resistance of debris flows using cohesion and the base friction angle, making it suitable for modeling the resistance of landslide materials [
15]. The Voellmy model was built upon the Coulomb model by adding turbulent friction. Within this model, the movement of debris is controlled by both the base friction angle and the fluid velocity, allowing for a better simulation of snow avalanches and rapid debris flow [
16]. The Bingham model treats debris flow as a plastic flow with yield stress. It limits the movement of debris using ultimate shear stress and viscosity coefficients and can describe flow behavior under different shear rates, making it suitable for simulating high-viscosity mudflows [
17]. The Manning model is widely used for calculating the resistance and flow velocity of water and debris flows. It takes into account the influence of multiple parameters on base resistance and focuses on mass flow in complex hydraulic environments and is especially suitable for hydraulic simulations in complex terrains [
18]. The selection of a model impacts the results of scenario simulation. The ice–rock debris generated by glacier collapse consists of ice bodies, rock fragments, moraines, frozen soil, liquid water, and so on [
19]. The Voellmy model considers the dual effects of Coulomb friction and turbulent friction. Coulomb friction effectively simulates the resistance among solid particles such as rock fragments and moraines, which is similar to the friction generated by the interaction of different solid particles in glacier collapse debris flow. Turbulent friction effectively captures the complex interactions between the debris and the surrounding air or other media when the debris flows at high speed. Moreover, this model is characterized by flexible and adjustable parameters. It adapts well to complex terrains and is capable of predicting debris-flow path and speed based on different slopes and geomorphological characteristics [
16,
20]. Therefore, compared to other models, the Voellmy model is more suitable for simulating glacier collapse.
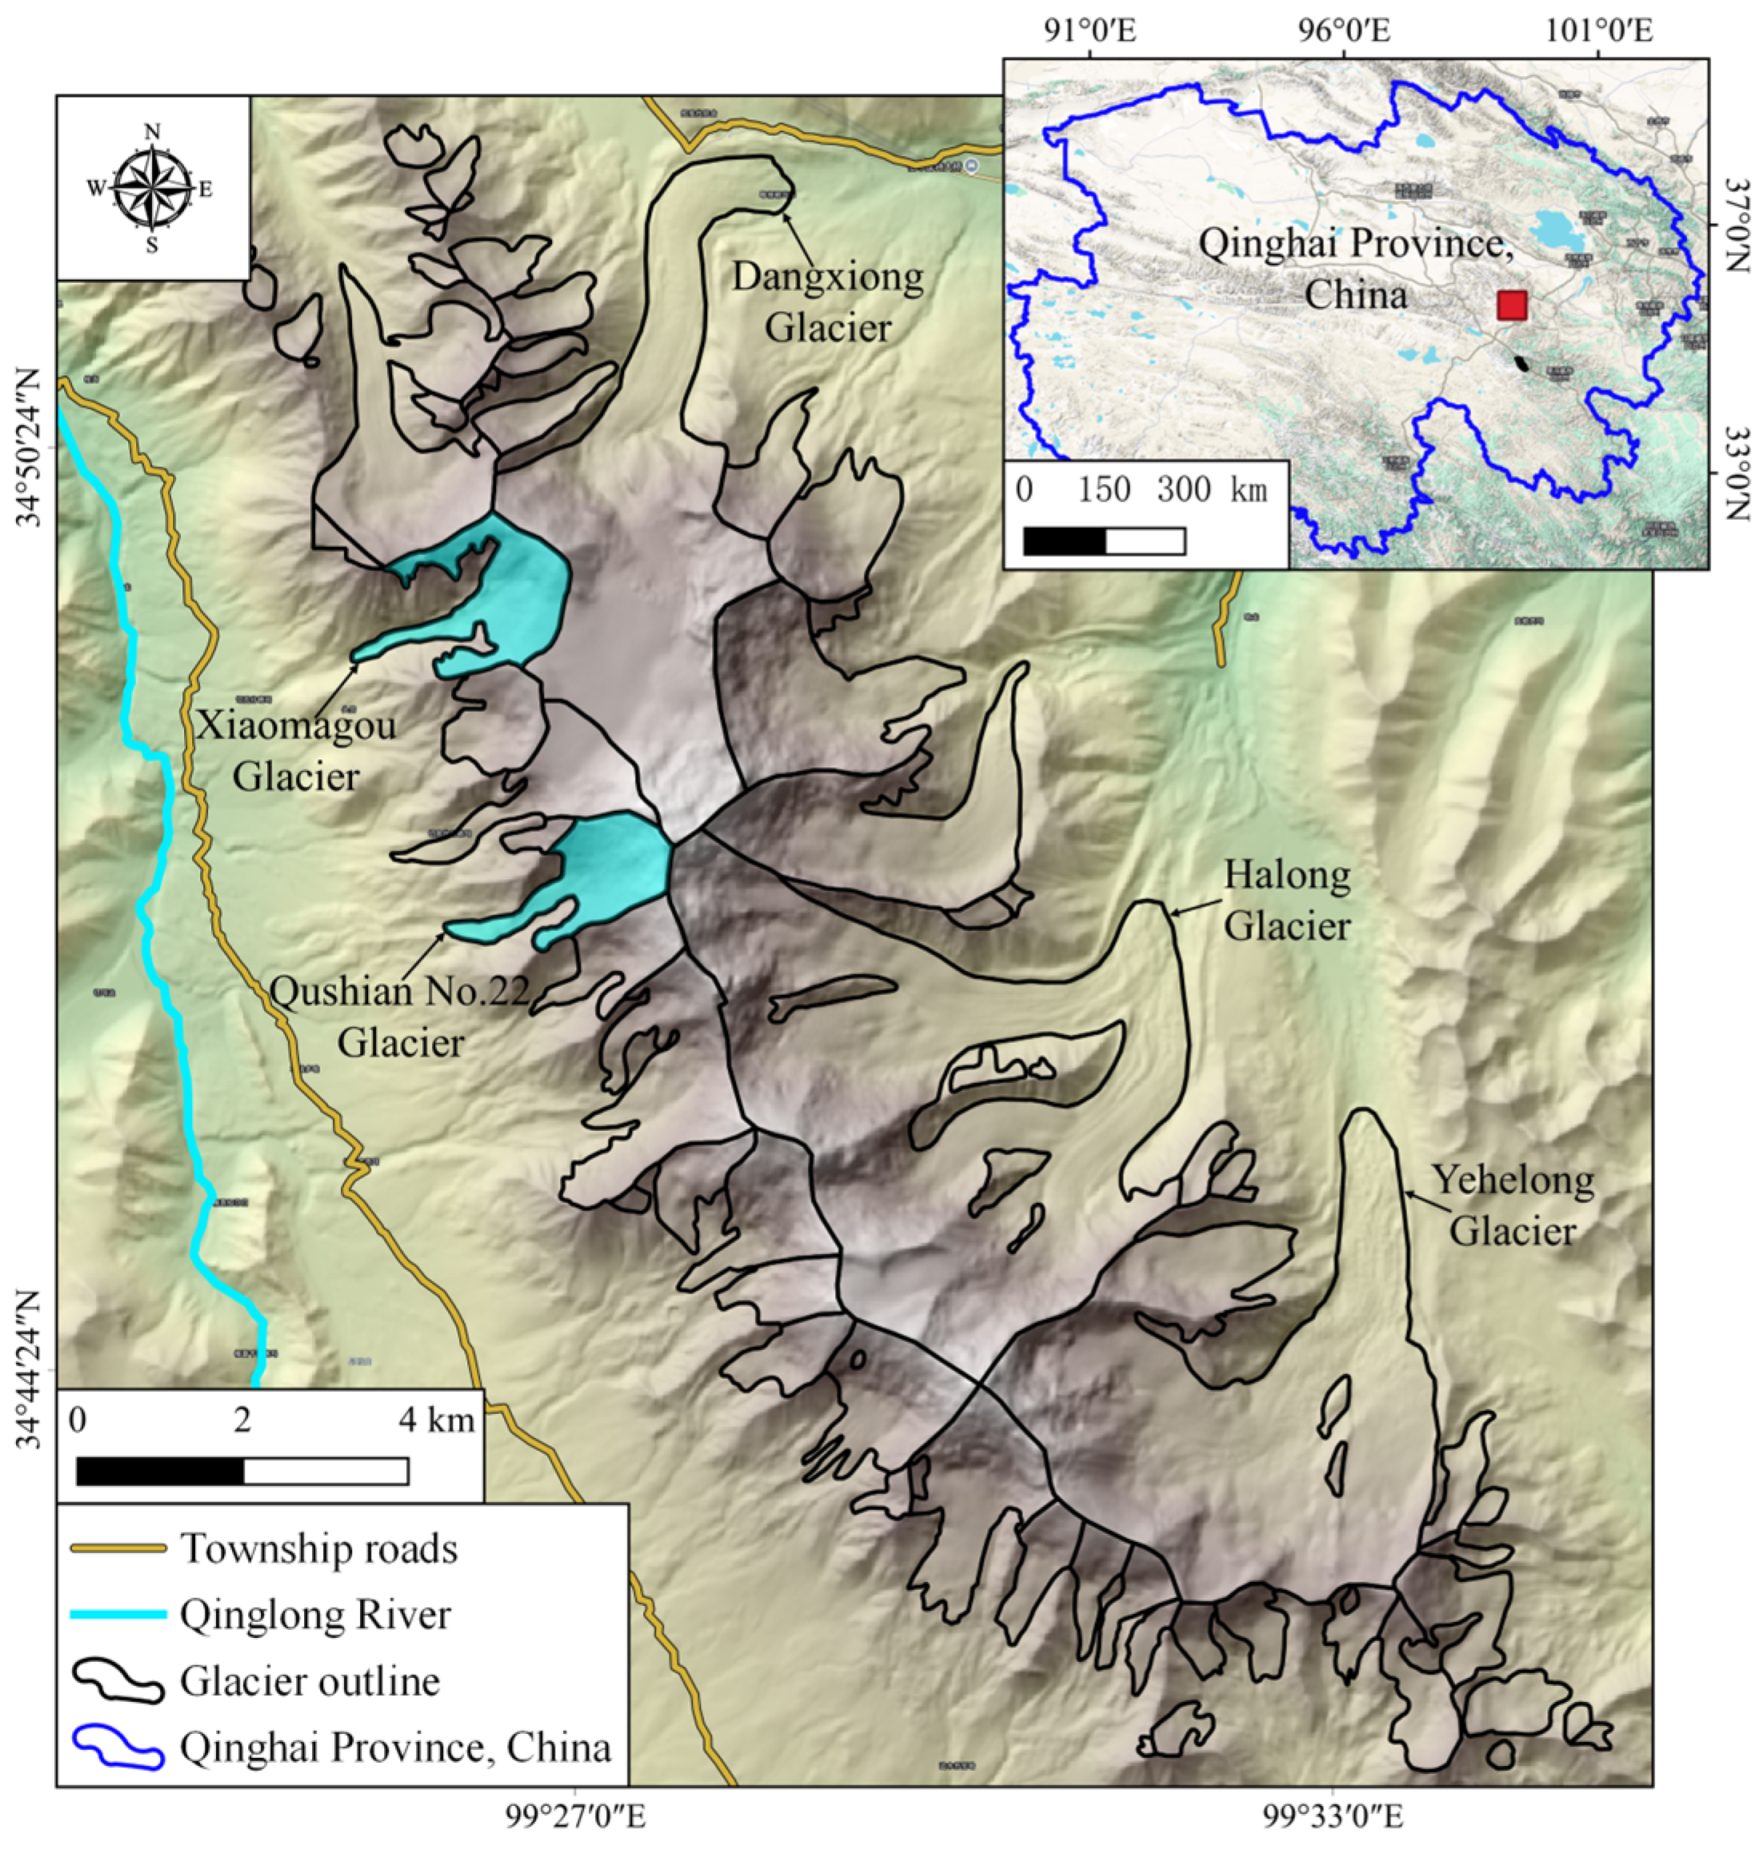
Currently, there are very few studies on glacier collapse scenario simulations. The multiple large-scale collapses of the Xiaomagou Glacier have made the western piedmont zone of the Amnye Machen Mountains a key area for geological disaster prevention and control in Qinghai Province, China. After field investigation and remote sensing analysis, the authors found that the Qushi’an No. 22 Glacier (see its location in
Figure 1) shares similar terrain and bedrock lithology with the Xiaomagou Glacier. The Xiaomagou Glacier and the Qushi’an No. 22 Glacier are both located on the steep western slope of the Amnye Machen Mountains, less than 4 km apart. They share similar geomorphological settings, with cirques formed on steep bedrock walls and long, narrow tongues stretching into valley floors. Both glaciers rest on soft lithologies, primarily arkose and slate, which are prone to failure under stress. And more importantly, the Qushi’an No. 22 Glacier is exhibiting the instability that the Xiaomagou Glacier ever exhibited before each of its collapses [
21], including icefall from the cirque, surge-like behavior, and terminus advance. These factors indicate that the Qushi’an No. 22 Glacier may undergo a collapse process similar to that of the Xiaomagou Glacier.
However, if the Qushi’an No. 22 Glacier were to collapse, what would be the potential flow paths, runout distances, deposition patterns, and associated disaster impacts? In order to answer these scientific questions, we conducted collapse numerical simulation via the Voellmy model and analyzed the simulation results in detail. At first, numerical simulations were conducted for the Xiaomagou Glacier 2004 collapse. The key parameters of the Voellmy model were optimized based on the real deposition area of the 2004 collapse. Then, the Voellmy model with optimized parameters was used for the numerical simulation of the Qushi’an No. 22 Glacier collapse. The mass source area was defined based on the features of changes in glacier flow velocity, and the absolute thickness of the mass source was estimated based on changes in glacier boundary and thickness. Field ground-penetrating radar (GPR) measurement was also conducted on the Qushi’an No. 22 Glacier to evaluate the estimated mass source thickness. The simulation results were then used to analyze the possible runout paths, hazard extent, and potential impacts on roads, pastures, and downstream communities. This research contributes to both the scientific understanding of glacier collapse processes and the practical needs of disaster prevention in Qinghai’s mountainous regions.
2. Study Area
The Amnye Machen Mountains, located in the southeastern Qinghai Province, China (
Figure 1), are part of the middle branch of the eastern Kunlun Mountains. They are the largest snowy mountains in the source area of the Yellow River. The highest peak has an elevation of 6282 m a.s.l. [
22]. Records from the Dari National Meteorological Station (at an altitude of 4000 m, approximately 110 km from the Amnye Machen Mountains) show that the average annual temperature in this area from 2005 to 2022 was −4.0 °C, with an increase of 0.3 °C per decade. The rate of warming in this area is comparable to the average level for the Qinghai–Tibetan Plateau. The annual precipitation in this area is 514 mm, with relatively small fluctuations over the past 50 years [
8]. Summer precipitation accounts for 56~62% of the annual precipitation. Precipitation on the west side of the mountain is less than that on the east side [
23].
The Amnye Machen Mountains nurture many glaciers. Overall, the eastern slope of the mountains is relatively gentle, while the western slope is relatively steep (see
Figure 1). Several large glaciers have developed on the eastern slope. Among them, the Halong Glacier is the largest glacier in the source area of the Yellow River, with an area of 2.05 × 10
7 m
2 in 2024. The Yehelong Glacier and Dangxiong Glacier are the second- and third-largest glaciers in the Amnye Machen Mountains, with areas of 1.76 × 10
7 m
2 and 1.25 × 10
7 m
2 in 2024, respectively. On the western slope, multiple cirque glaciers and hanging glaciers are developed. Most of them have steep and fan-shaped accumulation zones. Long and slender glacier tongues are formed after the mass in the accumulation zones flows into narrow valleys. Among them, the Xiaomagou Glacier and the Qushi’an No. 22 Glacier are the main study objects of this study.
The area of the Xiaomagou Glacier (RGI6.0 number: RGI60-13.23943) is 2.26 × 10
6 m
2 (in 2024). As mentioned in the introduction, the Xiaomagou Glacier has experienced five collapses since 2004. The collapse that occurred in 2004 was the largest in scale and had the widest impact. The collapse that occurred on 3 August 2024 was the smallest in scale, but it still disrupted local traffic. According to the authors’ previous research [
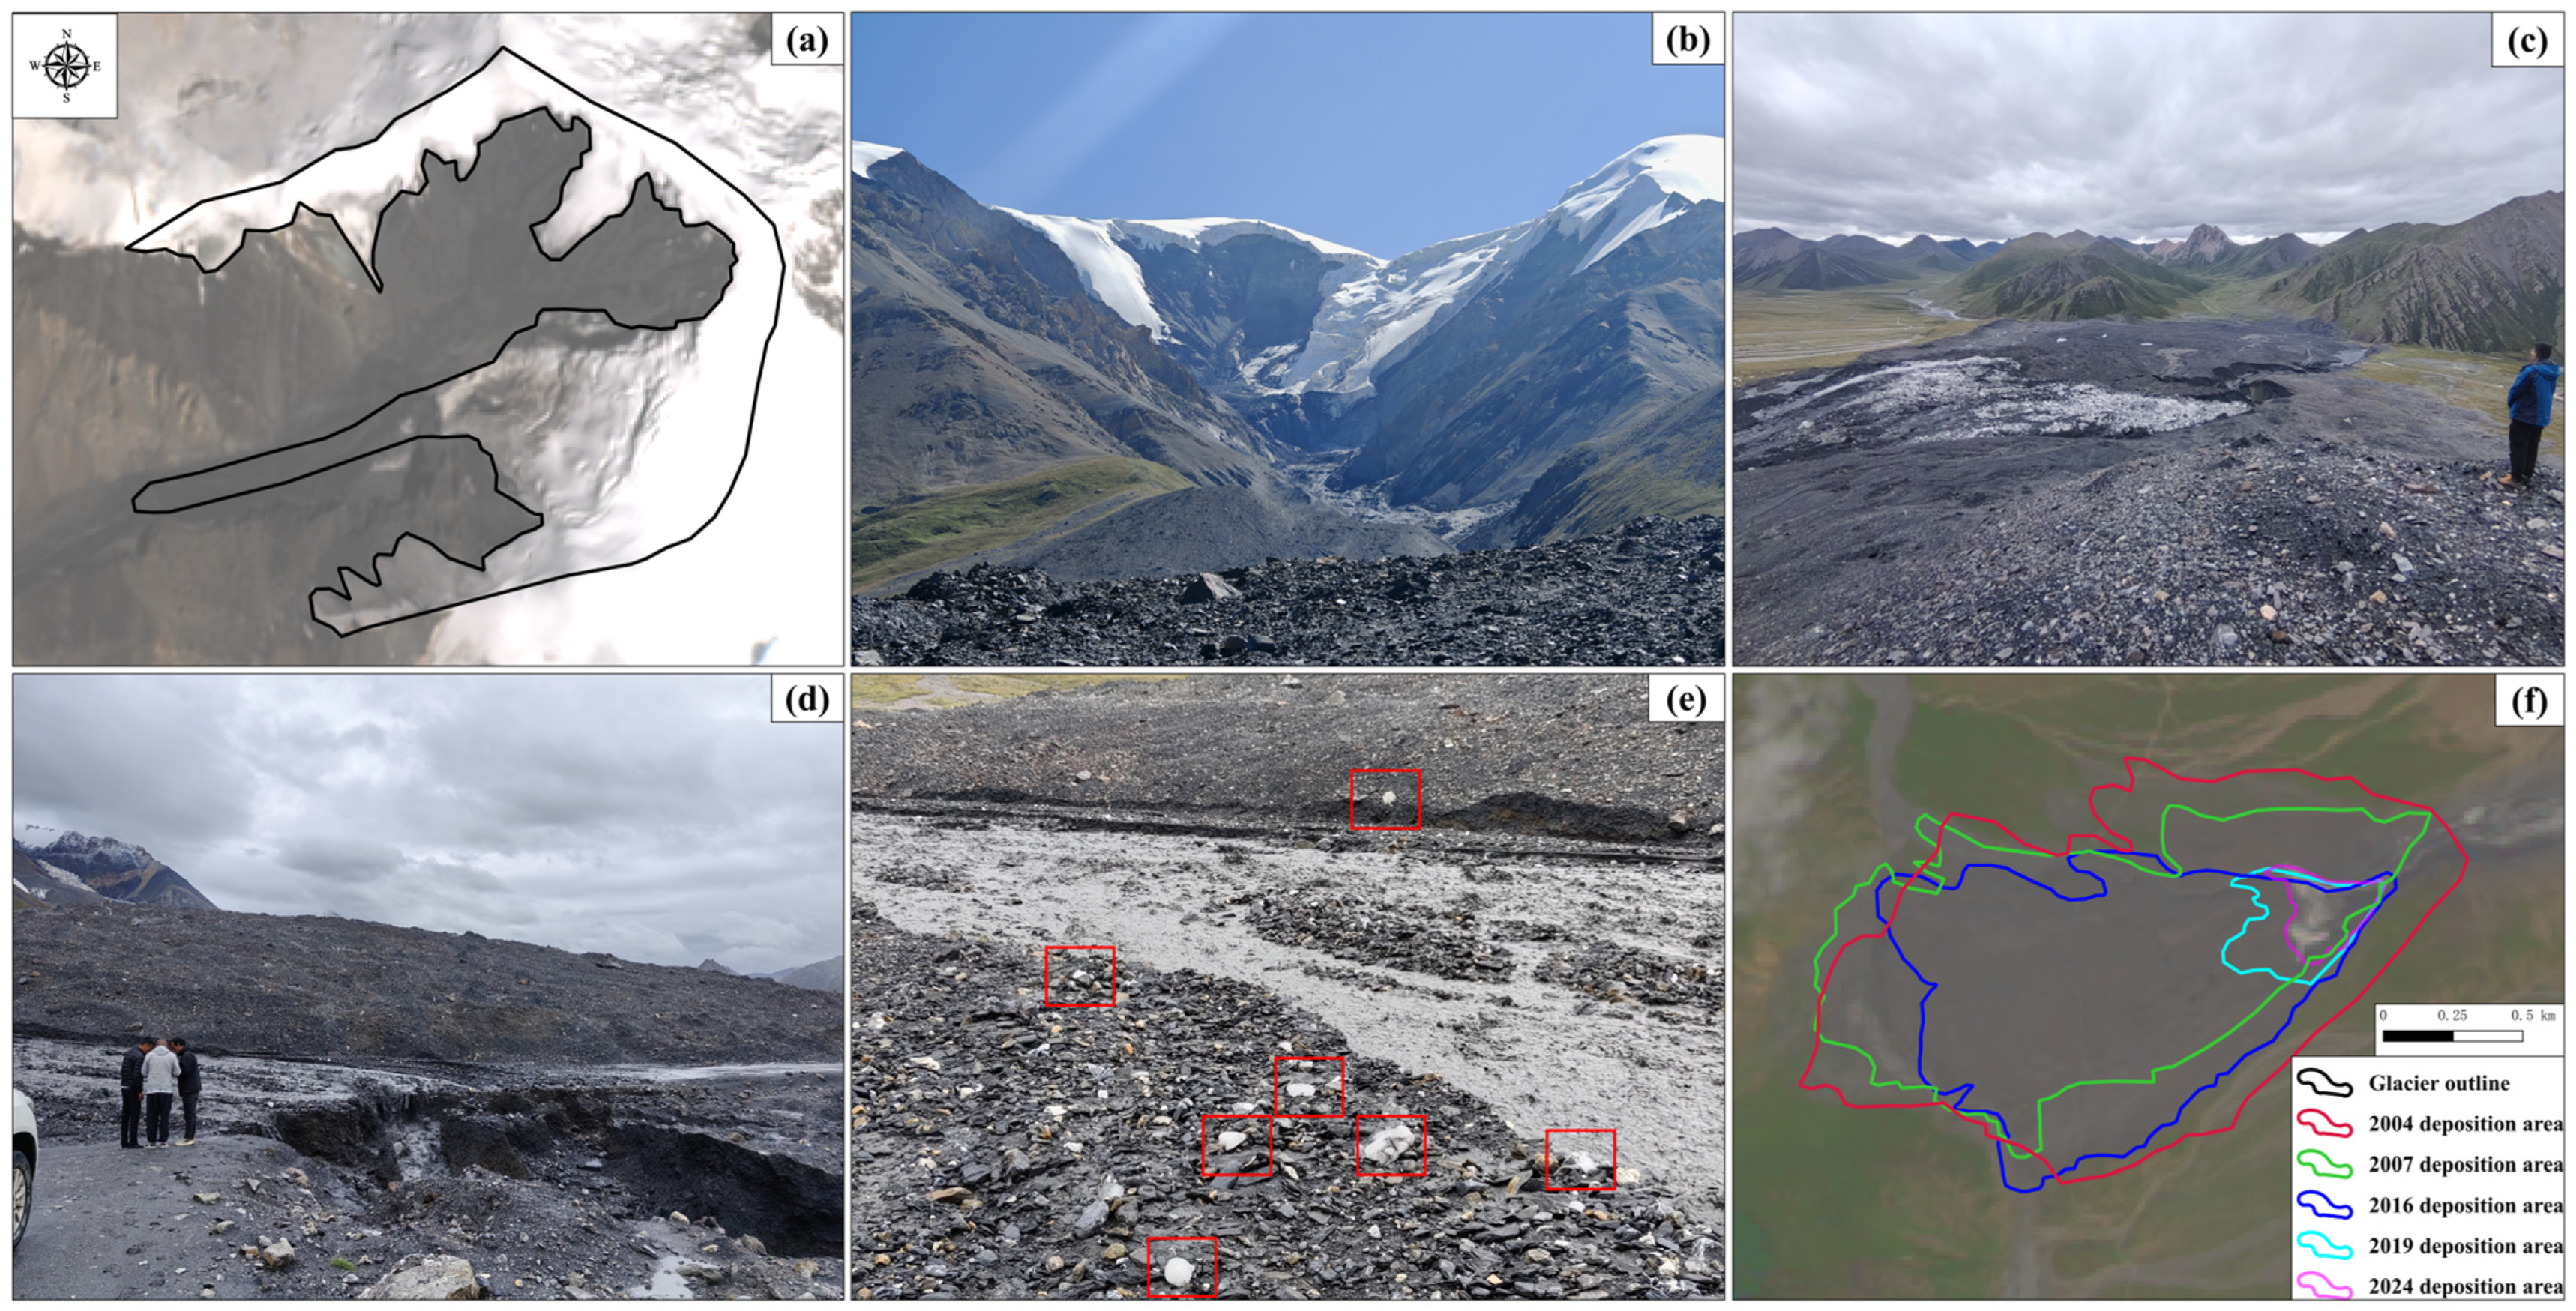
21], icefall in the cirque and terminus advance were observed before each collapse of the Xiaomagou Glacier. The overview of Xiaomagou Glacier is shown in
Figure 2.
The Qushi’an No. 22 Glacier (RGI6.0 number RGI60-13.23947) is located south of the Xiaomagou Glacier, with an area of 1.88 × 10
6 m
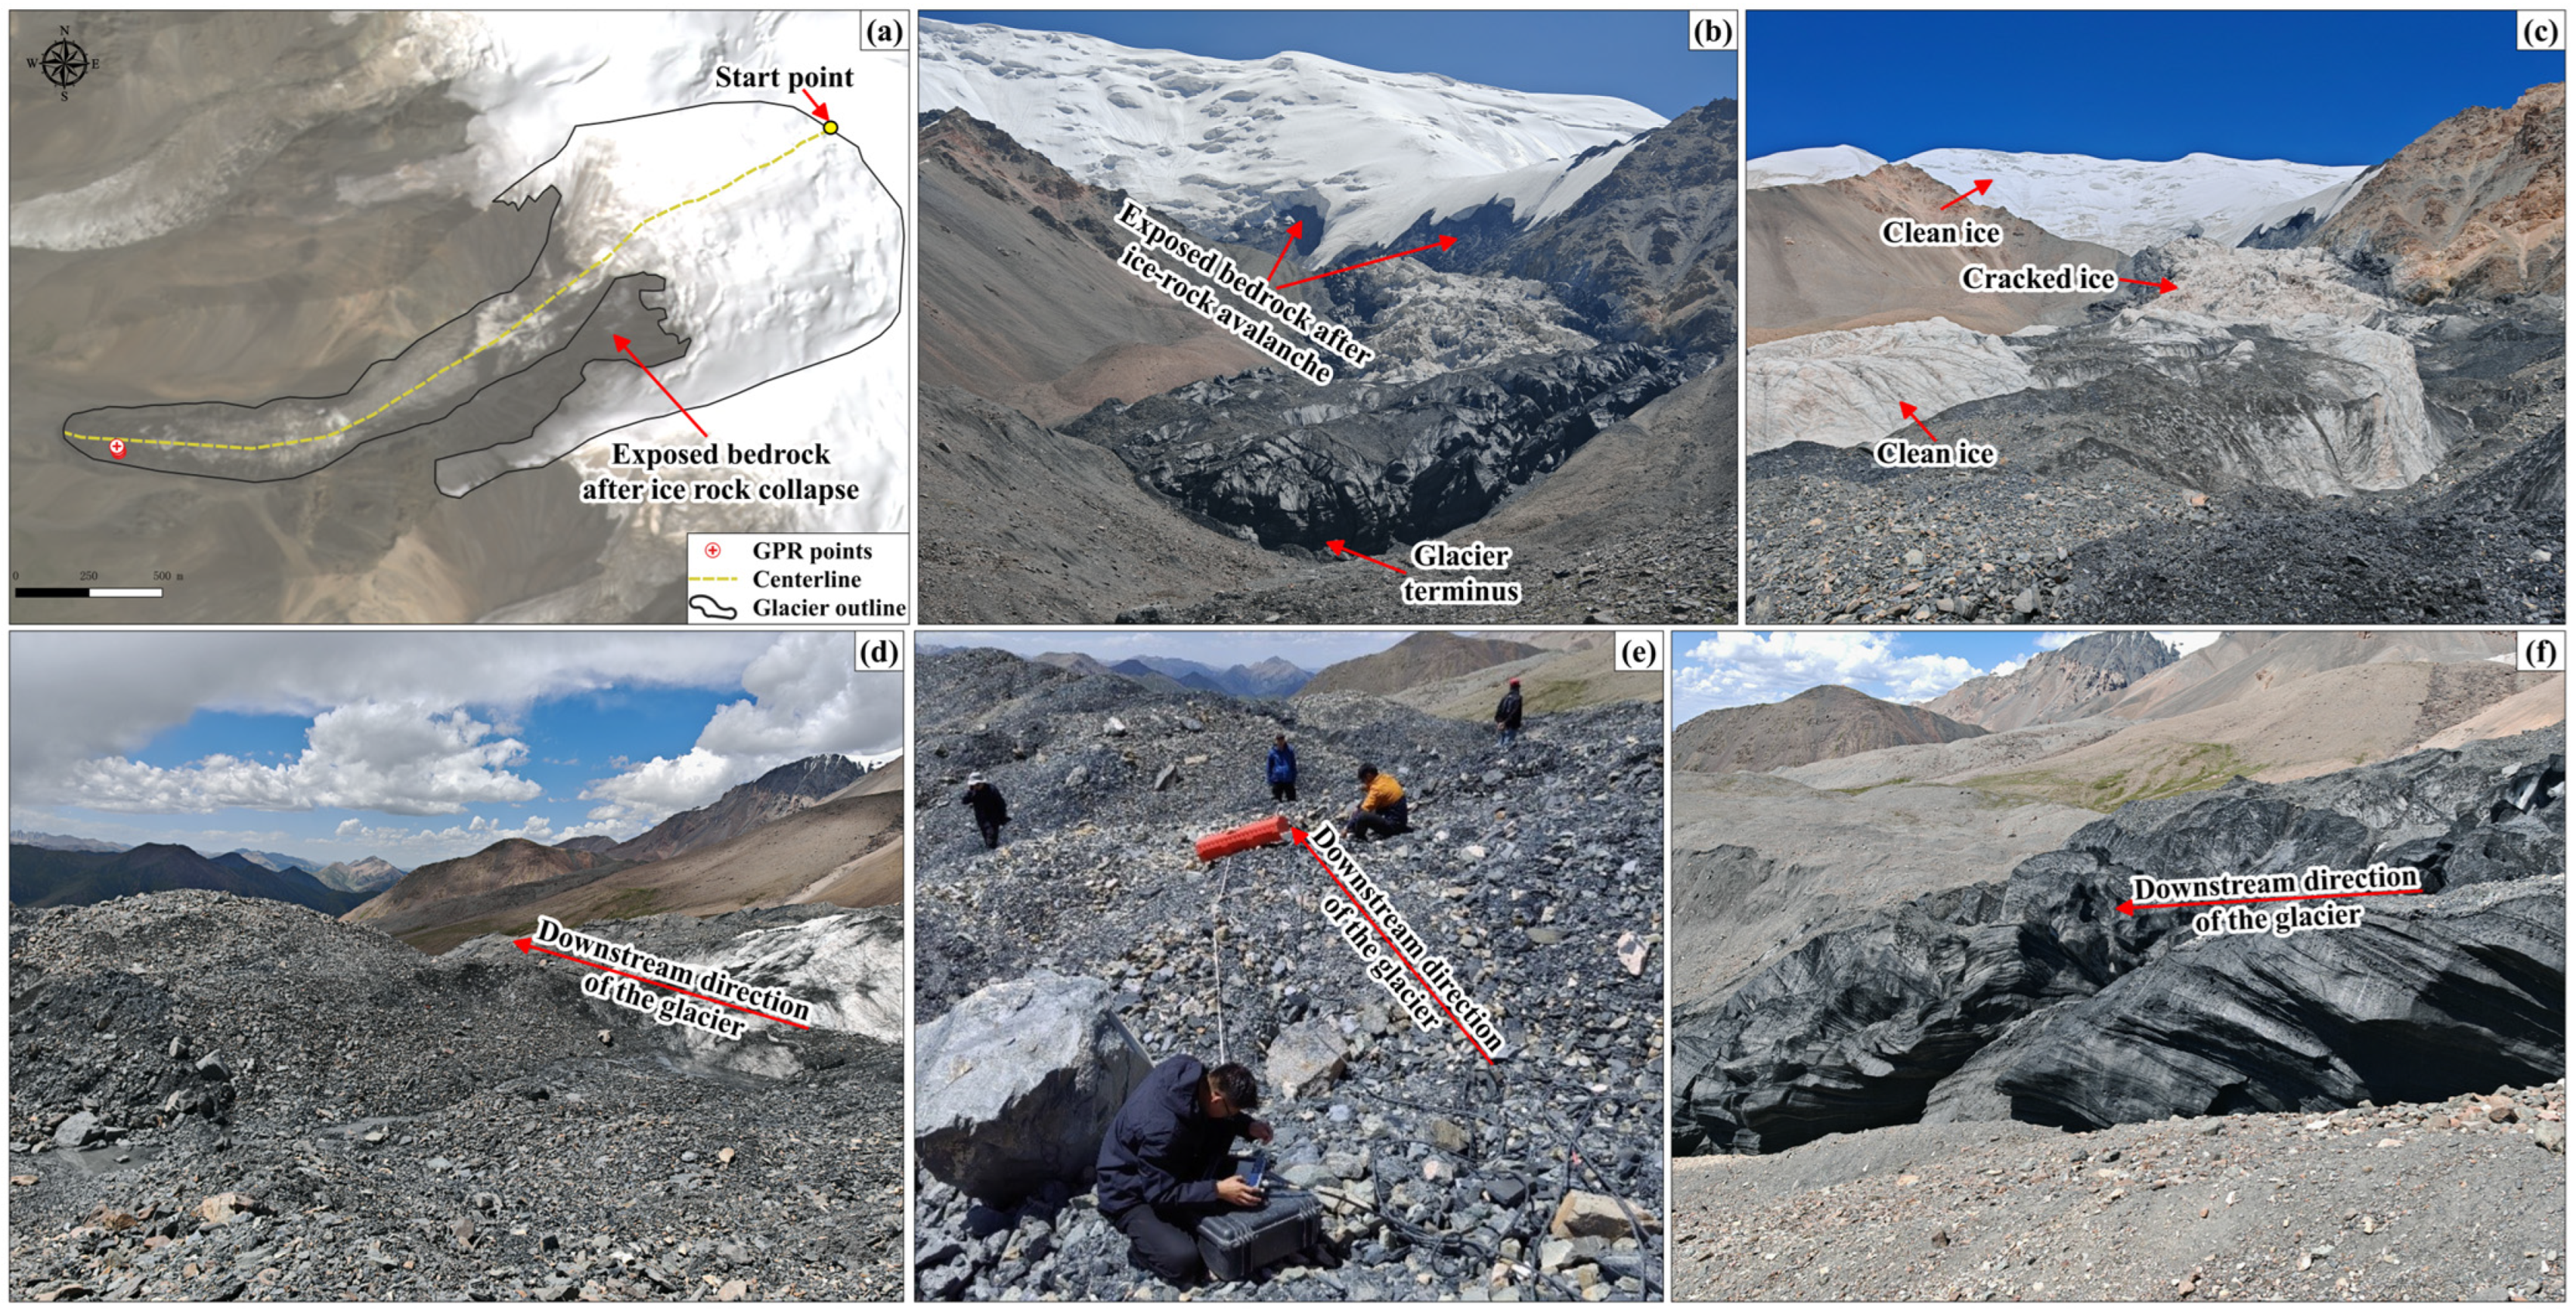
2 (in 2024). The average slope of its tongue (18.1°) is slightly lower than that of the Xiaomagou Glacier (19.7°). During the field investigation on 5 August 2024, the authors found obvious ice–rock fall traces at the junction between the cirque and the glacier tongue. The exposed ice body in the upper part of the glacier tongue is highly fragmented and is suspected to be deposits of a recent icefall in the cirque. Further down, ice bodies with relatively flat and clean surfaces, ice bodies covered with thick moraine, and ice bodies covered with thin moraine are distributed in sequence. In addition, the terminus of the glacier is steep, which indicates that the glacier is advancing. These signs are consistent with the authors’ previous conclusion drawn from remote sensing observations, that the Qushi’an No. 22 Glacier has successively experienced cirque icefall, terminus advance, and tongue acceleration since 2018 [
21]. At present, a large amount of debris generated by icefall has accumulated over the tongue, and a considerable part of the debris has moved to the zone within 1000 m of the terminus.
4. Scenario Simulation of the Collapse of the Xiaomagou Glacier
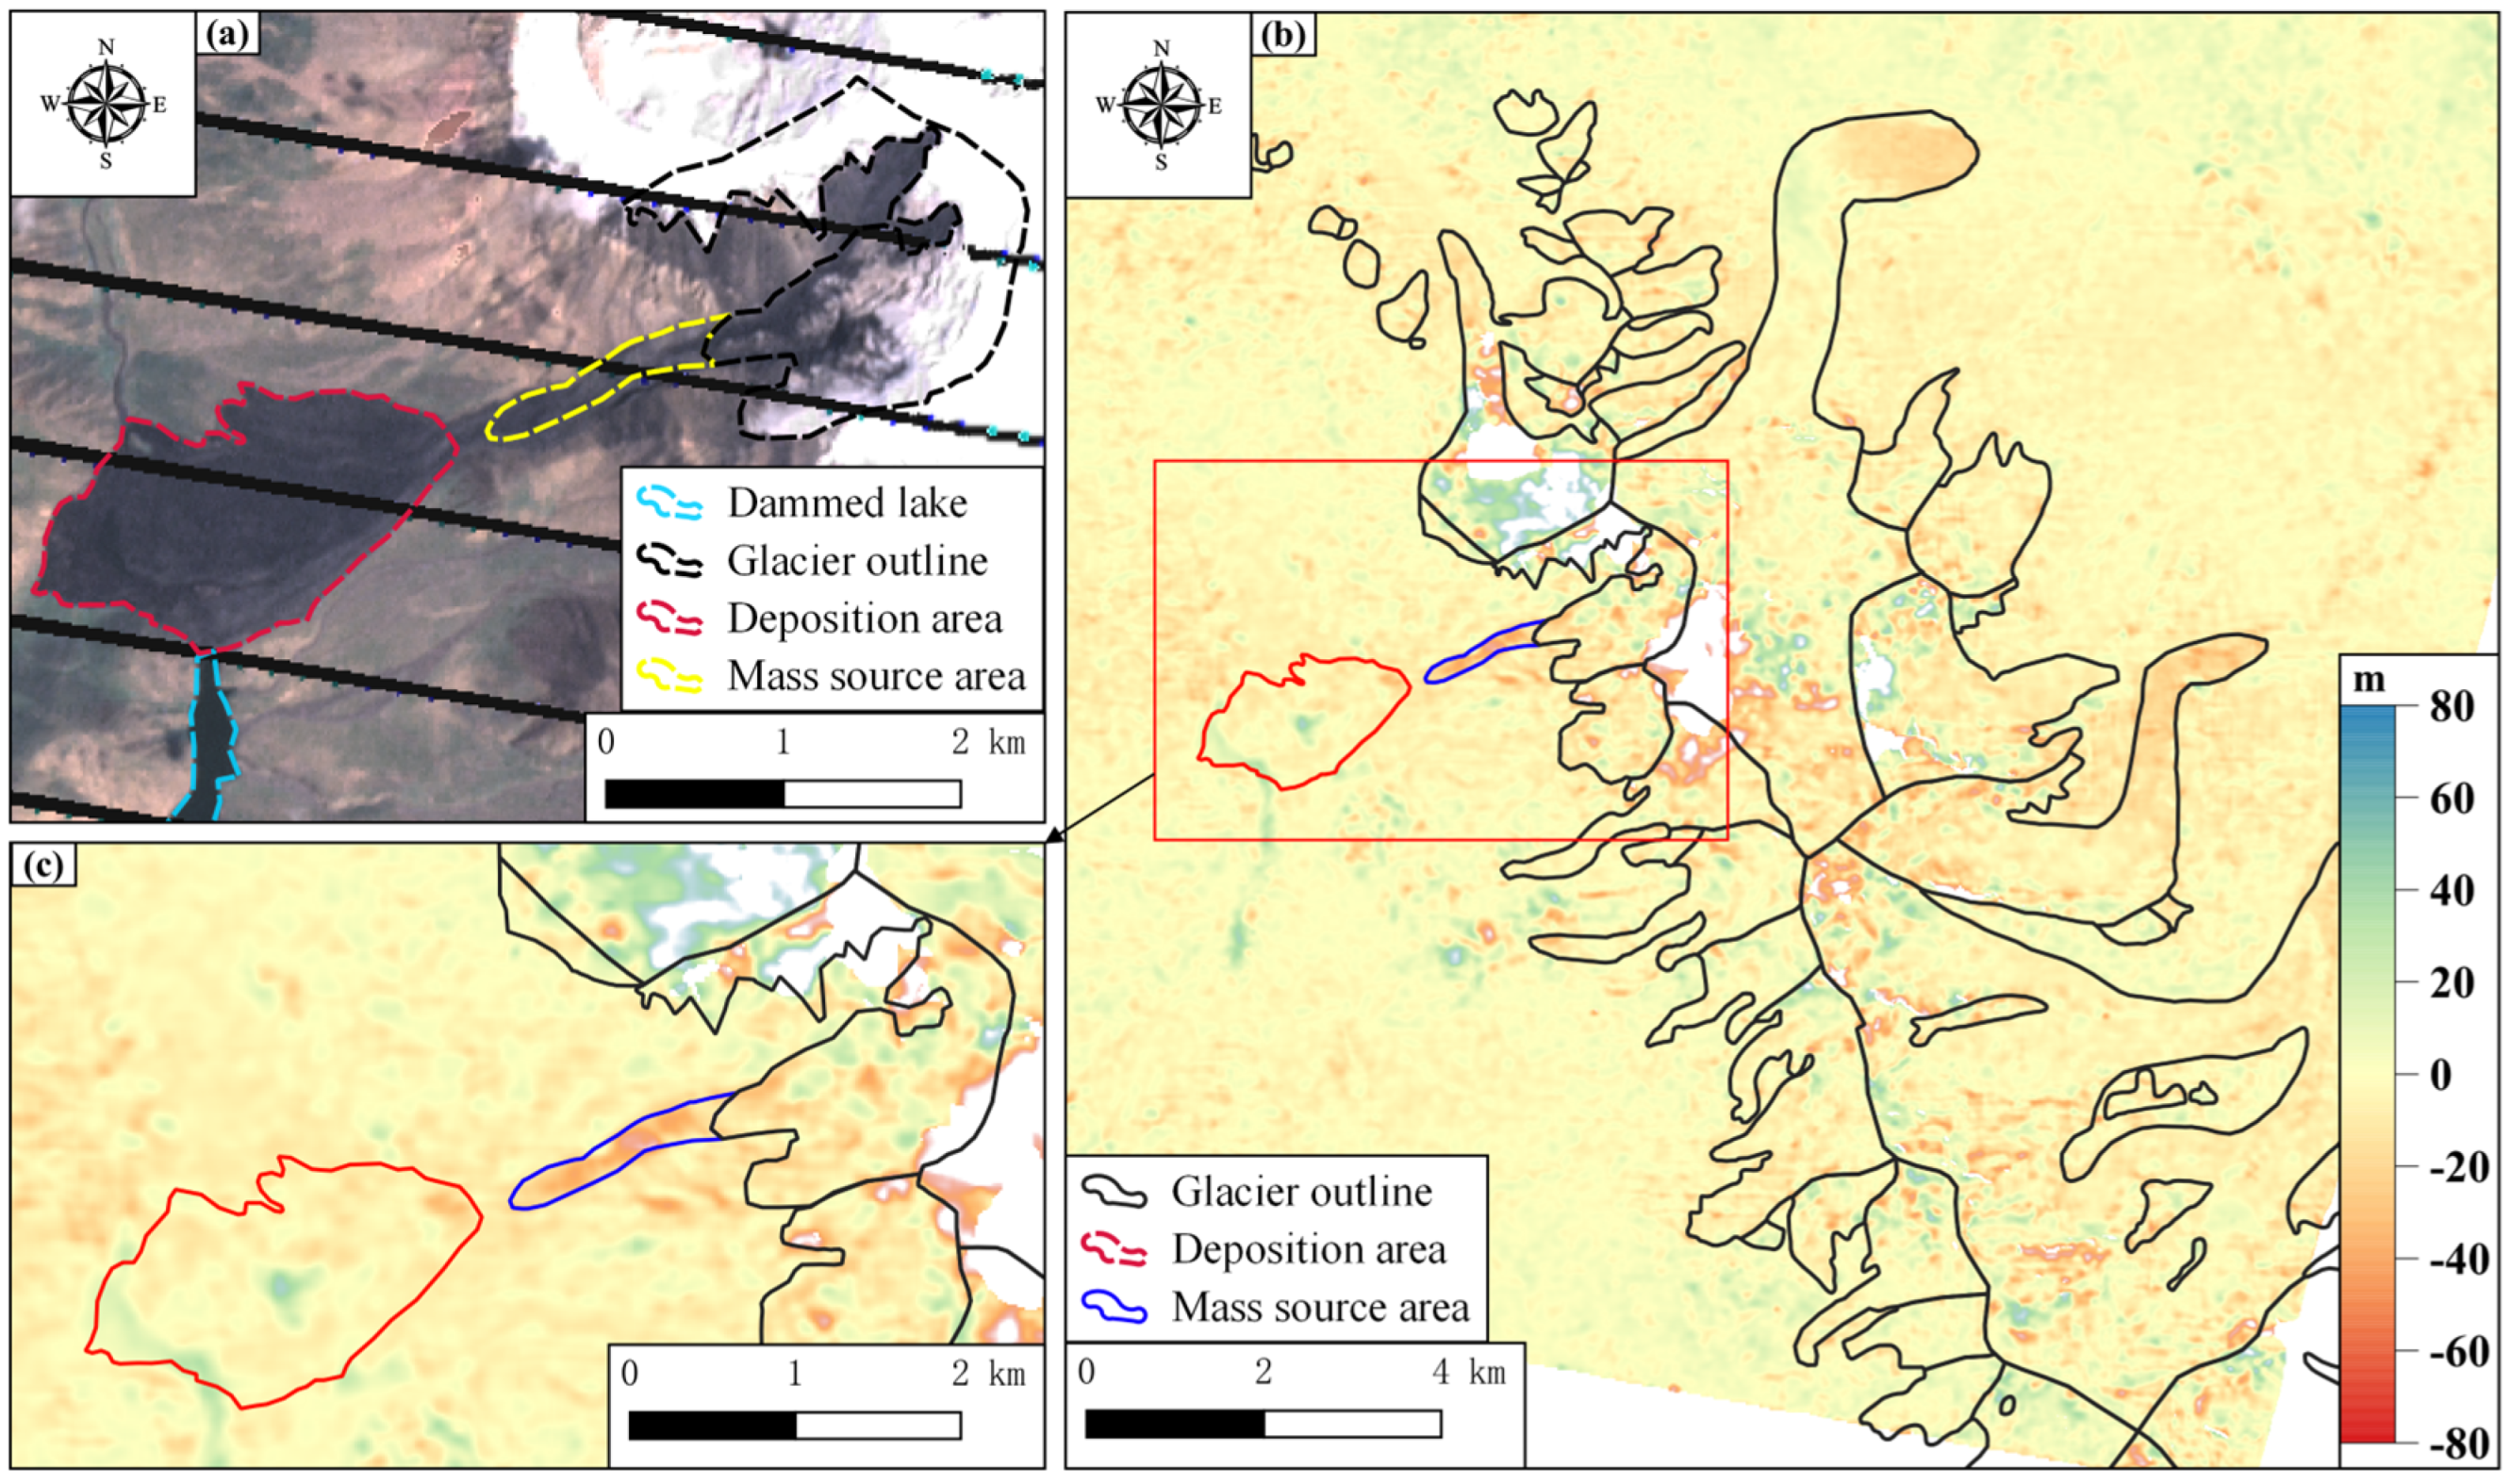
The mass source area (i.e., detached area) and the deposition area of the Xiaomagou Glacier 2004 collapse can be discerned in the optical images (
Figure 4). The mass source area covers approximately 2.14 × 10
5 m
2, and the deposition area spans approximately 2.21 × 10
6 m
2. Within the mass source area, the change in surface elevation derived by differencing the ASTER DEMs before and after the collapse (4 October 2000 and 13 September 2004) was regarded as the glacier thickness change caused by the collapse (
Figure 4). Due to cloud cover and snow/ice coverage, the elevation changes in some areas (particularly in the glacier accumulation zone) were significantly biased and were masked out. The results indicate that the thickness of the mass source area has decreased by more than 30 m. The volume of the mass released by the collapse is approximately 5.71 × 10
6 m
3. The thickness of the fan-shaped deposition area’s edge exceeds 20 m.
According to reported glacier collapse data [
13,
19,
28], the simulation duration was set to 150 s. After multiple experiments, various combinations of the basal friction angle, turbulence coefficient, and internal friction angle were tested. The simulation results were compared with the actual deposition area. The parameter set that produced the highest synthetic performance index (SPI), while remaining physically consistent with the known geological conditions of the bedrock, was selected as the optimal configuration. The final determined values were a basal friction angle of 5°, a turbulence coefficient of 3.3, and an internal friction angle of 10°.
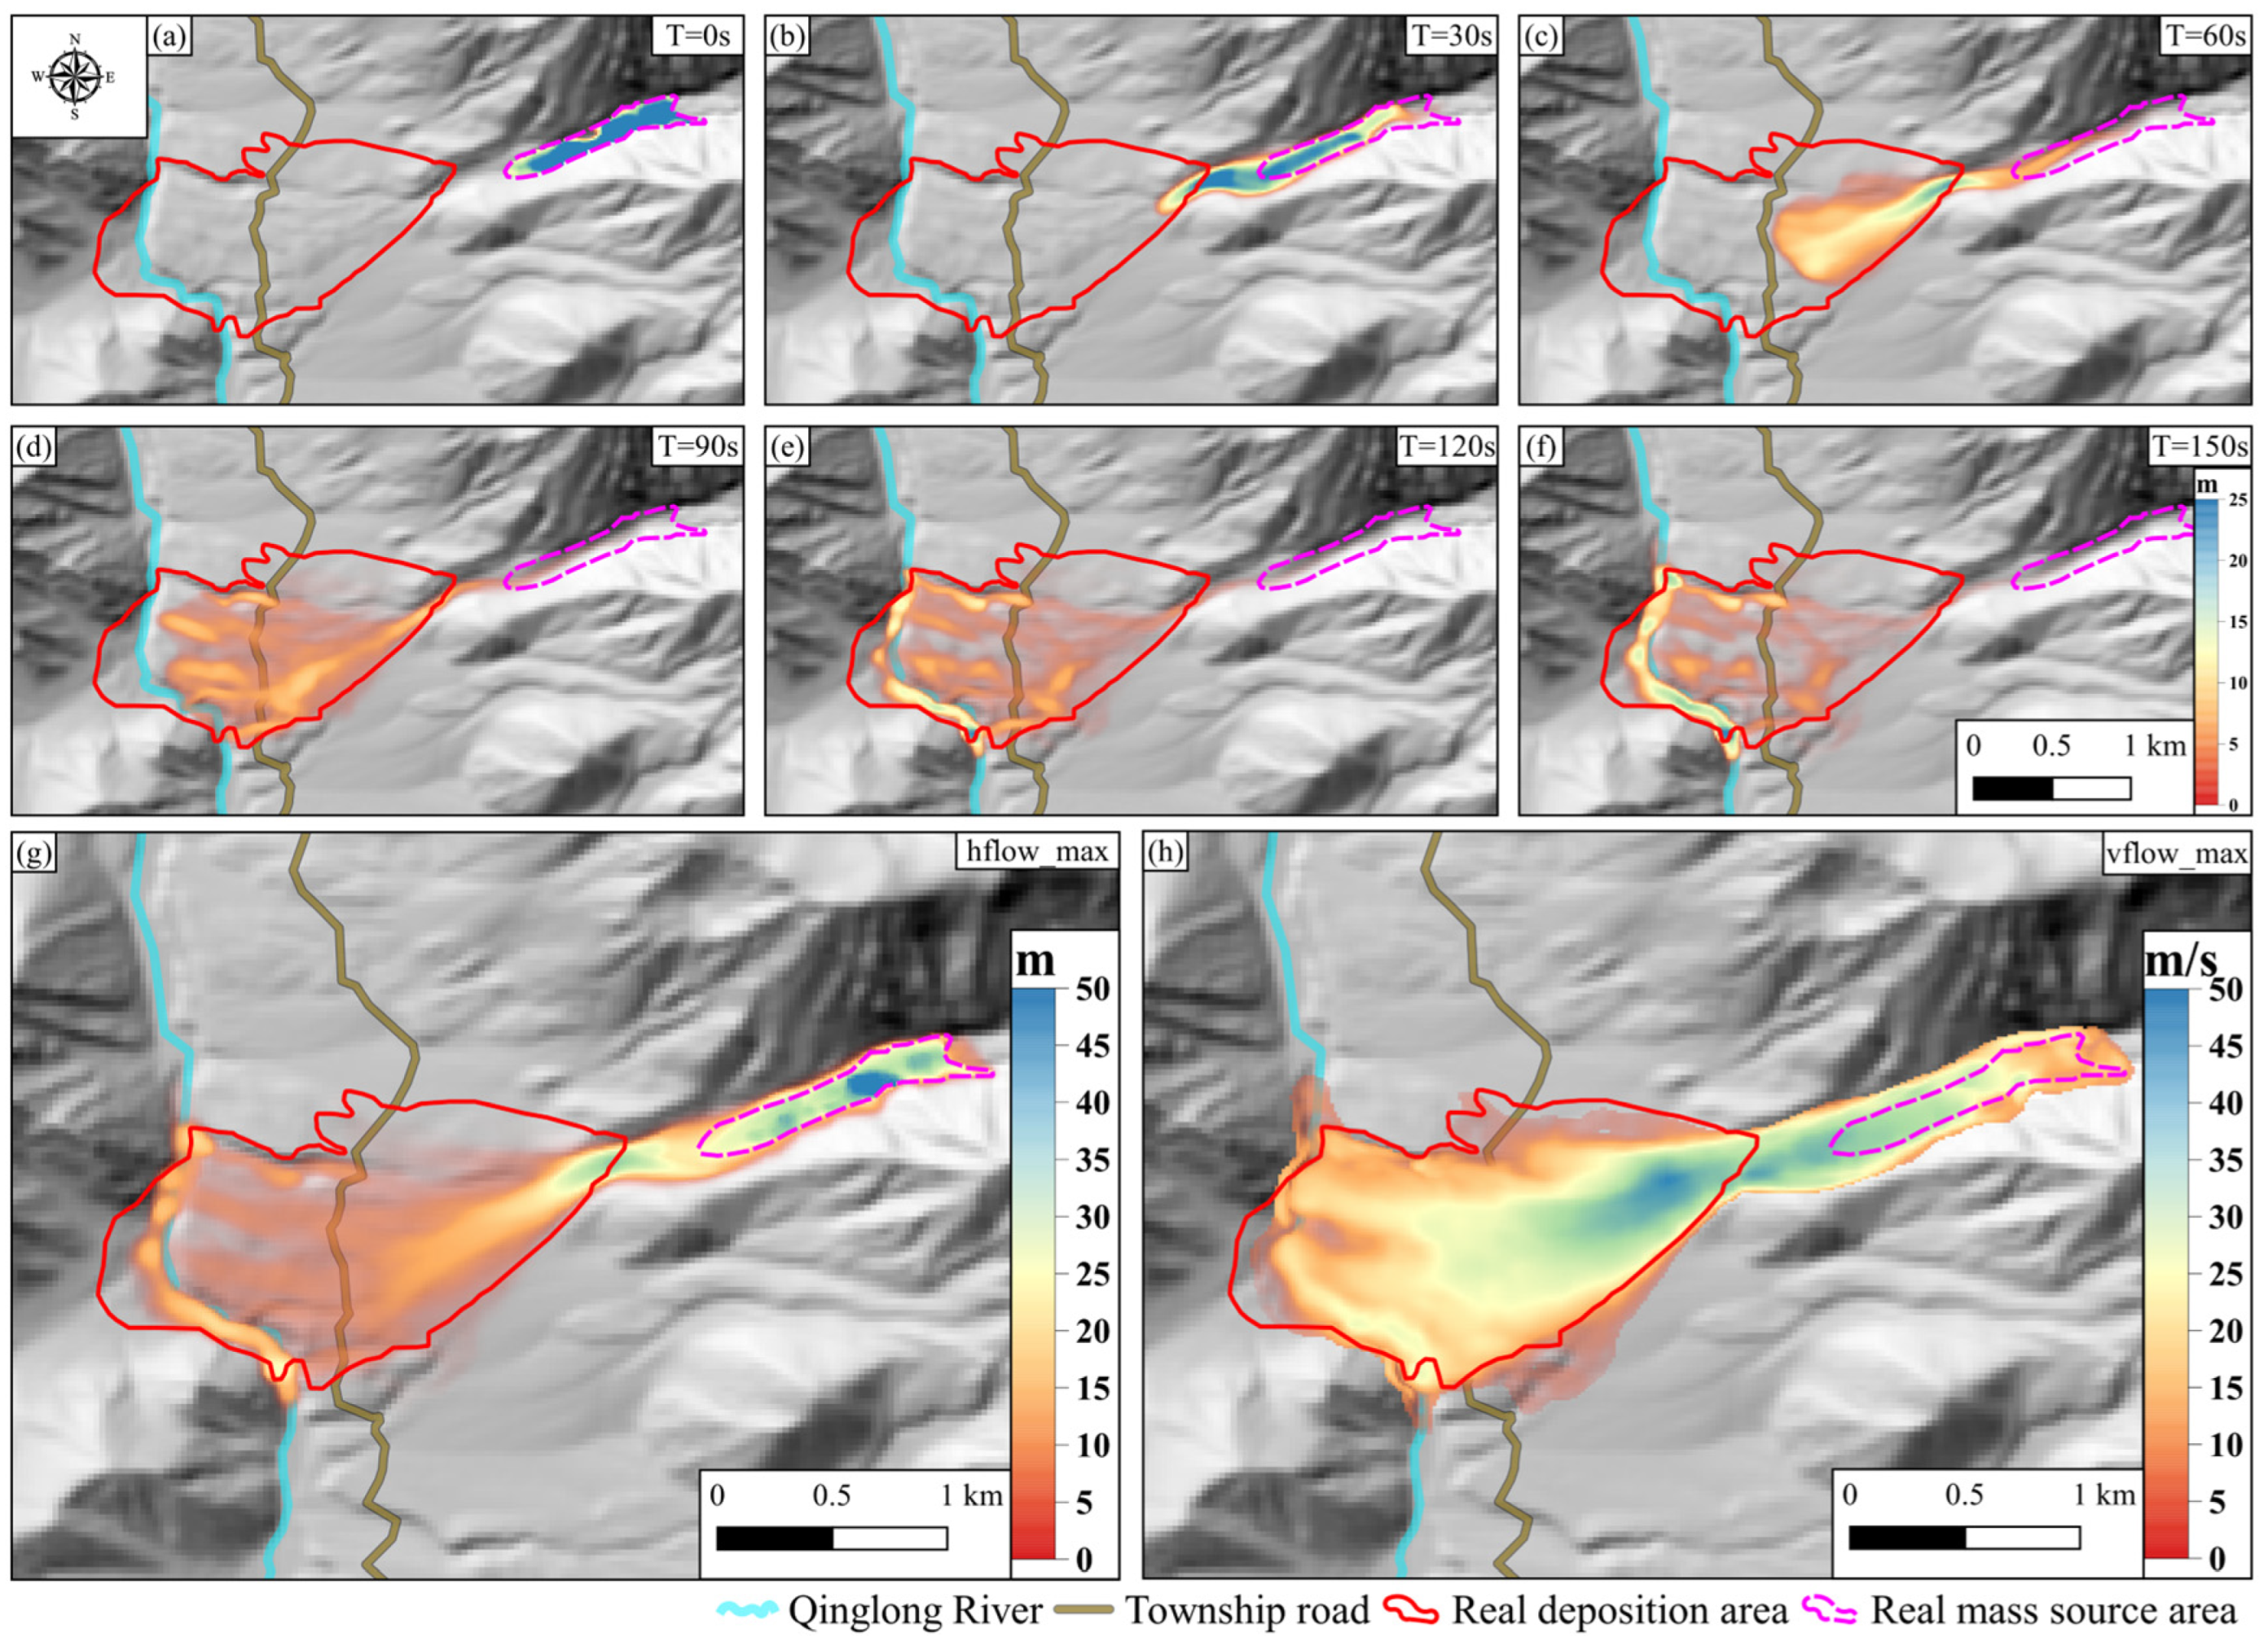
Figure 5 illustrates the simulated flow mass depth at different times (T = 0 s, 30 s, 60 s, 90 s, 120 s, and 150 s). The simulation results show that 90 s after the initiation of collapse, all released material exits the mouth of the Xiaomagou gully. A significant amount of debris eventually deposits between the gully mouth and the Qinglong River. Some areas exhibit a deposition height of up to 20 m, consistent with the real dam height of the barrier lake [
7]. Both the mass flow depth and flow velocity peak at the gully mouth. This is reasonable because the slope suddenly reduced at the gully mouth, facilitating the conversion of substantial gravitational potential energy into kinetic energy. The maximum mass flow depth and the maximum mass flow velocity reach 33 m and 48 m/s, respectively.
5. Scenario Simulation of the Collapse of the Qushi’an No. 22 Glacier
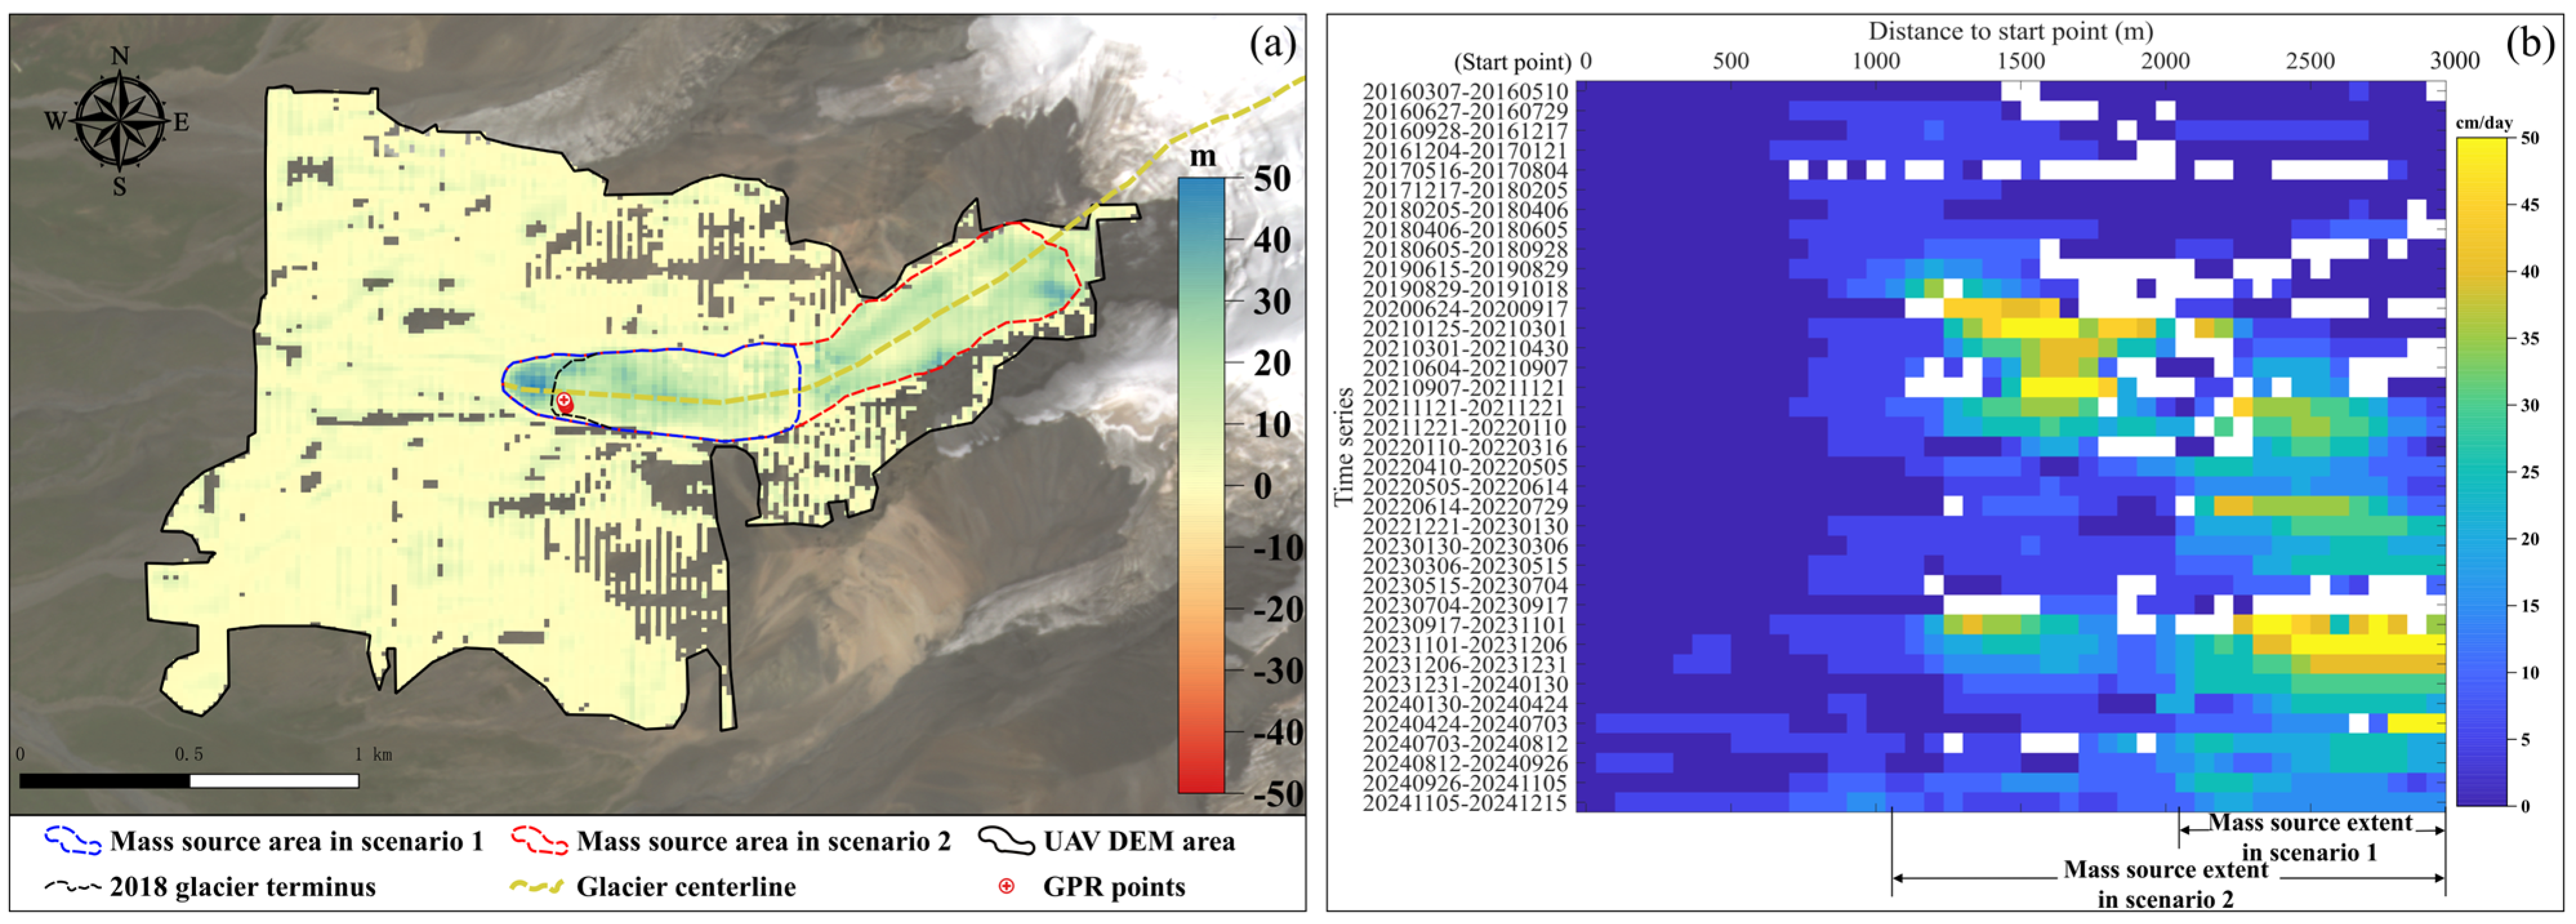
The surface elevation change map (
Figure 6a) shows that the tongue of Qushi’an No. 22 Glacier significantly thickened between October 2018 and November 2023. The thickening is particularly pronounced near the terminus, and the average thickening was up to 13.2 m. This result further confirms that the icefall in the cirque since 2018 has resulted in considerable mass loading on the tongue. According to our previous study, the Qushi’an No. 22 Glacier experienced terminus advancing between October 2018 and November 2023 (as shown in
Section 5.1). Within the area that increased between October 2018 and November 2023, the increased thickness can be considered the absolute thickness in November 2023, because the original thickness in these areas was zero before October 2018. We assumed that the absolute thickness of a point in the glacier tongue in November 2023 was the sum of the maximum thickness within the advanced portion and the thickness increase at that point between October 2018 and November 2023. For a glacier tongue that is melting and retreating, its thickness generally decreases with altitude, and the corresponding flow velocity also decreases with elevation [
29]. However, between October 2018 and November 2023, the tongue of the Qushi’an No. 22 Glacier kept advancing, and in 2022 and 2023, the flow velocity at the lower part of the glacier tongue had already exceeded that of the upper part (see
Figure 6b). Therefore, the thickness of the glacier tongue is not likely to significantly decrease with altitude. The absolute glacier thickness at a given point
in November 2023 is estimated by the following equation:
where
is the glacier thickness at point
,
is the maximum surface elevation increase within the advanced area, and
is the local surface elevation change between 2018 and 2023, obtained from DEM differencing.
Based on this assumption, the thickness of the glacier tongue was estimated to be between 20 and 75 m. To validate the assumption, the estimated thickness was compared with the thickness measured by GPR. The measured values at GPR points (P1–P7, shown in
Figure 3a and
Figure 6a) used to validate the estimated glacier thickness are listed in
Table 2 for comparison. The estimated glacier thickness was found to be close to the GPR-measured thickness, with an error of approximately 7.2%.
The flow velocity of the Qushi’an No. 22 Glacier between March 2016 and December 2024 was obtained through phase correlation of optical images (
Figure 6b) [
21]. The results indicate that the tongue of the Qushi’an No. 22 Glacier began to accelerate in September 2018 (see
Figure 6b). From September 2018 to the end of 2021, the flow velocity in the middle reach (approximately 1000 m to 2000 m from the starting point) increased from 10 cm/day to 50 cm/day. After the end of 2021, the high-speed zone gradually shifted downstream. By January 2022, the high-speed zone had completely moved to the lower reach (approximately 2000 m to 3050 m from the starting point), and the maximum velocity remained as high as 40 cm/day. From September 2023 to February 2024, a new round of acceleration occurred in both the middle reach and the lower reach. The boundary between these two high-speed zones was clear. Between February and December 2024, the flow velocity in the middle reach returned to the levels observed before June 2018; the flow velocity in the lower reach decreased notably but remained relatively high (about 25 cm/day).
Considering the distribution characteristics of surface flow velocity, two collapse scenarios were set for the Qushi’an No. 22 Glacier (see
Figure 6a). In Scenario 1, the mass source area extends from the middle of the tongue to the terminus, i.e., the glacier’s lower reach that has maintained high flow velocities since 2022. The detached glacier body covers an area of 2.73 × 10
5 m
2, with a mass volume of 1.49 × 10
7 m
3. In Scenario 2, the mass source area extends from the entrance of the tongue to the terminus, i.e., the glacier’s middle and lower reaches that have experienced significant acceleration since 2018. The detached glacier body covers an area of 5.37 × 10
5 m
2, with a mass volume of 2.97 × 10
7 m
3.
5.1. Scenario 1
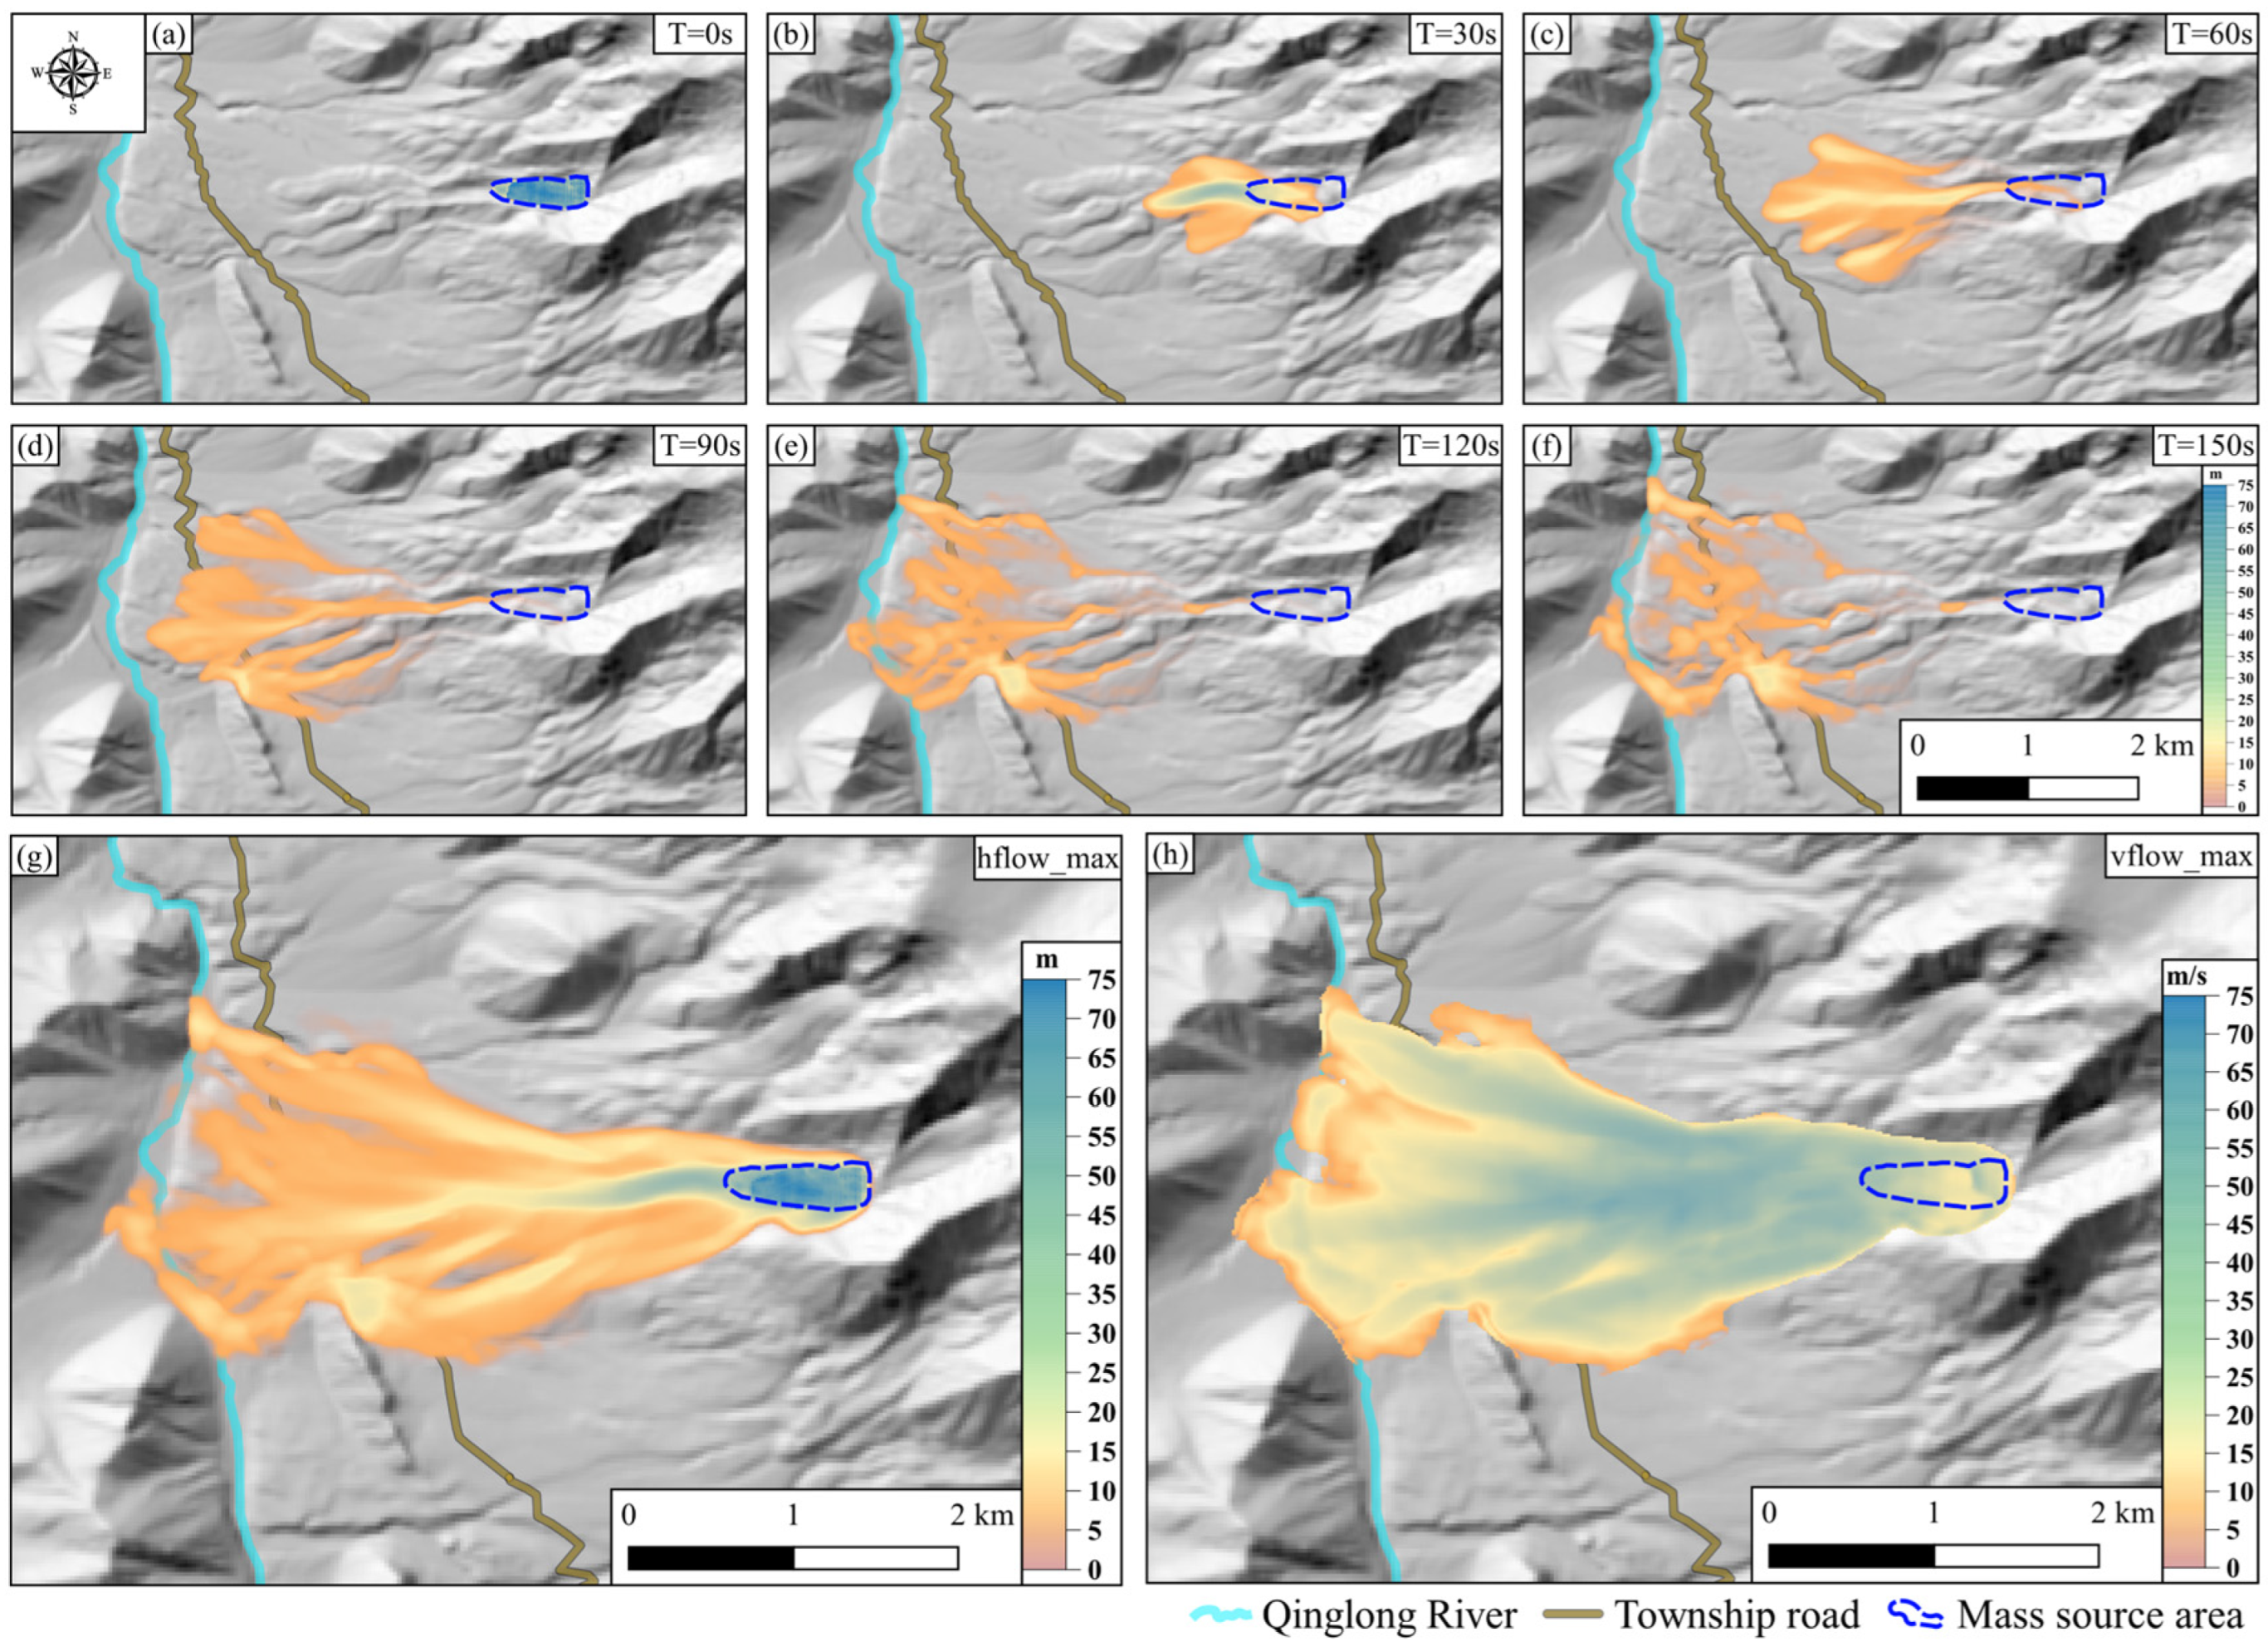
The simulation results of the collapse in Scenario 1 are presented in
Figure 7. At T = 120 s (i.e., 120 s after the initiation of collapse), the mass source completely detaches from the glacier tongue. The ice–rock debris spreads symmetrically after rushing out of the gully mouth, ultimately forming a fan-shaped deposition area in the piedmont zone. Some debris is deposited in the Qinglong River, potentially forming a dam with a height of 8 m. About 2.9 km of the township road is destroyed by the debris flow, and the thickness of the deposit over it reaches 15 m (
Figure 7g). During the collapse process, the maximum mass flow depth and the maximum mass flow velocity reach 72 m and 51.6 m/s, respectively. The impact area of the collapse in Scenario 1 is 7.19 × 10
6 m
2, and the deposition area covers 5.40 × 10
6 m
2.
5.2. Scenario 2
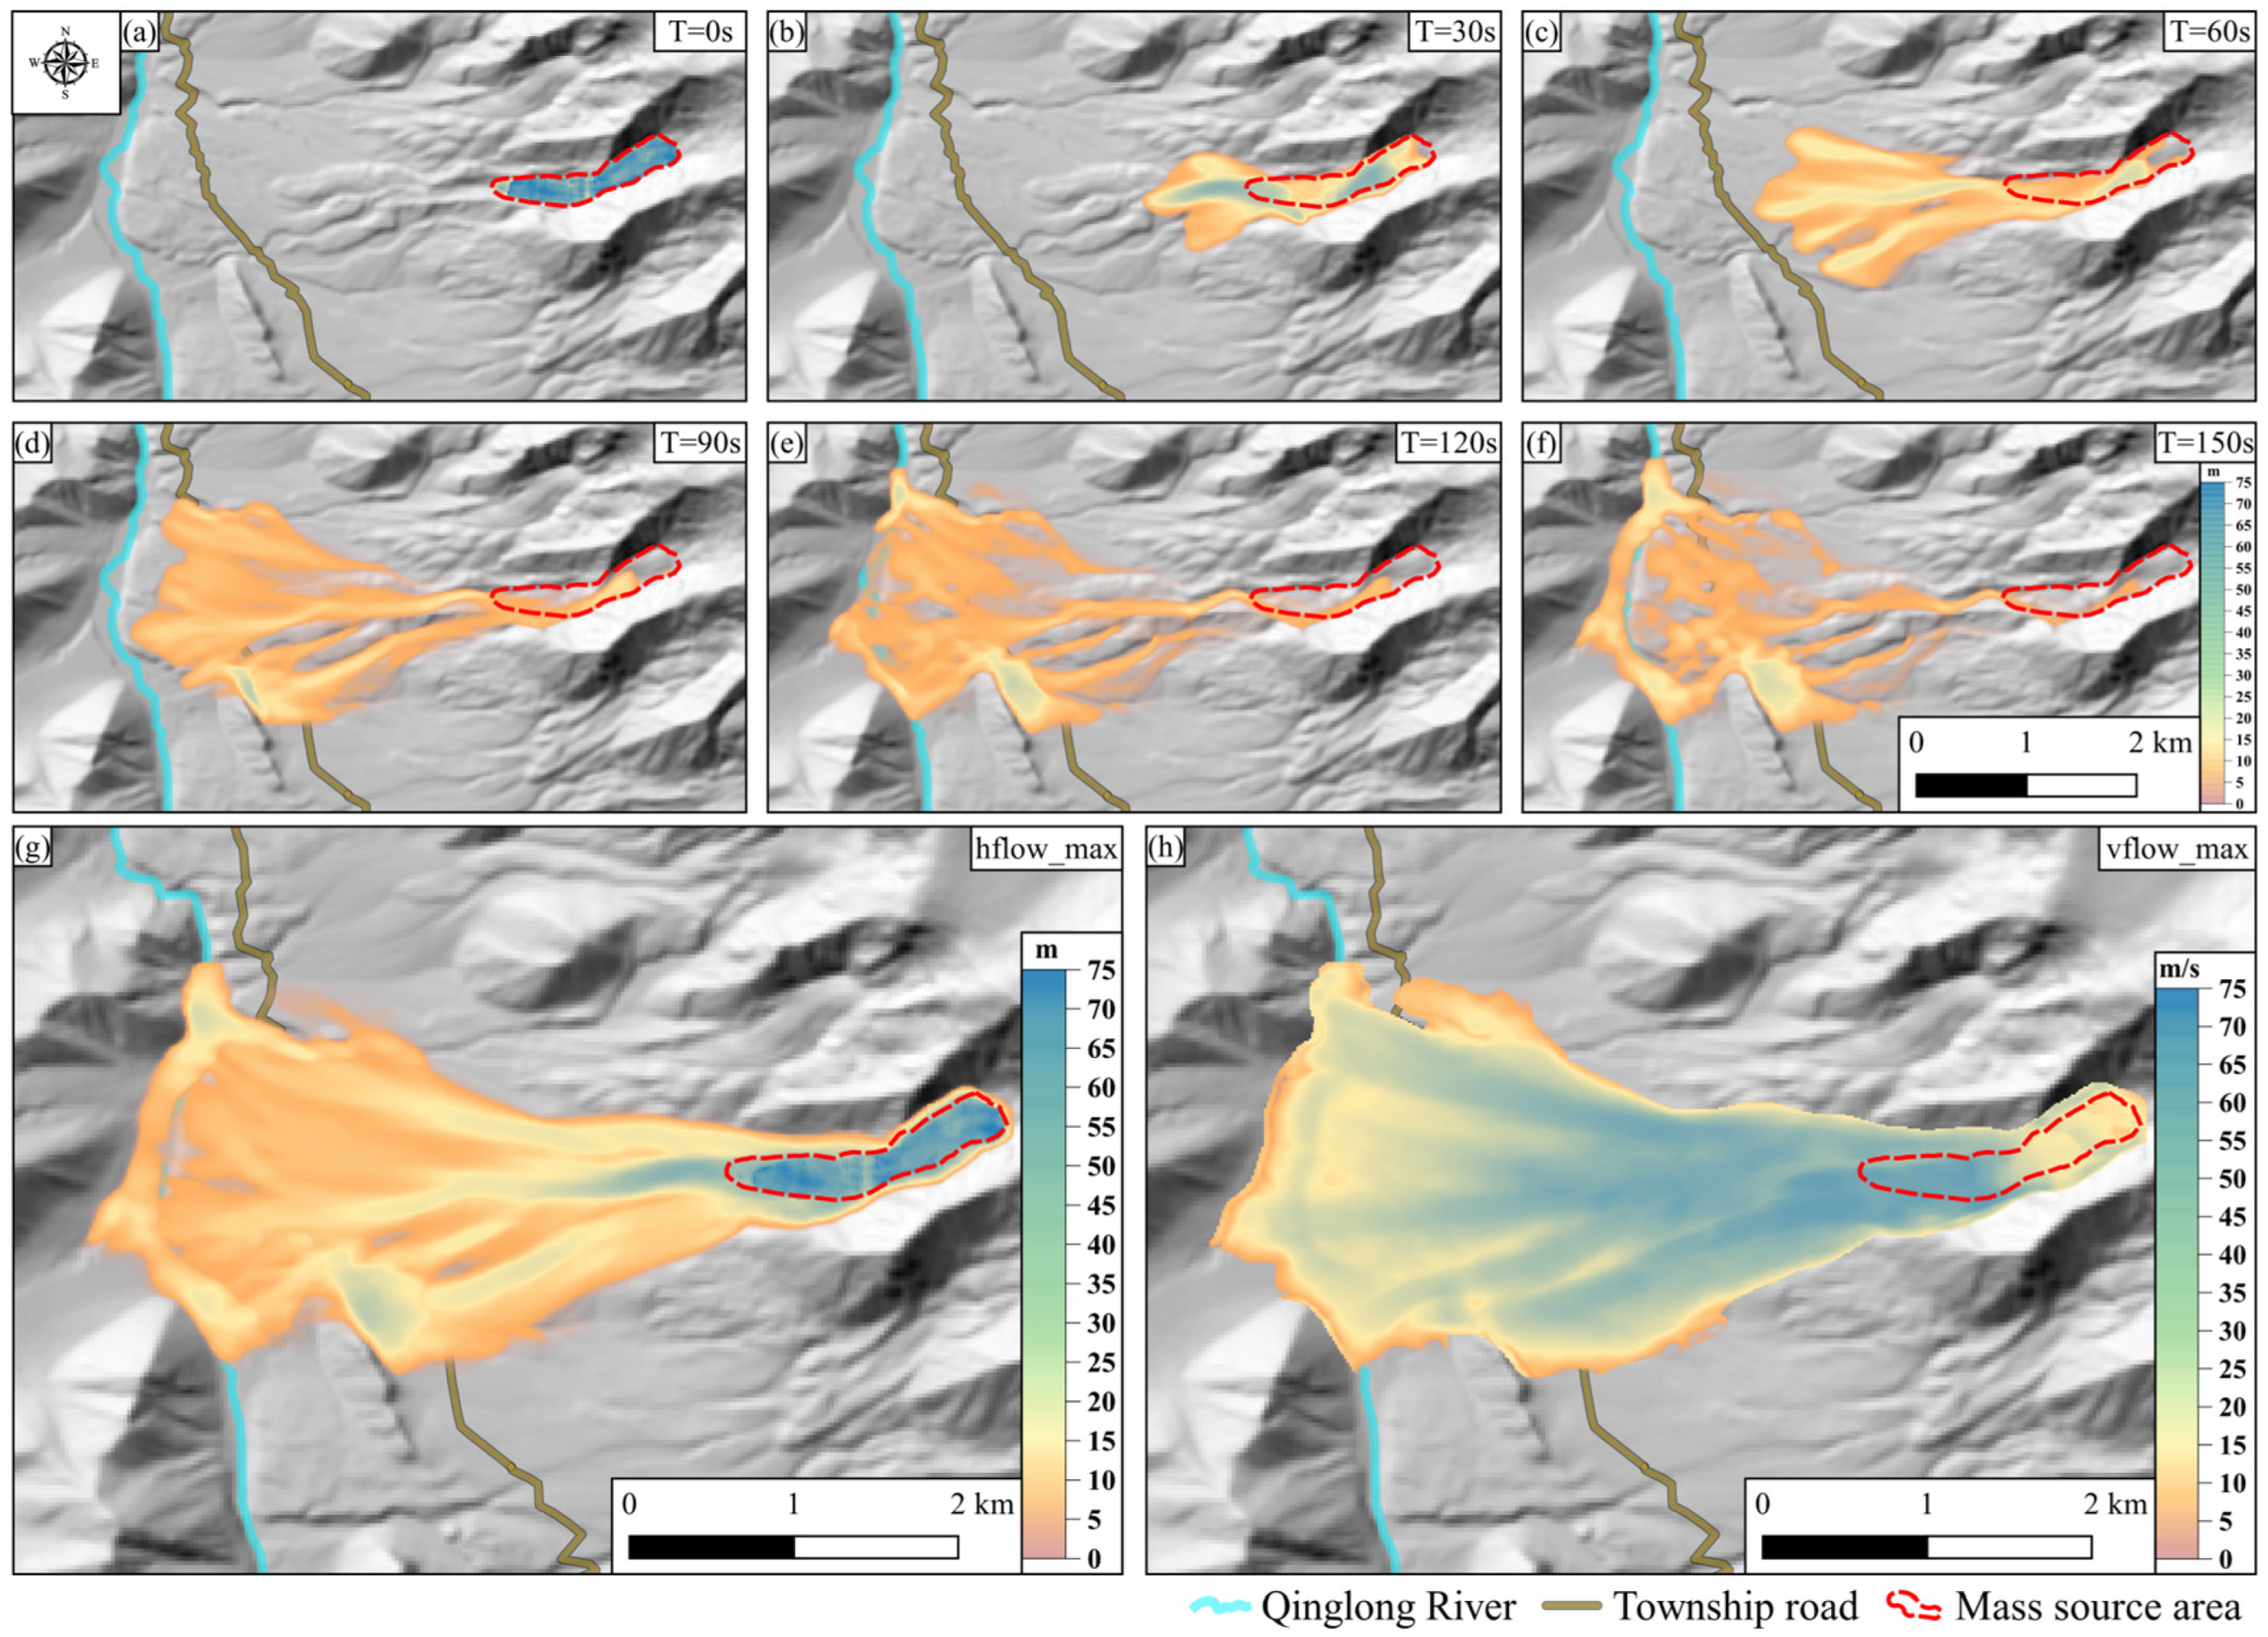
The simulation results of the collapse in Scenario 2 are shown in
Figure 8. At the end of the collapse process, the mass source has not completely rushed out of the glacier tongue. A small amount of ice–rock debris (with a thickness of 5 m) remains in the glacier bed. Compared to Scenario 1, Scenario 2 has more ice–rock debris deposited in the Qinglong River. A dam with a height of 12 m may form in the river channel. The length of the township road destroyed by the debris flow (3.2 km) is close to that in Scenario 1. However, the deposit over the road is much thicker, reaching 23 m (
Figure 8g). During the collapse process, the maximum mass flow depth and the maximum mass flow velocity reach 75 m and 59.7 m/s, respectively. The impact area of the collapse in Scenario 2 is 8.36 × 10
6 m
2, and the deposition area covers 6.32 × 10
6 m
2.
6. Discussion
6.1. Possible Triggers of the Qushi’an No. 22 Glacier Collapse
Previous studies have summarized that the collapse of the Xiaomagou Glacier in the Amnye Machen Mountains is subject to multiple factors, including the steep terrain in the glacier’s accumulation zone, rising temperatures, and soft glacier bedrock [
1,
6,
7,
9,
19,
30]. As mentioned above, for the Xiaomagou Glacier, icefall in the accumulation zone and terminus advance were observed before each collapse. The terminus advance indicates that the front of the glacier tongue is not frozen to the underlying bed [
3]. The glacial condition of the Xiaomagou Glacier resembles that of the Kolka Glacier (Russian Caucasus Mountains), which is also temperate and experienced a series of ice–rock falls before its catastrophic collapse on 20 September 2002 [
3,
31,
32]. The accumulation of debris from heavy ice–rock falls increased the driving stresses and caused the glacier geometry to reach the critical state [
3].
Field investigation and remote sensing monitoring demonstrated that the Qushi’an No. 22 Glacier shares similar collapse-nurturing conditions with the Xiaomagou Glacier. The Qushi’an No. 22 Glacier also has an accumulation zone located on a steep slope, with the glacier bed rock primarily composed of soft lithic materials such as arkose and slate. Multiple icefalls have occurred in the accumulation zone and descended over the tongue since 2018, resulting in rapid accumulation of ice–rock debris on the tongue. The anomalous mass loading has altered the stress regime of the glacier tongue, leading to the onset of surge-like instability that further intensifies local mass accumulation [
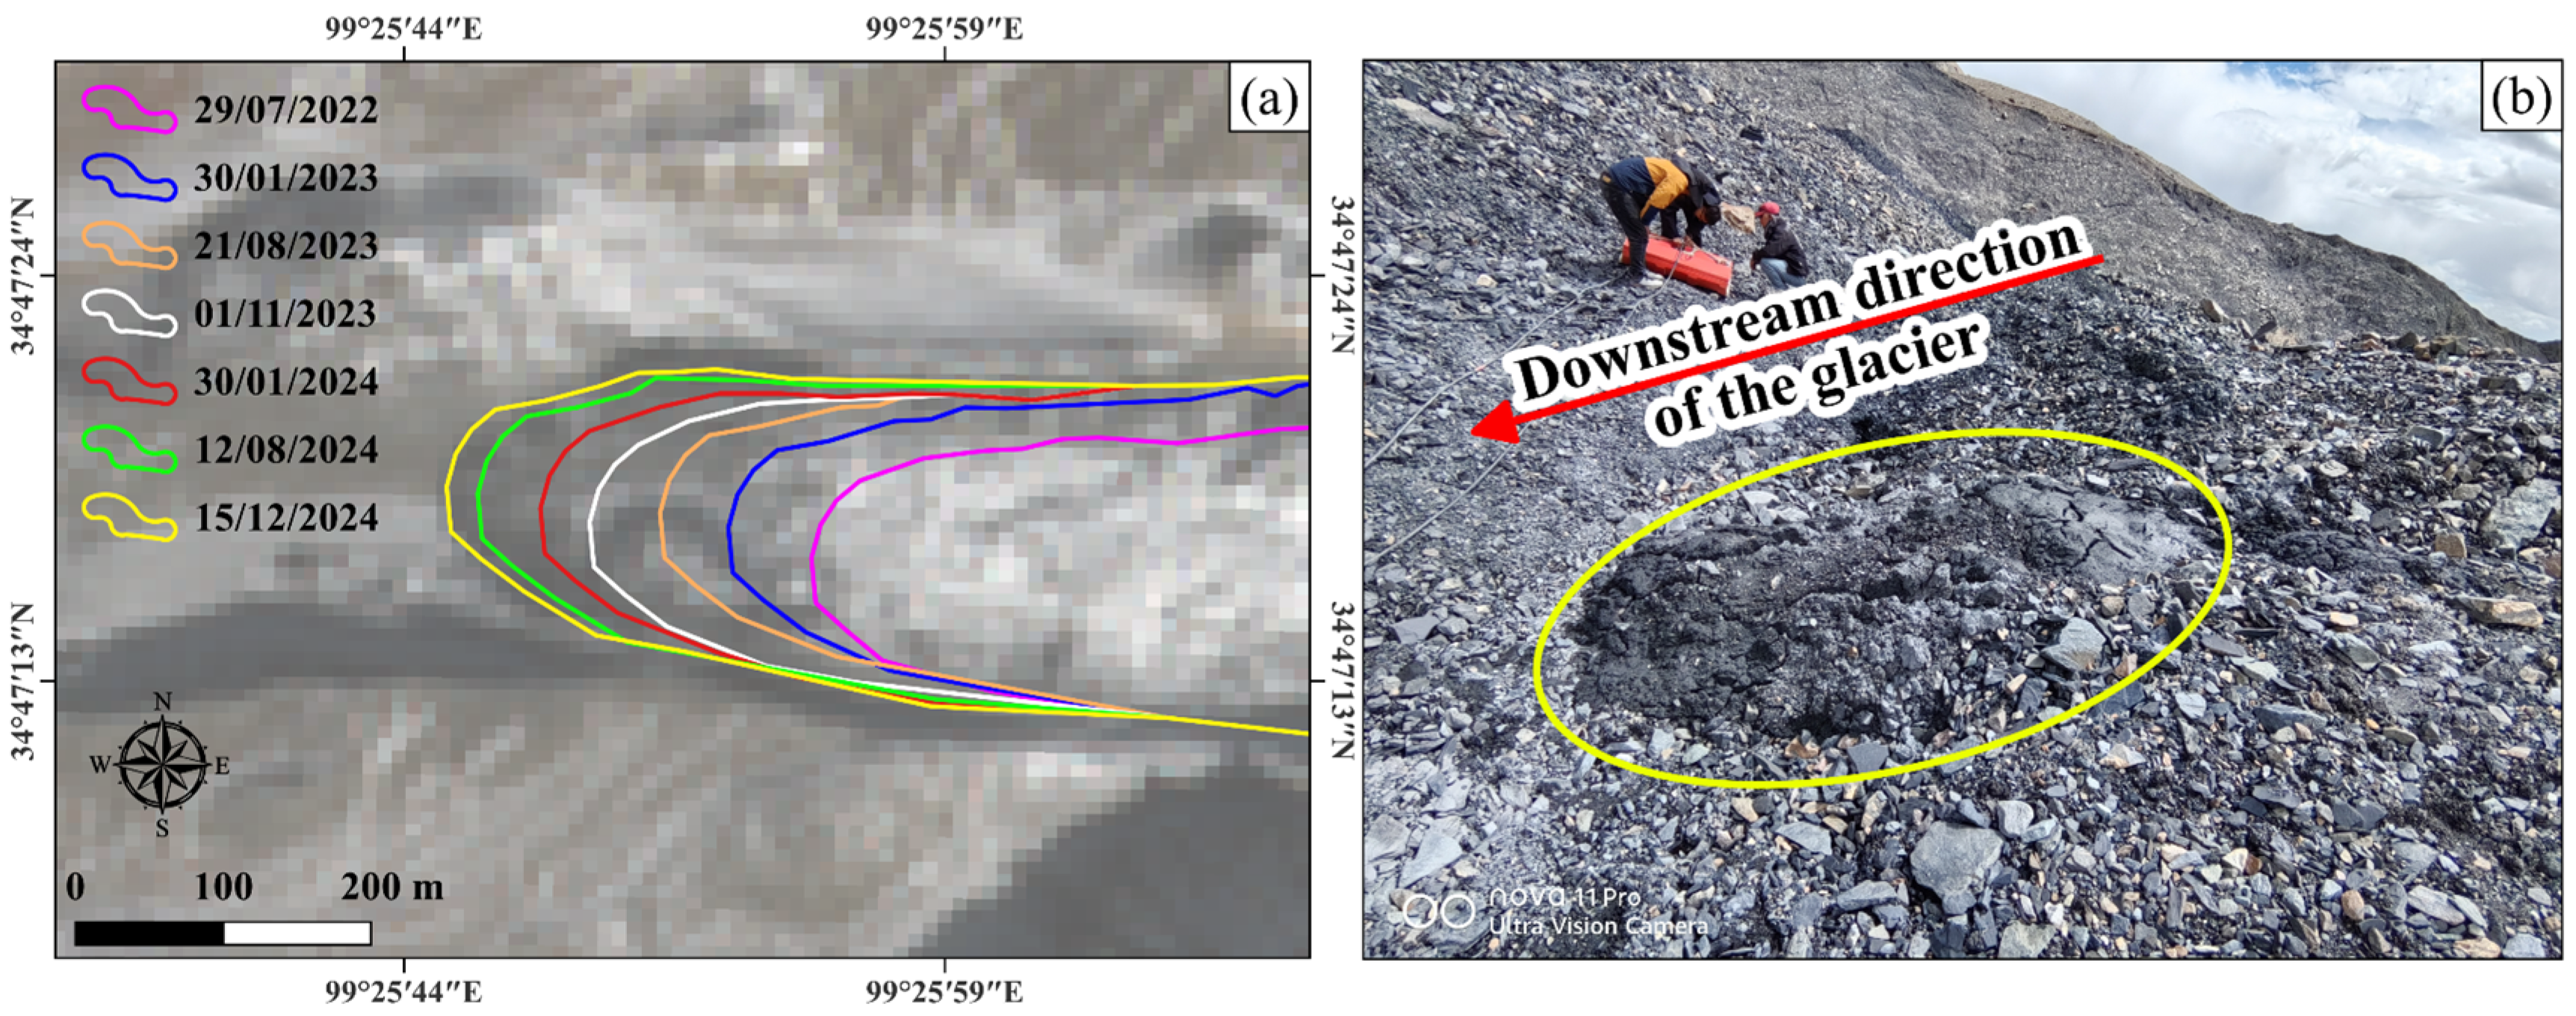
21]. Like the Xiaomagou Glacier, the Qushi’an No. 22 Glacier has been found to be advancing since July 2022, about 4 years after the first icefall event. From July 2022 to December 2024, its terminus advanced by 264 m (see
Table 3 and
Figure 9a). Moreover, mudflow-like fans of basal fines were found over the glacier tongue in August 2024 (see
Figure 9b), which indicates high subglacial water pressure. Given the continued temperature rising, more meltwater will enter the glacier’s base. As a result, the basal water pressure will rise, and the shear strength of the subglacial sediments will reduce [
32].
The Qushi’an No. 22 Glacier remains unstable. In particular, icefall in the upper reach is still ongoing, with more bedrock exposed in the higher elevations. The terminus is still advancing (
Figure 9a), and the flow velocity in the lower reach remains much higher than it was before 2018 (
Figure 6b). Theoretically, the temperate front is good, allowing the glacier geometry to adapt to the reduction in basal friction or the increase in driving stress. However, if the additional mass accumulation continues to be enhanced by the ice–rock fall and surge-like instability, or the subglacial water pressure soars after rainfall or strong melting, the present fragile balance of stress regime will be broken. The subglacial till will fail, and the surge-like behavior of the tongue will turn into collapse [
1,
32].
6.2. Potential Impact of the Glacier Collapse
Multiple collapses of the Xiaomagou Glacier in the 21st century have caused severe damage to the ecological environment and infrastructure in the western piedmont zone of the Amnye Machen Mountains. The debris flows generated by the collapse devoured pastures and destroyed the only road across the western piedmont zone of the Amnye Machen Mountains. With the local transportation blocked, animal husbandry products and necessities of herdsmen cannot be delivered in a timely manner, which directly impacts the livelihoods of local herders. Moreover, the collapse deposits blocked the Qinglong River for one and a half years, forming a large, dammed lake. A subsequent breach of this lake triggered floods [
8], diffusing the impact to downstream areas.
Compared to the Xiaomagou Glacier, the Qushi’an No. 22 Glacier has a longer and gentler tongue that provides stronger buffering capability against ice–rock falls originating from the accumulation zone. However, its larger volume means a greater impact force in the event of potential collapse. The numerical simulation results indicate that the collapses in both scenarios may have significant impacts on the piedmont zone. The debris flow generated by the collapse could damage pastures and the road in front of the glacier. The deposition area may significantly exceed that of the Xiaomagou Glacier 2004 collapse (2.21 × 10⁶ m2). The deposition in the Qinglong River could form a large, dammed lake. If the dam subsequently breaches, the lake outburst flood, mixing with the loose deposits in the river (including those from the Xiaomagou Glacier collapse), could transform into a mudflow, thereby expanding the affected area. Hence, it is necessary to maintain a high level of vigilance with regard to the changes in morphology, flow velocity, and surface elevation of the Qushi’an No. 22 Glacier.
6.3. Uncertainties in Glacier Collapse Scenario Simulation
In glacier collapse simulations, the setting of simulation parameters impacts the results. This study conducted 48 simulation experiments to test the influence of three key parameters: the turbulence coefficient, the basal friction angle, and the internal friction angle. Among them, the turbulence coefficient and basal friction angle exert a more significant influence on the simulation outcomes. The turbulence coefficient represents the turbulent resistance encountered by the ice–rock debris flow. Variations in this coefficient can alter the speed and diffusion range of the debris flow. When the turbulence coefficient increases, the resistance to the debris flow also increases, leading to a reduction in debris speed, an extension of time to exit the gully, and a change in the location and shape of the deposits. The basal friction angle determines the magnitude of friction between the debris flow and the base. A lower basal friction angle facilitates the slide of the debris on the base, thus altering its flow path and diffusion range. The internal friction angle reflects the friction between the particles within the debris flow, influencing the overall stability and movement characteristics.
The parameter value ranges tested in sensitivity experiments and the final adopted values used in the scenario simulations are shown in
Table 4.
The final set of parameters was determined by minimizing the difference between the simulated and observed deposition range of the 2004 Xiaomagou Glacier collapse. The optimized parameters yielded the highest SPI, and the same settings were applied to the simulation of the Qushi’an No. 22 Glacier collapse under Scenario 1 and Scenario 2 to ensure consistency.
In addition to parameter variability, the simulation results are subject to several other sources of uncertainty; for instance, when using the r.avaflow software for simulations, the model assumes the ice–rock debris flow to be a homogeneous two-phase mixture, but the debris flow’s composition and physical properties exhibit spatial heterogeneity. Differences in the distribution of ice and rock debris, frictional forces, and flow characteristics may affect the accuracy of the simulation results. Simulating glacier collapse is more complex than simulating other types of mass flows, such as snow avalanches, landslides, and mudflows. The strength of this study lies in its ability to optimize model parameters using data from the Xiaomagou Glacier, which shares similar geological and topographical conditions with the targeted glacier. Hence, the simulated mass flow speed, impact range, and deposition thickness are relatively reliable. One key parameter in disaster risk assessment is the potential impact range [
33]. Glacier collapse simulations offer valuable insights for delineating danger zones and assessing the volume of a dammed lake. However, research on glacier collapse scenario simulations remains in its early stages. Simulation methods require further development. Future studies should improve the models based on more field observations.
7. Conclusions
This study used the Voellmy model that has been incorporated into the r.avaflow software to simulate the collapse scenario of the Qushi’an No. 22 Glacier. Two potential collapse scenarios were established. The mass source area was delineated according to the spatio-temporal characteristics of the flow velocity, and the thickness of the mass source area was estimated from the combination of glacier surface elevation change and boundary change. Since the model parameters were constrained by the 2004 collapse data of the Xiaomagou Glacier, which shares a similar glacial condition with the Qushi’an No. 22 Glacier, the simulation results are relatively reliable. In both scenarios, the debris flow generated by the glacier collapse can destroy the township road and pasture in front of the glacier, and the deposits can block the Qinglong River. Due to the larger volume of the mass source, the potential Qushi’an No. 22 Glacier collapse will have a broader deposition area and greater impact force than the Xiaomagou Glacier 2004 collapse. At present, the terminus of Qushi’an No. 22 Glacier is still advancing, and the lower part of the glacier tongue remains highly mobile. With ongoing climate warming, additional mass accumulation caused by successive ice–rock fall and surge-like behavior or subglacial water pressure rise, potentially caused by heavy melting or rainfall, are possible triggers of glacier collapse. The Amnye Machen Mountains are a grand and sacred mountain range. People often pass by the Piedmont region because of religious faith and livelihood. Avoiding human casualties is the first priority of local disaster prevention and mitigation. Therefore, it is necessary to strengthen the monitoring of the surface morphology, flow speed, and elevation of the Qushi’an No. 22 Glacier via advanced field and spaceborne techniques; in the meantime, it is better to set up a disaster alert area according to the simulation results during the warm season.
