1. Introduction
Buried pipelines constitute a foundational element of critical civil infrastructures, enabling the transport of water, wastewater, oil, and gas across vast distances, and they are widely recognized as “lifelines”. Ensuring the long-term reliability and structural integrity of these systems are essential for public health, economic continuity, and environmental safety. However, pipelines are vulnerable to a range of geotechnical and hydraulic threats, among which soil erosion induced by water infiltration is a particularly complex and destructive process. Infiltration through defects or leaks in buried pipes can lead to gradual soil particle displacement, progressive formation of voids, and eventual pipeline instability, manifesting as sinkholes, vertical or lateral displacements, and premature structural failures [
1,
2].
Guo et al. [
3] conducted an experimental investigation into soil erosion through defective pipes subjected to cyclic infiltration–exfiltration flow conditions. Using physical model tests with bimodal (gap-graded) glass sphere soils, the study identified three distinct erosion behaviors: clogging, incomplete erosion, and complete erosion—depending on particle size, fines content, and flow cycles. A non-dimensional parameter incorporating defect size, particle size, and fines content was introduced, and a phase diagram was developed to predict the erosion mode based on the number of flow cycles. The results indicated that when the non-dimensional parameter exceeded 1.75, the erosion mechanism could change to complete erosion after approximately seven cycles. The study also proposed an analytical model for predicting soil mass loss under incomplete erosion conditions, accounting for the effects of cyclic infiltration–exfiltration. These findings provide insights into the progressive weakening of soils around defective pipelines and improve predictive capabilities for ground collapse associated with cyclic water flow events.
Experimental investigations on soil erosion mechanisms around buried pipelines have been instrumental in advancing understanding of subsurface instability processes. Laboratory tests have provided valuable qualitative and quantitative insights into soil–fluid interactions, erosion patterns, and sinkhole formation mechanisms under controlled conditions. However, these experimental approaches are inherently constrained by several limitations. The small spatial scales typically employed in laboratory models make it challenging to accurately replicate the full complexity of in situ subsurface conditions, particularly with respect to natural heterogeneities in soil structure, variability in hydraulic gradients, and long-term environmental effects. Additionally, the temporal resolution of physical testing is often insufficient to capture the slow evolution of erosion processes that occur over months or years in field conditions. Traditional experimental setups are further limited in their ability to resolve detailed three-dimensional interactions between fluid flow and soil microstructure, which are critical for understanding localized particle mobilization and the initiation of voids or preferential flow paths. Moreover, real-time monitoring of internal erosion progression, especially at the soil particle scale, is technically difficult due to the opaque nature of typical soil media and the invasive nature of many measurement techniques. These limitations highlight the need for complementary numerical modeling that can achieve finer spatial and temporal resolution, simulate long-term processes, and provide detailed insights into fluid–solid coupling mechanisms beyond what can be captured in physical experiments [
4,
5,
6,
7,
8].
To overcome these challenges, advanced numerical simulation techniques have emerged as indispensable tools. In particular, the coupling of computational fluid dynamics (CFD) with the discrete element method (DEM) offers a robust framework for modeling fluid–particle interactions at multiple scales [
1,
2,
9,
10,
11,
12,
13,
14]. CFD accurately calculates fluid motion governed by the Navier–Stokes equations, while DEM tracks the movement, collision, and interaction forces between individual soil particles. The integration of these methods allows for detailed investigations on fluid-driven erosion processes, capturing both macroscopic erosion patterns and microscopic particle behaviors.
Tang et al. [
4,
15] systematically investigated the mechanisms of soil erosion around defective sewer pipes with a focus on the effect of defect location. A series of controlled laboratory model tests, combined with particle image velocimetry (PIV) techniques, were performed to quantify soil displacement dynamics for five different defect positions along the pipe circumference. The results indicated that defects located at the pipe crown or springline promote localized soil erosion directly above the defect, while defects located closer to the invert lead to wider and more distributed erosion zones due to the combined effects of water infiltration paths and gravity-induced soil resistance. Soil flow rates were found to decrease progressively as defects shift from the crown toward the invert. Additionally, the study revealed that the soil-to-water flow rate ratio depends exponentially on the ratio of defect size to soil particle size, rather than on infiltration velocity alone. An analytical soil erosion model based on mass conservation principles, coupled with a kinetic model predicting soil particle velocities, was proposed and validated against experimental data, demonstrating strong predictive capability for sinkhole growth and soil loss rates. These findings contribute to a deeper understanding of defect-driven subsurface erosion processes and provide a framework for predicting sinkhole formation risks and assessing the long-term stability of buried pipelines.
Dai et al. [
9] conducted an experimental and numerical investigation into ground collapse mechanisms induced by underground drainage pipe leakage. Through a series of laboratory model tests and three-dimensional CFD–DEM coupled simulations, they reproduced the formation and progression of underground cavities and ground collapse events. The collapse process was divided into three distinct stages: initial stabilization, slow subsidence due to soil arch weakening, and eventual surface collapse. Key factors influencing collapse behavior include groundwater level, defect size, and burial depth of the pipe. Experimental results showed that collapse pit shapes were typically semi-elliptical and that deeper buried pipes and higher groundwater levels led to larger and deeper collapse pits. Numerical simulations captured detailed soil particle movements and soil arch formations, providing insights into micro-mechanical processes underlying cavity evolution. The study highlighted the critical role of seepage-driven soil erosion, the cyclic formation and failure of soil arches, and the interaction between soil hydraulic forces and mechanical stability. Validation against experimental data demonstrated strong agreement, confirming the reliability of the CFD–DEM approach for simulating ground collapse phenomena caused by pipe leakage.
Ibrahim and Meguid [
11] performed a detailed numerical investigation on sand erosion into defective gravity pipes under constant groundwater table conditions using coupled CFD–DEM simulations. The study focused on evaluating the effects of groundwater level, crack size, defect inclination, and sand layer thickness on erosion behavior. The results showed that raising the groundwater table accelerates erosion up to a saturation point, beyond which no further significant increase occurs. Erosion rates were highest when defects were located at the pipe crown, but inclined cracks ultimately produced larger erosion volumes. The thickness of the overlying sand layer was found to have minimal influence on erosion rates due to the dominance of a freefall arch regime. The authors validated the dry case simulations against empirical models and developed simplified relationships for predicting the extent of erosion based on defect geometry, groundwater level, and soil properties. Their findings provide important insights into the mechanisms of groundwater-driven erosion and highlight critical parameters that must be considered when assessing the stability of buried pipelines subject to leakage-induced soil loss.
Guo and Yu [
16] conducted a comparative study on three common formulations of coupled CFD–DEM models used to simulate soil surface erosion. The study implemented models based on different treatments of the fluid momentum equations and investigated their performance under laminar flow conditions. Validation was first performed through the simulation of a free-settling particle, showing negligible differences among the models in sparse particle–fluid systems. Subsequently, simulations of soil erosion within a pipe flow setup revealed that, in dense particle–fluid systems, notable discrepancies arise due to differences in the assumptions regarding fluid pressure distribution and porosity gradients. Their study highlights the critical role of model assumptions in accurately capturing fluid–solid interactions and soil erosion mechanisms.
Even though numerous research has been conducted to investigate the influences of different parameters on soil erosion above defective pipes caused by groundwater infiltration, the mechanisms of soil erosion and sinkhole formation are still unclear. For example, what are the critical hydrogeological conditions in which erosion can be initiated? How can you quantify the soil erosion caused by groundwater infiltration into defective buried pipes? What are the key influencing factors?
In this study, a coupled CFD–DEM approach was utilized to simulate soil erosion around defective or leaking pipelines under infiltration conditions. The primary objectives are to: (1) quantify the effect of infiltration pressure on the initiation and rate of soil particle detachment and transport into a buried pipe through an orifice; (2) characterize the formation and evolution of erosion-induced void zones within the soil matrix and evaluate their spatial and temporal progression under varying hydraulic conditions; (3) assess the influence of pipe defect size on particle outflow rate, velocity distribution, and internal erosion dynamics; and (4) demonstrate the capability of a coupled CFD–DEM modeling framework to capture fluid–solid interactions, particle migration patterns, and erosion pathways at the soil particle size level. These objectives aim to enhance the understanding of internal erosion mechanisms around buried infrastructure and provide a predictive basis for erosion-related risk assessment and mitigation.
2. Materials and Methods
In this study, the coupled computational fluid dynamics–discrete element method (CFD–DEM) framework was employed using ANSYS software (Ansys 2024 R1) tools to simulate the complex interactions between the fluid phase and discrete solid particles. Specifically, ANSYS Fluent was used to resolve the continuous fluid field by solving the Navier–Stokes equations, while ANSYS Rocky was utilized to model the motion and interaction of individual particles based on Newtonian mechanics. The CFD–DEM coupling in ANSYS enables two-way momentum exchange between the fluid and solid phases: the fluid exerts drag, lift, and pressure forces on the particles, while the particles, in turn, influence the fluid flow by introducing momentum sinks and altering local porosity. This method provides a powerful tool of capturing particle–fluid interactions at a micro scale, particularly when dealing with non-spherical particles, whose shapes can significantly affect hydrodynamic behavior and mechanical interactions. ANSYS Rocky’s advanced capabilities for handling irregular particle geometries further enhance the physical realism of the simulations, allowing for more accurate predictions of particle mobilization, soil erosion, and void formation in complex multiphase systems.
2.1. Computational Framework
The coupled CFD–DEM approach was adopted to accurately model the two-phase fluid–particle interactions involved in the soil erosion process. This study utilizes a Eulerian–Lagrangian approach where CFD governs the fluid phase, while DEM tracks the motion of individual soil particles. In this framework, the continuous fluid phase was solved using the finite volume method (FVM) in ANSYS Fluent, while the discrete particle phase was tracked individually using the DEM solver in ANSYS Rocky.
2.2. Fluid Phase (CFD)
ANSYS Fluent solves the incompressible Navier–Stokes equations governing the fluid motion:
where
u is the fluid velocity vector,
ρf is the fluid density,
p is the pressure,
µf is the dynamic viscosity, and
fp is the source term accounting for momentum exchange with particles.
The presence of particles was incorporated into the fluid phase equations through a porosity-modified approach, where local void fractions were computed based on particle concentrations within each CFD cell.
2.3. Particle Phase (DEM)
The DEM effectively captures the discrete nature of particles. The motion of individual particles is governed by Newton’s second law and computed through DEM. For the particle phase, the translational and rotational motions are described by the following form of Newton’s second law:
where
mp and
Ip are the mass and moment of inertia of the particle,
vp and
ωp are the translational and angular velocities,
Fcontact and
Tcontact are the contact forces and torques from particle–particle and particle–wall interactions, and
Ffluid and
Tfluid represent fluid–particle interaction forces and torques.
Particles were modeled with realistic and non-spherical geometries using Rocky DEM’s advanced shape modeling capabilities, which improves the accuracy of flow–particle interactions, especially in erosion phenomena, where particle orientation and shape have significant effects.
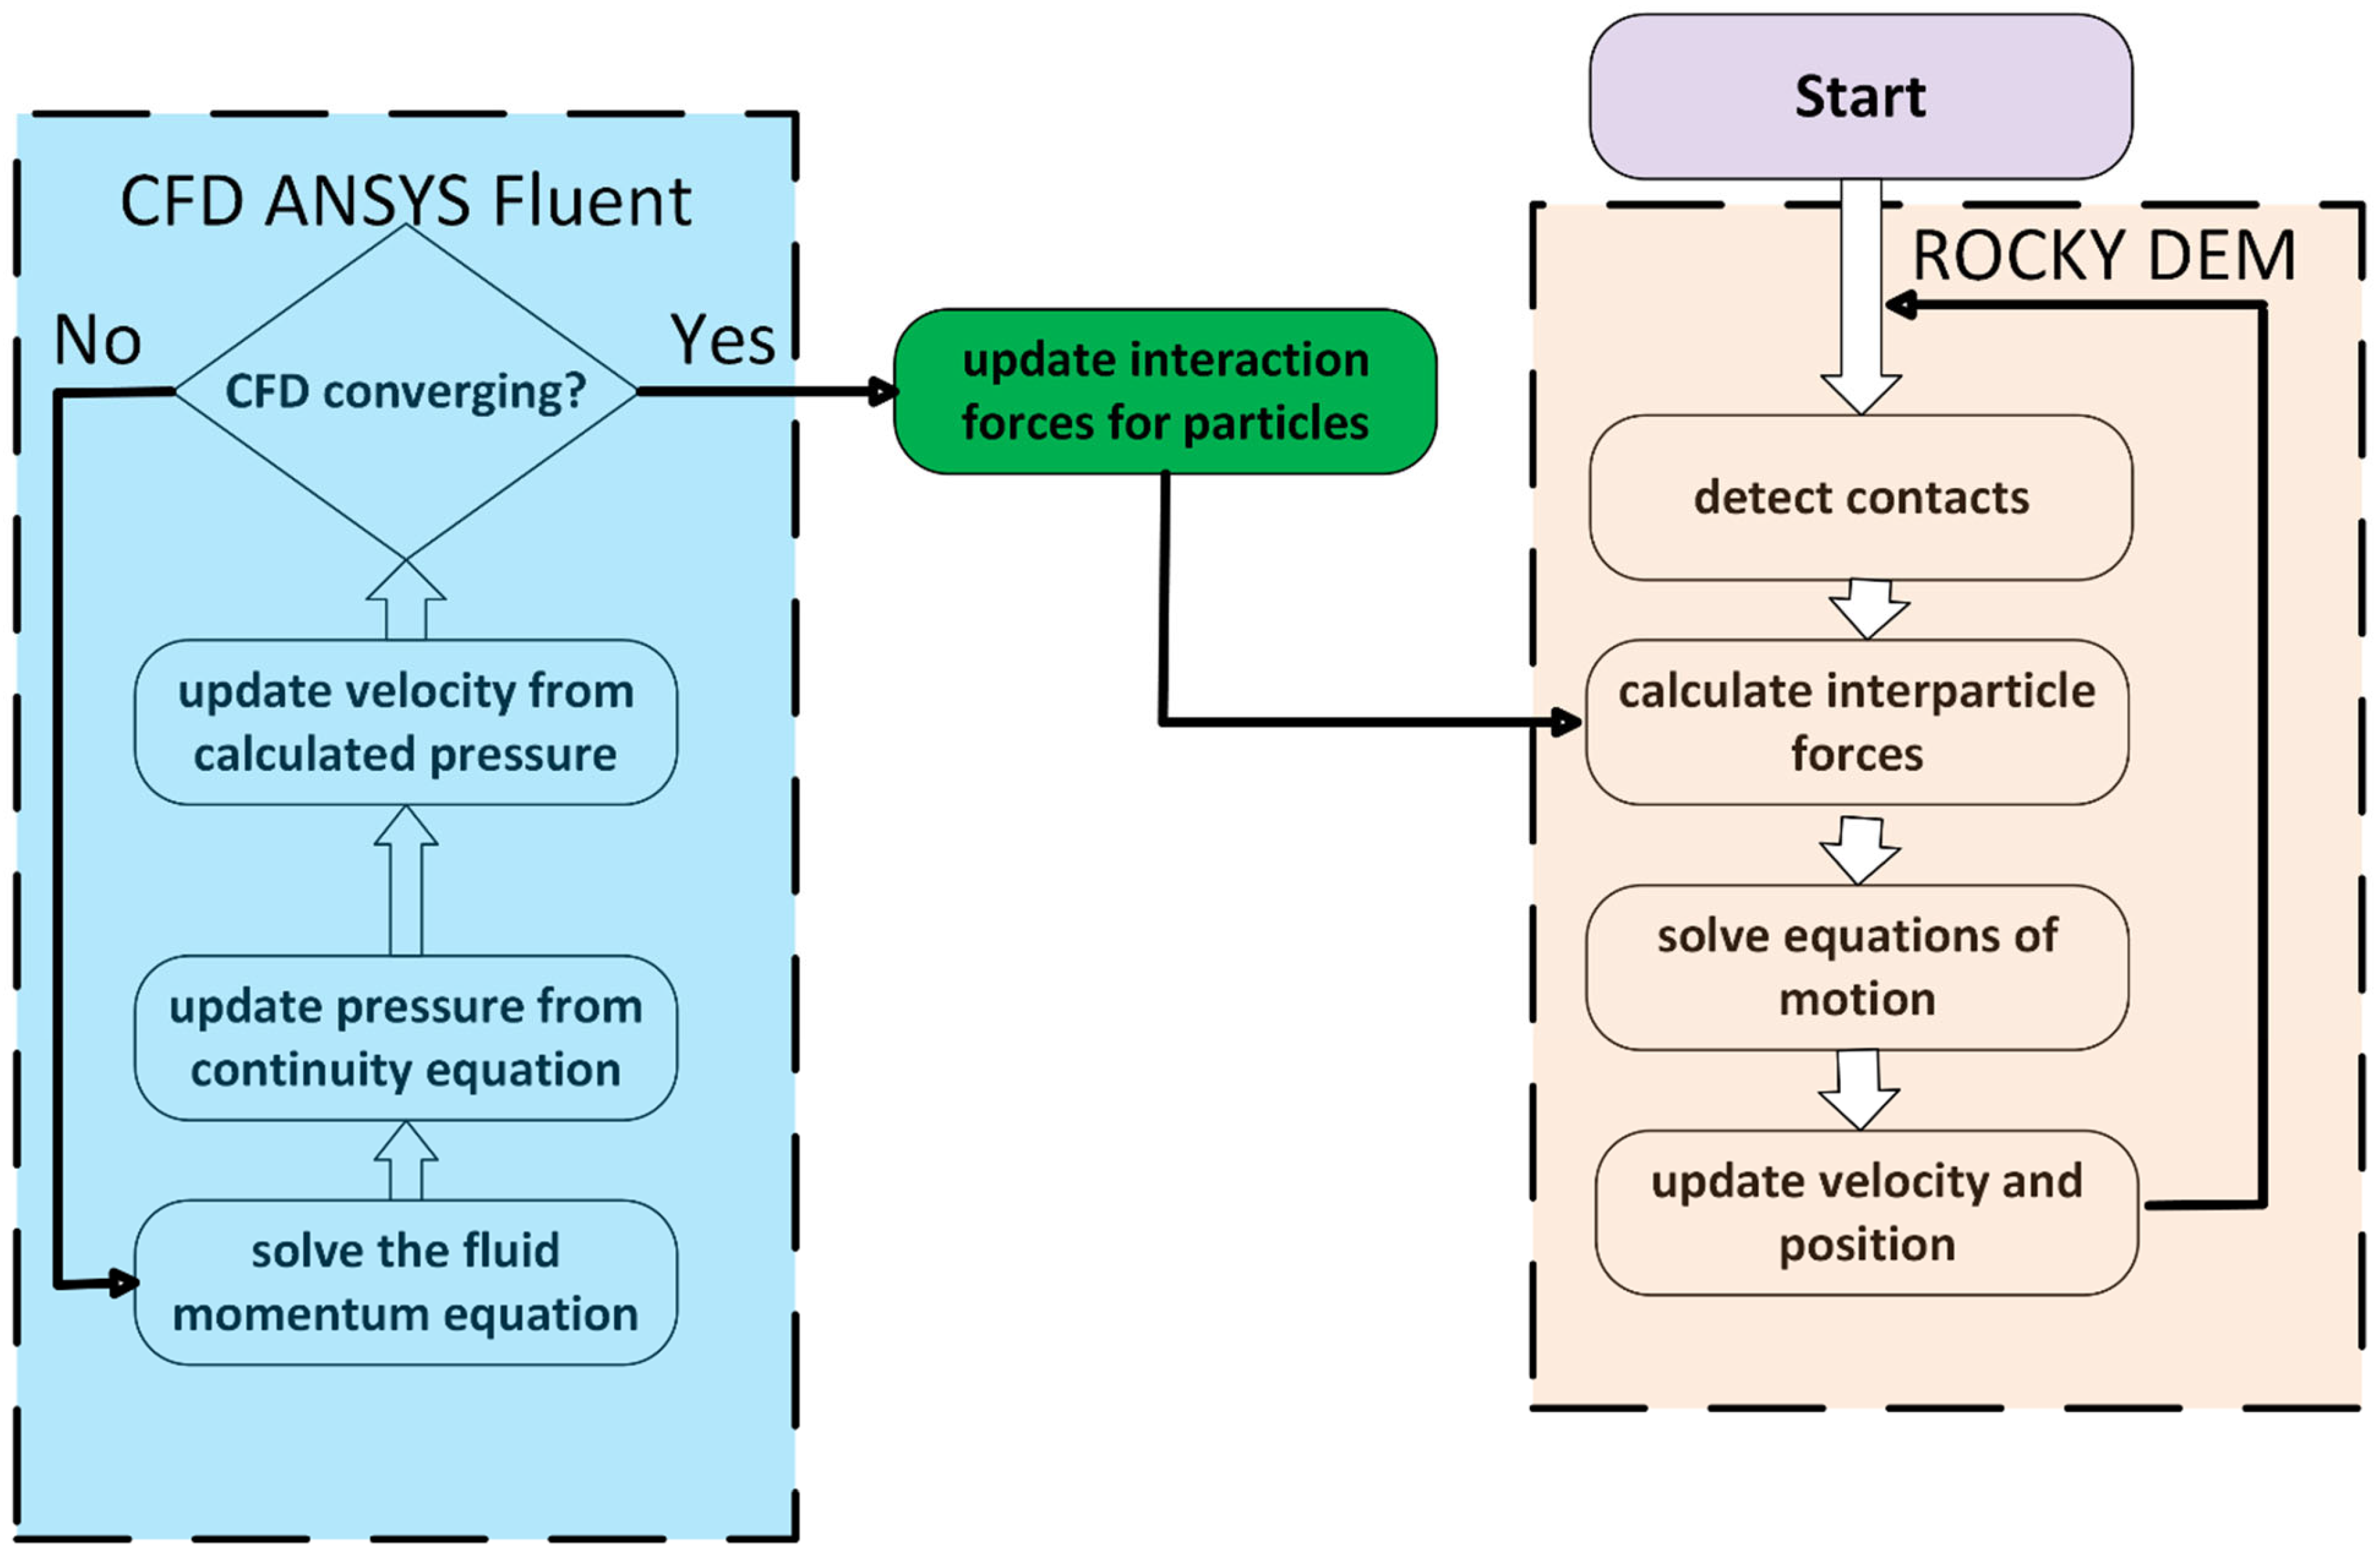
2.4. Coupling Strategy
The CFD–DEM coupling was realized through a one-way interaction mechanism as shown in
Figure 1, where:
Fluid flow fields from Fluent provide hydrodynamic forces acting on particles at each time step.
Particle motion and distribution, computed in Rocky, modify the fluid momentum equations through source terms that account for drag and momentum exchange.
A time-stepping scheme with sub-cycling was adopted, where multiple DEM time steps were executed within a single CFD time step to ensure stability and accuracy due to typically smaller characteristic timescales of particle collisions. At each coupled time step, ANSYS Fluent solves for the fluid field and computes hydrodynamic forces, which are passed to ANSYS Rocky. Rocky updates particle motion based on fluid and contact forces, enabling one-way momentum exchange and dynamic interaction between the fluid and solid phases.
2.5. Justification for One-Way Coupling and Its Limitations
In this study, a one-way coupling approach was employed, wherein the fluid flow field influences particle motion but the feedback effect of particle dynamics on the fluid phase is neglected. This simplification is appropriate under conditions where particle concentrations are relatively low and the momentum exchange from solid to fluid is minimal—typical for early-stage internal erosion where detachment is localized and voids are just beginning to form. One-way coupling significantly reduces computational time and complexity, enabling more efficient parametric exploration of defect-driven erosion mechanisms.
However, this assumption may introduce errors in regimes characterized by high particle concentration, especially near the defect during peak erosion phases. In such cases, particle-induced changes in porosity, drag, and turbulence can alter local flow fields, affecting both pressure distribution and erosion progression. These interactions are not captured in one-way models and may lead to underestimation of feedback effects such as flow redirection, local fluidization, or backpressure buildup. Future extensions of this study will incorporate two-way or fully coupled CFD–DEM schemes to more accurately simulate advanced erosion stages and dense particle–fluid interactions.
2.6. Boundary and Initial Conditions
Fluid boundaries: infiltration is simulated by applying an inlet pressure at the top boundary, while a no-slip condition is enforced on pipe walls.
Particle boundaries: no-slip conditions for walls and appropriate rebound or energy loss coefficients were set at solid interfaces.
Initial conditions: a settled granular bed was initialized under gravity before initiating fluid infiltration to replicate pre-erosion conditions.
2.7. Simulation Setup
The simulation setup was designed to study soil erosion induced by water infiltration through a localized defect in a pipe. A coupled CFD–DEM framework was employed to capture both the fluid dynamics and discrete particle behavior within the soil matrix. In this configuration, the soil is modeled as an assembly of discrete particles with defined contact laws, while the fluid phase is represented by the locally averaged Navier–Stokes equations. This integrated approach ensures that momentum exchange between the soil and the infiltrating water is accurately captured.
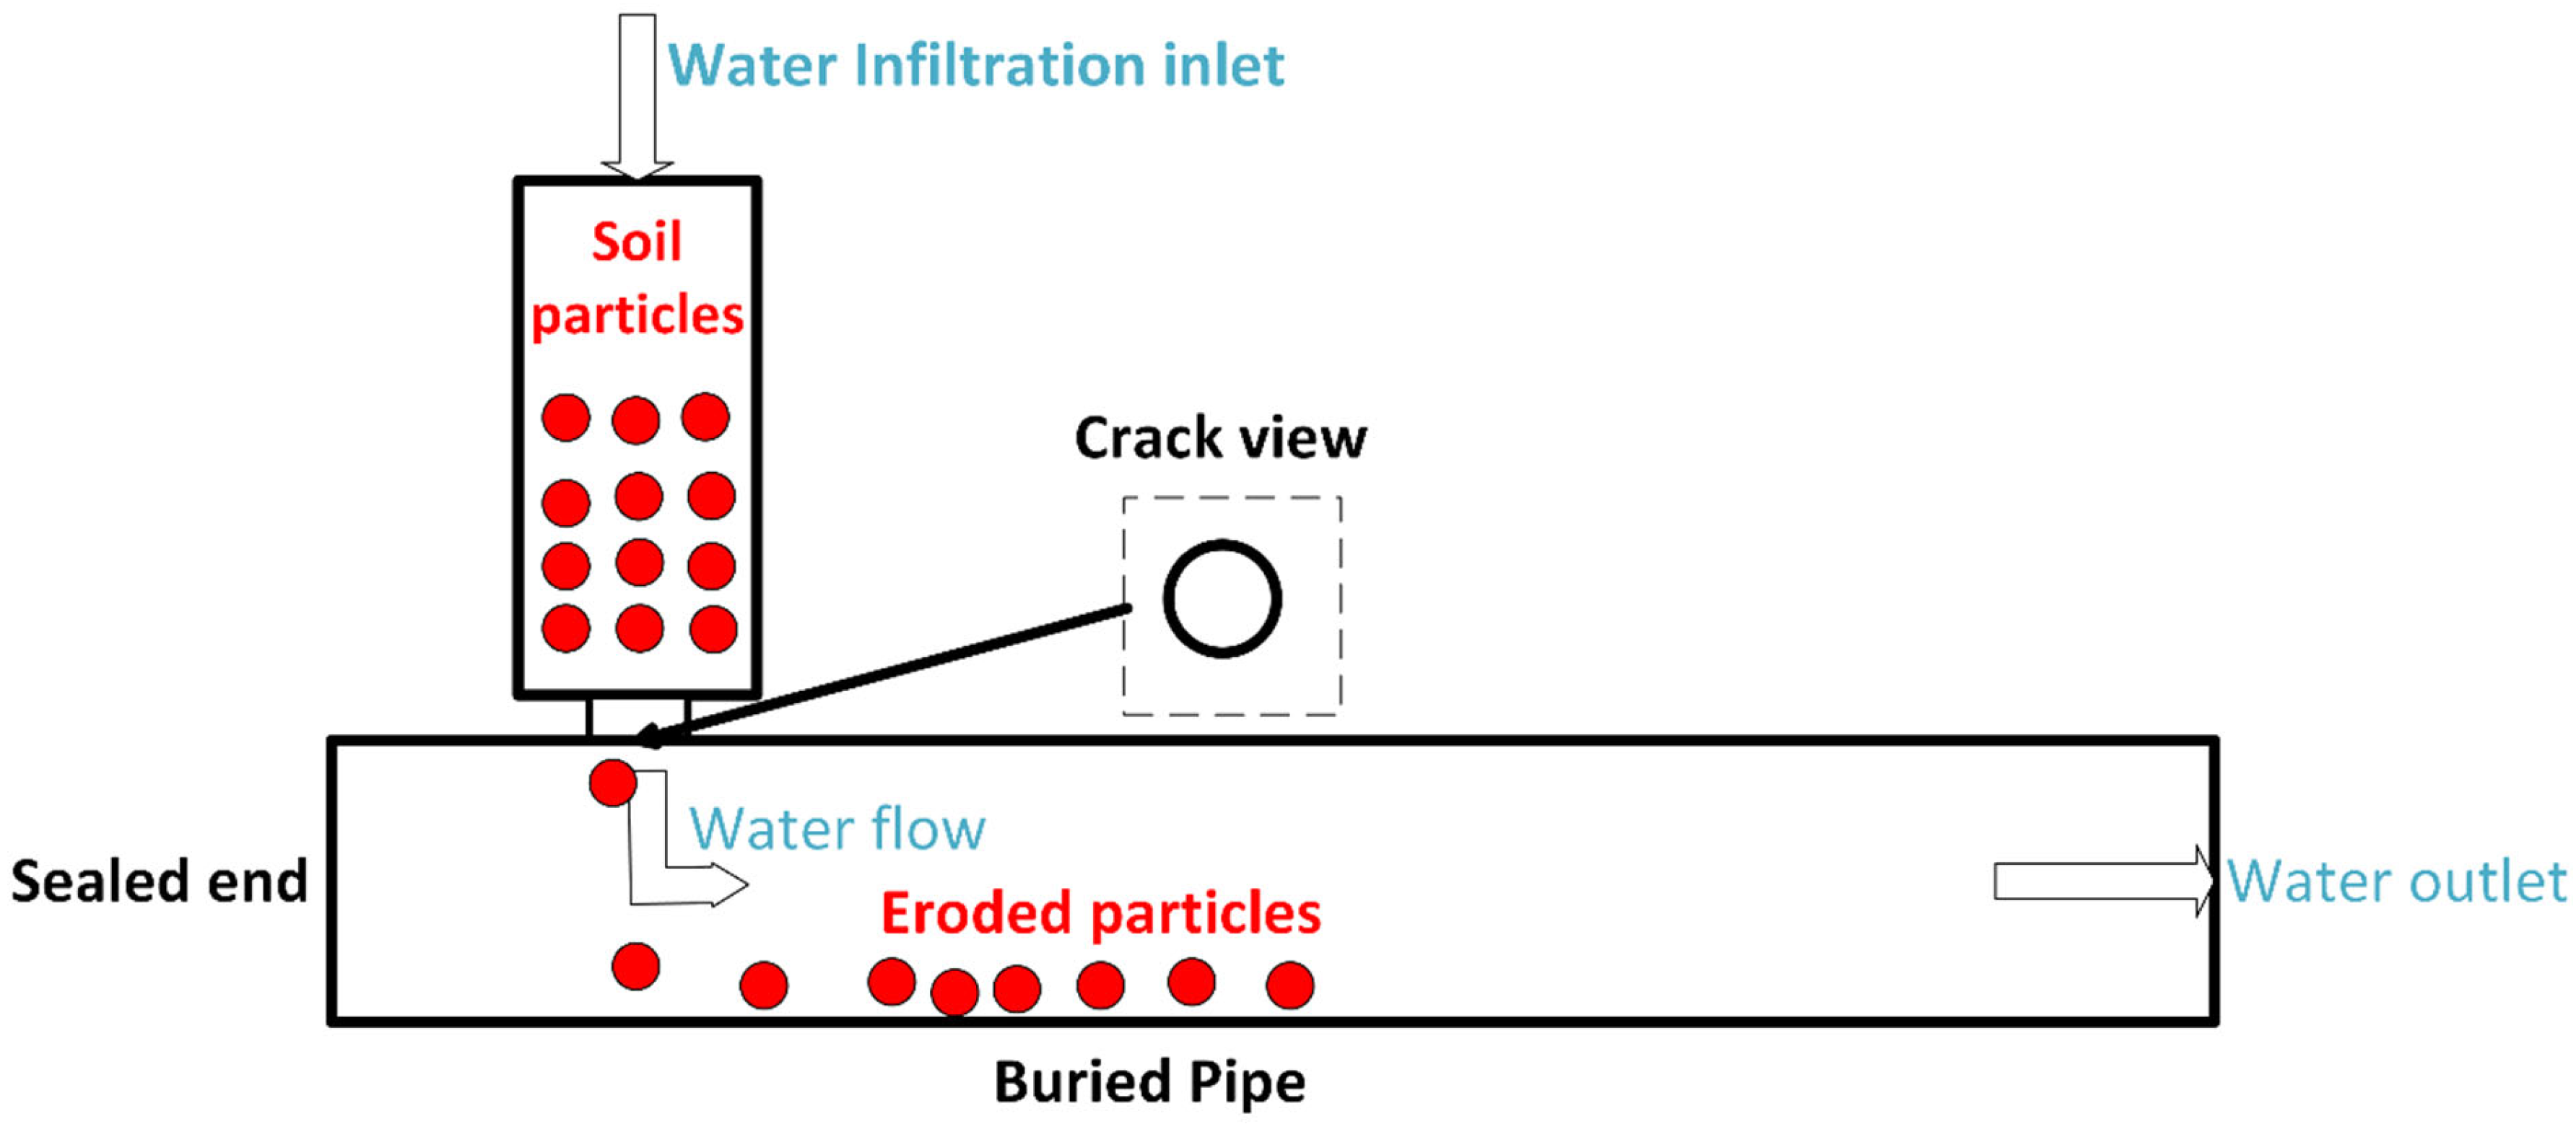
As shown in
Figure 2, the simulation domain consists of a cylindrical pipe adjoining a porous soil region, with a carefully incorporated defect serving as the infiltration pathway. The pipe defect opening, located at the interface between the soil column and the pipe, allows infiltrating water and detached particles to enter the pipe. As water continues to flow through the defect, soil particles are eroded, migrate into the pipe, and are transported downstream by the internal water flow toward the outlet boundary. A pressure boundary condition is applied at the fluid inlet to initiate infiltration at specified levels, and corresponding outlet conditions facilitate steady flow through the domain. The soil particles, distributed within the domain based on a representative grain size distribution, interact through frictional and cohesive forces, making it possible to study the progressive detachment and migration of particles due to hydraulic forces.
High-resolution meshing was used in ANSYS Fluent for the fluid domain to capture the intricate flow details, while the DEM simulation employed sufficiently small time steps to resolve rapid particle motions. Boundary conditions include no-slip walls for the fluid and fixed constraints at the base of the soil, with the coupling algorithm ensuring efficient exchange of information between the CFD and DEM solvers. Data post-processing focuses on tracking particle displacement, monitoring the formation and evolution of voids, and visualizing group-wise particle motion through color coding—all of which provide insight into the mechanics of internal erosion under various infiltration pressures.
Soil properties: A single-size soil particle with a diameter of 1.18 mm (sand, sieve #16) is used in the CFD–DEM model with a total number of 7387.
Fluid properties: Water is used as the infiltrating fluid with a density of 1000 kg/m3 and viscosity of 0.001 Pa·s.
Geometry: A 3D axisymmetric model is developed to represent a buried pipe in a soil mass as water flows through a 25.4 mm (i.e., 1 in.) diameter defective pipe as shown in
Figure 2. The chamber with a diameter of 25.4 mm (i.e., 1 in.) and a height of 50.8 mm (i.e., 2-in.) was adopted to contain the soil particles above the defective pipe and allow the observation of soil erosion progress during simulations. The orifice varies in sizes of 9.53 (3/8 in.), 12.7 (1/2 in.), and 19.05 mm (3/4 in.).
2.8. Mesh Independence and Time Step Sensitivity Analysis
To ensure numerical accuracy and minimize discretization errors, mesh independence and time step sensitivity analyses were performed prior to conducting the main simulations.
Table 1 presents the results of the mesh independence analysis, where three different mesh sizes (31,148, 44,387, and 98,275 cells) were tested. The maximum flow velocity was used as a key indicator for evaluating the mesh sensitivity. The results show that the maximum velocity stabilized at 6.48 m/s for mesh sizes of 44,387 and higher, indicating that further mesh refinement does not significantly affect the solution. Therefore, the mesh with 44,387 cells was selected for all subsequent simulations to balance accuracy and computational efficiency.
Table 2 summarizes the time step sensitivity analysis, in which three time step sizes (0.1 s, 0.05 s, and 0.025 s) were tested. The number of particles exiting the domain at 0.8 s was used as a representative metric for dynamic behavior. The results show that the particle out count converged at 34 when the time step was reduced to 0.05 s and below. Thus, a time step of 0.05 s was deemed sufficiently accurate while also ensuring computational feasibility.
These preliminary studies confirm that the chosen spatial and temporal resolutions provide stable and reliable results for capturing the key erosion phenomena modeled in this work.
3. Results
3.1. Effect of Infiltration Pressure
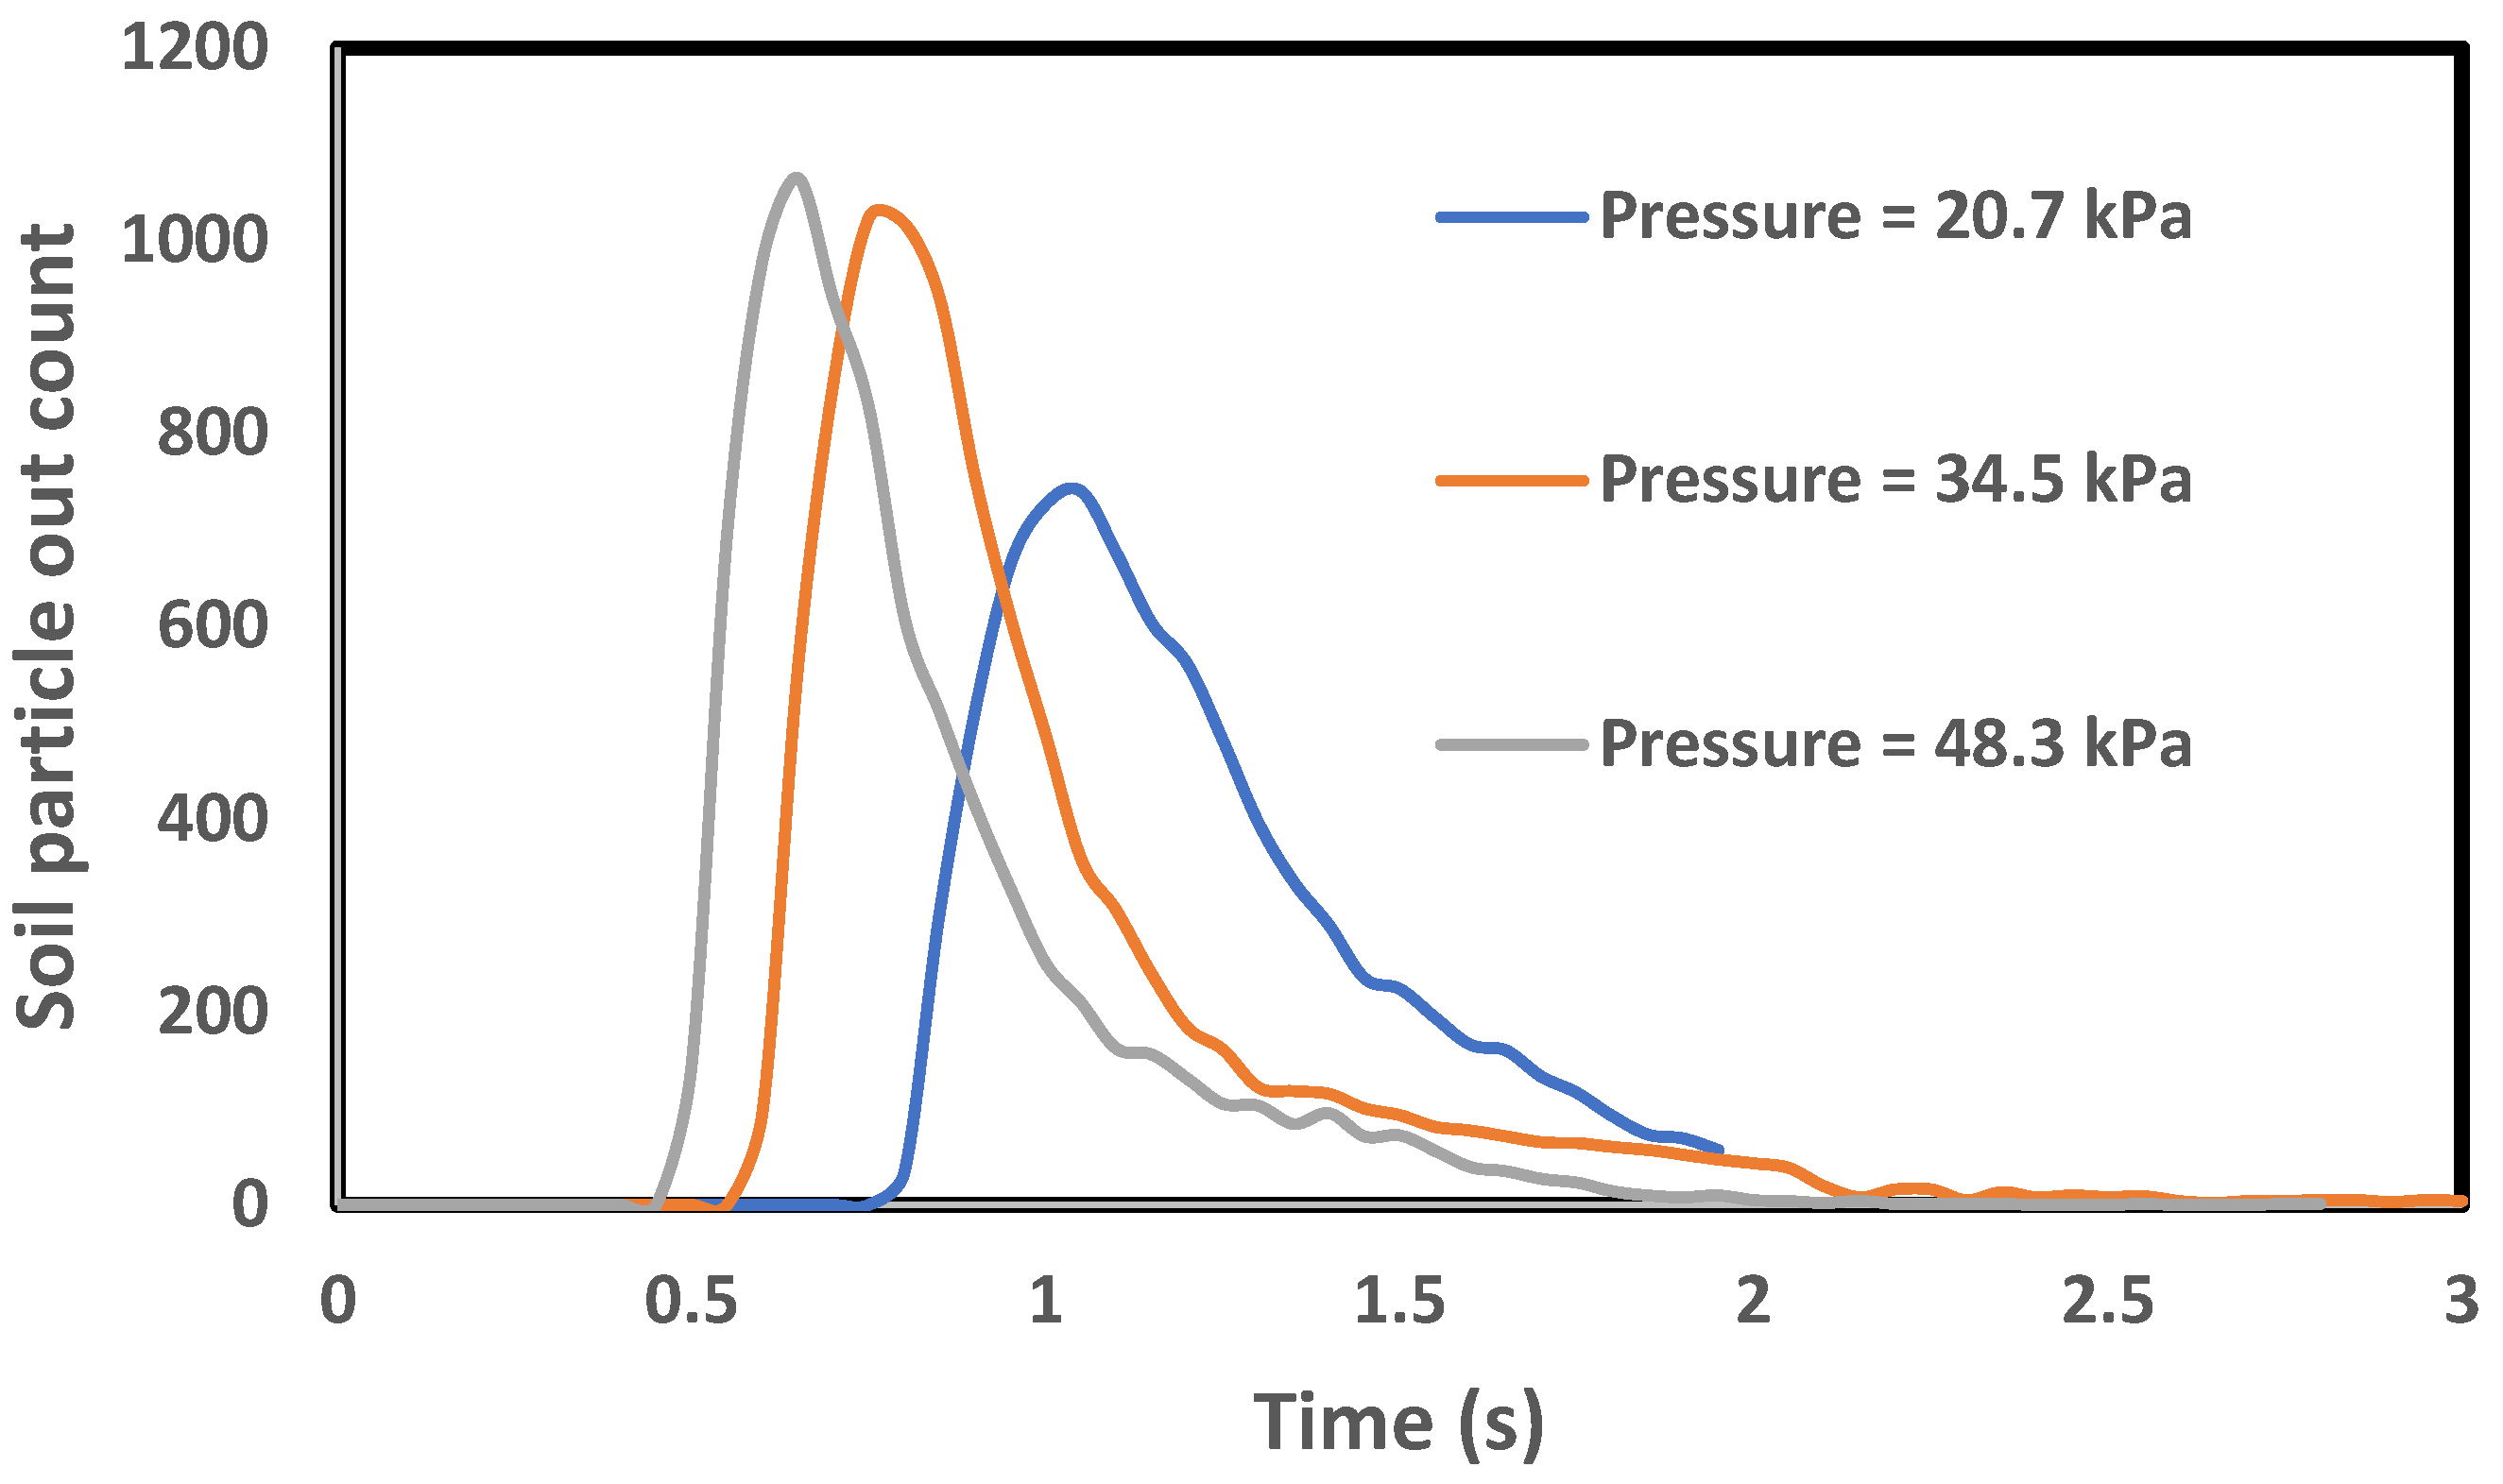
Figure 3 presents the temporal distribution of soil particle outflow under three different infiltration water pressures: 20.7, 34.5, and 48.3 kPa. The results indicate a clear relationship between the applied pressure and the timing and magnitude of particle transport.
At 48.3 kPa, particle outflow begins the earliest and reaches the highest peak count, suggesting a rapid mobilization of soil due to the higher hydraulic gradient. The peak is sharp and occurs around 0.7 s, followed by a steep decline, indicating a short-duration but intense erosion event.
At 34.5 kPa, the outflow peak occurs slightly later than at 48.3 kPa, with a similarly high maximum count, though slightly lower in magnitude. The curve also declines rapidly but exhibits a slightly broader peak, indicating a marginally prolonged erosion phase compared with the case of 48.3 kPa.
At 20.7 kPa, the onset of particle outflow is delayed, and the peak is both lower in magnitude and broader in time. This suggests slower erosion dynamics and a more sustained but less intense particle release process.
Overall, the data demonstrates that increasing infiltration pressure accelerates the onset of soil particle mobilization and amplifies the rate of soil particle outflow, consistent with the enhanced erosion under higher hydraulic forces.
Corresponding to an increase in infiltration pressure, higher infiltration velocities lead to increased detachment of soil particles, forming localized erosion zones around the pipe. The rate of erosion increases as the critical velocity threshold is surpassed.
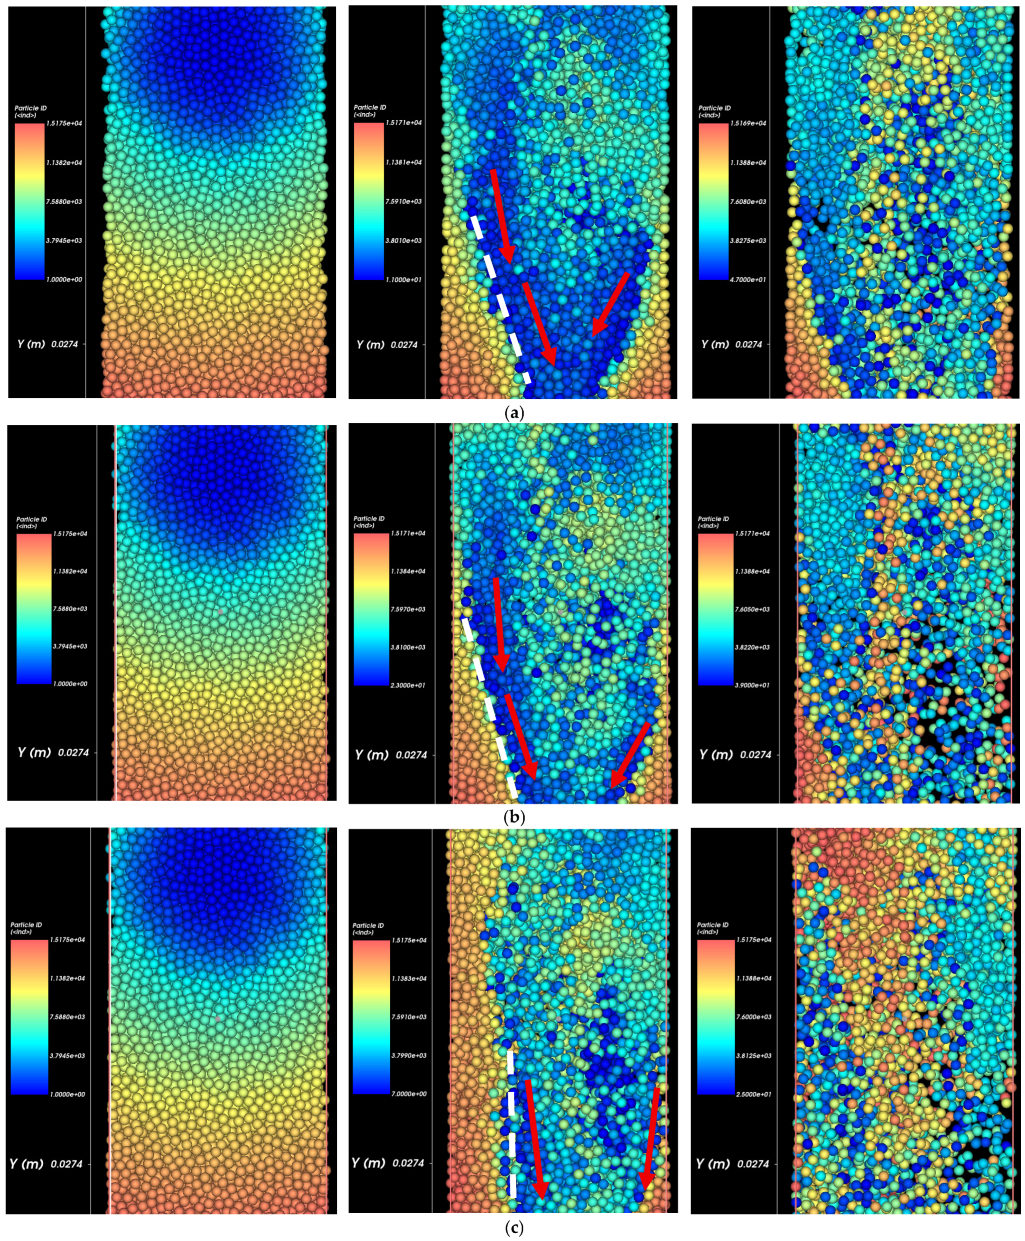
Figure 4 illustrates the spatial and temporal evolution of soil erosion at three different infiltration pressures using CFD–DEM coupled modeling. Different colors in the figure represent different particle groups, referred to as so-called “particle IDs” to represent the original location of soil particles. Each row shows a sequence of snapshots over time at a given infiltration pressure, and the distinct particle ID colors enable the visualization of group-wise displacement and mixing during the erosion process. The red arrows in
Figure 4 highlight the primary erosion pathways, indicating the direction of soil particle migration driven by seepage flow. The dashed white lines show the failure plans that should have an angle of (45 + ϕ/2) from the minor principal stress direction (i.e., horizontal direction). ϕ is the angle of repose (i.e., friction angle) of the eroded sand, typically ranging between 30° and 40° for non-cohesive stable sandy soils. The measured angle is 63° to 65° in
Figure 4a,b, which is in the range of the theoretical values. These unstable slope formations in
Figure 4 are consistent with experimental and theoretical predictions for granular material under gravitational and hydraulic forces when the angle exceeds the above range.
At 20.7 kPa (top row), particle detachment initiates slowly and remains localized near the pipe defect as the particles with the same color are still close to each other after a certain time. Distinct color bands remain largely intact, indicating minimal particle mixing, and limited erosion occurs. Particle motion is constrained, and void development is minimal.
At 34.5 kPa (middle row), more pronounced detachment occurs, with particle ID groups beginning to migrate downward and outward. The erosion cavity becomes more visible, and ID groups become increasingly mixed, reflecting enhanced transport and structural disruption.
At 48.3 kPa (bottom row), particle movement is rapid and widespread. The erosion front progresses quickly, and significant mixing of particle ID groups occurs as they are entrained into the flow. A large void zone forms early in the process, and color blending indicates intense displacement and redistribution.
These results highlight the strong dependency of erosion dynamics on the magnitude of infiltration pressure (i.e., groundwater height above the defect in the pipe). As the pressure increases, the flow-induced shear forces surpass the critical threshold for soil particle mobilization (i.e., critical shear stress), leading to accelerated and intensified erosion behaviors around the pipe. This particle ID tracking approach provides clear insights into the onset and propagation of internal erosion above defective buried pipes. It enables the identification of the erosion pathways and highlights how increasing infiltration pressure accelerates soil destabilization and void formation through more vigorous and extensive particle mobilization.
3.2. Formation of Void Zones
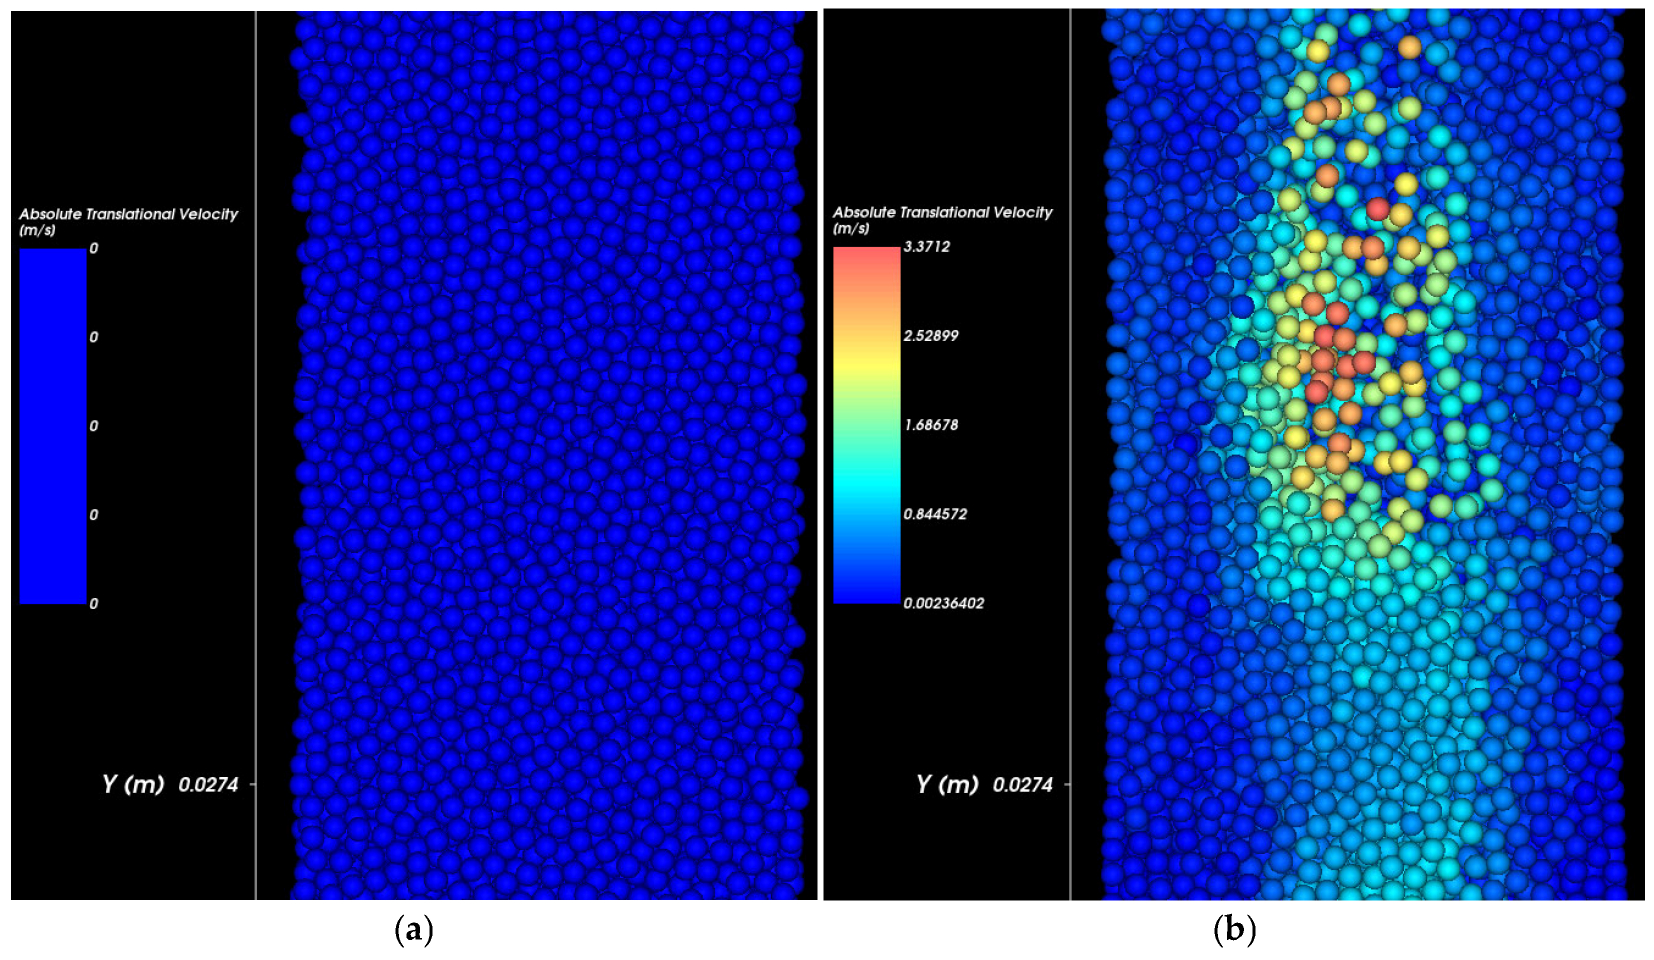
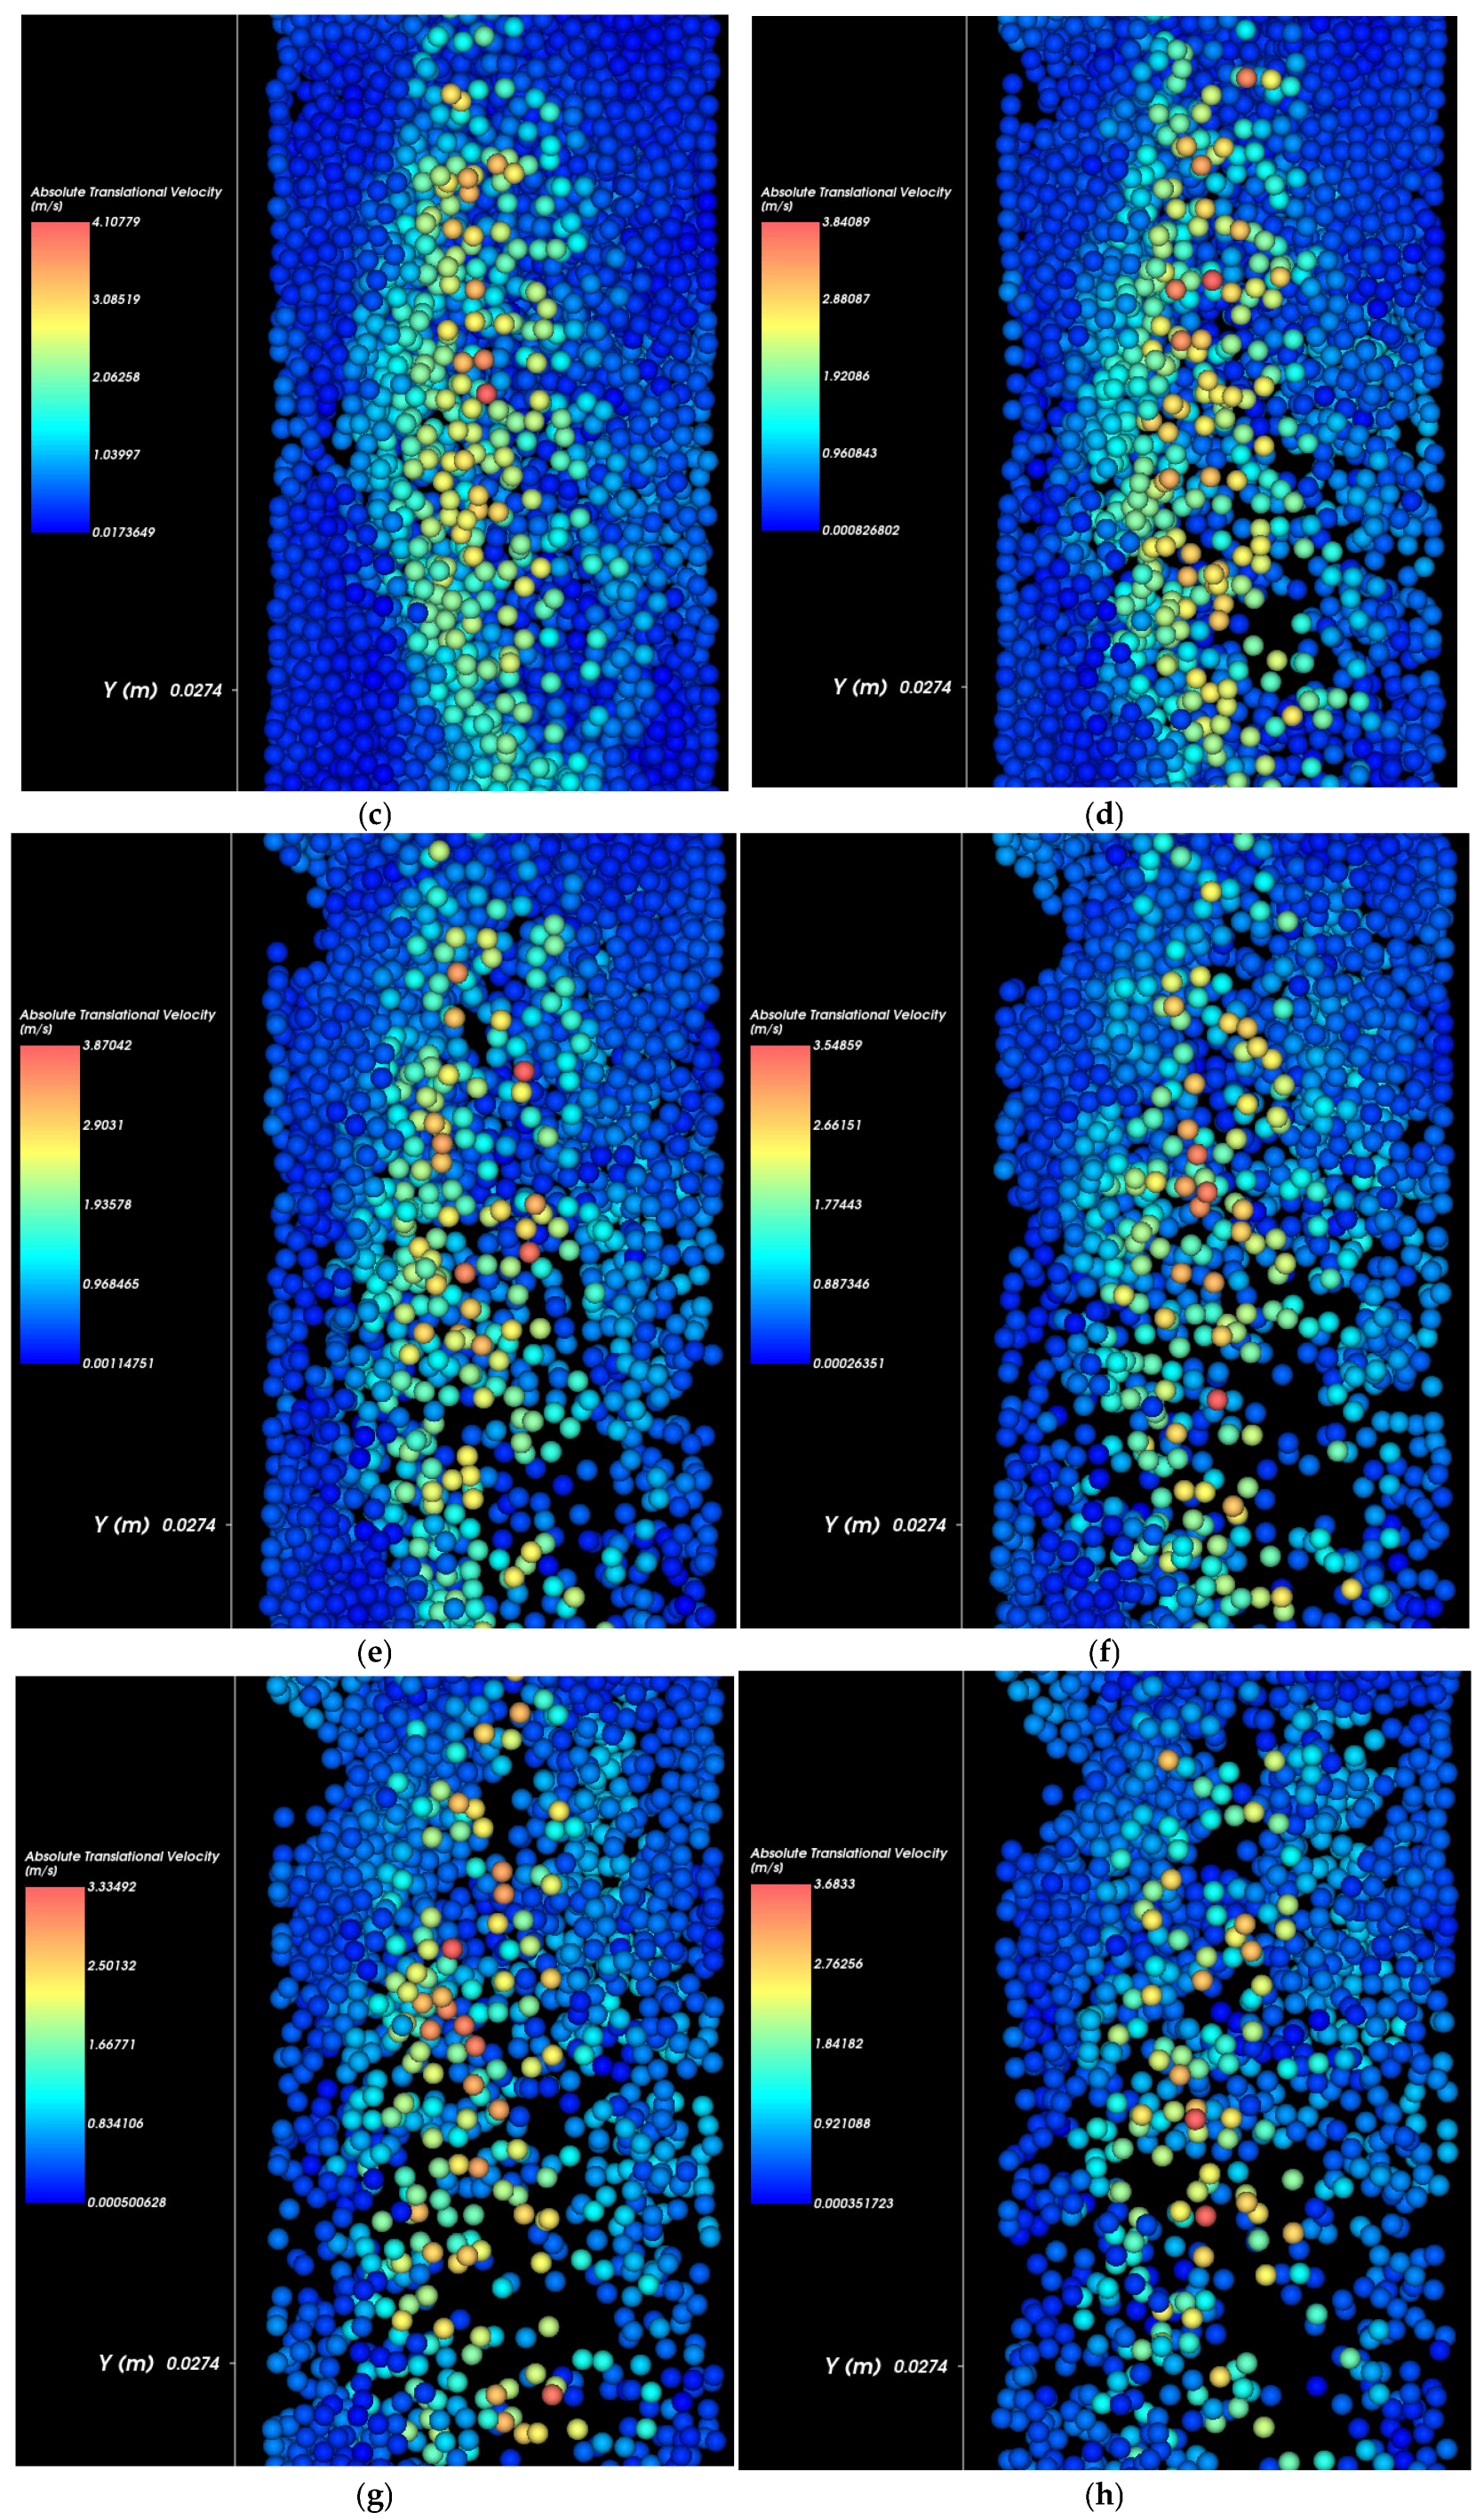
Figure 5 captures the dynamic evolution of void spaces within the soil mass as water infiltrates at a pressure of 20.7 kPa with a 12.7 mm defect opening. Initially (at 0 s), the soil structure is dense and undisturbed, with particles exhibiting negligible motion. As the infiltration progresses, localized particle detachment begins near the pipe defect due to rising pore water flow velocity.
Between 0.05 s and 0.15 s, a developing high-velocity zone emerges, initiating a concentrated region of particle mobilization. This region corresponds to the early formation of a vertical void channel aligned with the water flow path.
From 0.2 s onward, the void zone expands upward and outward. The velocity distribution highlights intensified particle movement at the erosion front, while previously detached particles exit the domain, leaving behind an increasingly porous structure. By 0.35 s, a well-defined erosion-induced cavity has formed, demonstrating the clear spatial development of void zones driven by the infiltration.
This sequence illustrates the fundamental mechanism of internal erosion at low infiltration pressure, emphasizing how gradual particle detachment and flow-aligned velocity gradients drive the progressive destabilization of soil internal structure. Simulations reveal the progressive development of voids near the pipe defect, which expand over time, potentially compromising the structural integrity of the pipeline.
3.3. Effect of Infiltration Pressure on Void Formation
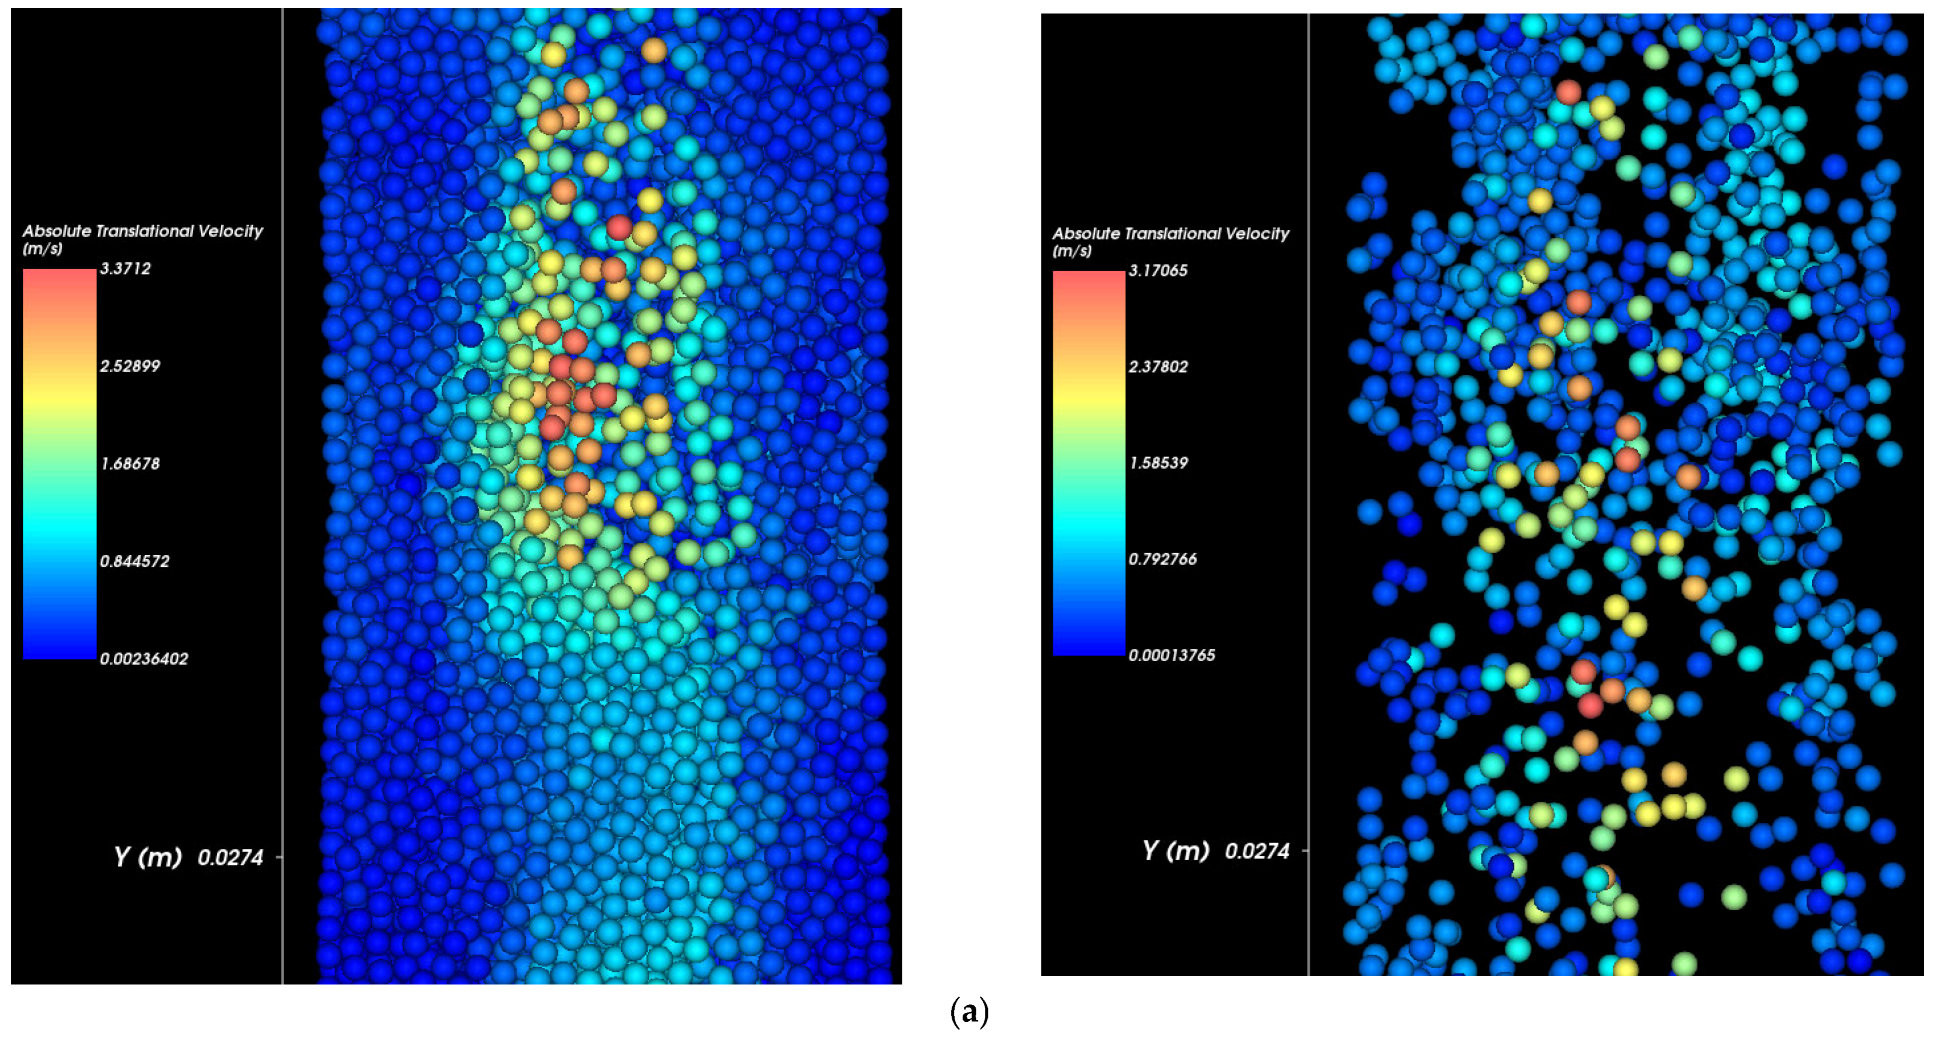
Figure 6 demonstrates the progressive development of void spaces as infiltration pressure increases. Different colors represent different velocities. Blue color has the lowest velocity while red color has the highest one. At 20.7 kPa, initial particle mobilization at 0.05 s is relatively limited and concentrated near the pipe defect. By 0.5 s, voids have begun to form but remain localized, with moderate particle velocities.
At 34.5 kPa, elevated infiltration pressure results in more pronounced particle movement, even at 0.05 s. By 0.5 s, a larger and more dispersed void zone is observed, with higher particle velocities indicating intensified erosion and detachment.
At 48.3 kPa, the formation of voids is the most significant one. High-velocity regions appear early (0.05 s), and by 0.5 s, an extensive void has developed with widespread particle displacement. The erosion pattern shows both vertical and lateral expansion, signaling structural destabilization due to rapid loss of soil material.
The progression across the three pressures clearly indicates that increasing infiltration pressure accelerates erosion processes and enlarges void zones, driven by higher hydraulic gradients and shear stresses that surpass the critical shear stress for soil particle mobilization.
3.4. Effect of Pipe Defect Sizes
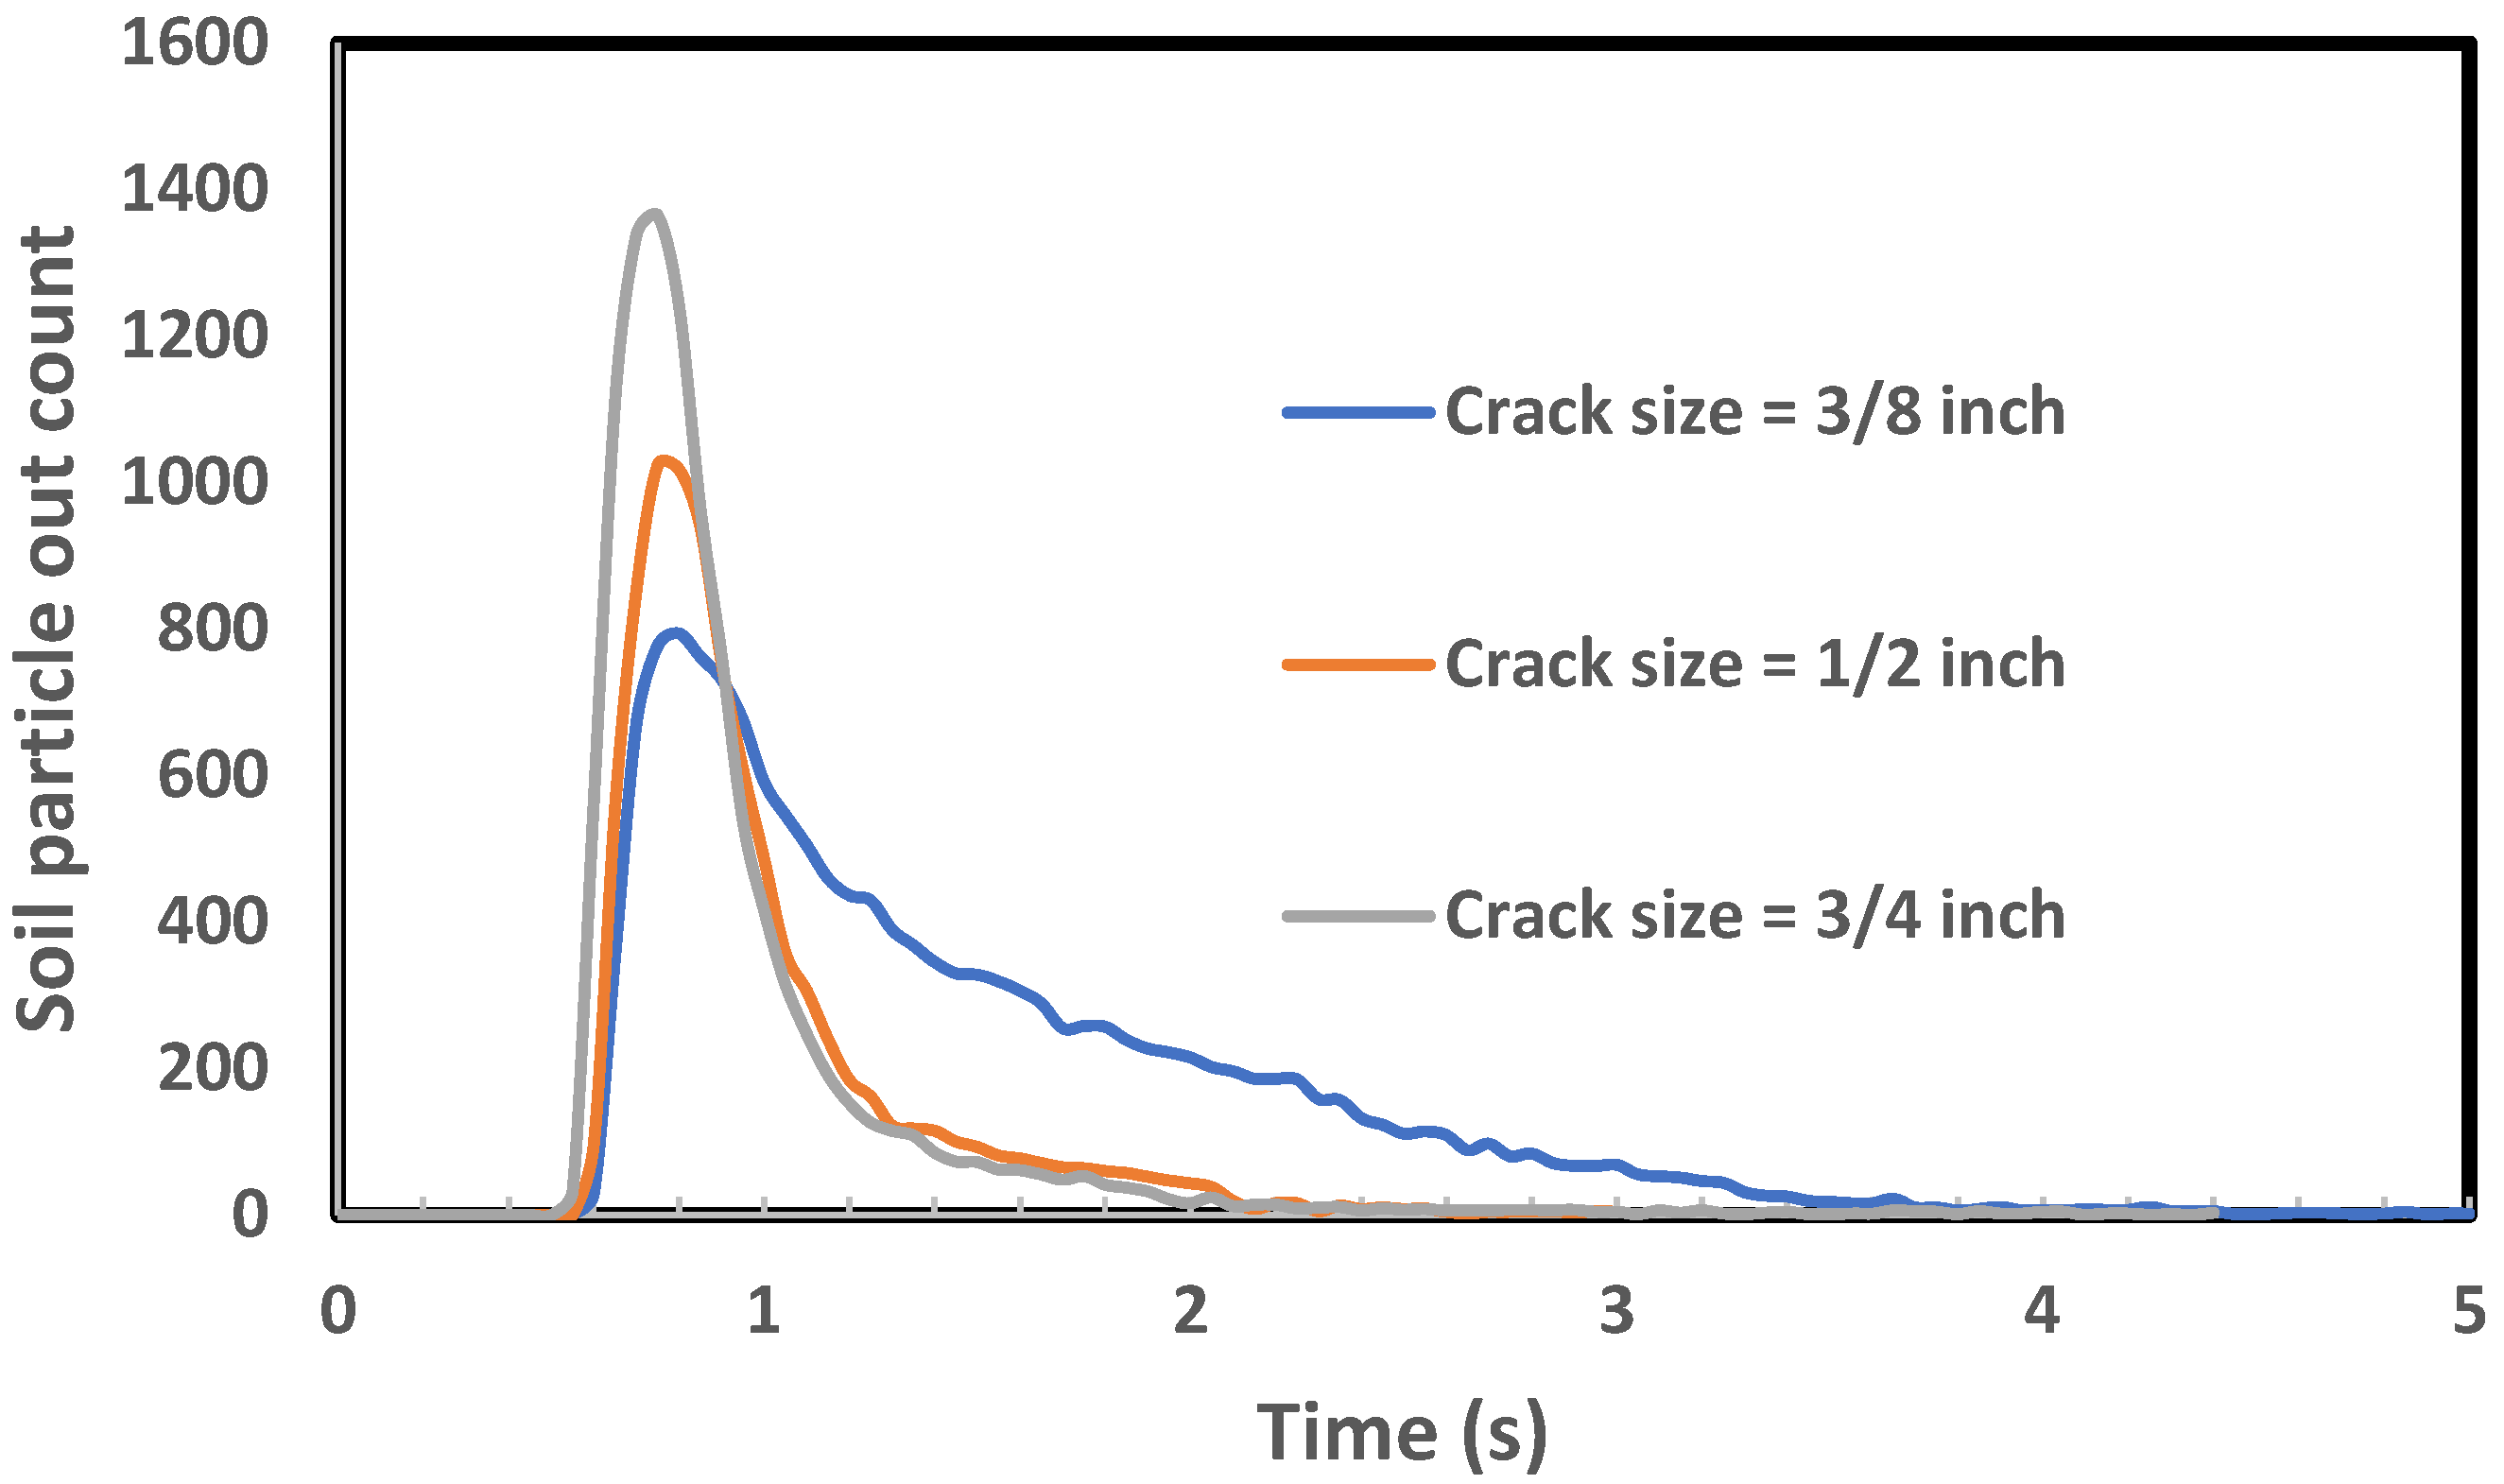
Figure 7 illustrates the relationship between pipe defect size and the rate of soil particle outflow over time. The simulations were conducted for three defect diameters: 9.53 (blue), 12.7 (orange), and 19.05 mm (gray), under the infiltration pressure of 34.5 kPa. The results clearly demonstrate that larger defect sizes result in more rapid and extensive particle loss.
For the 19.05 mm defect, particle outflow initiates earlier and higher peaks than the other two cases, reaching a maximum count of approximately 1400 particles in a short time. This sharp and early peak reflects intense soil erosion caused by the larger opening, allowing more particles to be mobilized and expelled rapidly.
The 12.7 mm defect also produces a high outflow count, peaking slightly below 1100 particles. The curve follows a similar shape to that of the 19.05 mm defect but with a slightly delayed onset and a broader distribution, indicating moderately intense but somewhat sustained erosion.
The 12.7 mm defect results in the lowest peak (around 800 particles) and the most prolonged particle outflow. Although the peak is lower, the longer tail of the curve indicates a more gradual release of particles over a longer duration.
These results highlight the critical role of defect size in influencing internal soil erosion behaviors. As the defect size increases, the system exhibits a more aggressive and rapid loss of soil particles, emphasizing the vulnerability of systems with larger structural openings to accelerate erosion and potential failure.
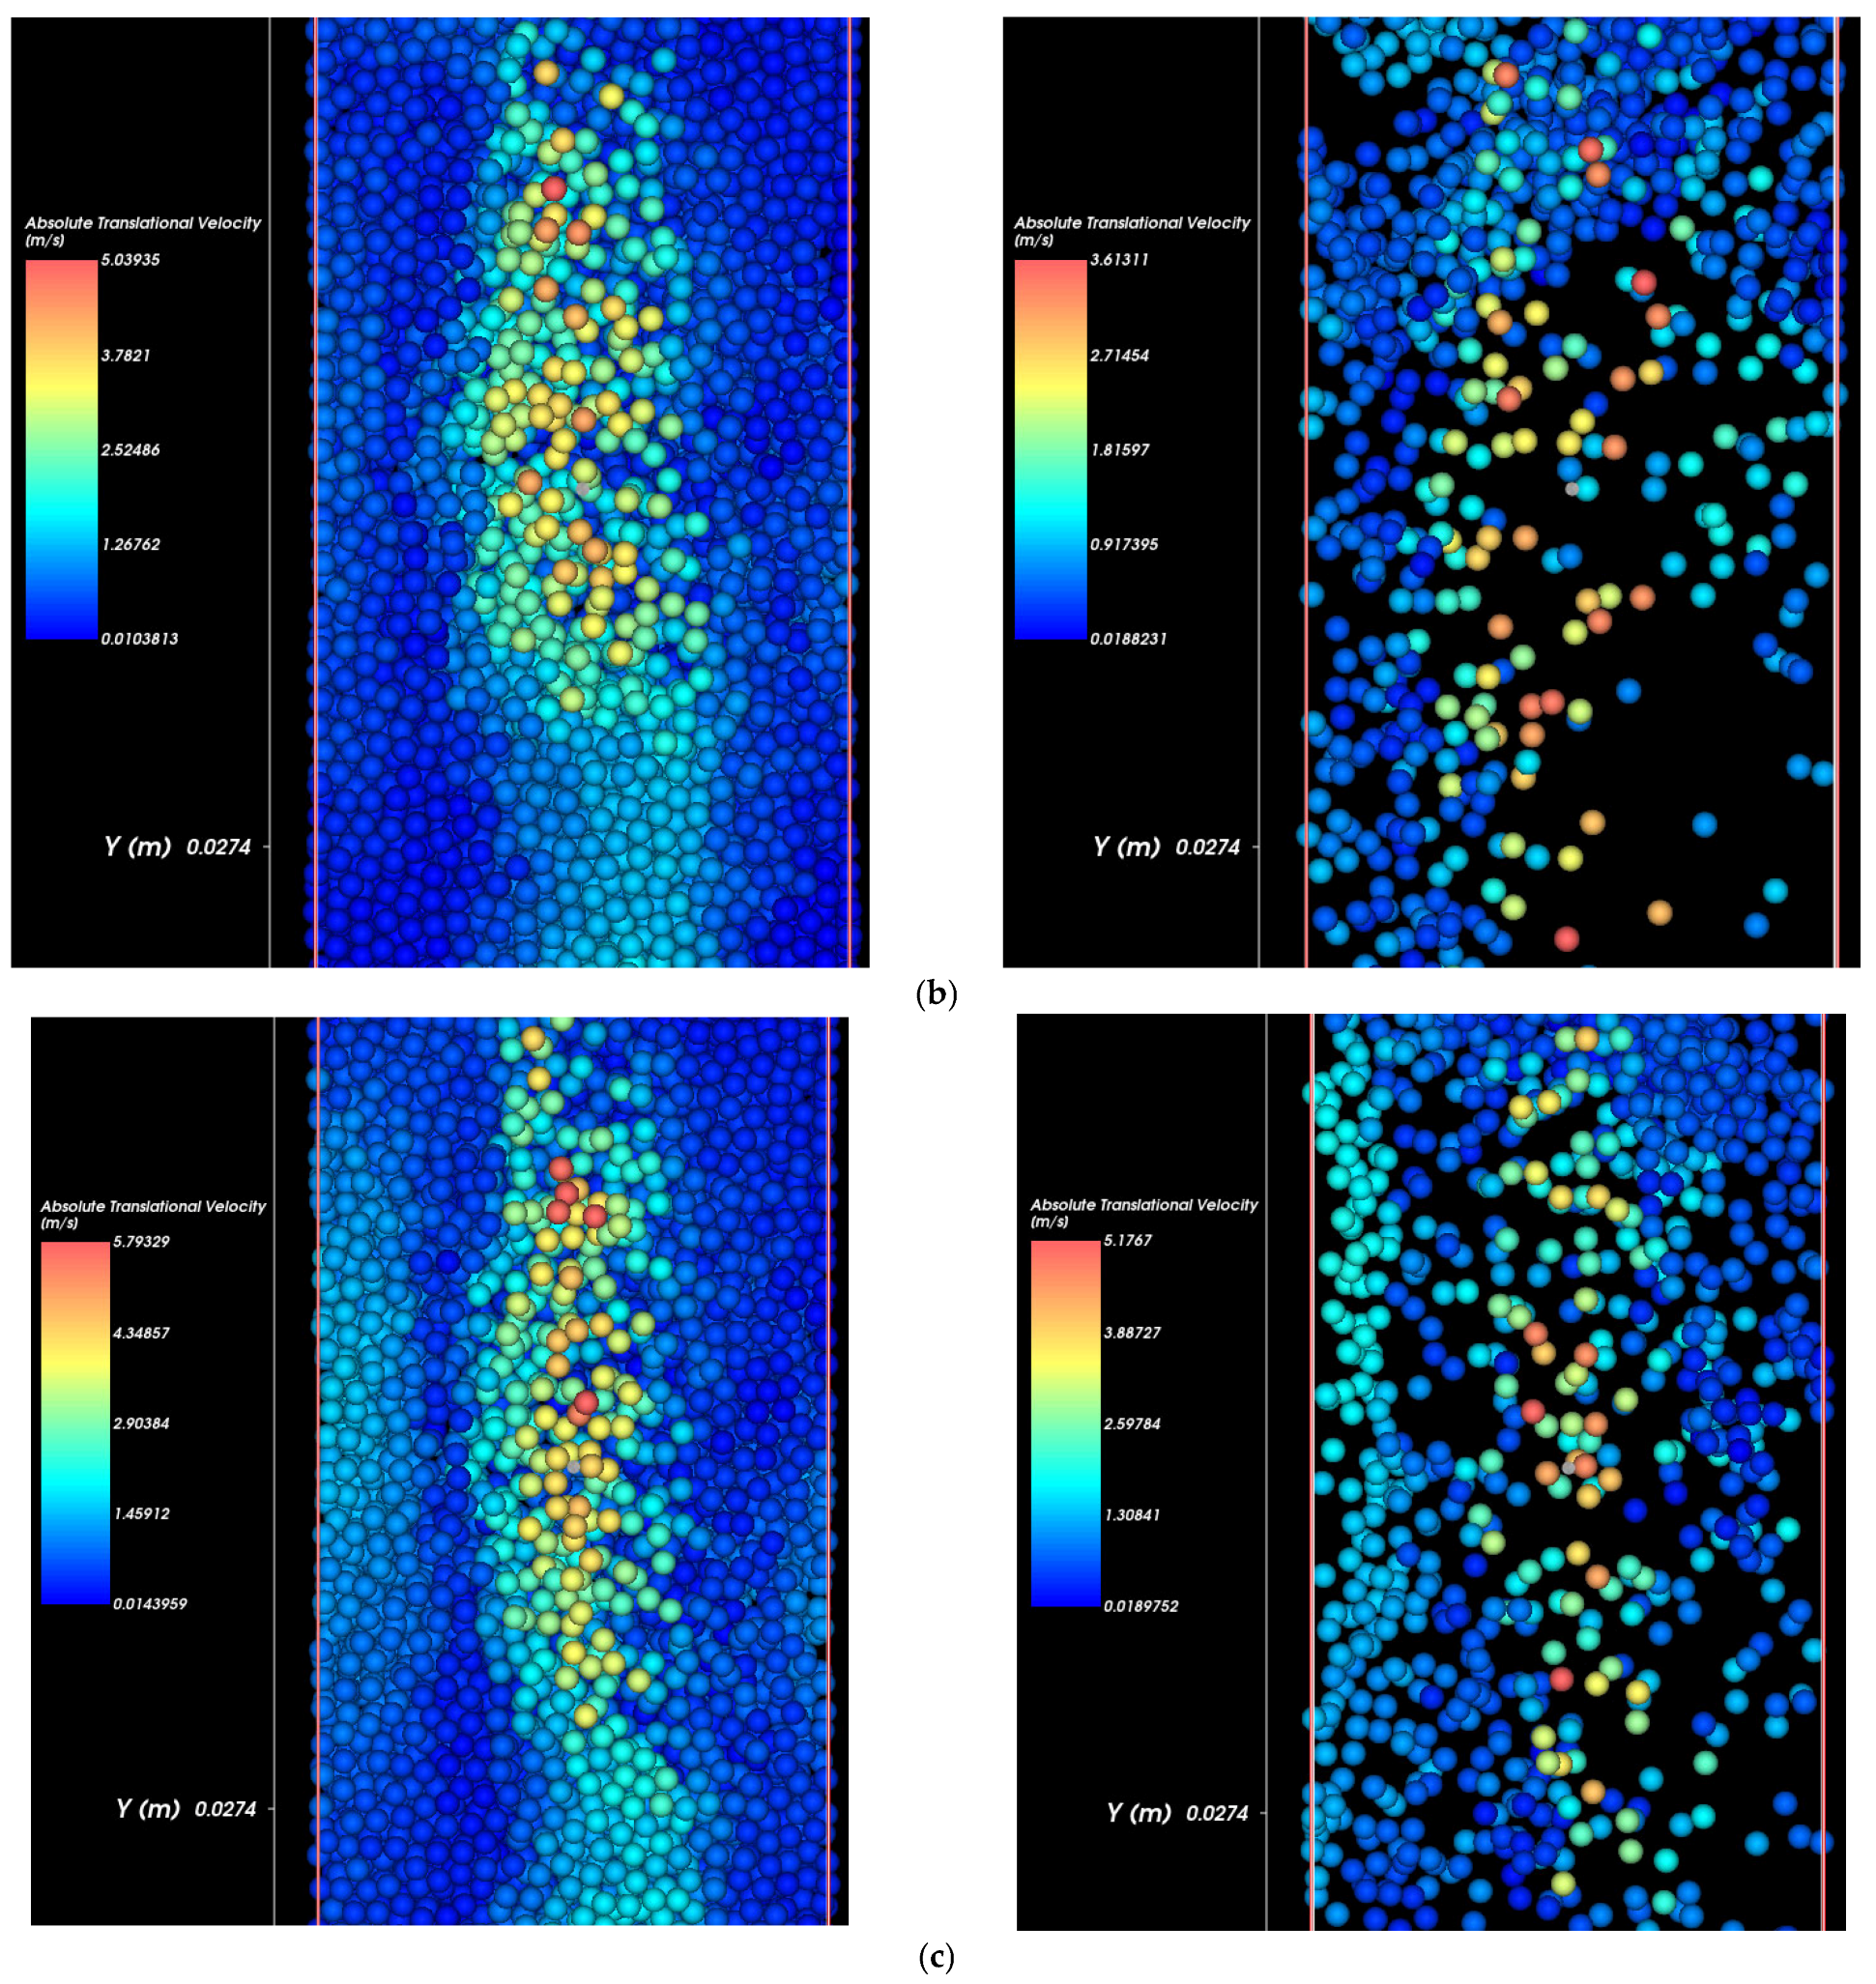
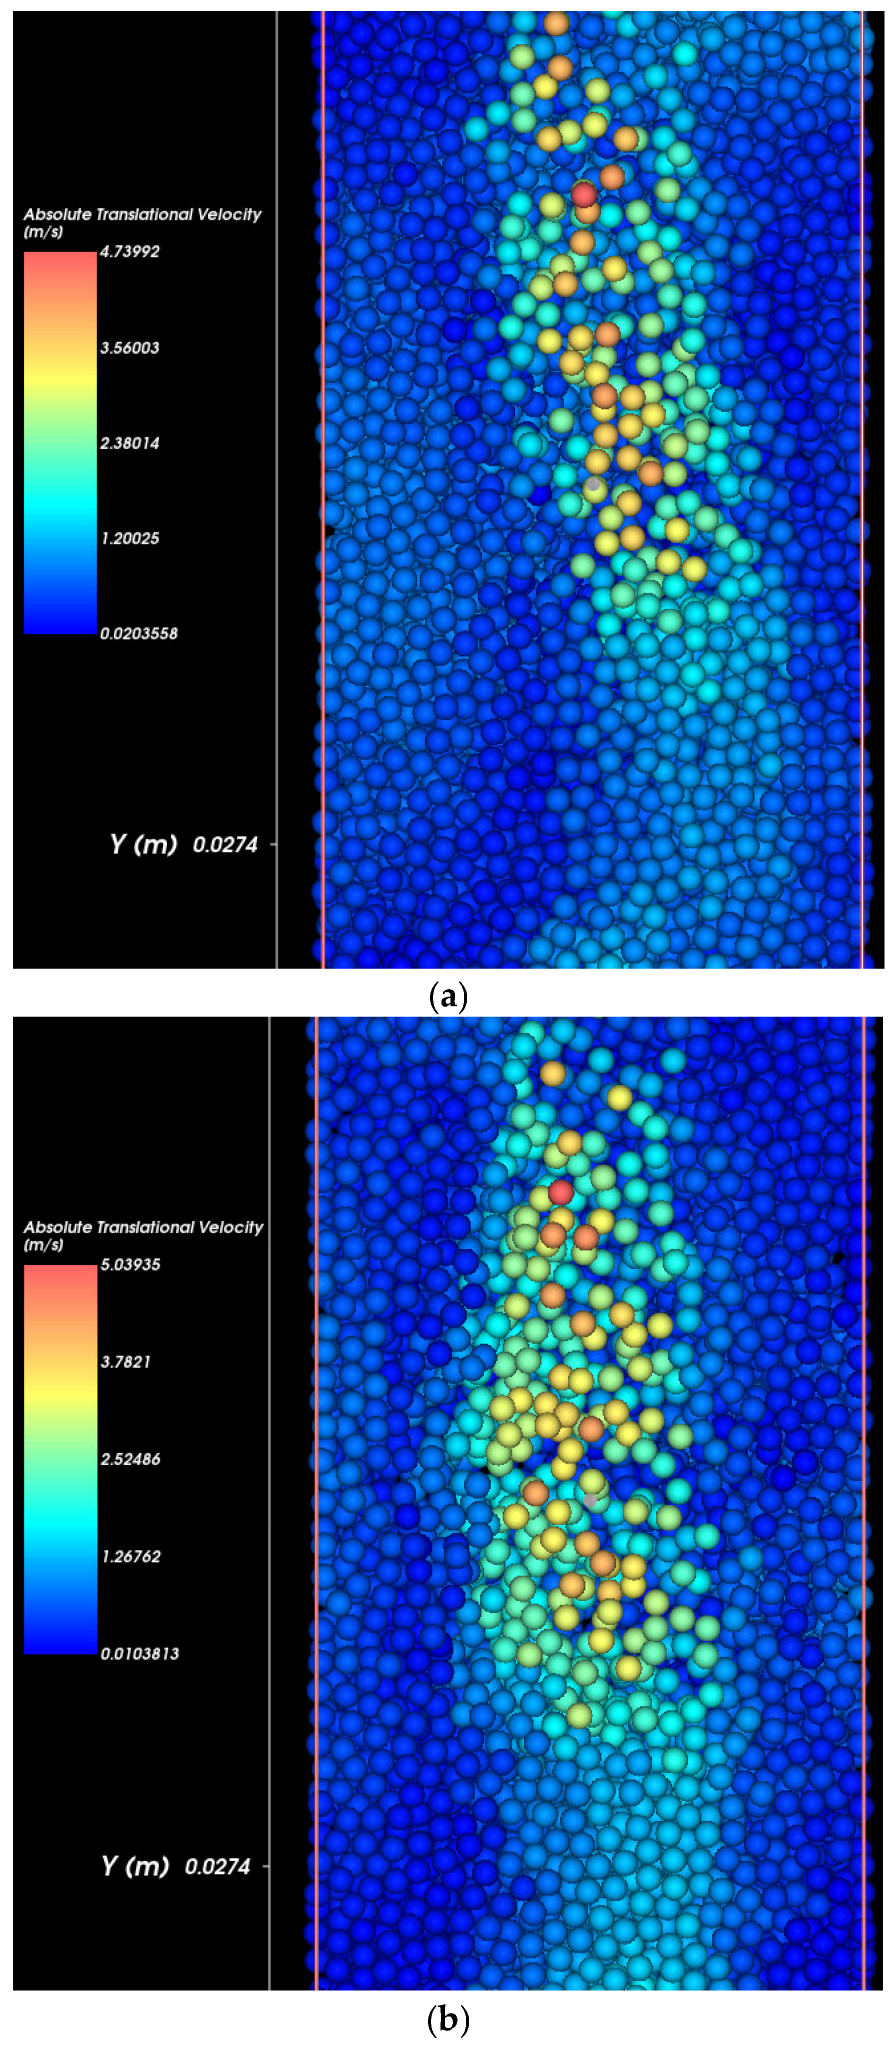
Figure 8 illustrates the influence of pipe defect size on the velocity field of eroded soil particles. Each subplot represents the velocity distribution for a different defect size. Particle velocity is visualized using a color scale, where red indicates higher velocities and blue indicates near-zero movement. As defect size increases, the magnitude and spatial extent of high-velocity zones also increase, indicating more aggressive particle mobilization.
Top image (9.53 mm defect): A relatively small high-velocity region is visible near the pipe defect. Particle movement is localized, and most of the soil mass remains undisturbed, reflecting slower erosion progression.
Middle image (12.7 mm defect): The high-velocity region becomes more prominent and expands vertically. A larger portion of the soil column exhibits significant motion, suggesting enhanced detachment and transport of soil particles.
Bottom image (19.05 mm defect): The highest velocity magnitudes and the broadest affected region are observed. Particle movement is widespread, and void development is clearly initiated. The increased flow energy due to the larger defect accelerates the erosion process and destabilizes a greater volume of soil particles.
These visualizations confirm that a larger pipe defect leads to more intense hydraulic conditions, promoting faster and more extensive internal erosion. The corresponding increase in particle velocity contributes directly to the rate and scale of soil erosion.
3.5. Transport of Soil Particles Under Pipe Flow
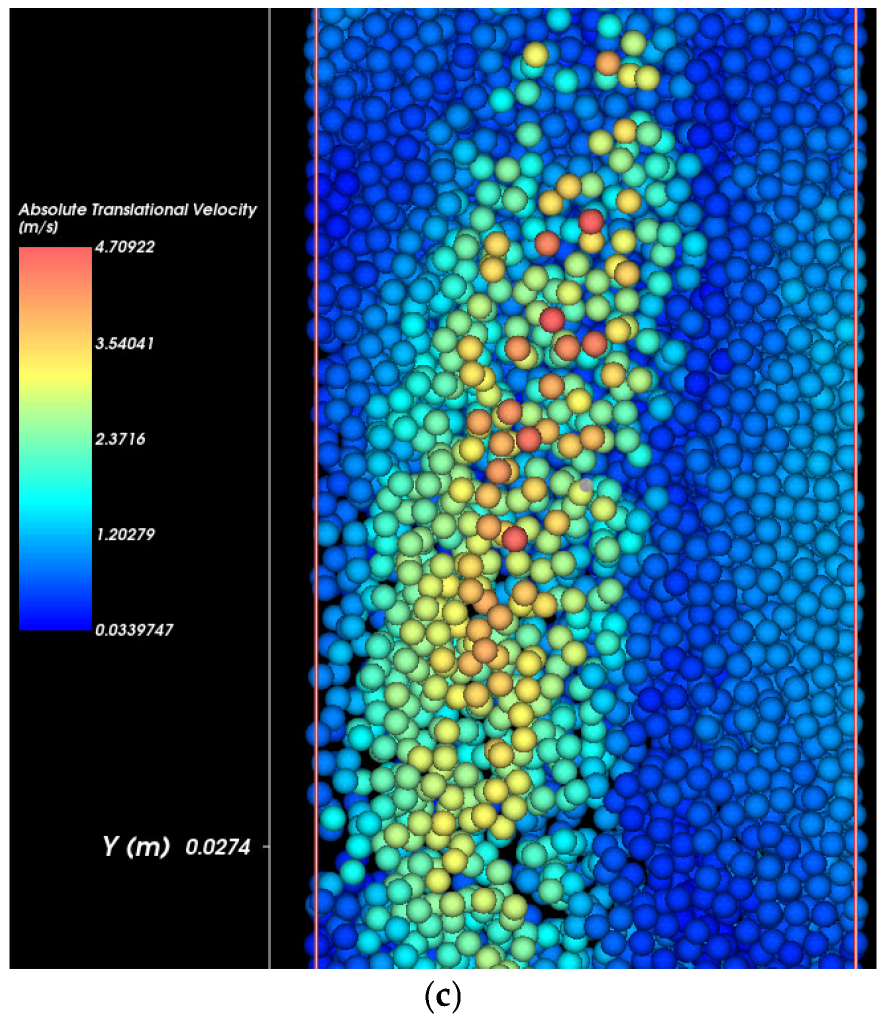
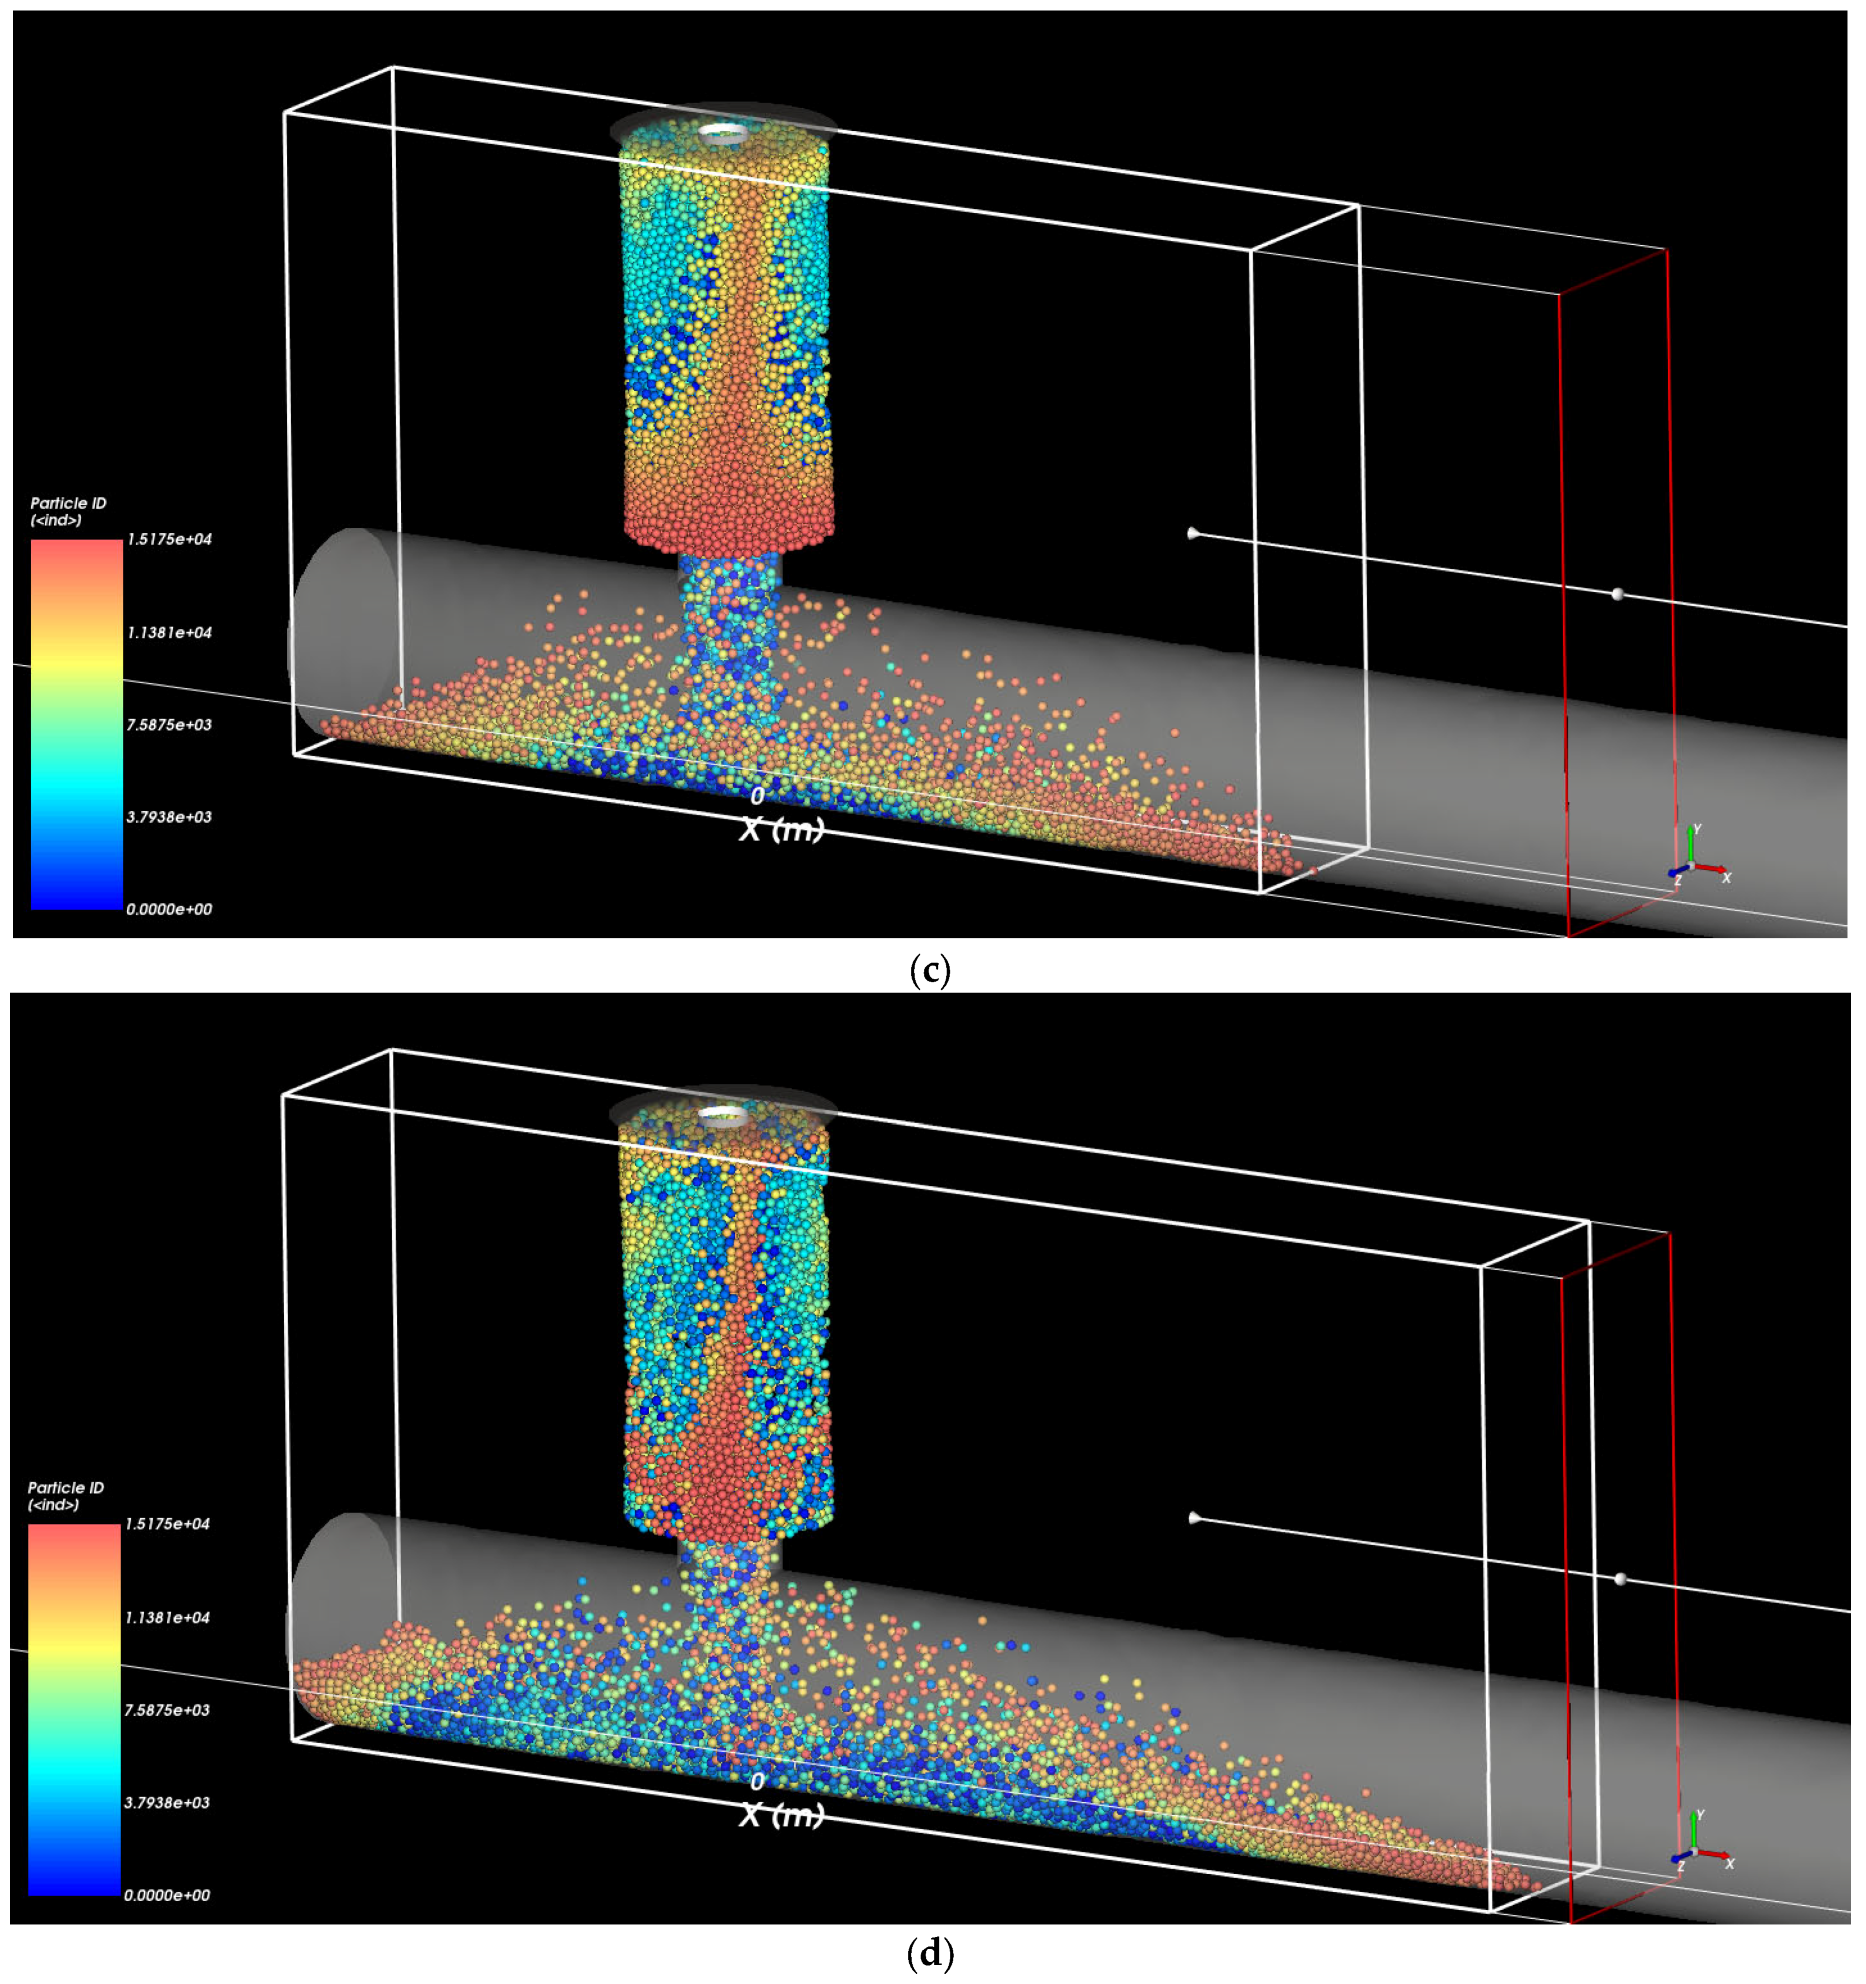
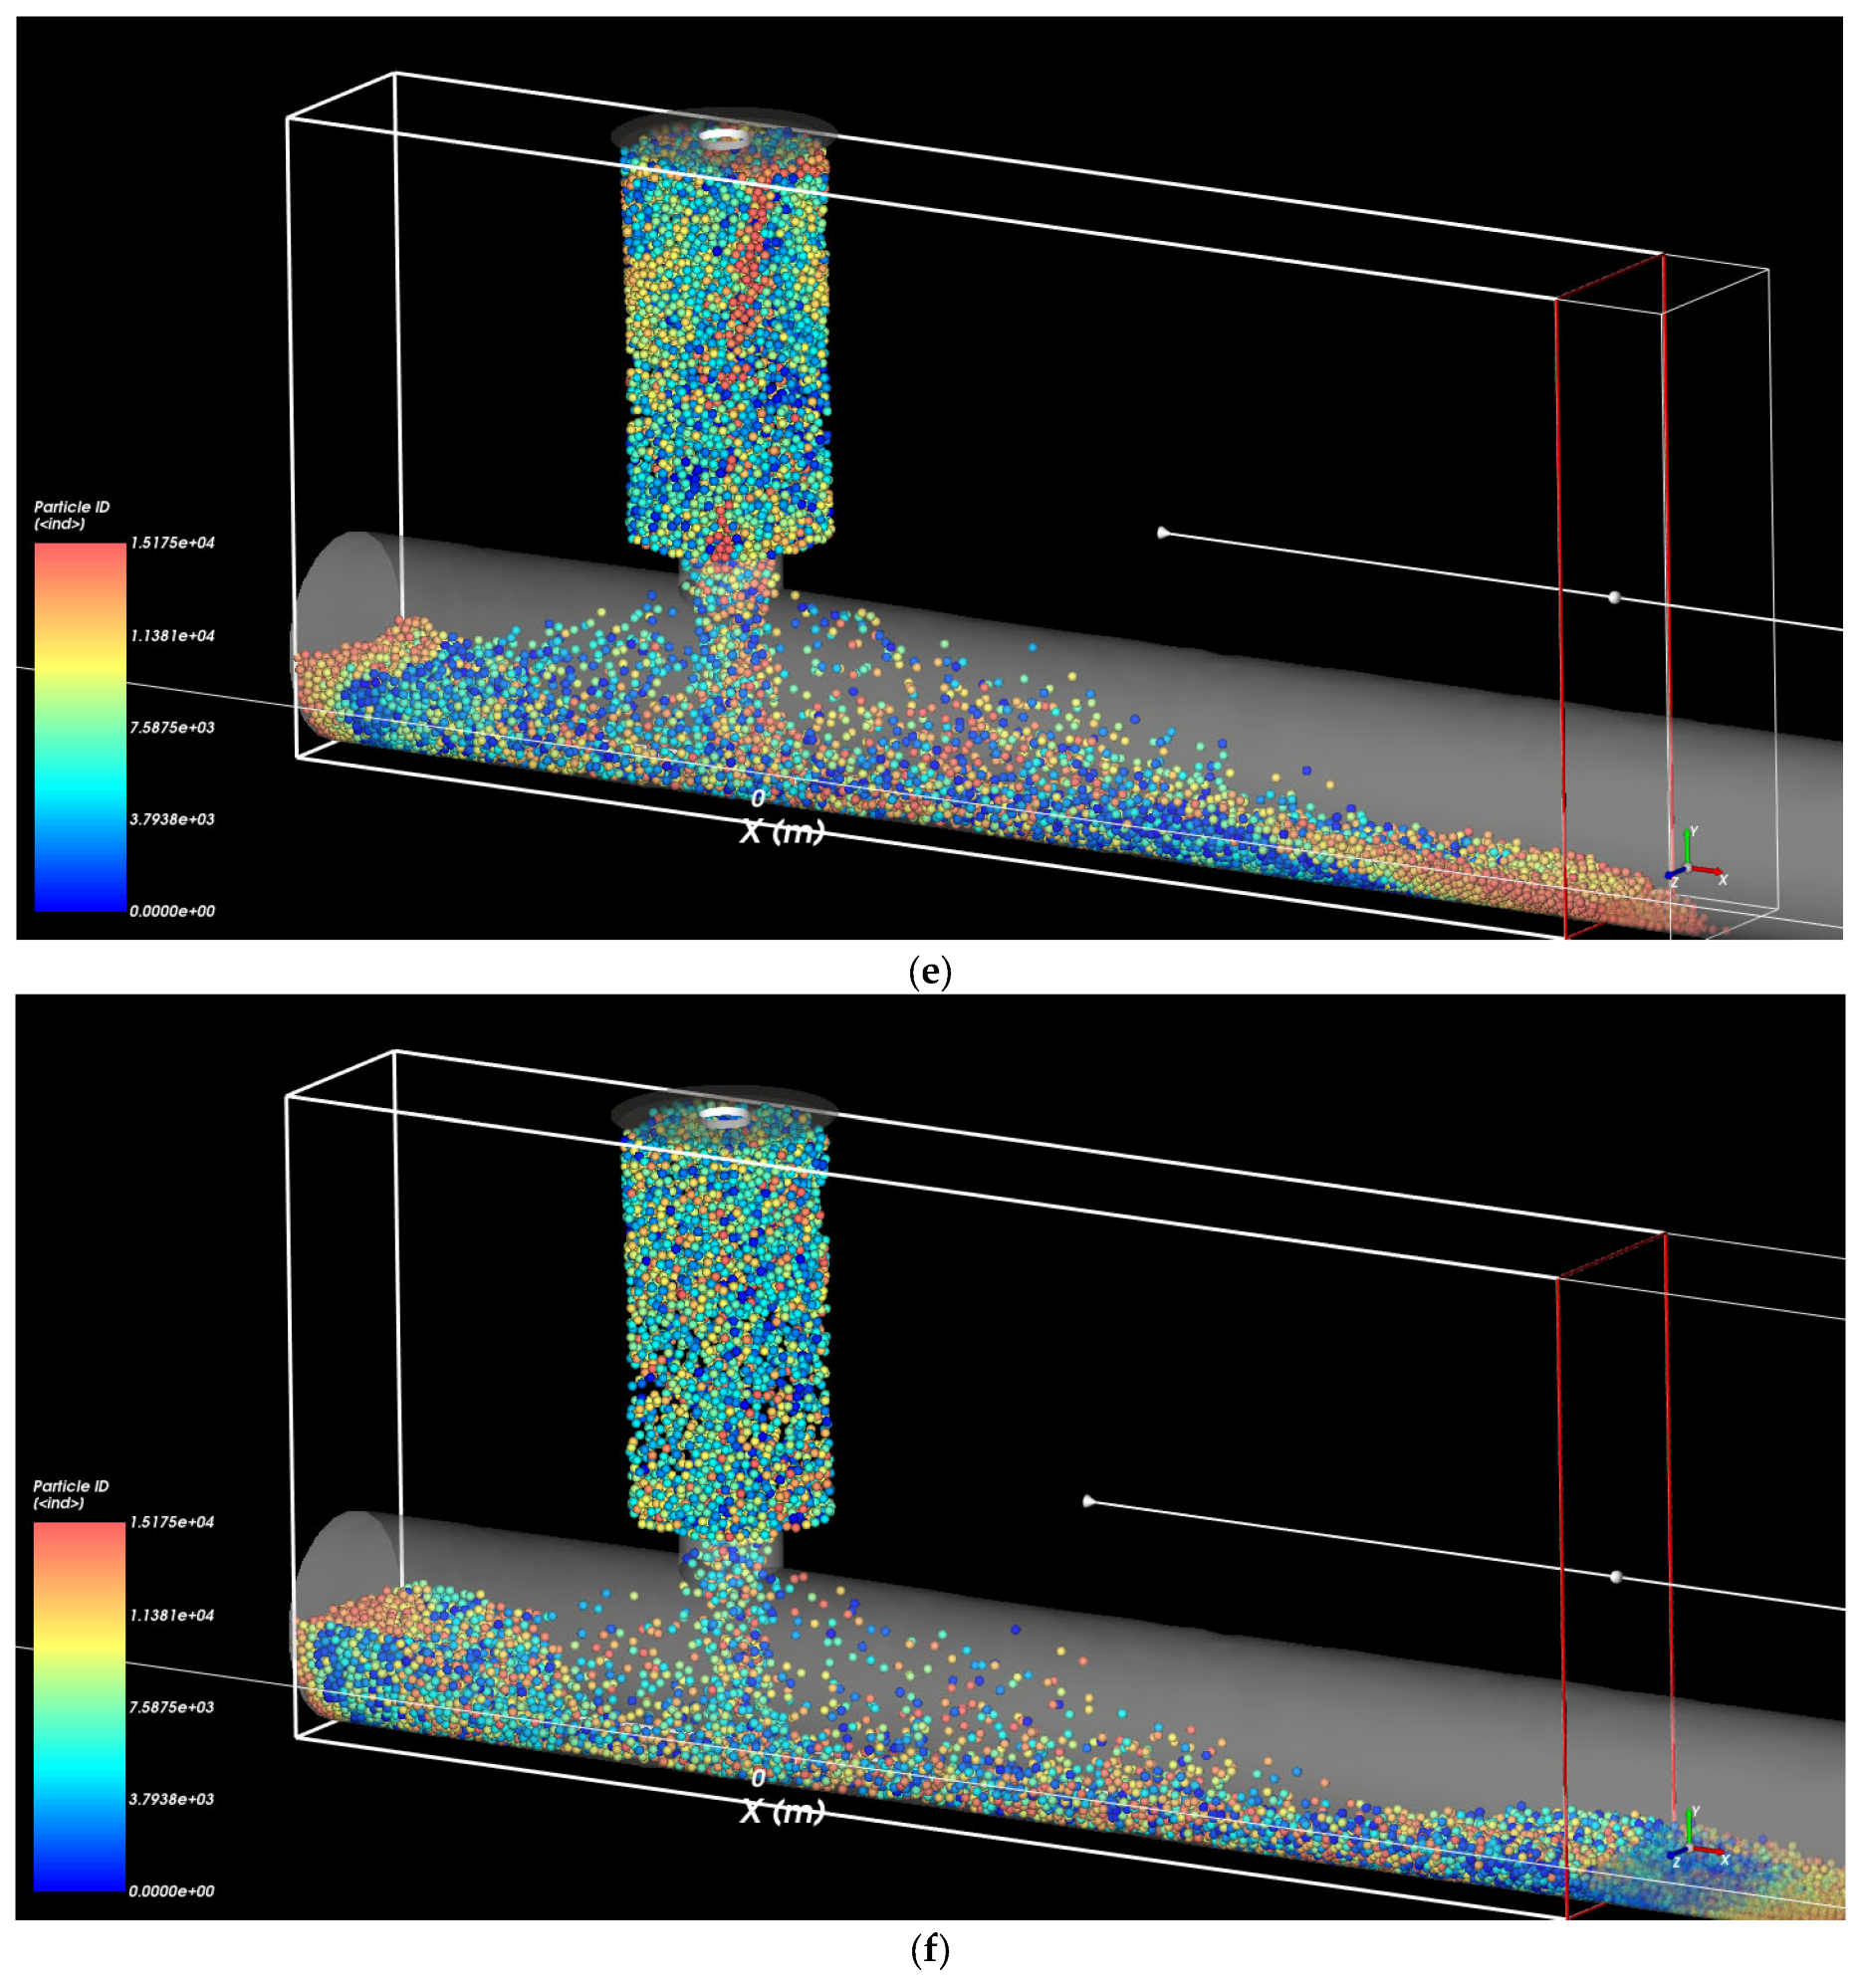
Figure 9 presents a 3D perspective of the internal erosion process driven by infiltration through a pipe defect. The color-coding of particles by ID group allows for visual tracking of particle displacement and the evolution of erosion pathways. The sequence illustrates the detachment and transport of soil particles from the soil column into the pipe through a defect, with particles color-coded by ID group to track their movement over time. There is a transportation of soil particles under pipe flow at 20.7 kPa infiltration water pressure for the pipe defect size of 12.7 mm through time intervals of 0, 0.05, 0.1, 0.15, 0.2, and 0.3 s.
At the time point of 0 s, particles remain relatively undisturbed, and the structure of the soil column is intact. Only a few particles near the defect begin to shift, indicating the onset of localized erosion.
At the time points of 0.05, 0.1, and 0.15 s, progressive particle movement becomes evident as particles from specific ID groups begin migrating toward the pipe. The developing erosion pathway is clearly visible, with particle groups revealing the directionality and extent of soil displacement.
At the time points of 0.2 and 0.3 s, erosion is fully developed, with distinct bands of particle IDs showing the transport of material through the defect and into the pipe. The void zone has expanded significantly, and the pattern of particle displacement reveals both vertical and horizontal progression of the internal soil erosion.
This visualization emphasizes the dynamic evolution of particle movement during infiltration-induced erosion and demonstrates the effectiveness of particle ID tracking in capturing the spatial and temporal development of erosion channels.
3.6. Erosion Rates and Void Zone Development
The visualized progression highlights a nonlinear erosion process. Initially, particle detachment is slow and confined to the immediate vicinity of the pipe defect. As infiltration continues, hydraulic gradients intensify, accelerating the detachment rate. This is reflected in the increasing volume of displaced particle ID groups entering the pipe.
Quantitative analysis (as seen in the associated particle outflow plots) confirms that erosion rates peak rapidly after the onset of movement, particularly for larger defects or higher infiltration pressures. The corresponding void zone begins as a localized cavity but evolves into a vertically elongated and laterally unstable structure.
This erosion behavior aligns with critical shear theory—once local hydraulic forces exceed the critical shear stress required to overcome particle friction and interlocking, detachment becomes self-sustaining. Particle ID visualization aids in mapping the pathway of this progressive failure and in identifying zones of concentrated flow and structural compromise.
These findings support the conclusion that pipe defects, even under modest infiltration pressures, can trigger internal soil erosion processes that rapidly evolve and threaten stability of soil internal structure. Monitoring particle trajectories and erosion rates through CFD–DEM coupled simulations provides valuable insights for risk assessments and the design of preventive drainage systems.
The CFD–DEM approach effectively captures microscopic interactions leading to macroscopic erosion phenomena. The findings emphasize the importance of considering soil type, infiltration intensity, and pipe material in pipeline design and maintenance. Future work should incorporate field validation and parametric studies on pipe inclination, pipe joint failures, material properties, and varying hydraulic conditions.
4. Discussion
This study employed a coupled CFD–DEM framework to investigate the internal erosion mechanisms induced by water infiltration around defective buried pipes. The simulation results revealed that both infiltration pressure and defect geometry play critical roles in accelerating soil particle detachment and the formation of erosion cavities. As infiltration pressure increases or defect size enlarges, the onset and progression of soil loss become more rapid, resulting in larger voids and a higher likelihood of ground instability. These findings underscore the importance of localized hydraulic gradients and structural defects in predicting subsurface failure mechanisms.
4.1. Comparison with Established Models to Highlight Novel Contributions
One of the key contributions of this work is the high-resolution visualization of soil particle motion in three dimensions, which provides a detailed depiction of erosion cavity formation, void evolution, and localized collapse. The analysis of soil velocity fields around defect sites demonstrated preferential erosion along paths of steep pressure gradients, often accompanied by the breakdown of soil arching. The simulations revealed that soil arches initially resist particle migration but collapse when hydraulic forces exceed structural load capacity, triggering an accelerated phase of erosion. This behavior is consistent with theoretical arching models and aligns with visual observations from particle image velocimetry (PIV) in previous laboratory studies.
In comparison with earlier experimental studies, such as those by Tang et al. [
4] and Guo et al. [
8], which investigated erosion through physical models using various particle sizes and slot geometries, the current study replicates and extends their findings by quantifying flow regimes and particle trajectories in full 3D. While the earlier studies established empirical relationships between defect size and erosion rate, our simulations validate these trends and reveal how defect orientation and infiltration pressure interact to dictate the extent and direction of soil loss.
Similarly, the findings compare favorably with those of Ibrahim and Meguid [
11], who used CFD–DEM simulations to study soil infiltration into defective sewer pipes under varying groundwater levels. Their identification of a freefall arch regime and erosion saturation threshold is corroborated by our results. However, our study further shows that larger defects and higher infiltration pressures can overcome arch stability, leading to continuous erosion even beyond the predicted saturation point. The significance of defect orientation is further highlighted, as our simulations confirm that invert-located defects result in more widespread erosion patterns compared with defects at the pipe crown, aligning with observations from Wang et al. [
1] and Dai et al. [
9], who reported similar trends in their physical/numerical studies of ground collapse.
Tang et al. [
15] also proposed an analytical model extending Beverloo’s free-fall arch theory, suggesting an exponential relationship between the ratio of soil to water flow rates and the ratio of defect to particle size. Our simulation data supports this relationship, and we provide additional granularity by identifying local instabilities and cavity morphology that were not captured in simplified models. These detailed insights enhance the predictive capabilities of existing analytical approaches and support their integration into risk assessment frameworks for buried infrastructure.
In summary, the CFD–DEM simulations presented in this study advance the current understanding of defect-induced internal erosion by bridging the gap between empirical models, analytical theories, and particle-scale mechanics. The ability to visualize and quantify soil–fluid interactions at high resolution reveals mechanisms that underline sinkhole formation and pipeline instability, thereby offering a robust predictive tool for the maintenance and design of critical underground systems.
4.2. Critical Shear Stress and Erosion Initiation
The onset of soil particle detachment under hydraulic loading is governed by the concept of critical shear stress (τ
c), which defines the threshold at which fluid-induced forces overcome the resisting forces of particle friction, interlocking, and weight. This principle has been foundational in erosion mechanics and is widely used to predict the initiation of sediment transport in both natural and engineered systems [
17,
18,
19,
20,
21].
In cohesionless soils such as sand, detachment begins when the local shear stress exerted by seepage flow exceeds τ
c. The resisting forces include the submerged weight of the particle, intergranular friction, and mechanical interlocking with surrounding particles [
22,
23,
24,
25,
26,
27,
28]. Once this threshold is exceeded, particle motion is initiated, and under favorable hydraulic gradients, the process becomes self-sustaining due to the reduction in confining stresses and progressive weakening of soil structure.
The critical shear stress can be estimated through empirical or theoretical models, often using the Shields parameter, which relates shear stress to particle size and relative density [
17,
29]. In granular flows adjacent to pipe defects, however, the problem becomes more complex due to three-dimensional effects, localized flow acceleration, and evolving geometry of the erosion cavity.
Our CFD–DEM model inherently captures the local fluid–solid interactions and allows for the resolution of shear forces at the particle scale. By analyzing the onset and propagation of erosion in regions where local hydraulic shear exceeds τc, we observed consistent alignment with classical erosion behavior. In particular, the simulations revealed that once critical shear is surpassed in the vicinity of the defect, detachment is no longer isolated but propagates outward, forming unstable arches and accelerating cavity growth.
The inclusion of this theoretical framework helps contextualize the simulation results within established erosion theory and reinforces the physical validity of the observed particle migration patterns. Understanding the role of critical shear stress is thus essential for predicting erosion initiation and guiding the design of more resilient buried infrastructure systems.


