Article

Research on the Distribution and Escape Characteristics of Dust at the Blasting Pile in an Open-Pit Mining Area

1
Zhunneng Group Co., Ltd., China Energy Investment Corporation, Ordos 010300, China
2
State Key Laboratory of Coal Mine Disaster Dynamics and Control, Chongqing University, Chongqing 400044, China
3
Institute of Future Civil Engineering Science and Technology, Chongqing Jiaotong University, Chongqing 400074, China
4
School of Resources and Safety Engineering, Chongqing University, Chongqing 400044, China
5
School of Metallurgy and Power Engineering, Chongqing University of Science and Technology, Chongqing 401331, China
6
School of Mines, China University of Mining and Technology, Xuzhou 221116, China
7
FinDreams Industry Co., Ltd., Xiangyang 441100, China
*
Author to whom correspondence should be addressed.
Geosciences 2025, 15(7), 238; https://doi.org/10.3390/geosciences15070238
Submission received: 17 May 2025 / Revised: 15 June 2025 / Accepted: 19 June 2025 / Published: 20 June 2025
(This article belongs to the Section Geomechanics)

Abstract

In open-pit mines, substantial amounts of dust are generated at various stages. Due to the long duration, repeated mechanical disturbance, and large volume of material handled during the shoveling and loading of blasting piles, this stage is recognized as one of the primary contributors to overall dust emissions in open-pit mining operations. The objective of this study is to investigate the spatial dispersion characteristics of dust at blasting piles and evaluate the influence of wind direction on dust migration and escape behavior. This study uses a full-scale numerical model to analyze the airflow and dust migration characteristics at blasting piles under different wind directions. Simulation results show that dust particles of different sizes exhibit distinct dispersion patterns: large particles settle near the source, medium particles migrate a moderate distance, and fine particles (PM2.5 and PM10) travel further and are more likely to escape from the pit. The leeward slope and pit bottom are identified as critical zones of dust accumulation and escape. Under both dump-side and stope-side wind conditions, respirable dust (d < 5 μm) accounts for more than 50% of the escaped particles, posing potential health risks to workers. These findings establish a scientific basis for targeted dust suppression strategies, supporting safer and more sustainable mine site management.

1. Introduction

Coal consumption accounts for 56% of China’s total energy demand (Ministry of Natural Resources, PRC. Statistical Table of National Mineral Resources Reserves in 2021, Ministry of Natural Resources, PRC. China Mineral Resources Report (2022)), indicating that coal is still the primary energy support for China’s rapid economic development. With the continuous development of open-pit coal mining technology in recent years, the proportion of open-pit mine output has increased to 17.8% in 2020 [1,2,3,4,5]. However, the rapid development of mining technology has also led to serious environmental problems, among which the dust generated by mining seriously endangers workers’ health and affects the mine’s environment [6,7,8,9,10].
Dust poses significant hazards to people and the environment. It can cause respiratory diseases such as pneumoconiosis and is a source of contamination for mine sites and their surroundings. Fine dust particles that are not quickly settled can even be carried by the wind for hundreds of kilometers, leading to haze and air pollution in urban areas. In addition, dust refers to solid particulate matter suspended on coal mining machinery and equipment for extended periods. This can lead to equipment wear, reduced equipment lifespan, increased mining costs, and decreased production efficiency. Moreover, dust can permeate mining areas, reducing visibility and impeding regular mining progress [11,12,13]. The China Coal Industry Association’s Guiding Opinions for High-Quality Development of the Coal Industry in the 14th Five-Year Plan, issued in 2021, emphasizes the importance of prioritizing safety and occupational health in coal mines while promoting coal science and technology innovation to improve production efficiency through green and intelligent mining (China Coal Industry Association. Guidance on high-quality development of coal industry in the 14th Five-Year Plan http://www.coalchina.org.cn/index.php?a=show&c=index&catid=464&id=129818&m=content, 2021-06-03/2023-03-18, accessed on 15 June 2025). Dust prevention and control are essential to implementing the national requirements for coal industry development and establishing a sustainable and environmentally friendly system. It can improve the working environment, enhance air quality, reduce occupational pneumoconiosis, reduce equipment wear and tear, increase equipment life, reduce production costs, and improve economic efficiency.
Studying the mechanism of dust generation in open-pit mining is crucial for effective dust pollution control. Previous research by foreign scholars on this topic focused on the particle movement process [14,15,16]. This includes the surface creeping process of large particles, the jumping process of medium-sized particles, and the suspension process of small particles. Since the 1970s, scholars have quantitatively studied the emission factors of suspended particulate matter in the discharge process to determine the load caused by particulate matter on the environment. Cowherd [17] proposed calculation formulas for loading and unloading operations and suspended particulate matter emissions through field tests. Japanese scholars [18] proposed calculation formulas for dust in coal piles based on wind tunnel experiments.
These formulas demonstrate that the amount of dust is related to wind speed, particle water content, coal pile surface area, and coal pile density. Organiscak used experimental results from eight groups of bituminous coal to establish the relationship between coal rank, coal product size, and dust amount [19]. As coal rank increases, the proportion of coal product powder less than 250 μm also increases. In contrast, the mass percentage of total dust and respirable dust released from this coal product powder less than 250 μm decreases. According to M. Sairanen’s study [20], the primary dust sources in open-pit mines are drilling, crushing, and transportation, with crushing being the largest contributor. Furthermore, different stages produce dust concentrations within varying ranges. Alan Robins conducted wind tunnel surveys and simulations on dust emission and deposition from coal stockpiles, revealing that turbulence and complex terrain significantly affect the dispersion and settling of dust particles [21]. Romualdo used EDX (Energy-Dispersive X-ray Spectroscopy) to analyze the composition and physical and chemical characteristics of particles in the dust to determine the dust source and achieve precise prevention and control [22]. Alexey observed dust generated after open-pit blasting with instruments [23]. Based on the observed data, a numerical model was developed to verify the influence of the boundary layer on particle movement. Jiang simulated the distribution law of borehole dust concentration in open-pit mines under different boundary conditions using Fluent (ANSYS Fluent) and found that the concentration increases and decreases with borehole distance [24]. Huang [25] simulated real-time dust pollution caused by open-pit mine blasting and designed relevant parameters for dustproof nets and remote sprayers based on dust pollution patterns. Ge combined knowledge of explosion mechanics and stress waves to obtain optimal mixing ratios for slurry and solid explosives through experimental formulas [26].
The dust produced at the blasting pile greatly impacts the whole open-pit mine, the surrounding environment, and the staff. Therefore, this paper aims to understand the migration and diffusion characteristics of dust at the blasting pile under the influence of external wind forces. Taking the dust at the blasting pile caused by natural airflow and shovel loading operation as the research object, this study researches the diffusion characteristics of dust at the blasting heap under the influence of airflow and shovel loading operation, clarifies the distribution structure of the flow field under different wind speeds, and reveals the migration law of dust at the blasting heap. More attention is paid to the dust generated at the blasting pile, the disturbance of wind to dust, and the initial velocity of dust release, which is also increased. The numerical simulation results can show the dust distribution characteristics of the whole open-pit mine, more intuitively grasp the dust migration law, and help improve the dust control efficiency at the blasting pile of the open-pit mine.

2. Materials and Methods

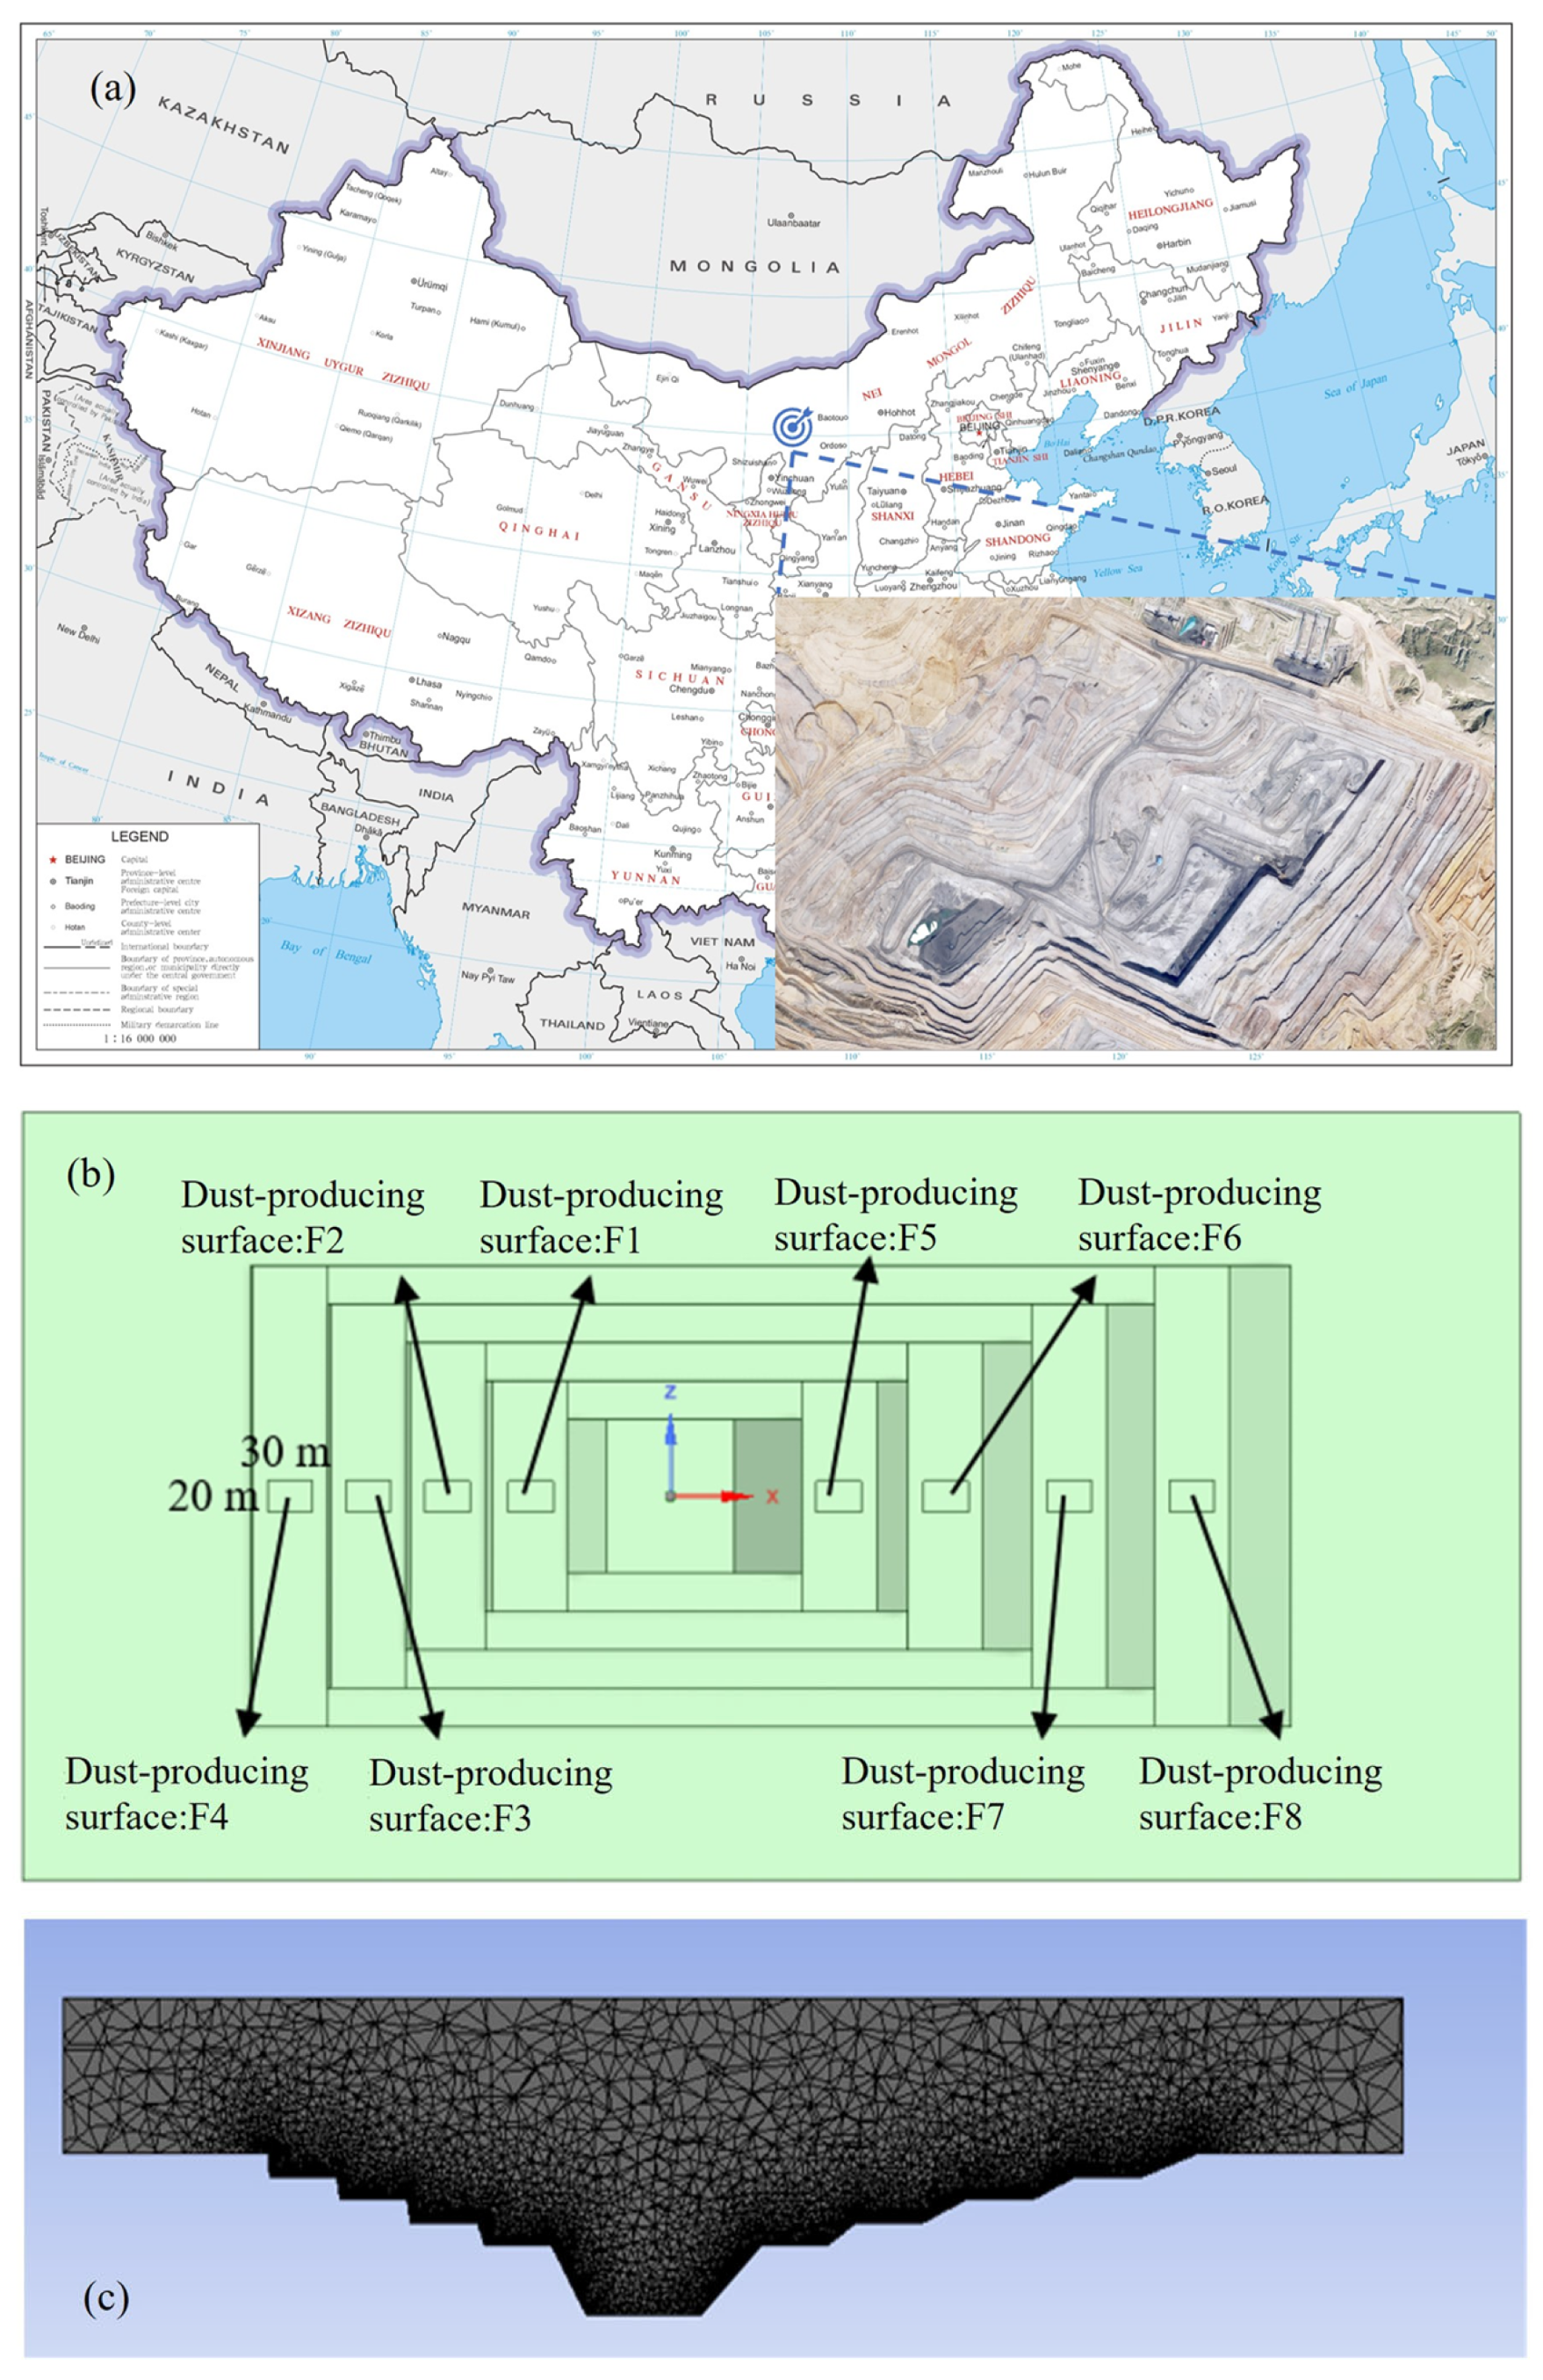
2.1. Numerical Calculation Model

The model of this study is based on the Heidaigou open-pit mine and has been simplified appropriately. It sets a dust-producing surface at the explosion pile of each platform. The model is 1000 m long, 500 m wide, and 205 m deep. The size of the dust-producing surface (30 m × 20 m) was determined based on the typical dimensions of the blasting zone and the working range of electric shovels used in the open-pit mine. Each dust-producing surface is positioned in the middle of the platform to facilitate calculation. The number of particles ejected from each dust-producing surface at each time step is related to the number of grids. Therefore, the grids at each dust-producing surface are encrypted, and the total number of grid units reaches 1.52 million. (Figure 1) The calculation time is extended from 600 s to 1200 s, and the dust-producing surface is identified as F1–F8. In the calculation, the Discrete Phase Model (DPM) was chosen to simulate the movement of dust in the open pit.

2.2. Model Reliability

To verify the reliability of the numerical simulation model, the data calculated in the numerical simulation are compared with the data measured in the Heidaigou open-pit coal mine of Zhunneng Group. On site, the drainage side and stope side are measured at a depth of about 100 m, 85 m, and 70 m from the bottom of the pit. The point selection function is adopted in the numerical simulation model to select the point at the corresponding depth from the bottom of the pit. When measuring the wind on site, there are two devices, one on the ground and one in the open pit. The surface wind speed on the test day was about 4.9 m/s, which represents typical operational meteorological conditions at the site. Therefore, to ensure that the simulation reflects realistic environmental conditions, we selected a wind speed of 5 m/s as the inlet boundary condition in the model. The measured values were compared with the simulated results. The deviation between the measured and simulated values was approximately 5–9%, which is within the acceptable error margin of 10%. The change trend of the measured value in the figure is basically consistent with that of the simulated value. The closer the distance to the bottom of the open pit, the smaller the wind speed. However, there is a great difference between the measured value and the simulated value on the stope side, which is due to the external influence when measuring the wind speed on the stope side.
To analyze the position changes of particles with varying sizes in an open pit at different times, data was collected at 100 s, 300 s, 500 s, 700 s, 900 s, and 1200 s after completing the Fluent calculation. The particle trajectory data was then imported into CFD-POST (Computational Fluid Dynamics Post-Processor) to obtain the spatial migration and distribution of particles of different sizes in the open pit. The airflow in two directions is set to analyze the dust production of the burst pile to varying positions of the air inlet on the soil discharge side and the stope side.

2.3. Numerical Simulation Parameter Setting

After importing the pre-divided mesh model into Fluent, the Discrete Phase Model (DPM) provided by Fluent is employed. Regarding the discrete phase parameters, the dust particle size distribution was obtained through on-site dust sampling at the Heidaigou open-pit mine. The collected samples were analyzed in the laboratory using a laser particle size analyzer (Mastersizer 3000, Malvern Panalytical, Great Malvern U.K.), which offers high-precision measurements across a wide range of particle sizes, including PM2.5, PM10, and larger fractions. Based on the measurement results, representative particle size classes were selected for the simulation. The mass flow rate of dust was set as 0.2 kg/s, as specified in Table 1.
Boundary conditions are defined according to actual situations, as listed in Table 2. A turbulence model is adopted for the gas-phase flow field parameters, considering the temporal variation of dust movement in the air.

3. Results and Discussion

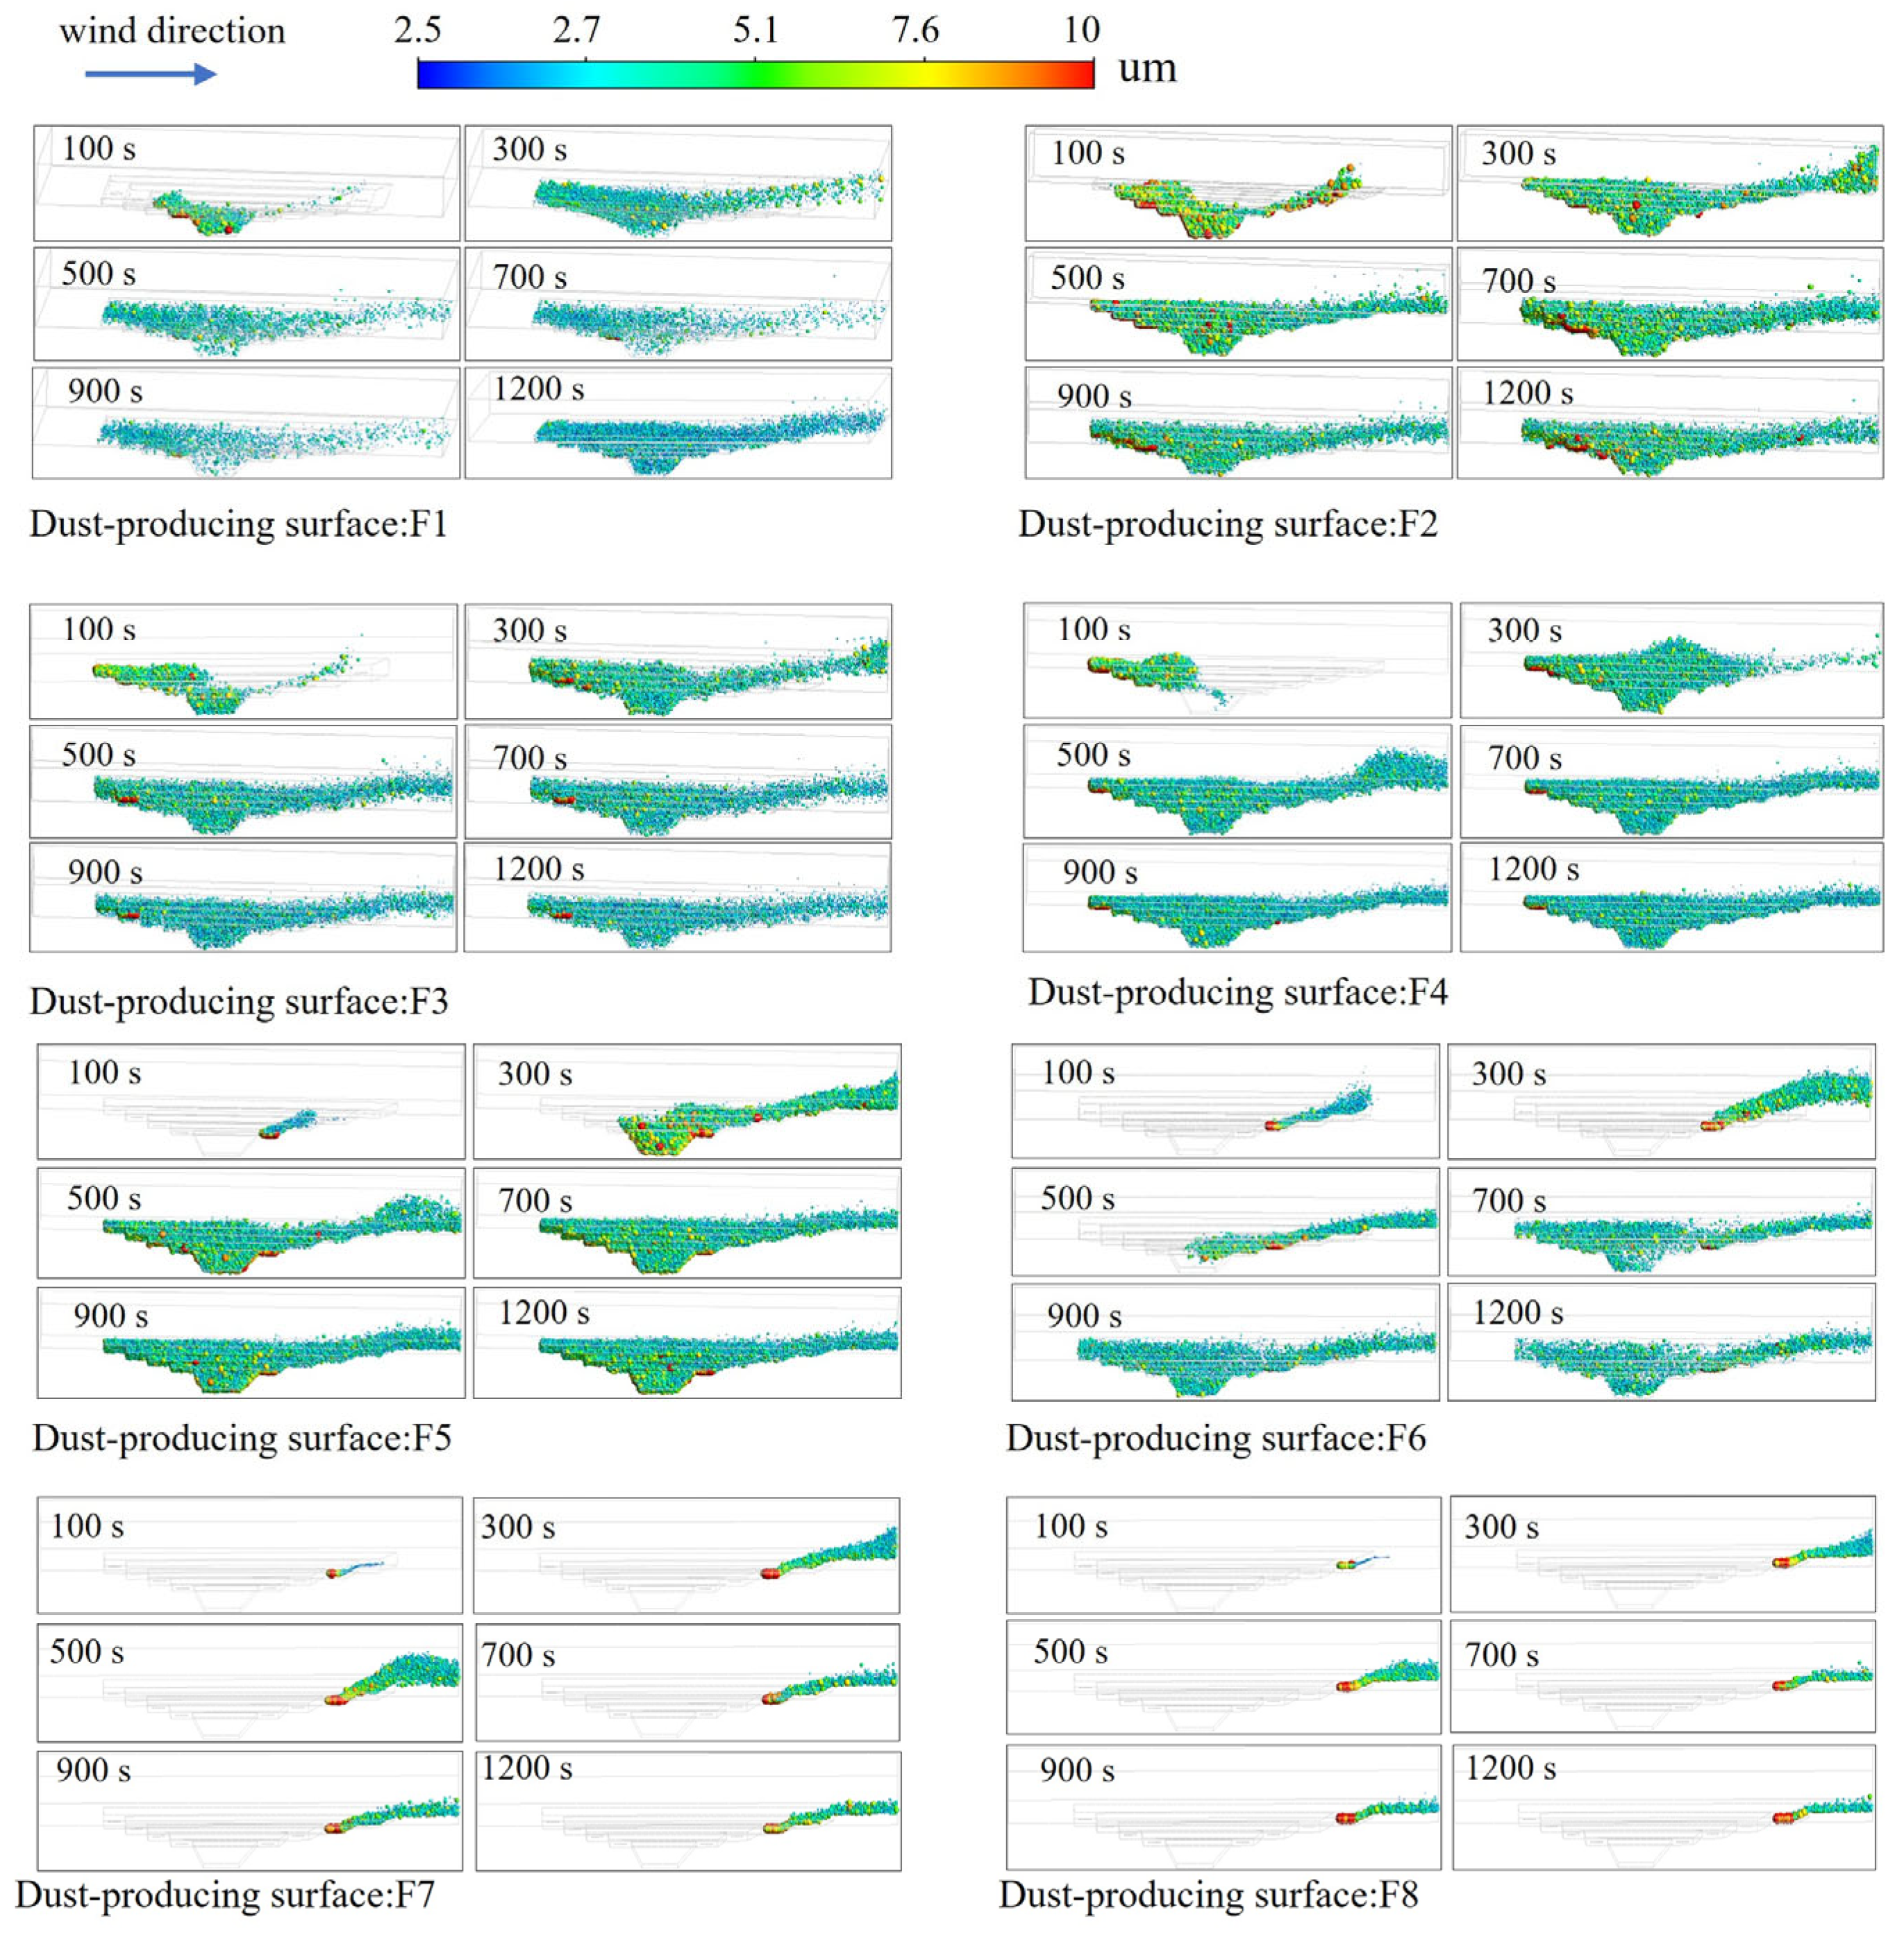
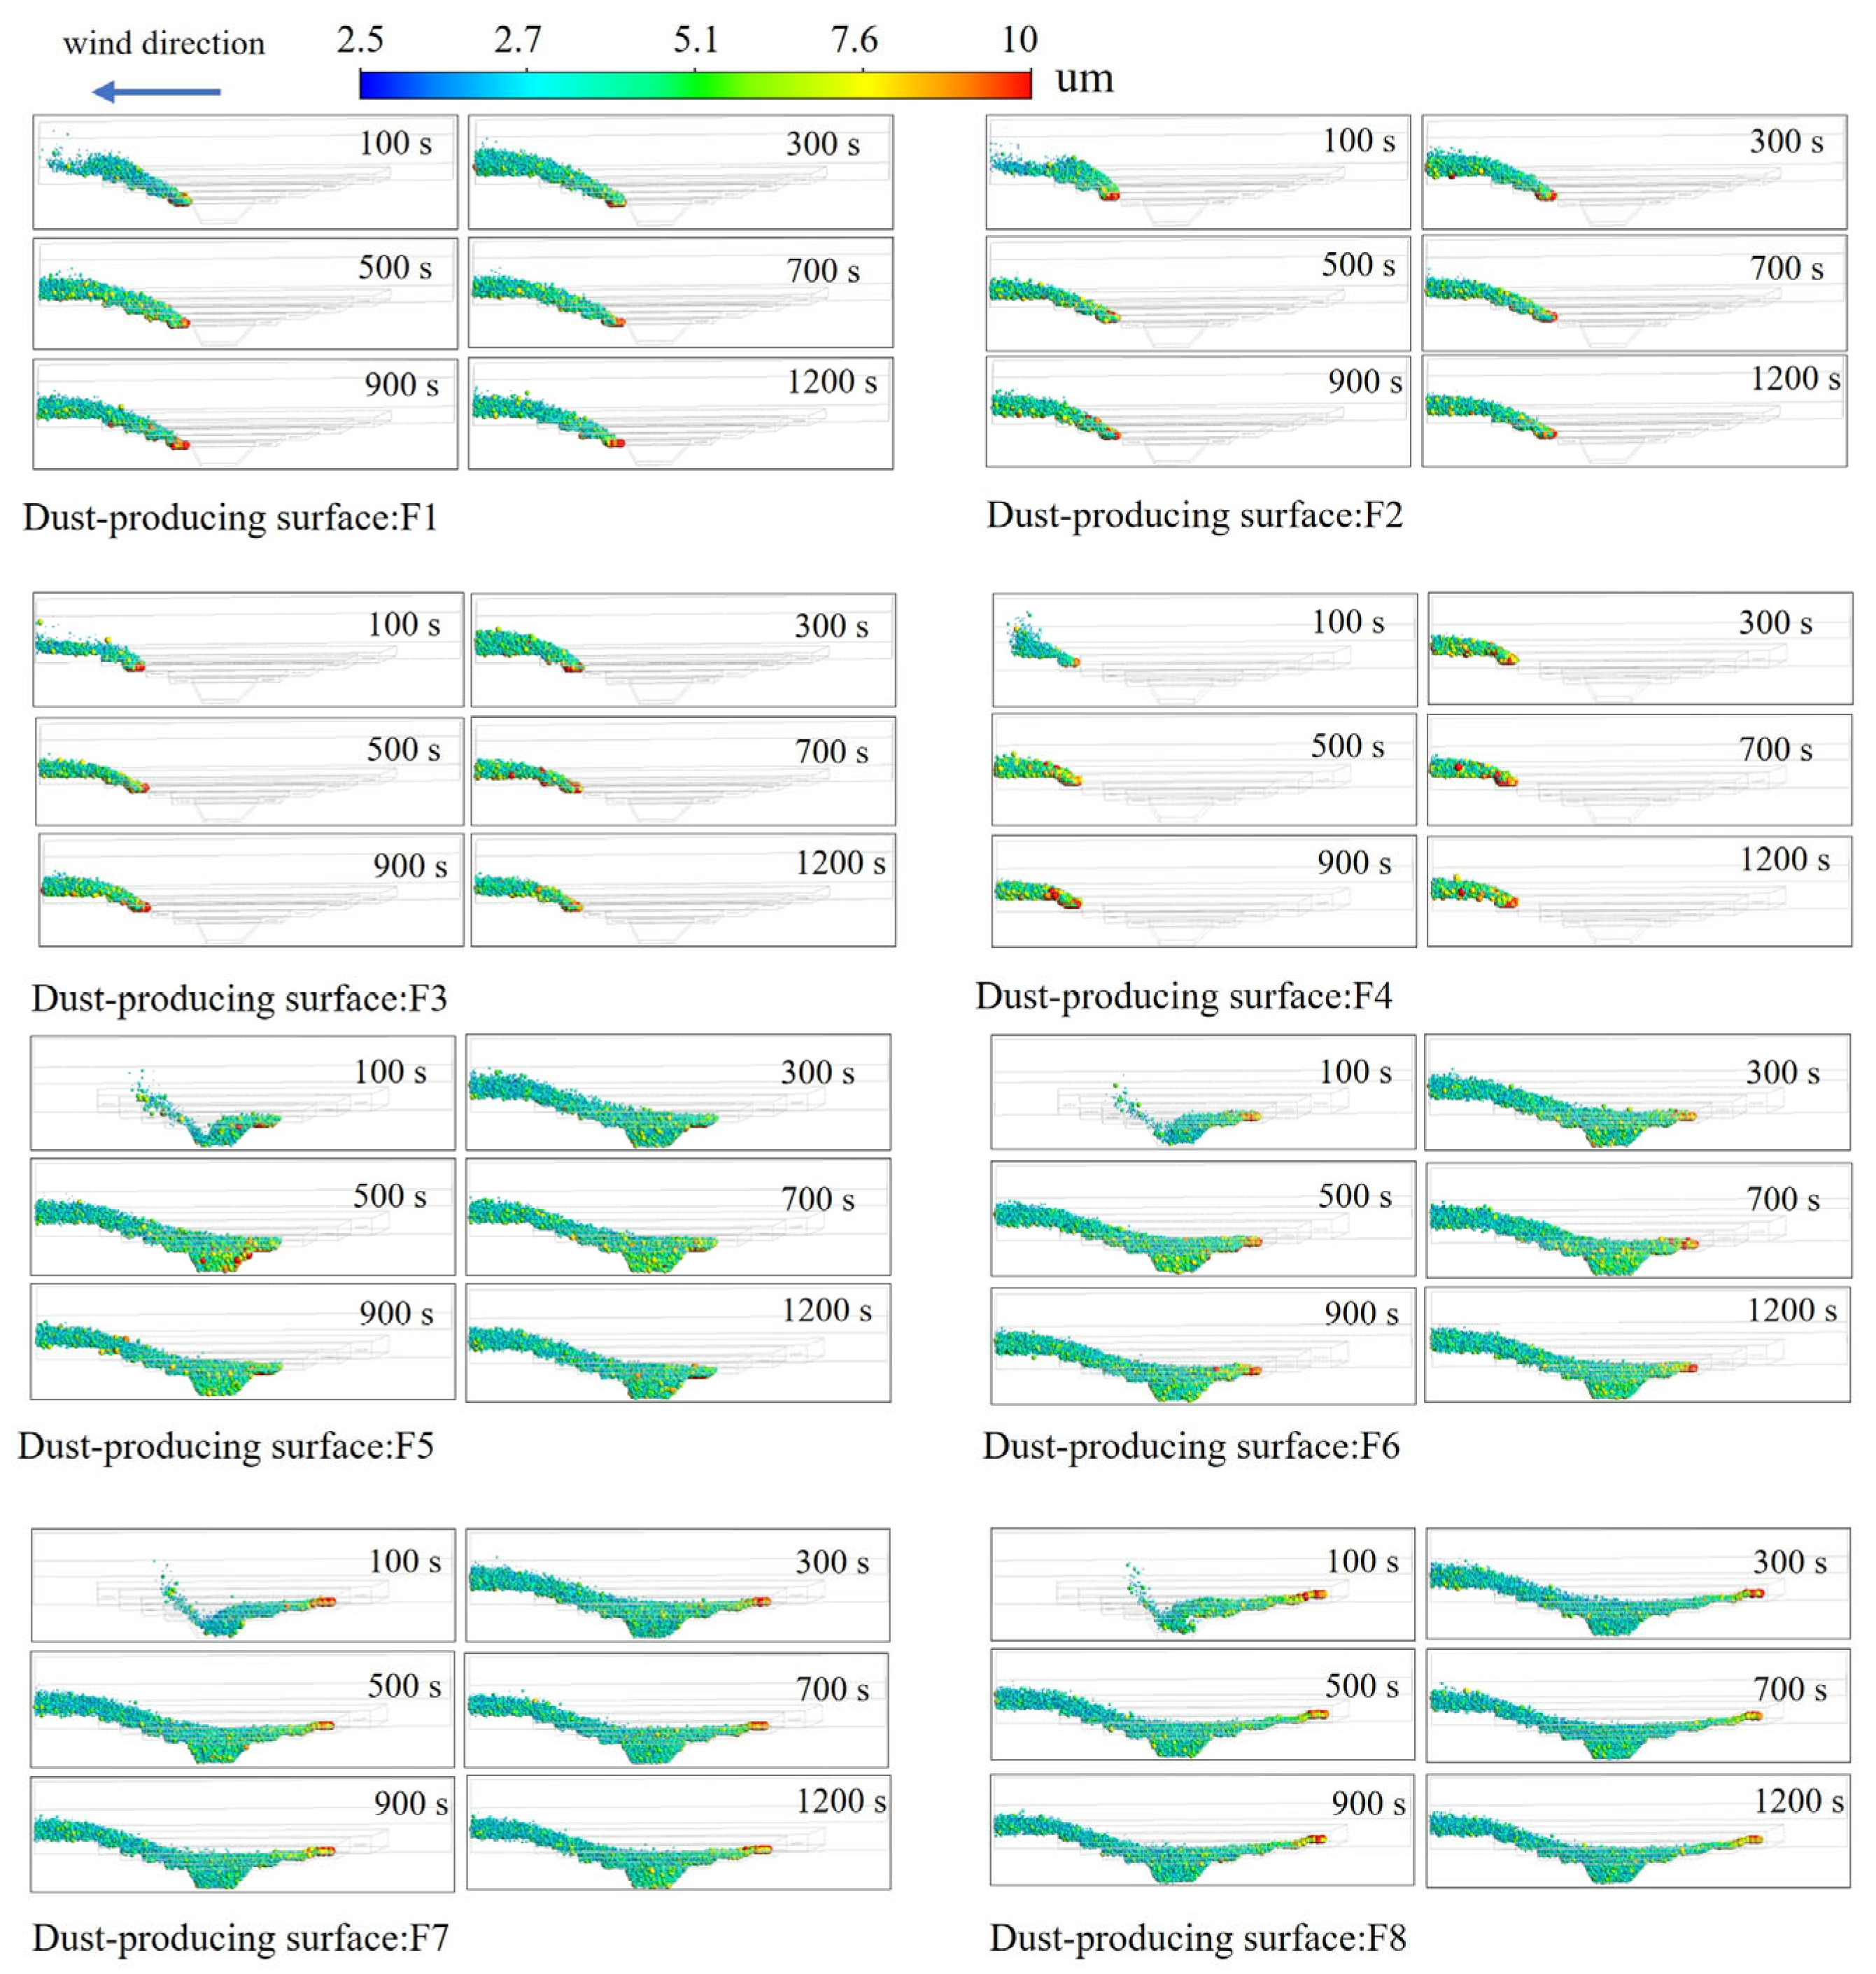
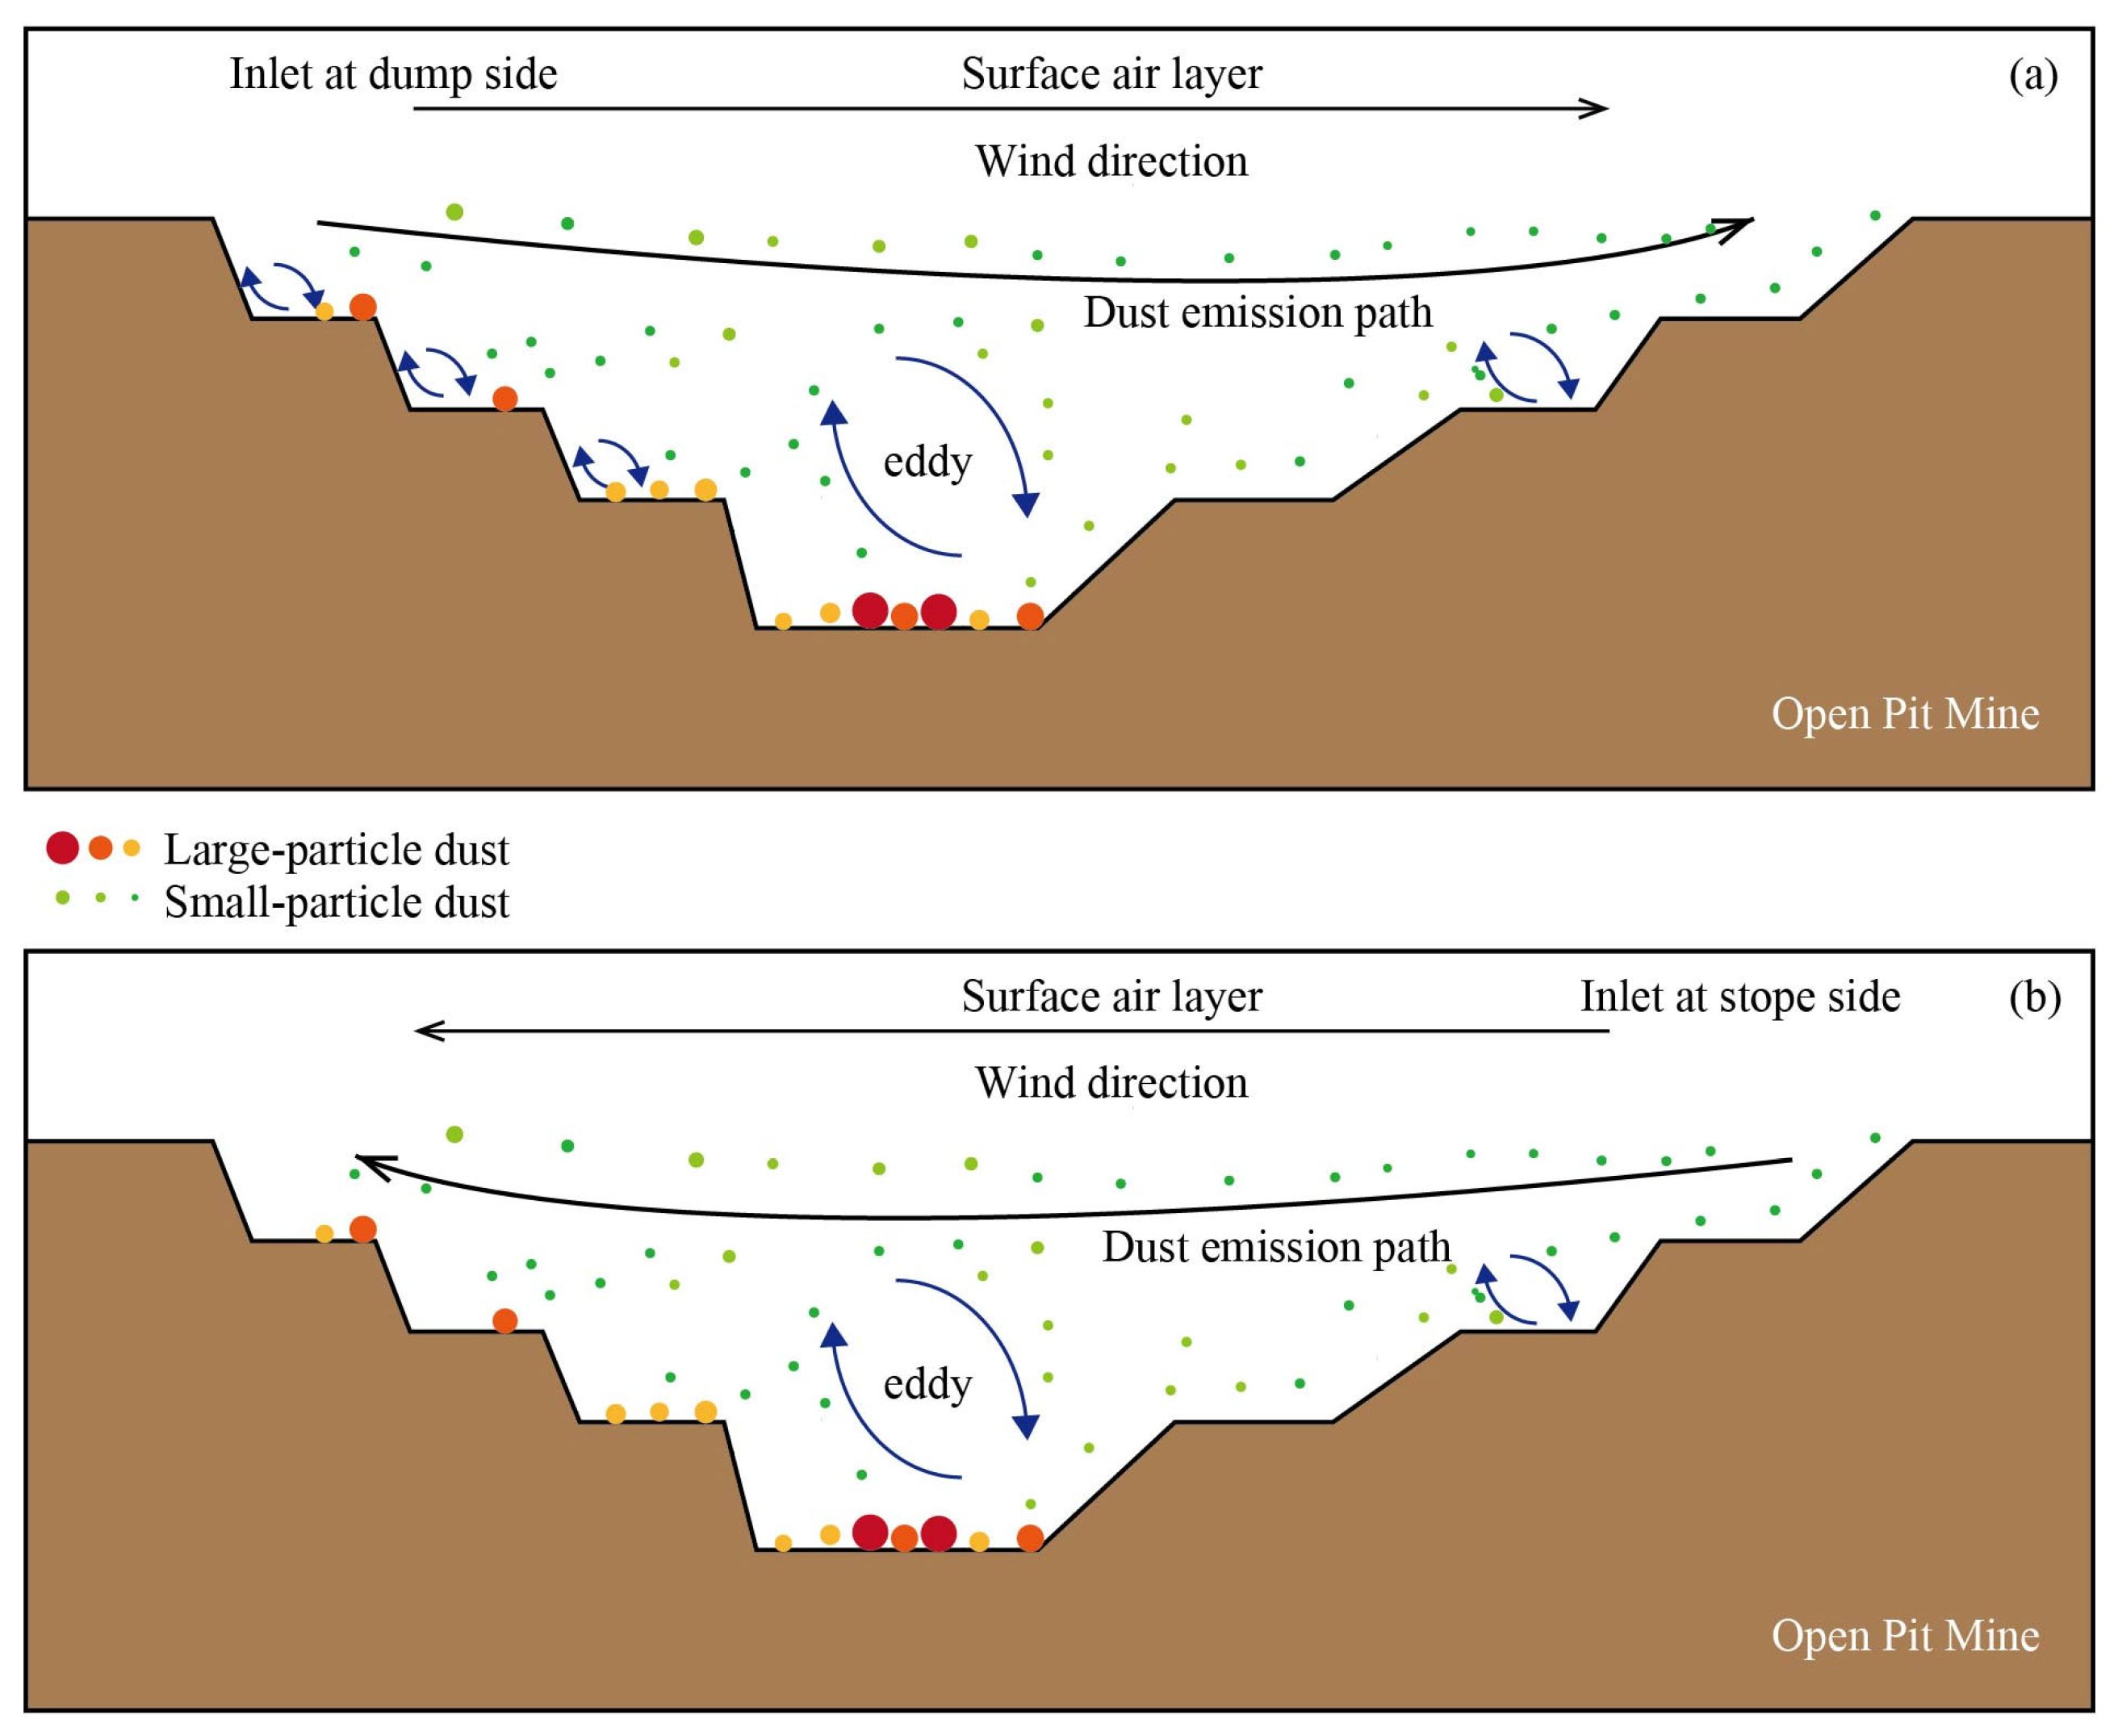
3.1. Spatial Distribution of Dust Diffusion at Blast Sites Under Different Wind Directions

3.1.1. Airflow from the Dump Side

The treatment was carried out on eight dust-producing surfaces, and the resulting spatial distribution of particles of different sizes is shown in Figure 2 and Figure 3. CFD-POST’s caption indicates that red particulates have the largest sizes (PM100), followed by yellow and green particulates, while blue particulates have the smallest sizes (PM2.5). The figure shows that red particles accumulate near each dust-producing surface, indicating that most large particles settle immediately. A few heavy particles settle at the bottom of the open pit, and very few settle after a distance with the wind flow. Additionally, dust particles with smaller diameters travel greater distances. During the early stage of dust particle movement, at t = 100 and 300 s, the open pit space contains a higher concentration of green particles than blue particles. However, in the middle and late stages of dust particle movement, at t = 500–1200 s, the figure shows blue particles distributed in the open pit space. This indicates that after 500 s, only PM2.5 is still carried by the wind flow, while other particle sizes have either settled or dispersed outside the model outlet.
The distribution of dust particles varies across each dust-producing surface. At t = 100 s, the dust on the dust-producing surface F1–F4 diffuses towards the surroundings due to both the airflow to the right and the small eddies generated at the detonation platform on the ground discharge side, which change the airflow direction and cause the dust to diffuse to the left of the dust-producing surface. After t > 100 s, dust disperses into the open pit. Regarding dust-producing surface F5, at time t = 100 s, dust diffused towards the right in the direction of the wind flow. At time t = 300 s, dust diffused towards the bottom of the open pit instead. After time t > 300 s, dust was distributed throughout the open pit. As for the dust-producing surface F6, at times t = 100 s and 300 s, the dust diffused towards the right in the direction of the airflow. At time t = 500 s, the dust diffused towards the bottom of the open pit. After time t > 500 s, the dust was distributed throughout the open pit. During the 1200 s, the dust on F7 and F8 moved along the airflow towards the right and did not spread in reverse towards the bottom of the open pit or the platform on the soil discharge side. This is because the two surfaces that produce dust are not only on the windward slope side but also far away from the bottom of the open pit. As a result, they are not affected by the eddy current at the bottom of the pit, allowing the dust to move quickly and smoothly from the dust-producing surface to the exit. Additionally, it was observed that, unlike other dust-producing surfaces, medium-sized dust particles are distributed above the open-pit mine between 100 s and 1200 s. Due to the outward movement of the wind flow, only small particles of dust are still being carried from other dust-producing surfaces to the middle and late stages.

3.1.2. Airflow from the Stope Side

When the side wind inlet is applied, the migration and distribution of dust from F1 to F4 on the windward slope and from F5 to F8 on the leeward slope are similar. For surfaces that produce dust, such as F1 to F4, small particles of dust have already spread to the left exit by the time t = 100 s. As time passes (t > 100 s), medium-sized particles of dust also gradually move towards the left exit, while large particles of dust settle at the explosion pile of various platforms. The closer the dust-producing surface is to the exit, the more active the medium and large dust particles become. At time t = 100 s, the dust has diffused from the dust-producing surface F5 to F8 on the stope side, through the bottom of the open pit, and onto the second- and third-level blast heap platforms on the bottom exit side. Most of these particles accumulate above the open pit, with a small proportion distributed as jets above the blast heap platform on the bottom exit side. Unlike other working conditions and times, the spatial distribution of dust particles now exhibits a V shape. As time progresses beyond t > 100 s, it gradually spreads towards the left exit.
Irrespective of the inflow’s origin, whether from the mining face or the spoil side, the leeward slope, housing the dust generation surfaces, exhibits a significantly broader range and higher density of dust distribution. This phenomenon is particularly prominent at the lower and upper sections of the open-pit mine, where dust concentration peaks. When the inflow originates from the spoil side, dust particles from the leeward slope’s dust generation surfaces disseminate throughout the mine. Conversely, dust particles are absent from the non-leeward slope’s dust generation surfaces when the inflow stems from the mining face. Only fine dust particles remain active in the later stages, propelled by wind currents within the open-pit mine. Therefore, to enhance dust suppression measures on the leeward slope’s dust-producing surfaces, it is crucial to analyze the spatial distribution of dust particles of varying sizes at different time intervals, emphasizing the control of fine dust particles.

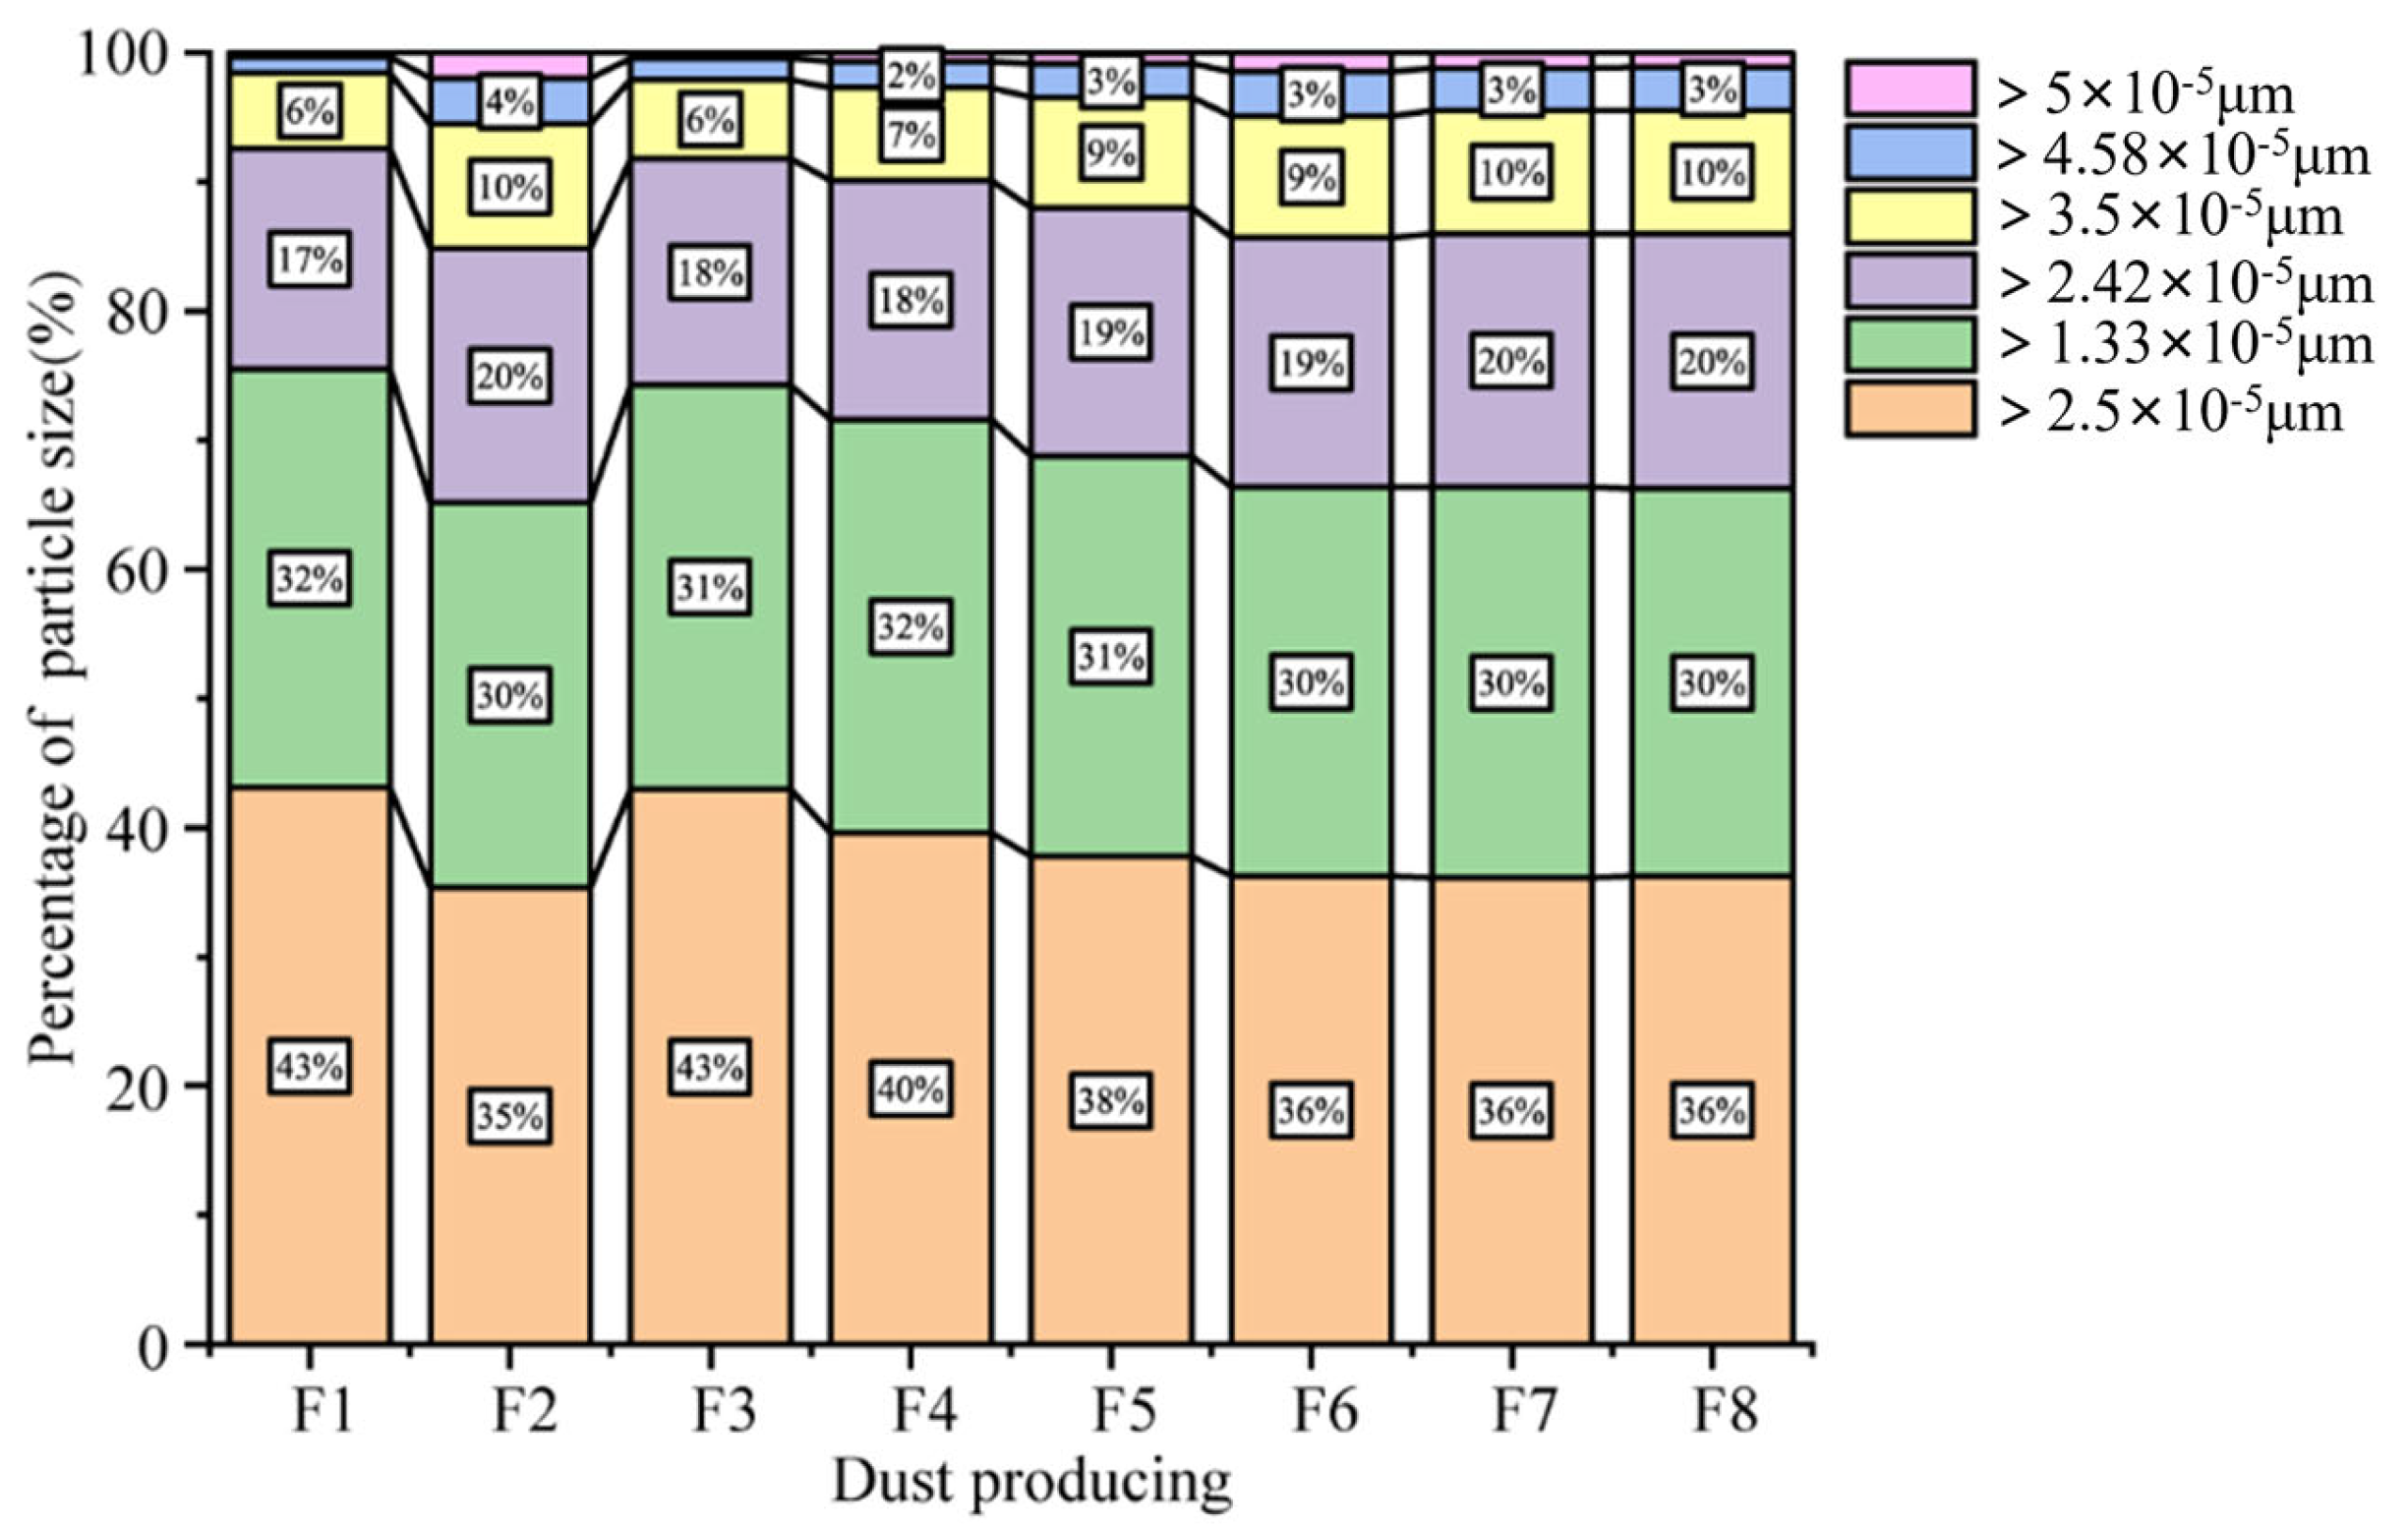
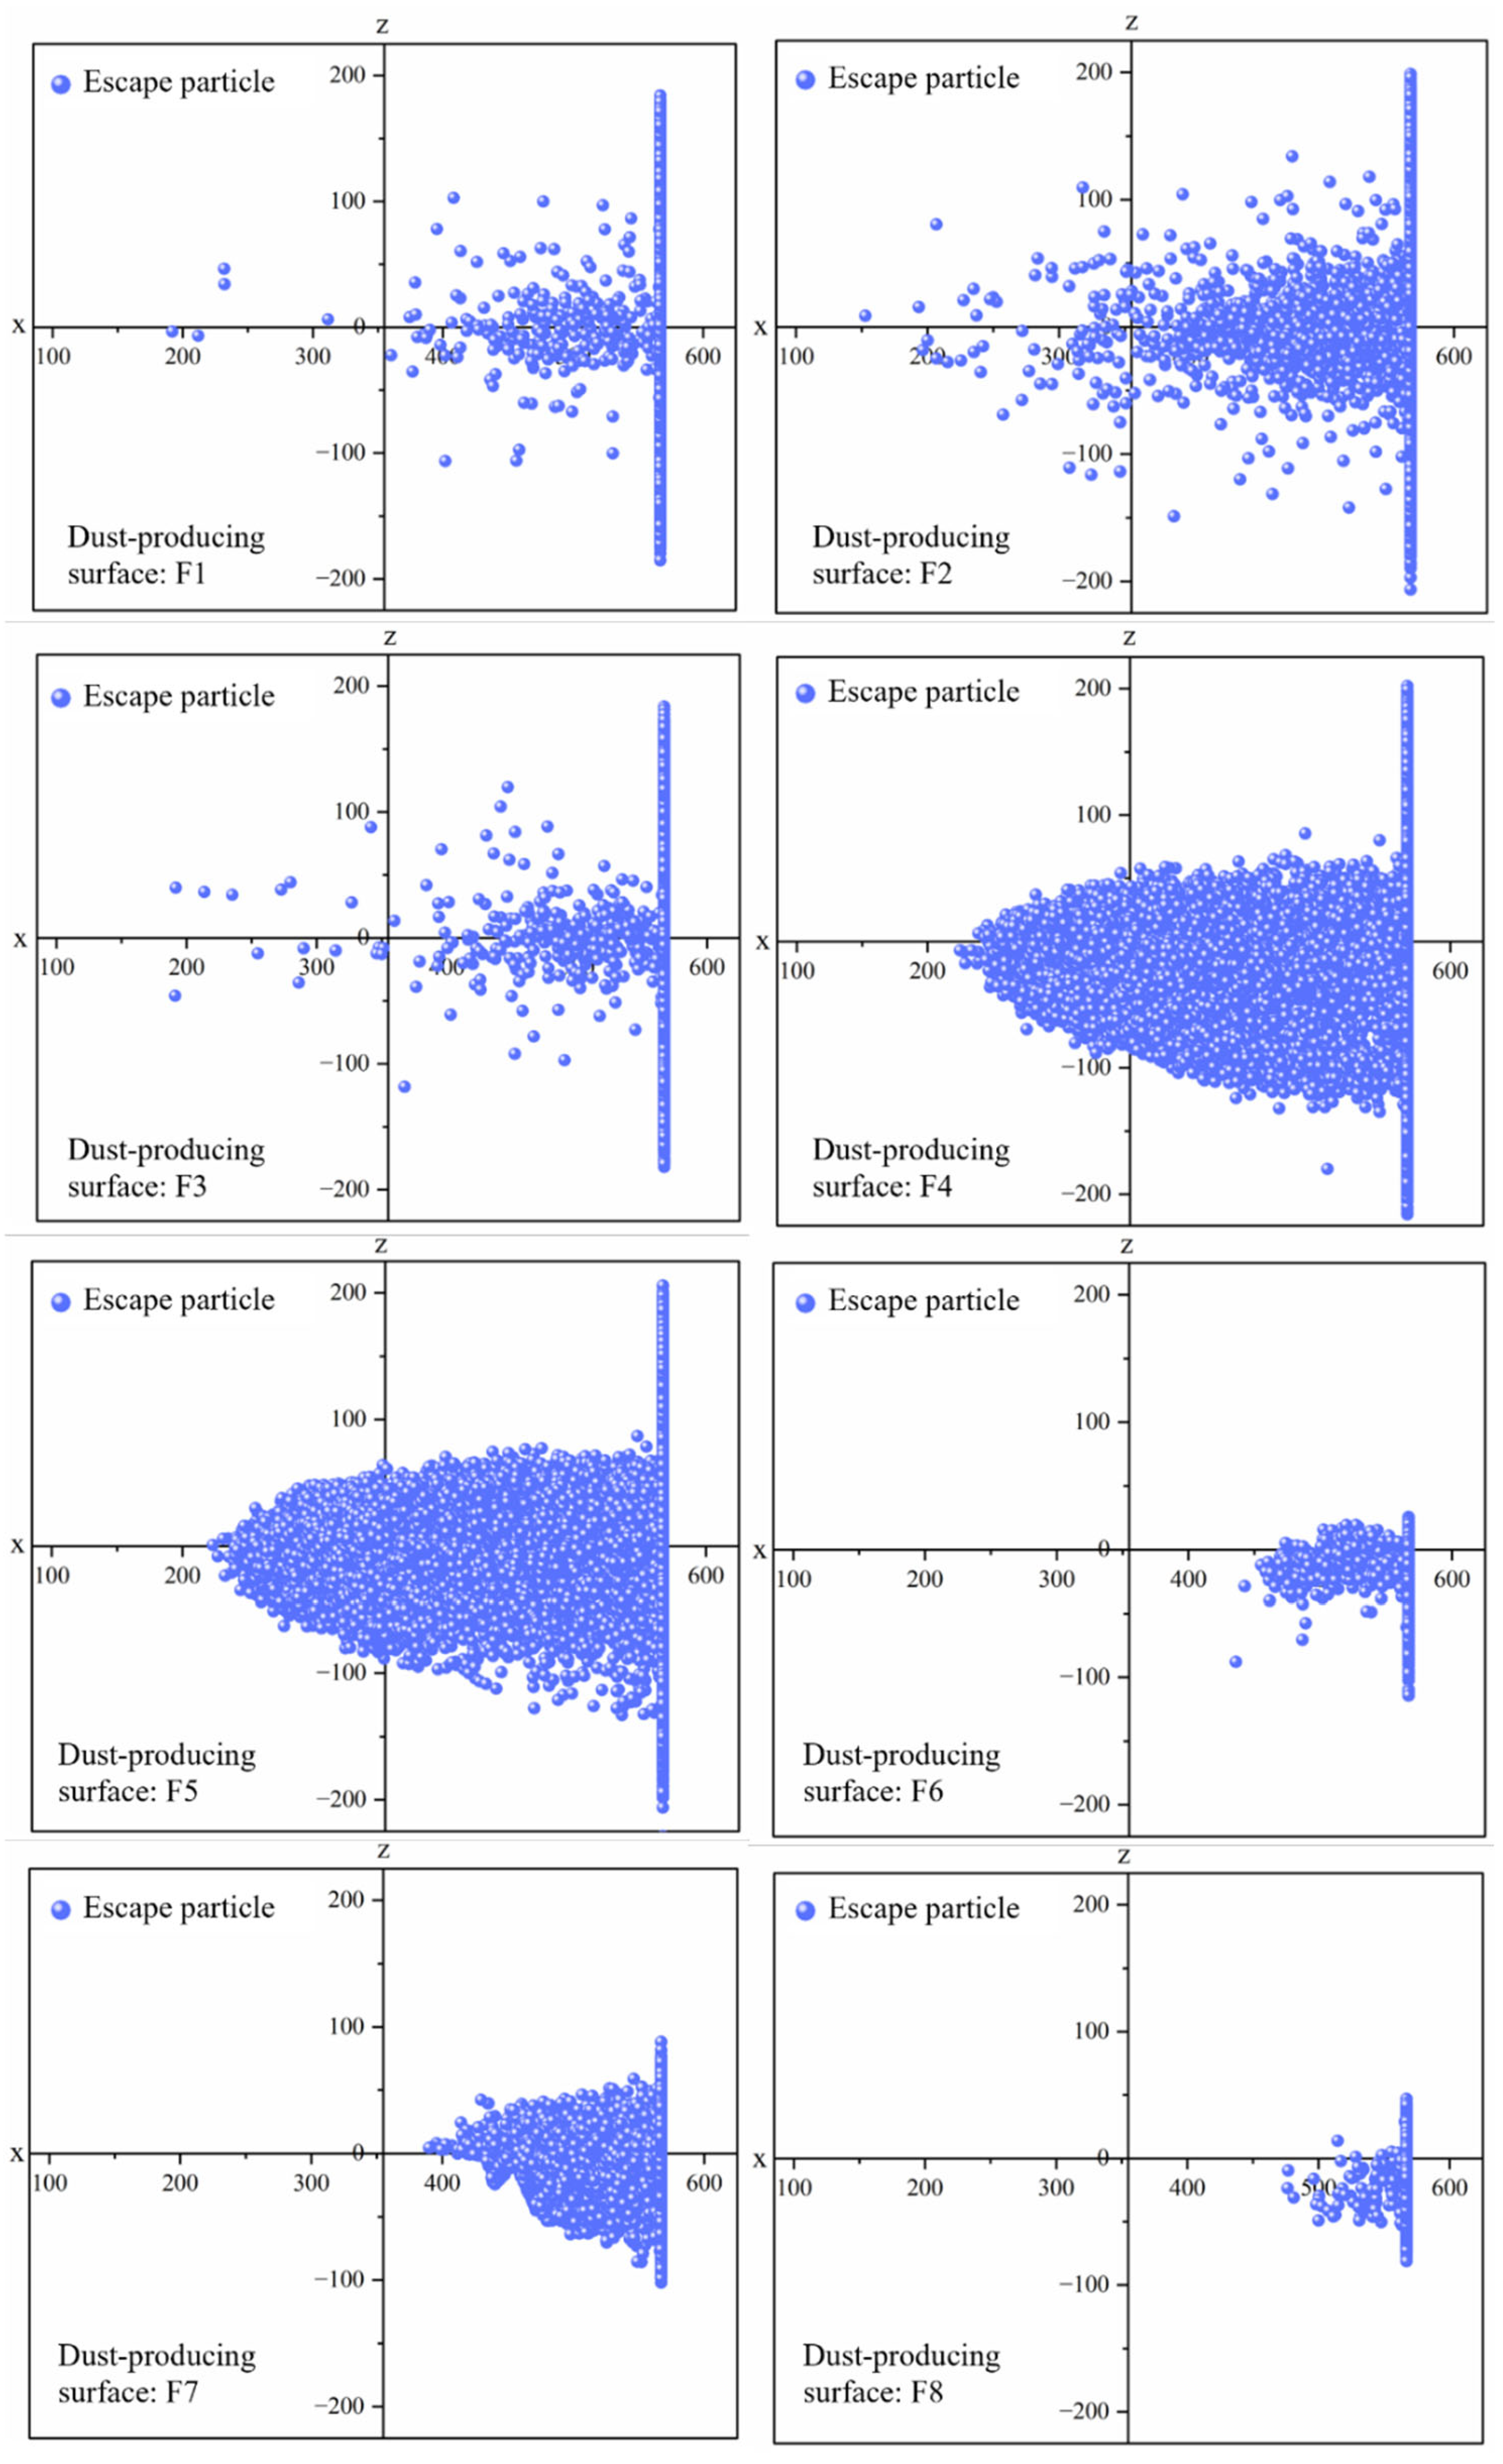
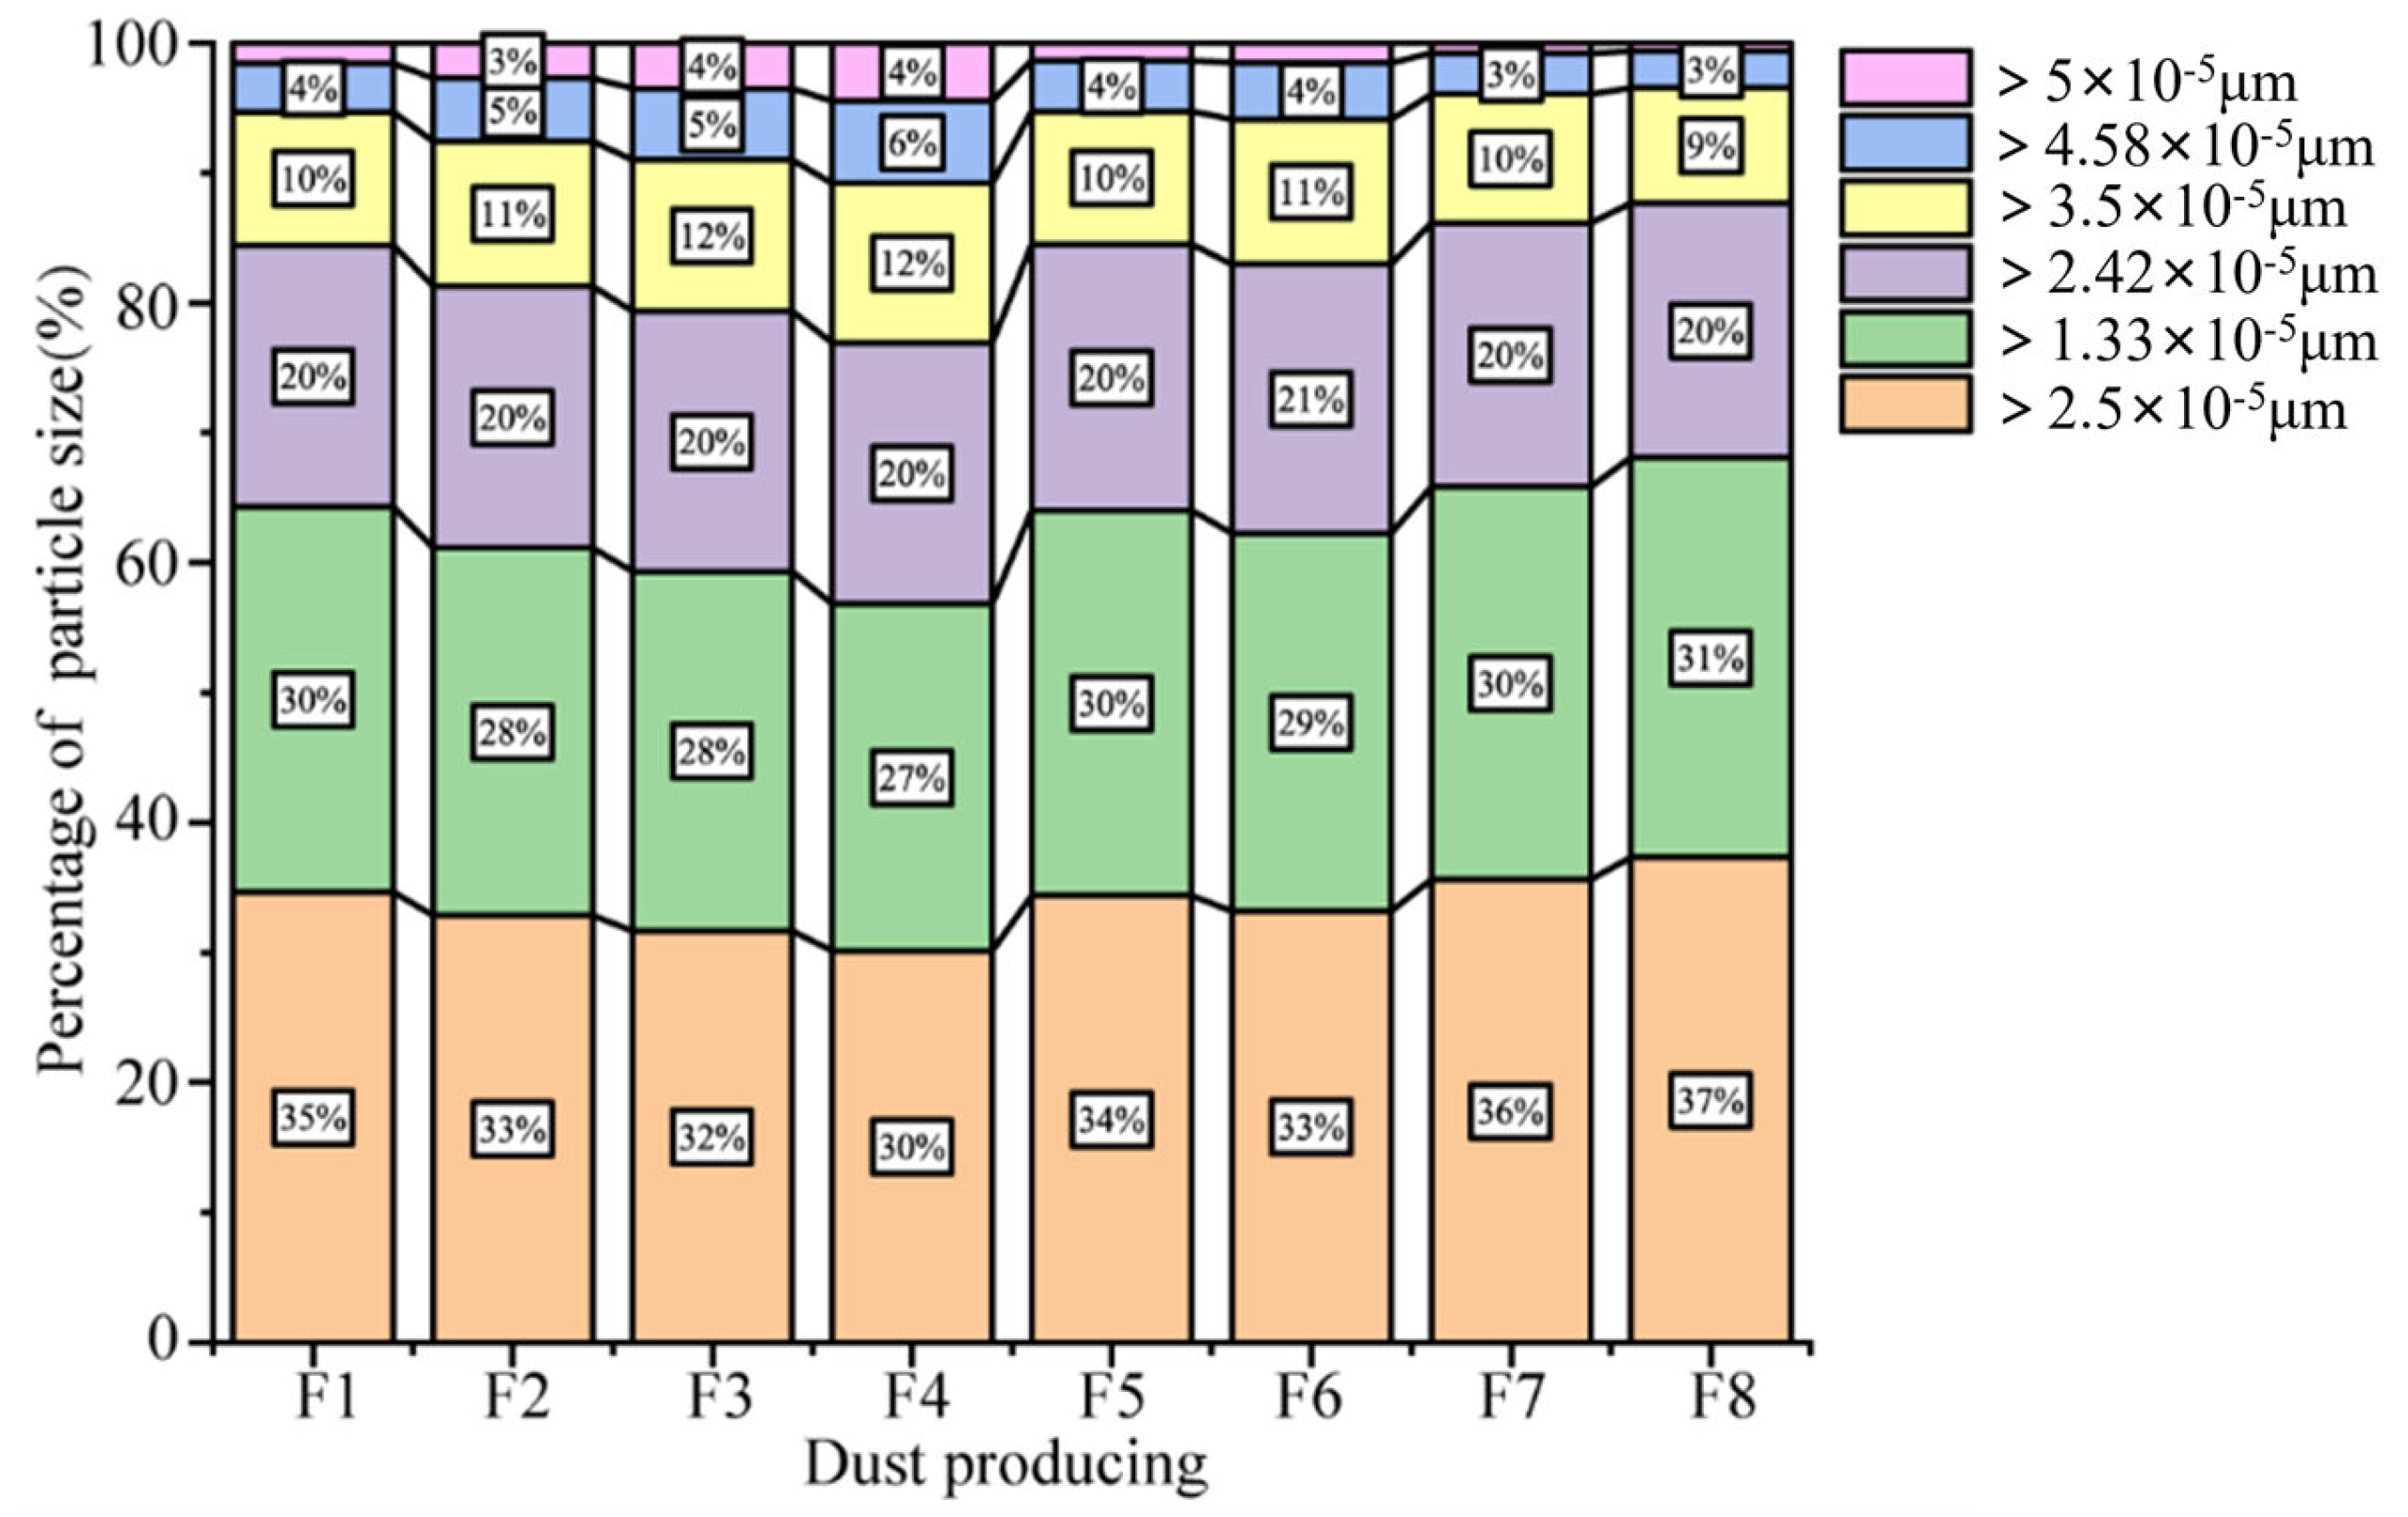
3.2. Statistical Rule of Escaping Dust at Explosion Site Under Different Wind Direction

To collect statistics on the particle size, quantity, and distribution of dust emitted from the open-pit mine, a sampling monitor was placed at the outlet location in Fluent. The monitor recorded the particle size, quantity, and position distribution of dust emitted from the outlet for the entire 1200 s calculation period, from the start to the end.

3.2.1. Statistical Law of Dust Escape by Air Inlet on Dumping Side

The data on dust particle size emitted from the eight dust-producing surfaces F1-F8 were categorized. The data were used to create a stacked bar chart that displays the proportion of different particle sizes for each dust-producing surface, as illustrated in Figure 4.
The number of dust particles escaping from each dust-producing surface varies, indicating that different surfaces impact the number of escaping particles. Additionally, it is evident that dust-producing surface F2 has the highest number of escaping particles. The dust-producing surface F3 has the lowest number of escaping dust particles compared to the other dust-producing surfaces. This difference amounts to 381,064 particles. This is due to the wind field analysis in Section 3, which shows that when the inlet wind speed is v = 5 m/s, the wind speed at the platform where surface F3 is located is minimal, making it difficult for dust to escape. Despite the relatively low wind speed at the platform where the dust-producing surface F2 is located, the dust concentration distribution diagram above shows that the dust concentration is too high, and the overall amount is large, resulting in more dust escaping. It is difficult for dust with large particle sizes, such as PM100 (d = 100 μm), to escape. Combined with the spatial distribution of dust, it is evident that larger dust particles settle closer to the dust surface, while most of the escaping dust consists of PM2.5 particles (d = 2.5 μm).
Figure 4 illustrates the proportion of varying-sized particles that escape from each dust-producing surface. The proportions of different particle sizes are consistent, especially for the windward slope sides F5–F8. PM2.5 particles constitute over 35% of the escaped dust particles, with the highest proportion found on dust-producing surface F1 at 43%. Respirable dust particles have a diameter of less than 5 μm and account for over two-thirds of the total escaped dust particle count. If these particles spread to urban areas hundreds of kilometers away, they significantly threaten local air quality and public health. The escaped dust particles with diameters of 2.42 μm and 3.50 μm account for nearly one-third of the remaining particles. Although these particle sizes do not enter the alveoli and cause pneumoconiosis, they can still induce respiratory diseases in the human respiratory system and even trigger extreme weather events such as sandstorms. Therefore, they should not be underestimated. Dust particles larger than the sizes mentioned above account for less than 5% of the total, and although their quantity is small, they are more likely to settle down after dispersing over a certain distance. This is because smaller particles are less likely to spread to areas hundreds of kilometers away and are easier to handle through dust reduction measures. Considering the number of particles, the distance they travel, and the extent of damage to human health caused by small particles, it is important to propose reasonable and practical measures to reduce and control respirable dust.
The previous discussion focused on the statistical patterns of escaping dust particles. Figure 5 illustrates the positional distribution of these particles. The X and Z coordinates of the escaping dust particles are plotted in the scatter plot below. The two-dimensional nature of the plot makes it impossible to display all overlapping escaped dust particles in the same position. Consequently, certain surfaces that generate dust may have a lower number of escaping particles.
According to the modeling diagram mentioned previously, X = 100 m indicates the right edge of the open-pit mine floor. At the same time, X = 200 m corresponds to the range of the platform steps on the mining side of the open-pit mine. Figure 5 shows that dust particles escape from the eight dust-producing surfaces (F1 to F8) located on the mining side of the open-pit mine towards the right. No dust escapes from the platform steps on the spoil side or the bottom of the open-pit mine. The outlet exhibits a linear distribution along the Z direction. The range for F1 to F5 is −200 m to 200 m, while the range for F6 to F8 is −100 m to 100 m.
Among the analyzed faces, the distribution of escaping dust particles from F4 and F5 exhibits the highest similarity, exhibiting a distinct semi-elliptical pattern. These two surfaces are characterized by the most concentrated and uniformly distributed dust. Specifically, in the X direction, the dust distribution extends from 200 m to the outlet, while in the Z direction, it spans from −150 m to 100 m.
In contrast, dust particles escaping from F1, F2, and F3 are distributed over a wider area, ranging from 100 m to the outlet in the X direction and spanning from −200 m to 200 m in the Z direction, with a more scattered pattern.
The escaping dust particles from F6, F7, and F8, though relatively concentrated, display a significantly narrower distribution range compared to F4 and F5. Notably, the dust distributions from F6 and F8 exhibit a bias towards the negative quadrant in the Z direction. In contrast, the distributions from the other faces remain almost symmetric about the X-axis.

3.2.2. Statistical Rule of Dust Escaping from Side Inlet Wind of Stope

The data collected from Fluent was processed using the previous approach. Figure 6 shows the proportion of different particulate sizes, and Figure 6 shows the distribution of the emitted particulates.
The dust-producing surface F6 has the highest number of escaped dust particles, while F8 has the lowest number, with a difference of 112,931 particles between the two surfaces. Compared to the case of the spoil side inlet, the extreme difference in the quantity of escaped dust particles is relatively small. The utilization of the mining side inlet reveals no significant disparity in the quantity of escaped dust particles across various surfaces that generate dust. This is attributed to the stable distribution of the airflow field on the mining side, without generating complex eddies and backflows that would affect the normal flow of dust particles.
Figure 6 shows the proportion chart of different particle sizes. It is evident that PM2.5 particles constitute over 30% of the escaped dust particles, with the highest proportion being on the surface F8, reaching 37%. Particles with a diameter of less than 5 μm, considered respirable dust, comprise more than half of the total escaped dust particle count. The proportion of respirable dust in the escaped dust particles is lower than in the spoil side inlet. Around 20% of the total particles are particles with a diameter of d = 2.42 μm, while approximately 10% are particles with a diameter of d = 3.50 μm. Dust particles larger than the mentioned sizes comprise about 10% of the total. The proportion of these three non-respirable particles has increased compared to the case of the spoil side inlet. The change in the proportion of dust particles of different sizes that escape is mainly due to the mining side inlet having a smaller windward slope than the spoil side inlet under the same wind speed. This allows for a higher wind speed throughout the open-pit mine, enabling larger dust particles to reach the starting velocity and be carried by the airflow, eventually dispersing and reaching the outlet. Furthermore, it is noted that the surface with the lowest amount of escaped dust particles, whether the spoil side inlet or the mining side inlet, has the highest concentration of PM2.5 particles.
According to the previous modeling diagram, X = −100 m indicates the left edge of the open-pit mine floor, while X = −200 m corresponds to the range of the spoil side platform steps of the open-pit mine. Figure 7 illustrates that the dust particles escaping from the eight dust-producing surfaces (F1 to F8) originate from the spoil side platform and the left outlet of the open-pit mine. The dust particles primarily escape from the left outlet, exhibiting a linear distribution along the Z direction. They have a significant horizontal velocity and longer horizontal movement time. However, a few scattered particles escape from the upper layer of the air at the outlet between F4 and F8. Combining the spatial distribution of dust particles at different time steps, the position distribution of escaped dust particles during the mining side inlet is relatively concentrated and uniform compared to the position distribution of escaped dust particles during the spoil side inlet. The dust particles mainly escape from the leftmost outlet. During the spoil side inlet, some dust particles escape from the rightmost outlet and the upper layer of the air.
According to the results of the exploration and analysis of the distribution of airflow field and dust migration distribution, the dust diffusion model in the open-pit explosion during soil discharge and an air inlet on both sides of the stope was established, as shown in Figure 8. When soil discharge and wind inlet on both sides of the stope, a large eddy current appears at the bottom of the open pit. The vortex generation mechanism follows: surface air flow drives the airflow in the pit, forming a low-pressure area in the open pit. After flowing through the open pit, it is blocked by the edge of the windward slope to form a high-pressure area, so the airflow spreads out. The airflow spreading upward flows out of the open pit, and the airflow flowing downward moves in the opposite direction of the wind, forming a vortex. Due to the large leeward slope, the pressure at the explosion platform is small, the air layer pressure is large, and the small vortex at the explosion pile is formed.
The dust is affected by the eddy currents at the multi-level platform and the bottom of the open pit when the air is discharged from the side, and the position of the eddy currents in the open pit easily causes the accumulation of dust, which makes it more difficult for the dust to spread out. Therefore, the large particle size and some medium particle size dust slowly settled in the explosion platform and the bottom of the open pit, and the small particle size dust was discharged out of the open pit with the airflow. In the case of a wind inlet at the side of the stope, the airflow at the blast platform is relatively stable, and there is an eddy current on the lee slope but no eddy current on the windward slope. Dust diffusion is mainly affected by the eddy current at the bottom of the open pit. When the dust passes through the bottom of the open pit and moves to the edge of the windward slope, part of the dust is discharged out of the pit, and part of the dust remains in the pit. The dust particles with small and medium particle sizes gradually accumulate, the dust concentration gradually rises, and the large particle size dust settles at the bottom of the pit.

4. Conclusions

This study systematically investigated dust concentration patterns and spatial distribution characteristics in open-pit mines under spoil and mining side inlet conditions. Results indicated that dust generation on windward slopes consistently resulted in lower concentrations and smaller affected areas compared to leeward slopes, where dust dispersal was more extensive. Large particles were found to settle near the source, medium-sized particles migrated a moderate distance, and smaller particles were transported further by the airflow. In both inlet conditions, respirable dust (d < 5 μm) constituted a significant proportion of escaped particles, representing a notable health risk to mine workers and the surrounding environment. During the spoil side inlet, dust escape was symmetrically distributed along the X-axis, while the mining side inlet led to a linear escape pattern along the Z-axis. A dust diffusion model was developed to delineate particle migration under varying inflow scenarios, offering a theoretical framework for optimizing dust suppression strategies. These findings provide crucial insights for enhancing occupational safety and reducing health risks in open-pit mining operations through targeted dust control measures.
In addition to the theoretical insights, the findings of this study have important practical implications for mine site dust control. By identifying the primary dispersion paths and particle size distributions under different wind directions, mine operators can implement more targeted dust suppression strategies. For example, the leeward slopes and bottom of the pit—where fine particulate matter tends to accumulate and escape—should be prioritized for control measures. Moreover, the spatial distribution patterns of fugitive dust support the strategic deployment of suppression equipment such as water sprays, wind barriers, or biological dust suppressants. These optimized control measures can effectively reduce airborne dust concentrations, enhance worker health and safety, and improve the overall efficiency of mine site environmental management.

Author Contributions

All authors contributed to the study conception and design. Y.C.: Conceptualization, Project administration, Funding acquisition. X.J.: Conceptualization, Writing-original draft. R.L.: Formal analysis, Resources. H.W.: Investigation, Resources. Y.H.: Resources, Validation. J.C.: Investigation, Formal analysis. X.L.: Formal analysis, Investigation H.Z.: Investigation, Validation, Supervision. All authors have read and agreed to the published version of the manuscript.

Funding

This work was supported by the National Natural Science Foundation of China (52204088), the Chongqing Municipal Education Commission (KJQN202400726), and the Chongqing Natural Science Foundation (General Program) (CSTB2024NSCQ-MSX1130).

Data Availability Statement

The original contributions presented in this study are included in the article. Further inquiries can be directed to the corresponding author.

Conflicts of Interest

Authors Yong Cao and Xiaoliang Jiao were employed by the company China Energy Investment Corporation, Zhunneng Group Co., Ltd., and Huangqing Zhang was employed by the company FinDreams Industry Co., Ltd. The remaining authors declare that the research was conducted in the absence of any commercial or financial relationships that could be construed as a potential conflict of interest”.

References

  1. Babii, K.; Chetveryk, M.; Perehudov, V.; Kovalov, K.; Kiriia, R.; Pshenychnyi, V. Features of using equipment for in-pit crushing and conveying technology on the open pit walls with complex structure. Min. Miner. Depos. 2022, 16, 96–102. [Google Scholar] [CrossRef]
  2. Cheskidov, V.; Gavrilov, V.; Khoyutanov, E.; Reznik, A.; Nemova, N. Specifics of open pit mining in brachysyncline-type coalfields. J. Min. Sci. 2022, 58, 561–570. [Google Scholar] [CrossRef]
  3. Khussan, B.; Abdiev, A.; Bitimbayev, M.; Kuzmin, S.; Issagulov, S.; Matayev, A. Substantiation and development of innovative container technology for rock mass lifting from deep open pits. Min. Miner. Depos. 2022, 16, 87–95. [Google Scholar] [CrossRef]
  4. Wang, Z.; Zhou, W.; Jiskani, I.M.; Yan, J.; Luo, H. Optimizing open-pit coal mining operations: Leveraging meteorological conditions for dust removal and diffusion. Int. J. Coal Sci. Technol. 2024, 11, 54. [Google Scholar] [CrossRef]
  5. Zhou, G.; Xu, Y.; Wang, Y.; Zheng, L.; Zhang, Y.; Li, L.; Sun, B.; Li, S.; Zhu, Y. Study on MICP dust suppression technology in open pit coal mine: Preparation and mechanism of microbial dust suppression material. J. Environ. Manag. 2023, 343, 118181. [Google Scholar] [CrossRef]
  6. Ashfaq, M.; Moghal, A.A.B.; Basha, B.M. The sustainable utilization of coal gangue in geotechnical and geoenvironmental applications. J. Hazard. Toxic Radioact. Waste 2022, 26, 03122003. [Google Scholar] [CrossRef]
  7. Chebotarev, A.; Sokur, O.; Duryagin, I. Working conditions and occupational health risks of open-pit mining machinery operators. Metallurgist 2024, 67, 1765–1768. [Google Scholar] [CrossRef]
  8. Fan, L.; Liu, S. Respirable nano-particulate generations and their pathogenesis in mining workplaces: A review. Int. J. Coal Sci. Technol. 2021, 8, 179–198. [Google Scholar] [CrossRef]
  9. Li, L.; Zhang, R.; Li, Q.; Zhang, K.; Liu, Z.; Ren, Z. Multidimensional spatial monitoring of open pit mine dust dispersion by unmanned aerial vehicle. Sci. Rep. 2023, 13, 6815. [Google Scholar] [CrossRef]
  10. Wang, Z.; Zhou, W.; Jiskani, I.M.; Yang, Y.; Yan, J.; Luo, H.; Han, J. A novel approach to forecast dust concentration in open pit mines by integrating meteorological parameters and production intensity. Environ. Sci. Pollut. Res. 2023, 30, 114591–114609. [Google Scholar] [CrossRef]
  11. Liu, R.; Jiang, D.; Chen, J.; Ren, S.; Fan, J.; He, Y. Blasting dust diffuse characteristics of spiral tunnel and dust distribution model: Similar experiment and numerical modeling. Environ. Sci. Pollut. Res. 2023, 30, 52340–52357. [Google Scholar] [CrossRef] [PubMed]
  12. Lutynski, A. Dust Hazards and their Control in Mechanical Processing Plants of Hard Coal Mines. J. Pol. Miner. Eng. Soc. 2021, 2021, 13–18. [Google Scholar] [CrossRef]
  13. Zhang, H.; Liu, R.; Chun, J.; Xue, Q.; Fan, J. Study on optimization of the dedusting air duct layout in coal mine roadway. Front. Earth Sci. 2022, 10, 855438. [Google Scholar] [CrossRef]
  14. Amulya, G.; Moghal, A.A.B.; Almajed, A. A state-of-the-art review on suitability of granite dust as a sustainable additive for geotechnical applications. Crystals 2021, 11, 1526. [Google Scholar] [CrossRef]
  15. Liu, R.; He, Y.; Zhao, Y.; Jiang, X.; Ren, S. Tunnel construction ventilation frequency-control based on radial basis function neural network. Autom. Constr. 2020, 118, 103293. [Google Scholar] [CrossRef]
  16. Liu, R.; Jiang, D.; He, Y.; Zhang, H.; Chen, J.; Ren, S.; Zhou, Z. Study on cooling measures and ventilation cooling device of high ground temperature tunnel. J. Therm. Anal. Calorim. 2024, 149, 3347–3365. [Google Scholar] [CrossRef]
  17. Cheng, J. Research on emission factors of suspended particulate matter in bulk material handling workplaces abroad. Environ. Prot. Transp. 1989, 5, 32–37. [Google Scholar]
  18. Liu, Q.; Guo, R.; Wu, X.; Zhou, C.; Gong, Q.; Wang, J.; Han, J.; Tang, Z.; Lou, Y.; Yang, H.; et al. Study on the dust emission law of coal and gangue piles in open-pit coal mine. Environ. Prot. Transp. 1986, 1, 88–96. [Google Scholar]
  19. Organiscak, J.A.; Page, S.J. Airborne dust liberation during coal crushing. Coal Perparation 2000, 21, 423–453. [Google Scholar] [CrossRef]
  20. Sairanen, M.; Rinne, M.; Selonen, O. A review of dust emission dispersions in rock aggregate and natural stone quarries. Int. J. Min. Reclam. Environ. 2018, 32, 196–220. [Google Scholar] [CrossRef]
  21. Xuan, J.; Robins, A. The effects of turbulence and complex terrain on dust emissions and depositions from coal stockpiles. Atmos. Environ. 1994, 28, 1951–1960. [Google Scholar] [CrossRef]
  22. Romualdo, L.L.; Santosa, R.S.; Limaa, F.C.; Andradea, L.S.; Ferreirab, I.M.; Pozzac, S.A. Environmental impact monitoring of a minero-chemical complex in catalao urban Area of PTS, PM10 and PM2, 5 by EDX characterization. Chem. Eng. 2015, 43, 1909–1914. [Google Scholar] [CrossRef]
  23. Krasheninnikov, A.V.; Loktev, D.N.; Soloviev, S.P.; Khazins, V.M. Transport of microparticles as stated by observation data in the open mining pit, 27th International Symposium on Atmospheric and Ocean Optics. Atmos. Phys. 2021, 11916, 1257–1264. [Google Scholar] [CrossRef]
  24. Sa, Z.; Li, F.; Qin, B.; Pan, X. Numerical simulation study of dust concentration distribution regularity in cavern stope. Saf. Sci. 2012, 50, 857–860. [Google Scholar] [CrossRef]
  25. Huang, Z.; Ge, S.; Jing, D.; Yang, L. Numerical simulation of blasting dust pollution in open-pit mines. Appl. Ecol. Environ. Res. 2019, 17, 10313–10333. [Google Scholar] [CrossRef]
  26. Ge, S.; Huang, Z.; Jing, D.; Chen, X.; Han, F. The law of blasting dust in open-pit mines and the optimization of water-blasting mud ratio. J. Liaoning Tech. Univ. (Nat. Sci. Ed.) 2017, 36, 225–231. [Google Scholar]
Figure 1. (a) Regional location map of Hedaigou open pit, (b) geometric diagram of dust-producing surface, (c) model grid diagram.
Geosciences 15 00238 g001
Figure 2. Spatial distribution map of side inlet dust in a dump.
Geosciences 15 00238 g002
Figure 3. Spatial distribution map of side inlet dust in the dump.
Geosciences 15 00238 g003
Figure 4. Percentage of particle size of fugitive dust from F1 to F8 (inlet at dump side).
Geosciences 15 00238 g004
Figure 5. Escape dust particle position distribution from F1 to F8 (inlet at dump side).
Geosciences 15 00238 g005
Figure 6. Percentage of particle size of fugitive dust from F1 to F8 (inlet at stope side).
Geosciences 15 00238 g006
Figure 7. Escape dust particle position distribution from F1 to F8 (inlet at stope side).
Geosciences 15 00238 g007
Figure 8. Dust diffusion process of inner blast pile in an open pit. (a) The wind direction is from the dump side to the stope side. (b) The wind direction is from the slope side to the dump side.
Geosciences 15 00238 g008
Table 1. Dust injection source parameters.
InjectionUnitsDefine
Injection Surface
Diameter distribution Rosin–Rammler
Start times0
Stop times600
Material Coal-hv
Total flow ratekg/s0.2
Min. diametermPM2.5 2.5 × 10⁻⁶
Max. diametermPM100 1 × 10⁻⁴
Mean diametermPM10 × 10−5
Spread parameter 1.12
Time scale constant 0.15
Table 2. Parameter settings of boundary conditions.
Boundary ConditionsUnitsDefine
Inlet Boundary Type Velocity Inlet
Inlet Velocity Magnitudem/s0, 1, 3
Turbulent Intensity%5
Hydraulic Diameterm17
Outlet Boundary Type Outflow
Wall Shear Condition No Slip
Wall Roughness Standard
DPM Boundary Type Trap
DPM Boundary Type Escape
Disclaimer/Publisher’s Note: The statements, opinions and data contained in all publications are solely those of the individual author(s) and contributor(s) and not of MDPI and/or the editor(s). MDPI and/or the editor(s) disclaim responsibility for any injury to people or property resulting from any ideas, methods, instructions or products referred to in the content.

