1. Introduction
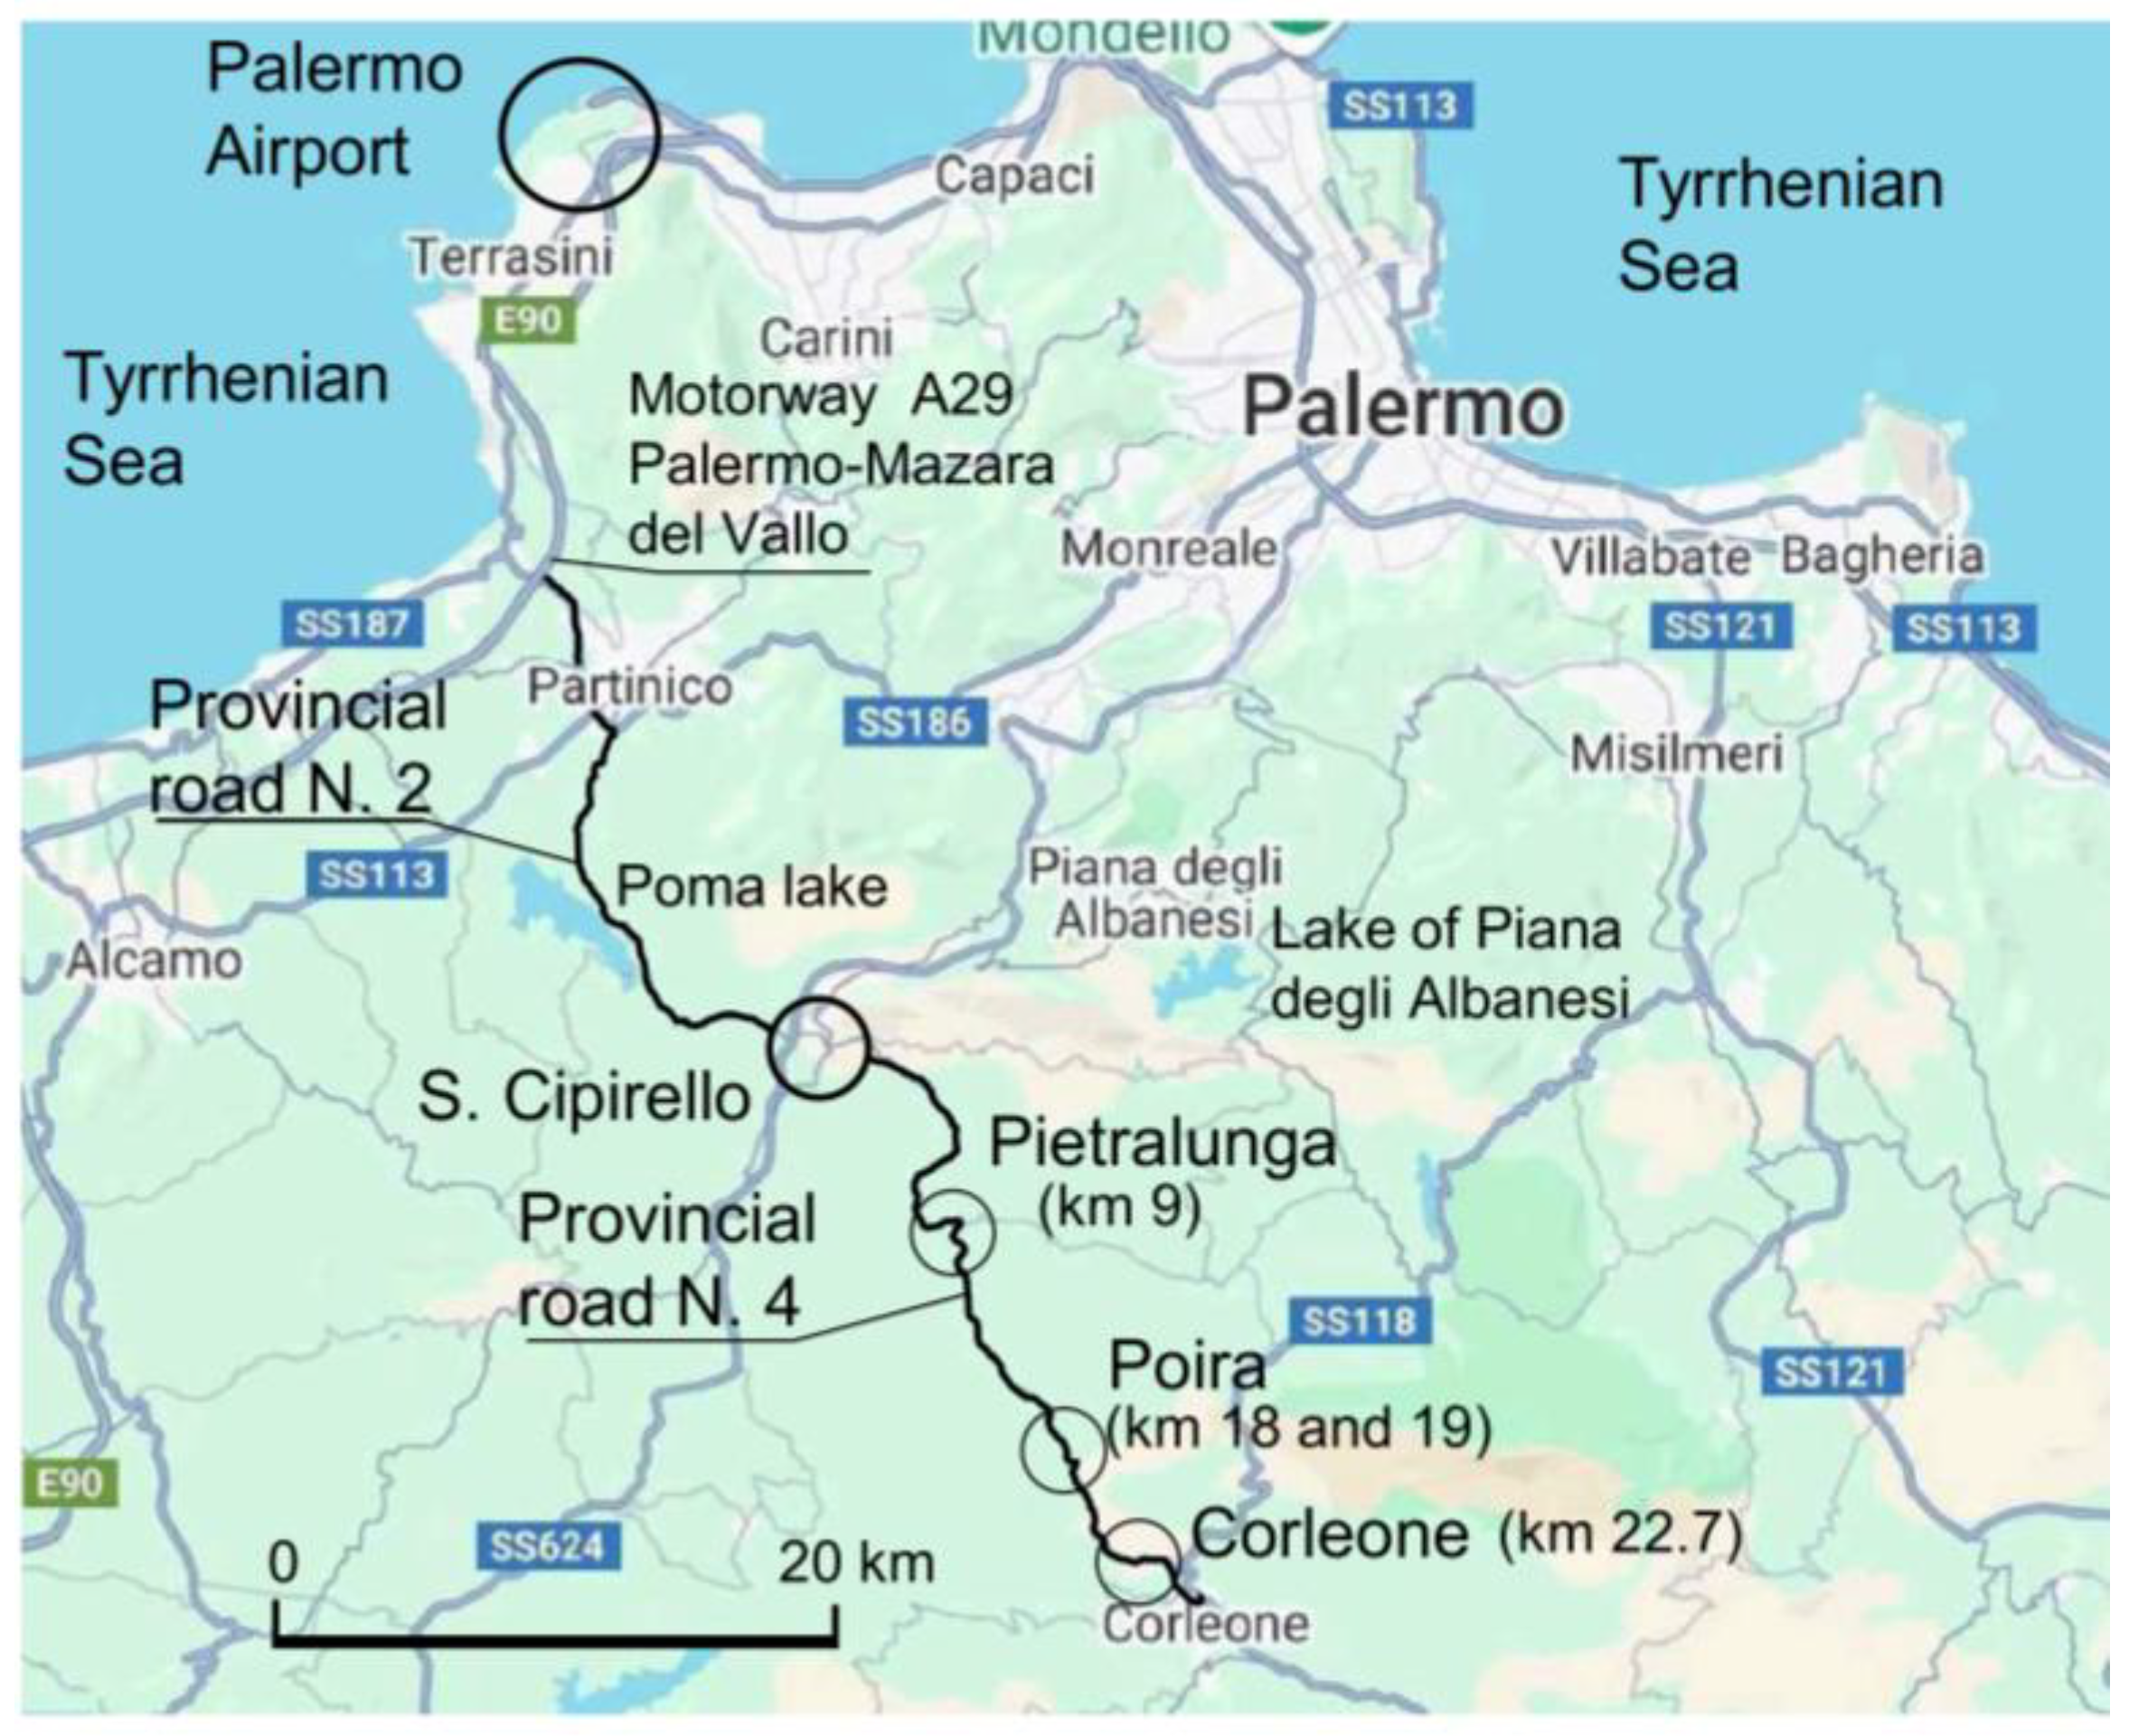
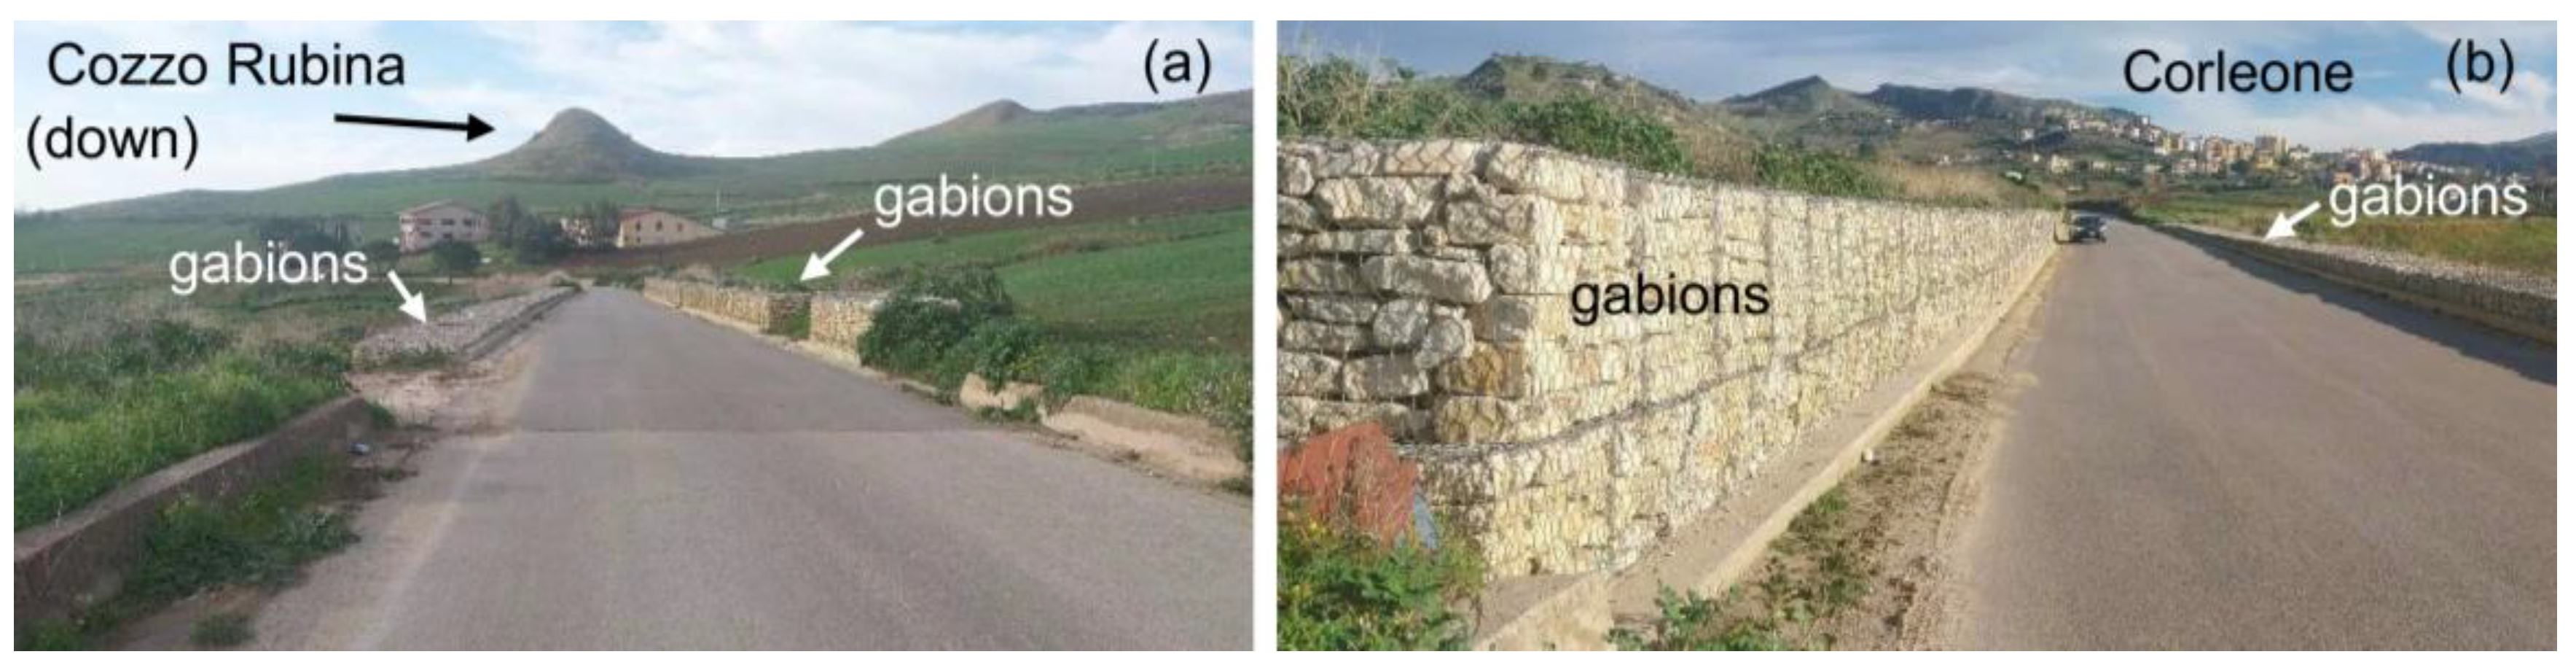
Many municipalities in Southern Italy, particularly in Sicily, are connected to cities or other major centres—often located along the coast—or to other towns by only a few roads, mostly state or provincial roads. In some cases, especially for municipalities in mountainous and remote areas, the number of connecting roads is very limited, and in exceptional cases, there may be only a single access road, as illustrated in
Figure 1 for the municipality of Corleone. Due to a lack of adequate funding, the maintenance of these roads is often suboptimal, particularly for provincial roads.
These transportation routes, due to the geological and geotechnical composition of the soil and rock formations on which they are built, as well as highly variable environmental conditions, are frequently affected by widespread deformation processes along their route and, in some cases, by actual landslides. In such situations, road accessibility and the various activities that depend on or are connected to it—such as agriculture, tourism, commerce, and healthcare services—can become severely compromised, negatively impacting the development of local communities. In many cases, this contributes to the abandonment and depopulation of these remote mountain towns.
This paper presents a case study illustrating the interaction between shallow landslides and Provincial Road N4 (SP 4) San Cipirello-Corleone in the province of Palermo (Sicily). This 24 km-long road is affected by several deformation and instability phenomena along its route, including two major landslides. One of these is located at km 9 (near the limestone rocky ridge formation of “Pietralunga”), while the second, which is the focus of this study, is located at km 22.7, near the town of Corleone (
Figure 1).
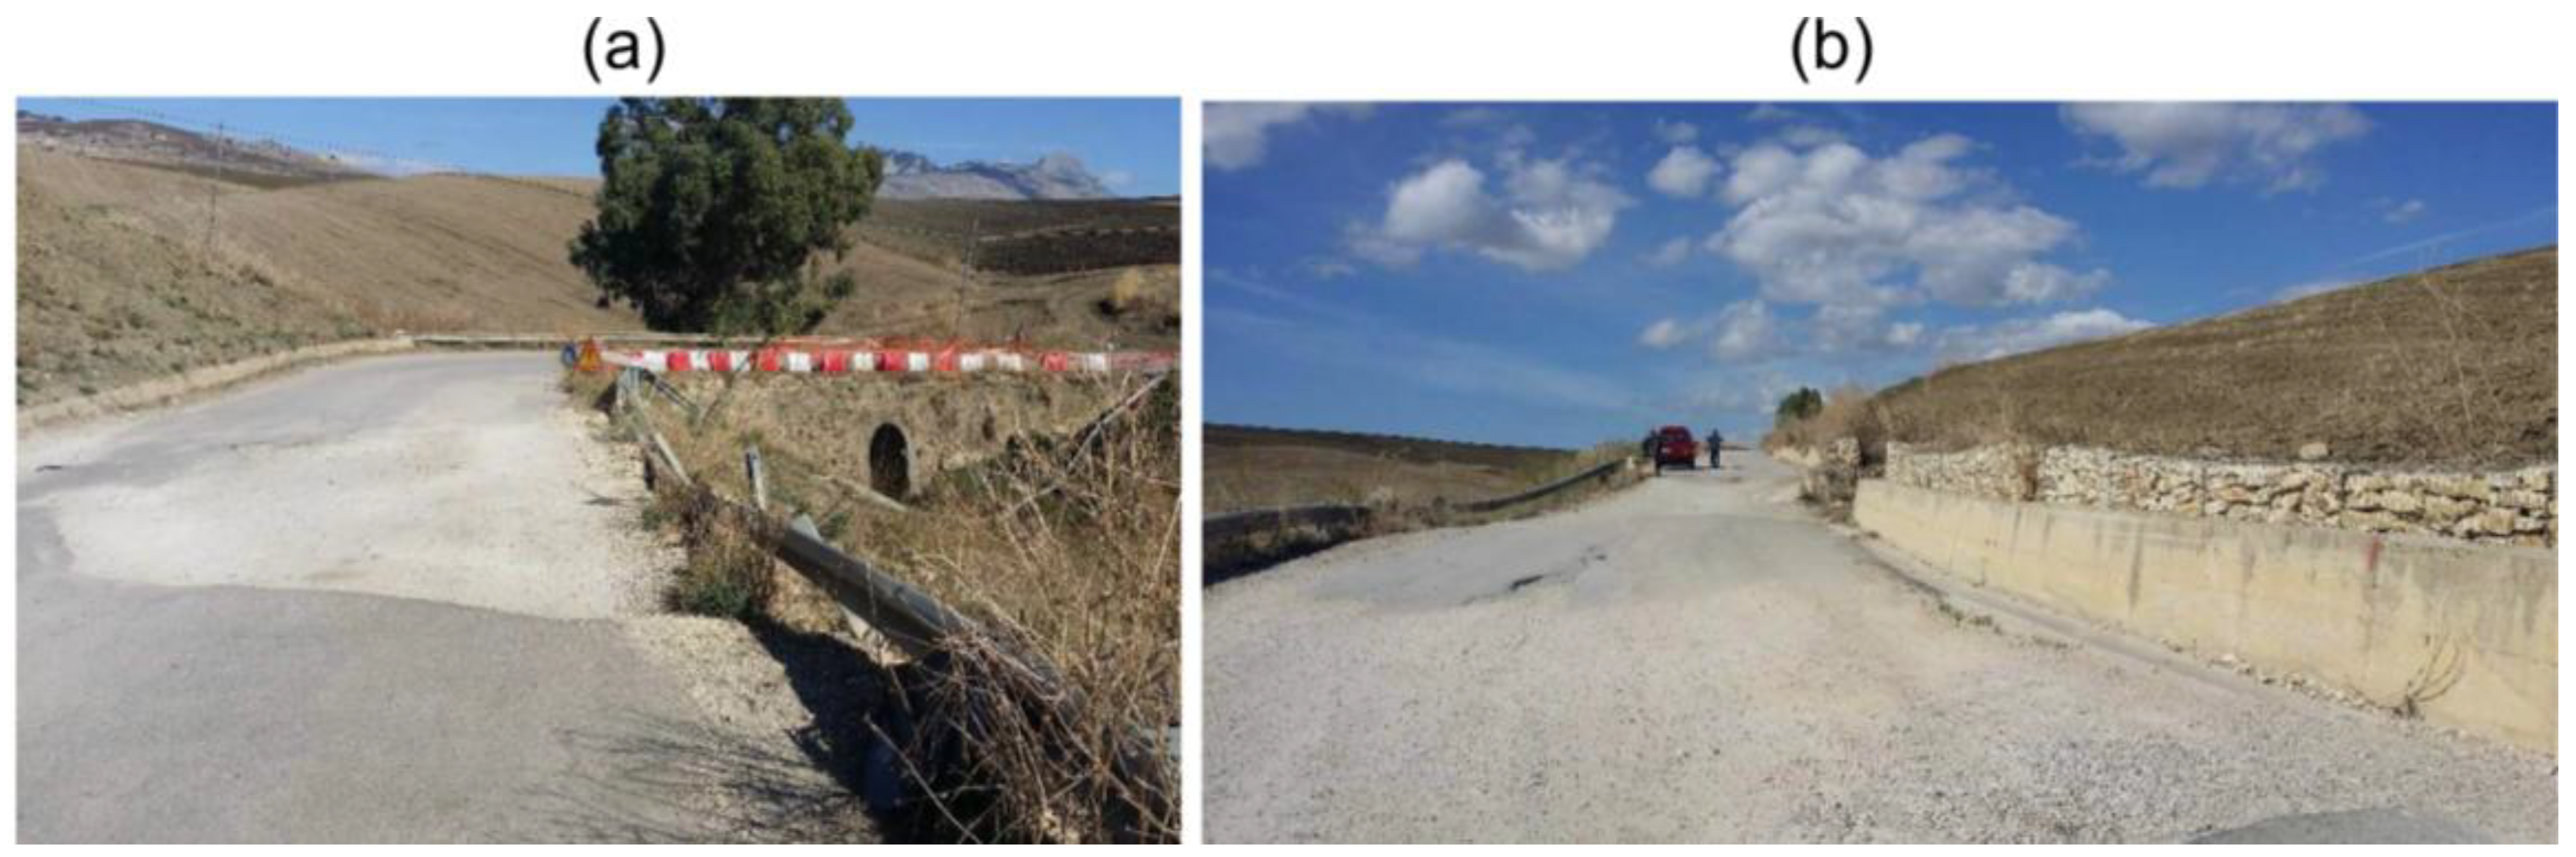
Figure 2 shows photographs of the large landslide at km 9 (Pietralunga), while
Figure 3 highlights secondary but significant instability phenomena at km 18 and km 19 (in the locality of Poira).
Provincial Road N4 is crucial for the town of Corleone, as it connects the municipality to several important centres along Sicily’s northwestern coast, where industrial hubs, construction industries, agricultural processing plants (e.g., wine production), healthcare centres, and other facilities are located. Moreover, this road serves as the shortest route to Punta Raisi Airport (Palermo Airport) via Provincial Road N2 and the A29 Palermo-Mazara del Vallo motorway. Additionally, it provides access to various touristic and commercial activities along the northern Tyrrhenian coast, including Partinico, the largest centre in the area (
Figure 1).
During the autumn–winter season of 2004–2005 (a particularly rainy season), a landslide in overconsolidated clays occurred at km 22.7 of Provincial Road N4, near the town of Corleone (
Figure 4). Over the extended period from 2004 to 2021, the landslide experienced several reactivations, resulting in temporary road closures and continuous yet ineffective restoration efforts on the roadway. These closures and repairs caused significant inconvenience to the local population, economic losses for affected sectors, and substantial financial expenditures for maintenance and restoration.
Similarly, numerous restoration interventions have been carried out along various sections of the road, particularly at km 9—where multiple reactivations have occurred since 2013—as well as at km 18 and 19, in an effort to maintain road usability, albeit with difficulty.
This paper presents on-site and laboratory investigations, in situ measurements, and geotechnical characterization of the landslide at km 22.7. Moreover, the study aims to identify the detailed constitution of the subsoil (within the significant volume from a geotechnical perspective), the causes and the kinematic characters of the landslide, the regime of pore water pressures, and the most suitable and effective corrective measures for the permanent restoration of this vital transportation route for the town of Corleone.
2. Principal Geological Characteristics of the Landslide
The landslide involves soils belonging to the clayey formation locally known as “Marne di San Cipirello”, which dates back to the Miocene age and reaches a maximum thickness of approximately 180 metres. This formation is primarily composed of grey-blue clayey marls and grey-blue sandy marls, which are widely present in the area and are known for their relatively low hydraulic conductivity and high susceptibility to deformation and weathering (Catalano et al., 2010 [
1]; ISPRA, 2010 [
2]).
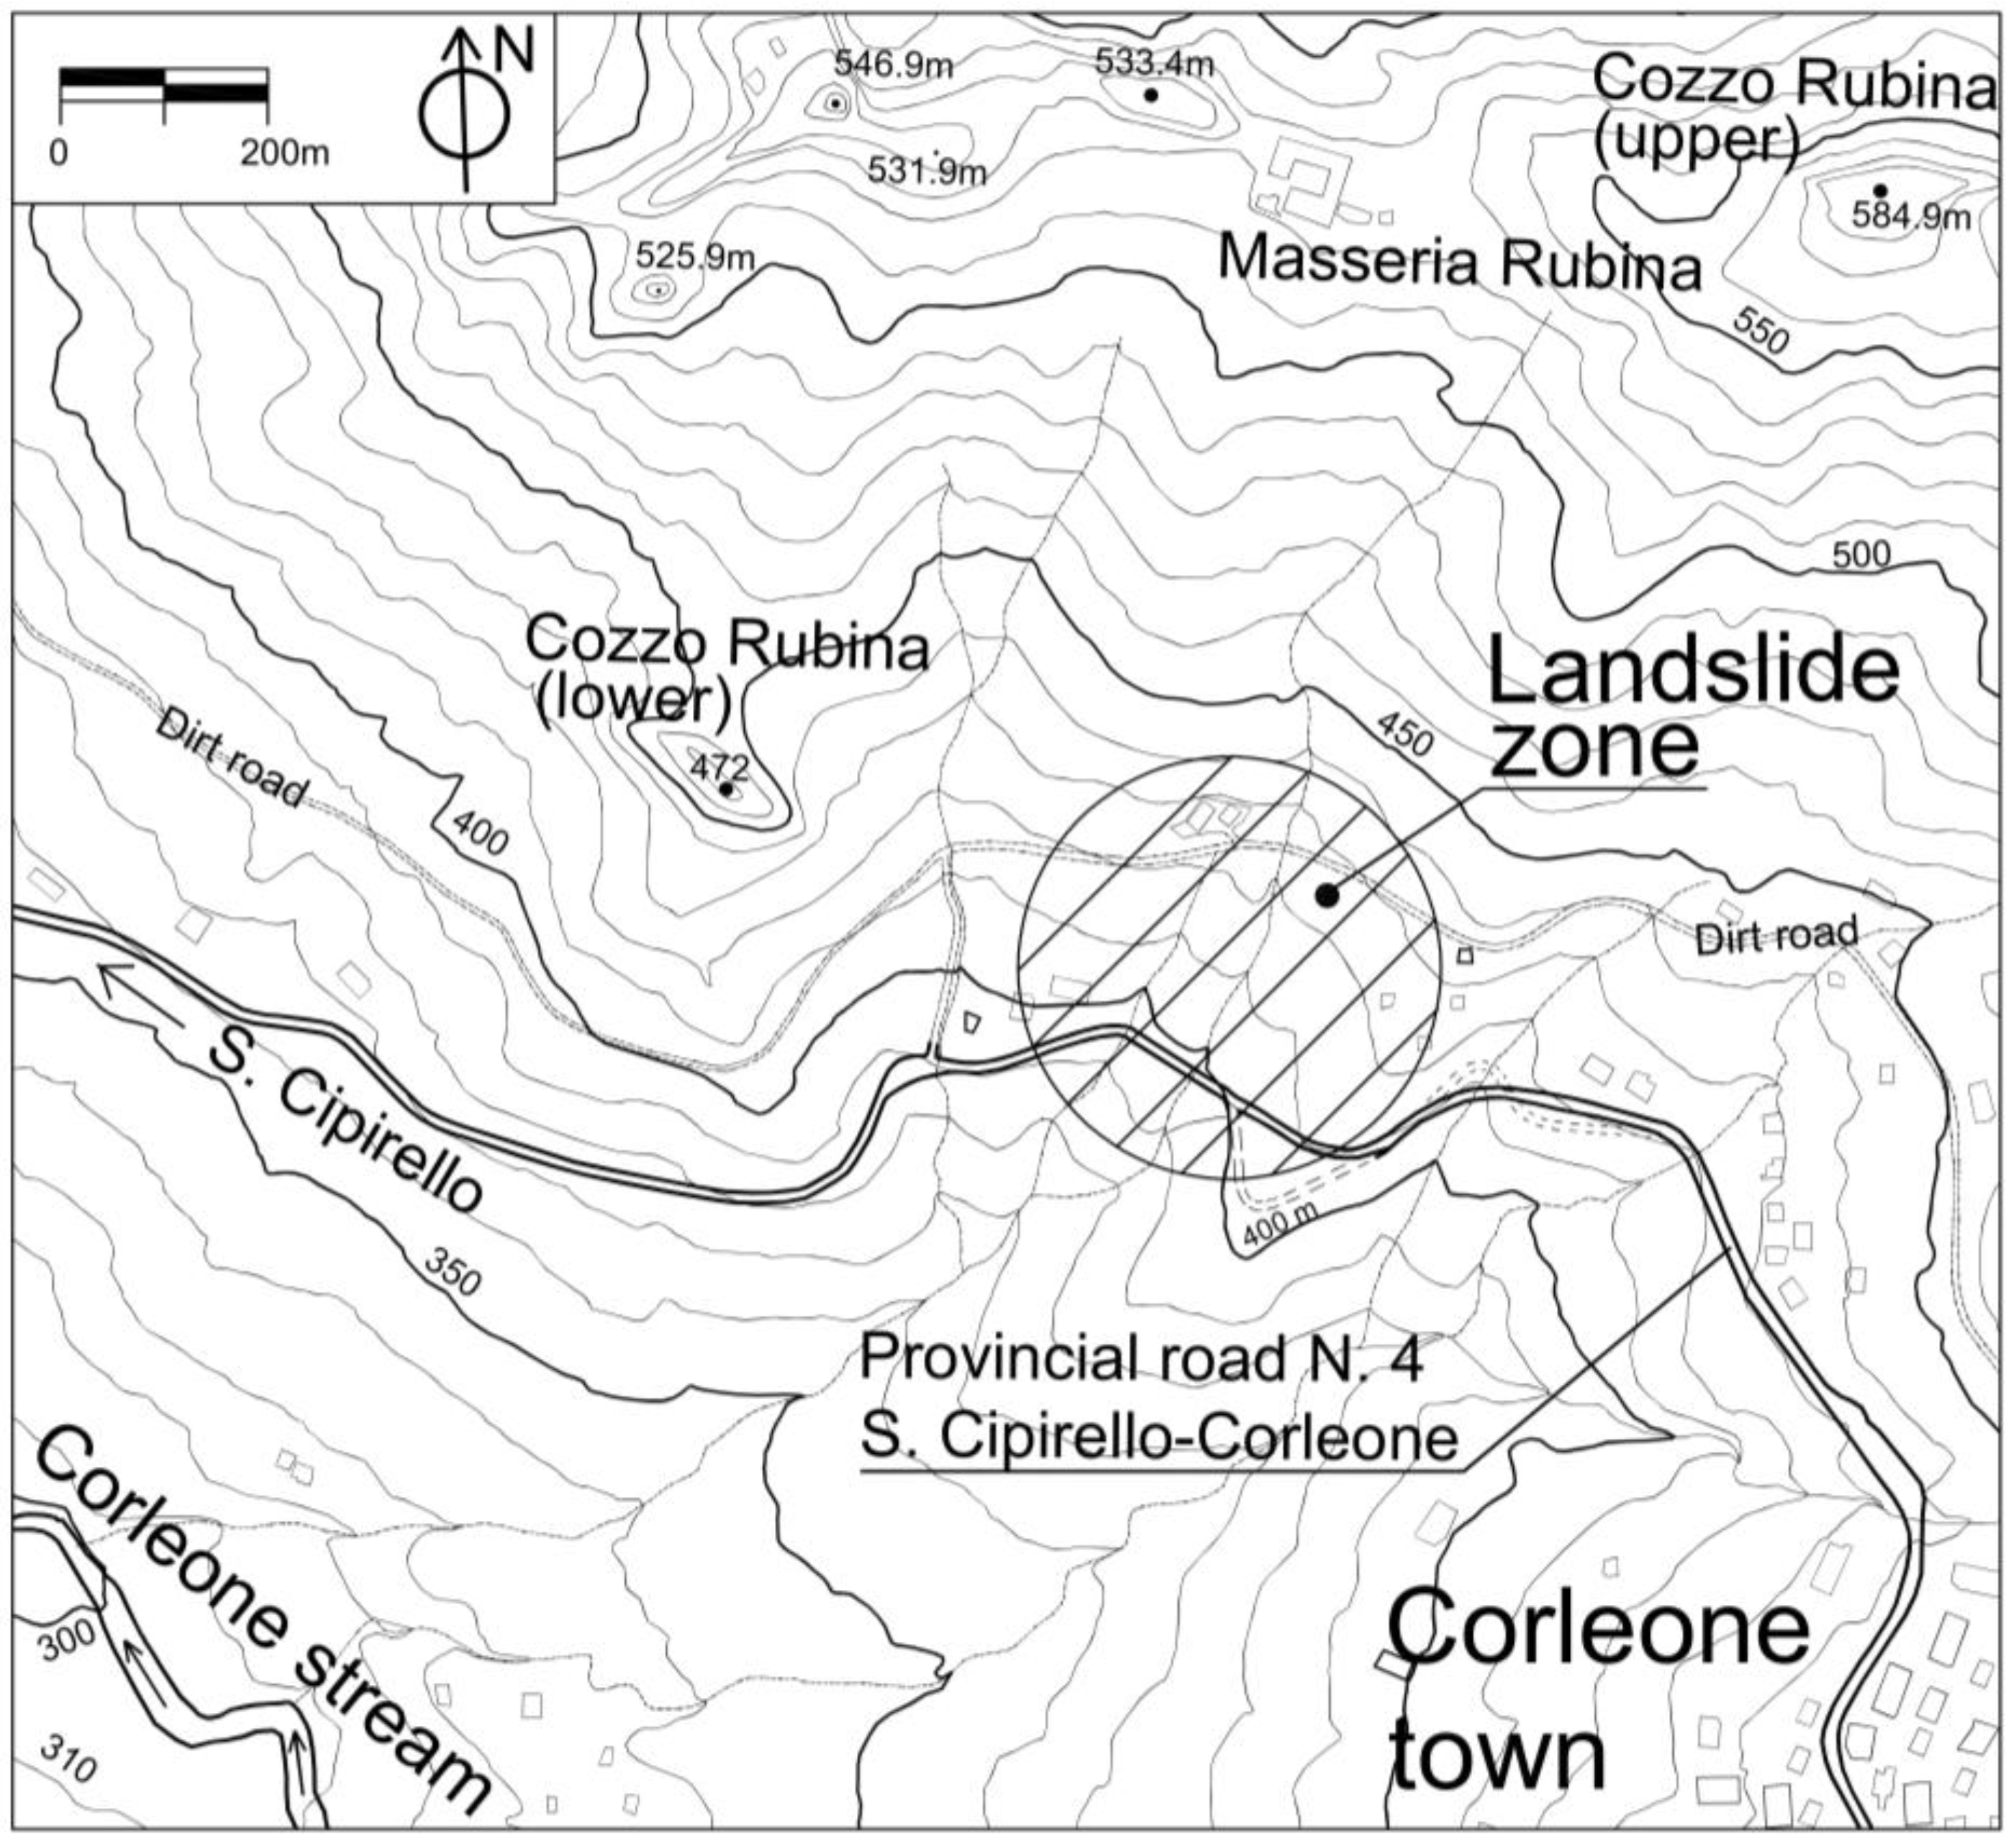
The “Marne di San Cipirello” formation overlies the “Calcarenite di Corleone” formation, a lithological unit composed of carbonate-rich deposits with greater mechanical strength compared to the underlying marls. The “Calcarenite di Corleone” outcrops in specific locations within the study area, particularly in the vicinity of Masseria Rubina and the Cozzo Rubina hills (upper and lower) (
Figure 4). These outcrops play a significant role in the geomorphology of the region, often forming small ridges or elevated reliefs.
The landslide in question, from the kinematics perspective, is classified as a shallow translational slide, primarily affecting the “Marne di San Cipirello” formation.
Due to the poor mechanical properties of the clayey soils composing the “Marne di San Cipirello” formation, particularly their tendency to degrade when exposed to water infiltration and wetting and drying cycles [
3,
4,
5,
6,
7,
8], the landslide is prone to progressive reactivations, especially during periods of intense rainfall. The combination of low shear strength within the shear band, high plasticity, and poor drainage capacity makes these soils highly vulnerable to mass movements, posing significant challenges for slope stabilization and infrastructure protection.
3. Evolution of the Landslide
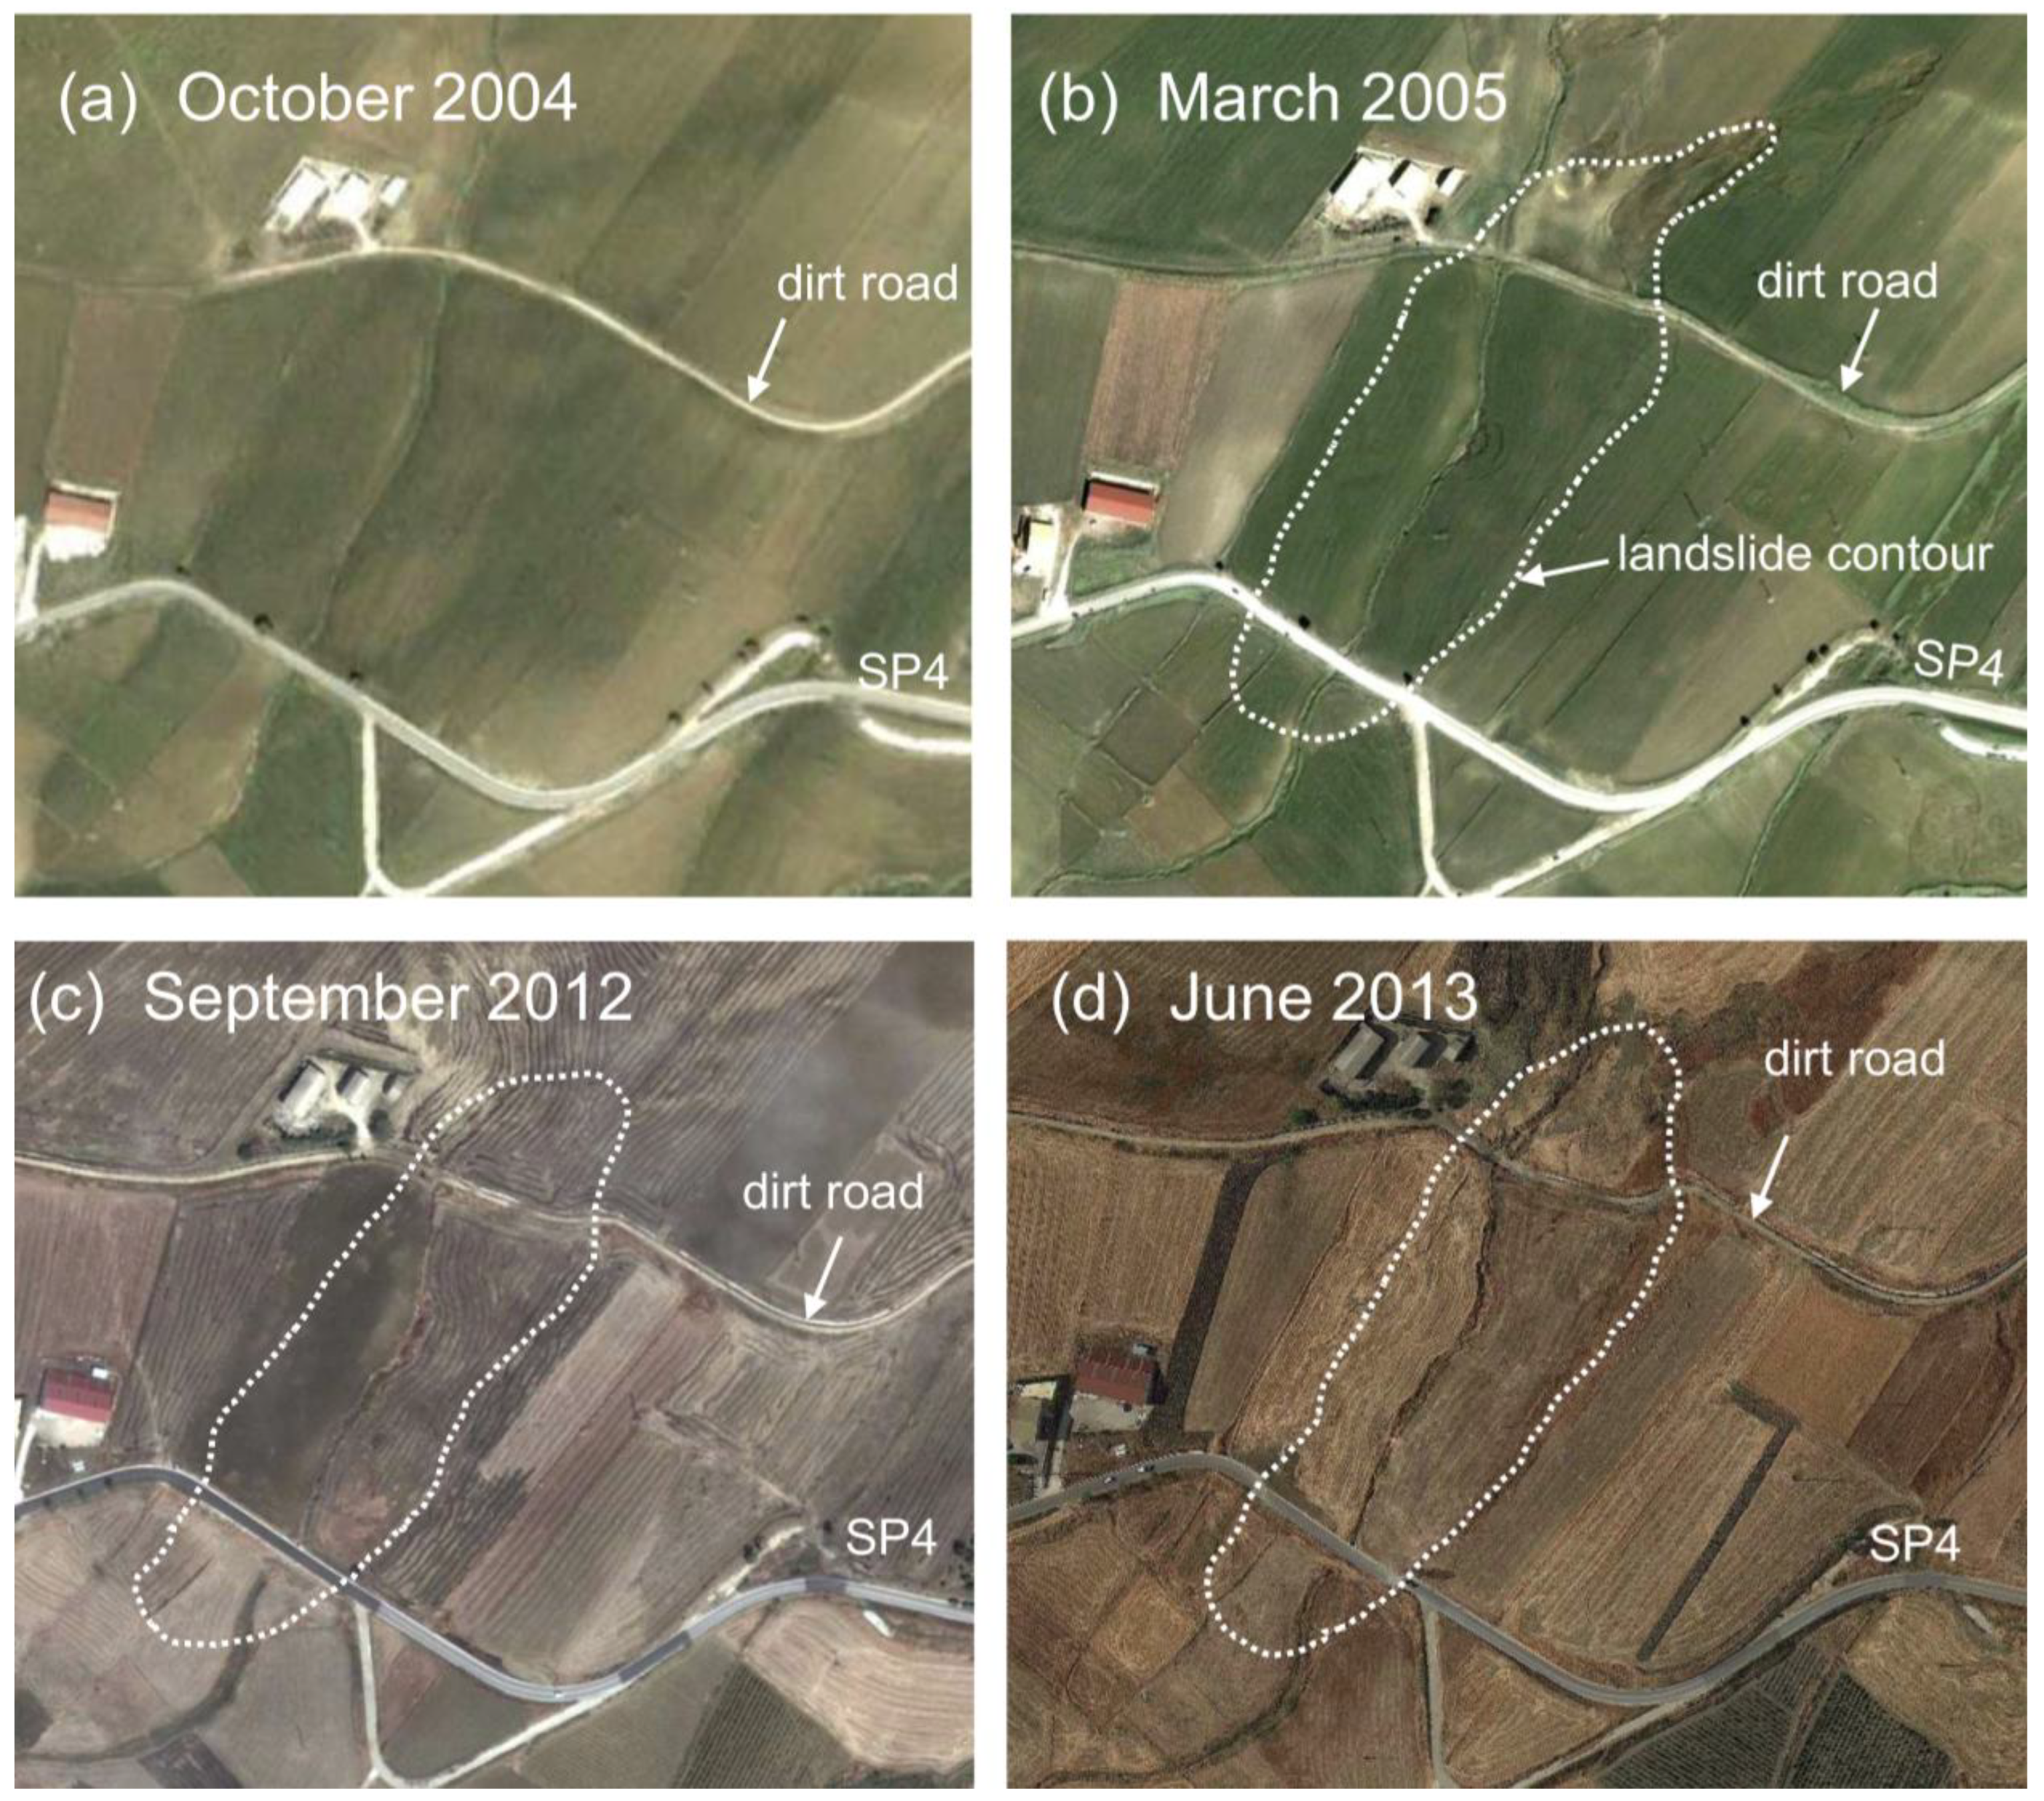
Figure 5 shows four Google Earth photos depicting the state of the landslide area in the autumn of 2004 (before the landslide occurred,
Figure 5a). The landslide was confirmed during the winter season of 2004–2005, and by March 2005, it was clearly identifiable (
Figure 5b). In March 2005, both the Provincial road N4 and the dirt road located above showed clear signs of deformation and displacement. Subsequently, various restoration interventions have been carried out, but new remobilizations of the landslide have occurred. One of these restoration works was completed in September 2012 (
Figure 5c). In 2013, a new remobilization of the landslide took place (
Figure 5d).
Between 2005 and 2021, several interruptions due to the remobilization of the landslide led to significant inconvenience and economic losses for the population, along with substantial expenses for ongoing road restoration efforts.
In
Figure 5, the remobilization of the landslide during the winter of 2012–2013 is clearly visible, with the dislocation of the road platform well illustrated in June 2013.
Further remobilizations occurred in subsequent years, inducing horizontal displacements ranging from 10 to 15 m.
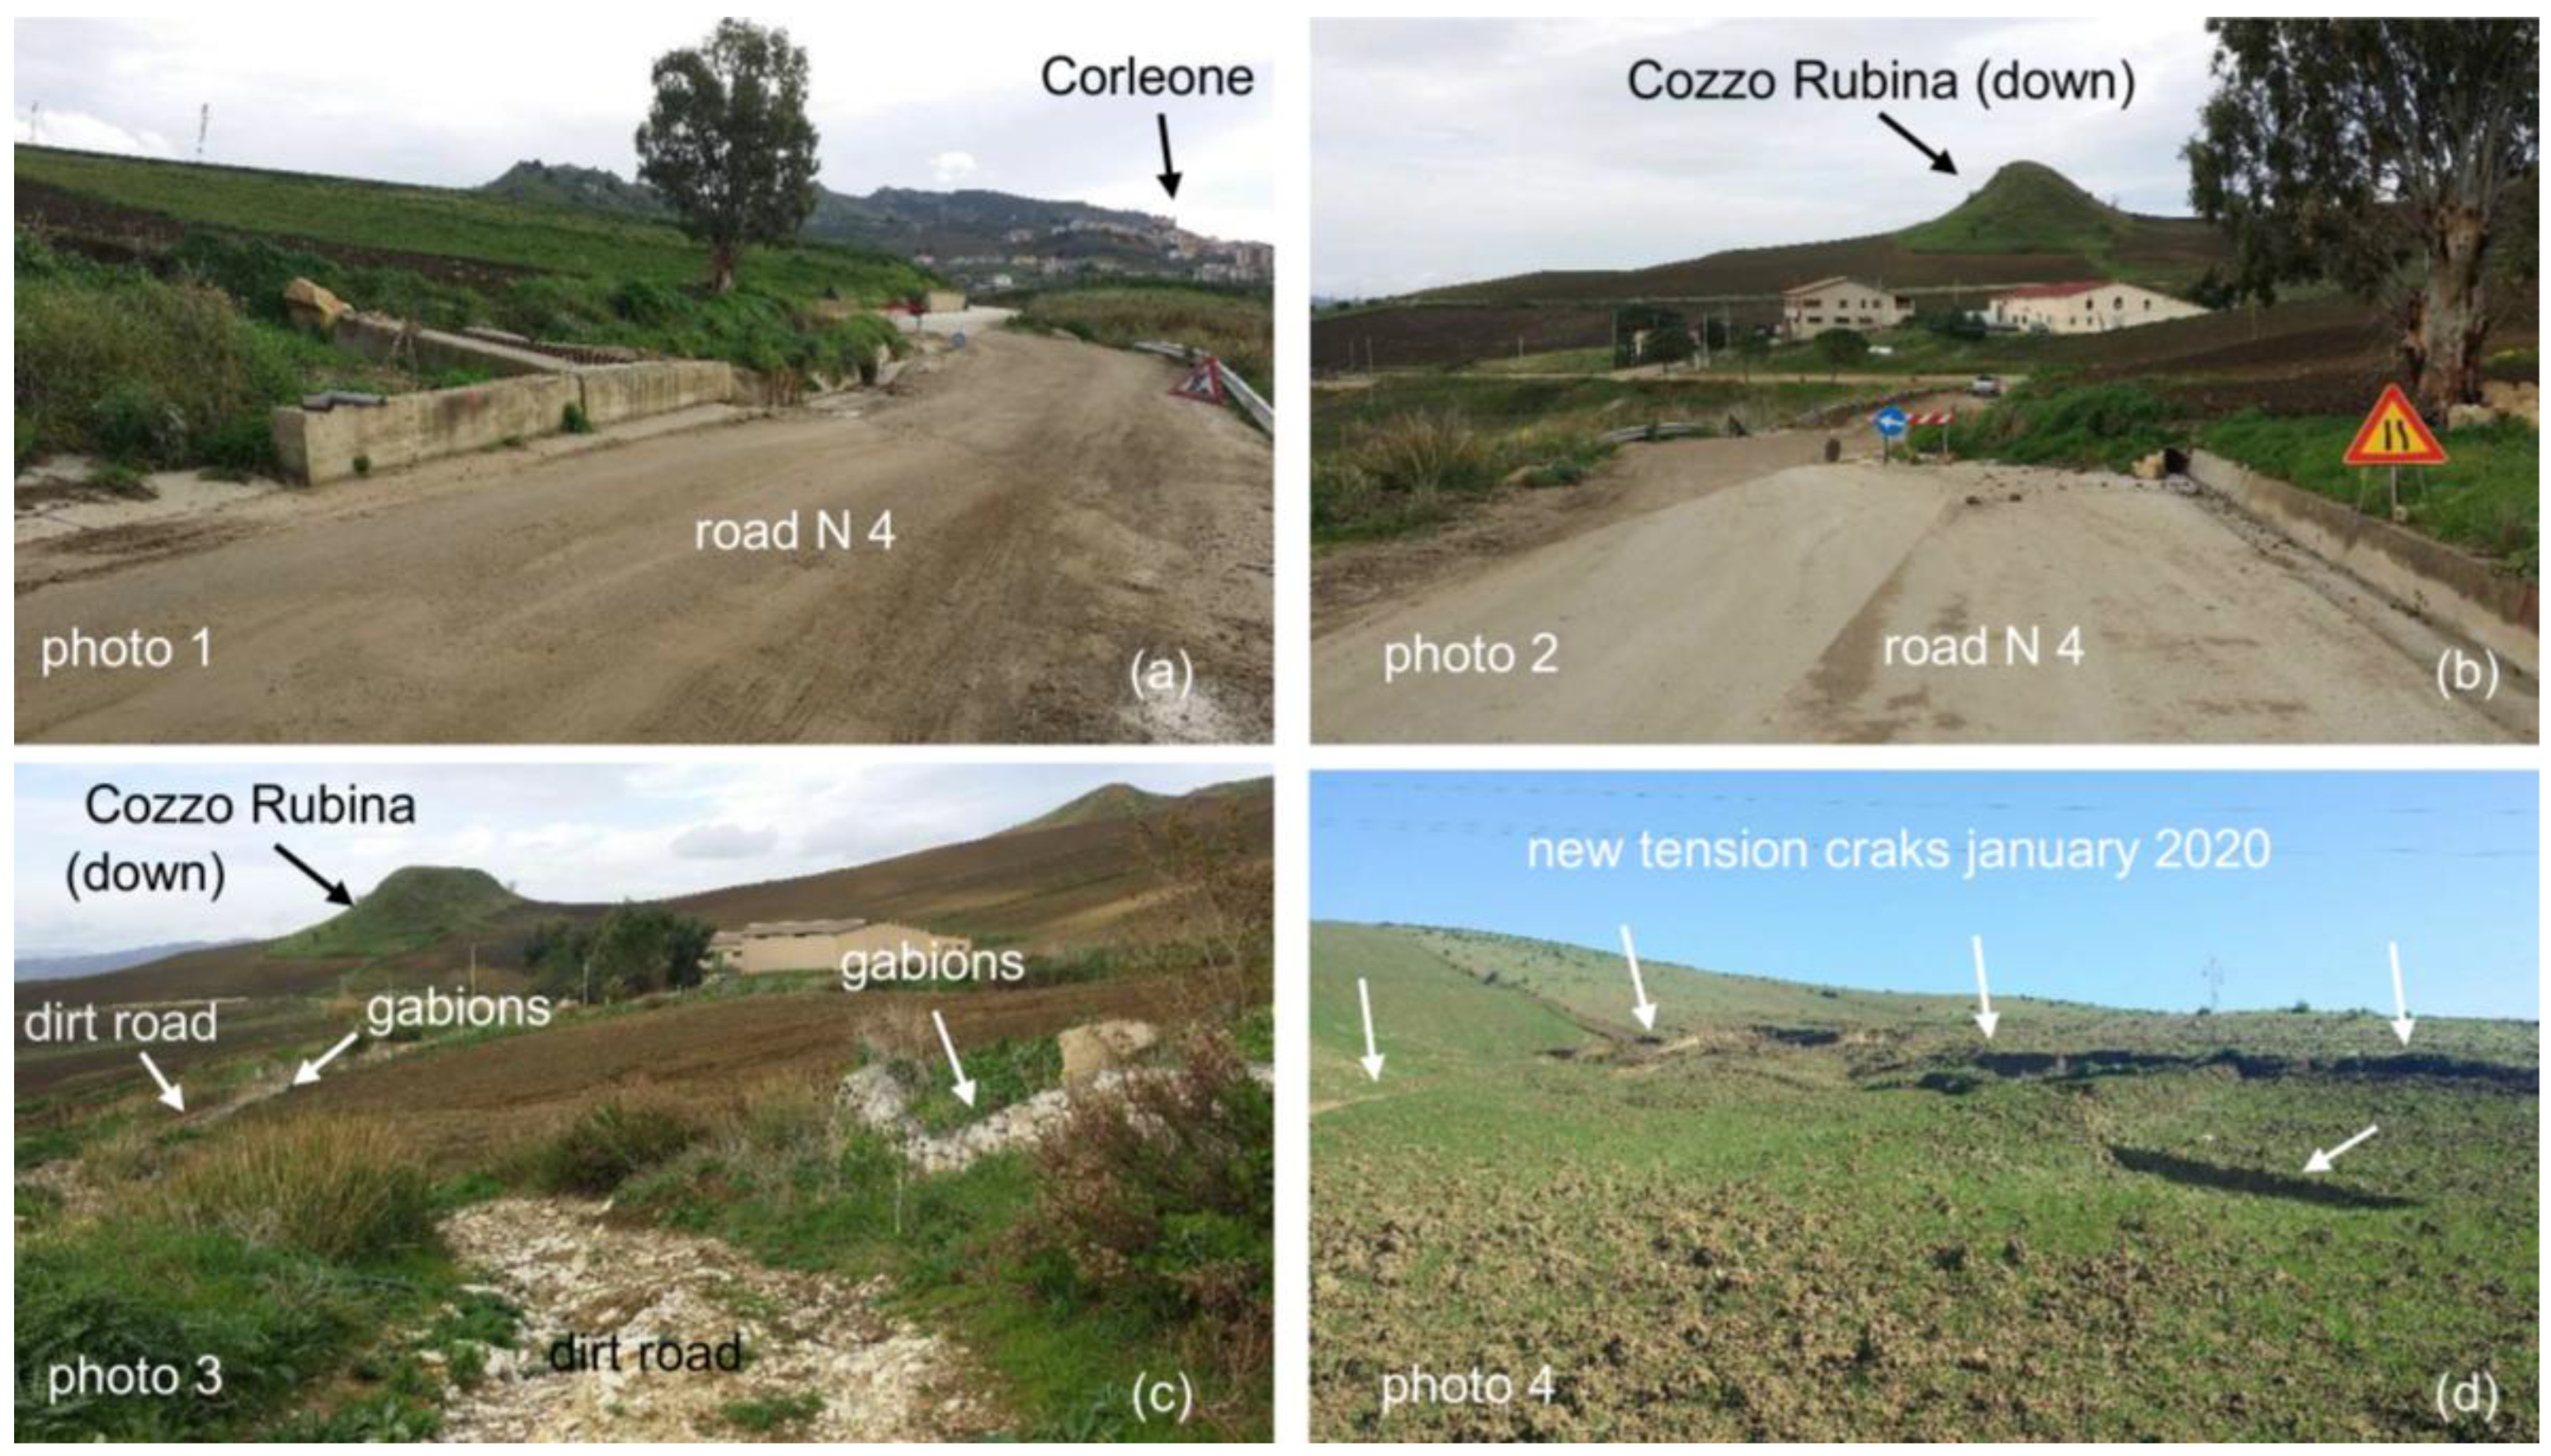
The boundary of the landslide in 2019 is represented in
Figure 6. This figure indicates the boreholes executed in July 2018, the viewpoints for some photos shown in
Figure 7, the boundary of the landslide in 2019, and the tension cracks observed in January 2020. In July 2020, horizontal displacements reached approximately 20 m in the upper part of the landslide (near the dirt road) and about 15 m in the lower part (near the platform of Provincial Road N4) (
Figure 7b,c). During the rainy seasons, the landslide progressively extends toward the upper part of the slope (
Figure 6 and
Figure 7d). The gabions located along the dirt road have experienced significant dislocation.
The high displacements induced by the landslide are clearly visible along both the provincial road and the dirt road.
The main dimensions of the landslide are as follows (
Figure 5 and
Figure 6): length: approximately 350 m; width: around 130 m; estimated thickness: between 6 and 7 m.
4. In Situ Measurements and Geotechnical Characterization of Soils
As previously mentioned in
Section 2, the soils constituting the slope where the landslide occurs belong to the “Marne di San Cipirello” formation. The soils were investigated through four mechanical continuous core drilling surveys (BH1-BH4), with their locations shown in
Figure 6, as well as through in situ and laboratory tests and measurements. In borehole BH1, a down-hole test was performed for the seismic characterization of the soils, while borehole BH2 was equipped with an inclinometer. Additionally, boreholes BH3 and BH4 were equipped with Casagrande-type piezometers.
Additional details of the survey and its results are reported in [
9].
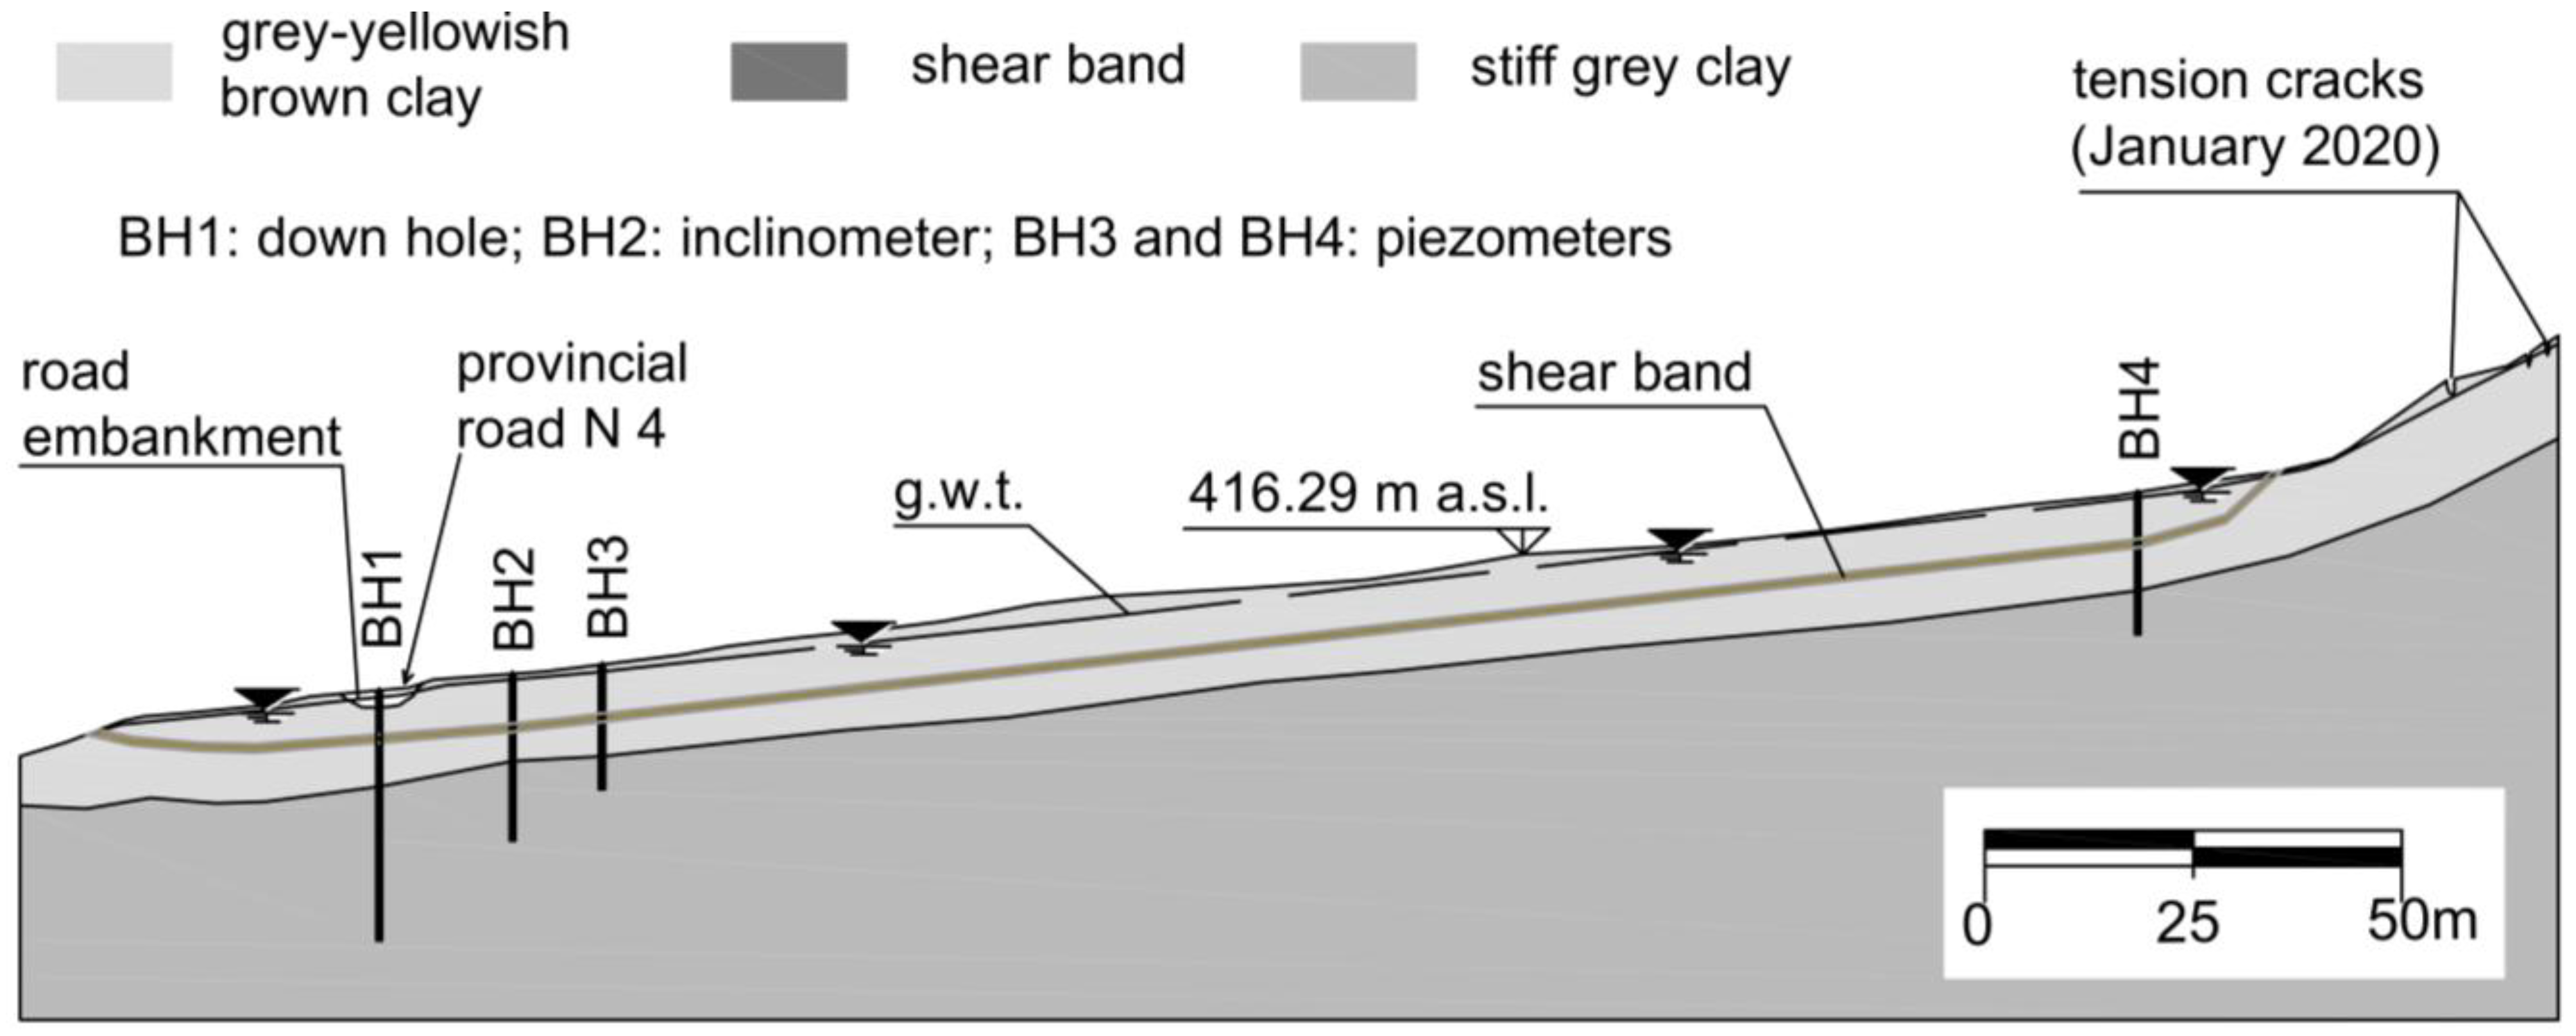
Figure 8 shows a simplified schematic reconstruction of the subsoil composition along the longitudinal vertical section A-A′, which is traced in
Figure 6. The soils of interest for this study, listed from bottom to top, are: (a) stiff grey clay with “zones” and “lenses” formed by scaly clays; (b) altered grey-yellowish-brown clay. Within this last layer, a shear band consisting of very soft grey-brown clay, approximately 50 cm thick, is present and was clearly identified in all the boreholes. The upper part of the subsoil, about 1 m thick, consists of agricultural soil, which has been incorporated into the weathered grey-yellowish-brown clays in the stratigraphic scheme.
Figure 9 presents photos of the clayey soils of the shear band in borehole BH1 (indicated as S1 in the photo). These soils also exhibit shiny and striated sliding surfaces (
Figure 9b).
The grain size distribution of the soils of interest on the slope is shown in
Figure 10a. The soils of the shear band have a clay fraction of about 60%, which is higher than that of both the base stiff grey clay and the altered yellowish-brown clay (ranging from 40% to 50%). The base stiff scaly grey clays and the altered yellowish-brown clays are classified as inactive and of medium-high plasticity, while those of the shear band are of normal activity and high plasticity (
Figure 10b).
The clays are saturated, with a unit weight of 20.5 kN/m3 for both the base grey clay and the yellow-brown clay, while the shear band has a unit weight of 19.5 kN/m3. The specific weight for all the soils is 27 kN/m3. The natural water content of the base stiff grey clay is approximately 12%, while that of the weathered, altered yellowish-brown clay is approximately 15%, and the natural water content of the clay of the shear band is 30%.
The clays, including those from the stiff base formation and the overlying weathered, degraded, and altered layers, are overconsolidated. The current configuration is likely a result of the erosion of the upper layers. The structure of the intact stiff grey clays is highly interconnected and resembles that of the stiff scaly clays.
The trend of the overconsolidation ratio (OCR) with depth for borehole BH2 is illustrated in
Figure 11. OCR, evaluated using the Casagrande method in oedometer tests on specimens from borehole BH2, decreases with depth.
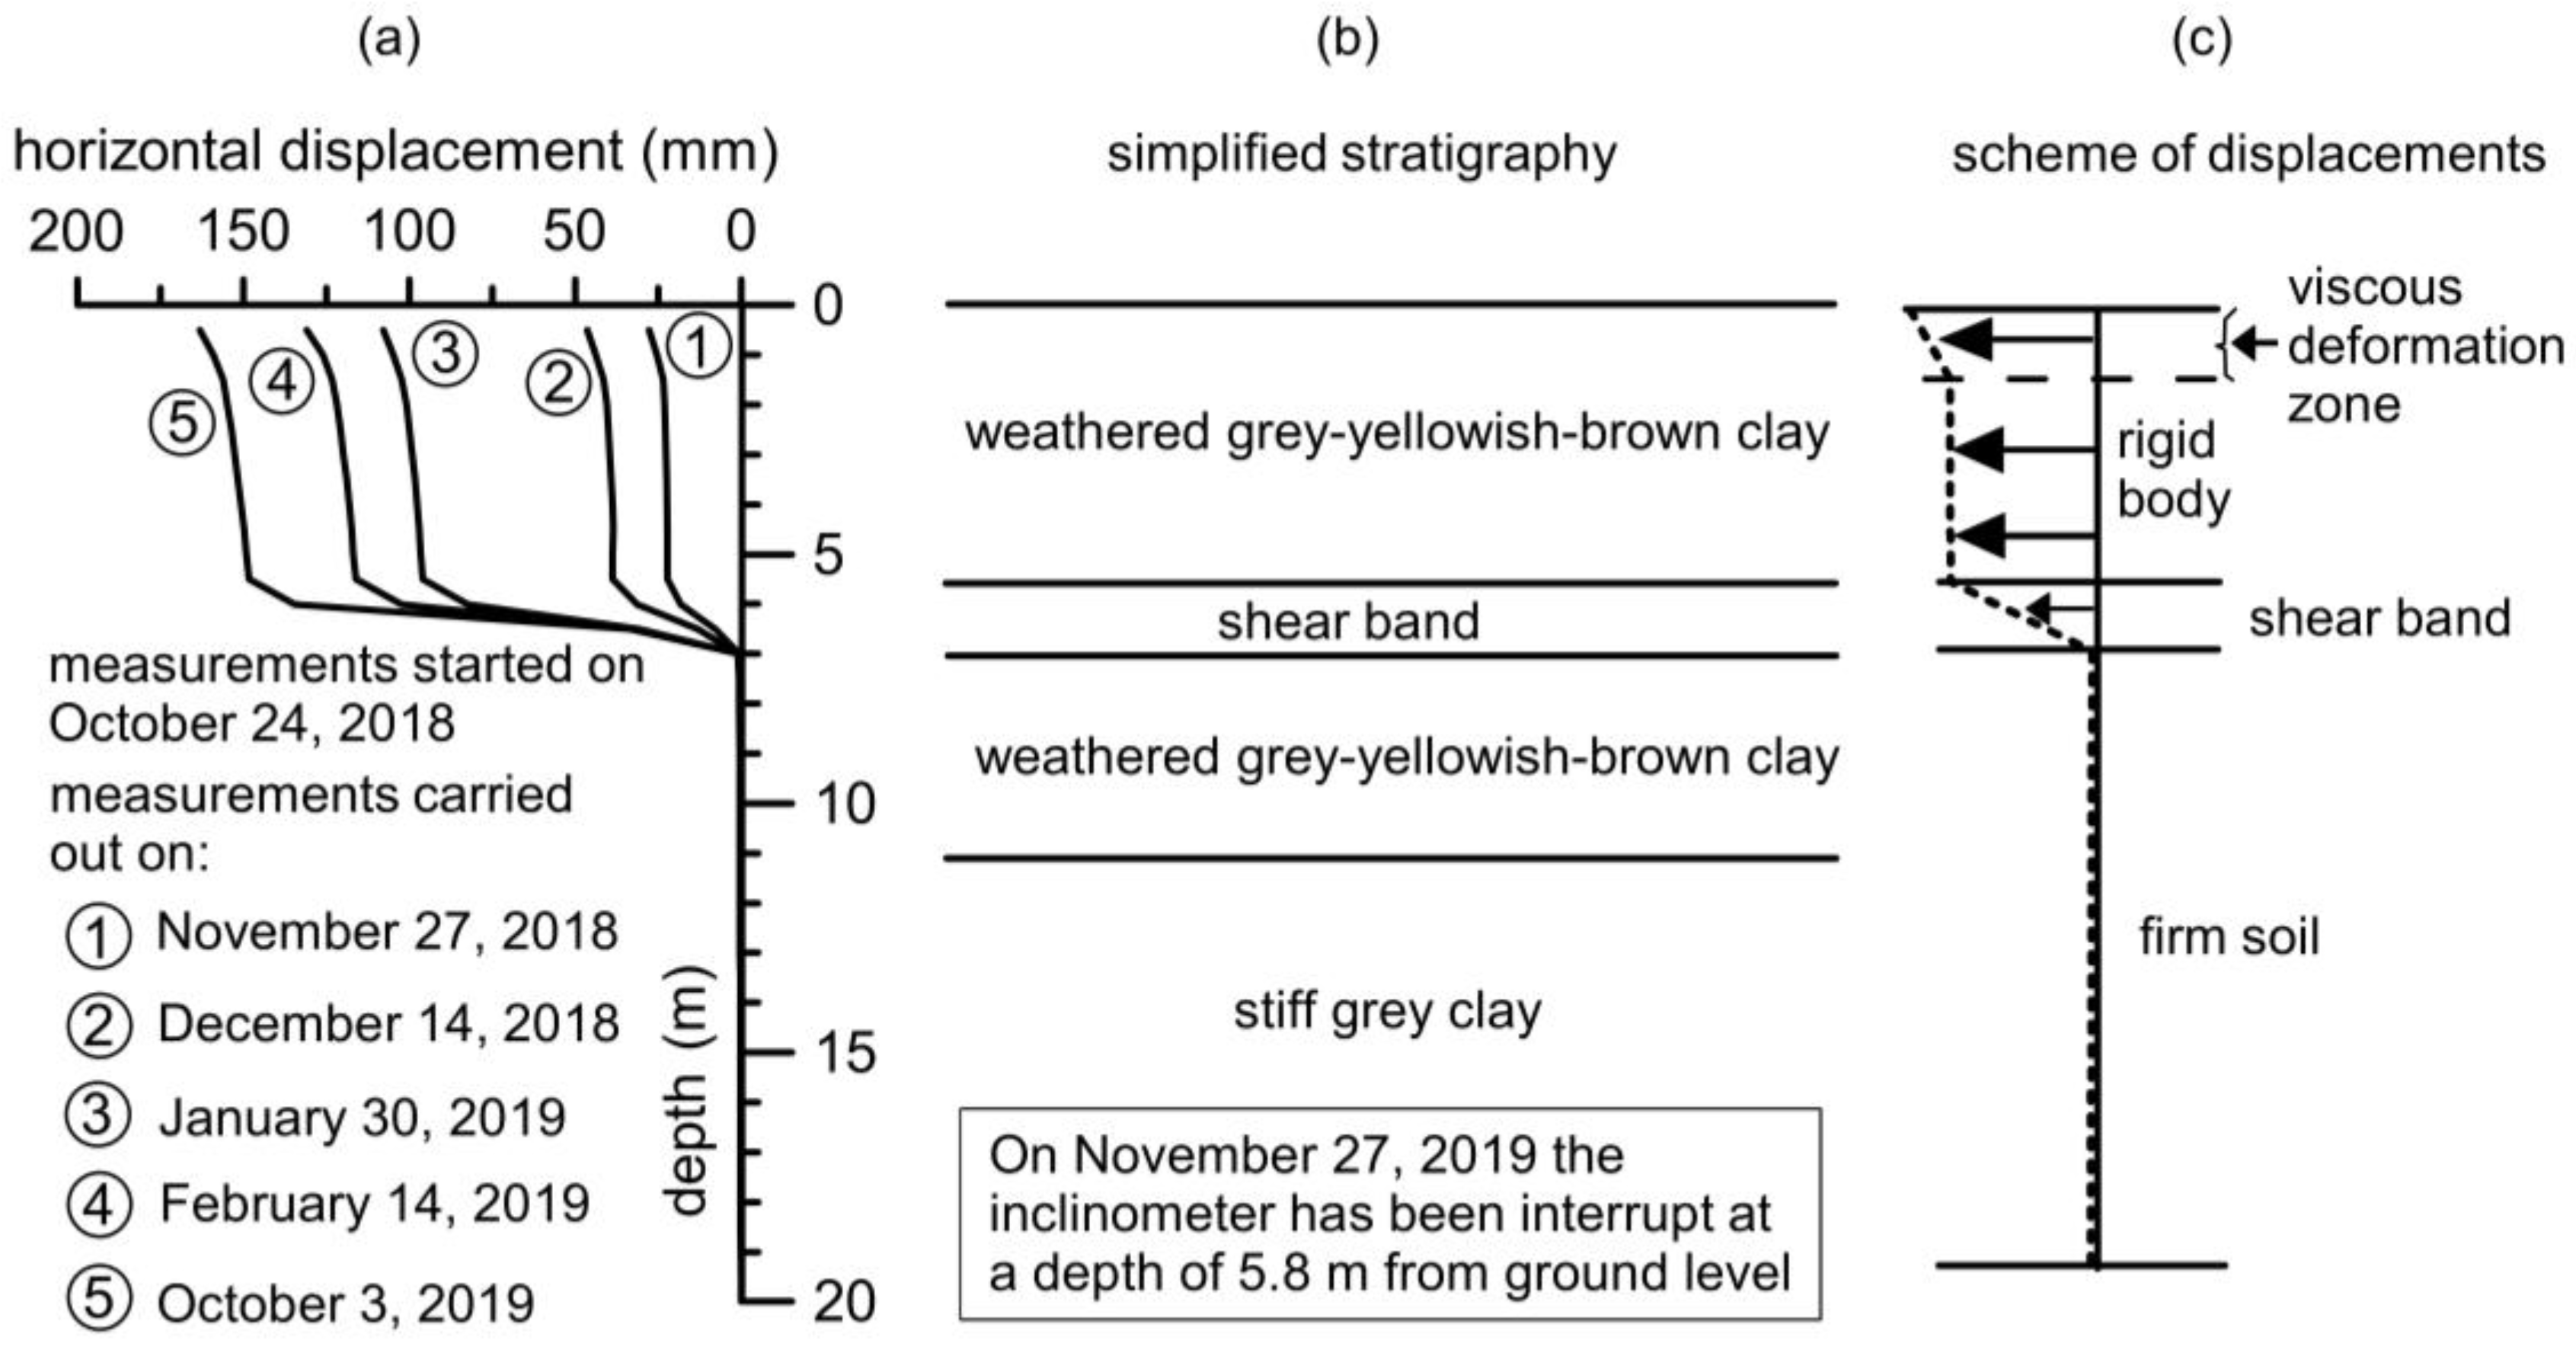
Figure 12 shows the inclinometer profile (
Figure 12a) for the vertical section of borehole BH2 covering the period from October 2018 to October 2019. The simplified stratigraphy of borehole BH2 (
Figure 12b) is also included in the figure for easier interpretation of the measurements. As illustrated, the shear zone is distinctly located within the yellow to brown weathered and altered clay. The displacement profile indicates that the soil mass, at least in the inclinometer area, behaves primarily as a rigid body sliding over the shear zone (or shear band), which is approximately 0.5 m thick. The soils exhibit viscous deformations in the upper section near ground level and extending to a depth of about 1 m (
Figure 12c). The sliding surface develops within the weathered-altered yellow-brown clays, representing the deeply weathered portion of the “Marne di S. Cipirello” formation.
The inclinometer was interrupted during the period from October 3 to November 27 of the year 2019.
5. Causes, Kinematic Characteristics, and Back-Analysis of the Landslide
5.1. Causes and Kinematic Characteristics of the Landslide
The main causes of the landslide are related to the poor mechanical properties of the soils within the shear band, which consists of weathered-altered and mechanically degraded clays. These inadequate geotechnical characteristics are a result of physicochemical alteration processes that have led to a deterioration in the shear resistance and stiffness parameters. The reduction in strength parameters is due to aging and degradation phenomena, as well as the accumulation of successive deformations induced by various drying and wetting cycles related to fluctuations in groundwater levels. Over time, these processes have directly contributed to a reduction in shear strength toward its residual values.
Numerous examples of landslides induced by rainfall are documented in the literature (e.g., refs. [
10,
11,
12,
13,
14,
15,
16]). The degradation of mechanical parameters, combined with high interstitial pressures generated by atmospheric precipitation, created conditions that triggered the landslide occurring during the winter season of 2004–2005 (
Figure 5).
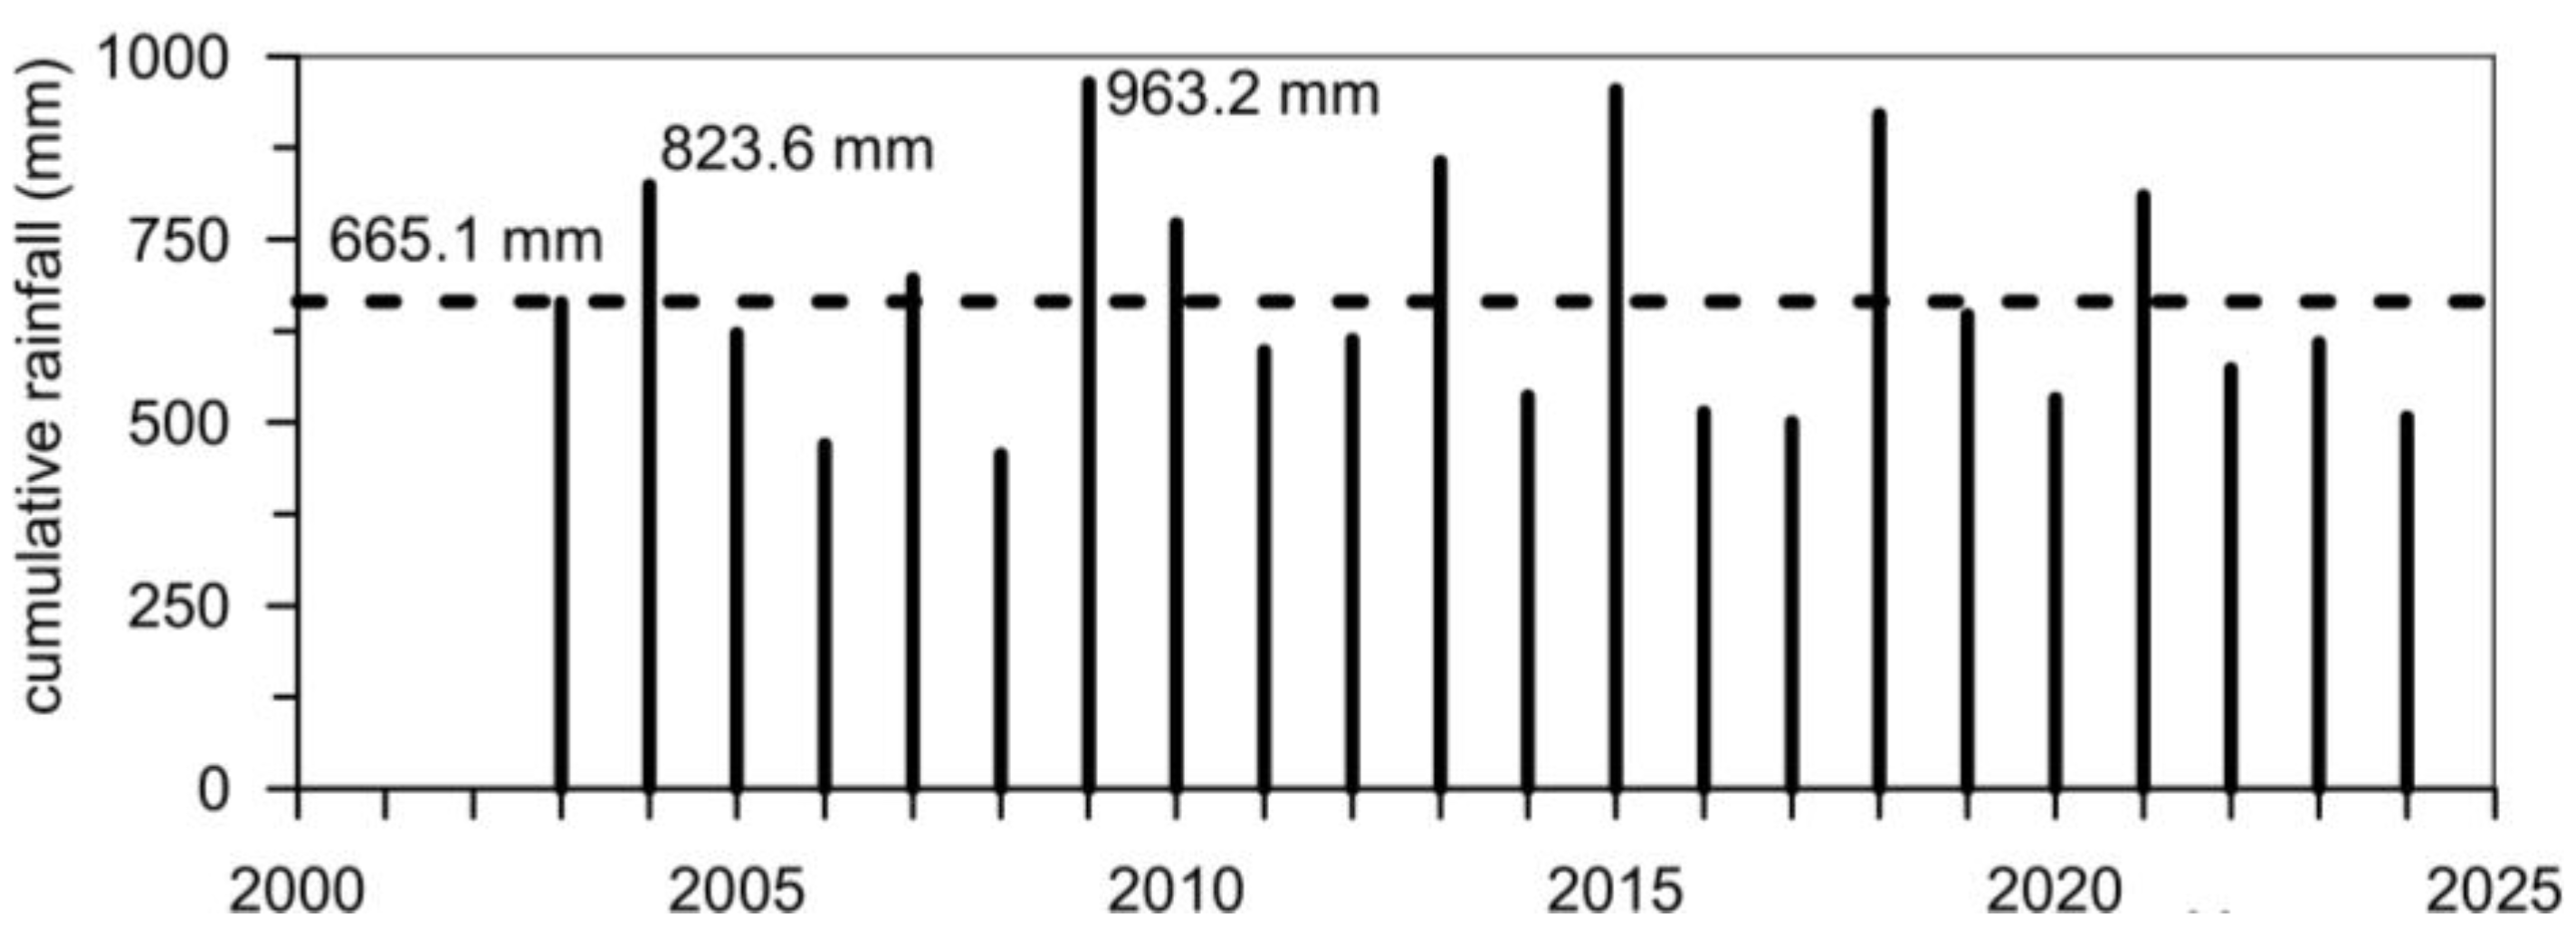
Figure 13 shows the annual cumulative precipitation for the period from 2003 to 2024, measured at the Corleone rainfall station. The year 2004 was particularly rainy, with cumulative rainfall exceeding the mean value. During the observation period, several years recorded cumulative annual precipitation approximately 1.5 times the mean value.
Figure 14a shows the monthly cumulative precipitation for the period from January 2004 to December 2005, which coincides with the period when the landslide first occurred. The months of November and December 2004, along with January 2005, experienced significant rainfall. The cumulative rainfall during this period was 148.8 mm for November 2004, 178.4 mm for December 2004, and 114.8 mm for January 2005, compared to the average value of 60.2 mm.
Figure 14b presents the four-month cumulative precipitation for the same period. Notably, the cumulative precipitation from November 2004 to February 2005 reached 502 mm, which is twice the average value of 252.2 mm. These data clearly indicate that the landslide occurred during the winter season of 2004–2005, coinciding with exceptionally high rainfall.
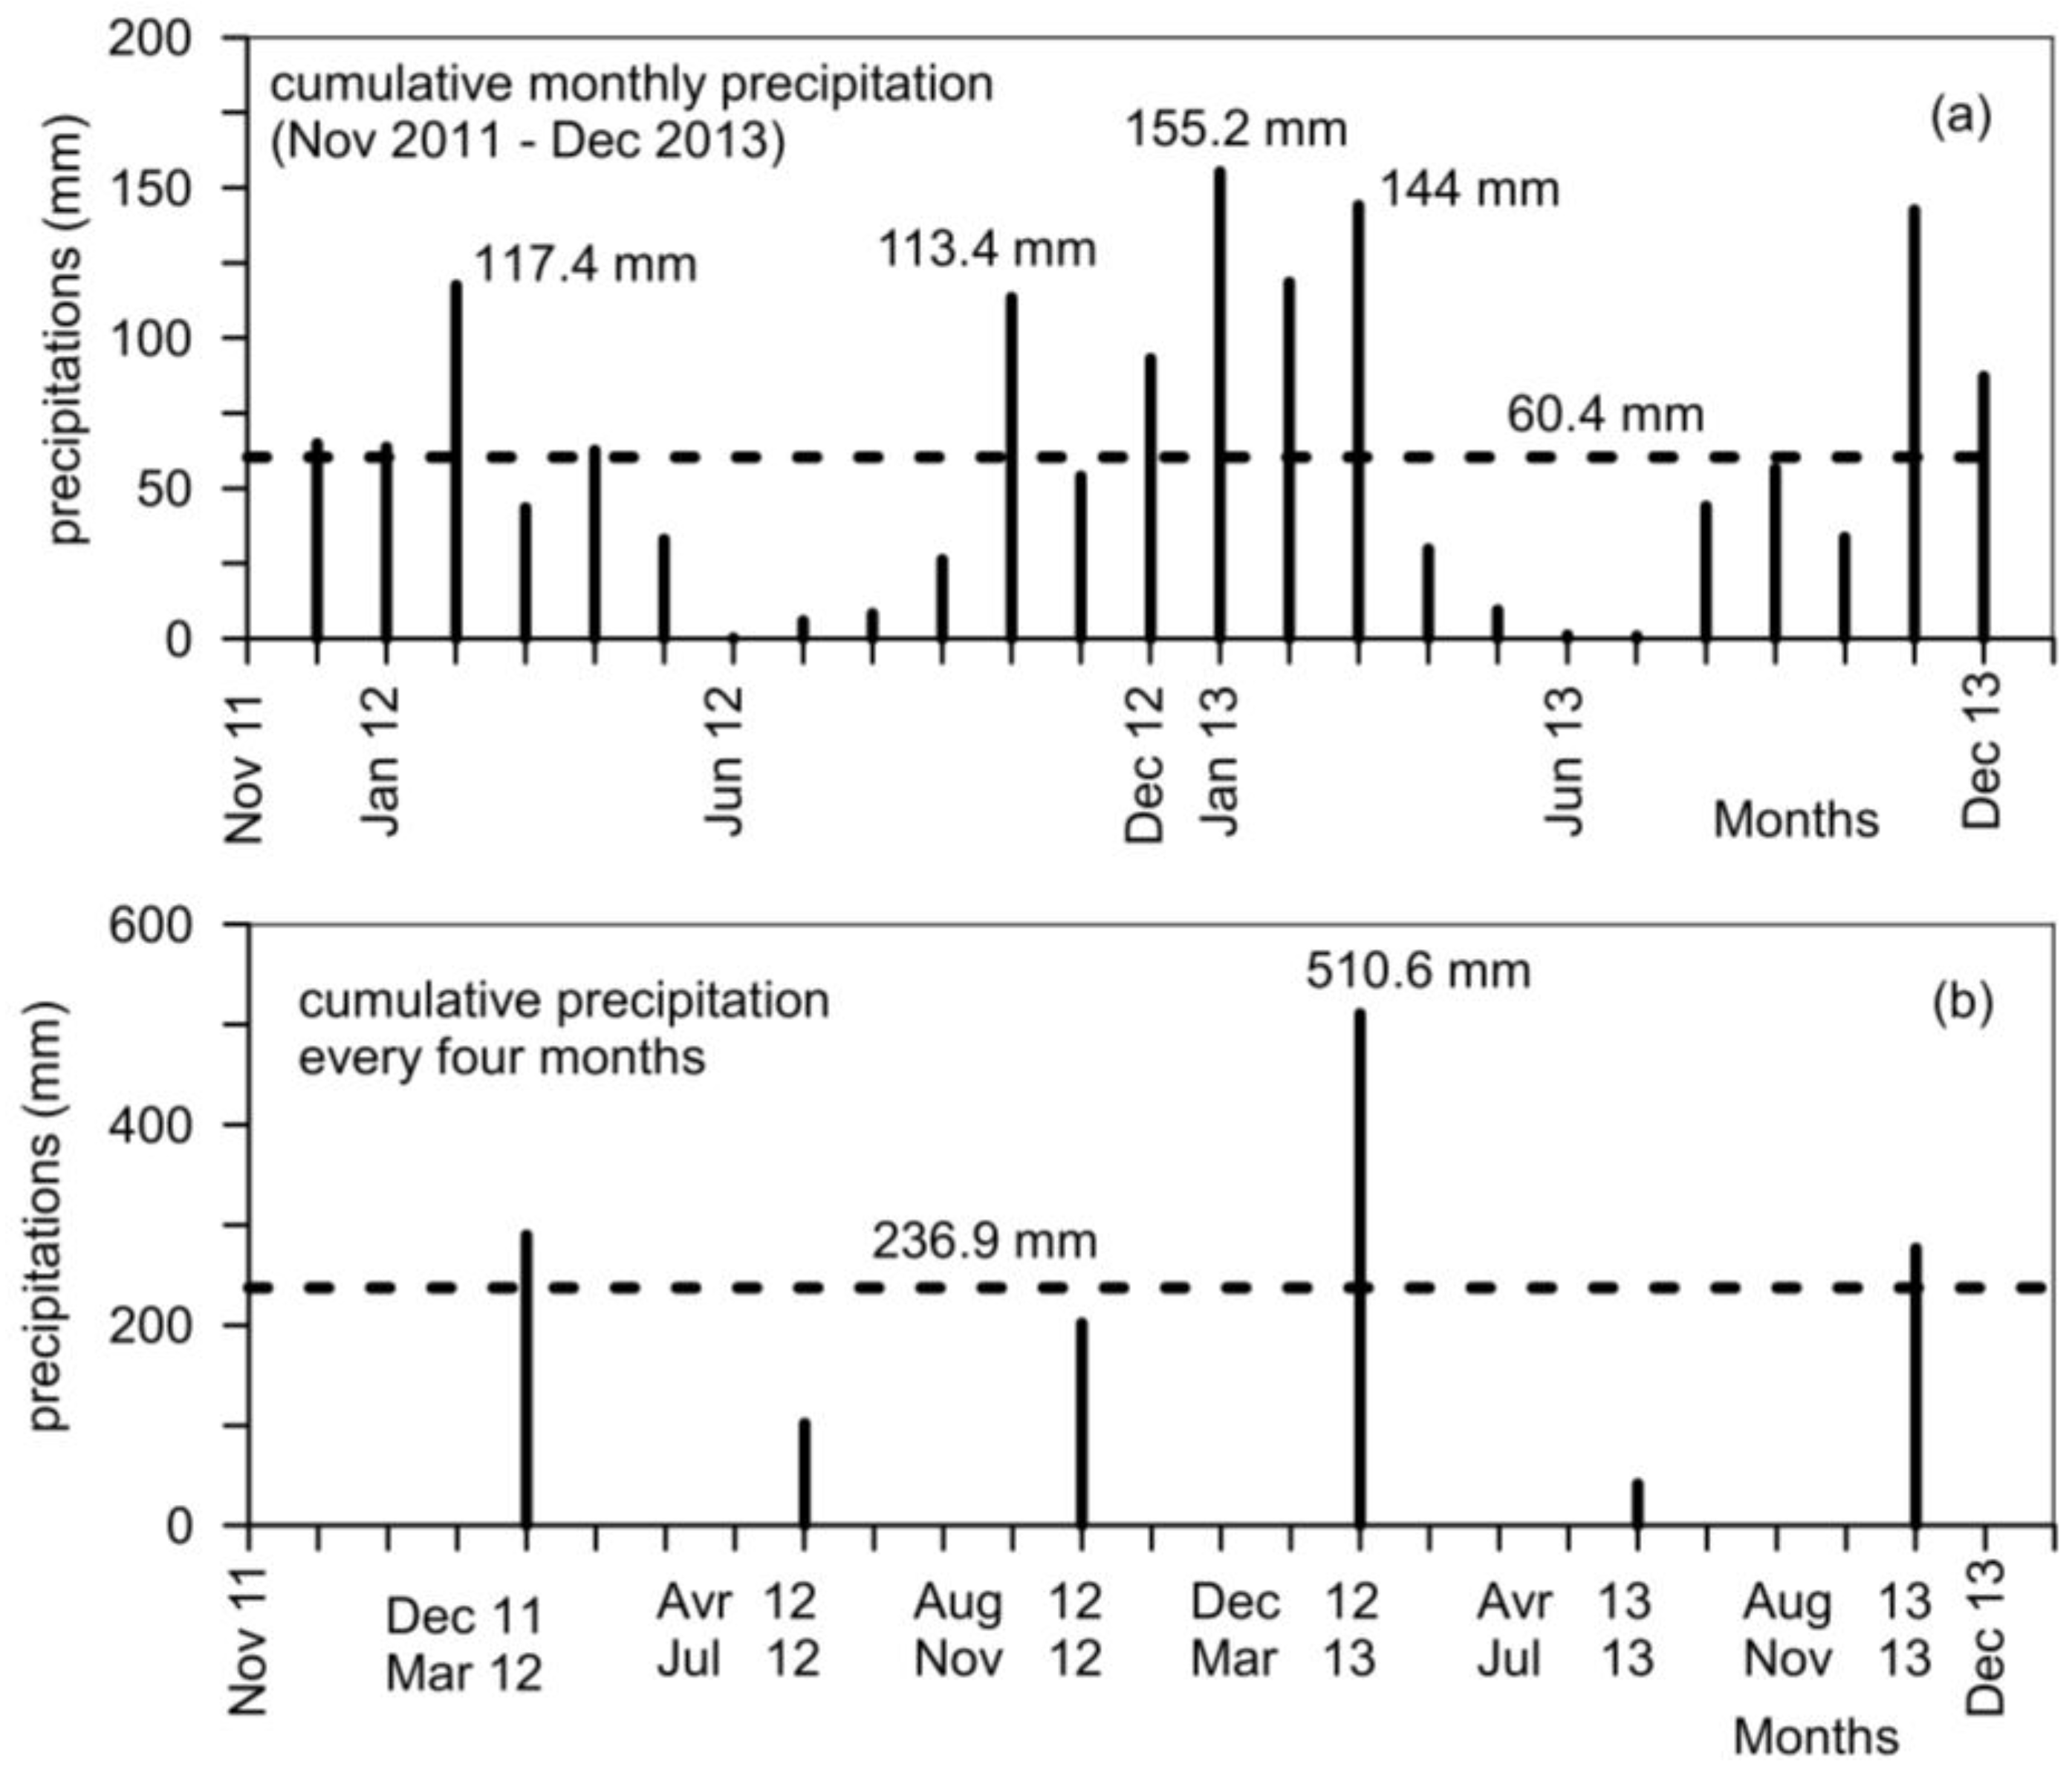
Figure 15 shows the cumulative monthly and four-month cumulative precipitation for the period from November 2011 to December 2013. During the autumn 2012 to winter 2013 seasons, a reactivation of the landslide occurred (
Figure 5). In this period, both monthly and four-month cumulative precipitation levels were significantly high, indicating that the landslide reactivation was associated with heavy rainfall.
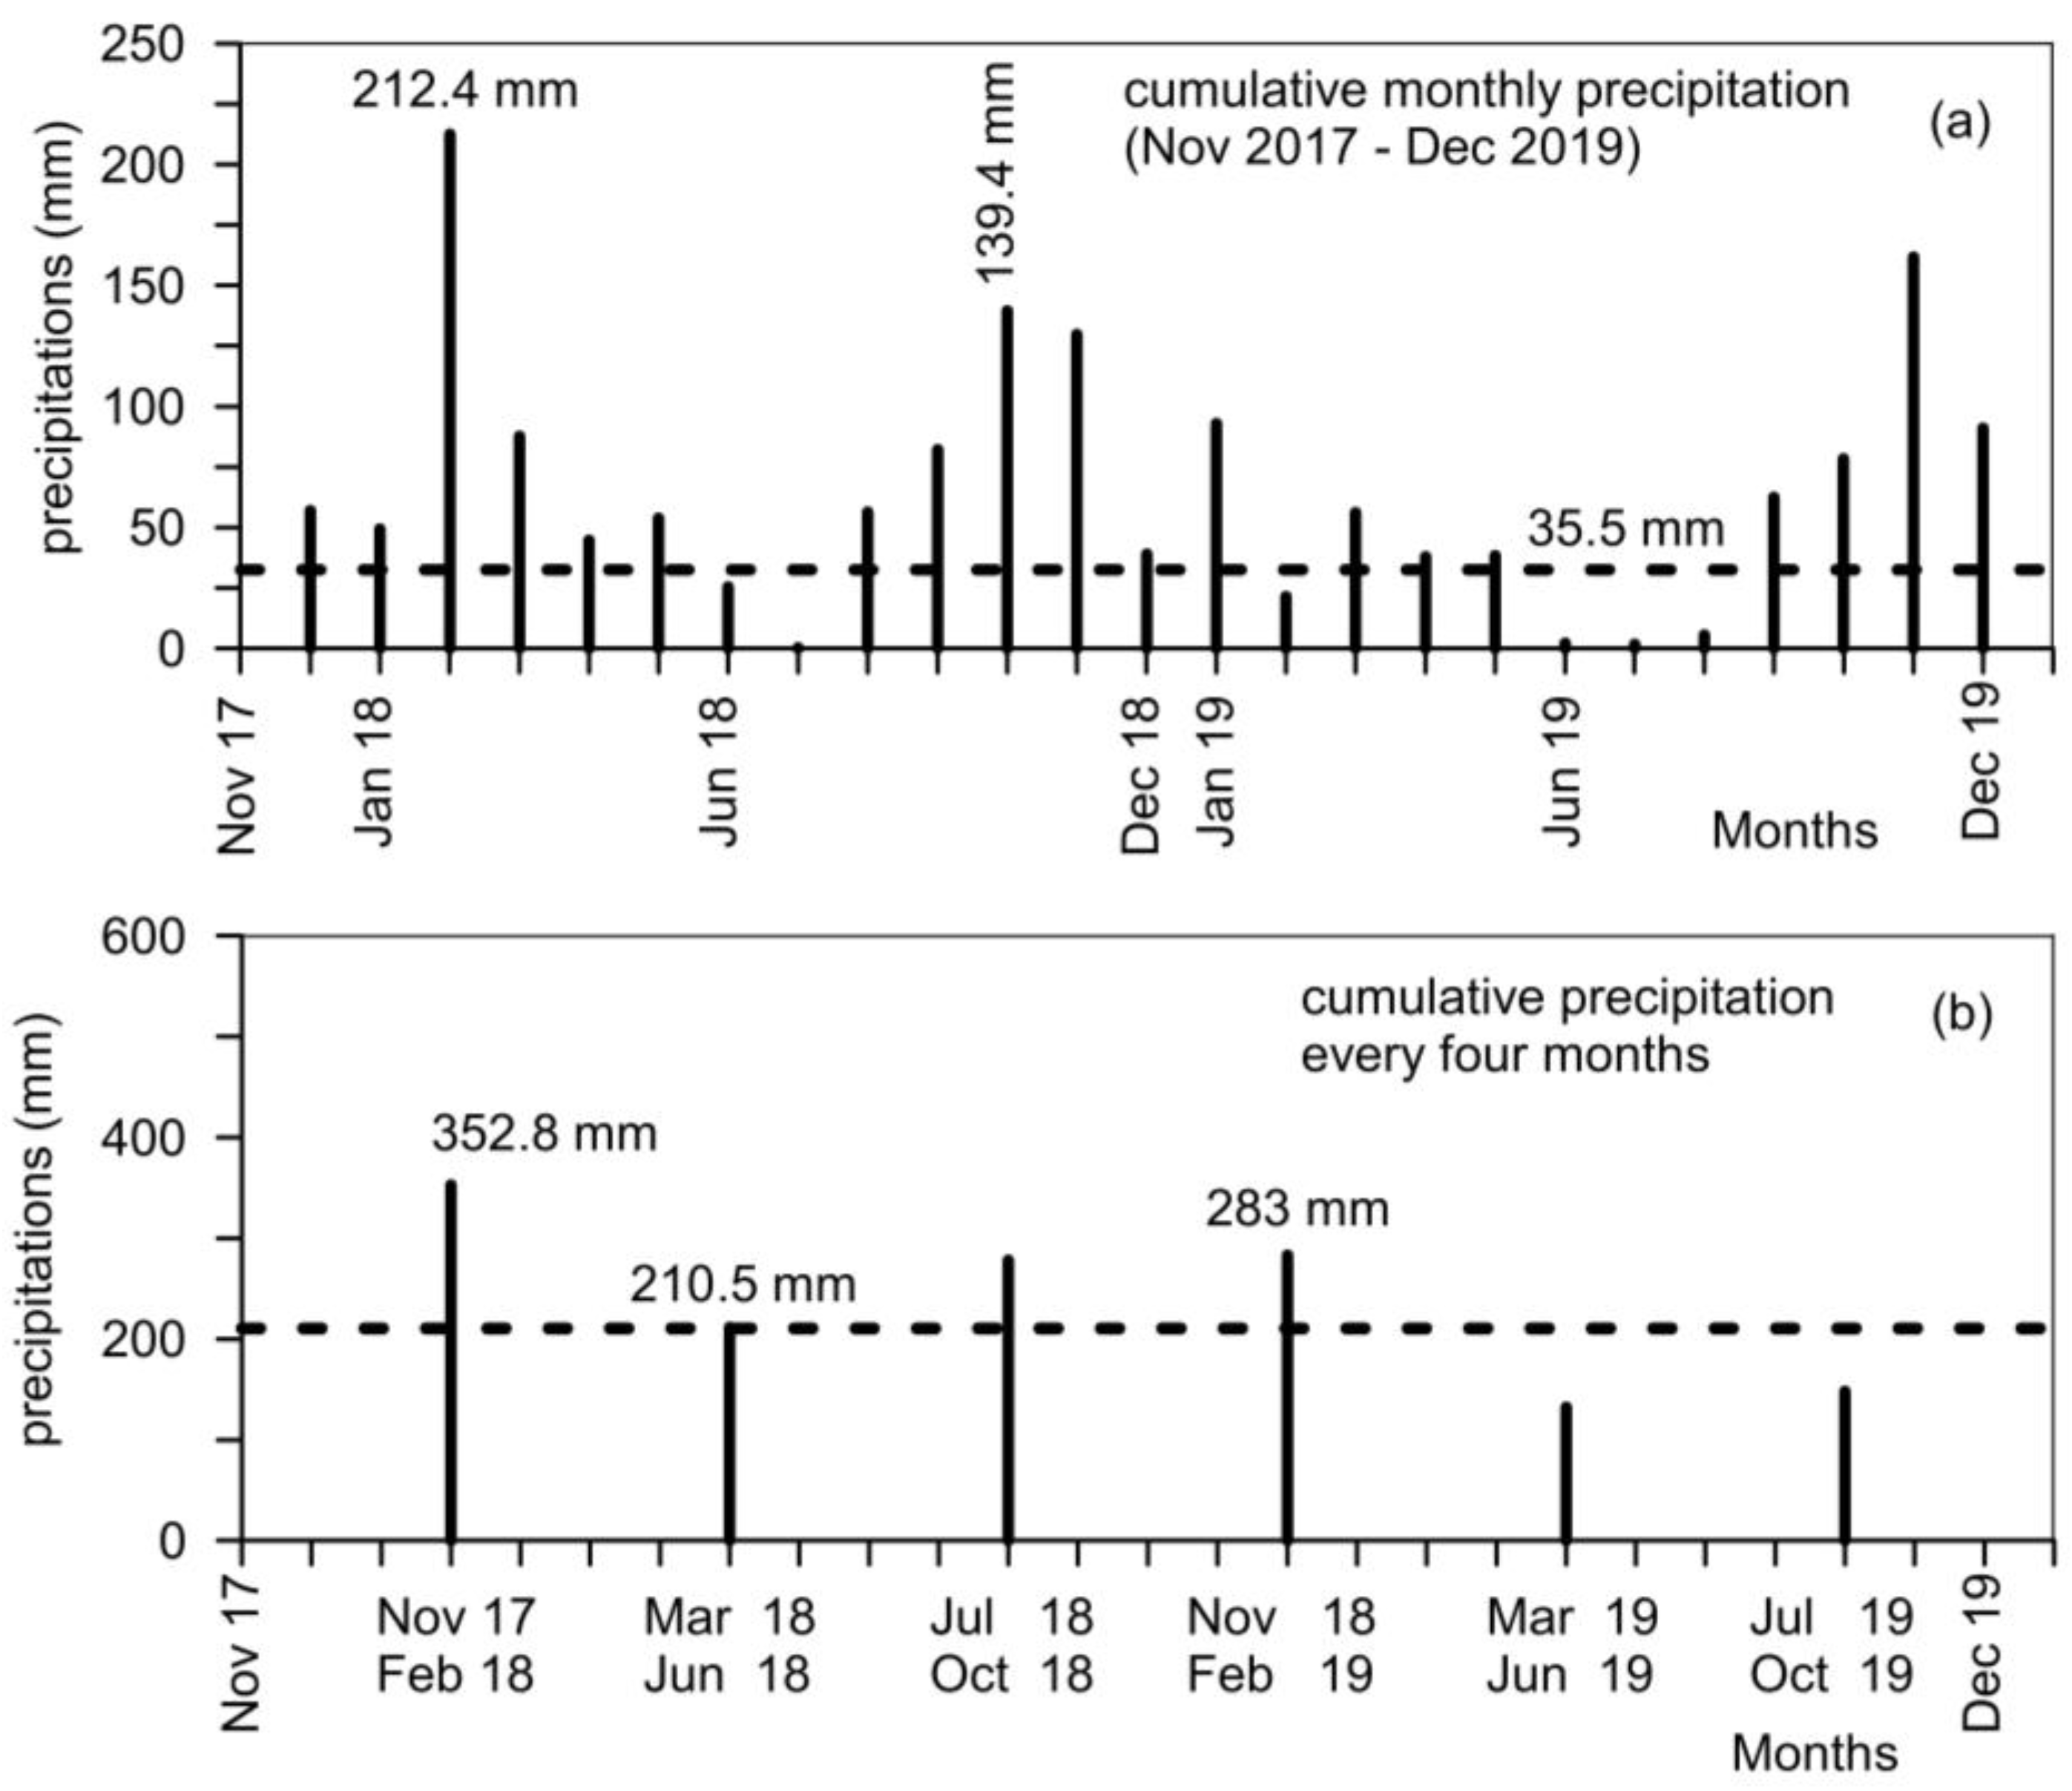
Figure 16 shows the cumulative monthly and four-month cumulative precipitation for the period from November 2017 to December 2019. Although both monthly and four-month cumulative precipitation levels were less intense than those reported in
Figure 14 and
Figure 15, significant displacements of the landslides were recorded, as indicated by inclinometer measurements (
Figure 12).
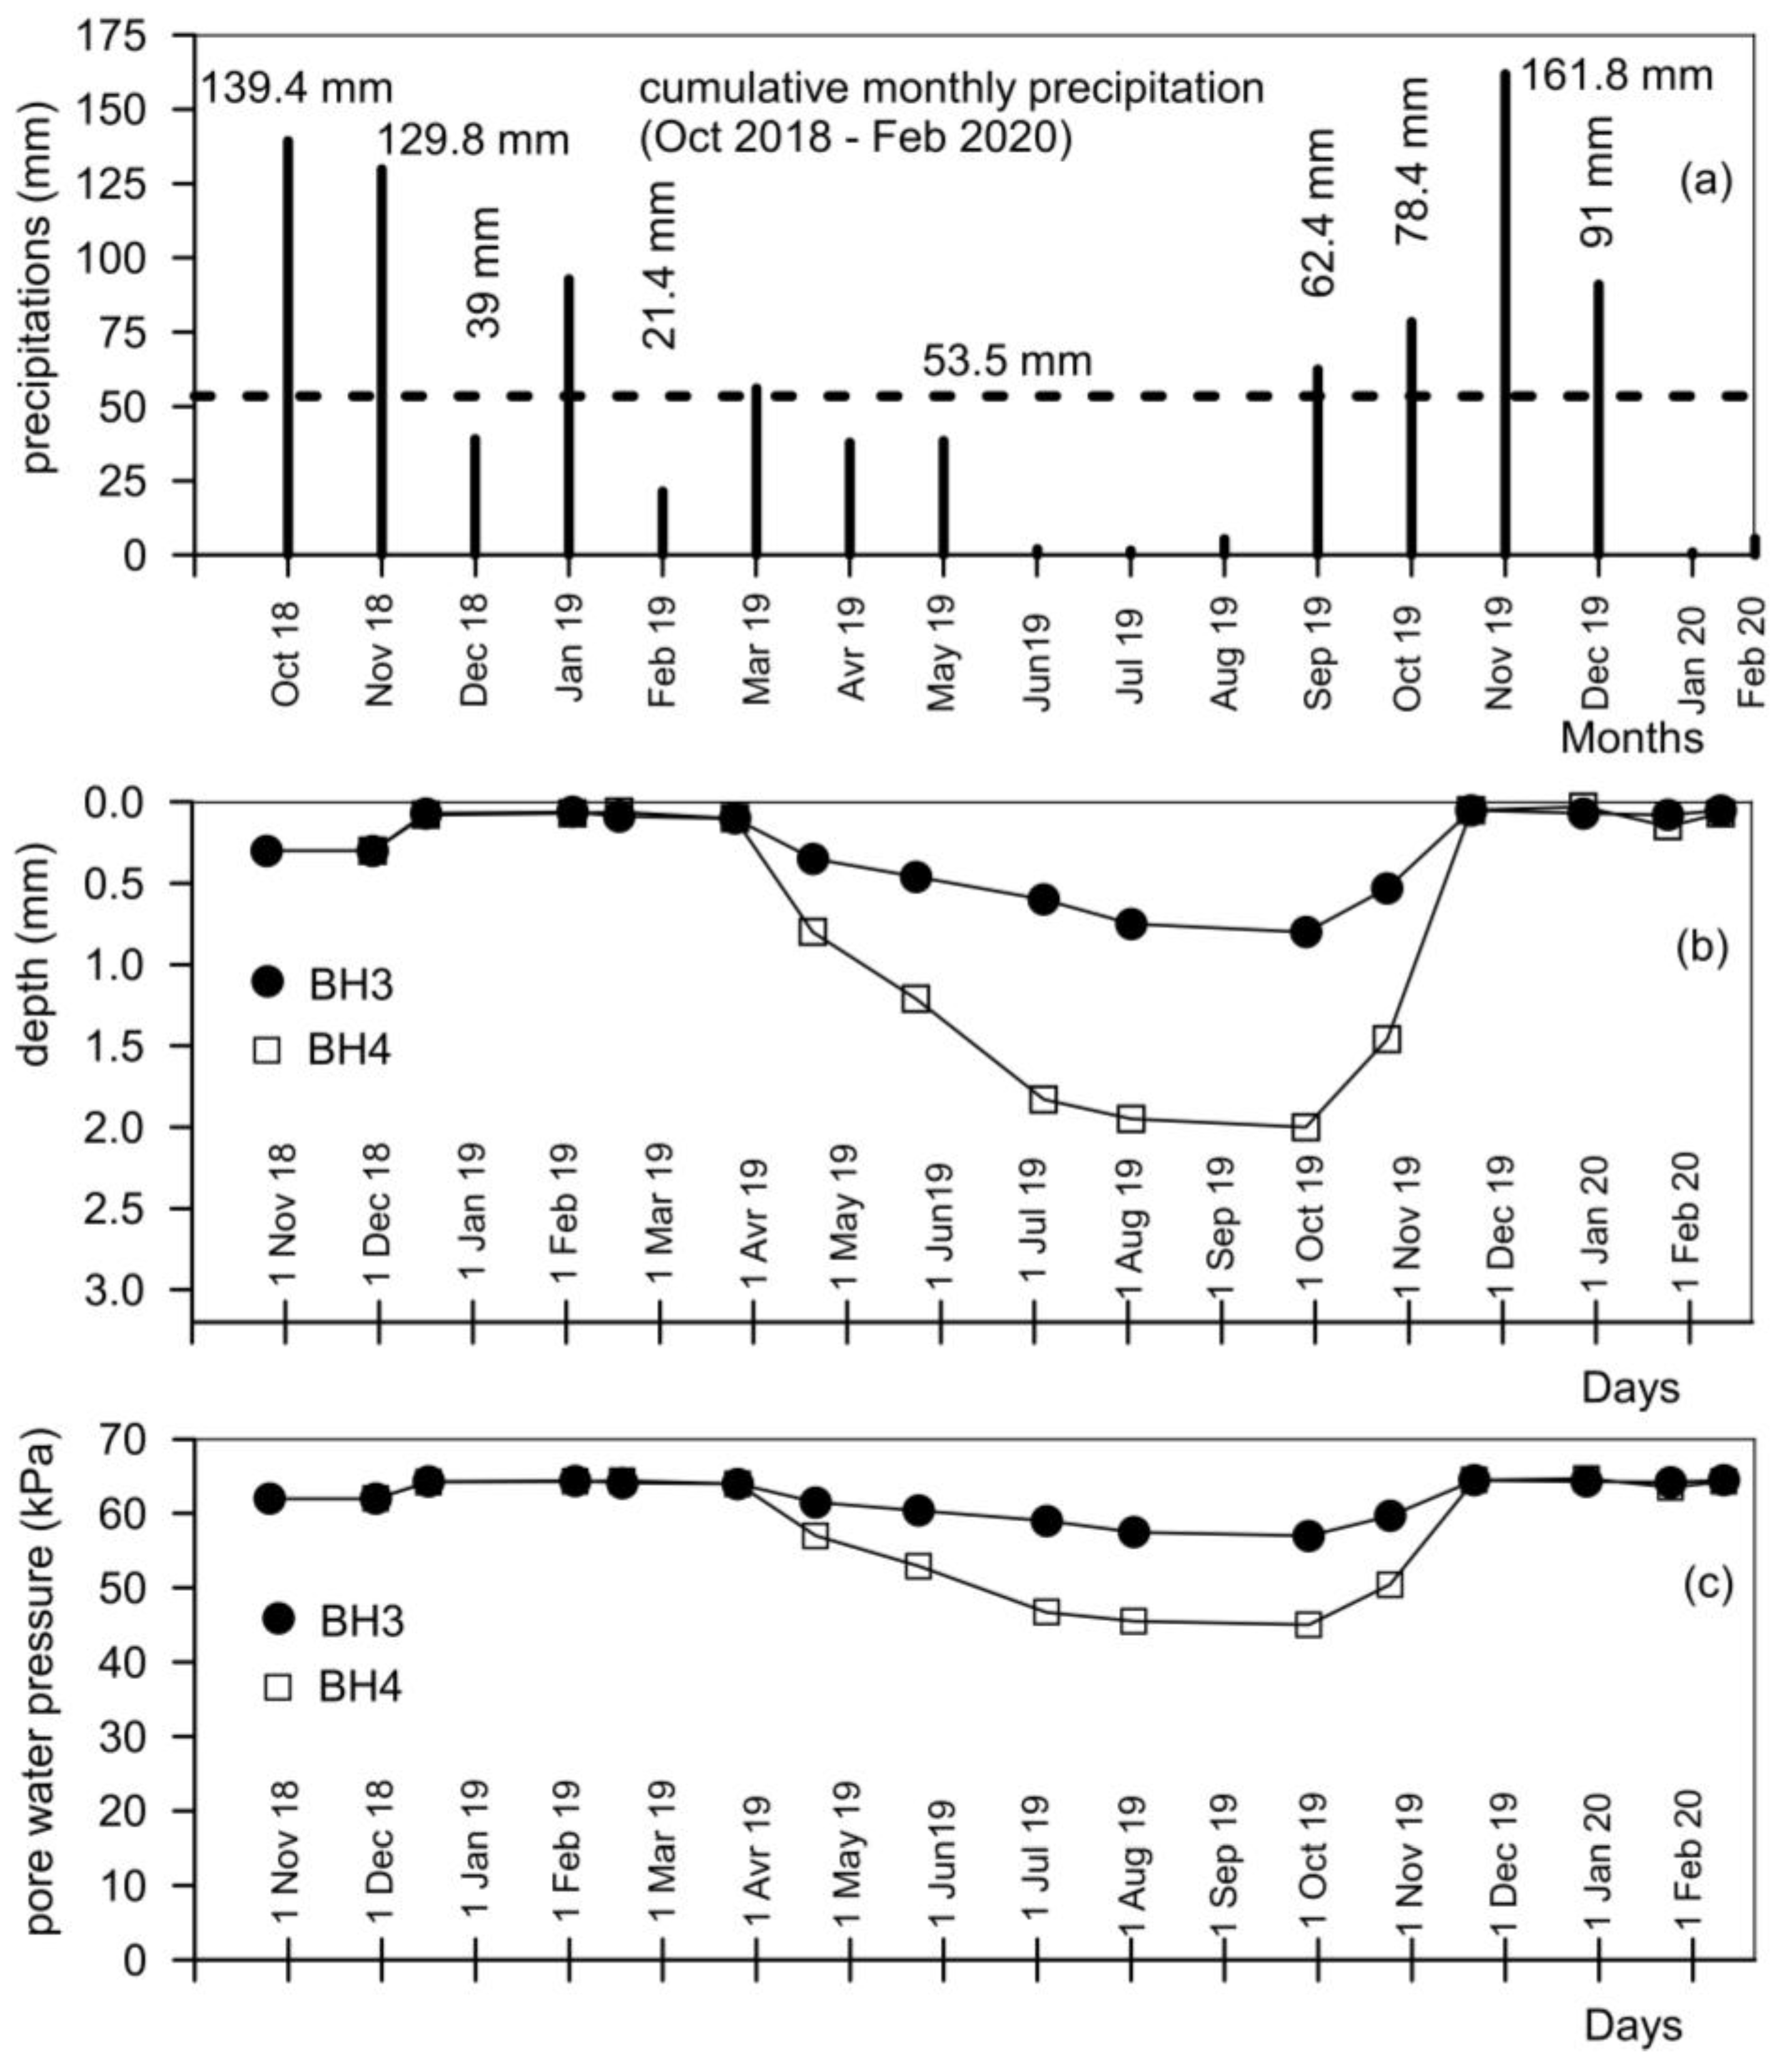
Figure 17 shows the cumulative monthly precipitation (
Figure 17a) and the corresponding piezometric measurements (
Figure 17b,c) recorded in piezometers BH3 and BH4 for the period from October 2018 to February 2020. During this time, both piezometric and inclinometric measurements were conducted.
As observed in
Figure 17, both piezometers BH3 and BH4 recorded very low water table depths from ground level and very high pore pressures on the sliding surface during the winter months, irrespective of monthly rainfall. In December 2018 and February 2019, for instance, the cumulative monthly precipitation was only 39 mm and 21.4 mm, respectively, significantly lower than the mean value of 53.5 mm and very far from the maximum value of 161.8 mm. During the same time interval, the depth of the water table from ground level was a few centimeters for both piezometers BH3 and BH4. Similar observations are applicable for January and February 2020. These data indicate that significant rainfall events are more closely related to cumulative precipitation over a period of 2 to 4 months. In fact, the water levels in the piezometers and the pore water pressures on the sliding surface remained unchanged from November 2018 to March 2019. Following the summer season, both the water levels in the piezometers and the pore water pressures on the sliding surface decreased. After two rainy months (September and October 2019), these levels increased again.
Notably, during January and February 2020, when no rainfall was recorded, the piezometric levels (
Figure 17b) and the corresponding pore water pressures (
Figure 17c) on the slip surface did not decrease. The data presented in
Figure 17 clearly demonstrate that once a landslide is triggered, its reactivations are directly dependent on the pore water pressures on the sliding surface, which are linked to cumulative rainfall over 2–4 months. Fluctuations in pore water pressures likely contributed to the triggering of the landslide, as they led to prolonged alteration processes in the ground and degradation of the shear strength of the soil’s properties [
17,
18,
19,
20].
Additionally, other factors may have included varying alteration processes and the presence of weak layers within the formation, which often play a crucial role in the stability of slopes and the overall geotechnical systems in which they exist [
21,
22,
23]. The displacement profile recorded in inclinometer BH2 (
Figure 12) and the in situ observations (
Figure 5 and
Figure 7) indicate that the soil mass behaves primarily as a rigid body sliding over the shear band identified in all the boreholes. The average displacement velocity from 24 October 2018, to 14 February 2019, is 1.1 mm/day, with a maximum velocity of 1.3 mm/day (recorded between 14 December 2018, and 30 January 2019) and a minimum of 0.8 mm/day (from 24 October to 27 November 2018). In the subsequent period from 14 February 2019, to 3 October 2019, the displacement velocity decreased to 0.15 mm/day. This displacement velocity is closely linked to variations (increases or decreases) in pore water pressures within the slope, particularly on the sliding surface. Consequently, the landslide can be classified as a reactivated translational slow landslide [
24,
25,
26].
5.2. Back-Analysis of the Landslide
Considering the geometry and soil composition of the slope, along with the results from in situ observations and measurements (including displacements and pore water pressures) and the mechanical parameters obtained from laboratory tests, a very simple model of the infinite slope with seepage motion under stationary conditions—where flow lines are parallel to the ground surface—can be effectively employed. For this basic model, the safety factor is defined as follows:
where
γ′ and
γsat are the submerged unit weight and saturated unit weight of the soils constituting the slope, respectively,
γw is the specific unit weight of the water,
zw is the depth of the ground water table from ground level,
H is the depth of the sliding surface measured from ground level,
φ′ is the angle of shear strength mobilized on the considered sliding surface, and α is the inclination on the horizontal of the slope.
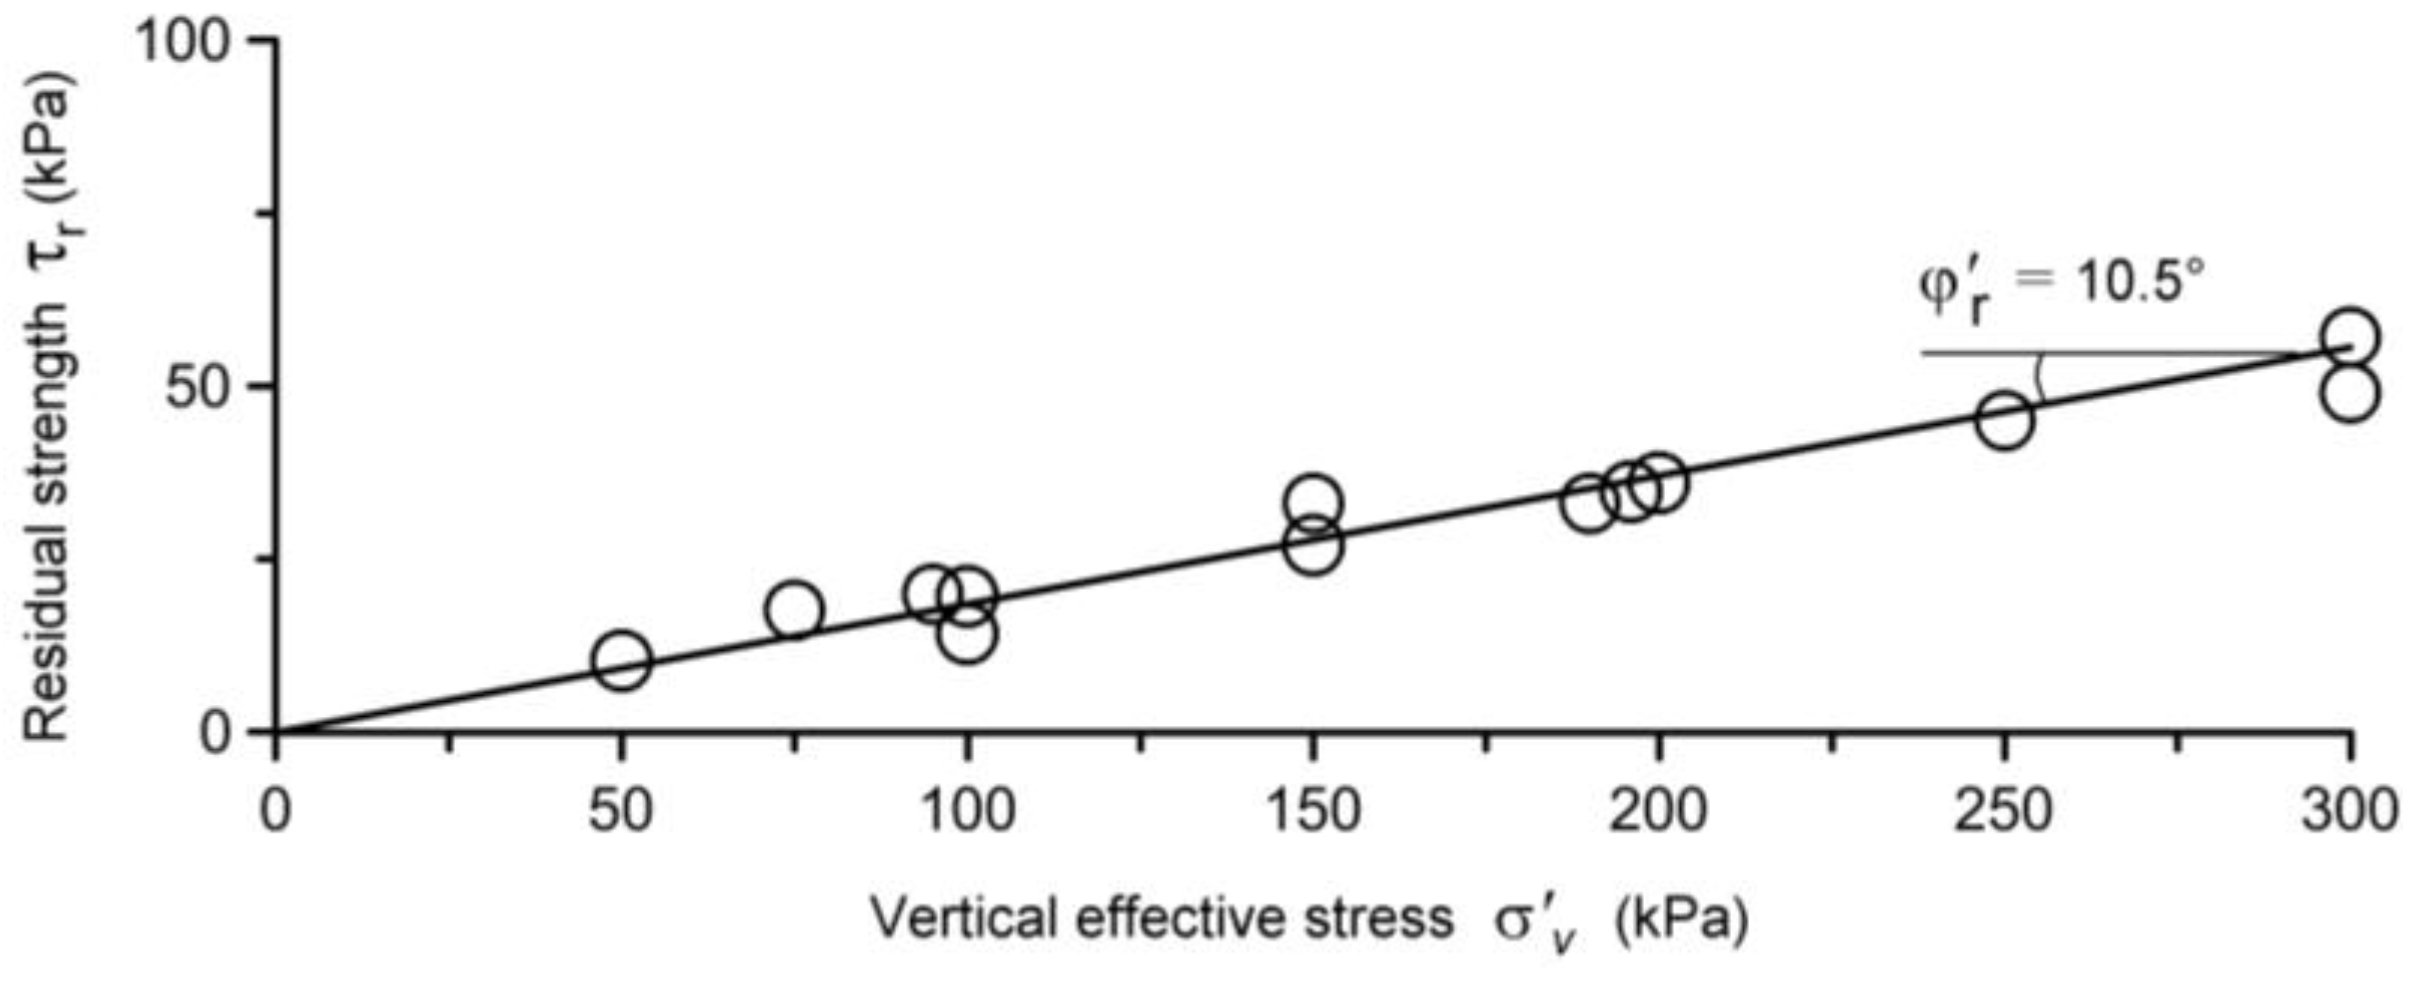
Given the observed displacements (averaging tens of metres), the shear strength is very close to the residual strength, characterized by zero cohesion intercept and a shear resistance angle φ′ equal to residual shear strength angle φ′r. For this purpose, it is worth highlighting that the residual shear strength parameters govern reactivated landslides, while peak shear strength parameters govern the stability of stable slopes or first-time landslides.
For
H = 6.5 m,
γsat = 20.5 kN/m
3, and
γw = 9.81 kN/m
3, the safety factor F equals 1 for the values of the depth of the water table
zw and the operative shear strength angle
φ′, as summarized in
Table 1.
For an operative shear strength angle
φ′ equal to the angle of residual shear strength
φ′
r =10.5° (as shown in
Figure 18), the safety factor is equal to 1 when
zw = 0.65 m. This result is consistent with the inclinometric and piezometric measurements.
Specifically, when the measured values of zw are very low (indicating high pore water pressures on the sliding surface during the autumn-winter season), the velocity of horizontal displacements recorded by the inclinometer increases. Conversely, when the values of zw increase (resulting in a reduction of pore water pressures on the sliding surface during the late spring-summer season), the rate of horizontal displacements decreases or approaches zero. These observations confirm that the mean mobilized shear strength on the sliding surface is very close to the residual shear strength.
Furthermore, the results from the simple model demonstrate that the reactivations of the landslide are primarily caused by high pore pressures present in the slope, particularly on the slip surface, for extended periods throughout the year, especially following cumulative rainfall over 2–4 months. This behavior is characteristic of landslides in fine clayey soils.
6. Design of Stabilization Works
Considering the causes of the landslide, their planimetric extension, the inclination of the slope, the geometry and depth of the sliding surface, the fine-grained soils involved, and the significant displacements that the ground has undergone, the most effective interventions focus on permanently reducing pore water pressures on the sliding surface, as suggested by Terzaghi (1950) [
27] and reported in many other studies [
28,
29,
30,
31,
32,
33,
34,
35,
36,
37,
38].
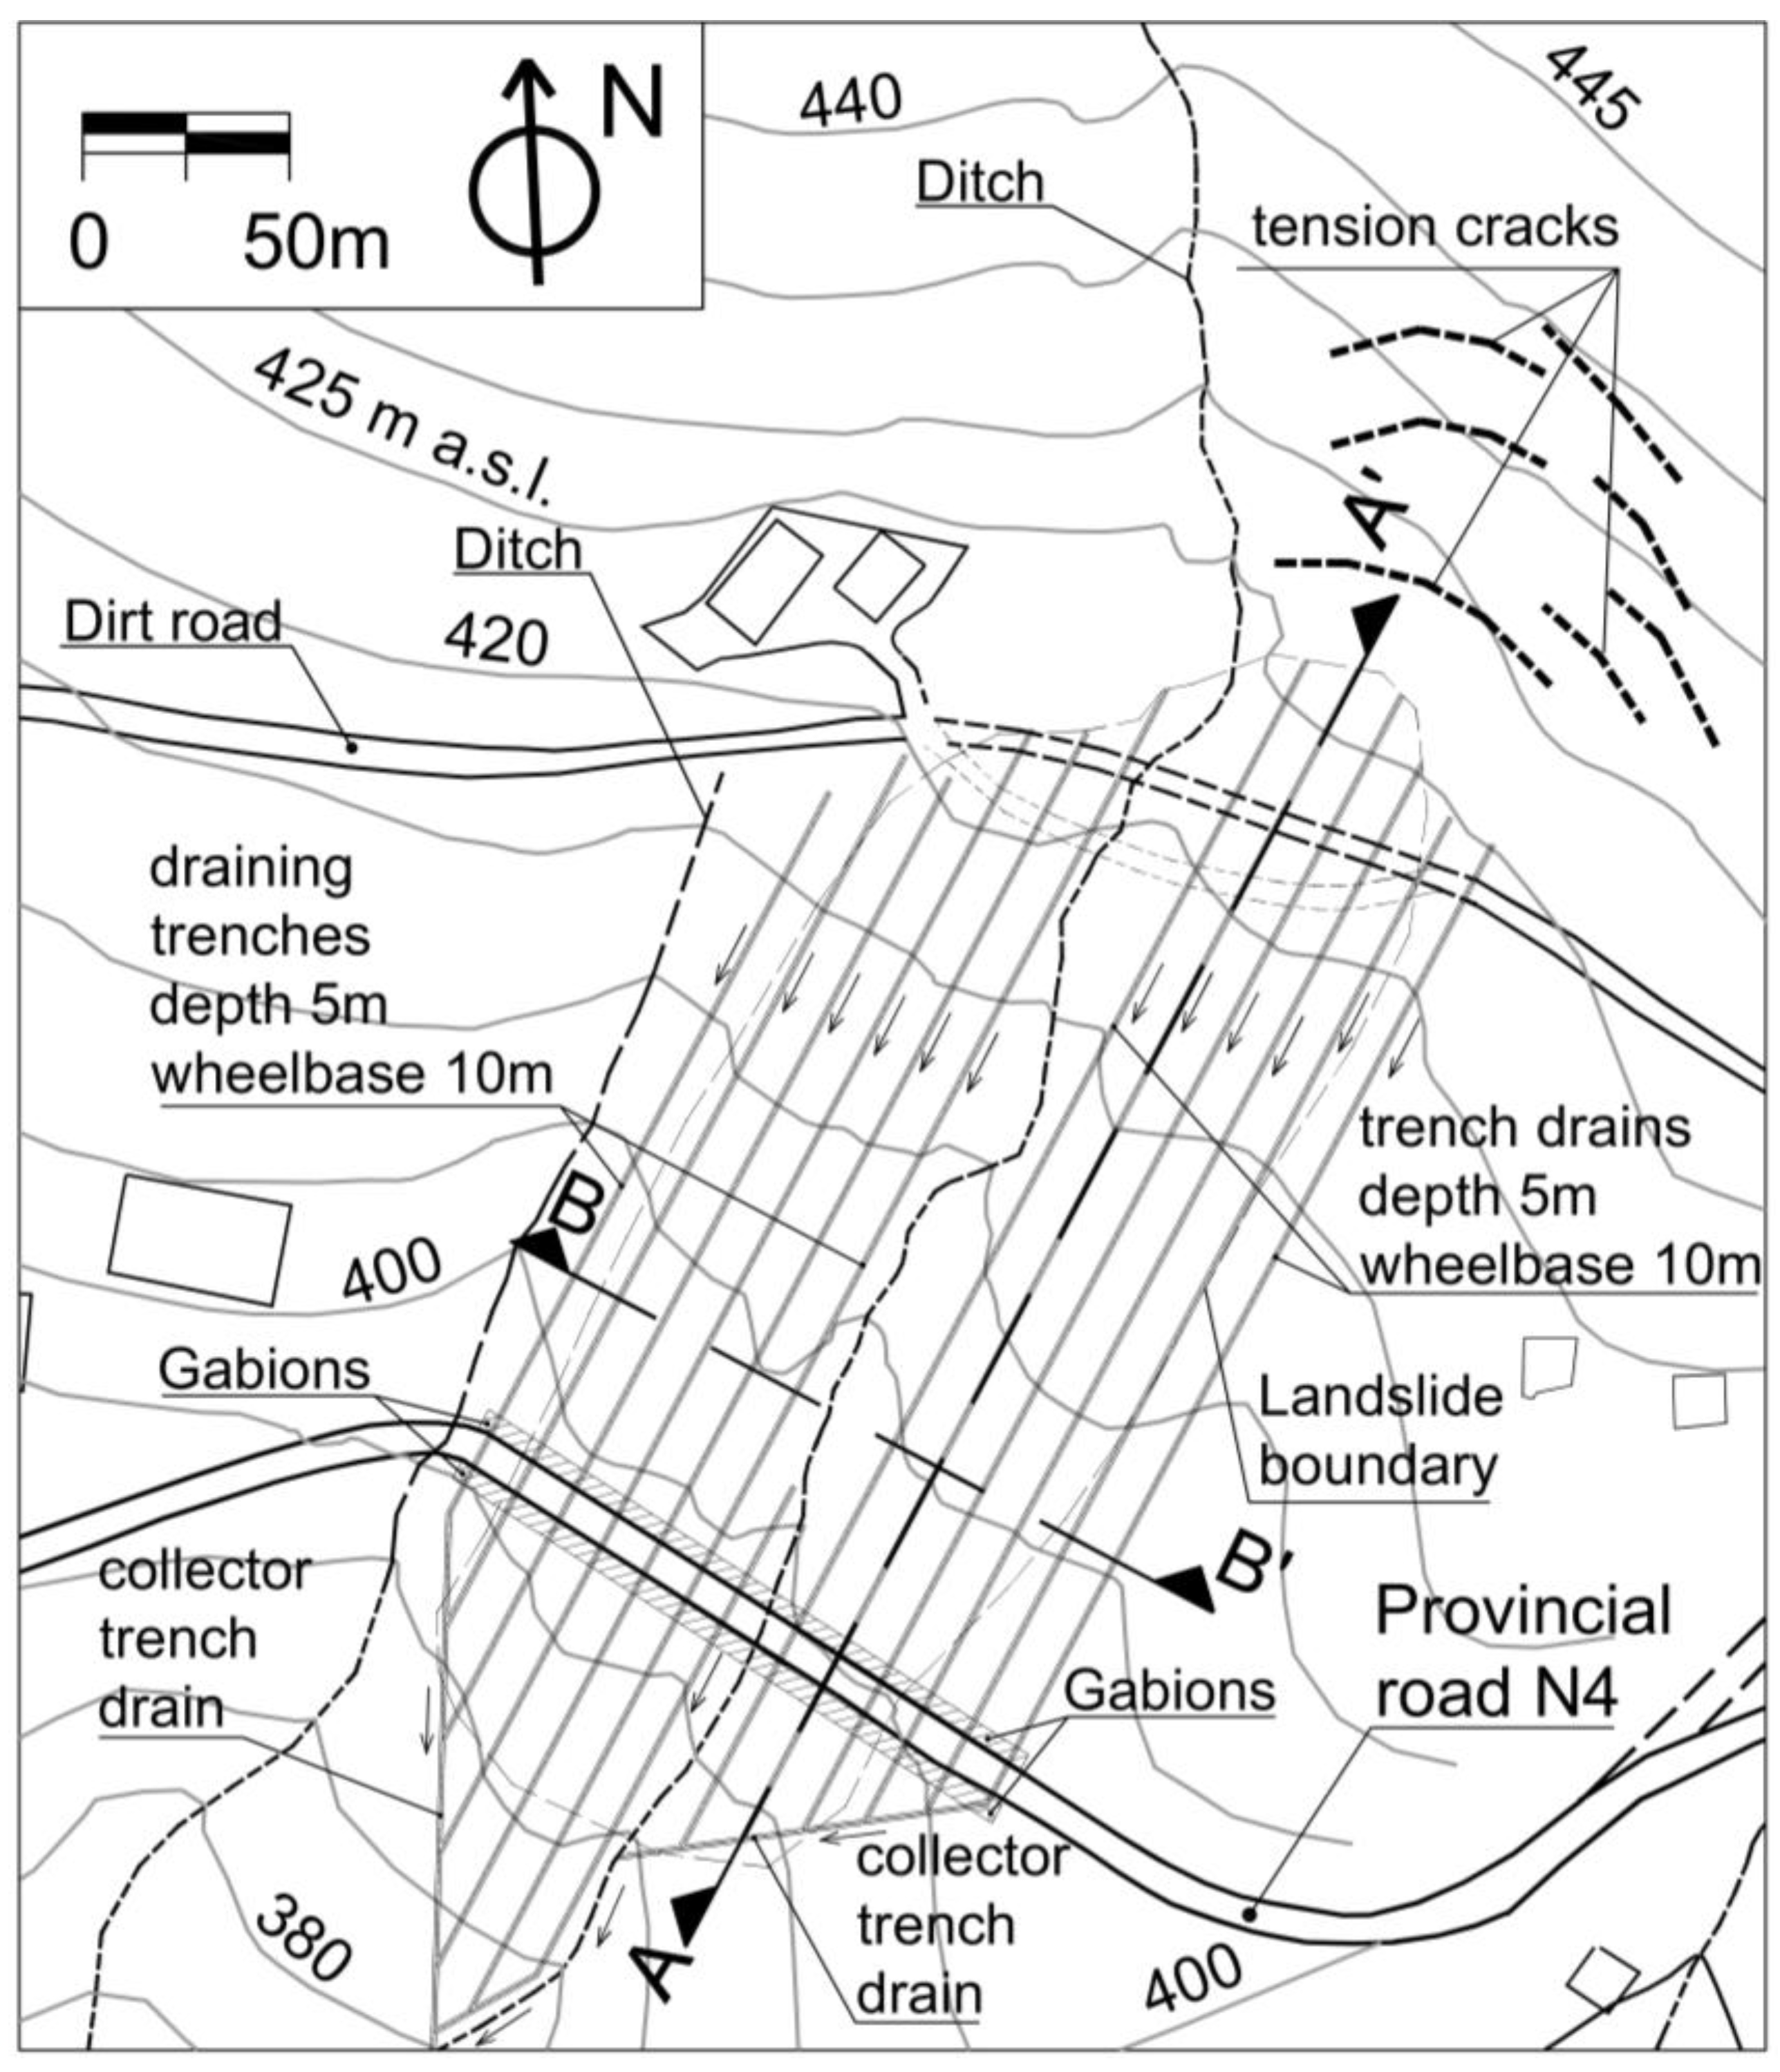
The optimal geometric arrangement for the trench drains is parallel to the direction of the maximum inclination of the slope. The reduction of interstitial pressures for the geometry of the landslide can be effectively achieved by using simple shallow drainage trenches, as illustrated in
Figure 19. The road embankment is designed between two rows of containment gabions, which are flexible and draining structures capable of supporting large displacements without losing functionality.
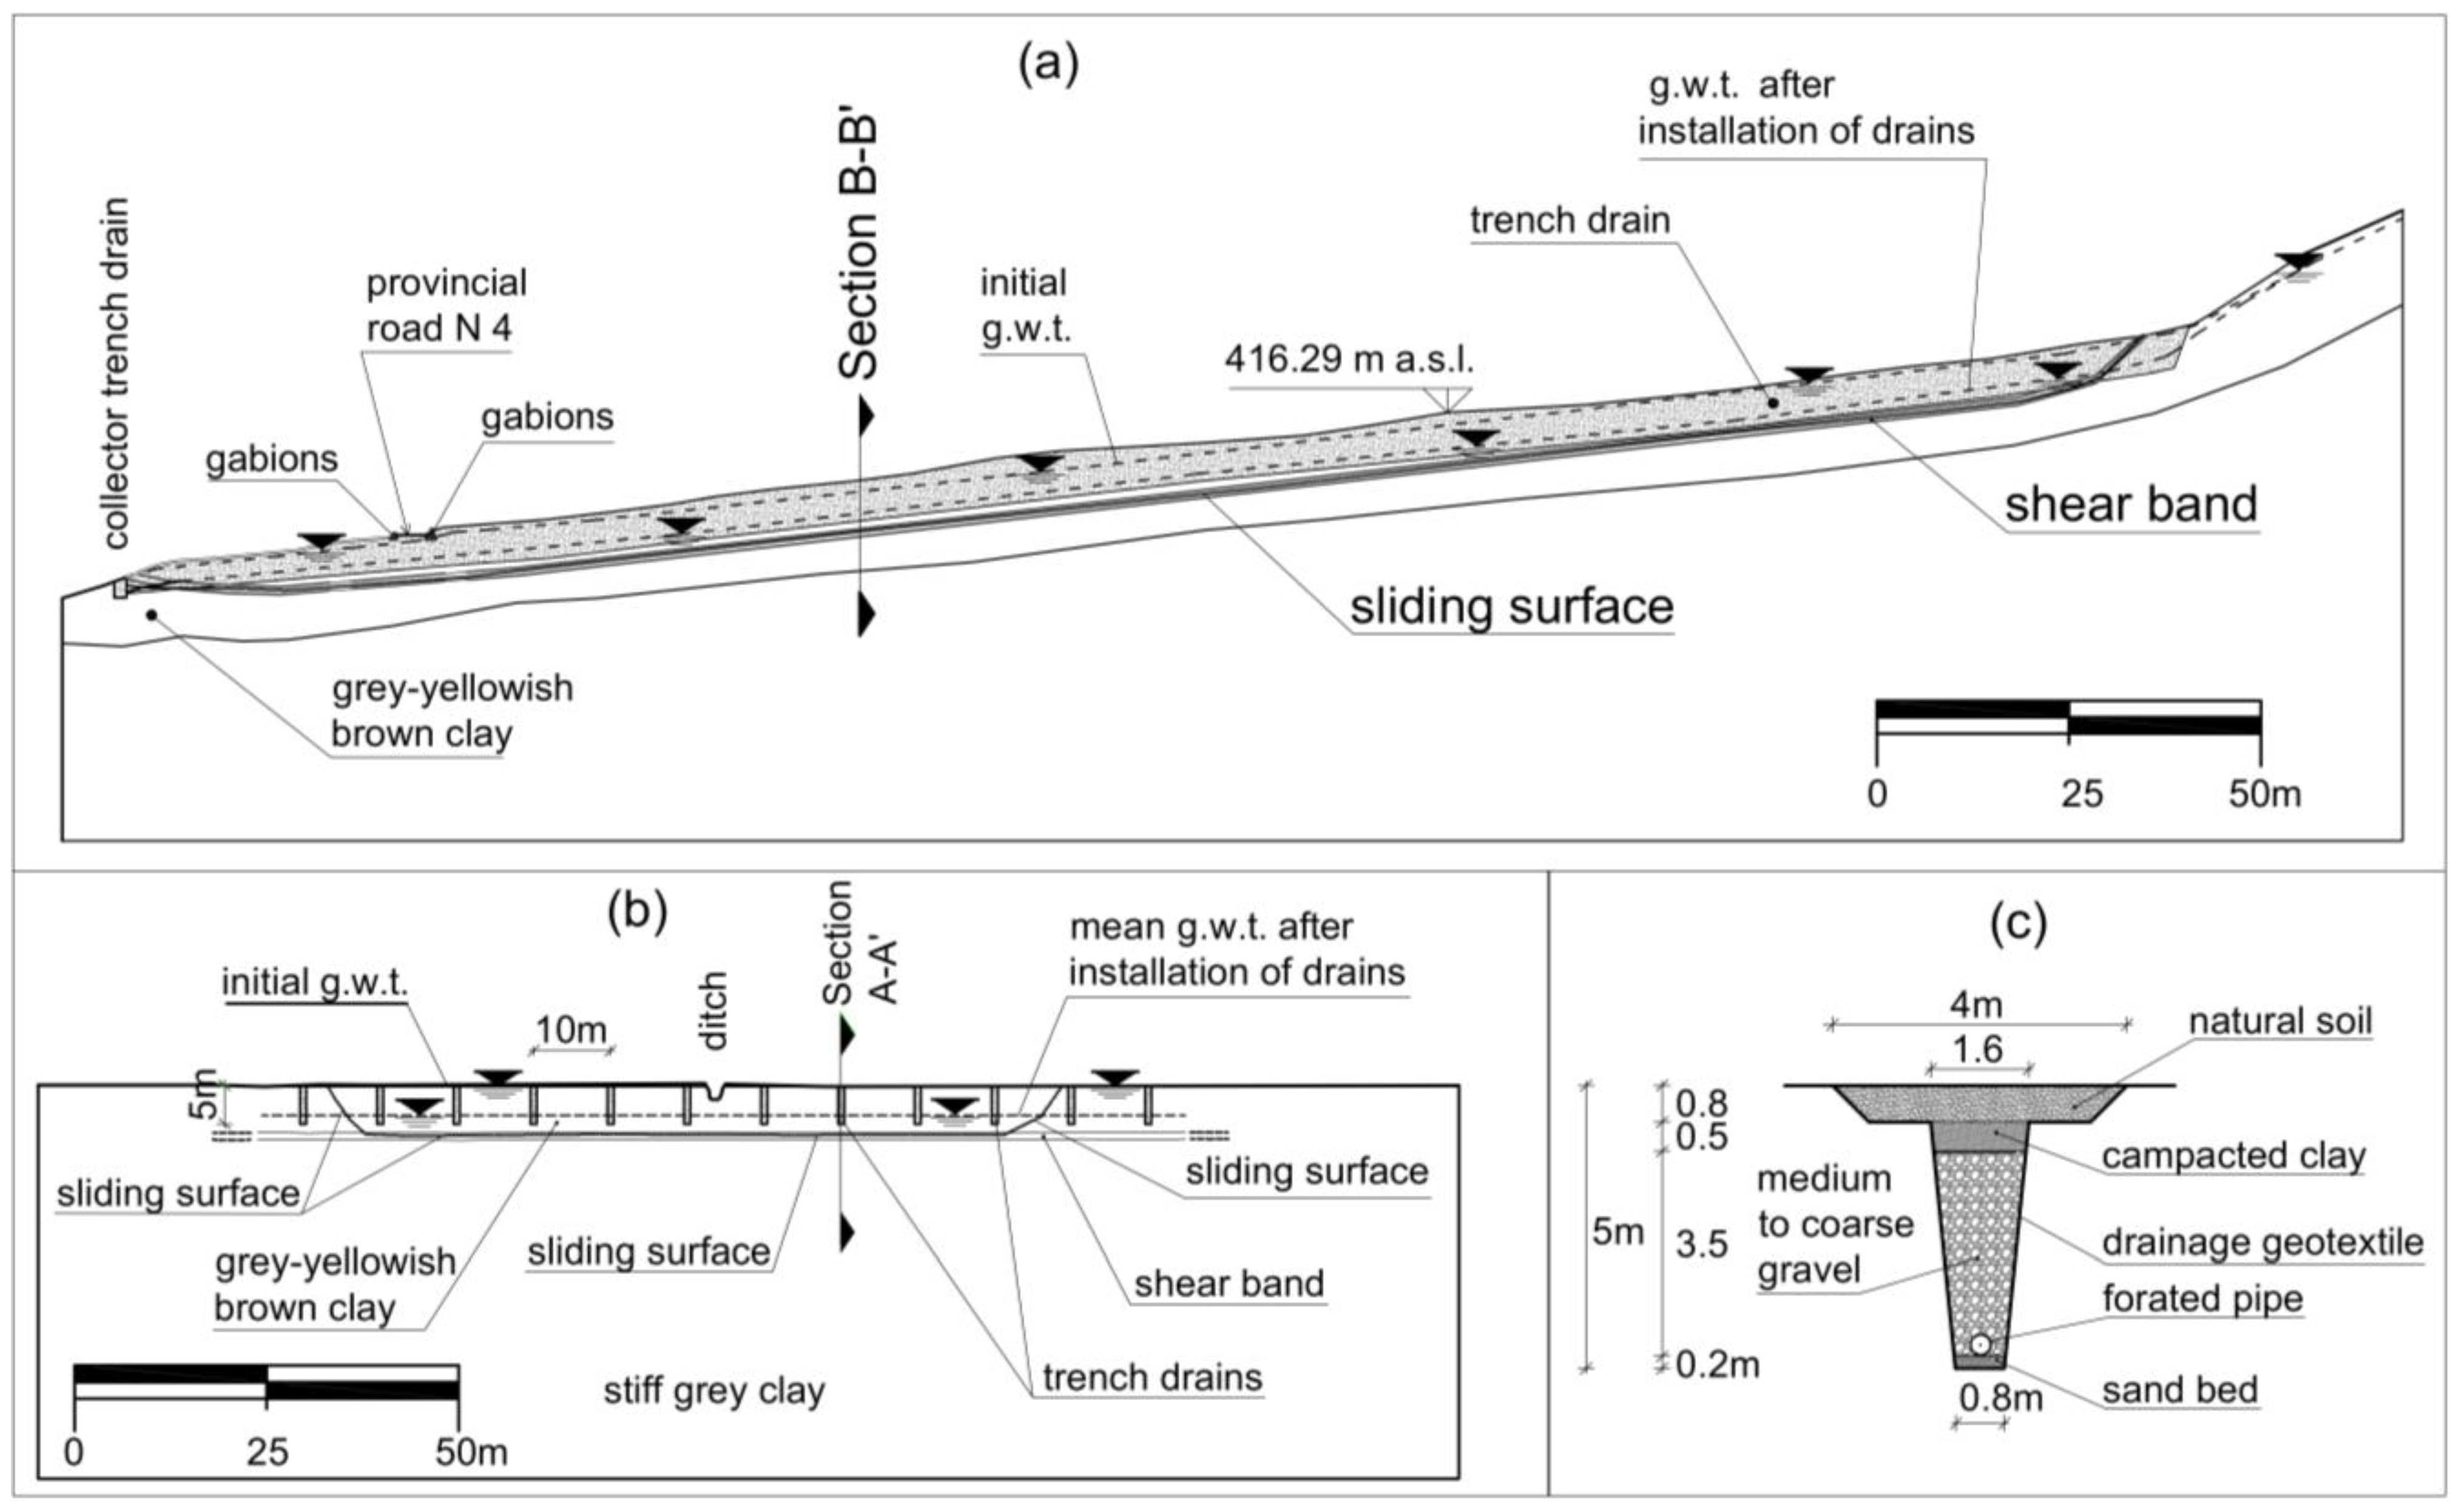
The drainage trenches are 5 m deep, with a spacing of 10 m between them. The longitudinal and transverse vertical cross-sections A-A′ and B-B’ are depicted in
Figure 20a,b, respectively.
Figure 20c provides details of the transverse cross-section of the drainage trench. The draining material, consisting of medium to coarse gravel, is wrapped in a draining geotextile that acts as a filter to protect the underlying soils from internal erosion, prevent clogging of the trench material, and ensure the long-term effectiveness of the draining system. Additionally, a layer of compacted clay with very low hydraulic conductivity must be placed on-site to prevent infiltration from the ground surface. The drained water within each trench drain is conveyed through a perforated pipe into a collector trench drain, which discharges directly into a natural ditch and subsequently into the Corleone stream.
The long-term effectiveness of the trenches and the evolution of pore water pressure reduction have been evaluated by using finite element method (FEM) calculations with the 2D Plaxis code [
39]. A median vertical transverse cross-section has been utilised, as shown in
Figure 21. In this section, the ditch has been considered as a boundary condition for the water table, with the water table consistently coinciding with the bottom of the ditch. This assumption is conservative, as there is typically no water present in the ditch.
The initial groundwater table at time
t = 0 has been assumed to coincide with the ground level (
Figure 21a). Hydraulic conductivity
K for both the weathered grey-yellowish-brown soils and the soils of the shear band has been assumed to be 5 × 10
−9 m/s. Laboratory oedometer tests have shown values of
K ranging from 5 × 10
−8 to 10
−9 m/s, depending on the effective vertical stress
σ′
v (
K reduces as
σ′
v increases). Given the very low mean effective stress levels present in the soils influenced by the flow, the value of
K = 5 × 10
−9 m/s has been adopted for the analysis.
The results presented in
Figure 21 indicate that, after one year of implementing the draining trenches, the groundwater table is, on average, approximately 3 m below the ground level (
Figure 21b). After two years, the groundwater table reaches a configuration that is very close to a steady state (
Figure 21c,d).
Considering that recharge due to precipitation certainly occurs throughout the year, along with the delay associated with the low permeability of the soils and the continuous effectiveness of the trenches, a mean value for the depth of the water table can be estimated to range between 2 and 3 m.
After the realization of the draining trenches, the problem is 3D. Considering a cross-section on which, on average, the same very simple model of infinite slope used for the back-analysis is applied, and for the sake of safety, assuming the operative shear strength angle on the sliding surface to be constant (neglecting the increase in shear strength due to the sliding surface partially intersecting the gravel of the trenches) and equal to the residual shear strength angle of the clayey soils of the shear band (
φ′ =
φ′
r = 10.5°), and always for a depth of the sliding surface
H = 6.5 m, the values of the safety factor F, reported in
Table 2, are obtained depending on the depth of the piezometric level below the ground surface.
The values of the safety factor are quite adequate, considering they have been derived from the residual shear strength of the weathered clays within the shear band.
Currently, due to insufficient funding, only the section of the trenches that crosses the road embankment (approximately 20 m in length), along with the associated drains for directing water from the draining trenches into the natural ditch and the gabions, was constructed (in 2021), as shown in
Figure 22. Four years after their implementation, the performance of these interventions is satisfactory and demonstrates, though not entirely, the effectiveness of pore water pressure reduction (drainage) on slope stability.
7. Conclusions
The paper presents a case study on the interaction between a significant provincial road (Provincial Road N4) and a landslide in overconsolidated clays, occurring near an important town in Sicily. The landslide was triggered during the autumn of 2004 to the winter of 2005 due to the deterioration of the strength parameters of the clayey soils in the shear band and the very high interstitial pressures linked to rainfall.
Over the period from 2004 to 2021, the landslide experienced several remobilizations, leading to temporary road closures and ongoing repairs to maintain the carriageway under precarious conditions. These disruptions caused considerable inconvenience for the local population and adversely affected commercial, healthcare, tourism, and agricultural activities.
Due to insufficient funding, the adopted solution involved maintaining and adapting the road embankment through continuous filling, without adequately addressing the underlying causes of the landslide. In 2018, a study that facilitated the reconstruction of the landslide kinematics, determined the depth of the sliding surface, and identified the most effective corrective measures, including a system of superficial drainage trenches was conducted. This approach represents a straightforward and cost-effective solution.
In 2021, due to limited funding, only the section of the trenches crossing the road embankment and the two rows of gabions, which also represent a drainage system and confine the road embankment, were implemented. Despite this partial realization of the planned works, the slope’s performance has been, overall, satisfactory. In the four years following the completion of the partial works, during which the rainfall regime was similar to that of previous years, no signs of significant movement were recorded on the road platform, which is sufficiently rigid and thus serves as an excellent indicator of any potential deformation. This demonstrates the effectiveness of partial but sufficient pore water pressure reduction (drainage) on slope stability. For the definitive assessment of the effectiveness of the drainage system, after the completion of the works, a monitoring system will be installed, consisting of piezometers, inclinometers, tensiometers, and topographic markers.
Ultimately, the case study underscores the critical importance of identifying the causes of instabilities to effectively address geotechnical issues. It also illustrates how the application of fundamental geotechnical principles can significantly enhance the management of infrastructure and land, yielding substantial benefits for society.


