1. Introduction
Recent years have brought great developments of technologies related to the space sector. For decades, satellite technologies were the main technical branch used in day-to-day applications (navigation, communication, etc.), bringing commercial profits and the involvement of the private industry sector.
Interest in space technologies increased when the paradigm of technical development of space exploration technologies changed, enabling the private sector to become a player in this technology development, enabling for rise of a new market, which is called New Space [
1,
2]. In addition, the ongoing Artemis mission, whose goal is the permanent presence of humans on the Moon, brings even more interest and need in the development of technologies for space exploration.
One of the great challenges to achieve the goals of the Artemis mission is to enable repeatable lading and starts on the lunar surface, which requires specific technical and civil engineering infrastructure, ultimately requiring infrastructure for short- and long-term human presence. Bringing that idea to life requires implementing In Situ Resource Utilization (ISRU), which means that as much material as possible for the development of the infrastructure should be extracted and processed where the infrastructure is about to be built. When talking about the development of infrastructure on the Moon, the lunar regolith is expected to be the first local material for extraction and processing. This comes from the common presence of the regolith (lunar soil) on the surface of the Moon and its promising technological value. In its raw form, it can be used as a building material for berms, shield erecting, etc. With some additional processes, it can be simply compacted, allowing the same to develop preliminary construction sites. Pre-processed regolith can be used as a construction material for lunar brick production [
3] and as a source material for additive manufacturing technologies [
4]. After more advanced processing, lunar regolith will be a promising source of oxygen and water (especially if mixed with lunar ice).
To avoid difficult and expensive experimental testing of the lunar regolith as a bulk material in mineral processing, the best alternative is to run analytical and/or numerical simulations, considering environmental conditions like lunar gravity, lack of atmosphere (resulting in a significant drop in heat exchange but, in the same way, increasing electrostatic phenomena) as well as temperatures ranging from around 120 °C during solar days up to around −130 °C during solar nights or even −240 °C at the bottom of craters in permanently shadowed regions.
However, the Moon itself is not homogenous when talking about its surface, and the lunar regolith is different with respect to the mineral/chemical composition as well as the granulometric composition. The main division of the regolith is made for Mare and Highland. Lunar Mare is a regolith representing the crater areas visible as a darker surface. The main mineral of this regolith is basalt. The Lunar Highland is the regolith present in the lighter color of the Moon and is composed mainly of anorthosite.
For terrestrial testing, many types of regolith simulants were developed in order to mimic chemical, geotechnical, or mechanical properties. The simulants were developed mainly based on the investigation of the samples collected during the Apollo mission [
5]. This raises the question of the parameters as an input for analytical and numerical calculations and validation.
In this study, the testing procedure, with an automated visual procedure, for the determination of the dynamic angle of repose is presented. The seven types of regolith simulants of different mineral and granulometric compositions were tested. Eventually, the description with respect to the qualitative behavior (character of the motion state) and corresponding to it quantitative measure is given by the angle.
This determined set of dynamic angles of repose is a self-standing dataset for any analytical and numerical simulations and validation procedures.
2. Geotechnical Testing
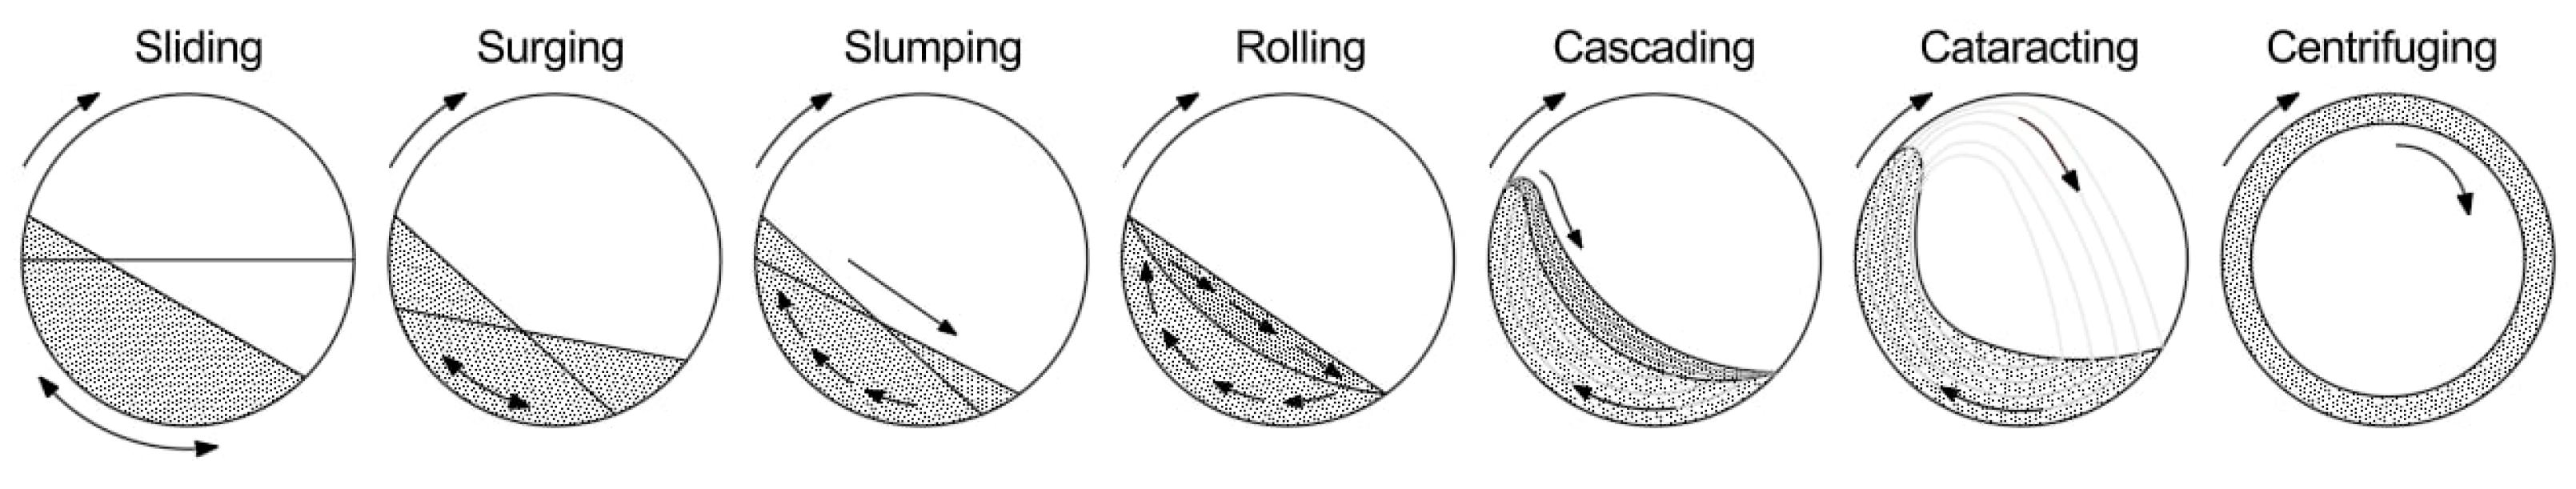
The dynamic angle of repose is a measure of the angle of pitch of the rolling material relative to the stationary surface. As presented in
Figure 1, the material flow can stabilize as a specific state, changing mostly due to rotational speed, if the remaining parameters like surface roughness and the investigated material remain unchanged.
The dynamic angle of repose characterizes higher values of the angle when compared to the static angle of repose, which is a measure of the angle of the pile created by the material free flow on a stationary surface. As the name suggests, the dynamic angle of repose is used for the calculation and calibration of the dynamic processes of transportation, mixing, milling, etc.
2.1. Testing Method Selection and Description of the Developed Test Rig
The most used method for identifying the dynamic angle of repose involves conducting laboratory tests using a simple setup consisting of a motor coupled with a drum, measuring system (visual) and powder sample. The most frequently used measurement system is a high-resolution camera positioned coaxially with the drum axis of rotation, which records the entire process. The image resolution must be sufficiently high to capture the process in detail and accurately distinguish the material’s shape. In this case, it is necessary to design and erect a laboratory setup followed by the selection and application of an appropriate methodology for identifying the dynamic angle of repose.
One of the approaches to measure the dynamic angle of repose is real-time kinematics analysis of the granular material. The most commonly used methods for real-time analysis are as follows: PIV (Particle Image Velocimetry) and PTV (Particle Tracking Velocimetry). PTV is one of the oldest measuring techniques in fluid mechanics. It is an indistinguishable method from PIV, with one main difference: PTV is focused on tracking the displacement of a small group of particles [
7]. Originally, PTV was a special method in PIV, which later evolved into an individual method [
8]. Both methods share a common methodological principle in tracking particles and involve capturing a series of images at short, consistent time intervals, which are subsequently subjected to detailed analysis. Therefore, both methods are non-intrusive; they are optical measurement techniques that do not require the use of any probes that could disturb material flow. The difference between PTV and PIV is in the method of recording the analysis. Particle Image Velocimetry (PIV) is based on the cross-correlation analysis of the areas of interest, which are called the “interrogation area”. These are small finite regions of the investigated picture, which are assessed separately, and it is assumed that the particle movement in a particular area is fairly consistent [
9]. PIV allows for the determination of instantaneous velocity vectors and particle motion trajectories and facilitates particle tracking. This technique not only allows for the measurement of the dynamic angle of repose but also supports the optimization of operating conditions for a drum tailored to specific technological processes [
10]. In the PTV method, the particles are identified and tracked individually to attempt to locate them in the following frame. The determination of particle displacement relies on the spatial information of its surrounding neighborhood. The accuracy of these measurements depends on the appropriate camera resolution and speed of moving particles. If the velocity is too high, the tracked particle may move beyond the image frame. Additionally, in regions with steep velocity gradients, the deformation of particle neighborhoods may become too significant, making it difficult to identify correspondences [
9].
Another approach is DIP (Digital Image Processing) of the images captured, where the angle stabilizes in one of the possible states shown in
Figure 1. In this study, it is not required to analyze the real-time granular flow in which the PTV and PIV methods would be used. Instead, DIP (Digital Image Processing) provides a much more efficient approach. As Xiao Yan Liu et al. [
11] presented, the image processing hardware system consists of a video camera, an image sampling unit responsible for converting the analog video signal into a digital format, and a computer for data analysis and processing. This approach does not require a camera with extremely high resolution nor frames per second; the choice can be made based on the price. In this method, the motion of solid particles is recorded using a camera and subsequently processed through thresholding for image segmentation. To ensure a smooth representation of the bed surface boundary, morphological processing is applied. Based on the morphologically processed image, the bed surface edge is detected by scanning the bed area from top to bottom and identifying the boundary points where pixel values transition from zero to one. Given the known slope of the detected boundary line, the repose angle is determined as the arctangent of the slope. This image processing sequence is repeated for each captured frame [
11].
Ammar Mohammed Alshammari et al. [
12] proposed a methodology in which the angle of the sloping surface is a proxy for the critical state friction angle. The algorithm uses the Radon Transform and is implemented in a sequence of steps. After all input parameters required for calculation are summarized, including particle-specific gravity, mass and internal volume, a special cylinder binary mask is declared, which is required to isolate the regions of interest. The masking step is implemented to accurately determine the inner diameter of the cylinder. Subsequently, the obtained image is split into three grayscale images represented by the intensity of each color channel, ranging between 0 and 255 pixels. The algorithm computes the sum of pixel values for each color channel to identify the most effective one. This selection is based on the premise that a specific color channel may provide superior contrast between the material and the background compared to others. Then, the best-performing channel is binarized using a threshold. The noises appearing in the image can be filtered before performing the slope calculation with Rodon Transform.
Studies conducted by Boateng and Barr [
13,
14] focused on cross-sectional flow in a drum during the rotation process. They discussed the behavior of granular temperature, flowing thickness, and solid concentration between the flowing layer and plug flow for different materials and conducted a comprehensive survey in a partially filled rotating cylinder. In order to capture the dynamics of granular flow, the measurement techniques described before were used [
15]. Hsien-Ter Chou et al. [
15] showed that the rolling stage is characterized by the steady-state circulation between the two layers: lower plug layer, similar to the solid, and the upper flowing layer, fluid one. Based on mass conservation law, they reported a solution with a parabolic profile to solve the fluidized layer. Although these velocity profiles are not identical, they indicate that velocity variations are influenced by material properties, particle shape, volume filling, drum geometry, and surface characteristics. Additionally, other flow parameters, such as the dynamic angle of repose, the thickness of the flowing layer, and velocity distributions, were analyzed under partially filled conditions. The results show that the dynamic angle of repose increases with volume filling in the flowing layer [
15].
Skoczkowska [
10,
16] described that the dynamic angle of repose for terrestrial granular material should be measured at a drum rotational velocity ranging from 2 to 10 RPM, with the degree of drum fill maintained within a range of 15–35%. Increasing the fill will decrease the speed at which the dynamic angle of repose is obtained [
10]. Furthermore, the behavior of granular material is compared to that of fluid. At low rotational speeds, combined with low fill levels or a low friction coefficient between particles, the flow becomes unstable, resulting in the appearance of material undulations, Slumping or Surging. Conversely, when the rotational speed exceeds the expected range, a phenomenon known as cascading occurs. There are several motion behaviors of grains as the speed is increased, as shown in
Figure 1 [
6]. The motion of granular material depends on the following: density, grain size and shape, internal friction coefficient, grain porosity, material humidity and drum wall roughness. In contrast, when a rough liner is applied, the angle of friction decreases with increasing grain diameter. The angle of friction also depends on the gradation of the applied liner. A greater angle of friction will be achieved when using a coarse-grained liner with a P40 gradation compared to a medium-grained liner with a P120 gradation [
10,
16]. In addition to the aforementioned properties, bulk material is characterized by static and kinetic friction, hardness, abrasiveness, sensitivity to crushing, adhesion, plasticity, and changes in properties under the influence of vibrations, temperature differences, moisture, or water [
6]. The testing of granular materials, in which we aim to define the dynamic angle of repose, should be conducted with consideration of the environment in which the material naturally exists.
The current study focuses on examining lunar regolith simulants, which exist naturally in gravity that is different from that on earth. The hypothesis presented by M. G. Kleinhans et al. [
17] shows that granular particles moving in lower gravity have lower friction, which results in more dilatation between each particle. This suggests that the dynamic angle of repose depends on gravity. After research and experiments, they concluded that both the static and dynamic angles of repose of granular material are strongly correlated with gravity. In the case of low gravity, the static angle of repose will increase, while the dynamic angle decreases. The research described herein was conducted to calibrate numerical models under Earth’s gravitational acceleration; therefore, the experiments were carried out under terrestrial conditions.
2.2. Test Setup
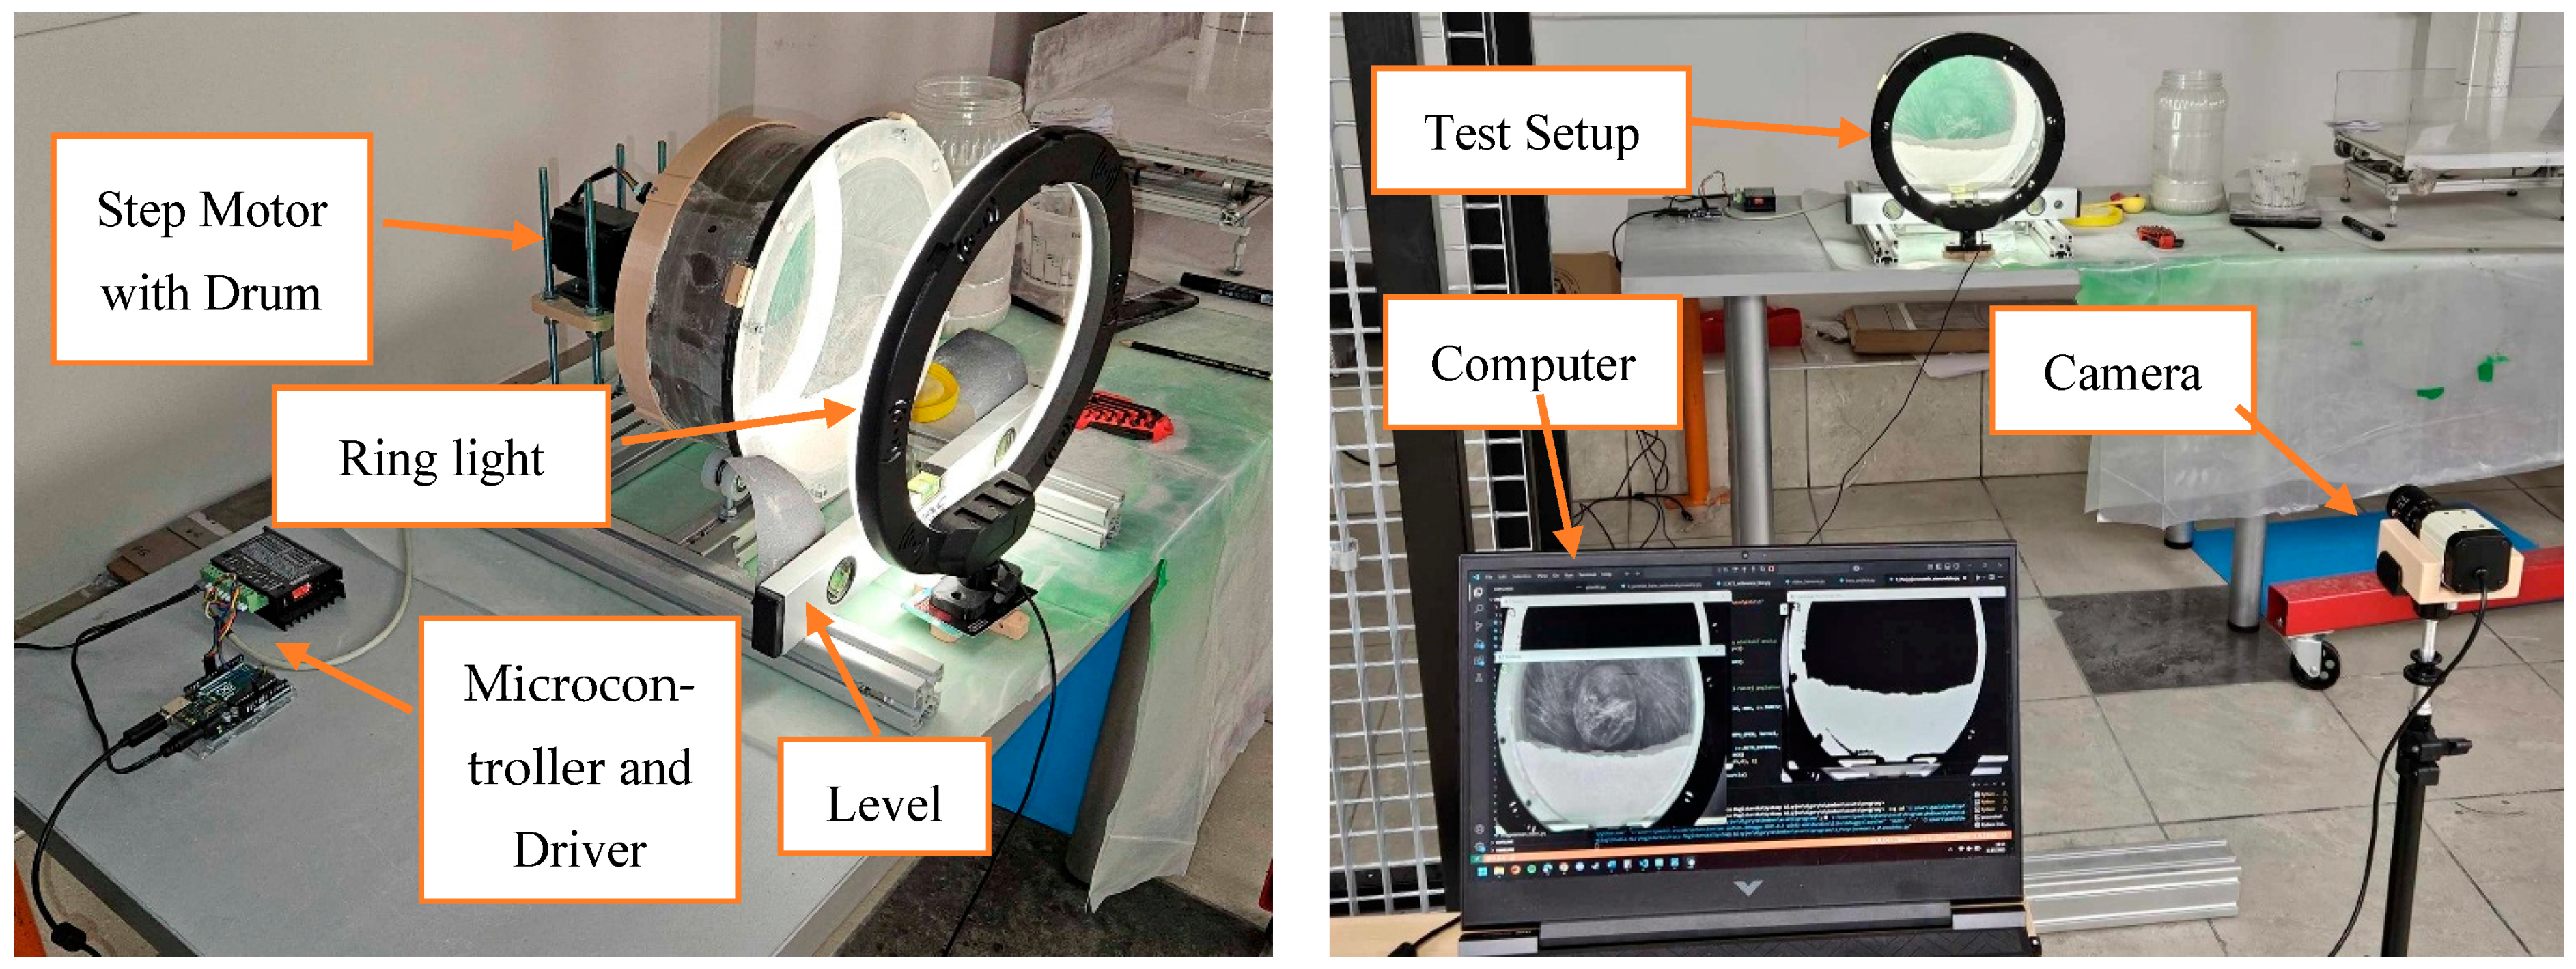
The measurement setup is presented in
Figure 2 and consists of two main parts: hardware and software. The main part of the hardware setup is a drum, 200 mm diameter and 100 mm depth, made of acrylic glass (PMMA), which causes excessive slippage of rolling particles. To mitigate this effect, the inner wall of the drum was lined with sandpaper of P400 grit. Additionally, to ensure adequate contrast, the rear part of the drum was painted with fluorescent green paint. To define a reference segment for angle measurement and maintain level alignment, a spirit level was placed within the setup, serving as a reference for angle measurement. The drum is driven by a Nema 23 High-Torque stepper motor 1.8°, 2.4 Nm, which is connected to a dedicated TB600 driver. The motor is controlled using a microcontroller Arduino UNO, powered by a 12 V supply. For the designed setup, a ring light was selected with an inner diameter close to the outer diameter of the drum. This type of illumination ensures uniform lighting of the entire analyzed surface. A camera and a computer were used for data analysis and processing. A Sttkey 4 MP 30 fps 2560 × 1440 camera was selected and equipped with a varifocal lens, with an adjustable range of 5–50 mm. Additionally, the camera supports the UVC (USB Video Class) standard, allowing it to be used without additional drivers. The algorithm, software part, was developed in Python with the OpenCV library. A detailed description of the digital image processing methodology is provided in the next subsection.
2.3. Image Processing Algorithm
The most common method for image segmentation is thresholding. This operation compares each pixel to a specified threshold value and classifies it by assigning an appropriate value. Among the types of thresholding, binary thresholding and inverse thresholding are commonly distinguished. More advanced methods of image processing include morphological operations. These operations transform a binary image or grayscale image using a structural element known as a kernel. By default, the structural element is represented as a matrix of dimensions k × k [
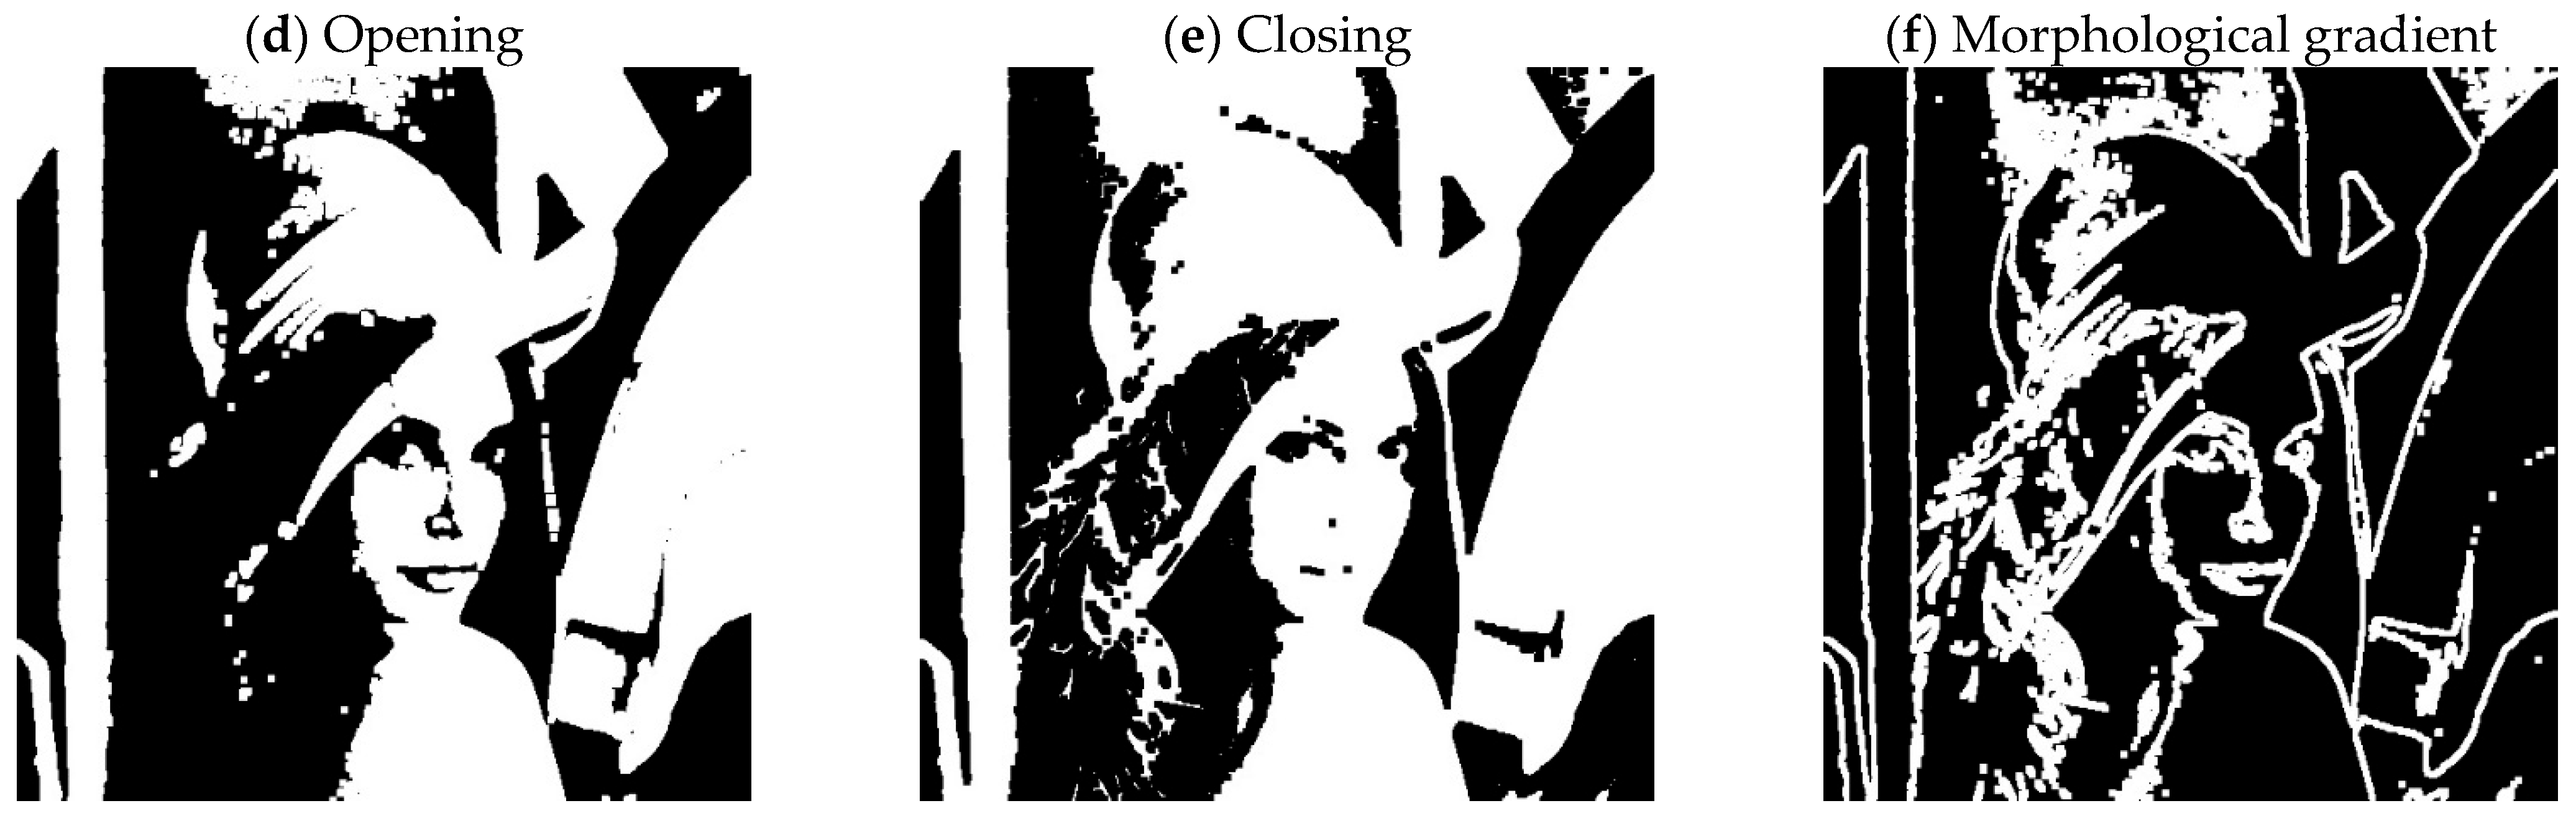
18]. The structural element can take any size and shape and has its own coordinate system. The origin of that coordinate system can be represented at the center, but it is not required. At the center of this coordinate system lies a distinguished point known as the anchor point. Morphological operations are based on Minkowski set theory and can be described as transformations that modify the structure of objects within an image. The most commonly used operations include erosion, dilatation, opening, closing and morphological gradient.
Dilation adds pixels to the edges of objects, filling gaps within them by expanding bright areas and reducing dark areas. The dilation operation A⊕B expands the object and is a commutative operation, meaning it is equal to B⊕A. The structural element is moved to the position of each point, and the resulting set of points is then summed. Erosion operation is used to simplify the structure of an object or to decompose a complex object into several simpler components. Erosion is declared as A⊝B and it is no commutative; it is not equal to B⊝A. The structural element is shifted to each point of the objects, and the intersection of the resulting sets is computed. The opening and closing operations are based on dilation and erosion. They are directly more useful than dilation and erosion. The definitions of these concepts are related to the intuition behind closed and open sets [
19]. Opening is an operation that combines erosion and dilatation in sequence and is defined as A◦B = (A⊖B)⊕ B. Opening removes small objects, fine details, and noise from a binary image while preserving larger structures. Closing is an operation that applies dilatation followed by erosion. It is represented as A•B = (A⊕B)⊖B. Closing fills small gaps, smooths sharp edges and can connect objects that are close to each other. The morphological gradient is described as (A⊕B) − (A⊖B). It shows the difference between an image after dilation and image after erosion. The operation adds a thick contour; therefore, two semi-gradients are additionally defined: inner and outer gradient.
Figure 3 shows all of the discussed morphological operations in reference to a basic binary image [
8,
19,
20,
21,
22].
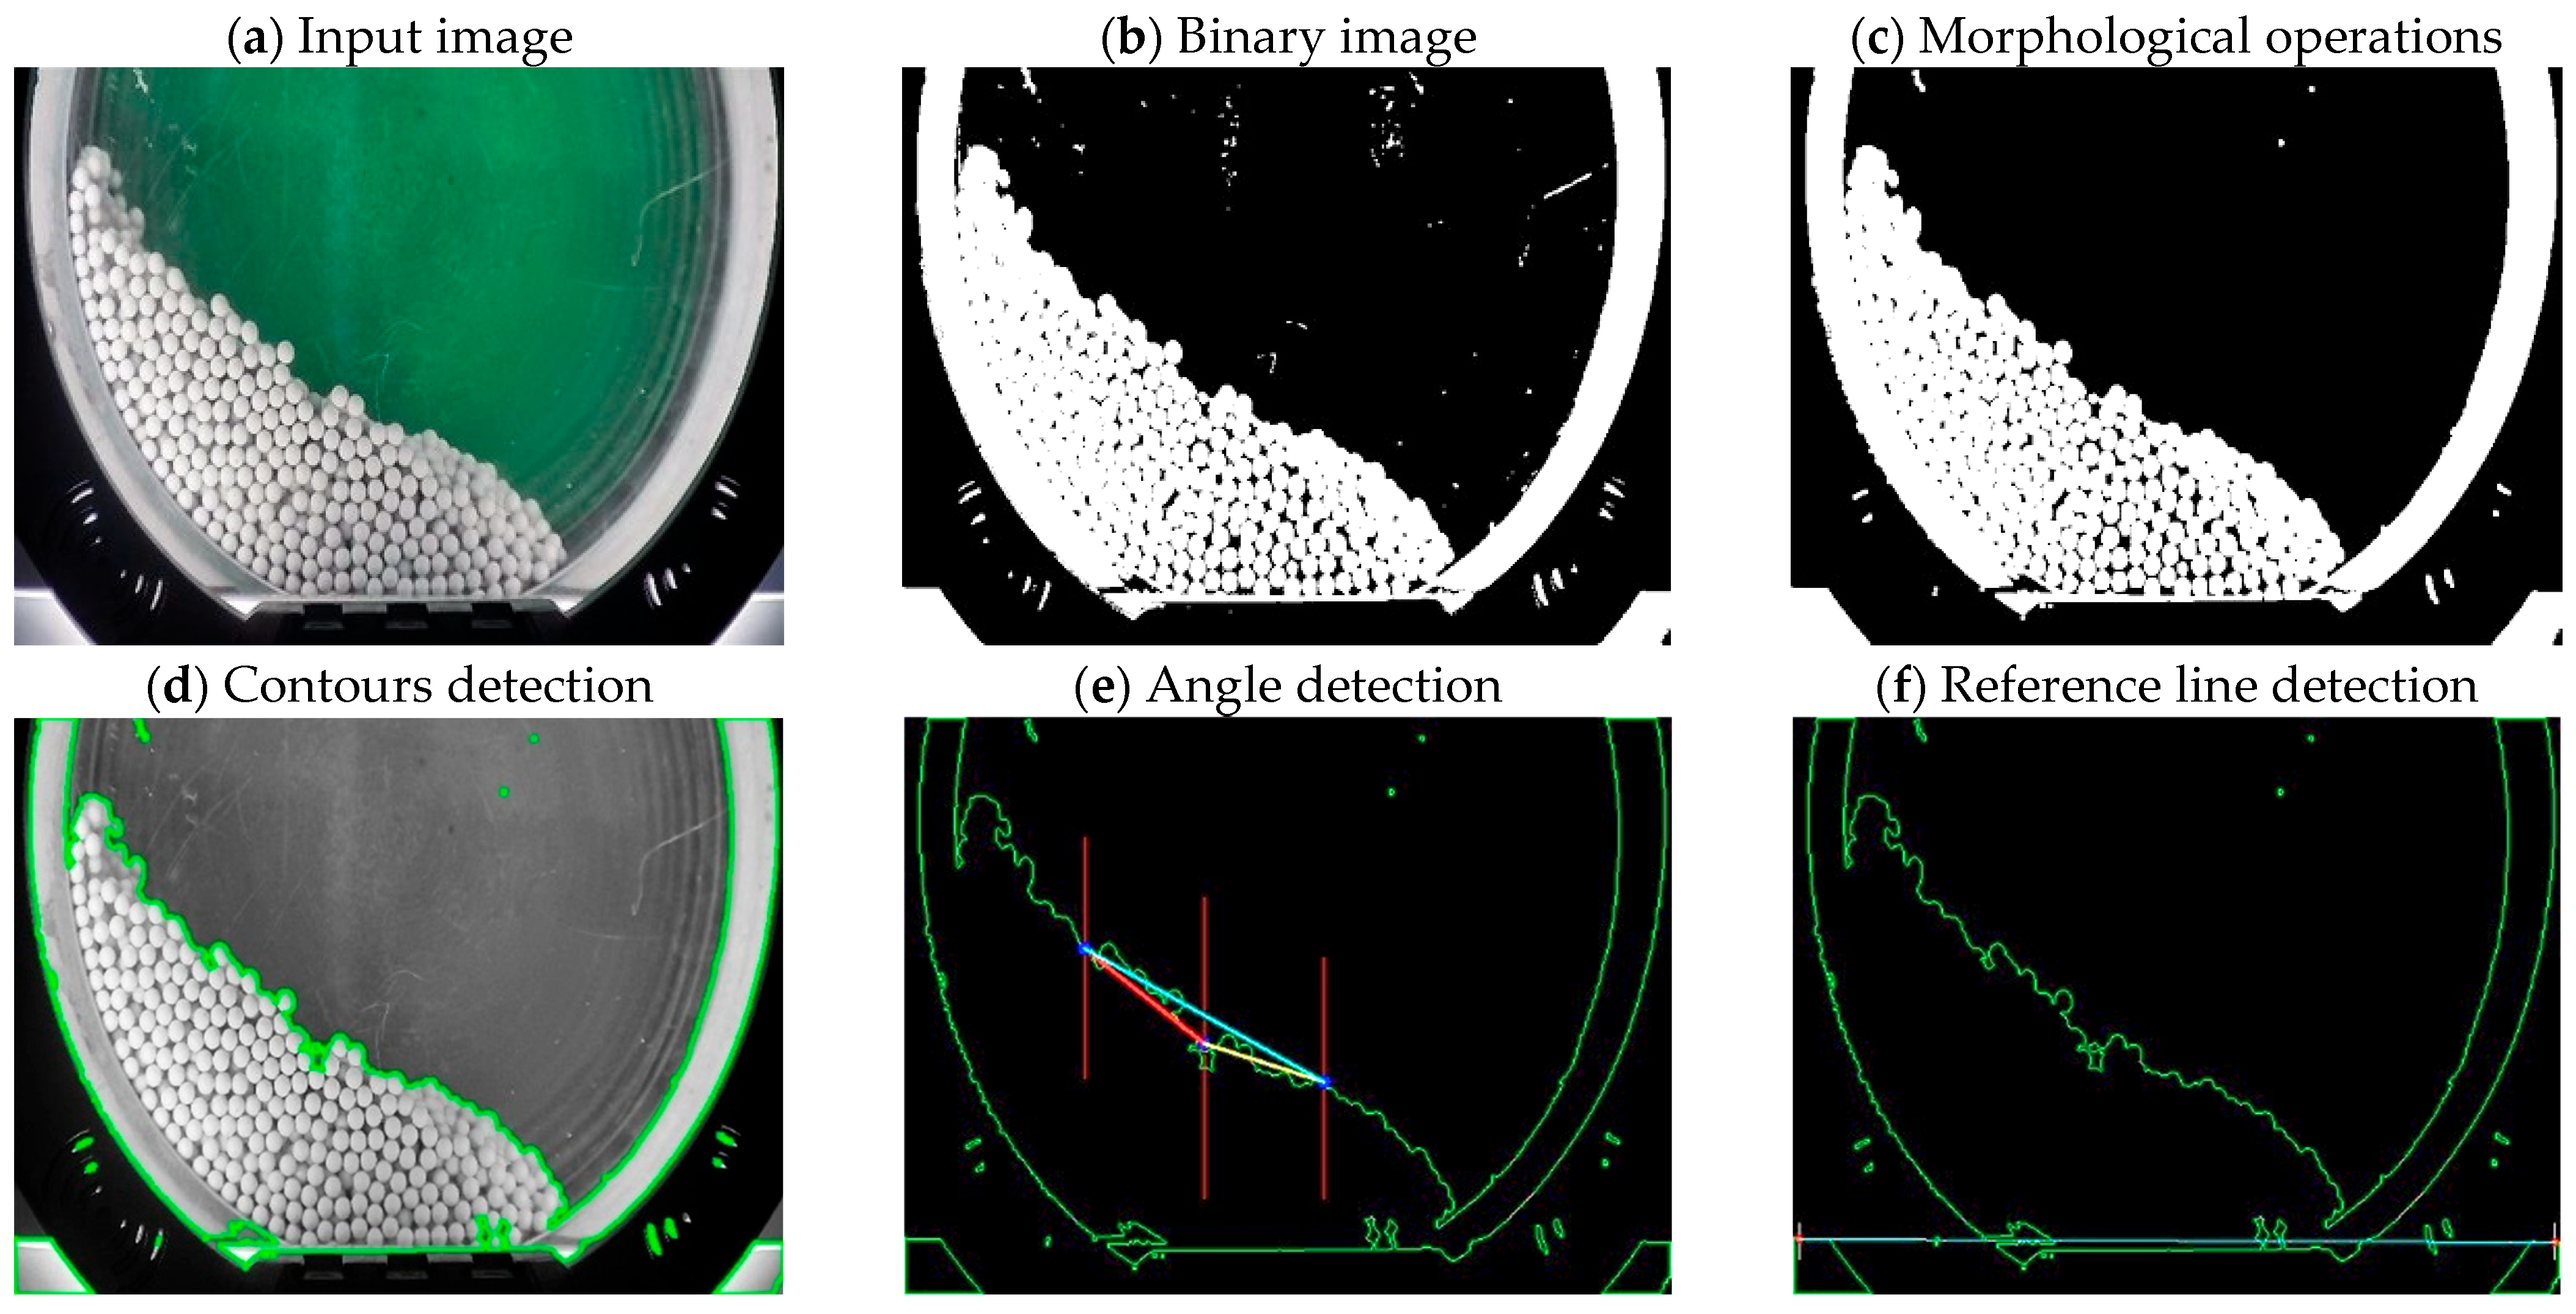
The described operations were used to develop an algorithm for determining the dynamic angle of repose. The algorithm was created based on a test setup using 0.25 g ASG (Air Soft Gun) ammunition balls with a diameter of 6 mm. The thresholding was determined empirically, and the noise was removed using morphological operations. The described morphological operations were chosen according to the tested material. Contours were identified in the processed image to define the repose line and enable the determination of a reference line. The dynamic angle of repose is calculated in reference to the lower edge of the image. If the camera is tilted, the obtained result will be incorrect. Therefore, the angle of repose must be calculated considering the reference line, which compensates for the measurement error. The reference line is determined by two fixed, unchanging points. The obtained result of the dynamic angle of repose is adjusted, either increased or decreased, depending on the direction and value of the reference line inclination. The contour is determined at the point where the pixel value changes from 0 to 1 and is then drawn on a black image. Knowing the dimensions of both the image and the area where the phenomenon occurs, three parallel lines are defined and drawn on the contour image. The intersection points of these segments with the contour are then identified. Each segment is offset from the next by an equal distance. Next, a function is defined to pass through all the contour points. Then, all points that lie on the lines described by the x-coordinates of the defined segments are checked and saved in an array. The algorithm then verifies whether these points fall within the range of the defined lines. All points within a given line are sorted, and the one closest to the ordinate axis is selected and marked. The next step is to draw lines connecting these points and determine their inclination angles. All points are connected, creating three lines with different inclination angles. The inclination angle is calculated using the tangent function by comparing the determined line to the lower edge of the image. The reference line is determined analogously. Two segments with fixed coordinates are defined, and the algorithm detects and stores all points found on these segments. It then checks for points at the intersection of the contour and the segment, sorts them, and returns the point with the lowest Y-coordinate. Based on these determined points, the reference line is drawn.
Figure 4 shows the digital image processing algorithm step by step. During the testing of the algorithm on a test object, measurements were validated, and the results were verified relating to the alternative manual verification method. The verification method was applied to each test measurement. This method involved manually determining the points of intersection with the contour and the inclination angles using graphical software. Subsequently, the dynamic angles of repose were determined within the same graphic software. Reference lines, which defined the baseline on the contour line, were also verified in the same manner. For the actual measurements, a random selection of several measurements was subjected to verification. The verification did not reveal any significant discrepancies between the two methods, with differences not exceeding 0.01 degrees.
2.4. Description and Comparison of the Parameter Simulants Under Test
The research presented in this study was conducted for seven different materials from extraterrestrial granular simulants of anthropogenic origin. The analyzed materials are simulants of regolith, representing various regions of the lunar surface. As mentioned in the Introduction, the main division can be performed with respect of the place of origin on the Moon and its Lunar Mare and Lunar Highland. In the presented paper, two types of Lunar Mare simulants are tested, which are LMS-1 and LMS-2, and the difference between them is the granulometric composition, where the maximum particle sizes can be 1 mm and 2 mm, respectively. Another group is the Lunar Highland group, which was tested with LHS-1, LHS-1E and LHS-2 simulants. Similarly, the main difference is the maximum particle size, but the simulant marked with the letter ‘E’ is the simplified version (with respect to the mineral composition), targeting only the geotechnical properties of the bulk material. Also in this group is the LSP2 simulant, which is also in the lunar Highland simulants group, but this specifically mimics the regolith samples collected from the south pole of the lunar surface. Finally, LCATS is the simulant of the specific use, for technology testing, e.g., regolith melting. The main properties of particular simulants are presented in
Table 1 and
Table 2.
3. Experimental Test, Results and Discussion
The literature does not specify stringent requirements for conducting experiments on extraterrestrial materials. Therefore, Skoczkowska’s [
10] approach, which aligns with the testing procedures for terrestrial materials, was applied. All measurements were conducted at three different rotational speeds, 2, 5, and 10 RPM, and with the degree of fill maintained at around 30% of the drum volume. According to the literature [
6], the dynamic angle of repose can be determined for three different states: Surging, Slumping or rolling. In the case of Surging and Slumping, the lower and higher angles of repose should be determined due to moving granular material [
23]. The specific rotational speed at which all phenomena occur and the dynamic angle of repose should be measured is not precisely known. Therefore, we decided to conduct the experiment at the maximum speed, equal to 10 RPM, at which rolling was observed in Skoczkowska’s [
10] experiment. Substantial research has shown that the long-time continuous rotation of granular media can induce segregation processes, leading to the formation of two distinct slopes in the plane perpendicular to the rotation axis. To minimize this effect, the test was carried out in the shortest possible time to obtain a stable motion state [
12,
24,
25].
To determine the dynamic angle of repose, the dedicated test rig described in
Section 2.1 was used. Subsequently, after the motion of the granular material was stable, a sequence of images was captured at short, predefined time intervals. Each image was processed and analyzed using a custom algorithm. The measurements were performed at a constant time interval of 5 s after the stabilization of the motion state of the granular material. There were six measurements for each speed, with 18 results for each material in total. In each measurement, the camera was positioned at a fixed distance of 192 cm from the examined object. Before the test, each material was admeasured with a special beaker to obtain a volume of around one liter, which was then weighed on a certificated scale. The exact mass is presented in
Table 3.
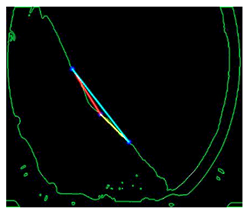
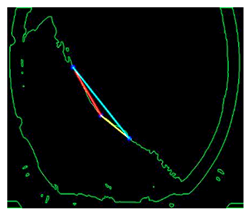
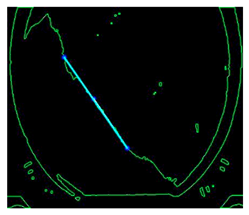
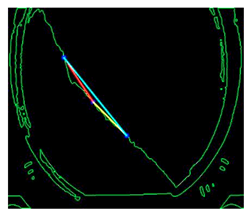
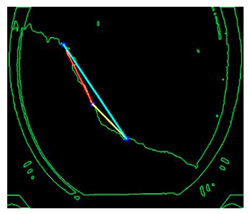
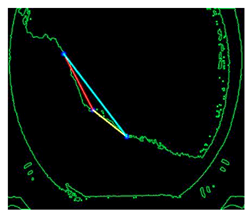
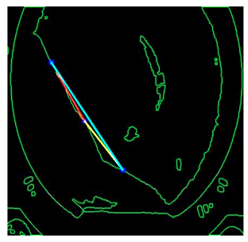
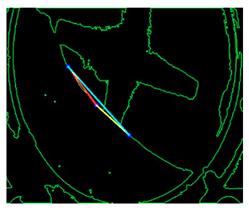
In the case of the chosen rotational speeds, it was possible to observe the occurrence of Surging, Slumping, rolling or cascading. Due to the presence of the first two mentioned phenomena, it is necessary to measure the lower and upper dynamic repose angles. The resulting images reveal the presence of three segments: two reference segments corresponding to the lower and upper dynamic repose angles, as well as a resultant segment referred to as the total DAR. An exemplary image result is presented in
Figure 5. The average measurement results for each material at speeds of 2, 5, and 10 RPM are shown in
Table 4,
Table 5 and
Table 6.
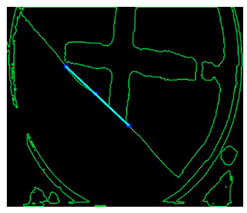
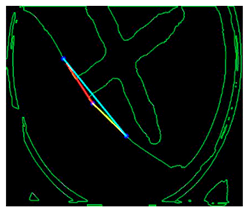
Figure 6 and
Figure 7 show the most representative images for each simulant.
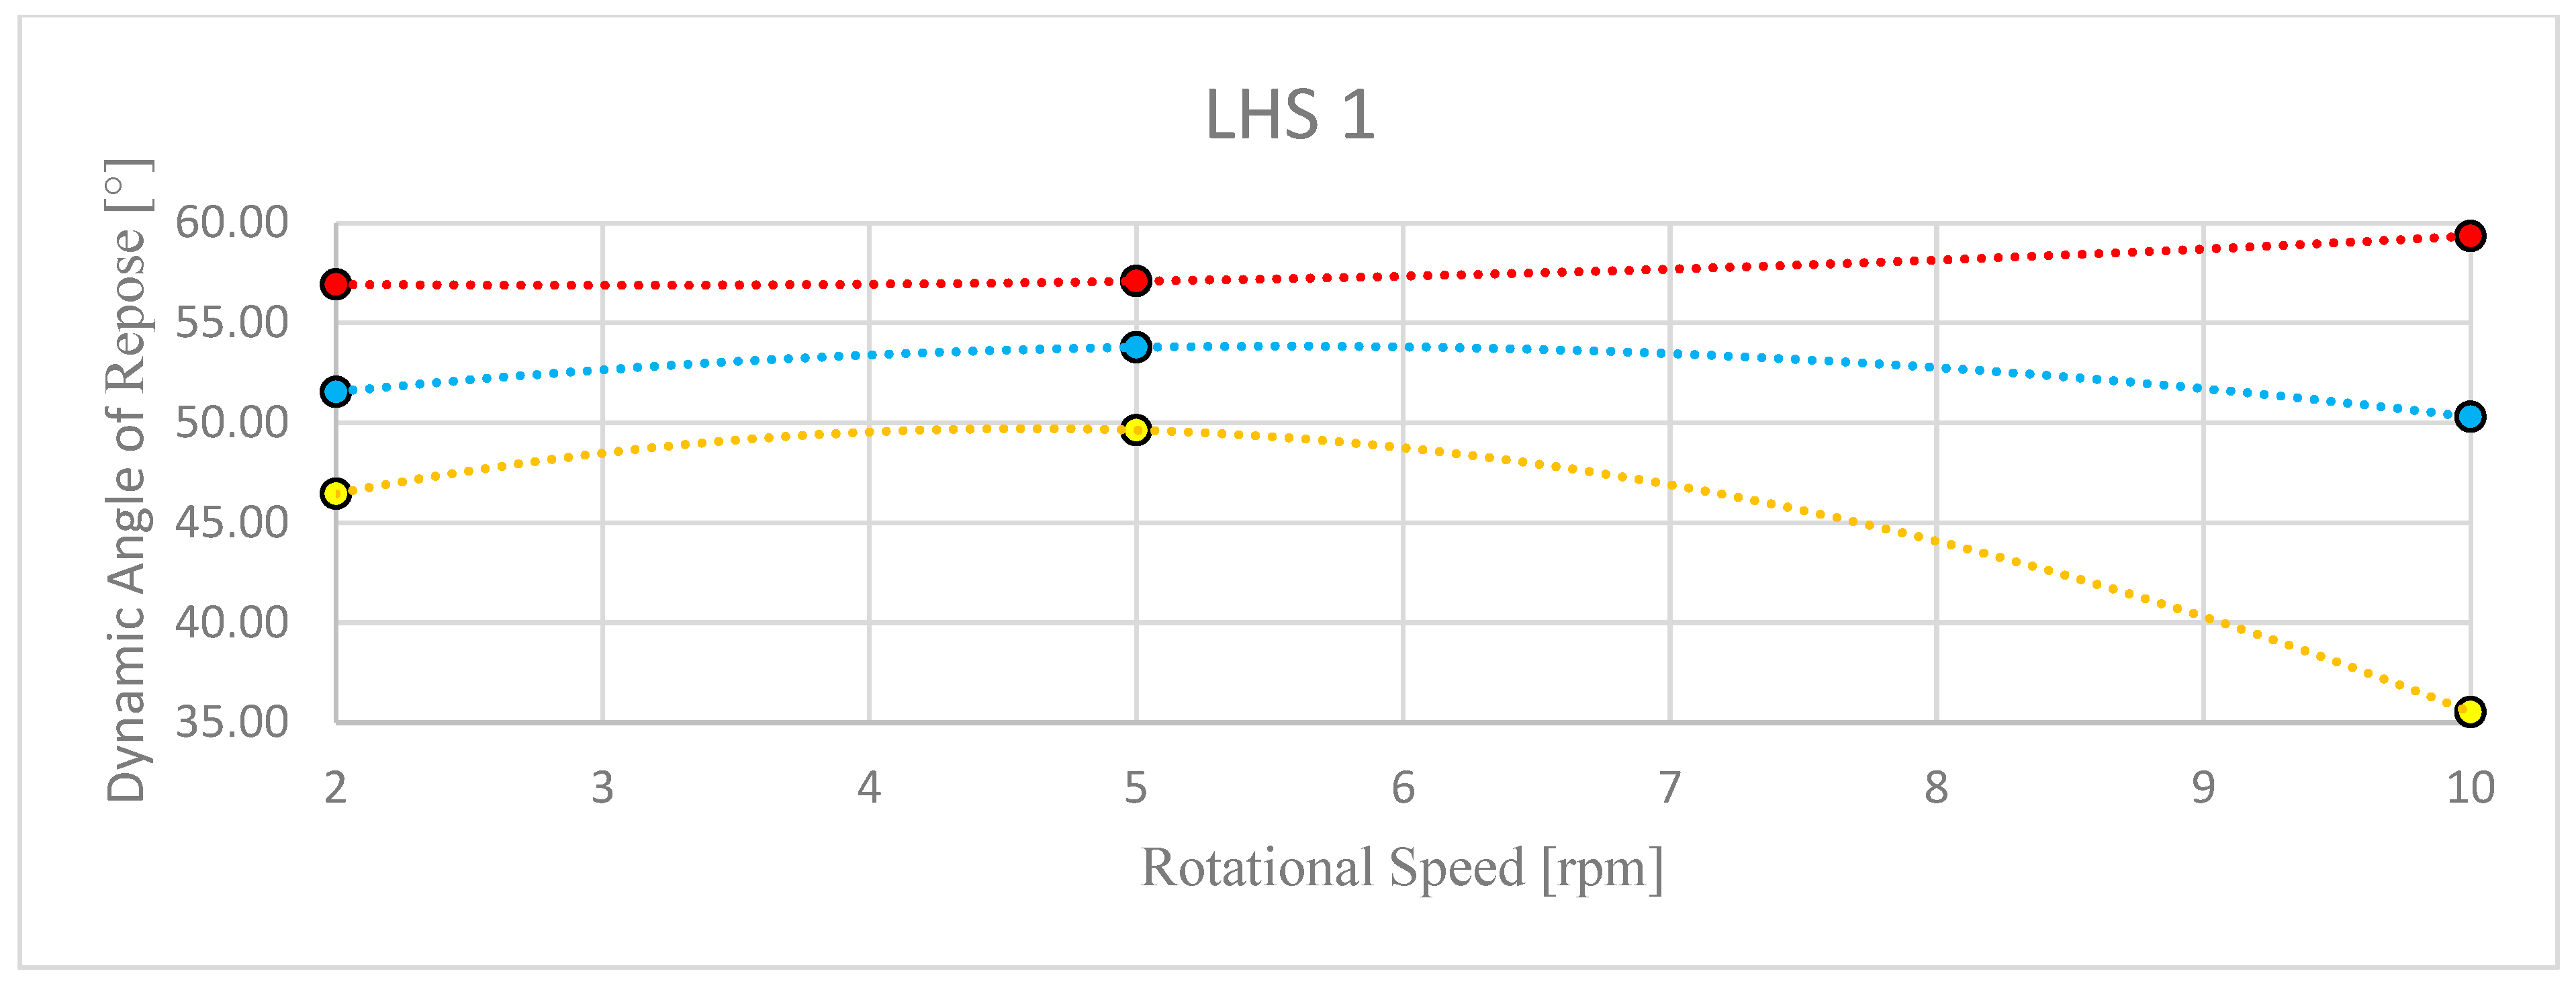
When analyzing the LHS 1 material at a rotational speed of 2 RPM, the phenomenon known as Slumping can be clearly observed; the material shears and then slides down due to inertia. At a speed of 5 RPM, the material is steeply inclined relative to the horizontal level. At this speed, the material no longer shears; instead, rolling occurs. At 10 RPM, the first detached particles become visible, initiating the cascading process. The dynamic angle of repose for total DAR reaches its maximum at 5 RPM, after which the angle decreases, approaching the initial value. When this happens, the observation of lower and higher DAR is more relevant to the actual slope shape. This progression indicates the sequential occurrence of three distinct processes: Slumping, rolling, and cascading.
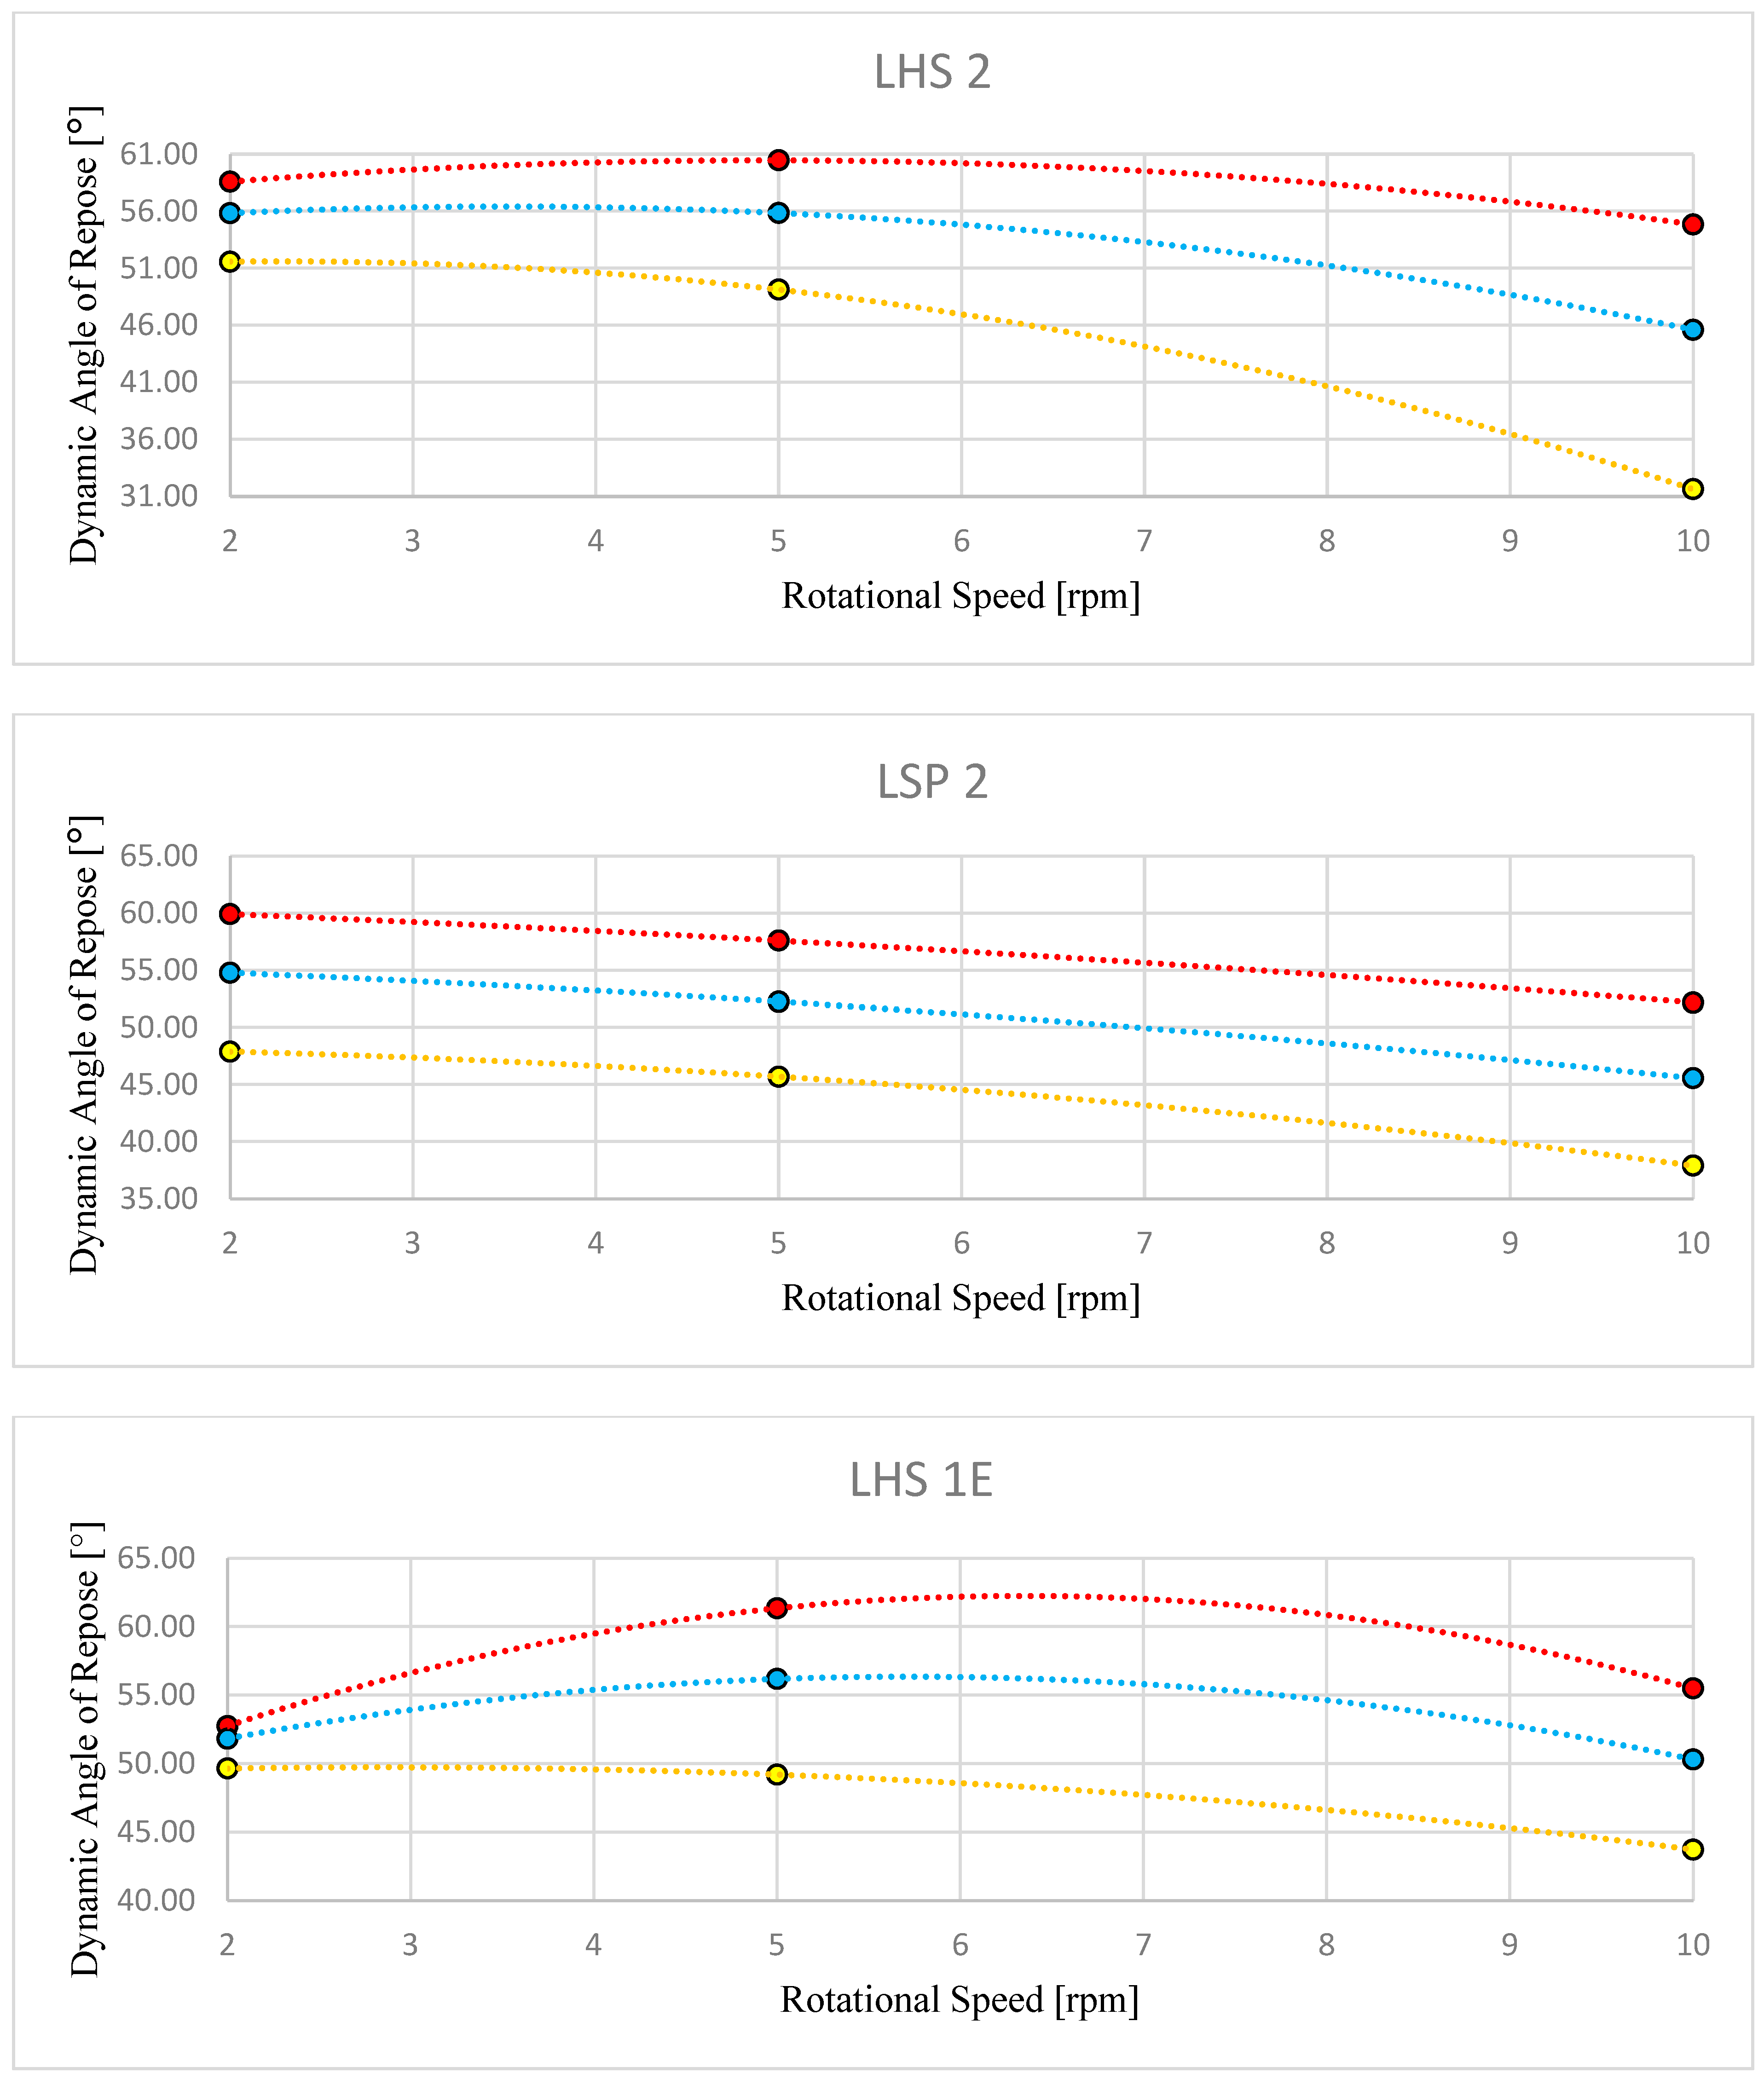
There is a strong correlation between the materials LHS1, LHS2, LHS1E and LSP2, which are different types of lunar Highland simulant. For each material in this group, a certain trend can be observed based on the results presented in
Table 7. At low rotational speeds, the lower and higher DAR values are close to the total DAR, indicating the previously described phenomenon known as Slumping. At medium speeds, the overlapping of each angle may suggest the occurrence of rolling. The highest speed suggests the onset of cascading. This pattern is consistent with that observed for LHS1. Analyzing the individual material graphs presented in
Figure 6 reveals a specific relationship: the total DAR increases for all materials except LSP2, which differs from the group in terms of its origin. LSP simulates the properties of regolith from the southern region of the Moon, which can cause divergence from the rest of the LHS group. During the experiment, the LHS group materials exhibited a tendency to form complex, cohesive clumps resembling wet sand. Therefore, it is necessary to consider whether this phenomenon significantly affects the obtained results.
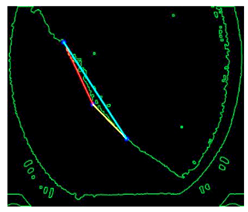
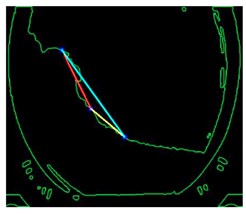
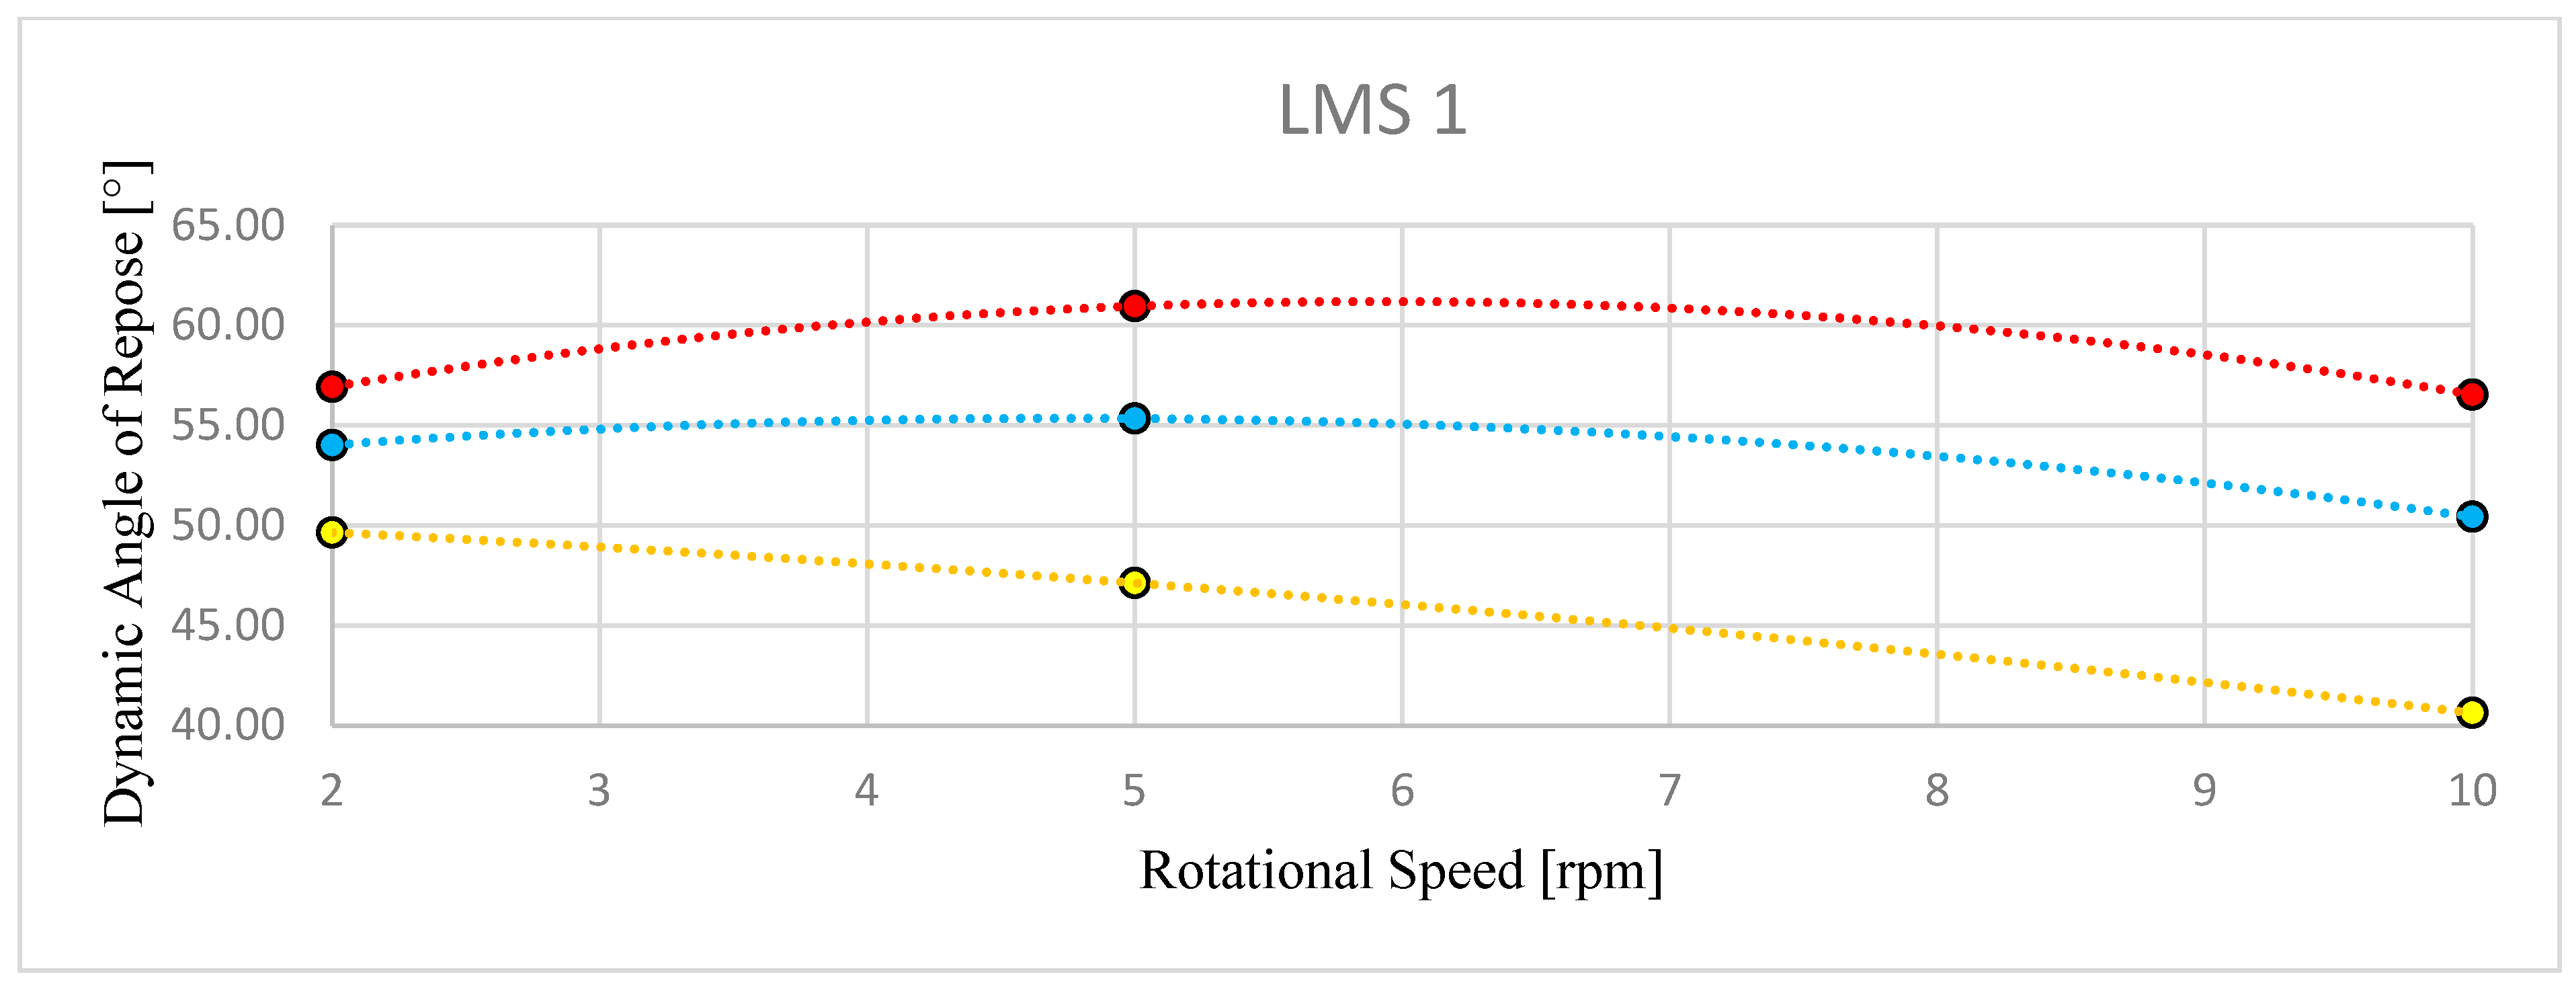
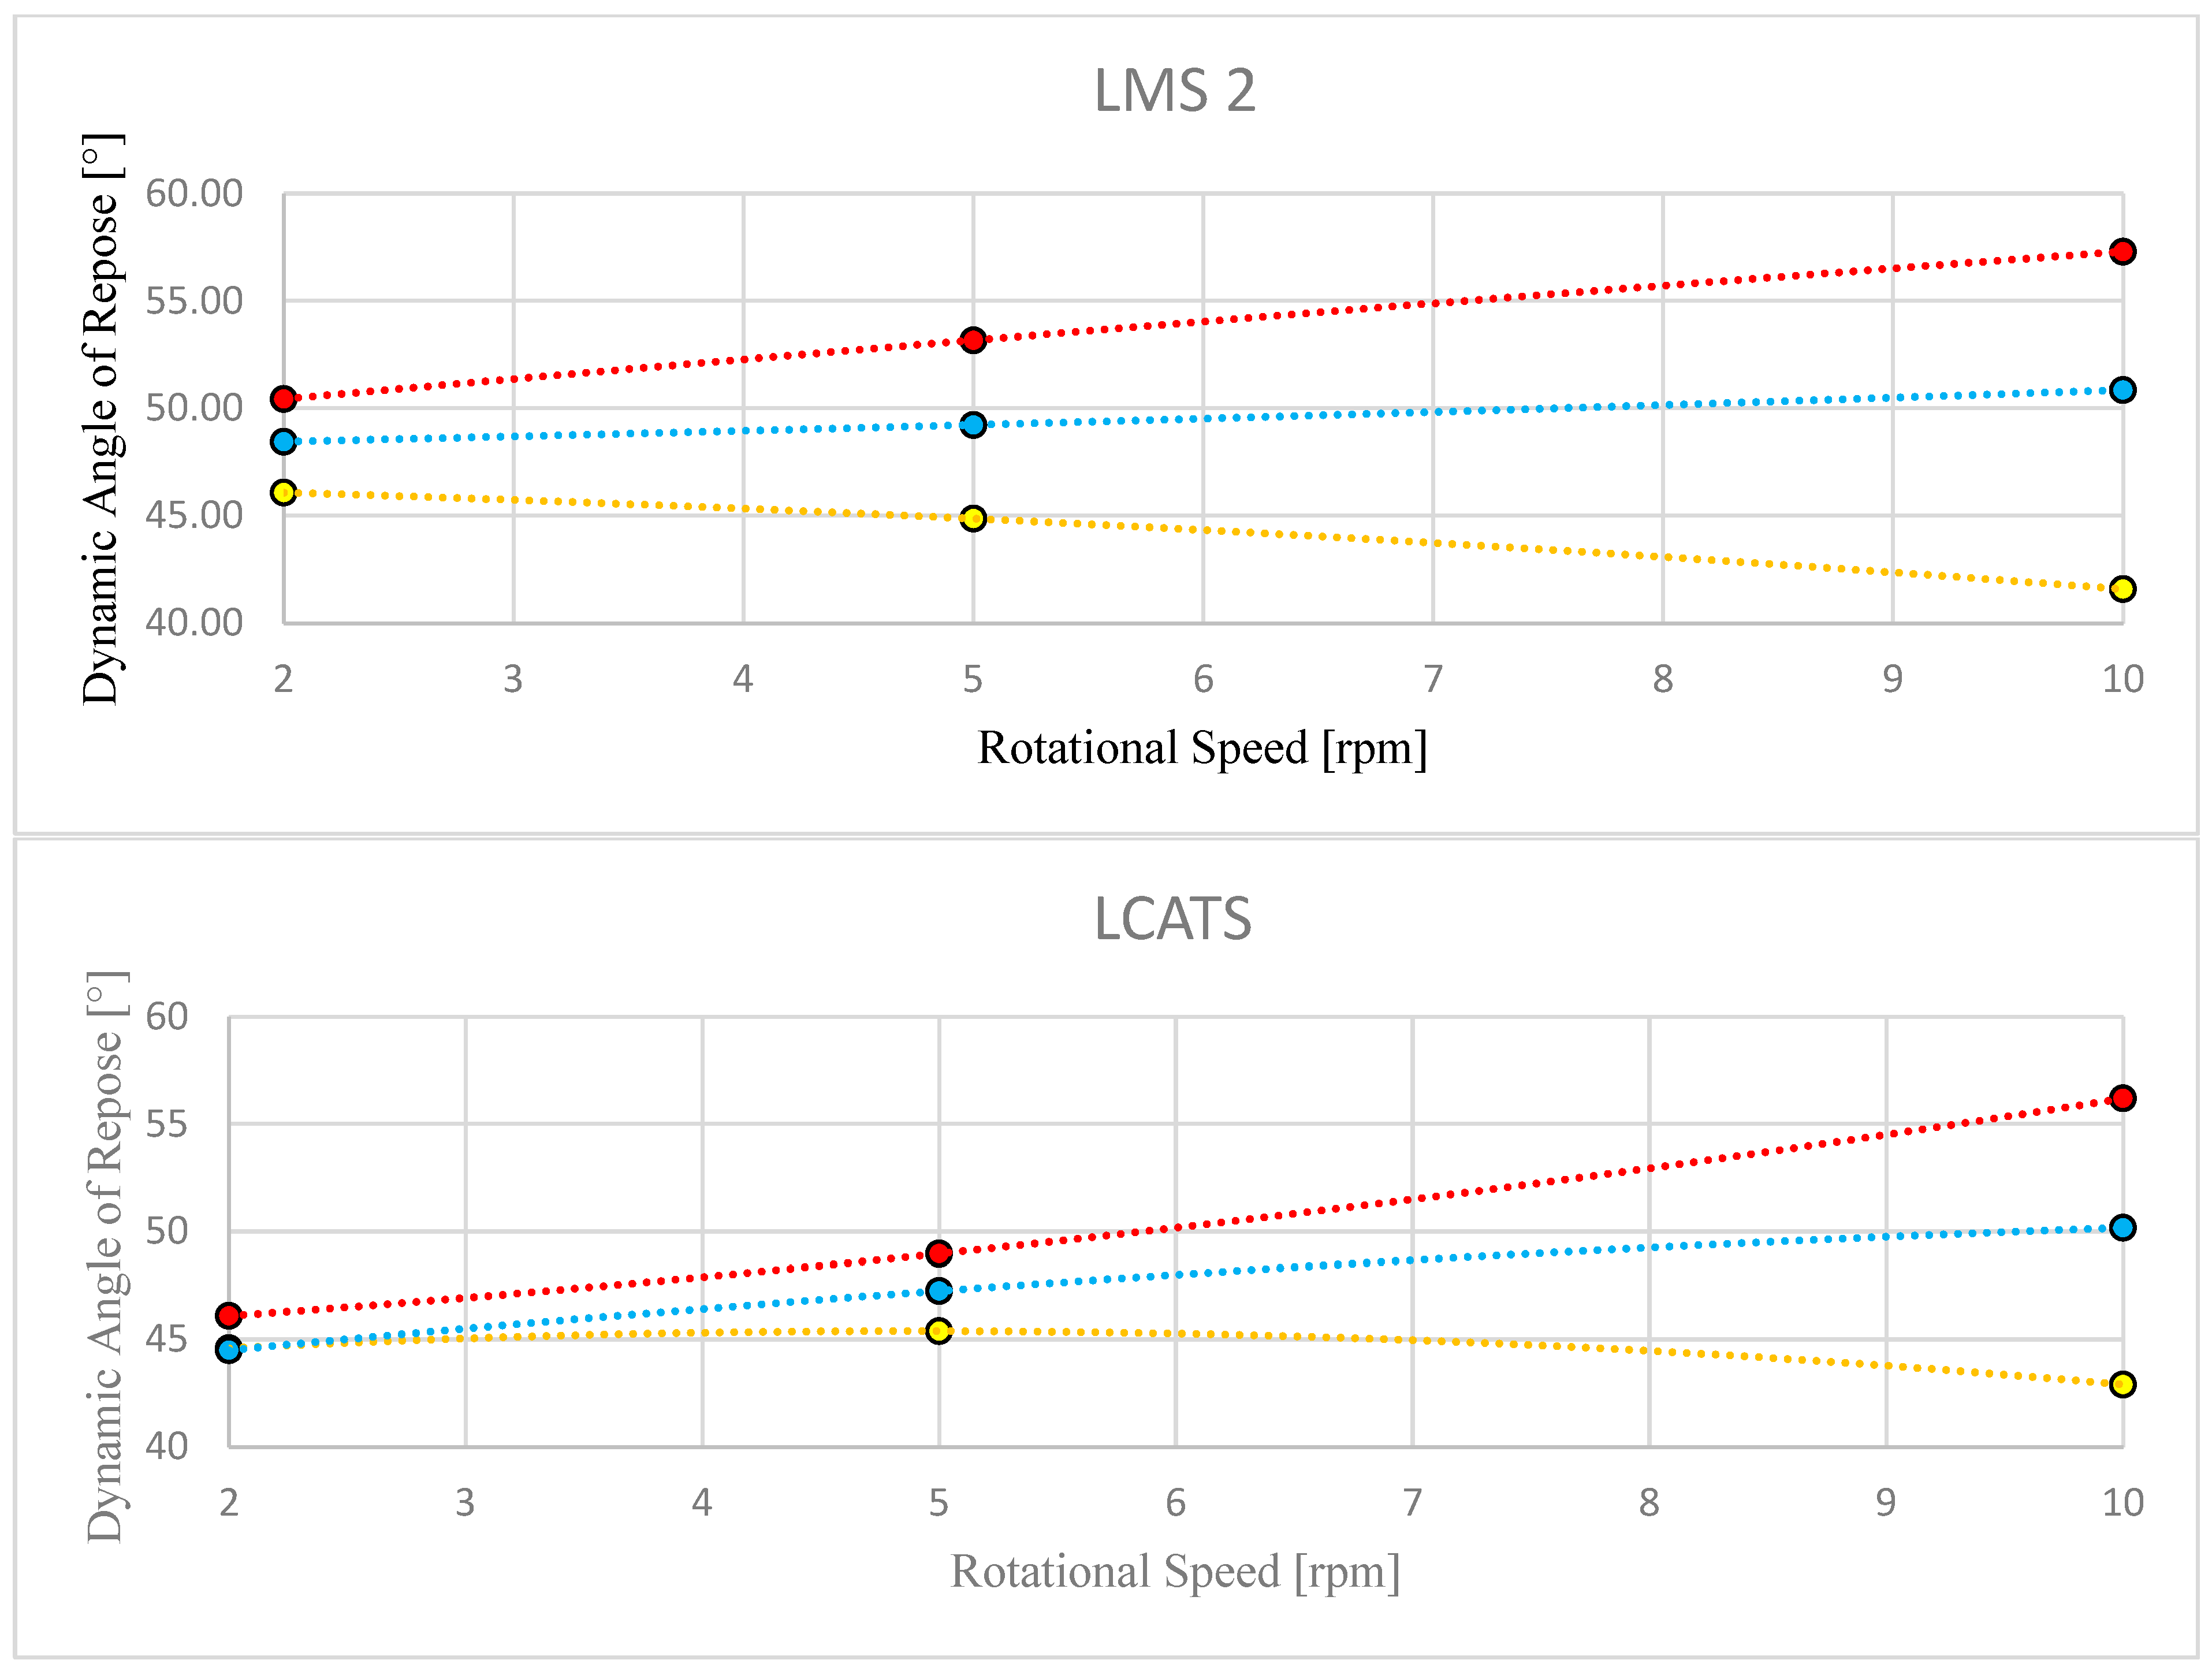
The second distinguished group representing Lunar Mare simulants consists of the LMS simulants group and LCATS, revealing a similar level do the DAR value. A global analysis based on
Table 8 reveals a specific pattern. At all rotational speeds, the higher and lower DAR values are closely aligned with the total DAR. Based on this, it can be hypothesized that, throughout the entire experiment, the material remained within the rolling state of bulk material motion. For LMS1, the maximum angle value was reached at a speed of 5 RPM, making it the only material in this group whose graph, presented in
Figure 7, exhibits a parabolic shape. The increasing angle values for LMS2 and LCATS may indicate a broader speed range in which the rolling phenomenon occurs. The LHS group’s characteristic tendency to form agglomerated clumps was not observed, preventing the occurrence of cascading at 10 RPM.
4. Summary and Conclusions
As already mentioned in this paper, in recent years, space exploration has put its imprint on the global market, so interest in the development of space-related technologies in industry and R&D technologies has increased.
In the presented paper, seven different types of lunar regolith simulants were examined, mimicking the behavior of the real regolith samples collected mainly during the Apollo mission, and tests were presented.
Based on the performed analysis, it can be concluded that the dynamic angle of repose differs when comparing materials mimicking the regolith of the Highland and Mare places of origin.
In general, the Lunar Highland angle of repose creates steeper slopes, especially when comparing the higher angle of repose measure. Characteristically, with an increase in the RPM, the change in the flow regime can be observed, and the values of the dynamic angle of repose (lower, higher, total) start to diverge. The formulation of clumps is observed, and this is most probably the reason why the material flow starts to be more complex. Clumping is a phenomenon that could disturb the obtained results. The accumulation of material in a single area leads to the formation of non-uniform inclination. Excessive clumping results in unreliable measurements, and the obtained value becomes a significant simplification. That is why the authors of this paper decided not to perform measurements at higher RPM.
In the case of Lunar Mare, clump formulation was not observed; materials were characterized with better flowability, resulting in an almost unchanged flow regime during testing. As a consequence, the measured value of the angle of repose was, in most cases, comparable, while the material created a smooth slope.
The main goal of this research was to deliver valid numbers of DAR for analytical and numerical simulations and model validations. One can conclude that when approaching the calculations, one should be aware, at least, that the potential region of operation of the equipment should be known, while Highland and Mare characteristics indicate differences in the dynamic behavior of the material. But it is a decision for the individual whether they should apply the total DAR or both the higher and lower DAR. When talking about the Lunar Mare, use of the total DAR should not lead to big errors, no matter if the interest is in big volume handling or, rather, average to small volumes. However, in the case of Lunar Highland, if the interest is in more precise handling of small volumes, the application of only total DAR may lead to some discrepancy in the behavior of the material in the local flow.
The test also indicates that the DAR varies within the place-of-origin group, if the grain size changes. It is important to underline that many of the regolith simulants were developed on the basis of already-segregated Apollo mission samples. When developing lunar equipment, that raw regolith will be more like a mixture of simulants of different granulometric characteristics, and bigger particles up to the cm size should be expected [
5,
26,
27,
28].
Eventually, one has to remember that the results presented in this article concern regolith simulants tested in an Earth environment, where the main difference, with respect to the Moon, is the gravity constant at 1/6th of the Earth. Testing in Earth conditions allows us to identify the main characteristics of the granular material flow, which allows us to develop functional discrete element models. Another step is to design and perform drop tower or parabolic flight measurements. As stated in the study of [
17], where several granular materials were tested during parabolic flight, it should be expected that the dynamic angle of repose decreases with a decrease in gravity.
Another thing is that plenty of factors still have to be included in future studies (e.g., electrostatics, vacuum) to exactly mimic the behavior of the regolith, as it is on the lunar surface. On the other hand, a future trade study will provide answers as to what level of inaccuracy is acceptable for each application.


