Article

Genetic K-Means Clustering of Soil Gas Anomalies for High-Enthalpy Geothermal Prospecting: A Multivariate Approach from Southern Tenerife, Canary Islands

by
Ángel Morales González-Moro
1,2,*,
Luca D’Auria
3,4 and
Nemesio M. Pérez Rodríguez
3,4
1
Escuela Técnica Superior de Ingenieros de Minas y Energía (ETSIME), Universidad Politécnica de Madrid, 28001 Madrid, Spain
2
Dirección General de Industria, Gobierno de Canarias, 38001 Santa Cruz de Tenerife, Tenerife, Canary Islands, Spain
3
Instituto Volcanológico de Canarias (INVOLCAN), 38400 Puerto de La Cruz, Tenerife, Canary Islands, Spain
4
Instituto Tecnológico y de Energías Renovables (ITER), 38611 Granadilla de Abona, Tenerife, Canary Islands, Spain
*
Author to whom correspondence should be addressed.
Geosciences 2025, 15(6), 204; https://doi.org/10.3390/geosciences15060204
Submission received: 25 April 2025 / Revised: 19 May 2025 / Accepted: 26 May 2025 / Published: 1 June 2025
(This article belongs to the Section Geochemistry)

Abstract

High-enthalpy geothermal resources in volcanic settings often lack clear surface manifestations, requiring integrated, data-driven approaches to identify hidden reservoirs. In this study, we apply a multivariate clustering technique—genetic K-Means clustering (GKMC)—to a comprehensive soil gas dataset collected from 1050 sampling sites across the ~100 km2 Garehagua mining license, located in the southern rift zone of Tenerife (Canary Islands). The survey included diffuse CO2 flux measurements and concentrations of key soil gases (He, H2, CH4, O2, N2, Ar isotopes, and 222Rn, among others). Statistical-graphical analysis using the Sinclair method allowed for an objective classification of geochemical anomalies relative to background populations. The GKMC algorithm segmented the dataset into geochemically coherent clusters. One cluster, defined by elevated CO2, helium, and 222Rn levels, showed a clear spatial correlation with inferred tectonic lineaments in the southern rift zone. These anomalies are interpreted as structurally controlled conduits for the ascent of deep magmatic-hydrothermal fluids. The findings support the presence of a concealed geothermal system structurally constrained in the southern region of Tenerife. This study demonstrates that integrating GKMC clustering with soil gas geochemistry offers a robust methodology for detecting hidden geothermal anomalies. By enhancing anomaly detection in areas with subtle or absent surface expression, this approach contributes to reducing exploration risk and provides a valuable decision-support tool for targeting future drilling operations in volcanic terrains.

1. Introduction

Geochemical techniques play a fundamental role in geothermal exploration, offering valuable insights into the composition of subsurface fluids and their interaction with surrounding geological structures [1,2]. Among these, soil gas surveys are particularly effective in volcanic environments where visible surface manifestations (e.g., fumaroles or hot springs) are absent [3,4].
The Canary Islands, and specifically the island of Tenerife, are among the few regions in Spain with recognized high-temperature geothermal potential [5]. However, hydrothermal surface features are scarce, except at the Teide summit. Previous studies in Tenerife and Gran Canaria have shown that diffuse soil gas emissions, mainly CO2 and helium, can reveal deep degassing structures [6,7]. These emissions are often structurally controlled and distinguishable from atmospheric or biogenic backgrounds using statistical-graphical methods such as the Sinclair technique [8,9,10].
Identifying geochemical anomalies in soil gases is critical for mapping zones of vertical permeability associated with geothermal upflow. Multicomponent measurements—including CO2 flux, He, H2, CH4, 222Rn, and δ13C–CO2—provide important constraints on the origin, depth, and dynamics of subsurface fluids [11,12,13]. However, the multivariate nature and inherent noise of such data demand advanced tools to extract meaningful patterns [14].
Clustering analysis has proven to be an effective unsupervised approach for grouping geochemically coherent populations [15,16]. A recent development in this field is the GKMC algorithm, which combines the classification power of k-Means with the optimization capacity of genetic algorithms [17]. This hybrid approach enhances the detection of subtle multivariate anomalies, particularly useful when surface signals are weak or diffuse. Originally developed for pattern recognition applications, GKMC has also been successfully applied in geothermal exploration contexts [18].
In this study, we apply a multivariate clustering framework to a high-density soil gas dataset collected in the southern volcanic rift zone of Tenerife, with a specific focus on the Garehagua and Garehagua II mining licenses. The dataset comprises 1050 sampling sites covering ~100 km2 and includes diffuse CO2 flux measurements and concentrations of key soil gases (He, H2, CH4, O2, N2, Ar isotopes, 222Rn, and δ13C–CO2). Univariate anomalies are evaluated using the Sinclair method, and GKMC is applied to delineate multivariate clusters.
A distinct anomalous cluster, characterized by elevated concentrations of CO2, helium, and 222Rn, shows strong spatial association with the intersection of NE–SW and NW–SE tectonic lineaments in the southern rift zone. These structures are well documented as preferential pathways for vertical fluid migration in Tenerife’s volcanic edifice [19,20]. The resulting geochemical model supports the hypothesis of a concealed, structurally controlled magmatic-hydrothermal system in the area.
This study highlights the value of integrating soil gas geochemistry with advanced clustering algorithms for geothermal anomaly detection in areas lacking conventional surface evidence. The approach enhances anomaly interpretation, supports target definition, and ultimately contributes to reducing exploration risk for future geothermal drilling campaigns.

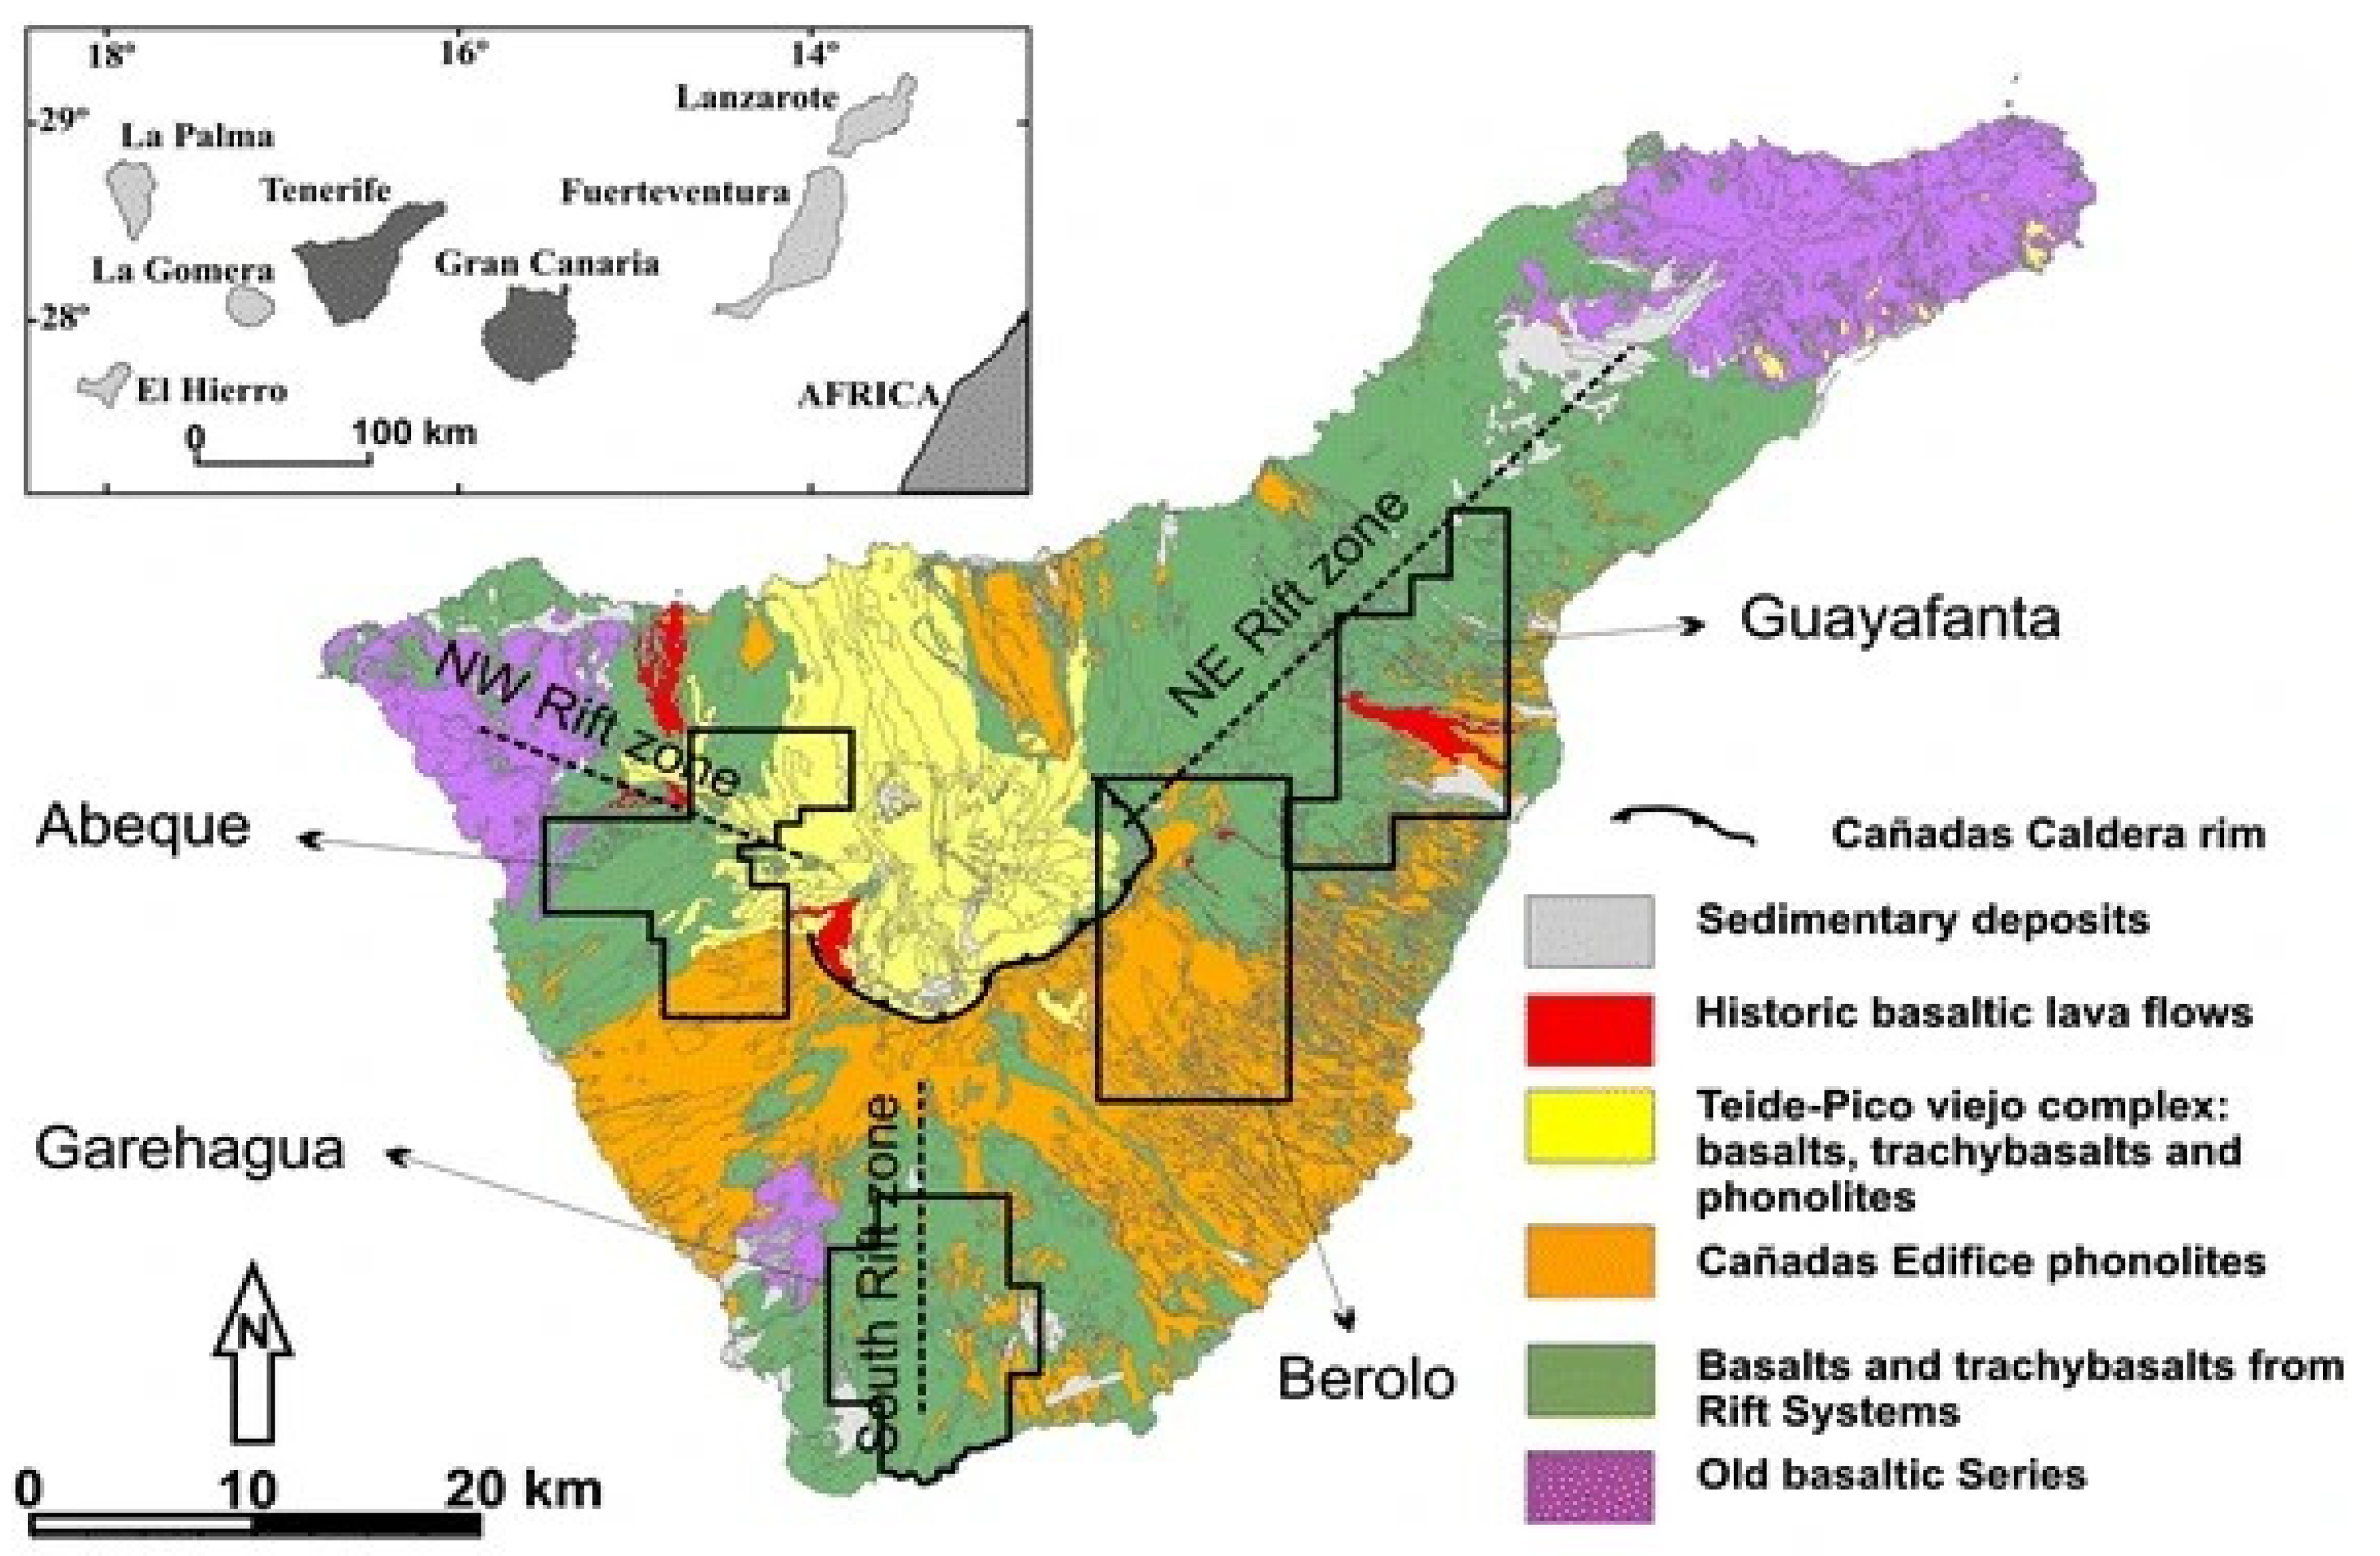
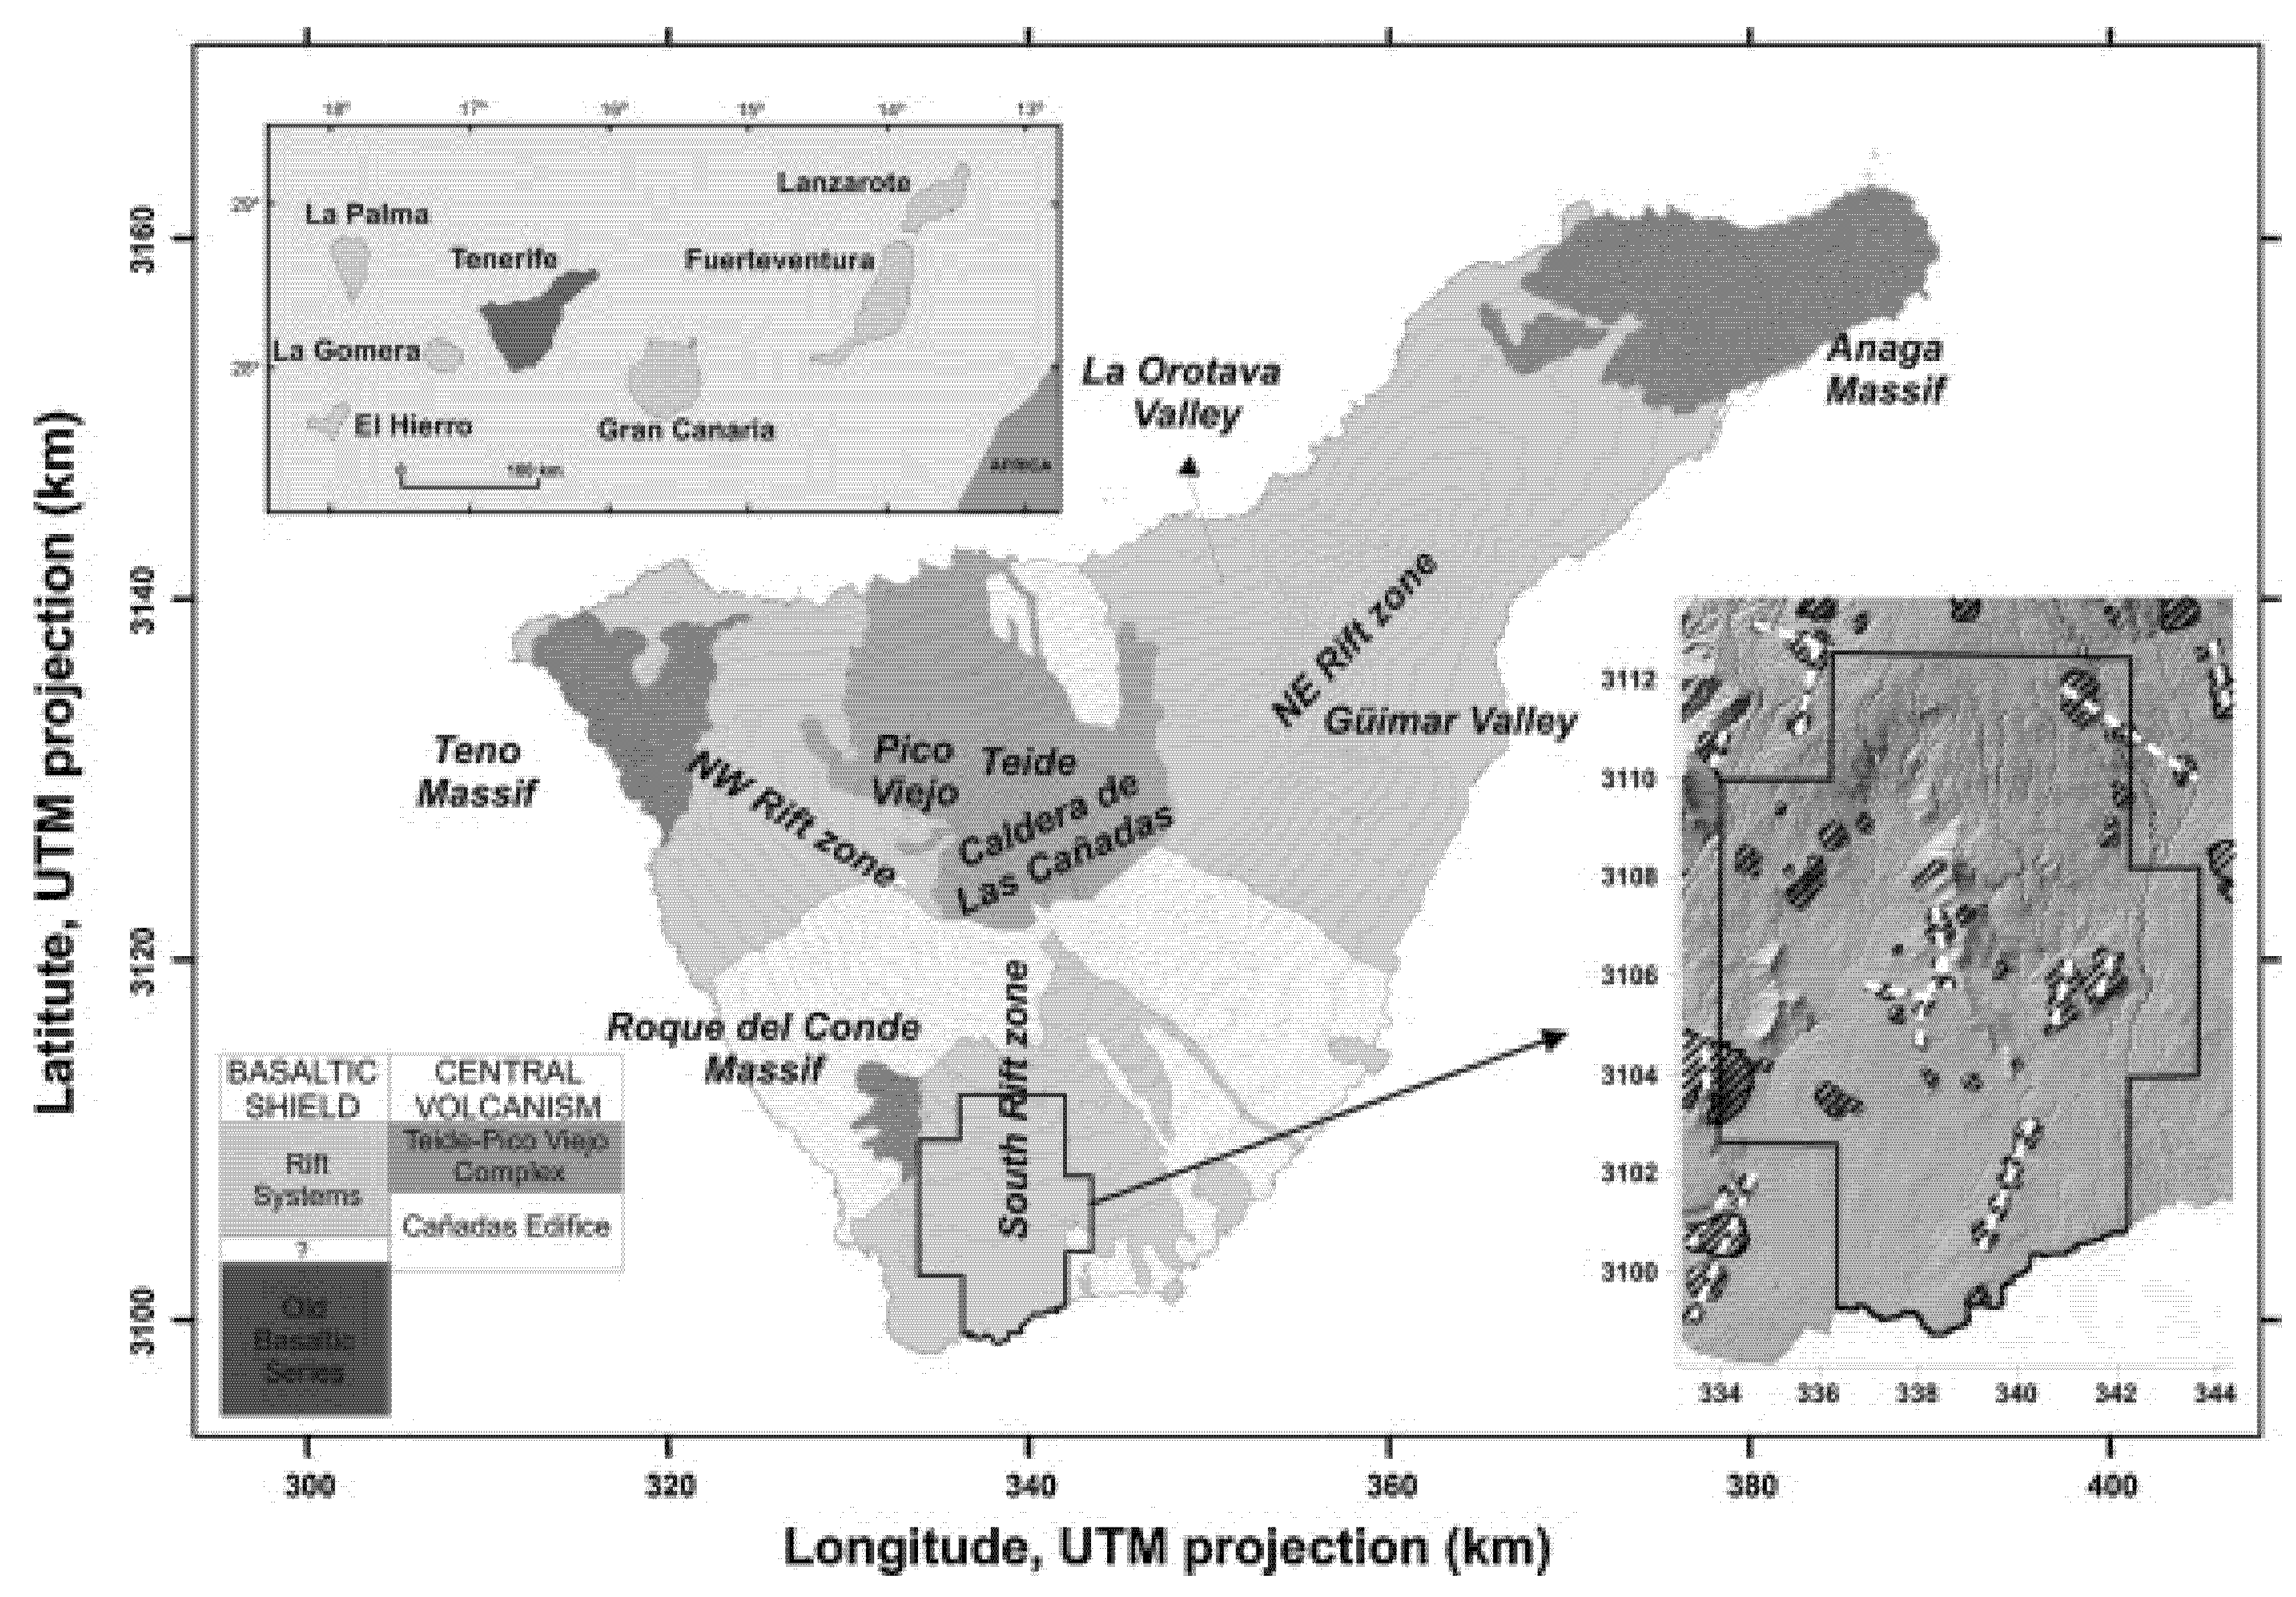
2. Geological and Structural Setting

Tenerife is the largest island of the Canary Archipelago, a chain of seven volcanic islands located off the northwest coast of Africa (intraplate setting on the African Plate). Volcanism in the Canaries has been active for over 20 million years, and several hypotheses have been proposed to explain this persistent magmatism on a passive margin. Two end-member models involve [21] tectonic uplift and fracturing of the lithosphere (possibly related to the Atlas Mountains of Morocco), creating pathways for magma, versus a stationary mantle plume (hotspot) under the archipelago. In either case, the following structural fabric of the region is important: major NE–SW and NW–SE trends (parallel to the Atlas orientation and Atlantic Ocean opening directions) have influenced magma ascent and island alignment [19]. These tectonic lineaments likely provided conduits that contributed significantly to the origin and long-lived nature of Canary Island volcanism.
Geologically, Tenerife consists of a complex volcanic edifice constructed in multiple stages. The earliest subaerial volcanism formed three Miocene basaltic shield massifs: Anaga in the northeast, Teno in the northwest, and Roque del Conde in the south. These “Ancient Basaltic Series” shields built the bulk of the island between ~12 Ma and 3.3 Ma [22,23], though some studies suggest initial subaerial eruptions as old as ~16 Ma. The shields are deeply eroded and are now exposed as massifs at the island’s corners. Volcanism then became concentrated in the central part of Tenerife with the development of the Las Cañadas volcanic complex starting around 3–4 Ma. This giant stratovolcano underwent several construction and destructive phases, including multiple caldera-forming explosive eruptions. The overlapping collapse depressions formed the Las Cañadas Caldera, a large depression (~16 × 9 km) in central Tenerife at ~2000 m elevation. Subsequent activity within this caldera gave rise to the Teide–Pico Viejo complex, a twin stratovolcano system, which remains active and reaches 3718 m at Teide, the highest peak in Spain. Teide’s fumaroles today are the only active geothermal surface manifestation in the Canaries, and gas geochemistry indicates a boiling hydrothermal system at depth with temperatures of ~250–300 °C [12].
Four of the study areas are located within the three differentiated volcanic rifts zones of Tenerife: NE Rift, NW Rift and south Rift (Figure 1). While the central stratovolcano was growing, basaltic volcanism persisted along these three rift zones which diverge from the central complex in a rough “Y” or triple-junction pattern (with rift arms oriented NW, NE, and S). This rift system is defined by alignments of hundreds of monogenetic cinder cones and fissure vents, reflecting the preferred pathways of magma ascent under extensional stress [20]. In fact, up to 297 monogenetic cones formed in Tenerife in the last ~1 million years, mainly along these rifts [24]. The typical geometry is a three-armed rift at ~120° separation, although in Tenerife, the southern rift is less pronounced topographically than the NW and NE rifts. The southern volcanic rift zone (the study area) lacks a well-defined linear ridge; instead, it exhibits a fan-shaped dispersal of cones and eruptive centers without a single dominant axis. Kröchert and Buchner [25] identified four main eruptive sequences in the southern rift during the Pleistocene, separated by long repose periods of ~70–250 kyr, and noted the presence of shallow-level syenitic intrusions in this zone as evidence for stalled magma bodies at crustal depths. Basanite, tephrite, and alkali basalt lava flows are common in this area (i.e., the Bandas del Sur formation).
The Garehagua mining license in southern Tenerife covers ~104 km2 of this rift zone (Figure 2). It spans parts of the municipalities of Vilaflor, Granadilla de Abona, San Miguel, and Arona, encompassing elevations from sea level to over 2000 m on the flank of Teide. The bedrock is predominantly Pleistocene basaltic to trachybasaltic lava flows and pyroclastics from the rift zone eruptions. A notable feature within the license is the Fuente del Valle subsurface gas manifestation: a bubbling gas occurrence rich in CO2 and helium was encountered ~2.85 km inside a water supply tunnel (gallery) in this area [26]. The gas from this underground spot contains ~85% CO2 with helium ~10 ppm and a high 3He/4He ratio (~7.0 R_A, where R_A is atmospheric ratio), plus very high radon (~100 kBq/m3). This indicates a strong magmatic component and suggests the presence of a permeable fault or fracture zone tapping deep geothermal fluids. Indeed, the occurrence of such a magmatic gas anomaly at depth implies that the study area is traversed by structures allowing upward migration of volcanic-hydrothermal gases, even though no hot springs or fumaroles are seen at the surface. These characteristics make the Garehagua area a compelling target for surface geochemical exploration and geothermal modeling.
Finally, it is worth noting the broader geothermal significance of the area. While high heat flow and hydrothermal systems are known on Tenerife (e.g., beneath Teide), the island and the archipelago in general have seen limited geothermal development to date. Past geothermal exploration programs in the 1970s–1990s by the Spanish Geological Survey identified several promising zones, but interest waned until a resurgence of research in the 2000s. Recent interdisciplinary studies combining geology, geochemistry, and geophysics (including the present study) are now revisiting these zones to locate and characterize potential reservoirs more precisely. This study contributes to this renewed effort, focusing on an area with no obvious surface geothermal manifestations but considerable subsurface evidence of a hydrothermal system.

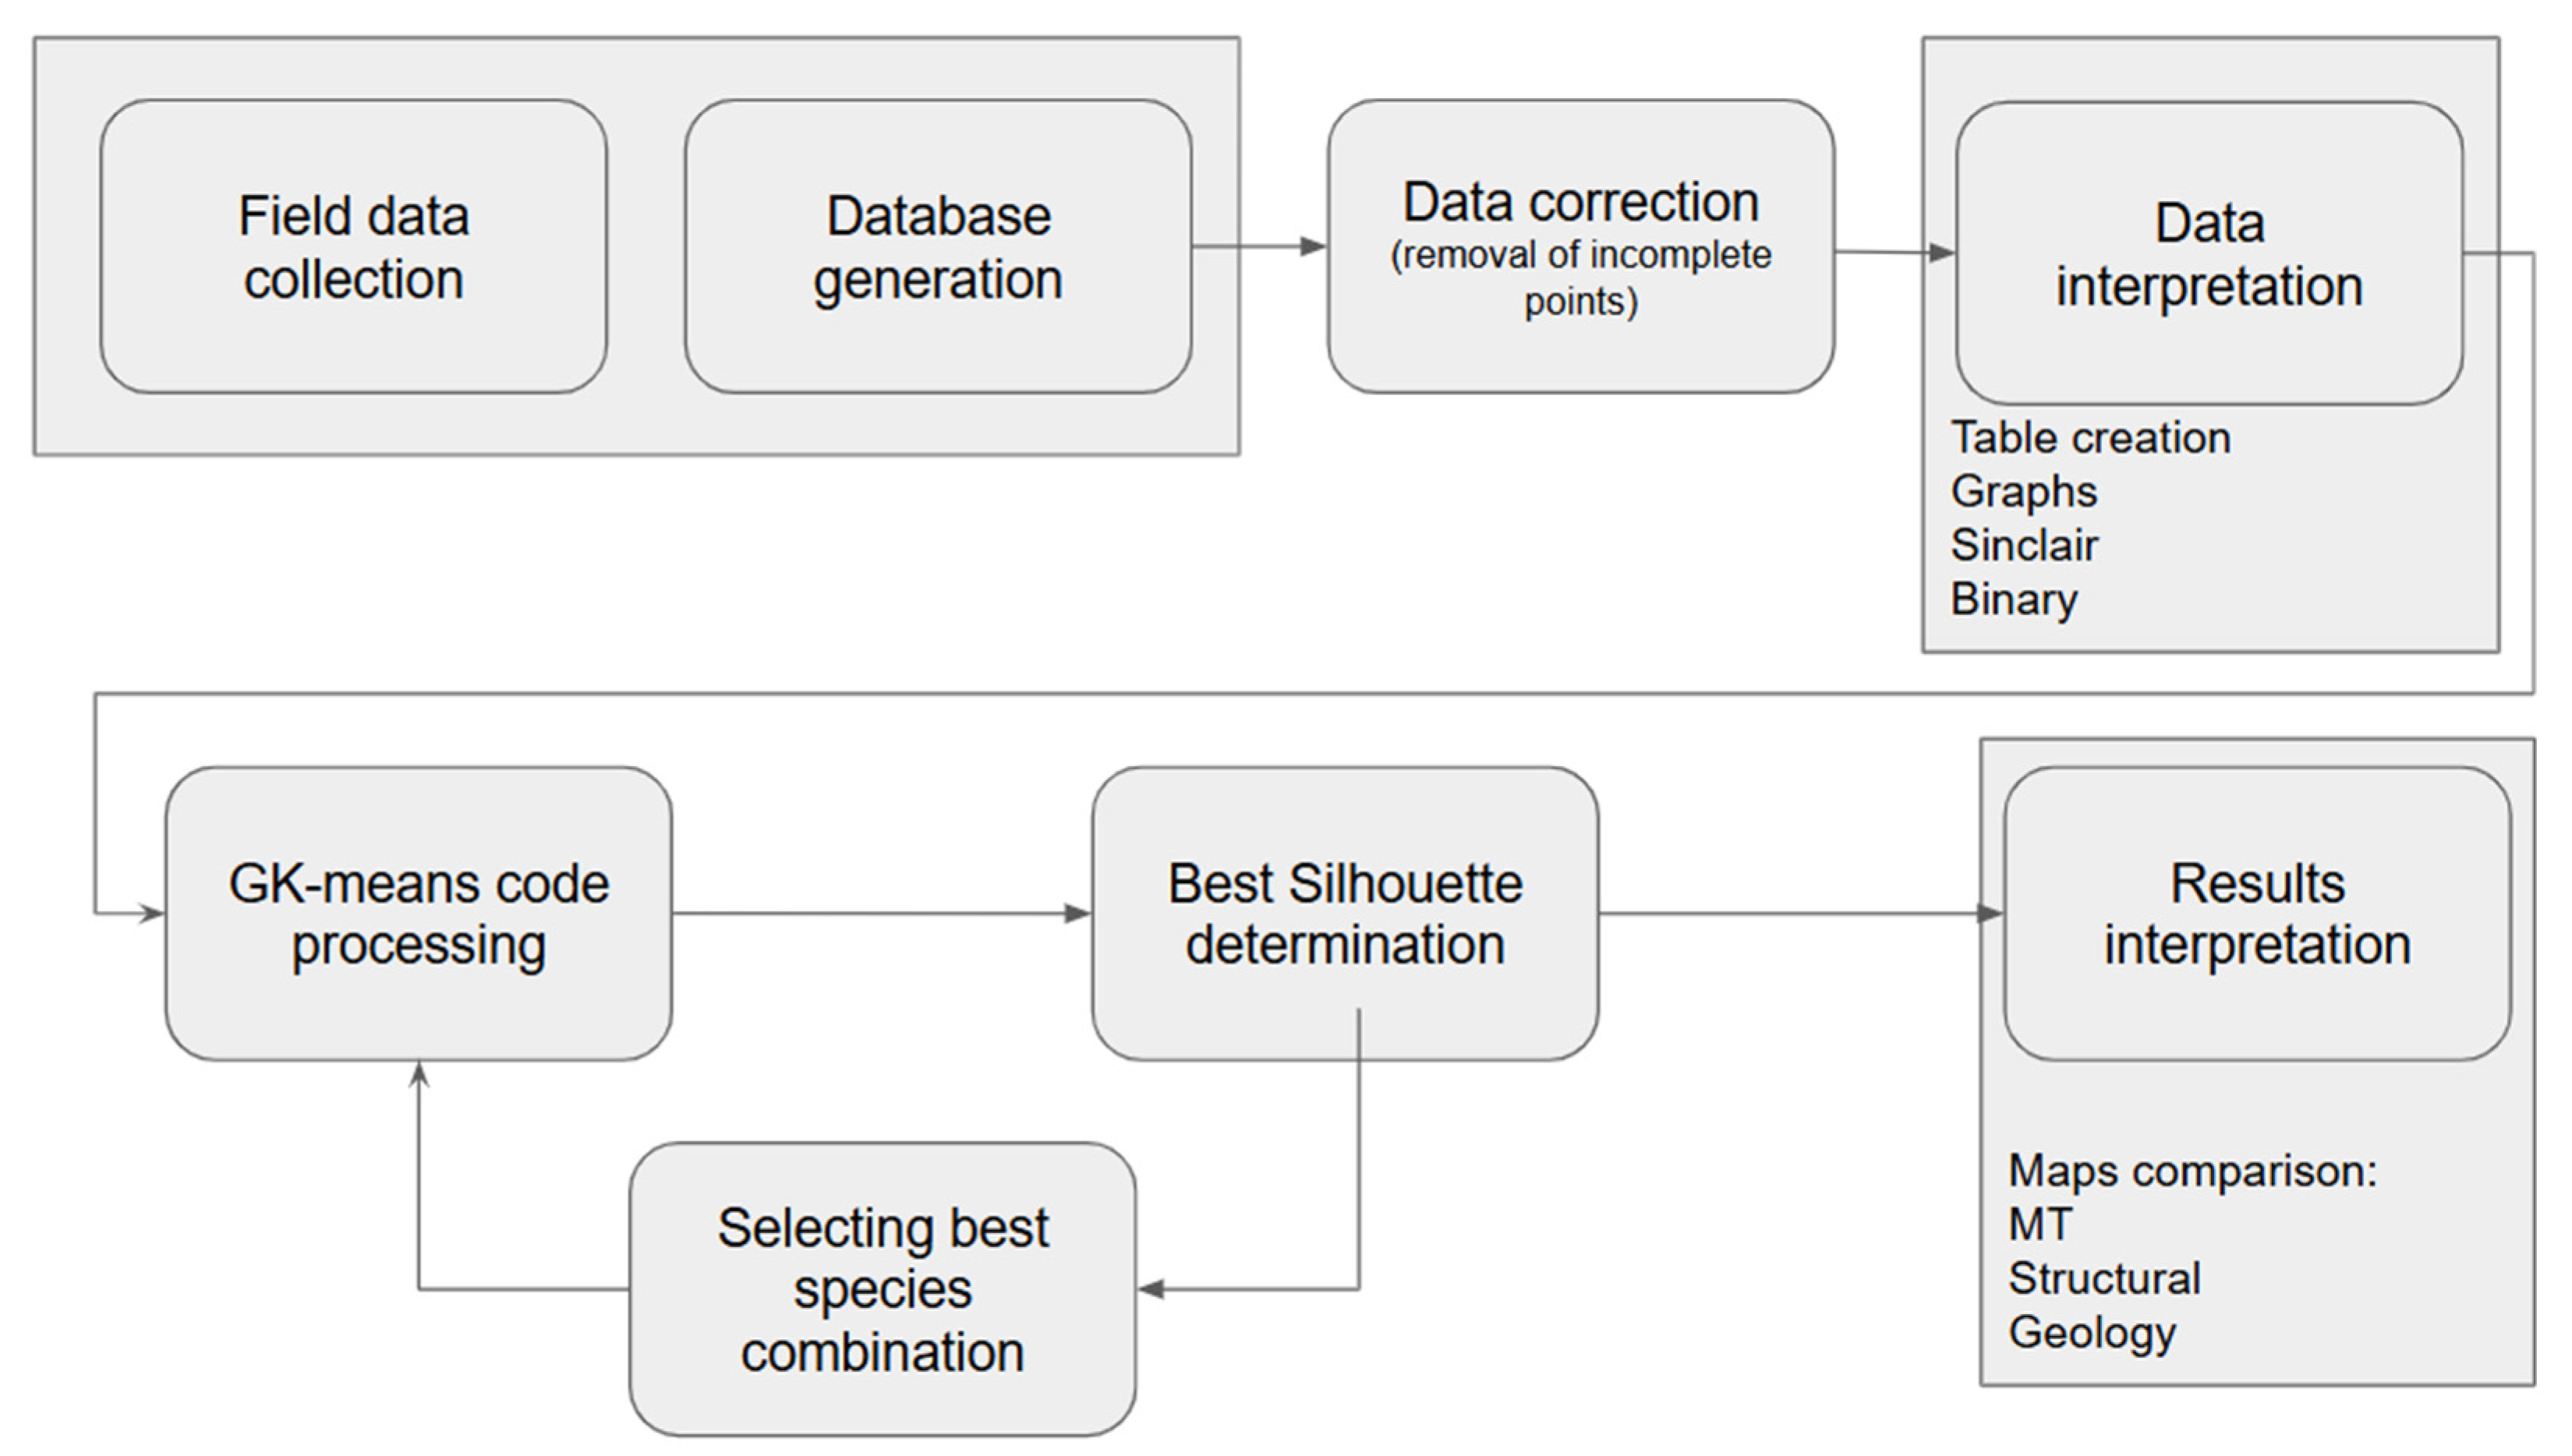
3. Materials and Methods

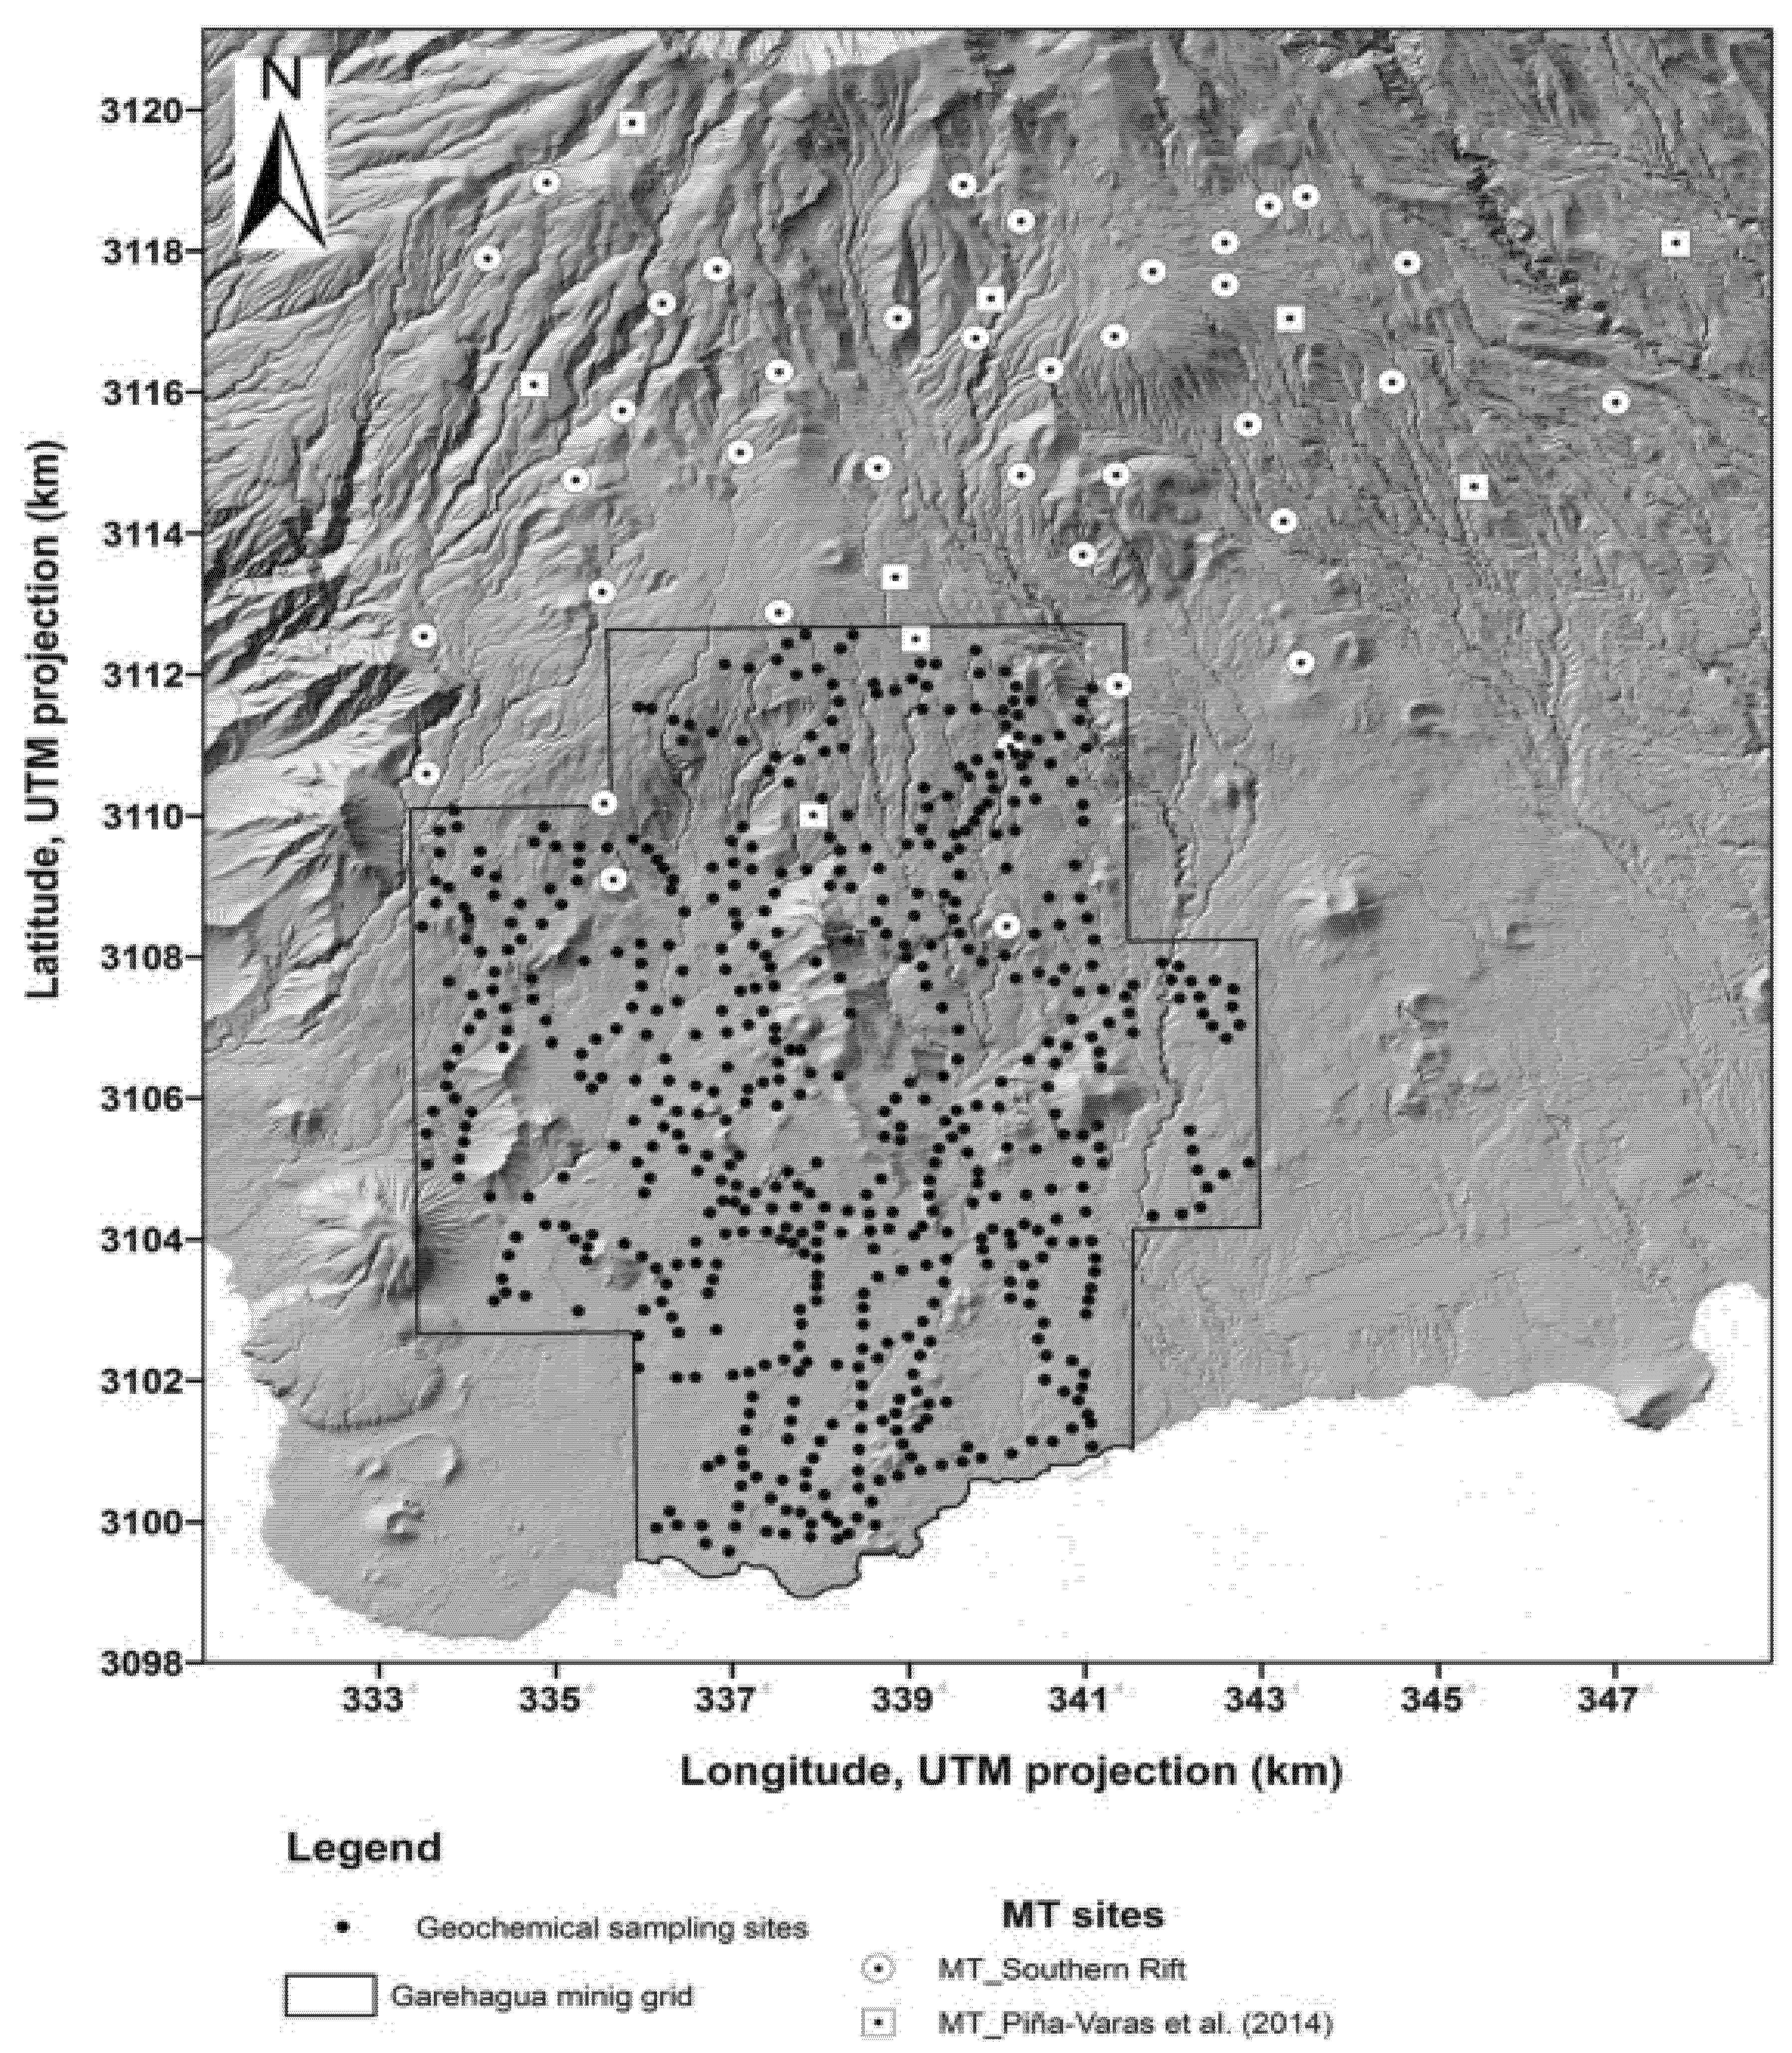
3.1. Soil Gas Survey and Analytical Techniques

A detailed soil gas and diffuse degassing survey was conducted across the Garehagua mining license area in 2011–2014 as part of geothermal exploration efforts. A total of 1050 sampling sites were established, distributed as uniformly as terrain and access allowed over the ~104 km2 area (average spacing ~250 m).
The first survey focused on the Garehagua license area, while the second campaign extended into the adjacent Garehagua II sector. Both campaigns were conducted under stable meteorological conditions, with no volcanic unrest or anomalous seismic activity reported during the study period. The time gap between campaigns, despite consistent sampling protocols, may have contributed to the bimodal patterns observed in certain geochemical variables. This temporal distinction justifies each subset separately before applying integrated clustering.
Figure 3 shows the sampling locations, which cover both lowlands and highlands of the southern rift zone. Each station was georeferenced (latitude, longitude, and elevation) and involved a suite of in situ measurements and sample collections as follows:
Diffuse CO2 Flux: The soil CO2 efflux was measured in the field using the accumulation chamber method (portable infrared gas analyzer). This method quantifies the rate of CO2 emission from the ground (typically expressed in g·m−2·day−1). CO2 flux is a crucial indicator, as CO2 is a major component of magmatic gases and can migrate upward even in the quiescent phase of a volcano’s activity.
Radon (222Rn) and Thoron (220Rn) Activity: In-situ soil gas measurements were made for radon and thoron using a portable alpha scintillation detector (or an equivalent device) placed at ~40 cm depth. Radon isotopes are useful tracers of deep gas and permeability; 222Rn (t_1/2 ≈ 3.8 d) can signal recent fracture-driven degassing, while 220Rn (t_1/2 ≈ 55 s) reflects very local sources due to its short half-life.
Soil Gas Sample Collection: A discrete gas sample was extracted from ~40 cm depth using a stainless-steel probe and syringe/pump and then stored in evacuated vials for laboratory analysis of its composition and isotopic ratios. The gases and parameters analyzed later in the laboratory include the following:
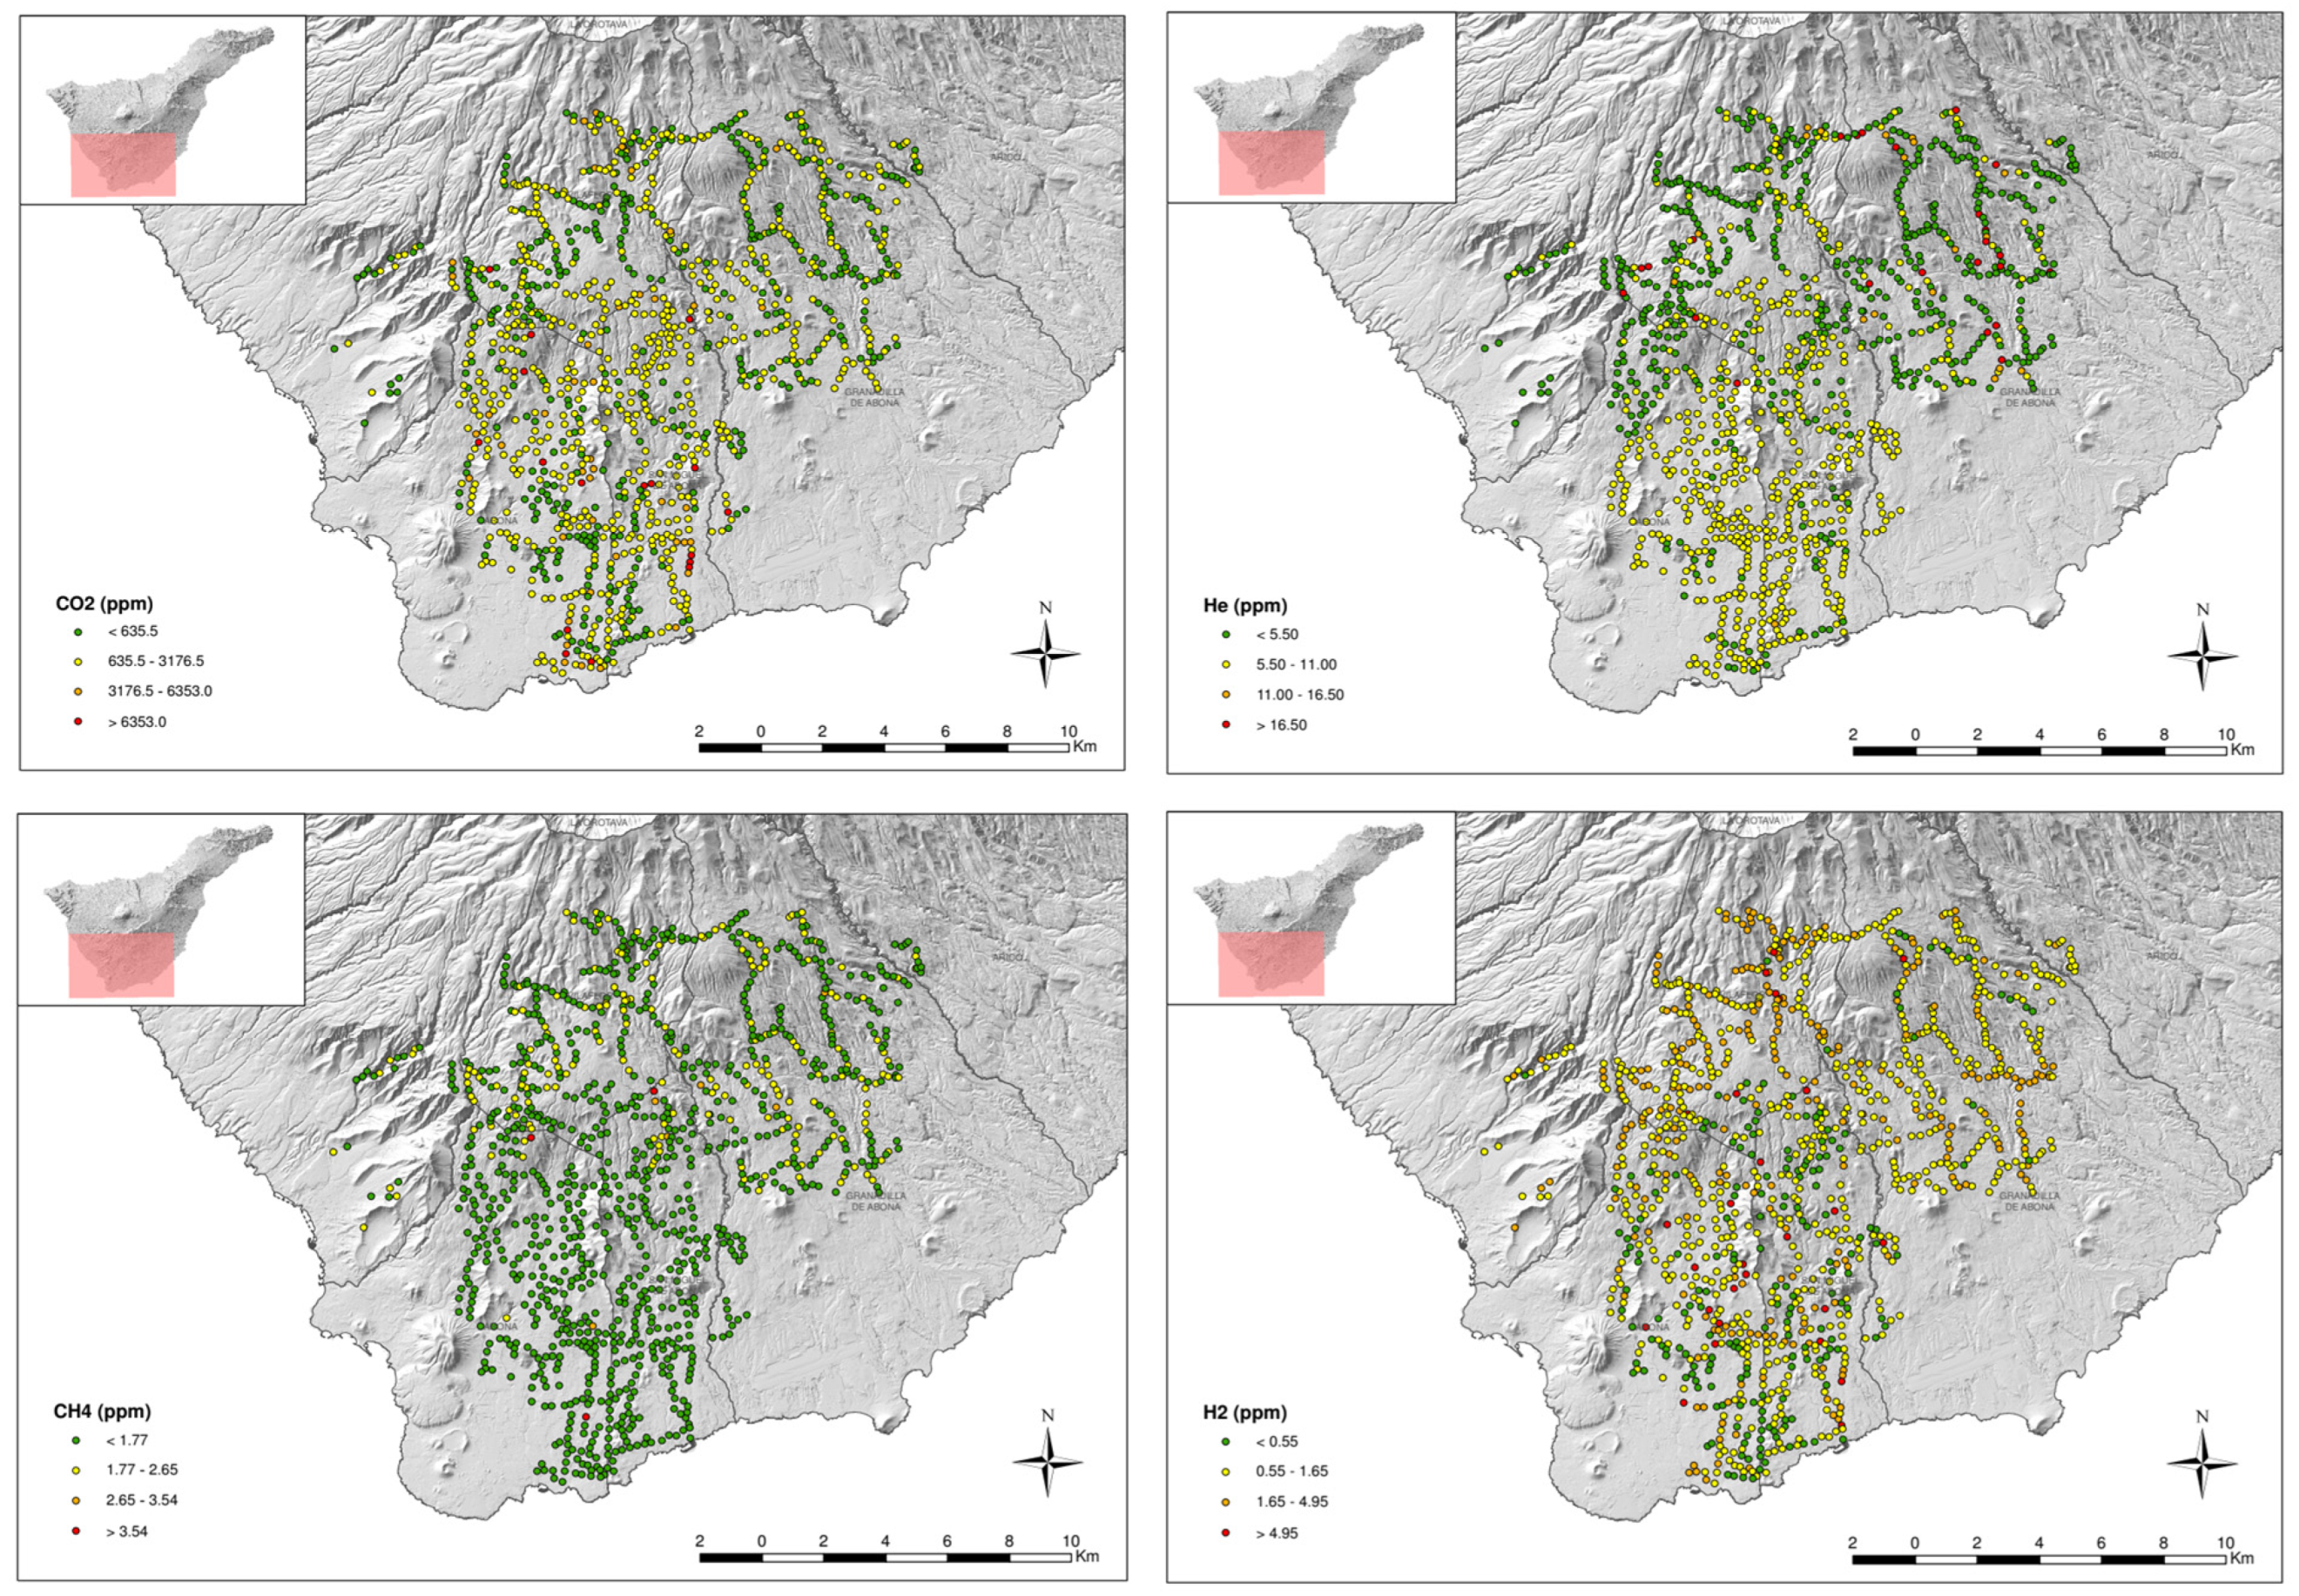
  • Major gas species (volume % or ppm): He, H2, O2, N2, CO2, and CH4. These were analyzed by gas chromatography (for H2, O2, N2, CH4, and CO2 in the collected samples) and a mass spectrometer for He.
  • O2 and N2 mainly represent atmospheric components, but depletion of O2 or enrichment of N2 beyond atmospheric ratios can indicate biological activity or injection of volcanic gases. Helium, hydrogen, and methane in soil gas are typically very low in normal air; any significant enhancement suggests deep or crustal processes (He is a key indicator of magmatic contributions, and H2 indicates redox conditions and water–rock interaction at depth).
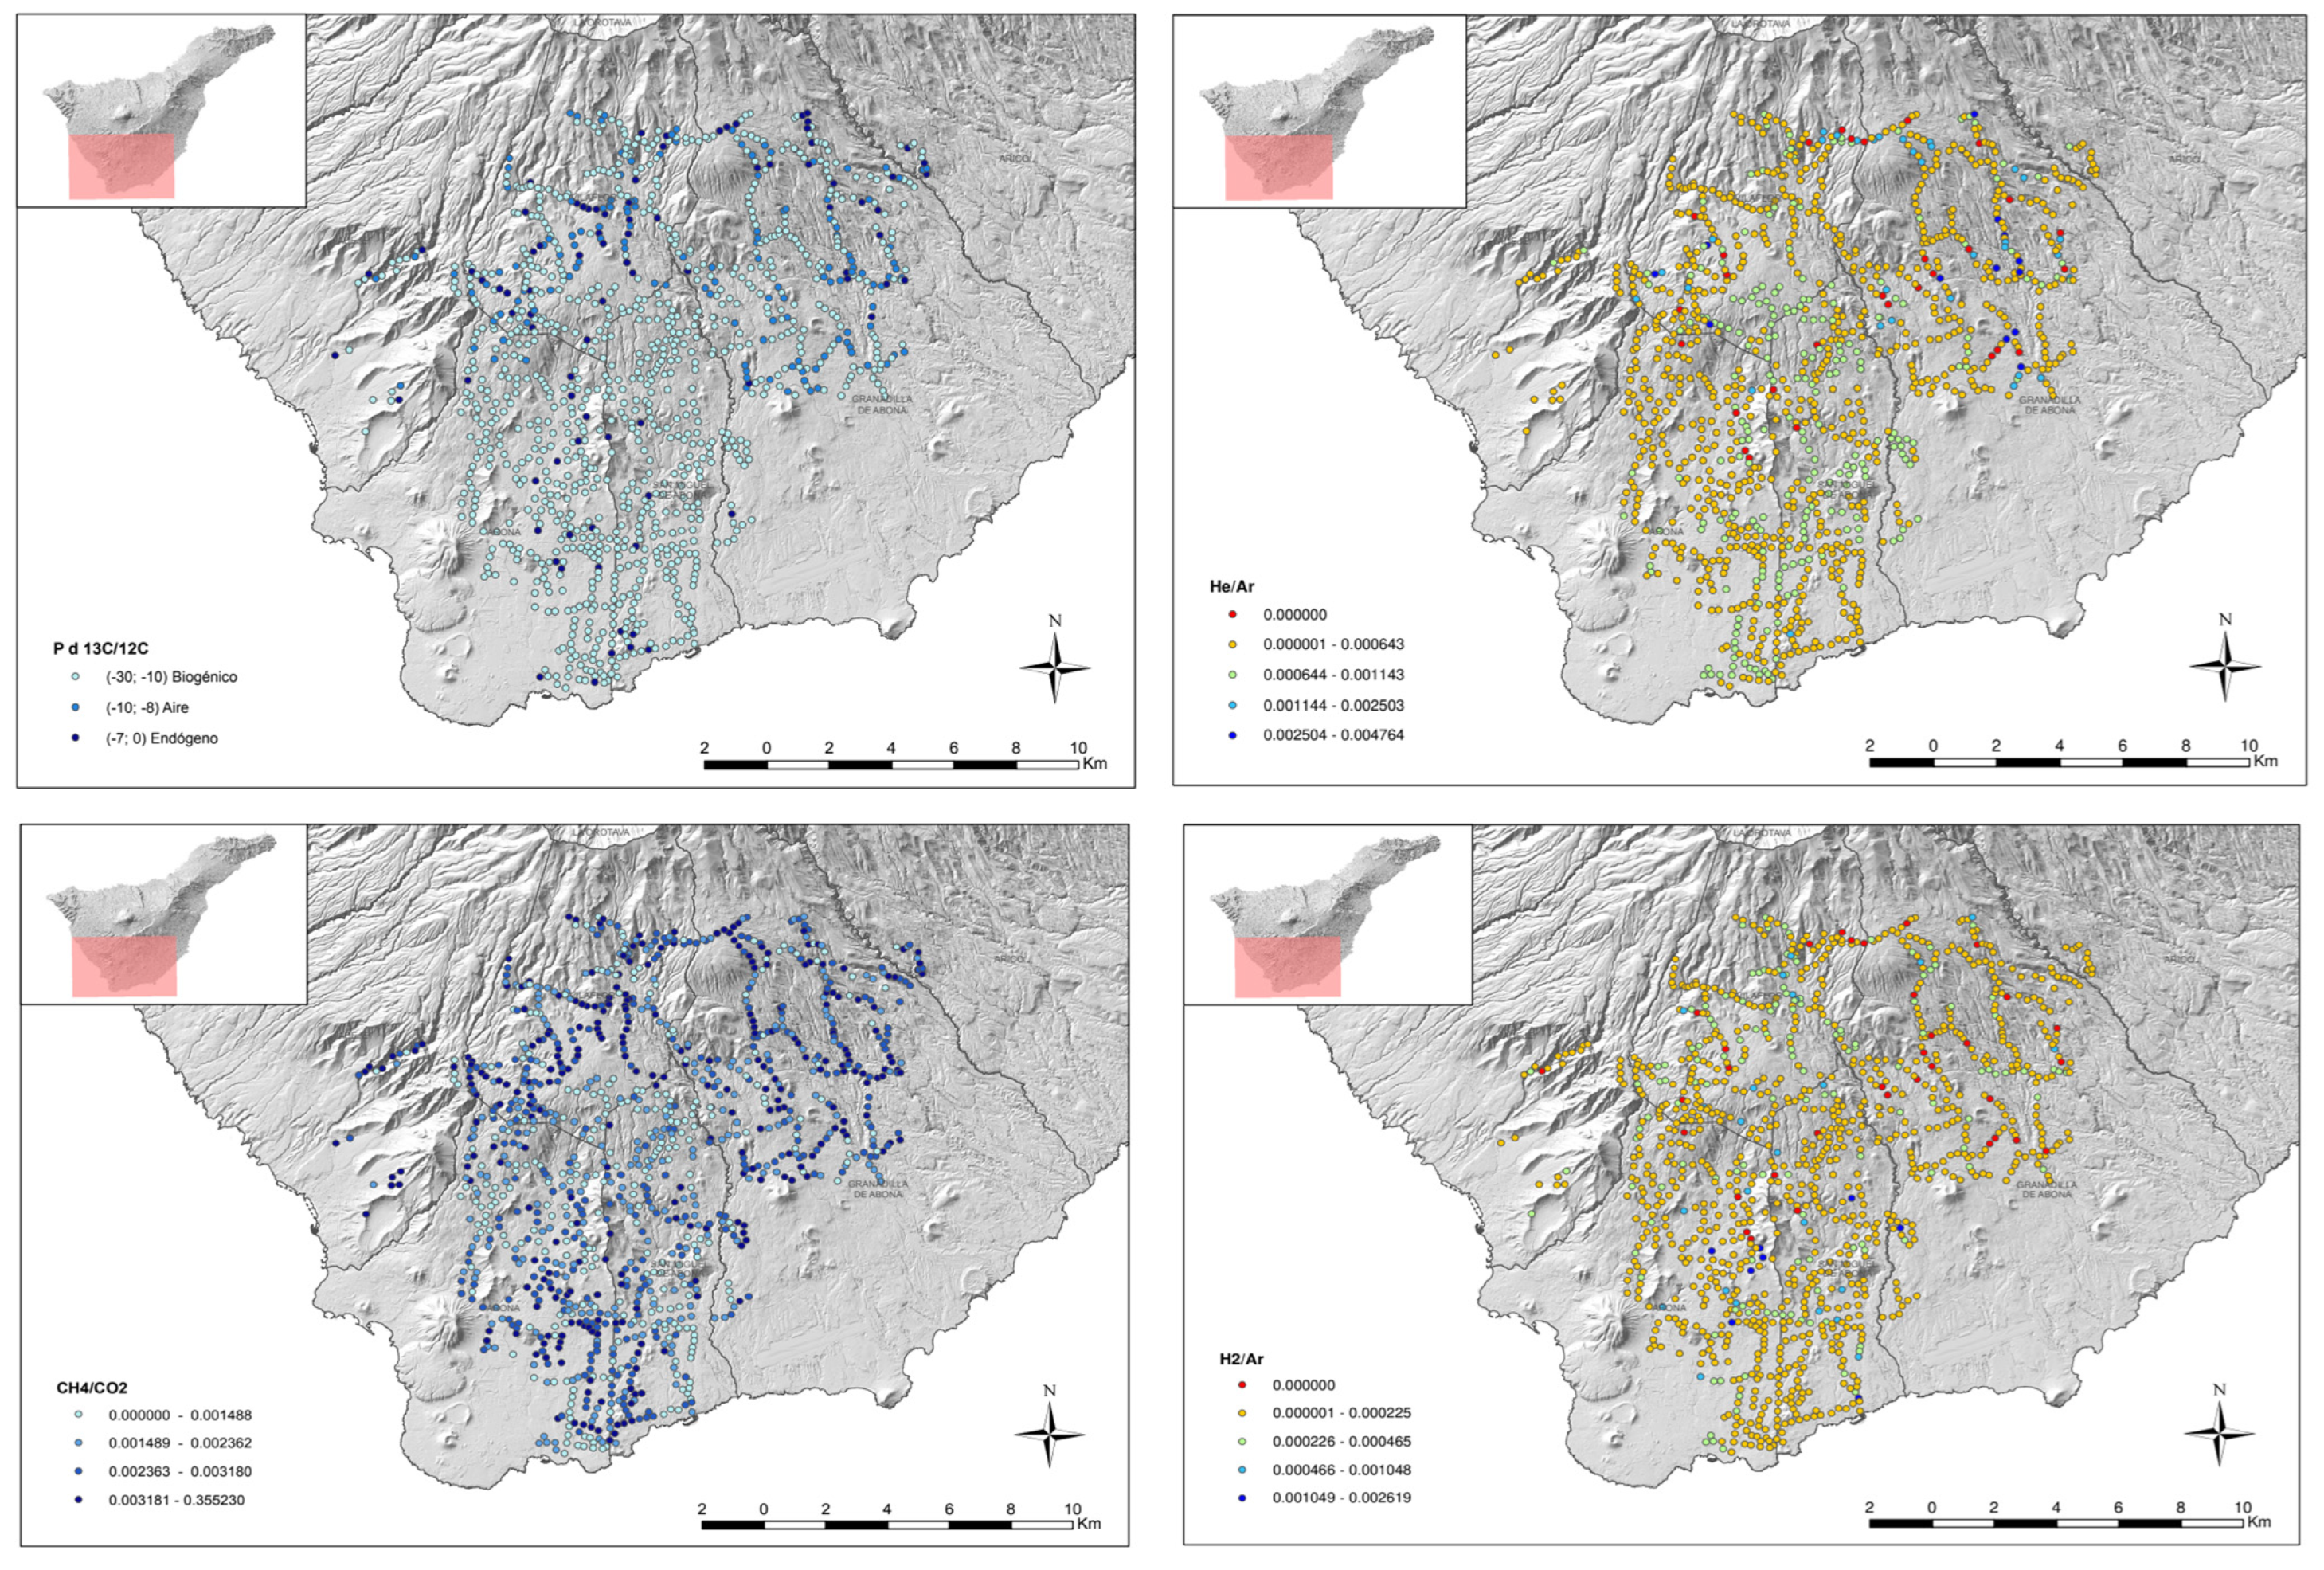
  • Argon isotopic composition (36Ar, 38Ar, and 40Ar): measured via a quadrupole mass spectrometer. The isotopic ratios of argon can reveal excess radiogenic 40Ar or air-derived Ar, helping to distinguish atmospheric vs. mantle sources of the gases.
  • Carbon isotopic ratio of CO213C-CO2): analyzed with an isotope ratio mass spectrometer. δ13C values in CO2 help differentiate between biogenic (soil respiration, typically 13C-depleted) and deep magmatic or limestone-derived CO2 (often 13C-enriched). In our context, magmatic CO2 typically has δ13C around −4 to −8‰ vs. VPDB, whereas biogenic CO2 is ~−25‰; thus, isotopically heavy CO2 anomalies can indicate a deep magmatic carbon contribution.
Each of these measurements is standard in geothermal geochemical exploration. The combination of CO2 flux and gas composition data provides a comprehensive picture of diffuse degassing. High CO2 flux coupled with helium enrichment in soil gas, for example, is a strong signal of a hidden geothermal feeder, since CO2 is abundant in magmatic fluids and He is an inert tracer of deep magmatic degassing. Radon anomalies, on the other hand, mark zones of enhanced permeability, such as faults. Table 1 summarizes the ranges and mean values of the key measured parameters in the dataset.
Prior to analysis, all gas concentration data were corrected for atmospheric contributions where applicable (e.g., subtracting atmospheric baseline for He, normalizing concentrations to eliminate dilution by air using O2-N2 as air indicators). The substantial number of sampling sites ensures a robust statistical baseline for each parameter. As expected in volcanic terrains, most gases showed a positively skewed distribution with a long tail of high values at a few sites, characteristic of geochemical anomalies overlain on a broad background population.

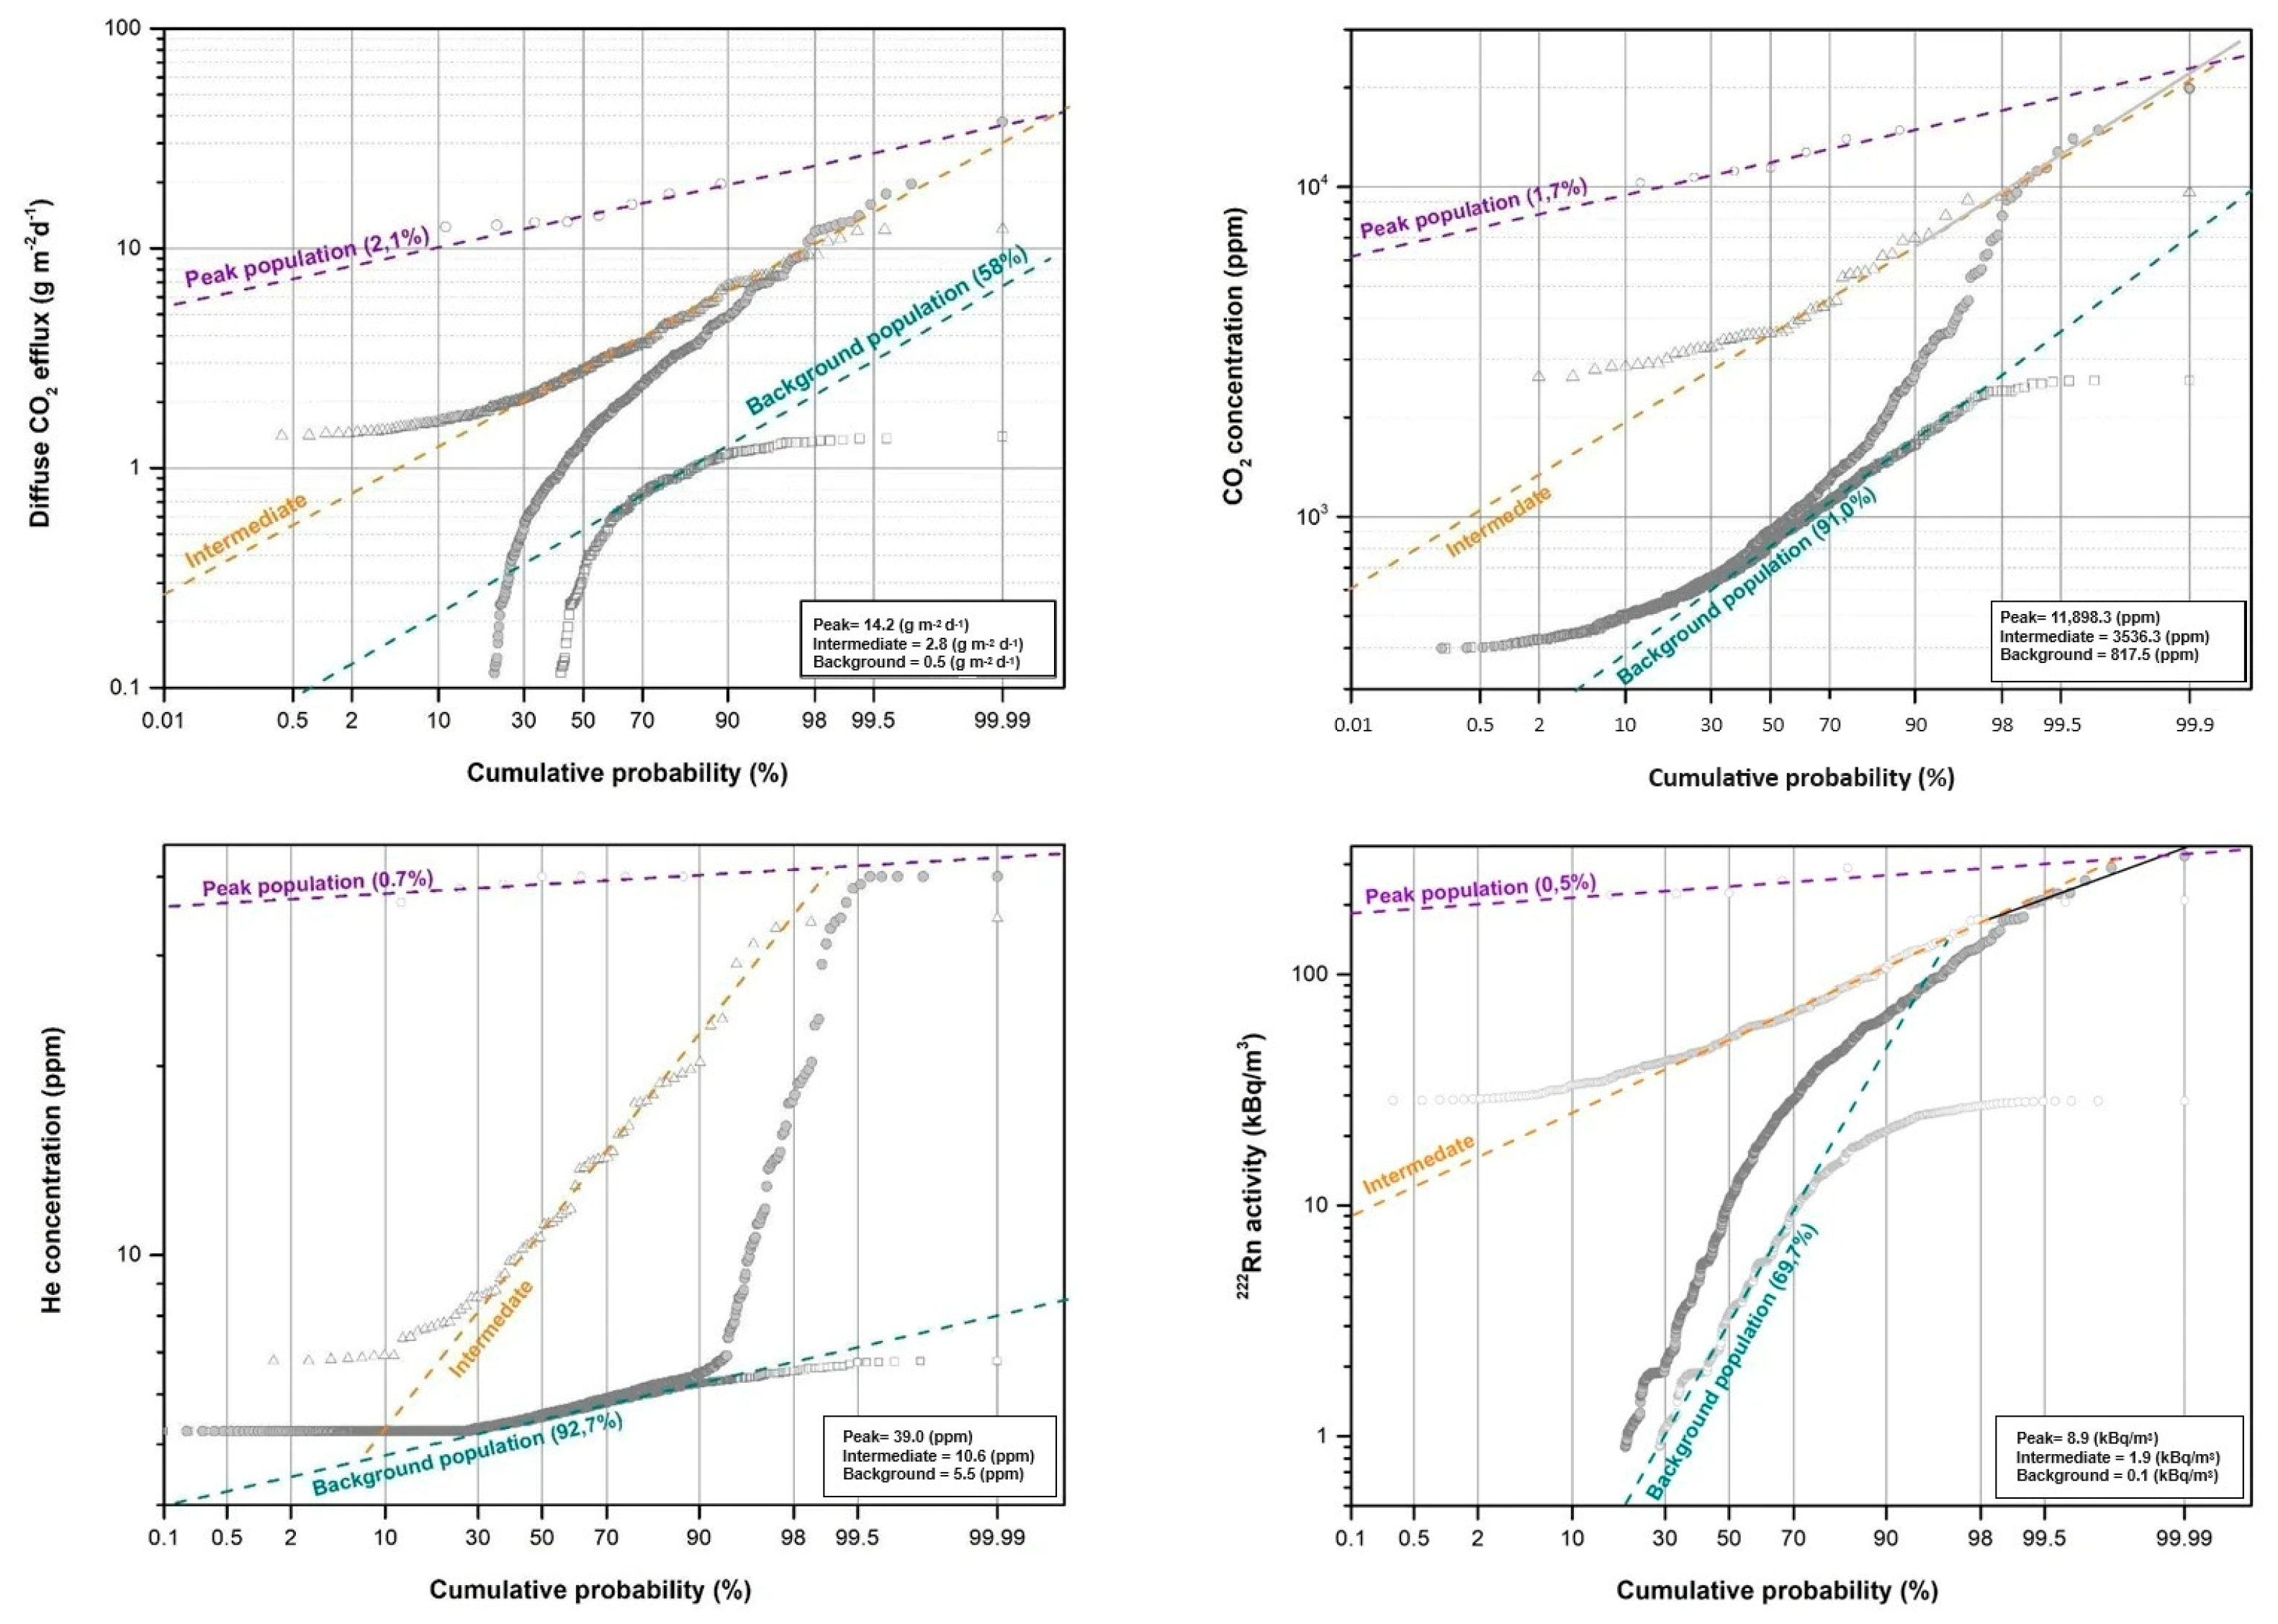
3.2. Geochemical Anomaly Threshold Determination (Sinclair Method)

To distinguish anomalous geochemical signals from background variability, we applied the Sinclair [8] statistical-graphical method to the key geochemical parameters. This method is widely used in exploration geochemistry to objectively separate multi-modal geochemical populations, typically identifying a background population and one or more anomalous populations within a dataset. It assumes that, in the absence of geothermal or mineralization influences, geochemical measurements follow an approximately log-normal distribution, reflecting crustal abundance and homogeneous geological processes. Anomalies caused by deep-seated degassing manifest as a separate population of elevated values superimposed on this background distribution.
The Sinclair method [8] is a robust statistical approach for separating geochemical populations in a compositional dataset, particularly useful when the presence of overlapping populations corresponding to background, intermediate enrichment, and geochemical anomalies is expected.
For each gas species of interest (particularly CO2 efflux, He concentration, and 222Rn activity, which are primary indicators of deep degassing), we constructed cumulative probability plots and log-probability graphs. Breaks in slope on these plots indicate the presence of multiple overlapping log-normal distributions (e.g., a lower segment for background and an upper tail for anomalous values). From these, we estimated a threshold value separating background and anomalous populations. As a simplifying criterion, we also computed thresholds using the mean plus two standard deviations (μ + 2σ) on log-transformed data, which roughly corresponds to the 98th percentile, serving as a conservative anomaly cutoff. In practice, we applied a few iterative steps as follows: data strongly deviating from log-normality were winsorized or adjusted by removing obvious outliers, after which the threshold was refined.
Using the threshold criteria, each sampling site’s value for a given gas could be classified as background or anomalous. We further categorized anomaly magnitudes in orders above the threshold: e.g., values 2–3 times above the threshold as “moderately anomalous”, >5× as “strongly anomalous”, etc., following ranges established in exploration geochemistry. This provides a first-pass map of individual anomalies. For example, in the case of soil CO2 flux, a threshold of ~15 g·m−2·d−1 (illustrative value) might differentiate background levels (due to soil respiration and atmospheric diffusion) from anomalous fluxes likely of volcanic origin [28,29]. Sites exceeding 75 g·m−2·d−1 (>5× threshold) would be classified as strongly anomalous. Similarly, a helium concentration threshold might be set around 5 ppmv (above atmospheric ~5.24 ppmv, indicating excess He) [30], and radon might have a threshold on the order of a 1–3 kBq/m3 depending on local uranium content in soils [31].
This univariate anomaly detection was not the final goal but rather a crucial preprocessing step to guide and validate the multivariate clustering. The identified high-anomaly sites for different gases were compared spatially to assess whether they coincide, which would suggest a common deep source. Indeed, in the dataset, many of the strongest CO2 anomalies also exhibited elevated helium and radon levels, indicating that a combined analysis is warranted. It is essential to verify the assumption of an approximately log-normal background distribution. In the dataset, parameters such as CO2 flux and helium concentration exhibited log-normal behavior for the lower 90% of the data, with a distinct break in the upper 5–10%, consistent with a geogenic anomaly tail. Where necessary, slight adjustments were applied (e.g., using a threshold factor k slightly different from 2 for non-normal distributions) to ensure that meaningful anomalies were captured while minimizing false positives.
Breaks in slope on logarithmic probability plots reveal the presence of multiple overlapping log-normal populations. For each gas species, we identified the following two distinct populations: a background (B) population and an anomalous or peak (P) population.
Similarly, for soil CO2 concentrations, the B population encompassed 91.0% of the data with a mean of 817.5 ppm, consistent with atmospheric and soil-respired CO2 levels. The P population (1.7% of data) had a mean of 11,898.3 ppm, indicating significant contributions from deeper, likely magmatic, sources.
As shown in Figure 4, cumulative probability plots were generated for soil diffuse CO₂ efflux, soil CO₂ concentration, soil ²²²Rn, and He concentration values.
Radon (222Rn) activity showed comparable behavior. The analysis identified a B population, with a mean of 0.1 kBq/m3, reflecting natural emanation from uranium-bearing minerals in the shallow soil [32], and a P population, with a mean of 8.9 kBq/m3, suggesting enhanced fluxes from deeper sources through permeability structures like faults.
Helium concentrations also conformed to this pattern. The B population (mean: 5.5 ppm, 92.7% of the data) aligned with atmospheric levels (~5.24 ppmv). The P population, with a mean of 39.0 ppm (0.7% of data), indicated significant contributions from mantle-derived or crustal sources associated with deep degassing.
Thresholds were conservatively set at the mean plus two standard deviations (μ + 2σ) of the log-transformed data, roughly corresponding to the 97.5th percentile. For instance, a threshold of ~15 g·m⁻2·d⁻1 for CO2 flux effectively distinguished background emissions from anomalous volcanic-origin fluxes. Values exceeding ~75 g·m⁻2·d⁻1 (>5× threshold) were classified as strongly anomalous. These thresholds were refined iteratively, with outliers treated appropriately to maintain statistical robustness.
Anomaly magnitudes were further categorized relative to the established thresholds: values 2–3 times above threshold were labelled “moderately anomalous”, while those >5 times were “strongly anomalous”. This classification provided a first-pass mapping of individual anomalies across the study area.
Importantly, this univariate anomaly detection was not an endpoint but a crucial preprocessing step to guide and validate subsequent multivariate clustering analyses. Spatial comparisons revealed significant overlap between high-anomaly sites for different gases. Notably, many of the strongest CO2 anomalies coincided with elevated helium and radon values, indicating a likely common deep-seated source.
The assumption of near log-normal background behavior held true for most parameters: for CO2 flux and He, approximately 90% of data followed log-normal distributions, with a distinct anomaly tail in the upper 2%. Where necessary, threshold factors were fine-tuned (e.g., using factors slightly different from 2) to balance the detection of meaningful anomalies against the risk of false positives.
Overall, this integrated approach, combining rigorous statistical-graphical analysis with iterative refinement and cross-gas spatial validation, provided a robust framework for distinguishing background processes from genuine geogenic anomalies, setting a solid foundation for advanced multivariate exploration models.
The spatial distribution of soil gas concentrations was analyzed using univariate statistical methods. Figure 5 shows the concentration maps of CO₂, CH₄, He, and H₂ obtained for the Garehagua study area through the application of the Sinclair (1974) method [8], allowing the identification of geochemical anomalies related to deep-seated degassing structures.
To complement the concentration analysis, several geochemical ratios were evaluated to infer the origin and migration processes of soil gases. Figure 6 presents the spatial distribution maps of δ¹³C/¹²C, He/Ar, CH₄/CO₂, and H₂/Ar ratios in the Garehagua study area, offering further insights into gas source signatures, redox conditions, and mixing dynamics.

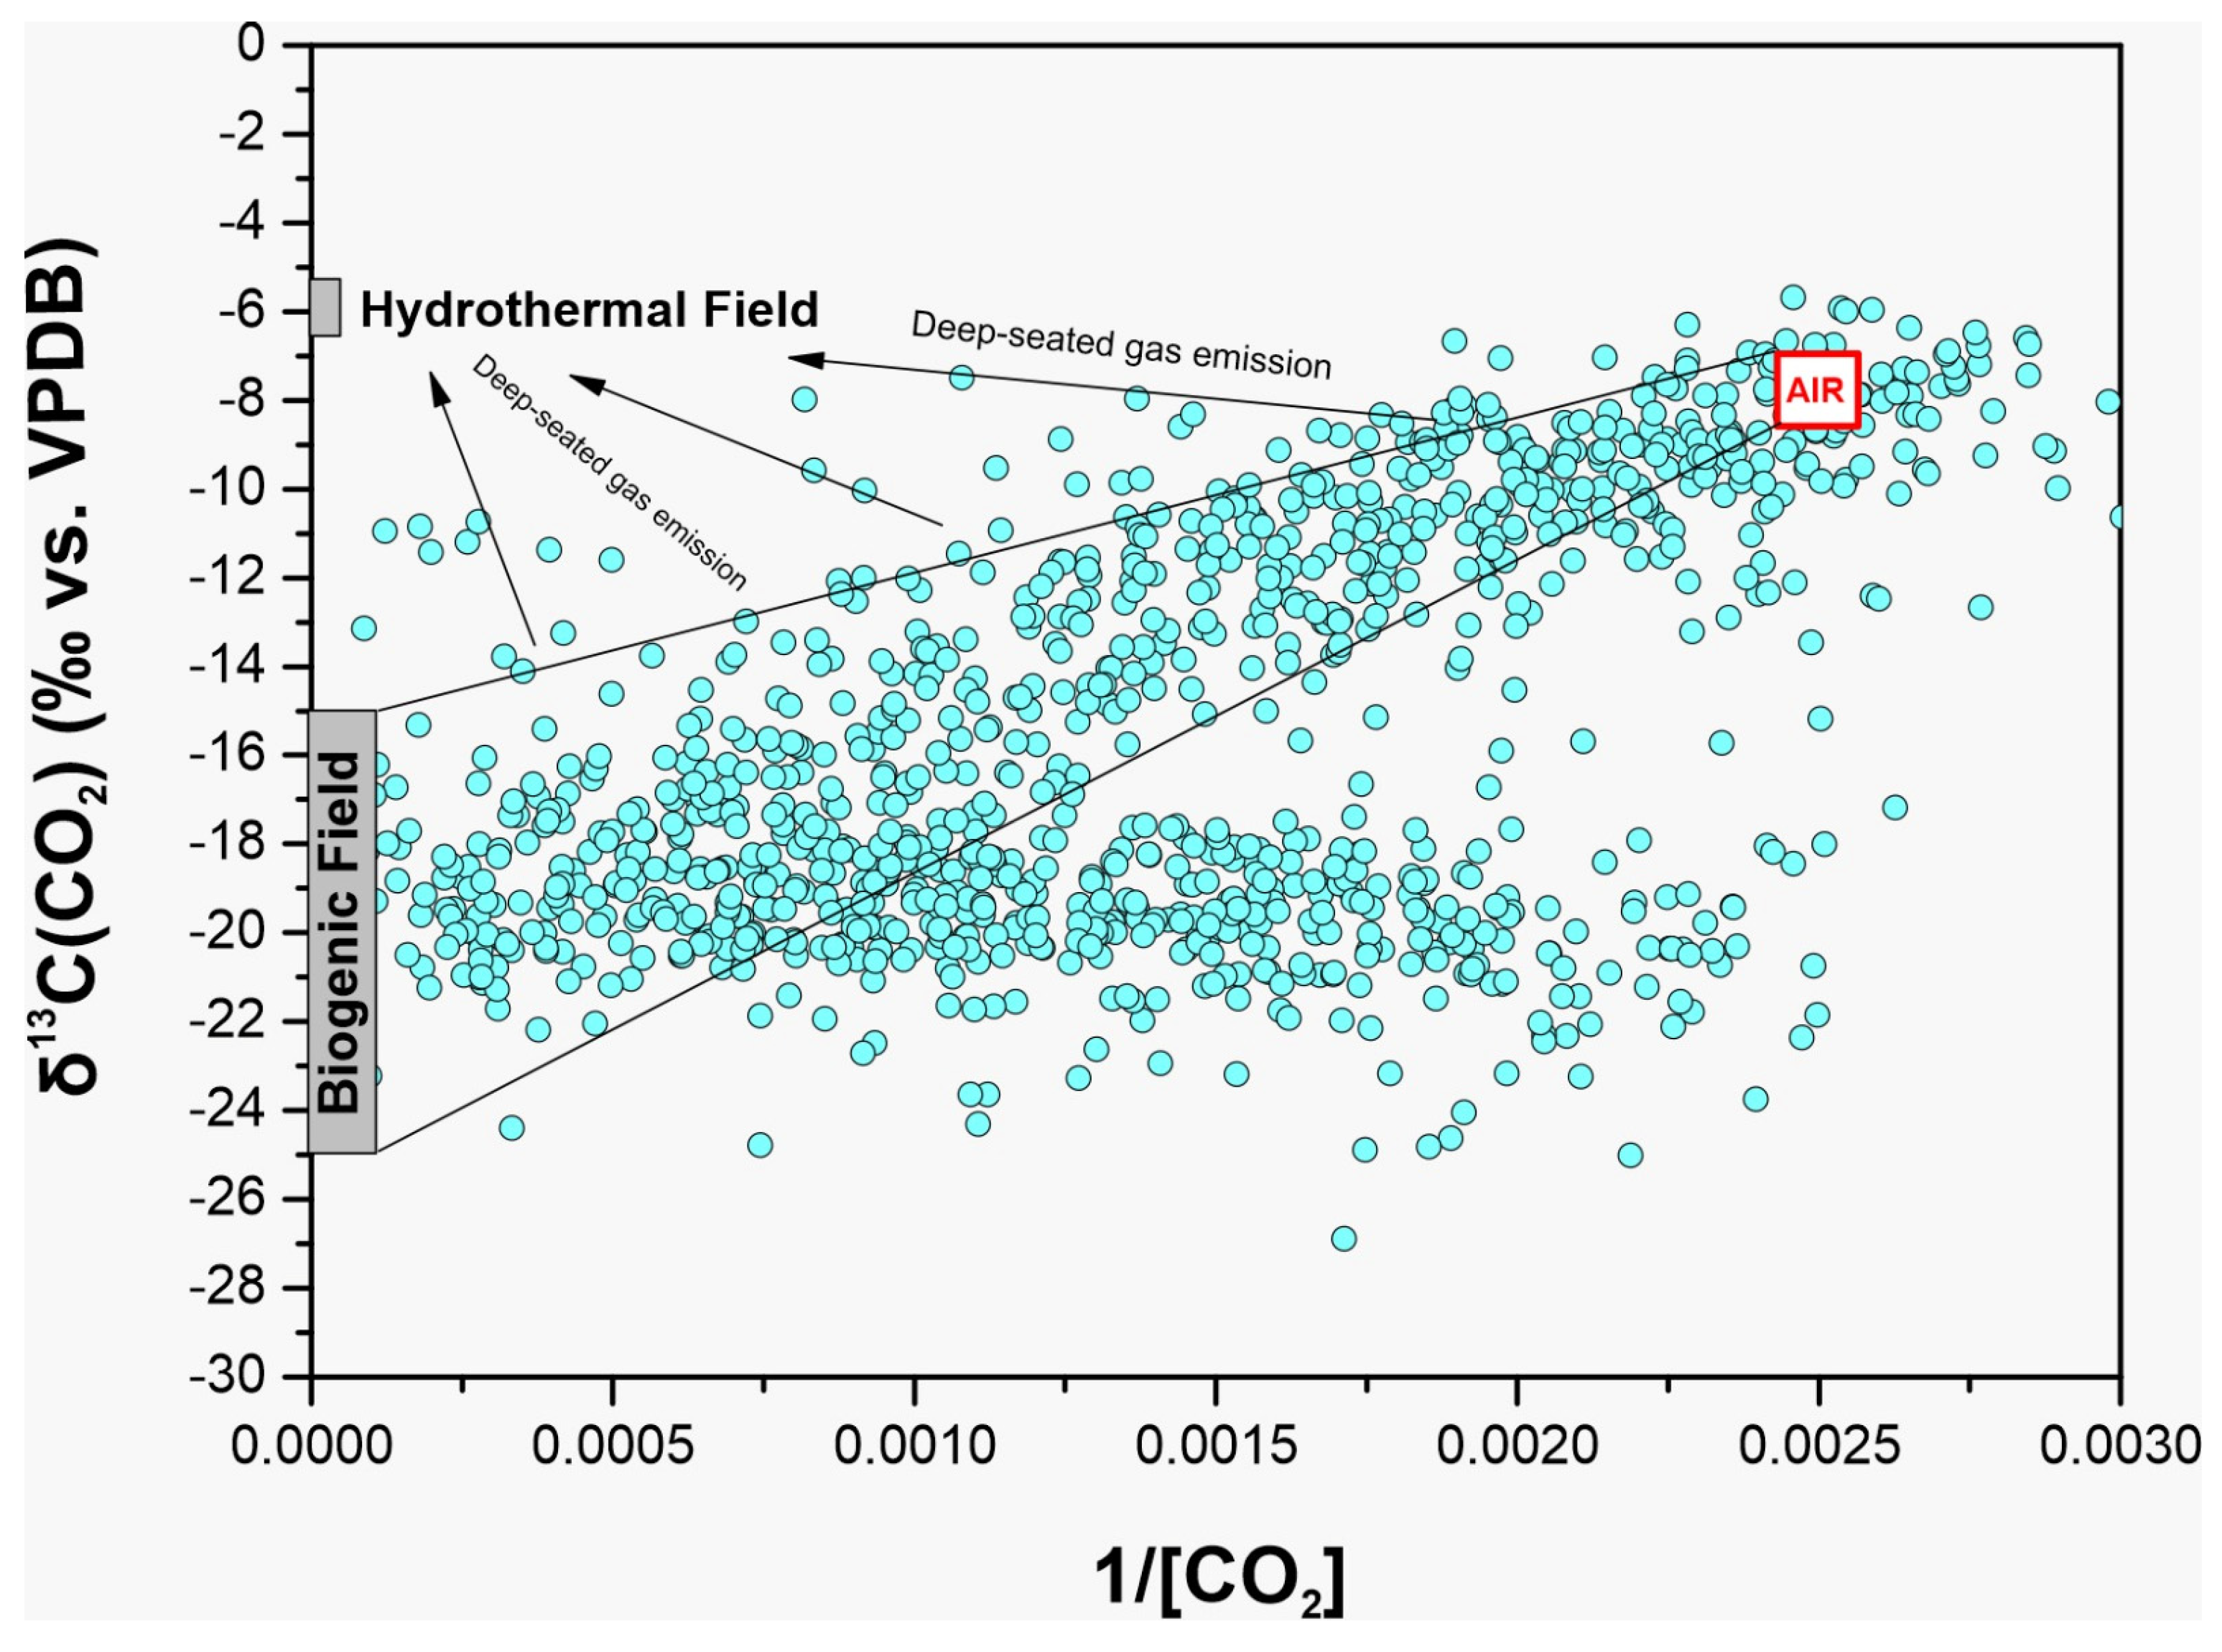
3.3. Origin of CO2: Isotopic Evidence and Mixing Model Interpretation

To determine the origin of CO2 emissions in the study area, a binary isotopic diagram was constructed by plotting δ13C(CO2) (‰ vs. VPDB) against the inverse of CO2 concentration (1/[CO2], in ppm⁻1). This approach allows identification of gas sources based on a two- or three-component mixing model, including biogenic, atmospheric, and deep-seated (magmatic/hydrothermal) contributions (Figure 7).
The three principal end-members considered are biogenic CO2, with δ13C values ranging from −26‰ to −15‰, consistent with soil respiration from organic matter [33] and including an enrichment of up to +4.4‰ due to isotopic fractionation during gas diffusion in the soil profile; atmospheric CO2, characterized by δ13C ≈ −8‰ and extremely low concentrations (~400 ppm), corresponding to 1/[CO2] ≈ 2.5 × 10⁻3 ppm⁻1; and magmatic-hydrothermal CO2, exhibiting less negative δ13C values (typically −6.5‰) and occurring at higher concentrations (lower values of 1/[CO2]), as reported in volcanic degassing systems.
Soil CO2 concentrations in the study area ranged widely, from near-atmospheric levels (~0.04 mol.%) to as high as 1.99 mol.%, with an average of 0.15 mol.%. The isotopic composition of δ13C(CO2) varied between −31.96‰ and −5.69‰, with a mean value of −15.51‰.
As shown in Figure 7, most of the samples fall within the biogenic field, confirming a dominant influence of biological activity on soil gas composition. A smaller subset of data points lies along a trajectory connecting the biogenic and hydrothermal fields, suggesting the presence of mixing between shallow biogenic CO2 and a deeper magmatic-hydrothermal component. These samples are characterized by relatively enriched δ13C values (−12‰ to −6‰) and elevated CO2 concentrations, indicative of deep-seated gas emission pathways through permeable fault zones.
Notably, no significant contribution from atmospheric CO2 is observed, as the dataset lacks points near the AIR end-member. This absence is expected in subsurface gas samples from volcanic terrains, where endogenous CO2 dominates over atmospheric diffusion.
In summary, the isotopic and concentration data support the interpretation of a predominantly biogenic origin of CO2, with localized deep-seated contributions likely associated with volcanic-structural control. These findings highlight the effectiveness of δ13C vs. 1/[CO2] binary diagrams in distinguishing gas sources in geothermal exploration contexts.

3.4. From Univariate Thresholds to Multivariate Classification in Geochemical Analysis

Univariate analysis is a valuable tool for examining individual variables (e.g., CO2 or radon concentration) and distinguishing background from anomalous values on a parameter-by-parameter basis. Methods such as the Sinclair approach [8] remain powerful for setting statistical thresholds and identifying geochemical populations within a single dimension of the data. However, this approach treats each variable independently, limiting the ability to detect co-occurrences or interactions among variables that may hold critical geochemical significance.
In volcanic and hydrothermal systems—where degassing is influenced by complex subsurface processes—anomalies rarely manifest through a single parameter alone. Instead, they are often characterized by distinct multivariate signatures, involving combinations of gases such as He, CO2, CH4, and 222Rn, which together reflect fluid sources, transport pathways, and permeability structures.
Multivariate analysis, in contrast, considers multiple variables simultaneously, allowing for a more integrated and comprehensive view of the geochemical system. Techniques such as principal component analysis (PCA), cluster analysis, or discriminant analysis improve the detection of complex patterns, enhance anomaly classification, and reduce the risk of overlooking significant correlations. By incorporating all relevant parameters in a unified framework, these methods extend the analytical scope beyond the limits of univariate approaches.
To address the limitations of variable-by-variable analysis and to better capture the complexity of geochemical signals, we incorporated multivariate cluster analysis. This method identifies natural groupings in the dataset based on multiple co-varying parameters, revealing structured patterns and integrated anomalies that may not be apparent when assessing variables in isolation. In the context of geothermal exploration, this approach allows for a more robust classification of geochemical populations, reduces the likelihood of false positives, and improves the interpretability of spatial trends—ultimately contributing to more reliable targeting of high-potential zones and better-informed decisions in the exploration process.

3.5. Multivariate Clustering Analysis in Geothermal Exploration

3.5.1. K-Means Algorithm (TKM)

Clustering algorithms identify structure within high-dimensional data by grouping points into dense regions separated by low-density boundaries [34]. Among these, the traditional K-Means algorithm (TKM) is one of the most widely used methods in multivariate geoscientific analysis due to its simplicity and computational efficiency. In geothermal exploration, it enables the classification of geochemical samples based on similarities in soil gas composition, facilitating the identification of concealed degassing structures and reducing uncertainty in the selection of drilling targets.
K-Means partitions a dataset into K clusters by minimizing within-cluster variance, using Euclidean distance to assign each point to the nearest centroid. Its advantages include ease of implementation and computational efficiency, although it presents challenges such as the optimal selection of the number of clusters and sensitivity to the initialization of centroids. Solving this problem exactly is NP-hard; Stuart P. Lloyd [35] proposed a local search solution that remains widely used today [36,37]. Indeed, a 2002 survey of data mining techniques states that it “is by far the most popular clustering algorithm used in scientific and industrial applications” [38].
In the present study, we applied K-Means clustering to a multivariate geochemical dataset from the southern rift zone of Tenerife. To ensure robust and meaningful classification, a series of preprocessing steps was first performed, including logarithmic transformation and normalization of the raw data. The following section describes the structure of the dataset, the parameters selected, and the procedures used for clustering and cluster validation.
Each geochemical sampling point is represented as a 14-dimensional feature vector: x i = [H2, He, Ne, Ar, O2, CO2, δ13C/12C, 222Rn, CH4, 220Tn, and associated ratios], where i = 1, 2,…, n, and n is the total number of samples. The complete dataset can thus be formalized as a set X = { x 1, x 2,…, x ₙ} ⊂ ℝ14.
Data Preprocessing: Prior to clustering, the data were log-transformed (base-10) to stabilize variance and enable comparison among parameters with different orders of magnitude. This was followed by z-score normalization (zero mean and unit variance) to ensure all variables contributed equally to distance calculations, regardless of scale or units. No data points were removed as outliers. Extreme values were preserved, considering that they may reflect meaningful geological phenomena such as localized deep degassing. The log transform sufficiently reduced their influence. Optionally, dimensionality reduction via Principal Component Analysis (PCA) is applied to the normalized data to reduce dimensionality and mitigate collinearity among parameters. The first two principal components were retained for clustering and visualization, capturing most of the variance in the dataset.
We applied k-Means clustering as a baseline method to partition the dataset into K disjoint groups by minimizing the within-cluster variance, defined as the total squared Euclidean distance between each point and the centroid of its assigned cluster:
J = k = 1 K x i G k X i μ k 2
where μk is the centroid of cluster Gk, and ‖·‖ denotes the Euclidean norm in multivariate space.
Clustering quality was assessed using the Silhouette coefficient [39], which compares a point’s average distance to its own cluster with the nearest neighboring cluster. Values close to 1 indicate well-separated and well-defined clusters.
In this study, we selected a subset of diagnostic geochemical variables directly linked to the following geothermal processes: diffuse CO2 flux, soil CO2 and He concentrations, soil H2, 222Rn activity, Ne, CH4, and δ13C-CO2. These variables provide complementary insights as follows: CO2 and He signal magmatic gas input, H2 indicates redox and thermal conditions, Rn relates to permeability, and δ13C helps distinguish deep versus shallow CO2 sources.
K-Means was chosen for its simplicity, speed, and broad applicability in exploratory geoscientific data analysis, despite lacking formal approximation guarantees. The algorithm requires three user-defined parameters: the number of clusters K, the initialization method, and a distance metric (commonly Euclidean).
The optimal number of clusters (k) was evaluated between 2 and 9 using both statistical criteria—Silhouette Score and Calinski–Harabasz index—and geological reasoning. Probability plots indicated at least two distinct populations (background vs. anomaly), while geological considerations supported the existence of a potential intermediate group.
Although the k = 2 configuration yielded slightly higher Silhouette values (~0.862), it collapsed all anomalies into a single class, overlooking meaningful geochemical variation.
By contrast, the k = 3 solution, with a Silhouette Score of 0.818, still indicates excellent cluster separation (Figure 8). This configuration captures greater geological nuance by differentiating (1) background, (2) intermediate anomaly, and (3) strong anomaly. The resulting groups exhibit high internal cohesion and robust inter-cluster separation, providing a more refined interpretation of subsurface degassing regimes.
This structure is consistent with the Sinclair anomaly detection method, which also identifies multiple populations (background, intermediate, and peak). Moreover, the K = 3 solution aligned better with the expected distribution of soil gas anomalies in volcanic terrains and the spatial distribution of known lineaments and magnetotelluric anomalies, thus providing greater interpretative value.
The clustering was driven by diagnostic geochemical ratios reflecting different gas origins. For example, He, He/Ne, and He/CO2 are classic tracers of deep-seated or magmatic components, whereas CO2/CH4 and CO2/Ne highlight fractionation processes distinguishing magmatic versus biogenic sources. These ratios proved highly discriminative for identifying geochemically distinct populations in the Garehagua area, offering valuable guidance for subsequent geophysical surveys and exploratory drilling.
To overcome the inherent limitations of the classical K-Means algorithm, we implemented the GKMC method [40]. This hybrid approach integrates the global search capabilities of Genetic Algorithms (GAs) with the local optimization strengths of K-Means, resulting in a more robust and efficient clustering framework. GKMC addresses key weaknesses of standard K-Means, such as sensitivity to initialization (K-Means relies on random centroid selection, often converging to suboptimal local minima), assumption of spherical clusters (it presumes isotropic, equally sized clusters, a poor fit for the anisotropic and heterogeneous nature of geochemical datasets), and predefined number of clusters (K) (although GKMC still requires K to be set a priori, its evolutionary search explores the solution space more comprehensively, often achieving better internal partitions).
By integrating global exploration (GA) with local refinement (K-Means), GKMC enhances convergence stability and reduces sensitivity to noise, outliers, and complex spatial patterns—typical challenges in surface geochemical data for geothermal exploration.

3.5.2. Genetic K-Means Clustering Algorithm (GKMC)

To improve the identification of geochemical anomalies in soil gas surveys, we adopted the GKMC algorithm as the core multivariate technique. Unlike univariate analyses, clustering considers the joint variability of multiple geochemical parameters, allowing the detection of co-occurring anomalies that signal potential geothermal activity.
We applied the GKMC approach proposed by Ghezelbash et al. [17], where each clustering solution is encoded as a chromosome combining both centroid positions and point assignments. Genetic operations such as crossover and mutation enable exploration of diverse cluster configurations. The initial population includes both random solutions and the best outputs from standard K-Means.
The genetic algorithm was configured with a population size of 50 chromosomes per generation and run for 200 generations. The crossover probability was set at 0.8, while the mutation probability was fixed at 0.05.
Over ~200 generations, the GA iteratively improves cluster quality by minimizing within-cluster variance while penalizing poorly populated clusters to avoid trivial groupings.
This evolutionary refinement yielded a ~5% improvement in Silhouette score compared to classical K-Means and significantly increased the robustness and reproducibility of the final clustering. The enhanced separation and internal cohesion of clusters allow for a more reliable interpretation of subsurface degassing patterns and a more accurate delineation of geothermal targets.
This entire process was fully automated and implemented in Python (V.3.11.11), using open-source libraries such as NumPy, pandas, scikit-learn, and matplotlib [41]. The workflow produced standardized outputs, including cluster labels, centroids, Silhouette scores, and graphical visualizations of cluster structure and quality. This script-based approach ensures full reproducibility, transparency, and scalability, making it suitable for repeated applications or integration into broader geospatial workflows.
The clustering objective is to minimize intra-cluster variance, using the same optimization function as classical K-Means:
J ( P ) = K = 1 k x i G k ( P ) | | x i μ k ( P ) | | 2
where P is a candidate partition (chromosome), μk represents the centroid of cluster Gk, and ∥⋅∥ is the Euclidean norm in multivariate space. Each individual (chromosome) encodes a complete solution by assigning each data point xᵢ to a specific cluster using integer-based labels.
The hybrid algorithm begins with a randomly generated population of partitions. Genetic operators are applied over successive generations, and each offspring solution undergoes a local refinement step via a single iteration of classical K-Means to accelerate convergence. After a defined number of generations, the best-performing individual is selected as the final partition.
Compared to standard K-Means, the GKMC algorithm offers several advantages. It is significantly less sensitive to the initial selection of centroids, thereby improving the consistency and reproducibility of the results. Its evolutionary nature allows for a broader and more effective exploration of the solution space, reducing the risk of convergence to suboptimal local minima. Furthermore, GKMC demonstrates a greater capacity to identify non-spherical or irregularly shaped clusters, especially when applied within transformed feature spaces or using adapted distance metrics—an important feature when dealing with complex, anisotropic geochemical datasets.
This hybrid method proves especially effective in the context of geochemical data analysis, where variables often display non-linear relationships and multi-populational behavior. In this study, the use of GKMC significantly enhanced the robustness, interpretability, and resolution of the clustering results, enabling clearer distinction between background, transitional, and anomalous geochemical regimes across the study area.
As the soil gas data were temporally segmented (e.g., distinct measurement periods), clustering analyses were performed separately for each zone. Silhouette scores were calculated for each subset and aggregated. The final variable set was selected based on the highest cumulative silhouette score across all zones, ensuring the most consistent and informative geochemical clustering for the Garehagua and Garehagua II study area.
To ensure the stability and reproducibility of the GKMC algorithm, we performed 10 independent runs with different random seeds. The variation in the Silhouette Score between runs was below 2%, indicating a high degree of consistency in the clustering results.
To assess the clustering performance of different variable combinations, a systematic evaluation was carried out using the Genetic K-Means Clustering (GKMC) algorithm. Figure 9 shows the top 10 parameter combinations ranked by Silhouette Score, highlighting those that yielded the most coherent and well-separated clusters.

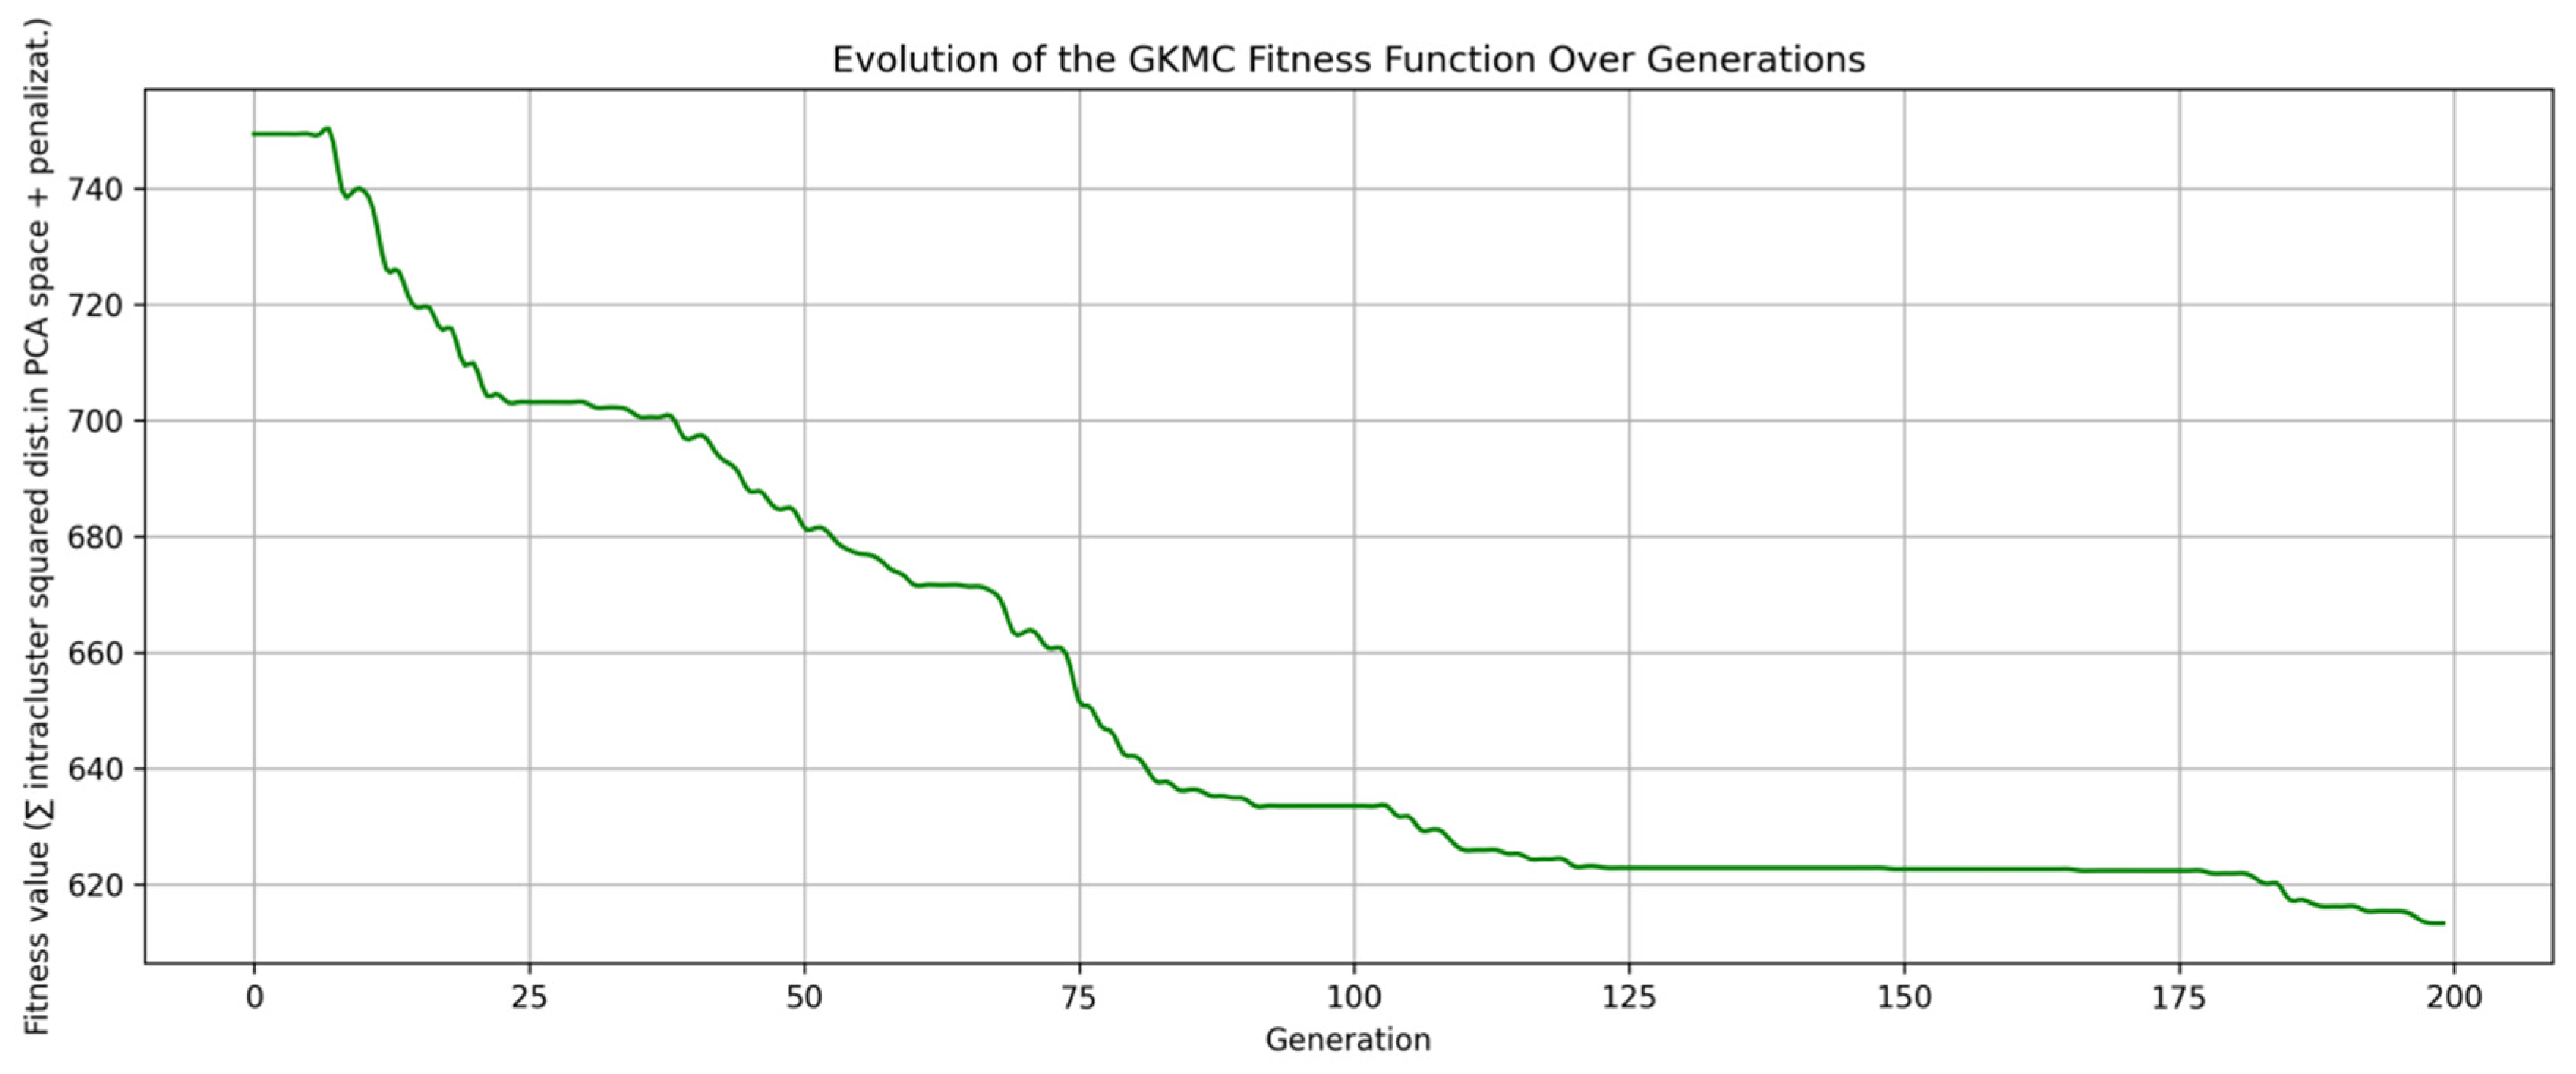
3.5.3. Fitness Function Evolution in GKMC

The Fitness Function Evolution graph illustrates how the quality of clustering improves over successive generations in the GKMC algorithm [42]. This visualization provides insight into the algorithm’s convergence behavior, highlighting how the integration of global search (via genetic operations) with local refinement (K-Means iterations) leads to progressively better clustering solutions.
On the graph, the X-axis represents the number of generations (iterations of the genetic algorithm), while the Y-axis shows the value of the fitness function for the best individual (partition) in each generation. In our implementation, the fitness function is defined as follows:
Fitness = J (P) + λ × Penalty.
where J(P) represents the intra-cluster cohesion, measured as the sum of squared Euclidean distances between each point and its corresponding cluster centroid (computed in PCA-reduced space to improve performance and reduce noise). Lower values of J(P) indicate more compact and homogeneous clusters.
The second term, penalty, acts as a corrective factor to avoid the formation of statistically underrepresented or trivial clusters. It is defined as follows:
P e n a l t y = k = 1 K ( N m i n | C k | ) α i f   | C k | < N m i n
where
  • ∣Ck∣: number of samples in cluster k.
  • Nmín: minimum acceptable cluster size.
  • α: penalty exponent (typically 2 or 3).
  • λ: weighting factor controlling the impact of the penalty in the total fitness function.
This hybrid fitness function ensures that the algorithm not only seeks compact clusters but also avoids overfitting or the emergence of statistically irrelevant clusters formed by a few isolated points. As generations progress, the balance between these two terms drives the population of solutions toward more geologically meaningful and stable partitions.
The typical behavior of the fitness curve in GKMC can be divided into three main phases. In the initial phase (early generations), randomly generated solutions tend to display high variability and poorly defined cluster structures. The fitness value is often low—or even negative—due to severe penalties associated with small, unbalanced, or statistically insignificant clusters. This reflects the algorithm’s effort to discourage unstable configurations early on. In the improvement phase, the interplay between genetic operators (selection, crossover, and mutation) and local refinement via K-Means drives a rapid enhancement in clustering quality. During this phase, intra-cluster cohesion improves, the penalty term decreases, and the silhouette score typically rises, reflecting better separation and compactness. Finally, in the convergence phase, improvements begin to plateau, and the fitness curve flattens, indicating that the algorithm has reached an optimal or near-optimal partition within the explored solution space.
In the context of geochemical exploration, clusters with very few members are often regarded as numerical artifacts or the result of noise, rather than meaningful geological populations. Ensuring that each cluster contains enough observations is therefore essential to maintain statistical robustness and interpretability. The penalty term in the fitness function plays a key role in preventing overfitting—particularly in scenarios where specifying a large number of clusters might lead to excessive segmentation and the detection of spurious structures. This mechanism acts as a structural safeguard, ensuring that the final clustering reflects genuine geochemical patterns rather than artifacts of the optimization process.
It is important to note that, unlike normalized clustering metrics such as the silhouette index (which ranges from –1 to 1), the fitness function used here represents an accumulated measure of intra-cluster variance J(P) and can reach values in the thousands—especially when working in projected feature spaces such as PCA or when using unnormalized variables. Nevertheless, its formulation is particularly suited to geochemical applications, where the primary goal is to achieve compact, statistically sound clusters while avoiding residual groupings with little geological significance.
The optimization process of the Genetic K-Means Clustering (GKMC) algorithm was monitored by tracking the evolution of the fitness function across generations. As shown in Figure 10, the fitness value progressively decreases over 200 generations, indicating convergence toward a more optimal clustering configuration in the reduced PCA space.
Figure 11 presents a comprehensive workflow diagram illustrating our methodological approach to the multivariate clustering and interpretation of soil gas data. This framework integrates traditional geochemical analysis techniques with advanced machine learning algorithms to optimize the detection of geothermal anomalies in complex volcanic terrains.
The diagram highlights how classical geochemical visualization tools (binary plots and probability graphs) are integrated with machine learning techniques to provide multiple lines of evidence for the final interpretation. This multidisciplinary approach culminates in the comparison of clustering results with independent datasets, including magnetotelluric surveys and structural geology maps, ensuring that the identified geochemical domains are geologically meaningful rather than statistical artifacts.
By formalizing this workflow, we create a reproducible methodology for transforming complex multivariate soil gas datasets into actionable insights for geothermal exploration, balancing statistical rigor with geological interpretability.

4. Results

4.1. Soil Gas Geochemical Characterization and Probabilistic Population Analysis

A total of 1050 soil gas samples were collected across the Garehagua and Garehagua II licenses, located in the southern rift zone of Tenerife. The concentrations and fluxes of the measured soil gases exhibited wide variability and followed log-normal distributions, consistent with patterns typically observed in diffuse degassing environments of volcanic settings.
The statistical-graphical method proposed by Sinclair [8] was applied to each key variable to distinguish discrete geochemical populations—namely, a predominant background population and one or more anomalous (or “peak”) populations. Cumulative probability plots and log-normal probability graphs were constructed to evaluate the distribution of each parameter and to objectively determine anomaly thresholds.
Key descriptive parameters are summarized as follows:
CO2 Flux: The geometric mean was ~2.19 g·m⁻2·d⁻1, with a positively skewed distribution and a maximum recorded value of 37.69 g·m⁻2·d⁻1. These results are consistent with biogenic emissions, although elevated fluxes at select sites suggest localized deep CO2 contributions.
Helium (He): Ranged from atmospheric background (~5.24 ppm) up to 20 ppm in specific hotspots, indicating possible mantle-derived input at certain locations.
Hydrogen (H2): Concentrations were predominantly <0.5 ppm, yet reached anomalous levels up to 24.43 ppm, potentially associated with water–rock interaction or redox processes.
Radon (222Rn): Values were low (<0.10 kBq/m3), but a subset of sites displayed peaks up to ~12.08 kBq/m3. These anomalies reflect zones of increased vertical permeability, such as faults or fractured rock.
Carbon Isotopic Composition of CO213C): Most samples exhibited δ13C values around −15.51‰, indicative of biogenic sources, whereas certain anomalous samples reached as high as −5.69‰. These heavier isotopic signatures are consistent with a contribution from deep magmatic or thermogenic carbon sources.
The spatial distribution of these anomalies revealed that while radon anomalies were more dispersed, they often overlapped with zones of helium enrichment, especially along a NW–SE structural alignment. Notably, some of the strongest geochemical anomalies occurred near mapped or inferred intersections of tectonic lineaments [43], suggesting structural control on gas migration.
Despite the identification of anomalous values through the probabilistic method, the overall proportion of peak populations was low: approximately 2.1% of samples for CO2 flux, 0.7% for helium, and 0.5% for radon. Furthermore, there was limited spatial coincidence between anomalies across different parameters. This lack of consistent multi-gas overlap precluded the delineation of clear, well-defined degassing zones based on univariate analysis alone, underscoring the need for a multivariate approach.

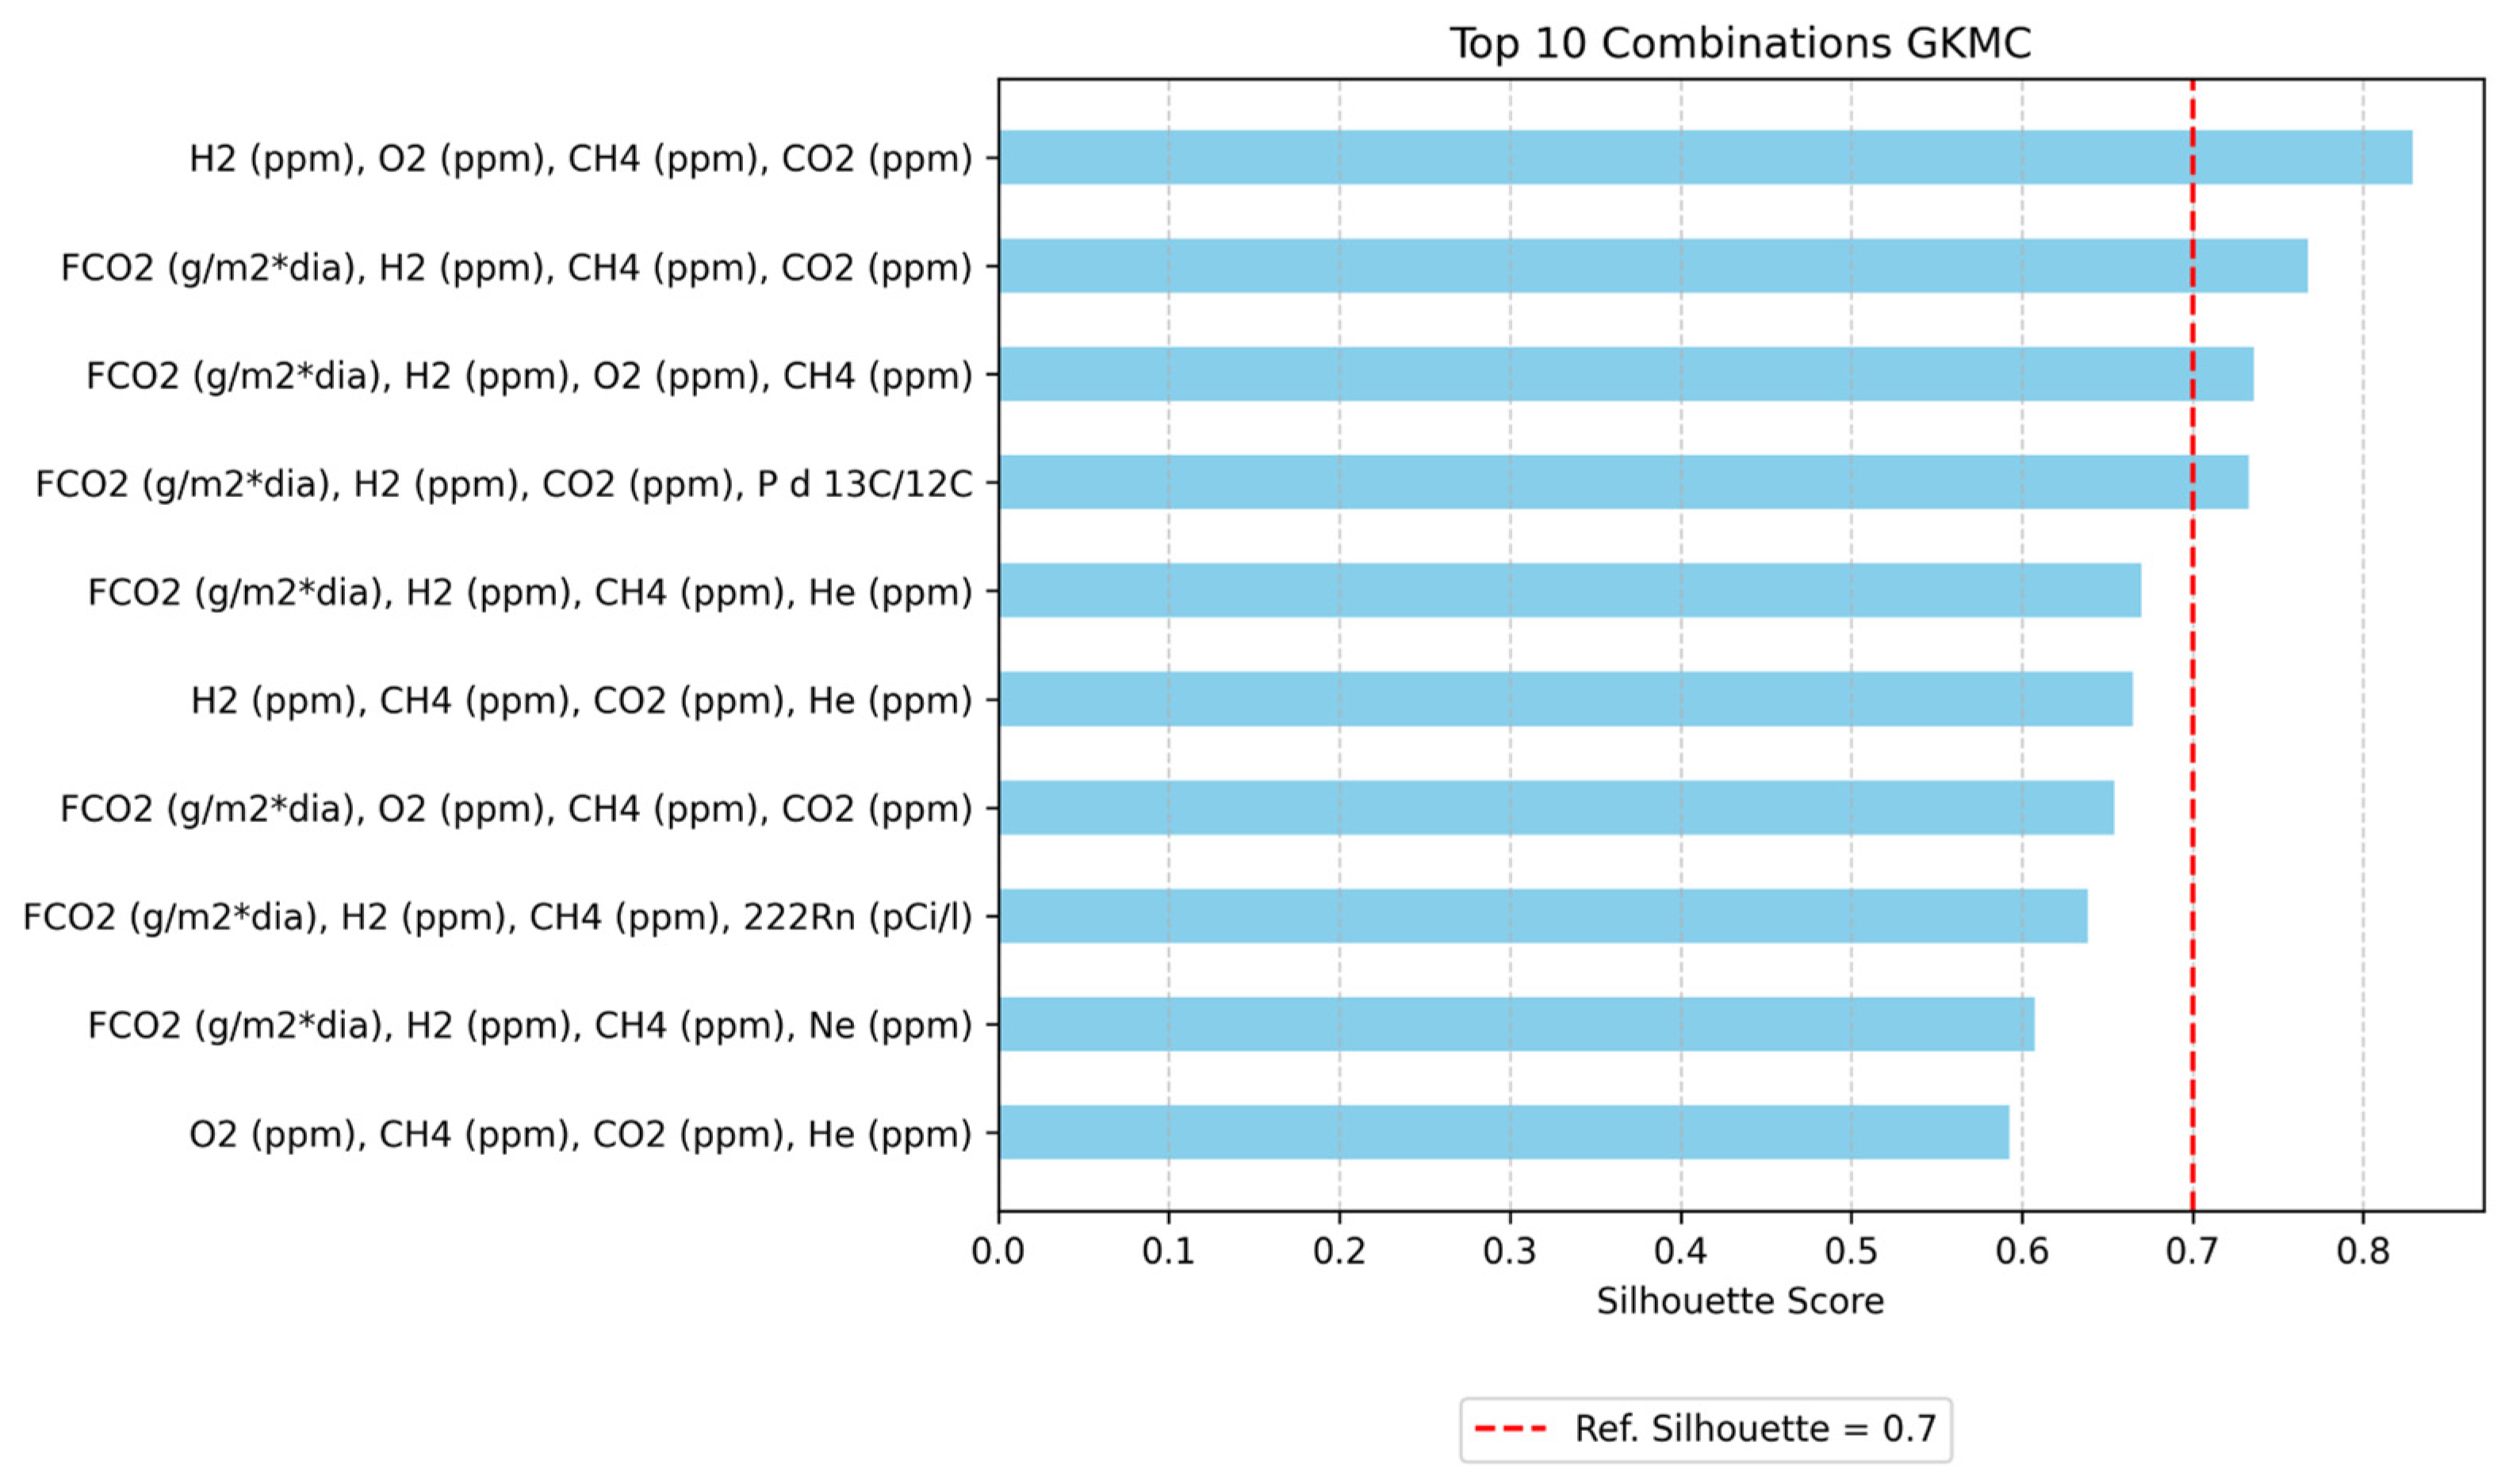
4.2. Multivariate Clustering of Soil Gas Data: GKMC Algorithm

To extract latent structure from the multivariate soil gas dataset and to overcome the interpretive limitations of univariate analysis, we applied a GKMC algorithm. This hybrid approach combines the conventional k-Means partitioning method with a genetic algorithm-based optimization strategy, which enhances cluster robustness by avoiding local minima and optimizing inter-cluster separation and intra-cluster compactness.

4.3. Variable Selection and Methodological Rationale

An initial exploratory phase assessed multiple combinations of geochemical variables using the Silhouette index as a metric for clustering quality. The combination of H2, O2, CH4, and CO2 yielded the highest Silhouette value (0.42), suggesting a statistically optimal separation. However, a critical evaluation of the geochemical behavior and origin of these parameters led to the rejection of this variable set for the final clustering model:
  • CH4 (methane) was consistently found near detection limits (~0.7 ppm) throughout the dataset, indicating limited spatial or geochemical variability. Its low concentrations and potential biogenic or anthropogenic origin diminish its value as a tracer of magmatic or geothermal processes.
  • O2 (oxygen) is overwhelmingly atmospheric in origin. Its presence in soil gas is governed by near-surface processes, such as soil-atmosphere exchange and microbial consumption, and therefore lacks diagnostic power in identifying deep-sourced anomalies.
  • H2, while sometimes used as a redox-sensitive indicator in geothermal systems, is highly reactive and susceptible to local oxidation–reduction reactions in the shallow subsurface. This reactivity can obscure any potential signals from deep degassing sources, particularly in settings with complex soil hydrology or vegetation.
Given its limitations, the final clustering was performed using a subset of variables with stronger geochemical relevance to magmatic-hydrothermal systems: CO2 flux, He concentration, 222Rn activity, and the carbon isotopic composition of CO213C–CO2). These parameters were selected for the following reasons:
  • CO2 is a major component of volcanic and hydrothermal gases and can traverse significant depths due to its mobility.
  • He is a well-established indicator of magmatic input, especially when concentrations exceed atmospheric levels (~5.24 ppm).
  • 222Rn serves as a proxy for subsurface permeability and the presence of fracture systems facilitating vertical gas migration.
  • δ13C–CO2 enables the distinction between biogenic and magmatic carbon sources, with heavier values (closer to 0‰) indicating a deeper origin.
This revised selection prioritizes geological interpretability and geochemical specificity over statistical optimization alone, underscoring the need for domain expertise in multivariate exploration analyses.

4.4. Clustering Outcomes and Structure

Using the GKMC algorithm with this refined variable set, the dataset was partitioned into three distinct clusters, visualized in Principal Component Analysis (PCA) space. Each data point represents a sampling location, color-coded by cluster membership, and centroids are denoted by “X” symbols.
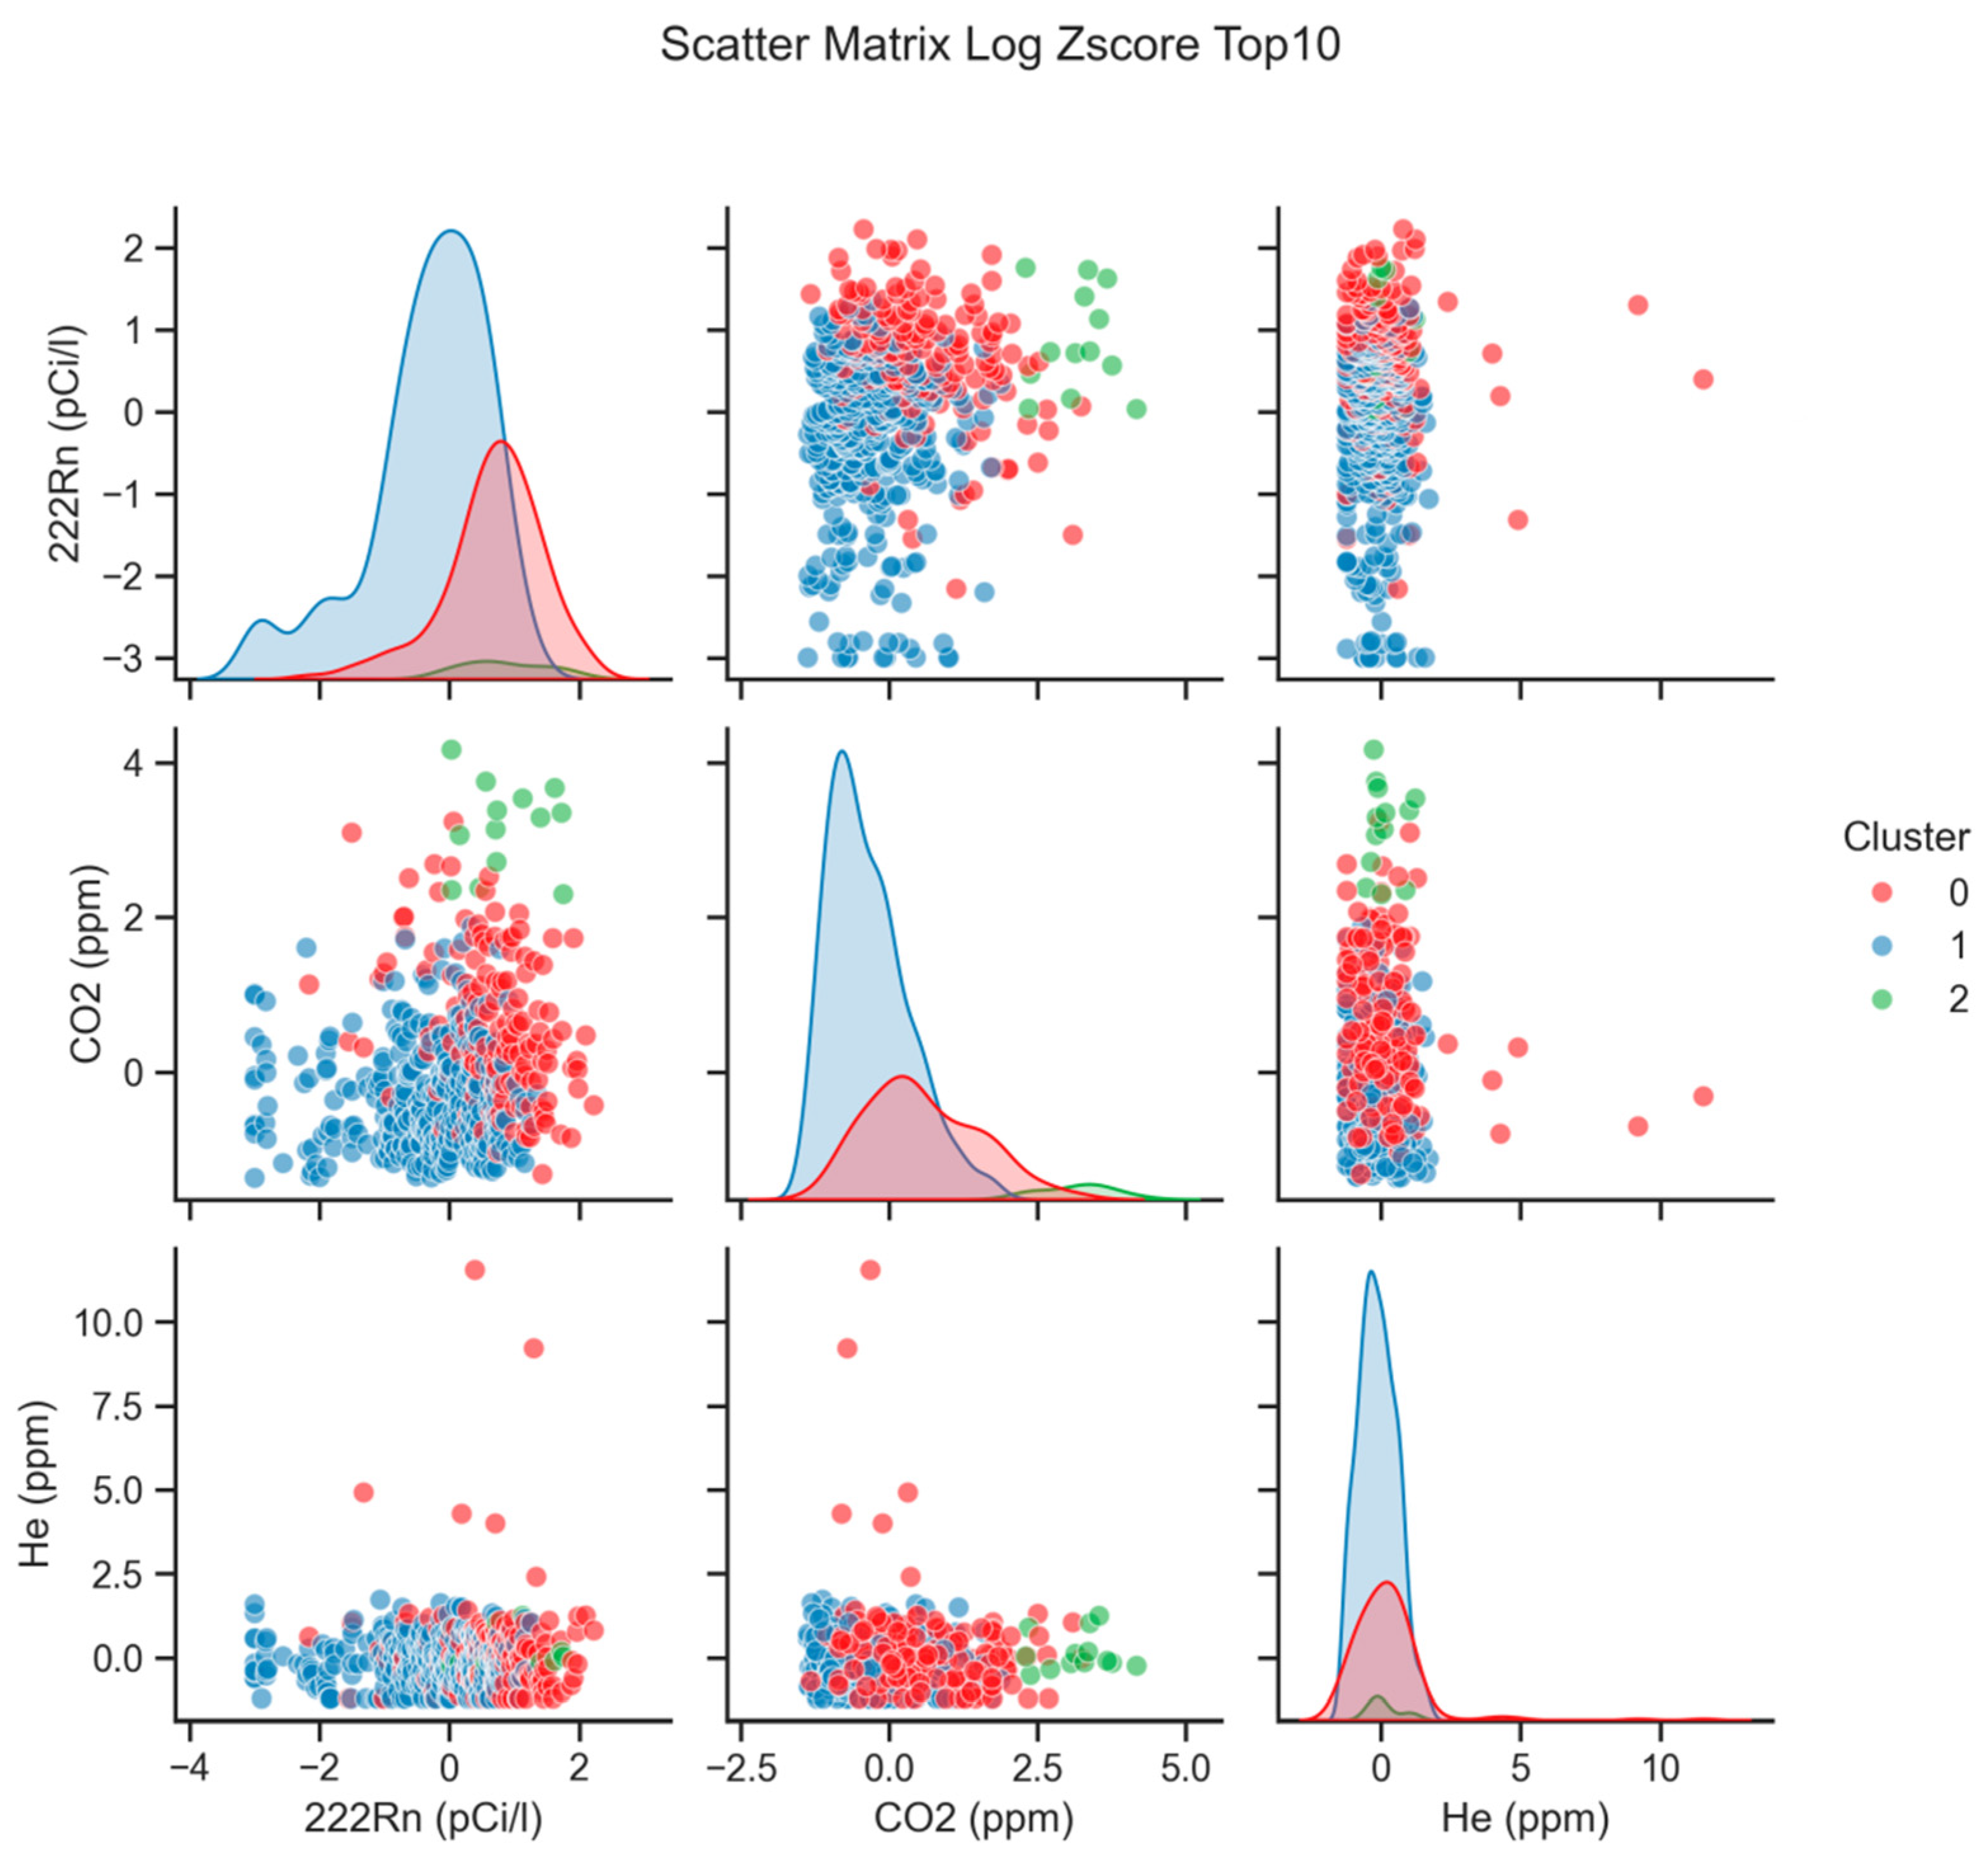
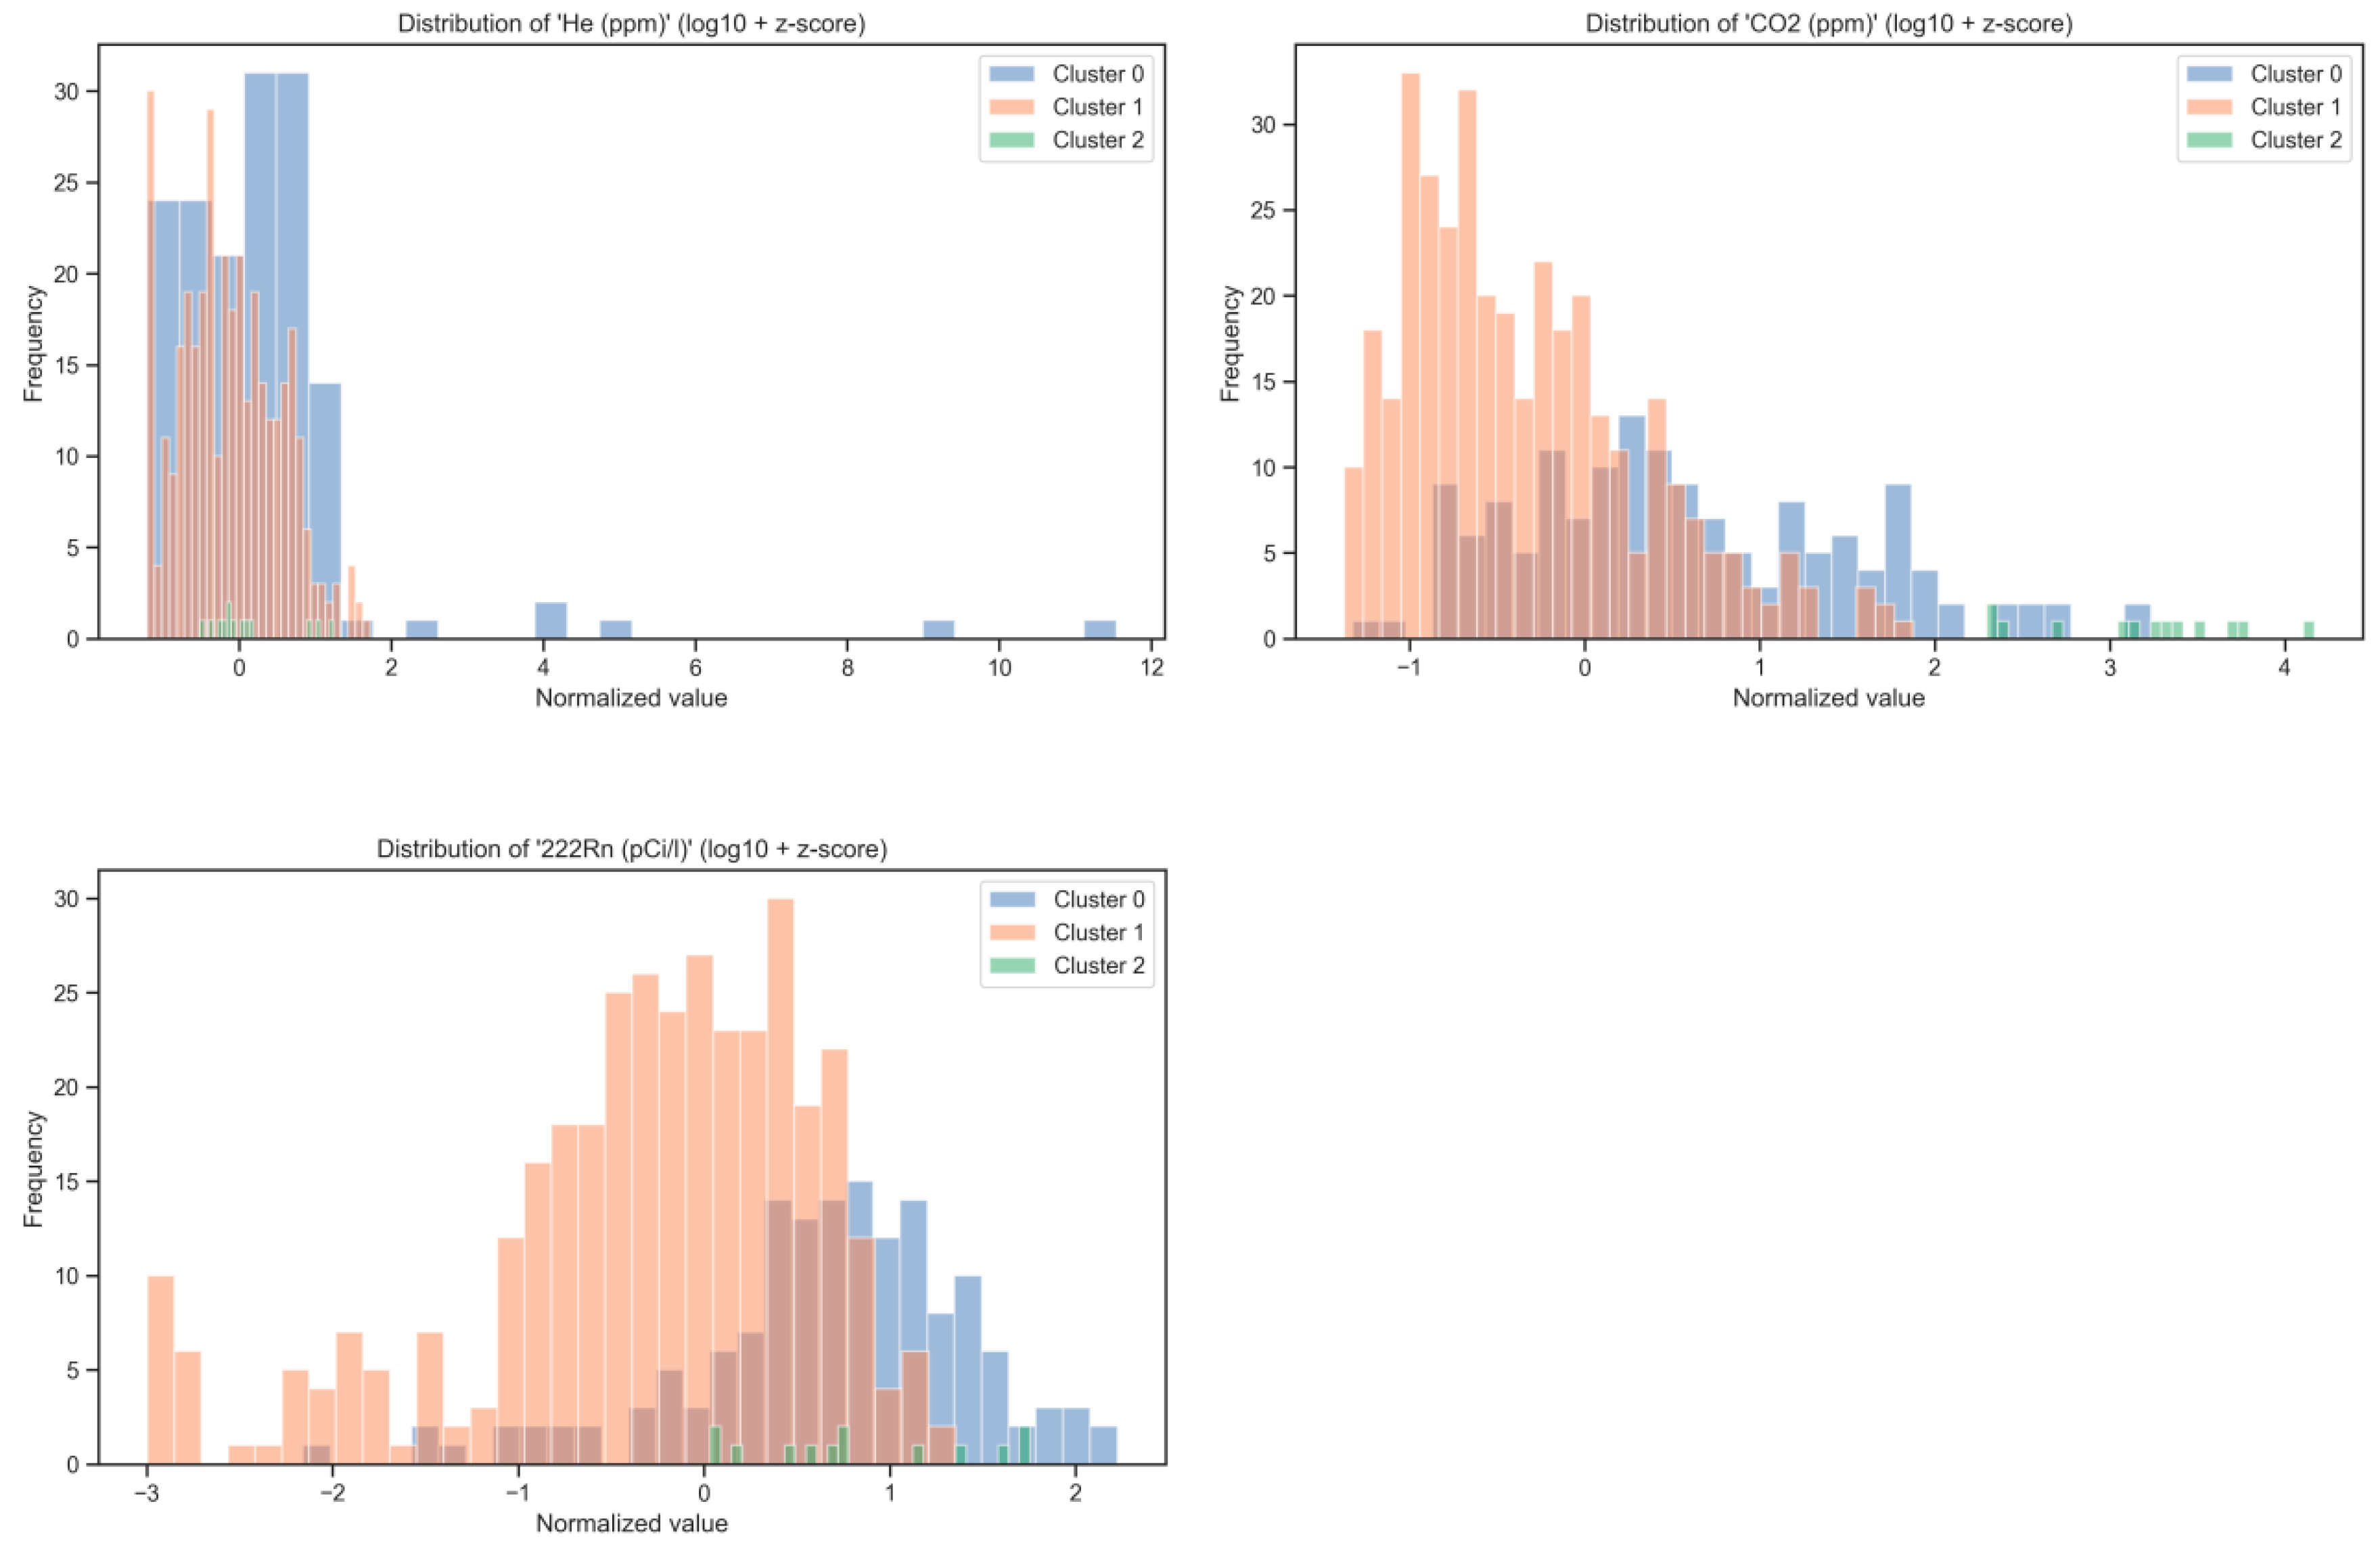
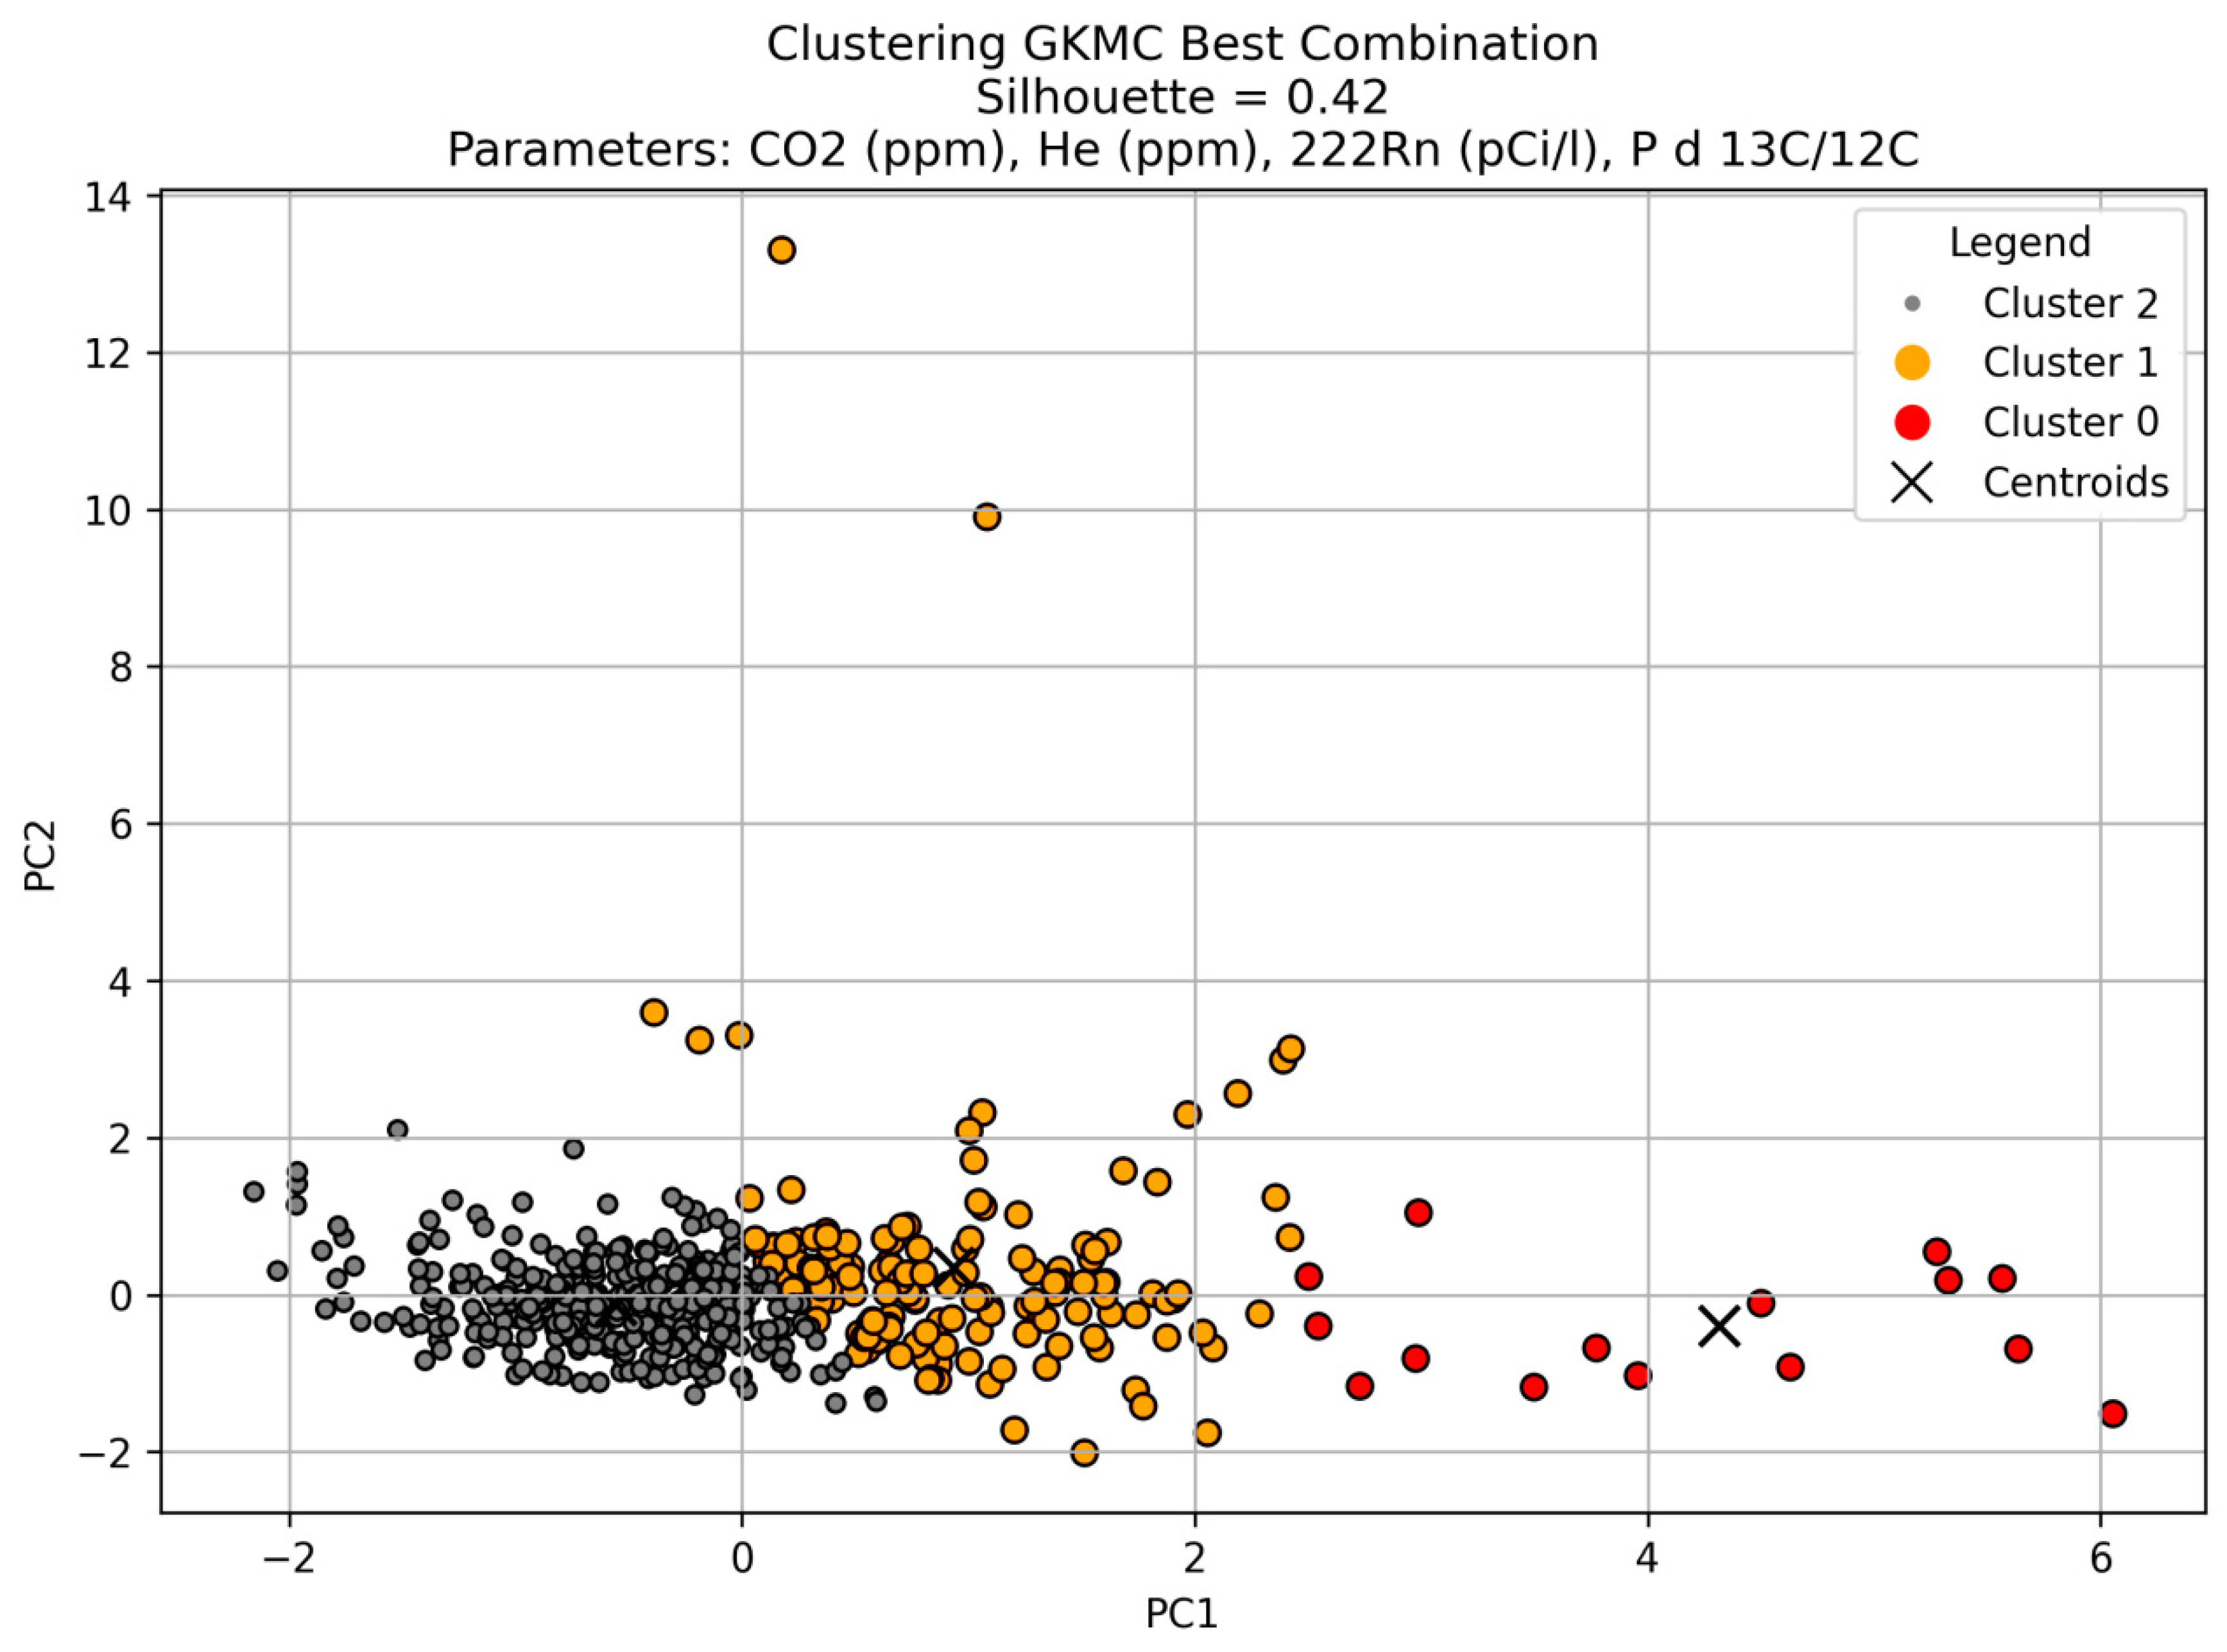
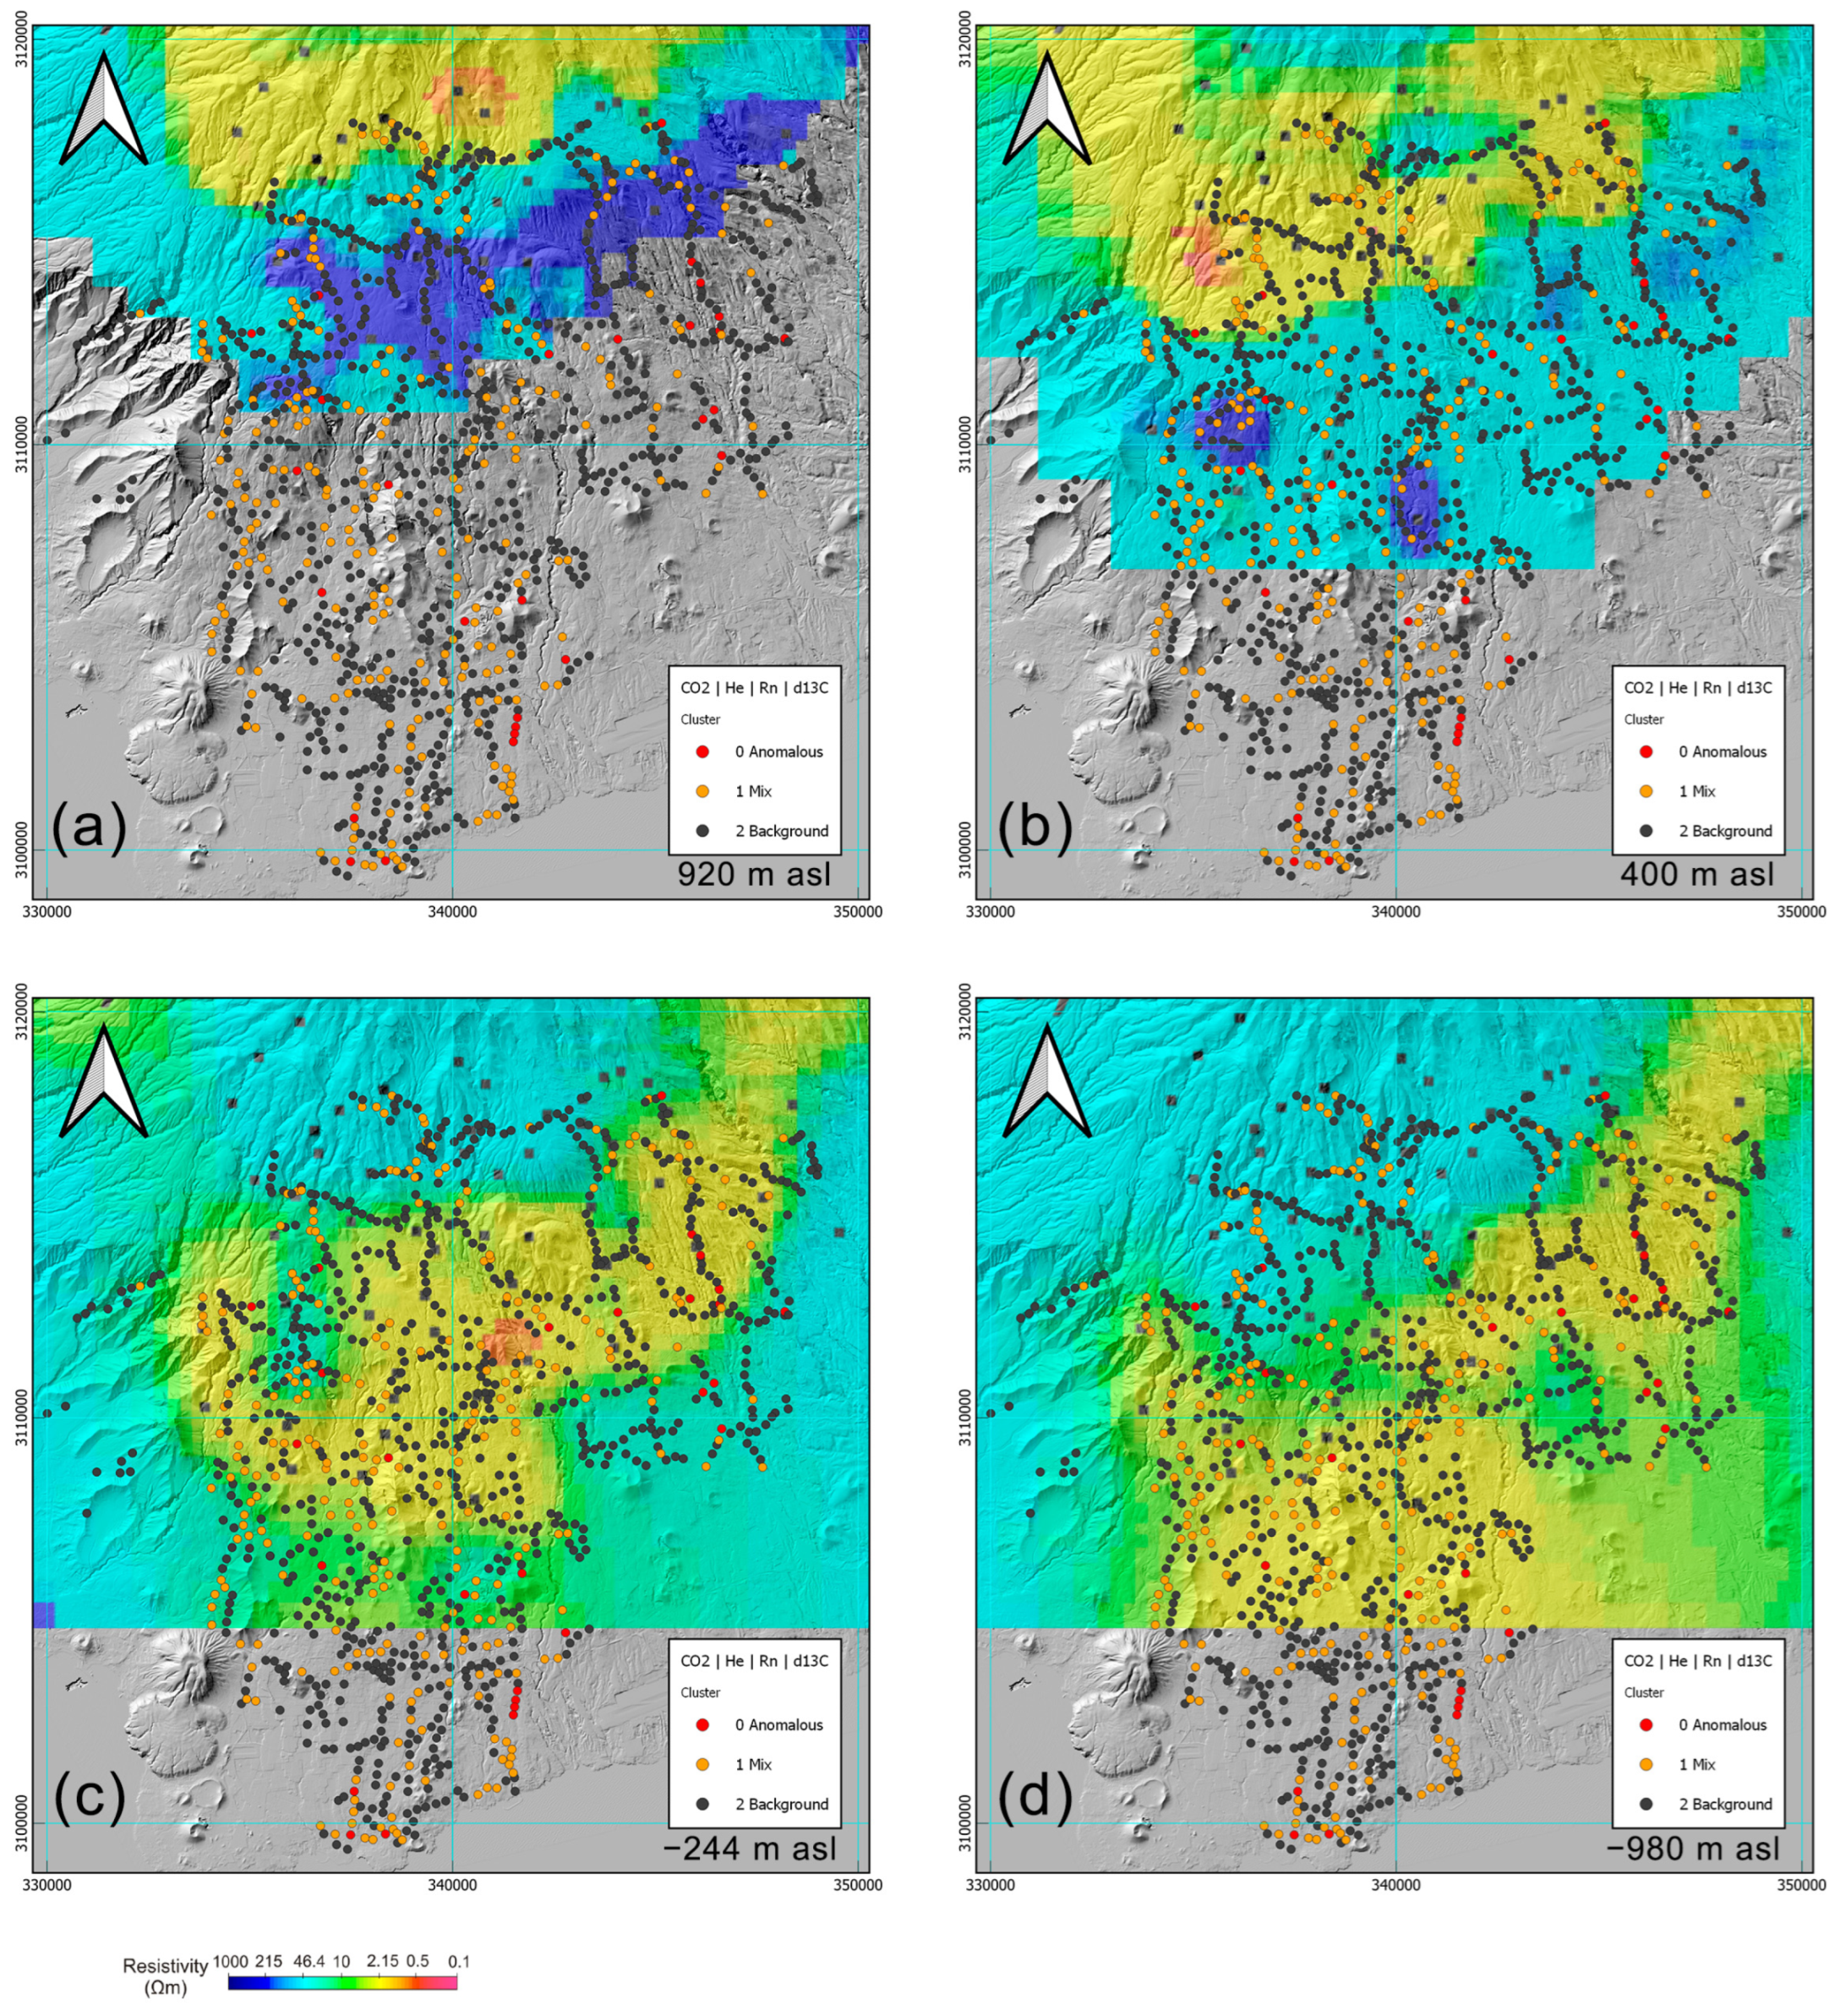
  • Cluster 0 (Red): This group comprises a small fraction of the dataset (~5%) but is characterized by co-occurring high CO2 fluxes, enriched He concentrations (≥15 ppm), elevated δ13C values (up to −6‰), and significant 222Rn activity. These geochemical signatures strongly suggest a magmatic-hydrothermal contribution, associated with enhanced vertical permeability along fault zones or deep-seated fracture networks. This cluster is interpreted as the primary geochemical expression of potential geothermal upflow zones.
  • Cluster 1 (Orange): Accounting for approximately 10% of the samples, this group shows intermediate values in all key parameters—e.g., CO2 fluxes around 50 g·m⁻2·d⁻1, δ13C values near −10‰, and modest He enrichment (~7 ppm). These sites are interpreted as transitional zones or halos surrounding more active degassing centers, reflecting areas of mixed gas sources or moderate permeability conditions.
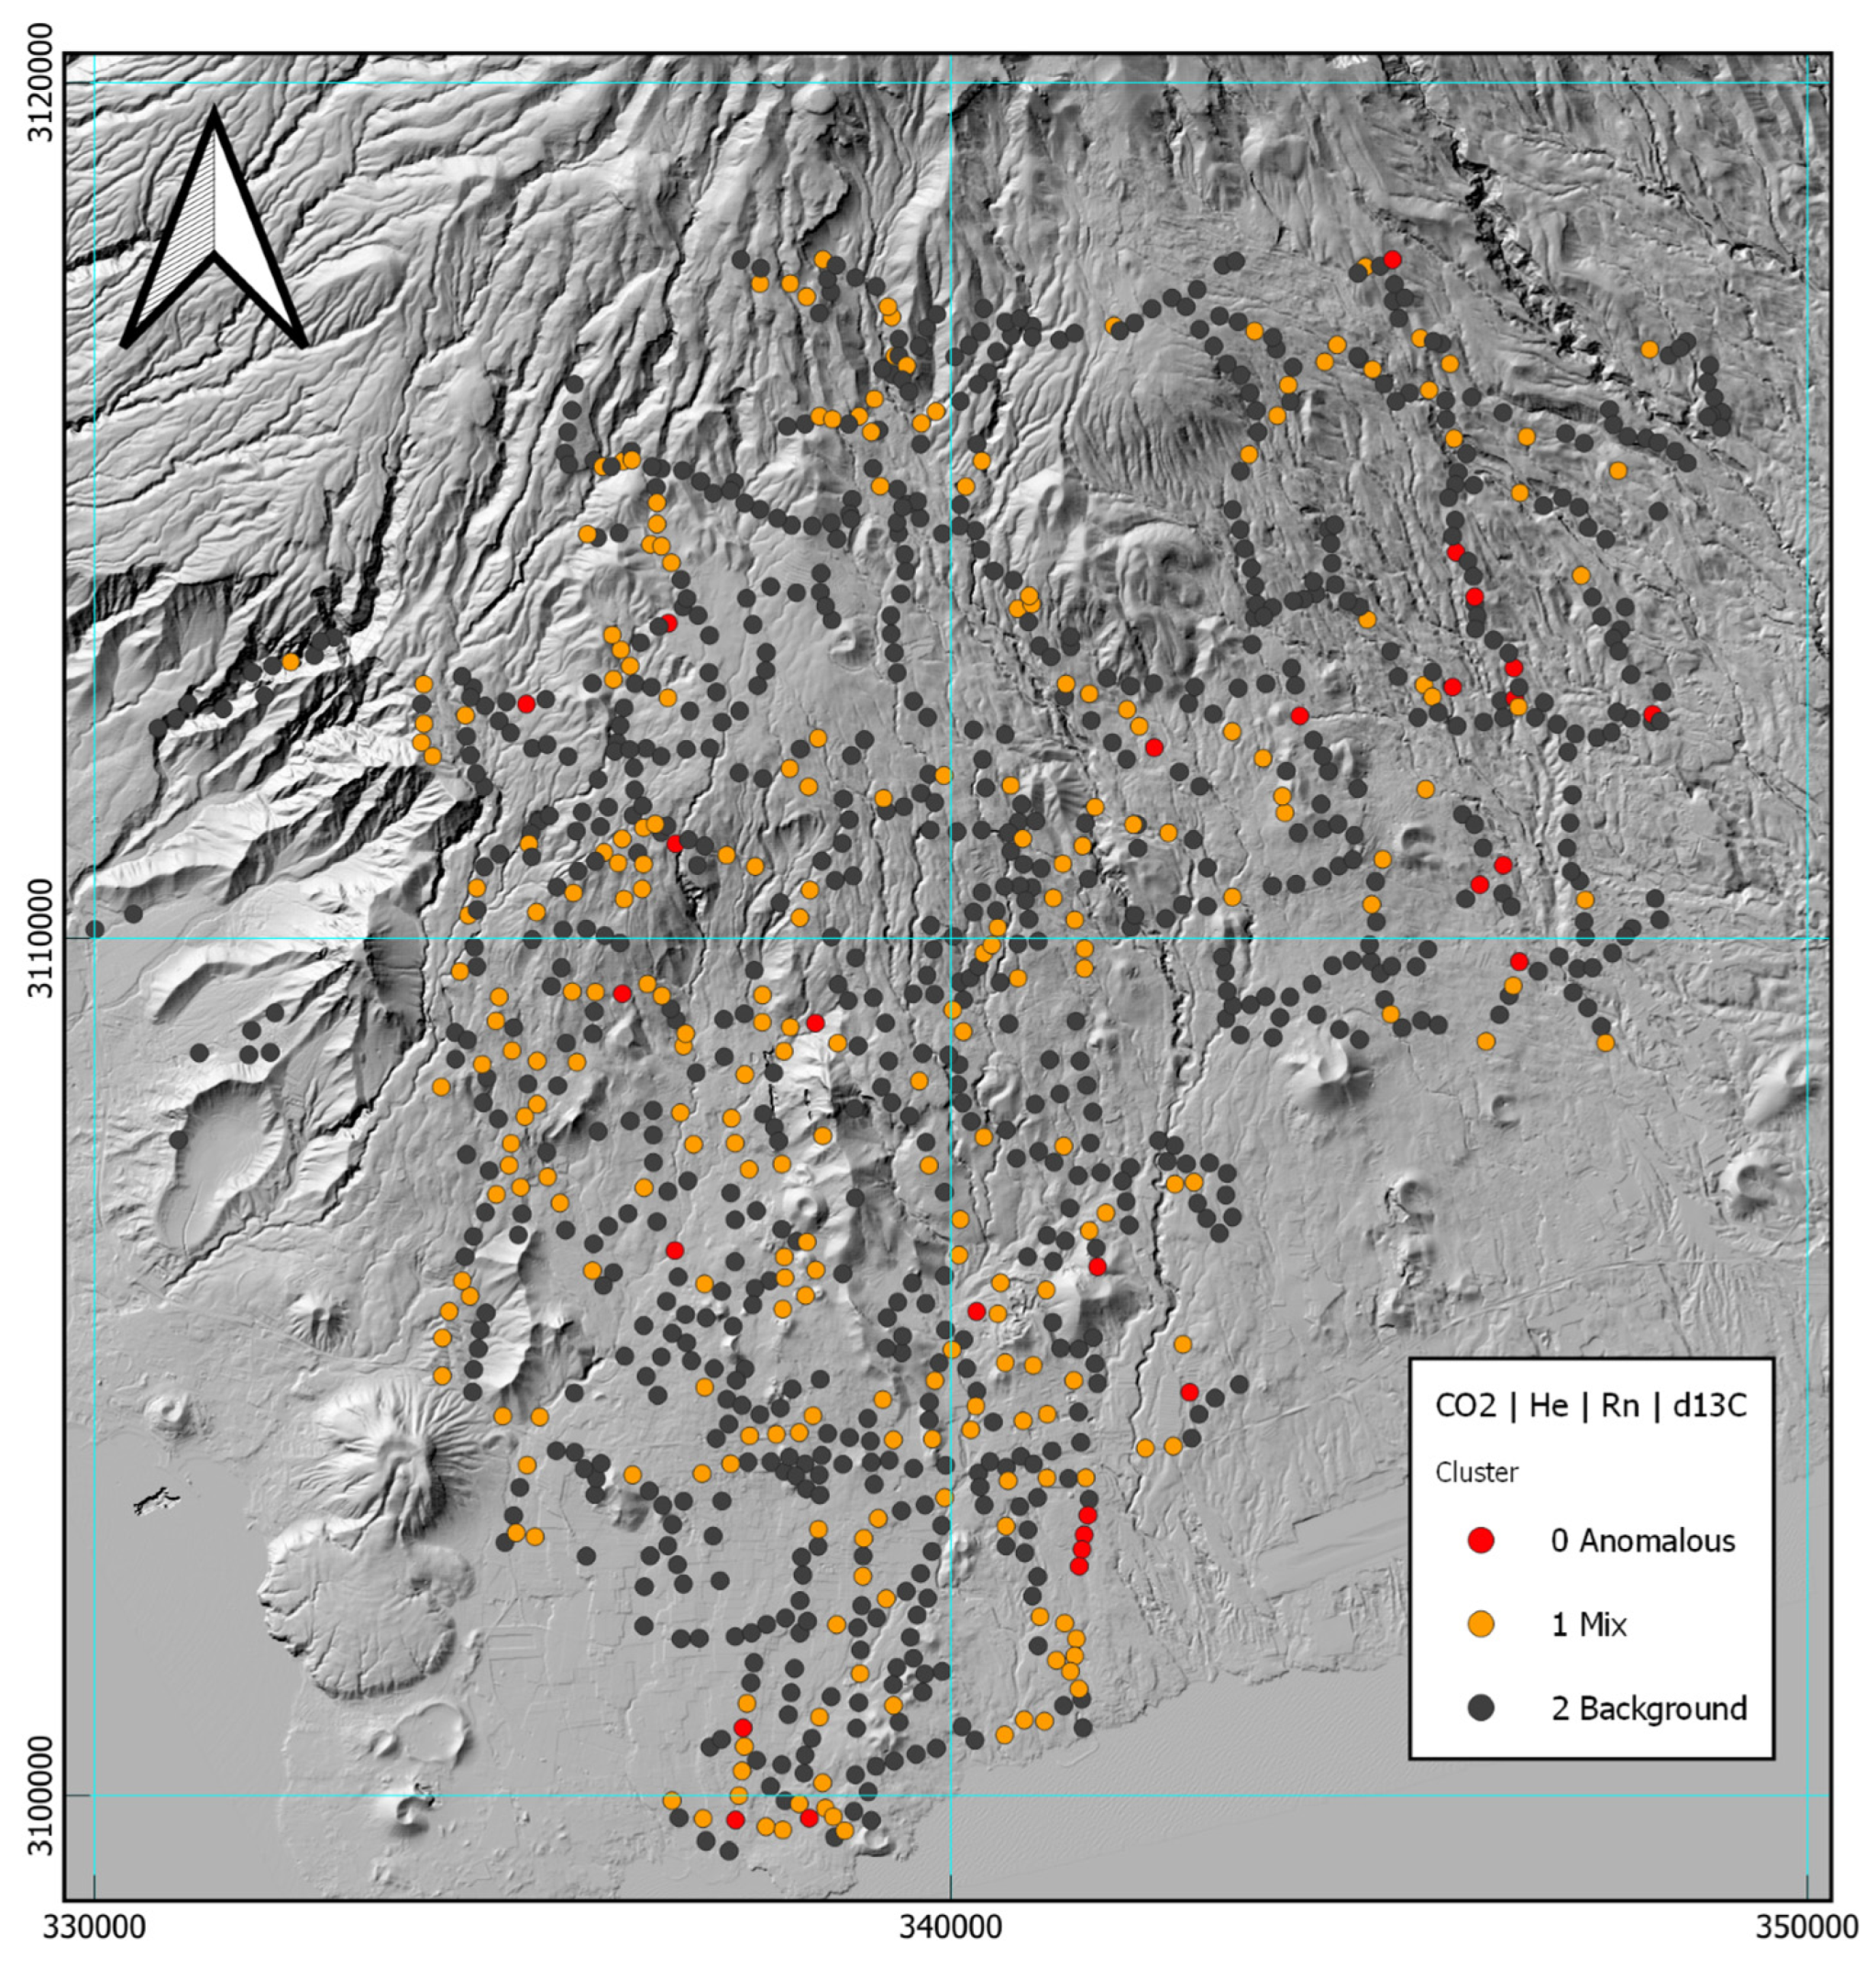
  • Cluster 2 (Dark Gray): Representing the background geochemical population (~85% of data), this cluster is marked by low CO2 flux, near-atmospheric He concentrations (~5.2 ppm), low 222Rn activity, and δ13C values around −25‰. These signatures are consistent with soil gas compositions dominated by biological activity, atmospheric mixing, and low subsurface gas input. The spatial distribution of this cluster covers most of the study area, especially the structurally unremarkable zones.

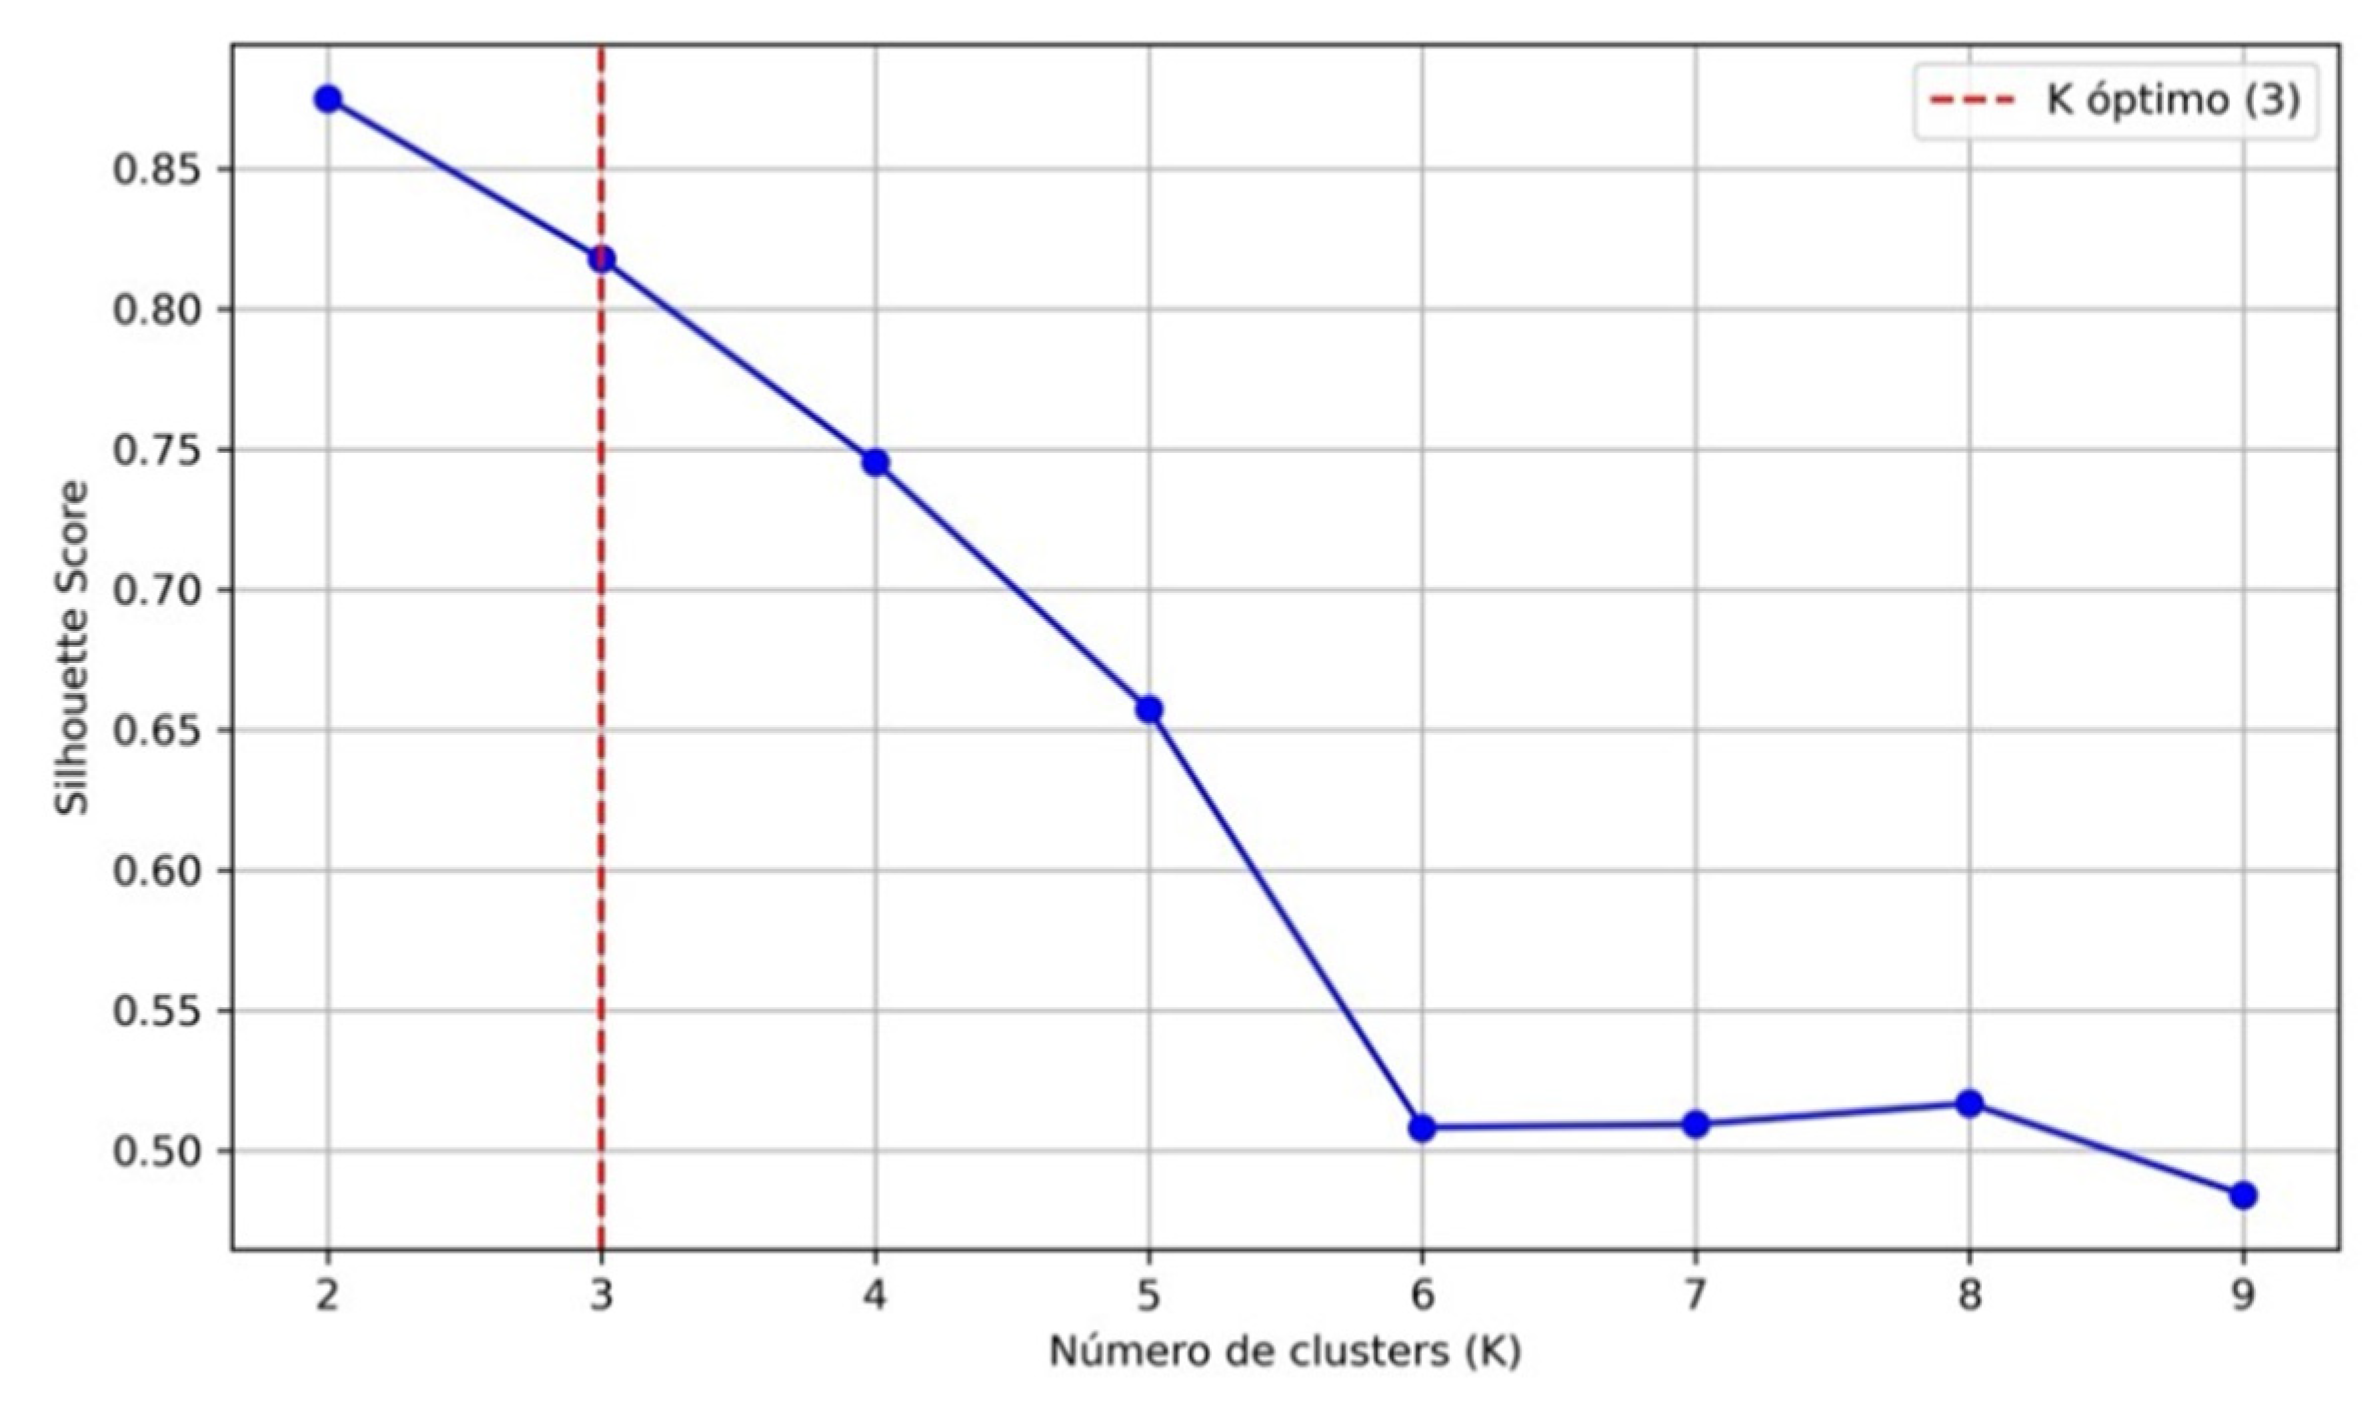
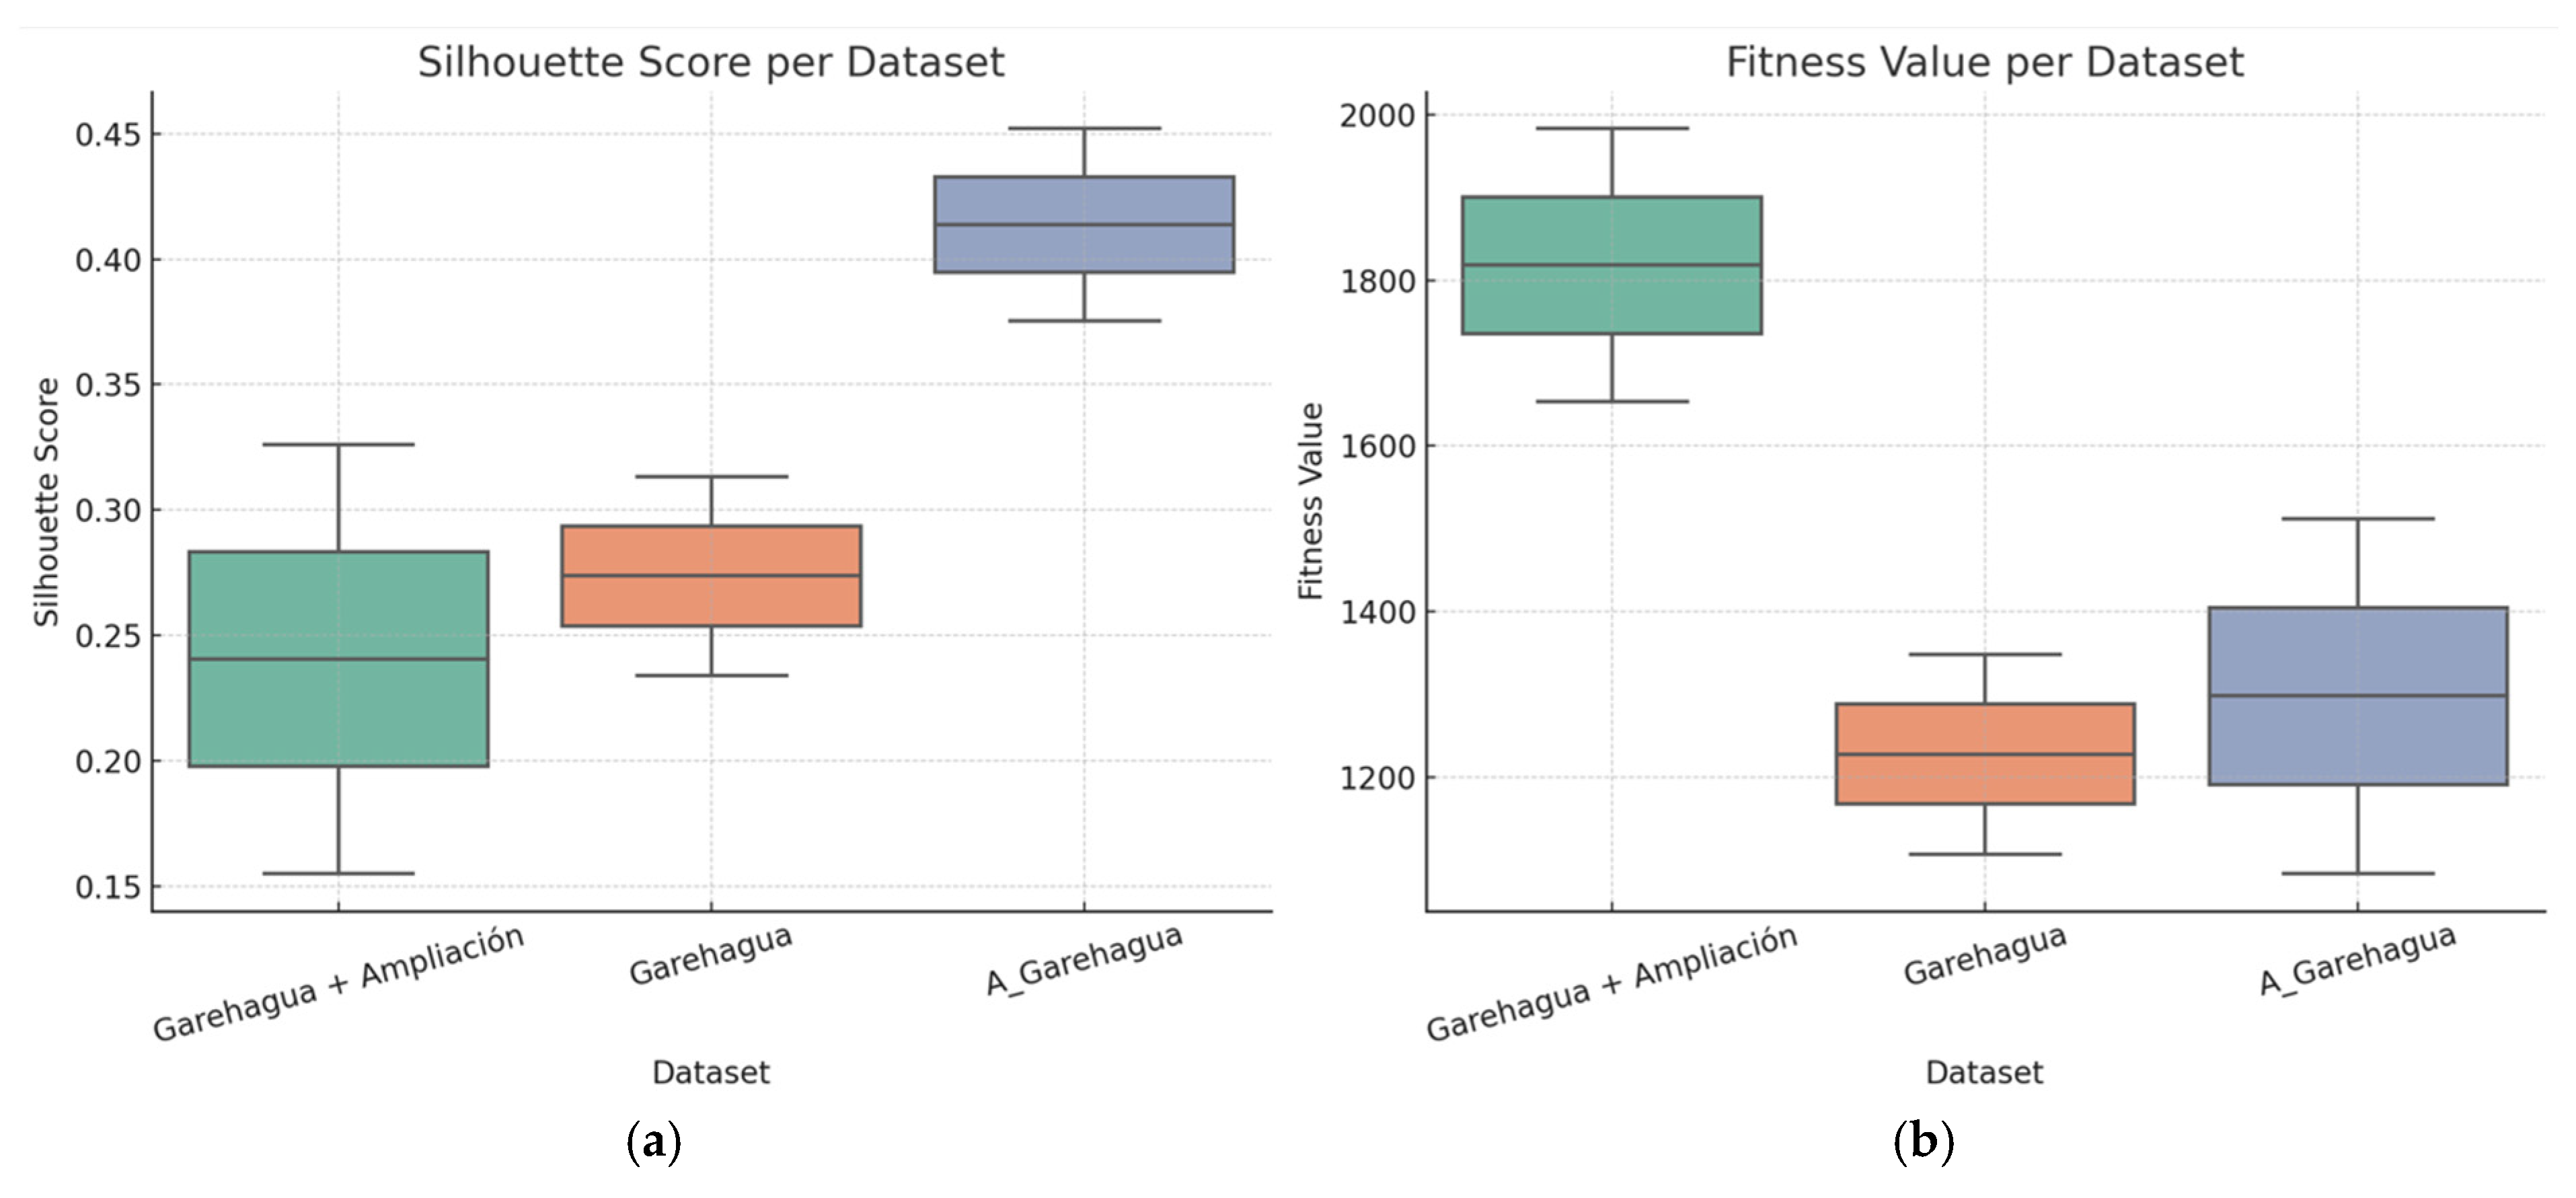
4.5. Stability and Robustness of GKMC Clustering

To evaluate the robustness of the GKMC algorithm under stochastic conditions, we performed 10 independent runs for each major subset: the full combined dataset, Garehagua, and Garehagua II mining license. For each execution, we used different random seeds while applying consistent preprocessing (log10 transform, z-score normalization, and PCA).
Figure 12 presents the comparative analysis of clustering performance through boxplots of Silhouette scores and fitness values, highlighting the stability and quality of clustering across the tested configurations.
The Garehagua subset showed the highest clustering coherence and stability, with a mean Silhouette Score of 0.418 ± 0.085 and a fitness value of 1321.4 ± 476.2. In contrast, runs on the full combined dataset yielded slightly lower but acceptable results.
Importantly, analyzing subsets independently avoided the inflation of cluster separation metrics due to inter-campaign bimodality, a common artifact when datasets collected under different conditions are merged. This analytical strategy served as a complementary validation of GKMC’s reliability, which ultimately supports the robustness of the integrated clustering shown in Section 4.
The optimized clustering yielded a moderate Silhouette score of 0.42, which, although not particularly high, is acceptable given the inherent heterogeneity and noise of soil gas datasets in volcanic environments. This result underscores both the utility and limitations of the GKMC approach: despite diffuse cluster boundaries, the method successfully captured meaningful geochemical structures that would be difficult to identify using traditional threshold-based anomaly detection.
To explore the internal relationships between key geochemical variables, a scatter matrix analysis was performed using log-transformed and z-score normalized values. Figure 13 displays pairwise correlations between ²²²Rn, CO₂, and He concentrations, with data points color-coded by GKMC cluster classification. The kernel density plots on the diagonal illustrate distinct distributions across clusters, where Clusters 1 and 2 exhibit broader or shifted profiles, suggesting potential deep-seated gas contributions and distinct geochemical signatures relative to background conditions.
To better characterize the geochemical behavior of soil gases within each cluster, the distributions of selected parameters were analyzed. Figure 14 presents histograms of normalized concentrations (log₁₀ + z-score) for He, CO₂, and ²²²Rn in the Garehagua study area. These visualizations highlight differences in gas behavior across clusters, with Cluster 1 showing predominantly background levels and Clusters 0 and 2 exhibiting more anomalous patterns, particularly in He and CO₂.
To visualize the separation and structure of the clusters generated by the GKMC algorithm, a Principal Component Analysis (PCA) projection was performed. Figure 15 displays the distribution of soil gas samples in the reduced PCA space, where clusters are clearly differentiated based on key geochemical variables, providing insight into the distinct geochemical signatures associated with magmatic, transitional, and background zones.
To assess the spatial coherence of the clustering results and their geological significance, the classification of the 1050 soil gas sampling sites was projected onto the topographic map of the Garehagua and Garehagua II study areas. Figure 16 displays the spatial distribution of cluster membership based on the most informative geochemical parameters identified: CO₂, He, ²²²Rn, and δ¹³C–CO₂.
The clusters exhibit a clear geographic pattern. Cluster 0 (red) corresponds to anomalous geochemical signals, frequently aligned with known structural features, such as fault systems and eruptive fissures, suggesting zones of enhanced vertical permeability and potential upflow of deep-seated fluids. Cluster 1 (orange) delineates areas of transitional geochemical signatures, possibly reflecting mixing processes between deep magmatic inputs and shallow biogenic or atmospheric components. Cluster 2 (dark gray) dominates the central and peripheral zones of the study area, marking regions with near-background values, consistent with soil gases primarily derived from surface or shallow sources.

5. Discussion: Structural and Spatial Interpretation of GKMC Clusters

The application of the GKMC algorithm not only allowed for the identification of discrete geochemical populations but also provided insight into the spatial structure and geological context of gas emissions across the Garehagua and Garehagua II prospects. The resulting clusters exhibit distinct geographic distributions that correlate meaningfully with the known tectonic and volcanic architecture of the southern rift zone of Tenerife.

5.1. Cluster 0—Deep Geochemical Anomalies Controlled by Fault Intersections

The most geochemically anomalous population, Cluster 0, is spatially concentrated in two key zones. The first lies near the intersection of NW–SE and NE–SW trending lineaments, a structurally complex area previously identified as a site of enhanced permeability in magnetotelluric (MT) studies [9,44]. The second cluster of anomalous sites is located along a southwestern structural corridor, which coincides with the extension of the southern rift axis. These areas exhibit elevated levels across all selected parameters—CO2 flux, He, 222Rn, and δ13C–CO2—suggesting active vertical migration of magmatic-hydrothermal fluids.
The spatial coincidence of these anomalies with tectonic intersections supports the interpretation that structural features act as preferential pathways for deep fluid ascent. This is consistent with the behavior observed in other volcanic islands, where fault intersections and rift zones enhance permeability and concentrate degassing [13,32]. The elevated helium concentrations strengthen the case for magmatic influence, as values exceeding 15 ppm cannot be explained by shallow processes alone.

5.2. Cluster 1—Transitional Zones Reflecting Partial Deep Input

Cluster 1 exhibits a peripheral spatial pattern, often forming halos around Cluster 0 zones or aligning with minor fractures and structural lineaments. The intermediate nature of its geochemical composition suggests a partial contribution from deep sources, diluted by mixing with background gases or attenuated by limited permeability. The occurrence of these transitional signatures supports the notion of lateral diffusion or leakage from deeper zones of upwelling, where gas migration is controlled by secondary structures such as radial fractures or lava flow discontinuities.
This “halo” configuration has been documented in other volcanic systems, where intermediate geochemical signatures delineate the outer margins of hydrothermal systems [28,45]. The identification of such zones is critical for geothermal prospecting, as they may provide indirect evidence of reservoir boundaries or the edges of fracture-controlled upflow areas.

5.3. Cluster 2—Regional Background and Structural Stability

Cluster 2 defines the geochemical background of the study area and is broadly distributed across regions lacking significant tectonic or volcanic features. The low gas fluxes, near-atmospheric helium, and strongly negative δ13C values are indicative of soils dominated by biological respiration and atmospheric gas exchange, with negligible input from deep sources.
The dominance of this cluster (>80% of data) underscores the limited surface expression of the geothermal system under investigation. This is expected in a volcanic island setting without active fumarolic fields or hydrothermal alteration at the surface. The widespread presence of this background population also highlights the sensitivity and selectivity of the GKMC approach, which was able to differentiate subtle, spatially confined anomalies within a noisy dataset.

5.4. Implications for Exploration and Conceptual Model Development

The clustering results and their spatial patterns inform a preliminary conceptual model of the subsurface system. Cluster 0 zones represent the primary upflow areas of deep geothermal fluids, structurally controlled and characterized by coherent multivariate anomalies. Cluster 1 may delineate leakage zones or lateral diffusion pathways. In contrast, Cluster 2 marks geochemically inert or structurally stable zones.
Importantly, these findings validate the integration of multivariate geochemical analysis with structural mapping in early-stage geothermal exploration. The correlation between geochemical anomalies and fault systems lends credibility to the hypothesis that deep fluid circulation is currently active, albeit spatially limited and structurally confined. These insights can be directly applied to the selection of drilling targets or the prioritization of follow-up geophysical surveys, particularly MT or passive seismic tomography aimed at imaging fracture networks and caprock geometries.
Correlation Between Clusters and Resistivity Anomalies: A qualitative comparison between the GKMC-derived cluster distribution and resistivity slices from magnetotelluric (MT) data reveals a notable spatial association. The resistivity models, derived from Piña-Varas et al. (2014) [46] and interpreted by Rodríguez et al. (2015) [9], show coherent low-resistivity anomalies (≤2 Ω·m) beneath the central and southern parts of the study area.
The clustering results were projected onto horizontal slices of the 3D magnetotelluric (MT) resistivity model. Figure 17 illustrates the distribution of cluster memberships at four elevation levels, superimposed over the resistivity maps. Notably, Clusters 0 and 1 frequently coincide with low-resistivity zones (<2 Ω·m), supporting their interpretation as areas of hydrothermal alteration and potential gas ascent pathways. This geophysical-geochemical correspondence reinforces the structural significance of the clustering patterns identified in the study.
Clusters 0 and 1, particularly those enriched in CO2, He, and 222Rn, tend to align with these conductive zones. This supports the interpretation that they may correspond to deep-seated hydrothermal conduits or alteration zones, structurally controlled and potentially linked to hidden geothermal activity.
Although this analysis is qualitative, the overlapping trends between resistivity anomalies and geochemical clusters lend credibility to the multivariate clustering approach as a reconnaissance tool in structurally complex volcanic terrains.
The multivariate clustering results, derived through the GKMC algorithm, enabled the geochemical domain to be segmented into three clearly differentiated populations. This partitioning is broadly consistent with the geological framework of the southern rift zone of Tenerife, highlighting the method’s effectiveness in detecting subtle geochemical signals potentially linked to deep geothermal processes.
From a geochemical perspective, most of the area (~74%) was assigned to Cluster 2, which represents a background population dominated by atmospheric and biogenic signals. Helium concentrations close to atmospheric levels (~5.2 ppm), δ13C values near −25‰, and low CO2 fluxes suggest that this cluster reflects an environment unaffected by endogenous fluid contributions. This interpretation aligns with previous studies reporting limited surface geothermal expression in peripheral zones of the system [5,27].
Cluster 1, interpreted as an intermediate or “halo” zone, comprises approximately 10% of the sampling points. It is characterized by moderately elevated geochemical parameters, including CO2 fluxes around 50 g·m⁻2·d⁻1, slightly enriched helium (~7 ppm), and δ13C values near –10‰. These features suggest a mixture of deep and shallow gas components, facilitated by secondary structures or partially fractured zones. Similar halo patterns have been described in other volcanic-geothermal systems, where lateral permeability allows for diffuse gas escape [13,14,15,16,17,18,19,20,21,22,23,24,25,26,27,28,29,30,31,32].
Cluster 0 represents the most geochemically anomalous population, though it comprises only ~5% of the dataset. It shows clear evidence of deep magmatic contributions: CO2 fluxes reaching up to 300 g·m⁻2·d⁻1, helium concentrations ≥ 15 ppm, δ13C values as high as −6‰, and elevated levels of 222Rn and H2. The magnitude and multivariate consistency of these anomalies support their interpretation as surface manifestations of an active deep geothermal system. Particularly notable is the helium anomaly, which—as supported by Rodríguez et al. [9] and Martín-Lorenzo et al. [44]—has been consistently linked to increased vertical permeability as thinning of clay cap in magnetotelluric models.
The univariate graphical statistical analysis (Sinclair method) further supports the cluster interpretation by demonstrating that the proportion of data considered “peak” (i.e., potentially indicative of deep contributions) is consistently low across all variables. For instance, only 2.1% of the CO2 flux values exceed the defined anomaly threshold, while just 0.7% of the helium data show concentrations significantly above atmospheric background. These findings suggest that while there are localized zones of deep degassing, they are spatially limited and do not indicate a widespread, high-enthalpy geothermal system—consistent with conclusions from previous geothermal exploration programs in Tenerife [43].
The analysis of gas ratios, such as CO2/He and CO2/CH4, provides further insight into the origin of anomalous emissions. Cluster 2, identified as the most geochemically anomalous group, displayed CO2/He ratios ranging between ~2000 and 12,000. These values fall within the range reported for mantle-derived and hydrothermal fluids in volcanic systems such as Pantelleria and Campi Flegrei [47].
Additionally, CO2/CH4 ratios exceeded 1000 in many cases, consistent with non-biogenic sources and contrasting with typical background soils where microbial activity often results in lower CO2/CH4 values (<100) [48]. These elevated ratios suggest gas mixtures dominated by magmatic-hydrothermal input with minor dilution from shallow sources.
The combined interpretation of gas concentrations and ratios supports the presence of a deep-seated degassing system, structurally controlled and largely masked at the surface, as inferred from the clustering and spatial analyses.
Alternative Interpretations of Geochemical Anomalies. Although the geochemical patterns identified through clustering suggest deep magmatic-hydrothermal inputs, it is important to consider alternative explanations. Some anomalies may reflect diffuse degassing along tectonic structures without active hydrothermal circulation. These could represent paleo-pathways or low-permeability faults allowing magmatic gases to escape without significant fluid involvement.
In such cases, the presence of CO2, He, or 222Rn anomalies would not necessarily indicate an exploitable geothermal reservoir [49]. Additional constraints from geophysical surveys or drilling would be required to confirm fluid-bearing structures, permeability, and temperature gradients. Thus, while our results highlight structurally controlled zones of deep degassing, the geothermal potential of these zones remains to be validated.
Methodology Conclusion. Despite limitations inherent to soil gas surveys—such as sensitivity to weather and temporal variations—the GKMC algorithm proved effective in identifying geochemically significant zones. By reducing background noise and integrating multivariate signals, it enables the detection of concealed geothermal systems that might be overlooked in traditional single-parameter analyses.
Geological Controls. Geologically, the anomalous clusters show spatial alignment with the intersection of NE–SW and NW–SE trending tectonic lineaments—structures historically identified as stress concentration zones and conduits for vertical fluid migration within Tenerife’s volcanic edifice [19,20]. This structural-geochemical correlation reinforces the hypothesis that magmatic gases preferentially migrate through tectonic weakness zones.
The spatial distribution of GKMC-derived clusters shows notable alignment with geological structures in the southern rift zone of Tenerife. High-intensity clusters, particularly those dominated by elevated CO2, helium, and 222Rn, appear concentrated along NE–SW and NW–SE lineaments corresponding to mapped or inferred faults.
One cluster shows direct correlation with the Galería Fuente del Valle, a subsurface structure previously associated with geothermal anomalies. Moreover, the elongation of some cluster boundaries is consistent with the orientation of volcanic dikes and cone alignments, suggesting structural pathways for fluid ascent.
The distribution of geochemical clusters was compared with the mapped tectonic framework of the study area. Figure 18 shows the spatial arrangement of GKMC-derived clusters superimposed on structural lineaments. The alignment of Cluster 2 (anomalous) and Cluster 1 (transitional) points along NE–SW and NW–SE trending faults suggests a strong structural influence on the degassing pathways. In particular, several anomalous points are located near the Fuente del Valle hydrothermal gallery, reinforcing the hypothesis of tectonically controlled magmatic gas ascent.
While some of these associations are interpretative, the convergence of geochemical anomalies with structural trends supports the hypothesis that deep degassing is structurally channeled. These findings reinforce the value of cluster analysis as a tool for identifying concealed geothermal features in complex volcanic settings.
Effectiveness of GKMC Clustering. The GKMC approach proved effective for processing the complex geochemical dataset. By simultaneously considering multiple soil gases, the clustering reduced the interpretative ambiguity often associated with single-parameter anomaly maps. The GKMC algorithm improved the stability and reproducibility of results: repeated runs yielded consistent cluster patterns, indicating that the groupings reflect intrinsic data structures rather than algorithmic artifacts. This robustness is critical when such methods are used to support decisions in geothermal drilling.
One of the most relevant outcomes is that GKMC effectively filtered out background noise. Minor variations due to local microbiological activity or diurnal fluctuations—especially in CO2 and 222Rn—were consistently grouped into the dominant background cluster. In contrast, only persistent, multi-parameter anomalies were isolated, reinforcing the method’s role as a data-driven anomaly detector. These results support previous findings by Ghezelbash et al. [17] and extend the applicability of GKMC to geothermal exploration. We recommend its implementation in similar projects, particularly those involving multivariate geochemical datasets, as it facilitates a more integrated and interpretable view of subsurface degassing processes.
Implications for Geothermal Potential. The integrated results indicate that the southern rift zone of Tenerife hosts a concealed geothermal resource with characteristics that merit further investigation. The areas delineated through clustering and geochemical analysis appear suitable for future exploratory drilling. However, additional studies will be required to quantify key reservoir parameters—this study represents an initial step toward identifying and characterizing the system.
The methodology applied here could be extended to detect blind geothermal systems in other volcanic islands, such as La Palma, El Hierro, or similar oceanic settings. Furthermore, the findings highlight the strategic value of conducting detailed surface surveys prior to drilling. Despite the absence of existing wells in the study area, our approach enabled the development of a plausible conceptual model of the subsurface and the identification of potential drilling targets, thereby contributing to a reduction in exploration risk and associated costs.
Despite the absence of existing wells in the study area, our approach enabled the development of a plausible conceptual model of the subsurface and the identification of potential drilling targets, thereby contributing to a reduction in exploration risk and associated costs.
In addition, the spatial correlation between geochemical anomalies and major fault intersections provides further support for the presence of structurally controlled upflow zones. As shown in Figure 19, anomalous clusters (Cluster 0) are frequently aligned with the convergence of NW–SE and NE–SW trending faults—features historically associated with tectonic stress concentration and increased vertical permeability. This alignment suggests that magmatic gases ascend preferentially along these discontinuities, reinforcing the potential of the southern rift zone as a structurally focused geothermal system.
Critical Evaluation of Methods. Although the approach proved effective, several limitations must be acknowledged. Soil gas surveys are inherently sensitive to atmospheric and seasonal variability. In this study, data were collected over two campaigns to minimize the impact of diurnal fluctuations; however, extreme weather events can temporarily obscure geochemical anomalies. The analysis assumes steady-state degassing, yet episodic emissions—if present—could remain undetected depending on the sampling window.
The reliability of the clustering results is closely tied to data quality and spatial density. In our case, the high-resolution sampling grid enhanced the robustness of the analysis; in contrast, sparser datasets may hinder the formation of meaningful clusters. The GKMC algorithm also requires a predefined number of clusters (k); we selected k = 3 based on both geological reasoning and statistical indicators. Nonetheless, in more geologically complex systems—such as those with multiple distinct upflow zones—a higher number of clusters might be necessary. In our case, however, the resulting classification was unambiguous and consistent.
Comparison with Other Geothermal Systems. The approach and findings from this study in Tenerife are comparable to investigations conducted in other active geothermal fields, particularly in continental settings such as Italy and Türkiye. In those regions, soil CO2 surveys combined with clustering methods—though not always using GKMC—have been applied to delineate degassing anomalies, while magnetotelluric (MT) data frequently reveal low-resistivity clay caps sealing geothermal reservoirs, as observed in areas like Larderello, Italy. Although Tenerife presents a distinct geological context as an oceanic island dominated by basaltic volcanism, the fundamental principles remain applicable.
Beyond its geothermal implications, this study also contributes to the broader understanding of Tenerife’s volcanic system. The geochemical anomaly identified in the southern rift may be linked to an underlying magmatic intrusion, which not only suggests geothermal potential but also raises considerations related to volcanic hazard. Overpressured geothermal systems could influence future eruption sites or contribute to elevated CO2 emissions during periods of unrest. In this sense, continuous soil gas monitoring in the region can serve as an early-warning tool for magmatic intrusions. Thus, the present interdisciplinary exploration effort also serves a dual role as a volcano monitoring initiative.

6. Conclusions

This study presents the results of a high-density soil gas survey conducted across the Garehagua and Garehagua II geothermal prospect areas in southern Tenerife. By integrating conventional geochemical techniques with advanced multivariate analysis—specifically the GKMC method—this study enabled the detection and classification of geochemical populations within a complex volcanic setting characterized by subtle surface signals. The main conclusions are as follows:
  • Discrete Geochemical Zonation via Multivariate Clustering. The application of GKMC to key parameters (CO2, He, 222Rn, and δ13C–CO2) yielded a robust three-cluster solution. Cluster 0 defines geochemically coherent, spatially restricted anomalies associated with deep magmatic-hydrothermal contributions. Cluster 1 corresponds to transitional zones influenced by partial deep inputs, while Cluster 2 represents regional background conditions dominated by biogenic and atmospheric components.
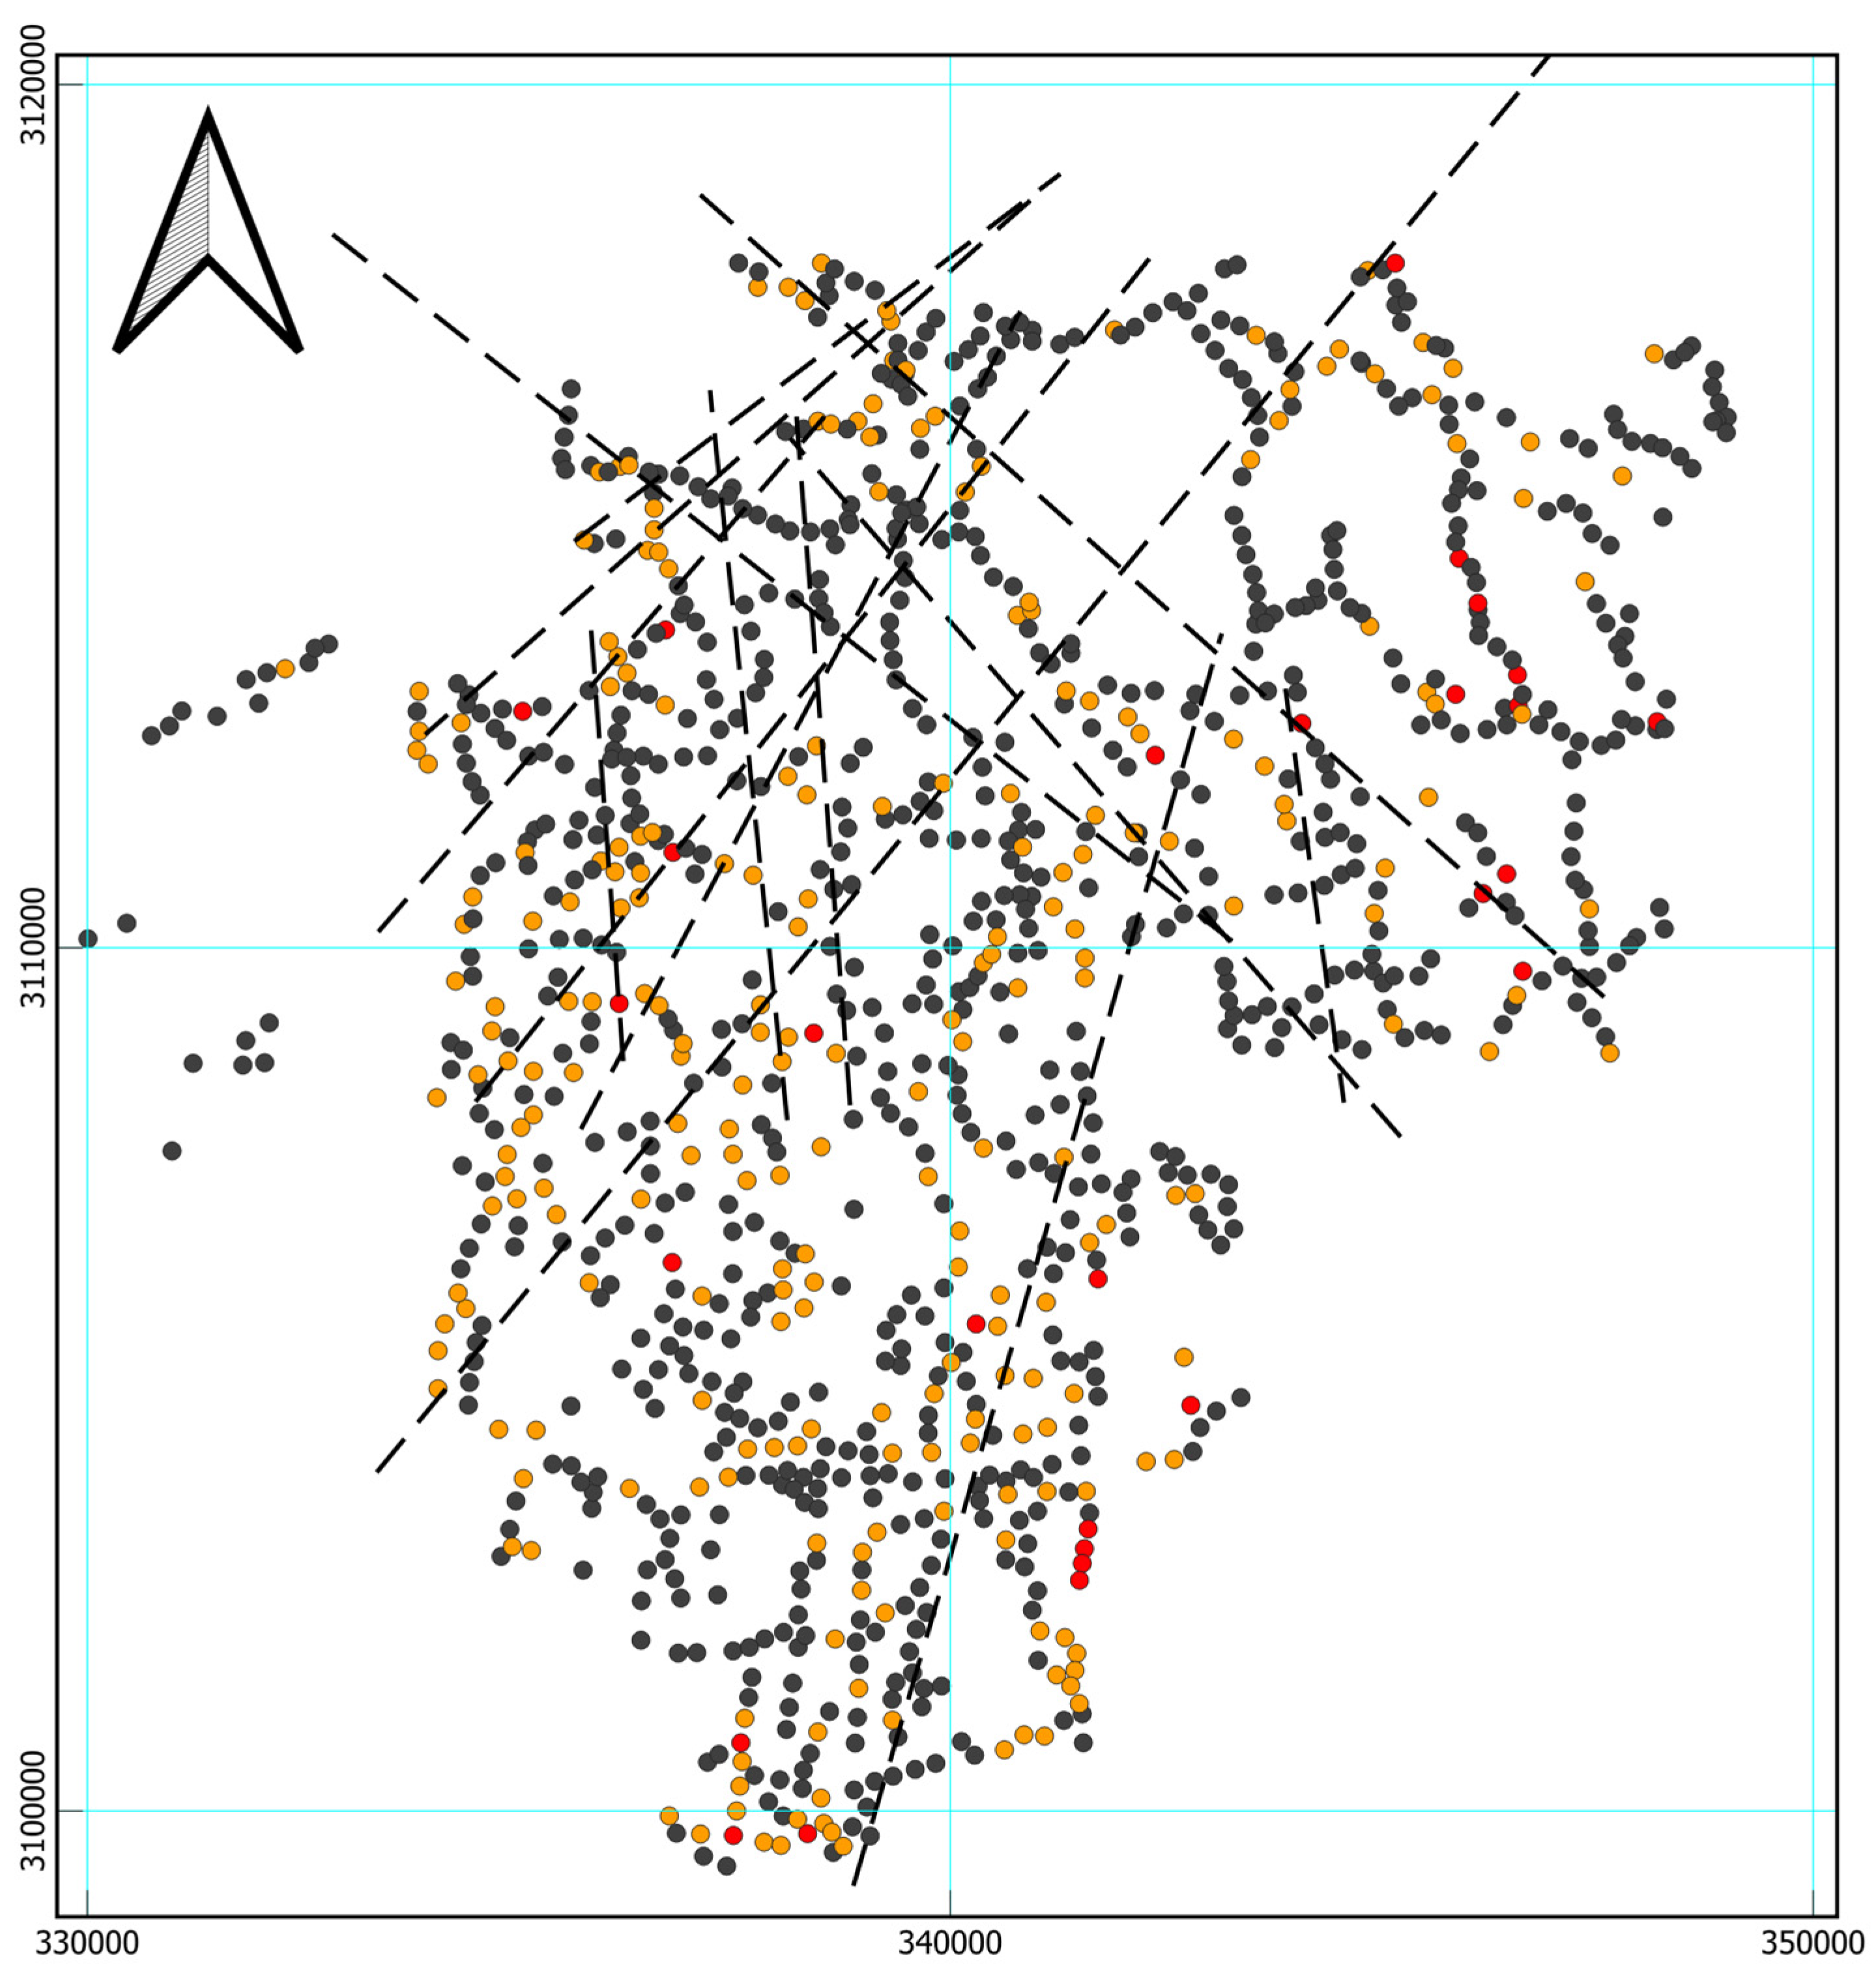
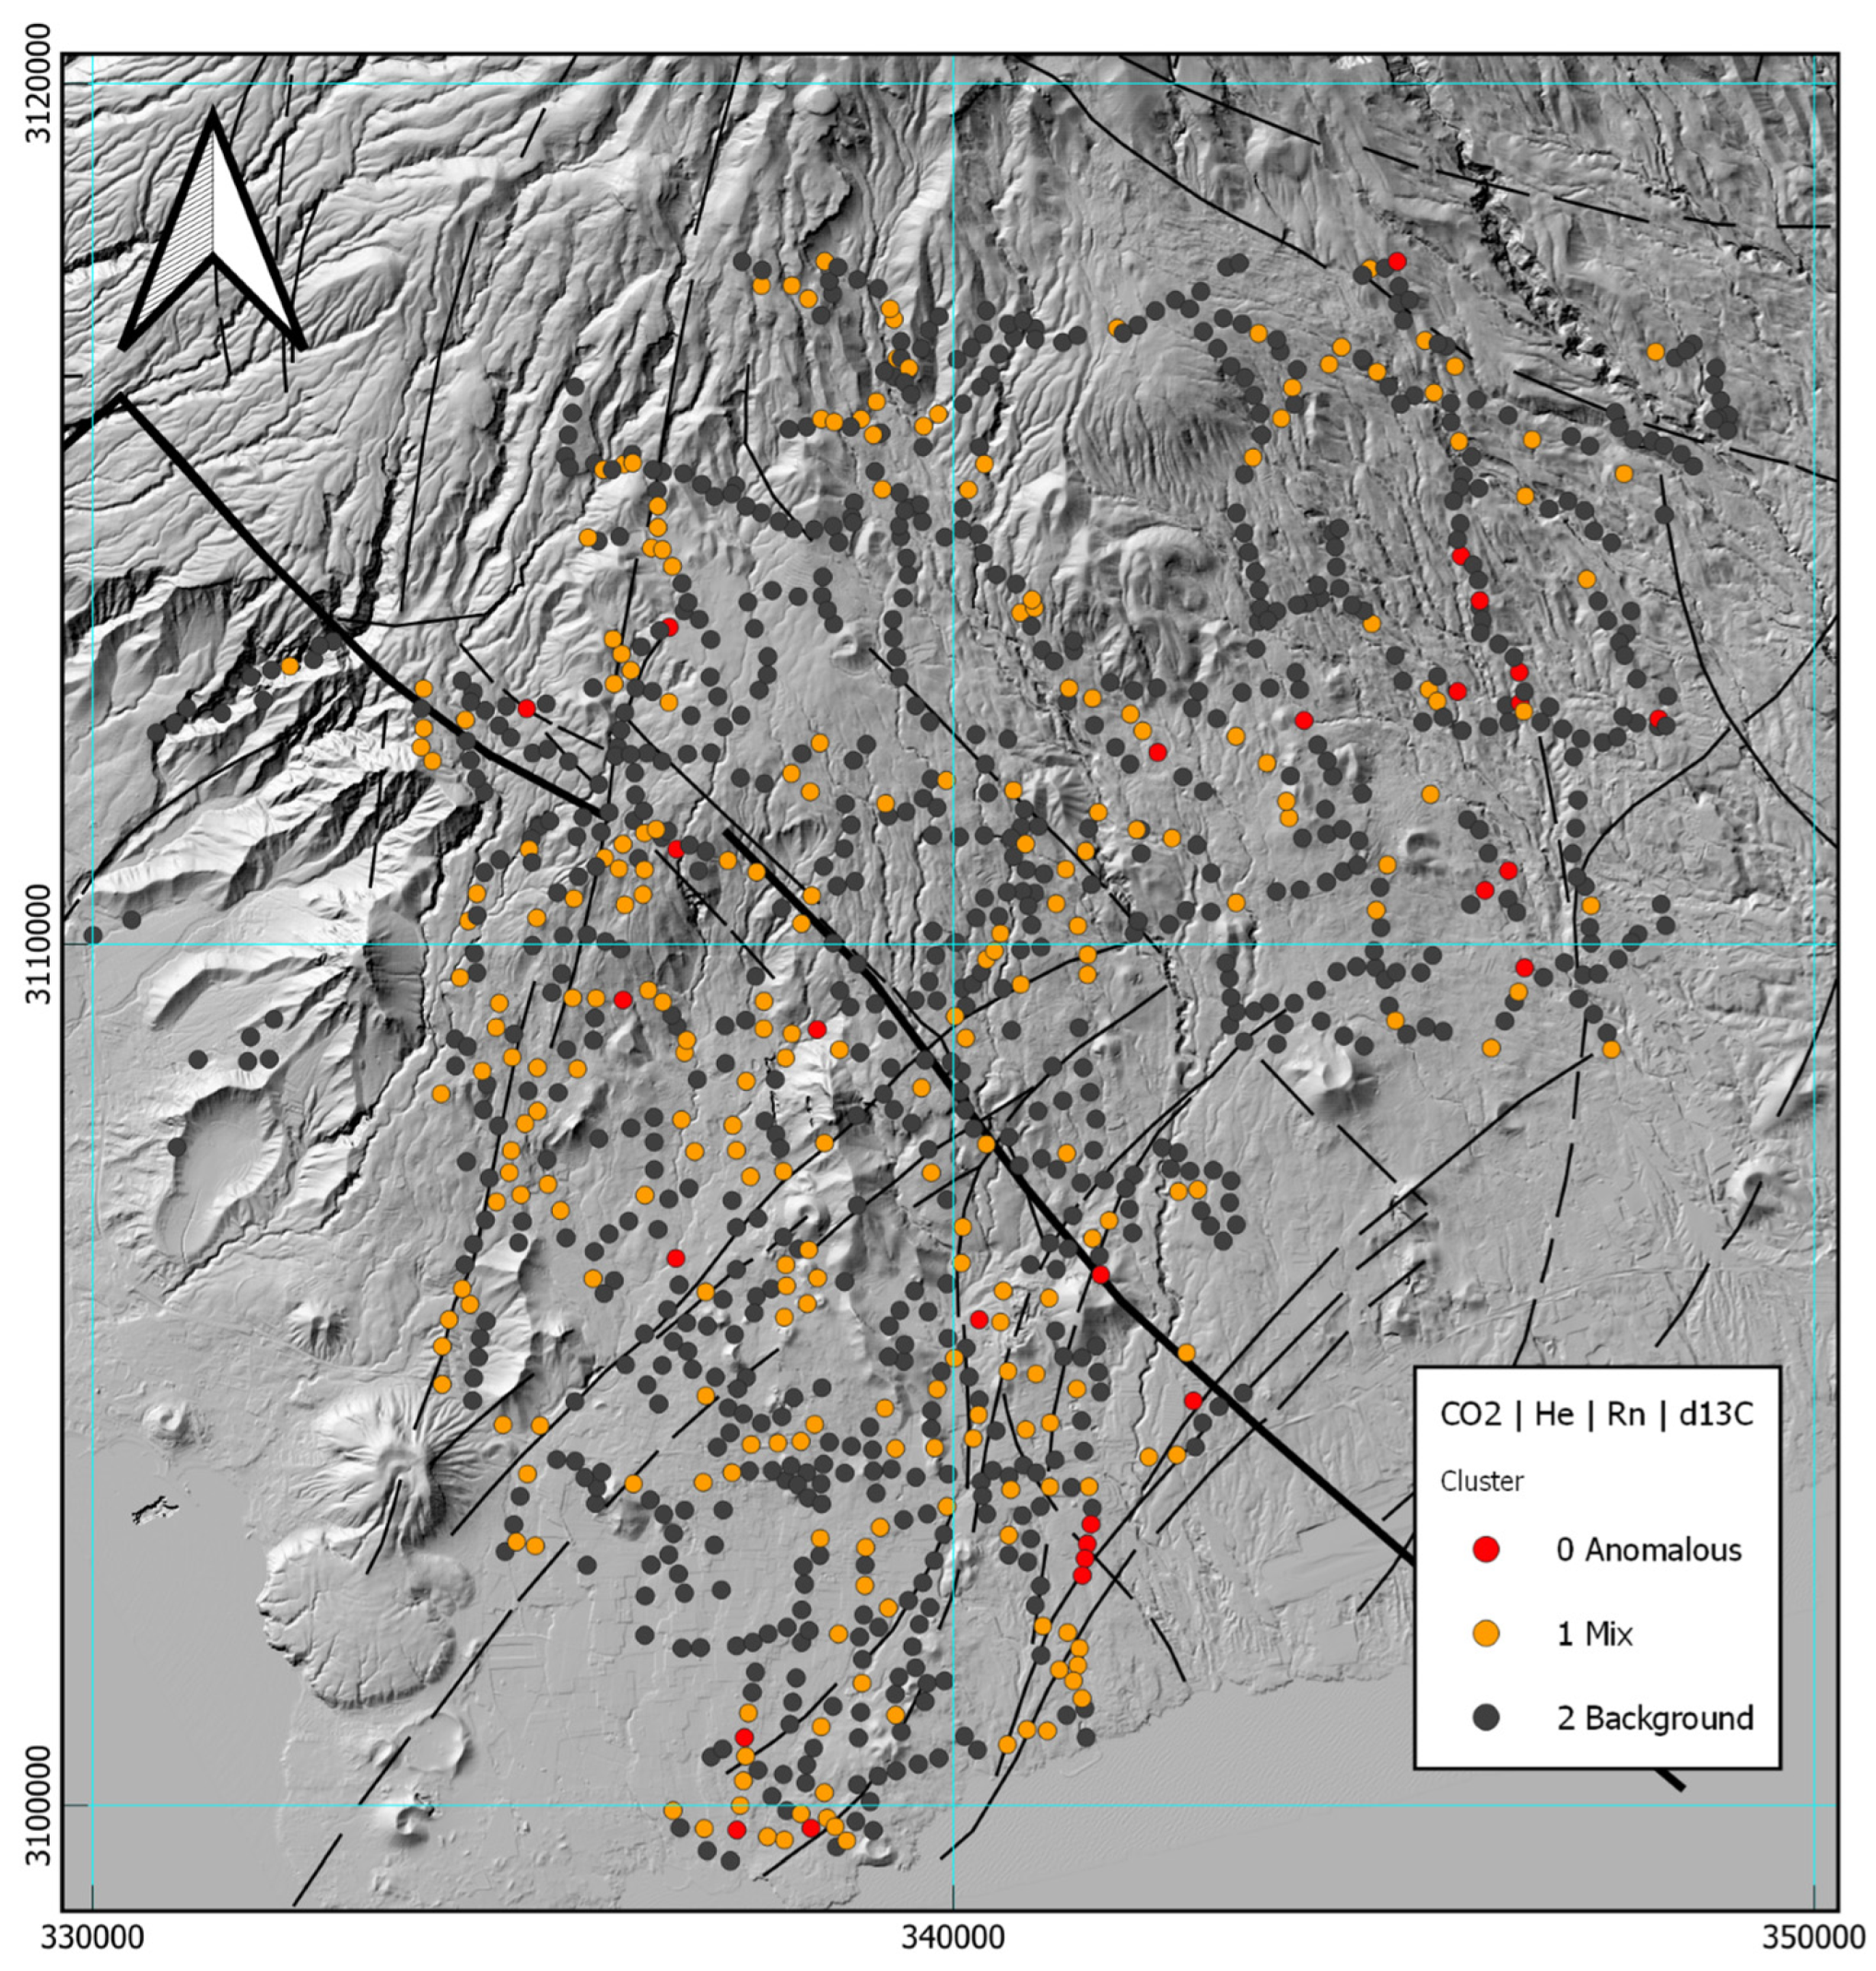
  • Structural Control on Fluid Migration. The spatial distribution of Cluster 0 correlates strongly with the intersection of NW–SE and NE–SW fault systems, historically recognized as preferential pathways for vertical gas migration in Tenerife’s volcanic edifice. These findings reinforce the structural control hypothesis in governing subsurface fluid dynamics.
  • Subtle but Meaningful Geochemical Anomalies. Although individual gas parameters exhibit low proportions of anomalous values (e.g., only 2.1% for CO2 flux), the multivariate clustering approach revealed consistent geochemical signals that would be overlooked through univariate analysis. This underscores the value of integrated, data-driven methodologies in detecting “hidden” geothermal systems without surface hydrothermal manifestations.
  • Methodological Robustness and Exploratory Value. The GKMC algorithm demonstrated robust performance in managing noisy, multivariate geochemical datasets. Its capacity to isolate subtle anomalies embedded within dominant background populations highlights its utility in early-stage geothermal exploration, particularly in volcanic and data-scarce environments.
  • Next Steps in Geothermal Assessment. While the geochemical results do not suggest a large or high-enthalpy reservoir, the identification of localized, structurally controlled deep gas emissions justifies further investigation. Combining these findings with complementary techniques—such as magnetotelluric imaging, shallow gradient drilling, and passive seismic monitoring—will help refine the conceptual subsurface model and better characterize reservoir properties. The methodology presented here may also be applied to other oceanic volcanic islands with similar geodynamic settings, such as El Hierro or La Palma.

Future Studies

We recommend that the identified geochemical anomaly zones undergo further targeted investigation. Techniques such as shallow temperature gradient drilling and passive seismic noise tomography could improve the resolution of subsurface heat anomalies and fracture networks. Moreover, the integration of geochemical and geophysical datasets through 3D joint inversion—using gas emissions as proxies for permeability—presents a promising pathway for advanced reservoir characterization.
An additional avenue of interest lies in expanding the GKMC clustering framework to include geophysical variables (e.g., resistivity and gravity) along with geochemical parameters. This would enable a fully integrated multivariate clustering approach, enhancing subsurface modeling and anomaly interpretation. Such integrative data workflows represent a valuable direction for future geothermal exploration.
In conclusion, although the geochemical data do not indicate a high-enthalpy or spatially extensive geothermal system, the methodology applied in this study has proven effective in detecting and interpreting subtle endogenous signals. The results emphasize the utility of multivariate statistical tools in early-stage geothermal exploration, particularly in volcanically active environments with limited surface manifestations.

Author Contributions

Conceptualization, L.D.; methodology, Á.M.G.-M.; validation, Á.M.G.-M. and N.M.P.R.; formal analysis, L.D. and N.M.P.R.; investigation, Á.M.G.-M.; data curation, L.D. and Á.M.G.-M.; writing—original draft preparation, Á.M.G.-M.; writing—review and editing, Á.M.G.-M.; visualization, Á.M.G.-M. supervision, N.M.P.R.; All authors have read and agreed to the published version of the manuscript.

Funding

This research received no external funding and the APC was funded by INVOLCAN.

Data Availability Statement

The data that support the findings of this study are available from INVOLCAN and the Dirección General de Industria, Gobierno de Canarias, subject to legal restrictions.

Acknowledgments

The authors gratefully acknowledge the INVOLCAN field team for their valuable assistance during the soil gas survey. We also appreciate the insightful discussions with colleagues from ITER and the University of La Laguna, which significantly contributed to the interpretation of the data. This manuscript greatly benefited from the constructive comments provided by two anonymous reviewers and the handling editor, to whom we express our sincere thanks.

Conflicts of Interest

The authors declare no conflict of interest.

References

  1. Nicholson, K. Geothermal Fluids: Chemistry and Exploration Techniques; Springer: Berlin/Heidelberg, Germany, 1993. [Google Scholar] [CrossRef]
  2. Fridriksson, T.; Padrón, E.; Óskarsson, F.; Pérez, N.M. Application of diffuse gas flux measurements and soil gas analysis to geothermal exploration and environmental monitoring: Example from the Reykjanes geothermal field, SW Iceland. Renew. Energy 2016, 86, 1295–1307. [Google Scholar] [CrossRef]
  3. Bertrami, R.; Buonasorte, G.; Ceccarelli, A.; Lombardi, S.; Pieri, S.; Scandiffio, G. Soil gases in geothermal prospecting: Two case histories (Sabatini Volcanoes and Alban Hills, Latium, Central Italy). J. Geophys. Res. Solid Earth 1990, 95, 21475–21481. [Google Scholar] [CrossRef]
  4. Voltattorni, N.; Quattrocchi, F.; Sciarra, A. The application of soil gas technique to geothermal exploration: Study of “hidden” potential geothermal systems. In Proceedings of the Proceedings World Geothermal Congress, Bali, Indonesia, 25–30 April 2010; Available online: https://www.researchgate.net/publication/228361425 (accessed on 23 March 2024).
  5. Rodríguez, F.; Pérez, N.M.; Melián, G.V.; Padrón, E.; Hernández, P.A.; Asensio-Ramos, M.; Padilla, G.D.; Barrancos, J.; D’Auria, L. Exploration of deep-seated geothermal reservoirs in the Canary Islands by means of soil CO2 degassing surveys. Renew. Energy 2021, 164, 1017–1028. [Google Scholar] [CrossRef]
  6. Pérez, N.M.; Hernández, P.A.; Padrón, E.; Melián, G.; Nolasco, D.; Barrancos, J.; Padilla, G.; Calvo, D.; Rodríguez, F.; Dionis, S.; et al. An increasing trend of diffuse CO2 emission from Teide volcano (Tenerife, Canary Islands): Geochemical evidence of magma degassing episodes. J. Geol. Soc. 2013, 170, 585–592. [Google Scholar] [CrossRef]
  7. Pérez, N.M.; Hernández, P.A.; Padrón, E.; Melián, G.; Marrero, R.; Padilla, G.; Barrancos, J.; Nolasco, D. Precursory subsurface 222Rn and 220Rn degassing signatures of the 2004 seismic crisis at Tenerife, Canary Islands. Pure Appl. Geophys. 2007, 164, 2431–2448. [Google Scholar] [CrossRef]
  8. Sinclair, A.J. Selection of threshold values in geochemical data using probability graphs. J. Geochem. Explor. 1974, 3, 129–149. [Google Scholar] [CrossRef]
  9. Rodríguez, F.; Pérez, N.M.; Padrón, E.; Melián, G.; Piña-Varas, P.; Dionis, S.; Barrancos, J.; Padilla, G.D.; Hernández, P.A.; Marrero, R.; et al. Surface geochemical and geophysical studies for geothermal exploration at the southern volcanic rift zone of Tenerife, Canary Islands, Spain. Geothermics 2015, 55, 195–206. [Google Scholar] [CrossRef]
  10. Rodríguez, F.; Pérez, N.M.; Padrón, E.; Melián, G.; Hernández, P.A.; Asensio-Ramos, M.; Dionis, S.; López, G.; Marrero, R.; Padilla, G.D.; et al. Diffuse helium and hydrogen degassing to reveal hidden geothermal resources in oceanic volcanic islands: The Canarian archipelago case study. Surv. Geophys. 2015, 36, 351–369. [Google Scholar] [CrossRef]
  11. Ciotoli, G.; Etiope, G.; Guerra, M.; Lombardi, S. The detection of concealed faults in the Ofanto Basin using the correlation between soil-gas fracture surveys. Tectonophysics 1999, 301, 321–332. [Google Scholar] [CrossRef]
  12. Hernández, P.A.; Pérez, N.M.; Salazar, J.M.; Nakai, S.; Notsu, K.; Wakita, H. Diffuse emission of carbon dioxide, methane, and helium-3 from Teide Volcano, Tenerife, Canary Islands. Geophys. Res. Lett. 2000, 27, 2389–2392. [Google Scholar] [CrossRef]
  13. Hernández, P.; Pérez, N.; Salazar, J.; Reimer, M.; Notsu, K.; Wakita, H. Radon and helium in soil gases at Cañadas caldera, Tenerife, Canary Islands, Spain. J. Volcanol. Geotherm. Res. 2004, 131, 59–76. [Google Scholar] [CrossRef]
  14. Reimann, C.; Filzmoser, P.; Garrett, R.; Dutter, R. Statistical Data Analysis Explained: Applied Environmental Statistics with R; John Wiley & Sons: Hoboken, New Jersey, USA, 2011; Available online: https://books.google.es (accessed on 20 February 2022).
  15. Di Giuseppe, M.G.; Troiano, A.; Patella, D.; Piochi, M.; Carlino, S. A geophysical k-means cluster analysis of the Solfatara-Pisciarelli volcano-geothermal system, Campi Flegrei (Naples, Italy). J. Appl. Geophys. 2018, 156, 44–54. [Google Scholar] [CrossRef]
  16. Finlayson, J.B. A soil gas survey over Rotorua geothermal field, Rotorua, New Zealand. Geothermics 1992, 21, 27–41. [Google Scholar] [CrossRef]
  17. Ghezelbash, R.; Maghsoudi, A.; Carranza, E.J.M. Optimization of geochemical anomaly detection using a novel genetic k-means clustering (GKMC) algorithm. Comput. Geosci. 2020, 134, 104335. [Google Scholar] [CrossRef]
  18. Ghezelbash, R.; Maghsoudi, A.; Shamekhi, M.; Pradhan, B.; Daviran, M. Genetic algorithm to optimize the SVM and K-means algorithms for mapping of mineral prospectivity. Neural Comput. Appl. 2023, 35, 719–733. [Google Scholar] [CrossRef]
  19. Araña, V.; Ortiz, R. The Canary Islands: Tectonics, Magmatism and Geodynamic Framework. In Magmatism in Extensional Structural Settings: The Phanerozoic African Plate; Springer: Berlin/Heidelberg, Germany, 1991; pp. 209–249. [Google Scholar] [CrossRef]
  20. Carracedo, J.C. The Canary Islands: An example of structural control on the growth of large oceanic-island volcanoes. J. Volcanol. Geotherm. Res. 1994, 60, 225–241. [Google Scholar] [CrossRef]
  21. Anguita, F.; Hernán, F. The Canary Islands origin: A unifying model. J. Volcanol. Geotherm. Res. 2000, 103, 1–26. [Google Scholar] [CrossRef]
  22. Fuster, J.M.; Hernández-Pacheco, A.; Muñoz, M.; Rodríguez Badiola, E.; García Cacho, L. Geología y Volcanología de las Islas Canarias: Gran Canaria; Instituto “Lucas Mallada” (CSIC): Zaragoza, Spain, 1968; Available online: http://hdl.handle.net/10261/3307 (accessed on 15 April 2023).
  23. Ancochea, E.; Fuster, J.M.; Ibarrola, E.; Cendrero, A.; Coello, J.; Hernán, F.; Cantagrel, J.M.; Jamond, C. Volcanic evolution of Tenerife (Canary Islands) in the light of new K-Ar data. J. Volcanol. Geotherm. Res. 1990, 44, 231–249. [Google Scholar] [CrossRef]
  24. Dóniz, J.; Romero, C.; Coello, E.; Guillén, C.; Sánchez, N.; García-Cacho, L.; García, A. Morphological and statistical characterisation of recent mafic volcanism on Tenerife (Canary Islands, Spain). J. Volcanol. Geotherm. Res. 2008, 173, 185–195. [Google Scholar] [CrossRef]
  25. Kröchert, J.; Buchner, E. Age distribution of cinder cones within the Bandas del Sur Formation, southern Tenerife, Canary Islands. Geol. Mag. 2008, 146, 161–172. [Google Scholar] [CrossRef]
  26. Martín-Lorenzo, A.; Rodríguez, F.; Alonso, M.; Amonte, C.; Melián, G.V.; Asensio-Ramos, M.; Padrón, E.; Hernández, P.A.; Pérez, N.M. A detailed soil gas physical-chemical survey for geothermal exploration at Tenerife, Canary Islands. In Proceedings of the 23rd EGU General Assembly, Online, 19–30 April 2021; p. EGU21-15066. [Google Scholar] [CrossRef]
  27. Ablay, G.J.; Martı, J. Stratigraphy, structure, and volcanic evolution of the Pico Teide–Pico Viejo formation, Tenerife, Canary Islands. J. Volcanol. Geotherm. Res. 2000, 103, 175–208, ISSN 0377-0273. [Google Scholar] [CrossRef]
  28. Chiodini, G.; Cioni, R.; Guidi, M.; Raco, B.; Marini, L. Soil CO2 flux measurements in volcanic and geothermal areas. Appl. Geochem. 1998, 13, 543–552. [Google Scholar] [CrossRef]
  29. Bloomberg, S.; Werner, C.; Rissmann, C.; Mazot, A.; Horton, T.; Gravley, D.; Kennedy, B.; Oze, C. Soil CO2 emissions as a proxy for heat and mass flow assessment, Taupō Volcanic Zone, New Zealand. Geochem. Geophys. Geosystems 2014, 15, 4885–4904. [Google Scholar] [CrossRef]
  30. Torgersen, T.; Clarke, W.B. Helium accumulation in groundwater, I: An evaluation of sources and the continental flux of crustal 4He in the Great Artesian Basin, Australia. Geochim. Cosmochim. Acta 1985, 49, 1211–1218. [Google Scholar] [CrossRef]
  31. D’Alessandro, W.; Brusca, L.; Cinti, D.; Gagliano, A.L.; Longo, M.; Pecoraino, G.; Pfanz, H.; Pizzino, L.; Raschi, A.; Voltattorni, N. Carbon dioxide and radon emissions from the soils of Pantelleria island (Southern Italy). J. Volcanol. Geotherm. Res. 2018, 362, 49–63. [Google Scholar] [CrossRef]
  32. Giammanco, S.; Sims, K.W.W.; Neri, M. Measurements of 220Rn and 222Rn and CO2 emissions in soil and fumarole gases on Mt. Etna volcano (Italy): Implications for gas transport and shallow ground fracture. Geochem. Geophys. Geosystems 2007, 8, 10. [Google Scholar] [CrossRef]
  33. Craig, H. The geochemistry of the stable carbon isotopes. Geochim. Cosmochim. Acta 1953, 3, 53–92. [Google Scholar] [CrossRef]
  34. Jain, A.K. Data clustering: 50 years beyond K-means. Pattern Recognit. Lett. 2010, 31, 651–666. [Google Scholar] [CrossRef]
  35. Lloyd, S. Least squares quantization in PCM. IEEE Trans. Inf. Theory 1982, 28, 129–137. [Google Scholar] [CrossRef]
  36. Agarwal, R.; Motwani, D.M. Survey of clustering algorithms for Manet. arXiv 2009. [CrossRef]
  37. Gibou, F.; Fedkiw, R. A fast hybrid k-means level set algorithm for segmentation. In Proceedings of the 4th Annual Hawaii International Conference on Statistics and Mathematics, Honolulu, HI, USA, 9–11 January 2005; pp. 281–291. Available online: https://physbam.stanford.edu/~fedkiw/papers/stanford2002-08.pdf (accessed on 6 June 2022).
  38. Berkhin, P.; Becher, J.D. Learning simple relations: Theory and applications. In Proceedings of the 2002 Siam International Conference on Data Mining, Arlington, VA, USA, 11–13 April 2002; Society for Industrial and Applied Mathematics: Philadelphia, PA, USA, 2002; pp. 420–436. [Google Scholar] [CrossRef]
  39. Rousseeuw, P.J. Silhouettes: A graphical aid to the interpretation and validation of cluster analysis. J. Comput. Appl. Math. 1987, 20, 53–65. [Google Scholar] [CrossRef]
  40. Krishna, K.; Murty, M.N. Genetic K-means algorithm. IEEE Trans. Syst. Man Cybern. Part B Cybern. 1999, 29, 433–439. [Google Scholar] [CrossRef] [PubMed]
  41. Pedregosa, F.; Varoquaux, G.; Gramfort, A.; Michel, V.; Thirion, B.; Grisel, O.; Blondel, M.; Prettenhofer, P.; Weiss, R.; Dubourg, V.; et al. Scikit-learn: Machine learning in Python. J. Mach. Learn. Res. 2011, 12, 2825–2830. [Google Scholar] [CrossRef]
  42. Gad, A.F. Pygad: An intuitive genetic algorithm python library. Multimed. Tools Appl. 2024, 83, 58029–58042. [Google Scholar] [CrossRef]
  43. Benà, E.; Ciotoli, G.; Ruggiero, L.; Coletti, C.; Bossew, P.; Massironi, M.; Mazzoli, C.; Mair, V.; Morelli, C.; Galgaro, A.; et al. Evaluation of tectonically enhanced radon in fault zones by quantification of the radon activity index. Sci. Rep. 2022, 12, 21586. [Google Scholar] [CrossRef]
  44. Martín-Lorenzo, A.; Pérez, N.M.; Melián, G.V.; Asensio-Ramos, M.; Padrón, E.; Hernández, P.A.; Rodríguez, F.; D’Auria, L. Soil gas physico-chemical survey for geothermal exploration at Madre del Agua mining grid in the Tenerife SRZ volcano, Canary Islands. Geothermics 2024, 122, 103096. [Google Scholar] [CrossRef]
  45. Frondini, F.; Chiodini, G.; Caliro, S.; Cardellini, C.; Granieri, D.; Ventura, G. Diffuse CO2 degassing at Vesuvio, Italy. Bull. Volcanol. 2004, 66, 642–651. [Google Scholar] [CrossRef]
  46. Piña-Varas, P.; Ledo, J.; Queralt, P.; Marcuello, A.; Bellmunt, F.; Hidalgo, R.; Messeiller, M. 3-D Magnetotelluric Exploration of Tenerife Geothermal System (Canary Islands, Spain). Surv. Geophys. 2014, 35, 1045–1064. [Google Scholar] [CrossRef]
  47. Chiodini, G.; Granieri, D.; Avino, R.; Caliro, S.; Costa, A.; Werner, C. Carbon dioxide diffuse degassing and estimation of heat release from volcanic and hydrothermal systems. J. Geophys. Res. Solid Earth 2005, 110, B08204. [Google Scholar] [CrossRef]
  48. Etiope, G.; Klusman, R.W. Geologic emissions of methane to the atmosphere. Chemosphere 2002, 49, 777–789. [Google Scholar] [CrossRef]
  49. Etiope, G.; Schoell, M. Abiotic gas: Atypical, but not rare. Elements 2014, 10, 291–296. [Google Scholar] [CrossRef]
  50. Rodríguez Fernández, L.R.; López Olmedo, F.; Oliveira, J.T.; Matas, J.; Martín-Serrano, A.; Martín Parra, L.M.; Terrinha, P. Mapa Geológico de ESPAÑA y Portugal 1/1.000. 000; Geological and Mining Institute of Spain (IGME): Madrid, Spain; National Laboratory of Energy and Geology (LNGE, Portugal): Lisbon, Portugal, 2014. [Google Scholar]
Figure 1. Geographic location of the Canary Islands and simplified geological maps (modified from Geological and Mining Institute of Spain (IGME), 2011) of Tenerife, with the location of the four mining licenses (Garehagua, Berolo, Guayafanta, and Abeque) studied for geothermal exploration purposes [5].
Geosciences 15 00204 g001
Figure 2. Geographic location and simplified geologic map of Tenerife Island (modified from Ablay and Martí [27]. A solid black line inside Tenerife bounds the study area (Garehagua mining license). A zoom-in of the study area shows a volcano-structural map of the southern volcanic rift of Tenerife Island. Dashed white lines indicate alignments of eruptive centers, highlighted with a black line pattern [9].
Geosciences 15 00204 g002
Figure 3. Location of sampling points selected for geochemical analysis (solid black circles) and MT stations reported by Piña-Varas et al. (2014) is shown as white squares [9].
Geosciences 15 00204 g003
Figure 4. Cumulative probability plots of soil diffuse CO2 efflux, soil CO2 concentration, soil 222Rn, and He concentration values, measured with a total of 1050 sampling sites at Garehagua. Solid black lines in the probability plots indicate different log-normal geochemical populations in the original data. Solid gray lines indicate the separated background and peak log-normal populations. Dashed lines indicate background; peak and intermediate log-normal populations are separated from the original data [5].
Geosciences 15 00204 g004
Figure 5. Concentration maps of CO2, CH4, He, and H2 in the Garehagua study area, based on univariate analysis using the Sinclair (1974) [8] method. Each data point is color-coded according to statistical thresholds derived from cumulative log-scale frequency plots, reflecting four distinct geochemical populations: background (green), intermediate (yellow, between μ + σ and μ + 2σ), anomalous (orange, between μ + 2σ and μ + 3σ), and peak anomalies (red, >μ + 3σ). This classification enhances the visualization of spatial distribution patterns and helps identify potential zones of deep gas emission or structural control.
Geosciences 15 00204 g005
Figure 6. Spatial distribution maps of selected geochemical ratios in soil gases from the Garehagua study area: δ13C/12C, He/Ar, CH4/CO2, and H2/Ar. These ratios provide additional insight into gas origin, mixing processes, and redox conditions. The δ13C/12C map uses fixed isotopic thresholds to distinguish biogenic (≤−18‰), atmospheric (~−8‰), and endogenous (>–7‰) sources. The He/Ar, CH4/CO2, and H2/Ar ratios are classified into three to five quantile intervals, reflecting increasing contributions of deep or reduced gases. These ratio maps are particularly useful for detecting subtle geochemical anomalies not evident in absolute concentrations.
Geosciences 15 00204 g006
Figure 7. Correlation diagrams of δ13C–CO2 (‰ vs. V-PDB) against 1/CO2 (ppm−1) for Garehagua and Garehagua II illustrate the contribution of volcano-hydrothermal, biogenic, and atmospheric CO2. The graph displays the mixing trends between biogenic and atmospheric end-members with the solid black lines and with deep-seated gases using arrows. Typical air values are closer to the red square.
Geosciences 15 00204 g007
Figure 8. Blue line represents the evolution of the Silhouette Score as a function of the number of clusters (k). The optimal solution (k = 3) is highlighted with a dashed red line, balancing statistical performance with geological interpretability. This tripartite classification enables a more nuanced interpretation of the geochemical landscape and supports the identification of potential geothermal targets.
Geosciences 15 00204 g008
Figure 9. Example of the top 10 parameter combinations evaluated using the GKMC algorithm, ranked by Silhouette Score. Each horizontal bar represents the clustering quality for a specific variable set, with higher scores indicating better-defined and more well-separated clusters. A reference threshold of 0.70 is marked with a red dashed line to highlight high-performing configurations. These results help identify optimal parameter combinations for geochemical classification in volcanic soil gas datasets.
Geosciences 15 00204 g009
Figure 10. Evolution of the GKMC fitness function over 200 generations. The fitness value represents the sum of squared Euclidean distances from each data point to its corresponding cluster centroid, calculated in the reduced two-dimensional PCA space (PC1 and PC2). These dimensionless values incorporate both intra-cluster compactness and a penalty term for suboptimal solutions. The progressive decrease in fitness illustrates the convergence of the genetic algorithm toward more optimal cluster configurations.
Geosciences 15 00204 g010
Figure 11. Workflow diagram for the multivariate clustering and interpretation of soil gas data. The process begins with field data collection and database generation, followed by data correction and initial geochemical interpretation using classical tools (e.g., tables, Sinclair plots, and binary representations). A subset of gas species is iteratively selected and processed with the GKMC algorithm. The combination yielding the highest Silhouette Score is retained. Finally, the results are interpreted through spatial analysis and cross-comparison with magnetotelluric (MT) and structural geology maps, aiming to identify concealed geothermal anomalies.
Geosciences 15 00204 g011
Figure 12. Comparison of clustering stability across datasets. Boxplots summarize the results of 10 independent GKMC executions for each dataset (a) Silhouette scores indicate the internal cohesion and separation of clusters, and (b) fitness values represent the sum of squared Euclidean distances within clusters in PCA-reduced space. The Garehagua II subset yielded the highest Silhouette scores with consistent clustering, whereas Garehagua + II exhibited higher variability due to greater heterogeneity and cross-campaign effects. These results confirm the robustness of GKMC clustering across different spatial and temporal subsets.
Geosciences 15 00204 g012
Figure 13. Scatter matrix showing pairwise correlations between 222Rn (pCi/l), CO2 (ppm), and He (ppm), based on log-transformed and Z-score normalized values. Data points are color-coded by cluster assignment (GKMC algorithm) from soil gas samples collected in the Garehagua license area. Kernel density plots along the diagonal illustrate the distribution of each parameter within clusters. Clusters 1 and 2 highlight anomalous geochemical behaviors potentially associated with deep-seated gas emissions.
Geosciences 15 00204 g013
Figure 14. Histogram plots showing the normalized distributions (log10 + z-score) of helium (He), carbon dioxide (CO2), and radon (222Rn) concentrations in soil gas samples from the Garehagua study area. Colors represent the clusters identified by the GKMC algorithm. Cluster 1 (orange) displays high-frequency values centered around background levels, whereas Clusters 0 (blue) and 2 (green) include more dispersed and anomalous values, particularly for He and CO2, suggesting potential deep-seated gas emissions through structurally controlled pathways.
Geosciences 15 00204 g014
Figure 15. Principal Component Analysis (PCA) projection of the optimized clustering results using the GKMC algorithm. The model was trained with a selected variable set, including CO2, He, 222Rn, and δ13C/12C isotopic ratio. Data points represent individual soil gas sampling locations from the Garehagua license area, color-coded by cluster membership. Centroids of each cluster are marked with “X” symbols. Cluster 0 (red) groups samples with high CO2 flux, He enrichment, elevated δ13C values, and 222Rn anomalies, consistent with magmatic-hydrothermal degassing. Cluster 1 (orange) includes samples with intermediate values, suggesting transitional zones or peripheral halos. Cluster 2 (dark gray) encompasses most samples with near-background levels, typical of biogenic and atmospheric influence.
Geosciences 15 00204 g015
Figure 16. Spatial distribution of the 1050 sampling sites in the Garehagua and Garehagua II areas, classified by cluster membership based on CO2, He, 222Rn, and δ13C–CO2. Red points (Cluster 0) indicate anomalous geochemical signatures; orange (Cluster 1), transitional or mixed zones; and dark gray (Cluster 2), background values associated with biogenic and atmospheric contributions.
Geosciences 15 00204 g016
Figure 17. Resistivity cross-sections at multiple depths overlaid with GKMC cluster points. Panels show horizontal slices of 3D magnetotelluric (MT) resistivity models at four elevation levels: (a) 920 m a.s.l.; (b) 400 m a.s.l.; (c) –244 m a.s.l.; and (d) –980 m a.s.l., adapted from Rodríguez et al. (2015) [9] based on MT data by Piña-Varas et al. (2014) [46]. Geochemical sampling points are colored by cluster membership: Cluster 0 (gray), Cluster 1 (orange), and Cluster 2 (red). Clusters 0 and 1 tend to align spatially with low-resistivity zones (≤2 Ω·m), which are interpreted as clay-rich hydrothermal alteration zones or deep degassing pathways. This correspondence provides geophysical support for the structural and hydrothermal significance of the identified geochemical clusters.
Geosciences 15 00204 g017
Figure 18. Spatial distribution of GKMC clusters over structural geology. Map showing the location of soil gas sampling points colored by cluster membership as derived from GKMC. Cluster 0 (background, gray), Cluster 1 (intermediate, orange), and Cluster 2 (anomalous, red) are overlaid on structural lineaments (black dashed lines) and the topographic basemap. Notable cluster alignments follow inferred tectonic trends (NE–SW and NW–SE), with high-anomaly clusters showing spatial correlation with mapped fault systems and volcanic alignments. The proximity of several red cluster points to the Fuente del Valle hydrothermal gallery suggests a structural control on magmatic gas ascent in the area.
Geosciences 15 00204 g018
Figure 19. Spatial distribution of sampling sites classified by cluster membership (based on CO2, He, 222Rn, and δ13C) overlaid on the structural framework of southern Tenerife [50]. Anomalous sites (Cluster 0, red) show a marked alignment with the intersection of NW–SE and NE–SW trending fault systems, historically recognized as zones of tectonic stress concentration and enhanced vertical permeability [19,20]. This correlation supports the interpretation that magmatic gases preferentially ascend through structural discontinuities within the volcanic edifice.
Geosciences 15 00204 g019
Table 1. Statistical summary of the analytical results of the soil gas concentration and fluxes measured at Garehagua mining license [9].
IDParameterMax.Min.AverageMedianSD
1CO2 flow (g m−2 d−1)37.7<0.502.21.443.0
2Ne (neon) ppm18.017.817.9417.950.05
3H2 (hydrogen) ppm24.4<0.501.541.362.12
4O2 (oxygen) ppm213,804.7204,238.3210,794.7210,859.81141.5
5N2 (nitrogen) ppm799,468.6774,063.6788,774.7788,230.73742.6
6CO2 (carbon dioxide) ppm16,151.5355.0909.3648.31060.9
7CH4 (methane) ppm6.371.701.801.760.25
8He (helium) ppm40.05.246.855.285.39
936Ar (argon-36) ppm35.7426.7431.5231.31.6
1038Ar (argon-38) ppm7.905.326.255.90.2
1140Ar (argon-40) ppm10,740.227866.759254.379351.5559.7
12Ar tot ppm10,783.867898.819292.149388.8561.5
1313C/12C (carbon isotope ratio)−10.9−25.0−19.3−19.51.8
14222Rn (radon) pCi/l290.0< 0.5043.933.740.3
15Tn (thoron 220Rn) pCi/l2075.83< 0.5046.323.3186.84
SD—standard deviation.
Disclaimer/Publisher’s Note: The statements, opinions and data contained in all publications are solely those of the individual author(s) and contributor(s) and not of MDPI and/or the editor(s). MDPI and/or the editor(s) disclaim responsibility for any injury to people or property resulting from any ideas, methods, instructions or products referred to in the content.

