Article

Glacier Recession and Climate Change in Chitral, Eastern Hindu Kush Mountains of Pakistan, Between 1992 and 2022

by
Zahir Ahmad
1,*,
Farhana Altaf
1,
Ulrich Kamp
2,*,
Fazlur Rahman
3 and
Sher Muhammad Malik
1
1
Department of Geography and Geoinformatics, The Islamia University of Bahawalpur, Bahawalpur 63100, Pakistan
2
Earth and Environmental Sciences Discipline, Department of Natural Sciences, University of Michigan-Dearborn, Dearborn, MI 48128, USA
3
Department of Geography and Geomatics, University of Peshawar, Peshawar 25120, Pakistan
*
Authors to whom correspondence should be addressed.
Geosciences 2025, 15(5), 167; https://doi.org/10.3390/geosciences15050167
Submission received: 16 February 2025 / Revised: 12 April 2025 / Accepted: 5 May 2025 / Published: 7 May 2025
(This article belongs to the Section Cryosphere)

Abstract

:
Mountain regions are particularly sensitive and vulnerable to the impacts of climate change. Over the past three decades, mountain temperatures have risen significantly faster than those in lowland areas. The Hindu Kush–Karakoram–Himalaya region, often referred to as the “water tower of Asia”, is the largest freshwater source outside the polar regions. However, it is currently undergoing cryospheric degradation as a result of climatic change. In this study, the Normalized Difference Glacier Index (NDGI) was calculated using Landsat and Sentinel satellite images. The results revealed that glaciers in Chitral, located in the Eastern Hindu Kush Mountains of Pakistan, lost 816 km2 (31%) of their total area between 1992 and 2022. On average, 27 km2 of glacier area was lost annually, with recession accelerating between 1997 and 2002 and again after 2007. Satellite analyses also indicated a significant increase in both maximum (+7.3 °C) and minimum (+3.6 °C) land surface temperatures between 1992 and 2022. Climate data analyses using the Mann–Kendall test, Theil–Sen Slope method, and the Autoregressive Integrated Moving Average (ARIMA) model showed a clear increase in air temperatures from 1967 to 2022, particularly during the summer months (June, July, and August). This warming trend is expected to continue until at least 2042. Over the same period, annual precipitation decreased, primarily due to reduced snowfall in winter. However, rainfall may have slightly increased during the summer months, further accelerating glacial melting. Additionally, the snowmelt season began consistently earlier. While initial glacier melting may temporarily boost water resources, it also poses risks to communities and economies, particularly through more frequent and larger floods. Over time, the remaining smaller glaciers will contribute only a fraction of the former runoff, leading to potential water stress. As such, monitoring glaciers, climate change, and runoff patterns is critical for sustainable water management and strengthening resilience in the region.

1. Introduction

Mountain glaciers provide essential freshwater for drinking, agriculture, and hydropower generation [1,2,3,4]. They also play a crucial role in regulating regional temperatures and climate while supporting diverse ecosystems vital to environmental health [5,6]. However, mountain regions, particularly their cryosphere, are highly sensitive and vulnerable to the impacts of climate [7,8]. Over the past three decades, mountain temperatures have increased significantly compared to those in lowland areas [9], a phenomenon known as “elevation-dependent warming” (EDW) [10,11]. Globally, the frequency of cold and warm days and nights has shifted in recent decades. Cold days have decreased by one day, and cold nights by 0.5 nights per decade, while warm days have increased by 1.2 days, and warm nights by 1.7 nights per decade [8]. As a result, glaciers are retreating at an accelerated rate in many mountainous regions [12], serving as a clear indicator of climate change [13]. The ablation and recession of mountain glaciers are largely driven by changes in temperature and precipitation [13], where even minor fluctuations can lead to unpredictable consequences. The observed rapid recession of glaciers in many regions has already caused significant impacts, including increased livelihood insecurity, hydrological crises, and more frequent and intense natural disasters such as glacial lake outburst floods (GLOFs), flash floods, soil erosion, and landslides [7].
The Hindu Kush–Karakoram–Himalaya (HKH) region is the largest freshwater resource outside the polar regions, often referred to as the “water tower” of Asia [14]. Most of South Asia’s rivers originate in this region, supporting the livelihoods of over two billion people [15]. However, the HKH is warming at twice the global average, posing a significant threat to the livelihoods of approximately 240 million people within the mountains and 1.65 billion people in the adjacent lowlands [16]. Over the last three decades, the HKH has experienced a sharp temperature increase of 1.5 °C, double the increase observed in other parts of Pakistan [17]. Projections indicate that the trend of elevation-dependent warming (EDW) will continue and intensify, with the region expected to exceed the global average temperature rise by at least 0.3 °C [18]. In the 1980s, the glaciers of the HKH began to show a marked increase in melting and recession, a trend that continues today [3,18,19], although the response of glaciers varies depending on local terrain and climate. Within the HKH, many of the Karakoram glaciers are actually advancing, a phenomenon known as the “Karakoram anomaly” [20], which has been supported by numerous subsequent studies [21,22,23,24,25,26].
The rapid depletion of glaciers across the HKH is a growing concern [27,28,29,30], threatening downstream communities. The consequences are already evident, with devastating natural disasters such as avalanches, landslides, and glacial lake outburst floods (GLOFs) becoming more frequent. GLOFs in particular are one of the most dangerous hazards in the HKH, with a high death toll [31]. Additionally, higher temperatures, accelerated glacier melting, shifting seasons, and erratic rainfall are altering the region’s hydrology, further impacting agriculture, food security, and livelihoods [32]. Given these challenges, understanding natural changes and their impacts in mountain environments is critical for managing and mitigating natural hazards and risks. However, there is a dearth of scientific studies on the impacts of climate change on glacier recession in the Eastern Hindu Kush. This study aims to examine climate change and glacier response in Chitral, located in the Eastern Hindu Kush of Pakistan, over the past thirty years.

2. Study Area

Chitral (35–37° N, 71–74° E) is the northernmost valley of the Khyber Pakhtunkhwa province in the northwestern part of Pakistan (Figure 1). It is referred to as “the heart of the Hindu Kush” and “the land of fairies and flowers” [33]. The Hindu Kush Range has several peaks over 7000 m, with Tirich Mir (7708 m asl.) being the highest. It is also the tallest peak in the world outside the Himalayas and Karakoram. Chitral has over 500 glaciers, of which Chiantar (36 km), Tirich Mir (32 km), Booni, and Raman are the most famous ones. The Raman Glacier is situated in the Laspur Valley at an elevation of 5500 m asl. Chitral is administratively divided into Lower Chitral and Upper Chitral districts, covering an area of 14,850 km2. In 2023, the valley was home to almost 516,000 people; its population density is thirty-five persons per square kilometer [34].
The climate of Chitral is classified as subtropical continental highland, characterized by long, cold winters and short, warm summers. The semi-arid mountain climate is marked by significant seasonal extremes in both temperature and precipitation [35]. The region has a mean annual temperature of 16 °C and an average annual precipitation of 460 mm, which is unevenly distributed throughout the year [27]. The highest precipitation occurs in the form of snow, driven by western disturbances during the winter months from December to April, accounting for 75% of the total annual precipitation. May sees the highest relative humidity, at 60%, while July experiences the lowest, at 42%. March typically has the highest number of rainy days (12.7), whereas July receives the least rainfall, with only 9.5 mm [36]. Chitral enjoys 3,281 h of sunshine annually, with an average monthly sunshine duration of 273 h [36]. June has the longest daily sunshine, averaging 11.6 h, for a total of 360 h of sunlight in the month. In contrast, January has the shortest daily sunshine, with an average of 7.2 h, totaling 217 h of sunlight for the month. As a result, Chitral’s glaciers are exposed to the maximum solar radiation during the summer months, particularly in June and July.

3. Methods

3.1. Glacier Mapping

To analyze glacial area changes in Chitral, we used satellite imagery and DEM data from 1992 to 2022 (Table 1). The satellite images were downloaded from the U.S. Geological Survey (https://earthexplorer.usgs.gov, accessed on 10 April 2024). Only images with less than 10% cloud cover and minimal snow cover from August and September were selected to optimize glacier delineation. Additionally, glacier polygons from the Global Land Ice Measurements from Space (GLIMS) database were incorporated. The Shuttle Radar Topography Mission (SRTM) DEM of 30 m resolution was used to derive watershed boundaries and extract glacier attribute data. For a more detailed study of glacier dynamics and retreat, we focused on Raman Glacier as a case example. Observations on snow and ice harvesting were made during field surveys from 2020 to 2023.
The Normalized Difference Glacier Index (NDGI) was used for the spatiotemporal analysis of clean-ice glacier areas [37]. NDGI is a spectral index specifically designed to identify and delineate glacier areas based on their unique spectral properties. It is calculated as: NDGI = (Near Infrared − Green)/(Near Infrared + Green). The green band highlights glacier ice due to its high reflectance, while the shortwave infrared band helps distinguish ice from the surrounding terrain. Pixels with an NDGI value greater than the threshold of 0.4 were classified as glacier ice. Since only clean ice was mapped, the results present the minimum total glacier area. However, debris-covered glaciers are relatively rare in Chitral.
Accuracy assessments for the NDGI-based image classification of clean glacier and non-glacier surface areas were carried out using Google Earth. A total of 300 reference points distributed across all the classified images were verified using Google Earth. User and producer accuracy, commission and omission errors, and the Kappa coefficient were calculated. The key accuracy metrics showed values greater than 75% for all images (Table 2). The results were also validated using NDSI classification and cross-checked with GLIMS data (https://www.glims.org/maps/glims, accessed on 10 April 2024). However, after inspection, several mapping errors were found in the GLIMS data.

3.2. Climate Data Analysis

Time-series data on temperature and precipitation from 1967 to 2022, collected at meteorological stations in Chitral and Drosh, were analyzed to assess the impact of climatic change on glaciers. The data are archived at the Regional Meteorological Department Peshawar, Pakistan.

3.2.1. Long-Term Temperature and Precipitation Trends

The non-parametric Mann–Kendall test (MKT) was used to assess long-term trends in temperature and precipitation [38,39,40]. The MKT is particularly suitable for climate-related studies because it does not require the data to follow a specific distribution. The test evaluates the presence of a trend in time series data by analyzing the rank correlation between data points. Its robustness and versatility make it a widely used method for detecting monotonic trends in environmental data such as temperature, precipitation, and streamflow. For an observed time series x = x₁, x₂, …, xₙ, the test statistic S is expressed as (Equation (1)) [41]:
S = i = 1 n 1 j = i + 1 n 1 S i g n ( x j x i )
where the value of Sign ( x j x i ) can be computed as (Equation (2)) [41,42]:
S i g n ( x j x i ) =       1       0 1     x j x i > 0     x j x i = 0     x j x i < 0      
where i and j are the ranks of observation of the xi, xj of time series. The variance of S can be expressed as (Equation (3)) [41]:
V a r   S = n n 1 2 n + 5 i = 1 n t i t i 1 2 t i + 5 18

3.2.2. Magnitude and Direction of Temperature and Precipitation Trends

The Theil–Sen Slope (TSS) method, which is part of the Mann–Kendall test, quantifies the rate of change in temperature and precipitation trends [43,44,45]. Known for its robustness, the TSS calculates the median slope between all pairs of data points, providing a reliable estimate of the trend’s magnitude and direction. Unlike linear regression, TSS is resistant to outliers and effectively handles non-normally distributed data, making it highly suitable for climate dataset analysis. By calculating the slope of the time series, the method reveals how rapidly temperatures or precipitation are increasing or decreasing. The median slope is particularly useful for understanding long-term trends in complex environmental data. The formula for the slope is (Equation (4)) [46]:
F(t) = Qt + B
where Q represents the slope’s magnitude and B denotes a constant. However, the magnitude of the slope is calculated to assess the slope for the temporal temperature and precipitation data as (Equation (5)) [46]:
Q i = X i   X j j k
where Xi and Xj represent pairs of temperature data with i = 1, 2, 3, 4, 5, 6, 7, …, N, and among time, denoted by j and k (j > k). The median of the N values of Q are calculated as (Equation (6)) [46]:
Q m e d = Q   [ N + 1 ] 2 ,                           I f   N   i s   o d d   Q N 2 + Q [ N + 2 2 ] 2 ,       ( I f   N   i s   e v e n )
where Qmed represents the median of the calculated slopes (Qi). It assists in computing the central tendency for a set of slopes derived from the pairwise differences in the temperature or precipitation data over time. Qmed is then used to characterize the overall trend or direction of change in the temperature or precipitation data: a positive Qi indicates an increase in temperature or precipitation, whereas a negative Qi indicates a decrease.

3.2.3. Monthly Temperature and Precipitation Trends

The Autoregressive Integrated Moving Average (ARIMA) model [47] is widely used for the analysis and forecasting of time series climate data, including monthly temperature and precipitation [48,49,50,51,52]. The magnitude of temporal correlation in the time series determines the “autoregressive” (AR, p) and “moving average” (MA, q) terms, while the “integrated” (I, d) term helps transform a non-stationary time series into a stationary one, as shown in (Equation (7)) [47]:
ý t = c + ϕ 1 ý t 1 + ϕ p ý t p + θ 1   ε t 1 + θ q ε t q + ε t
where c denotes a constant term in a time series, also known as the drift term, when (d = 1), ϕ 1 ý t 1 +   ϕ p ý t p represents the AR term with ϕ 1 to ϕ p   as a coefficient of p order; θ 1   ε t 1 + θ q ε t q represents the MA term with θ 1 to θ q as a coefficient of q order; ε t is an error term for random background noise at time t; and ý t is the differencing series. A first-order differencing is calculated as (Equation (8)) [47]:
ý t = ý t ý t 1
where ý t , is the observation taken at time t. After determining the orders and estimating the coefficients for the temperature and precipitation time series data by fitting the model, point forecasts and interval forecasts were generated using Equation (7).

3.3. Land Surface Temperature

Land Surface Temperature (LST) data were extracted from Landsat-5 TM imagery from 1992 and Landsat 8 OLI imagery from 2022.

4. Results

4.1. Changes in Glacier Area

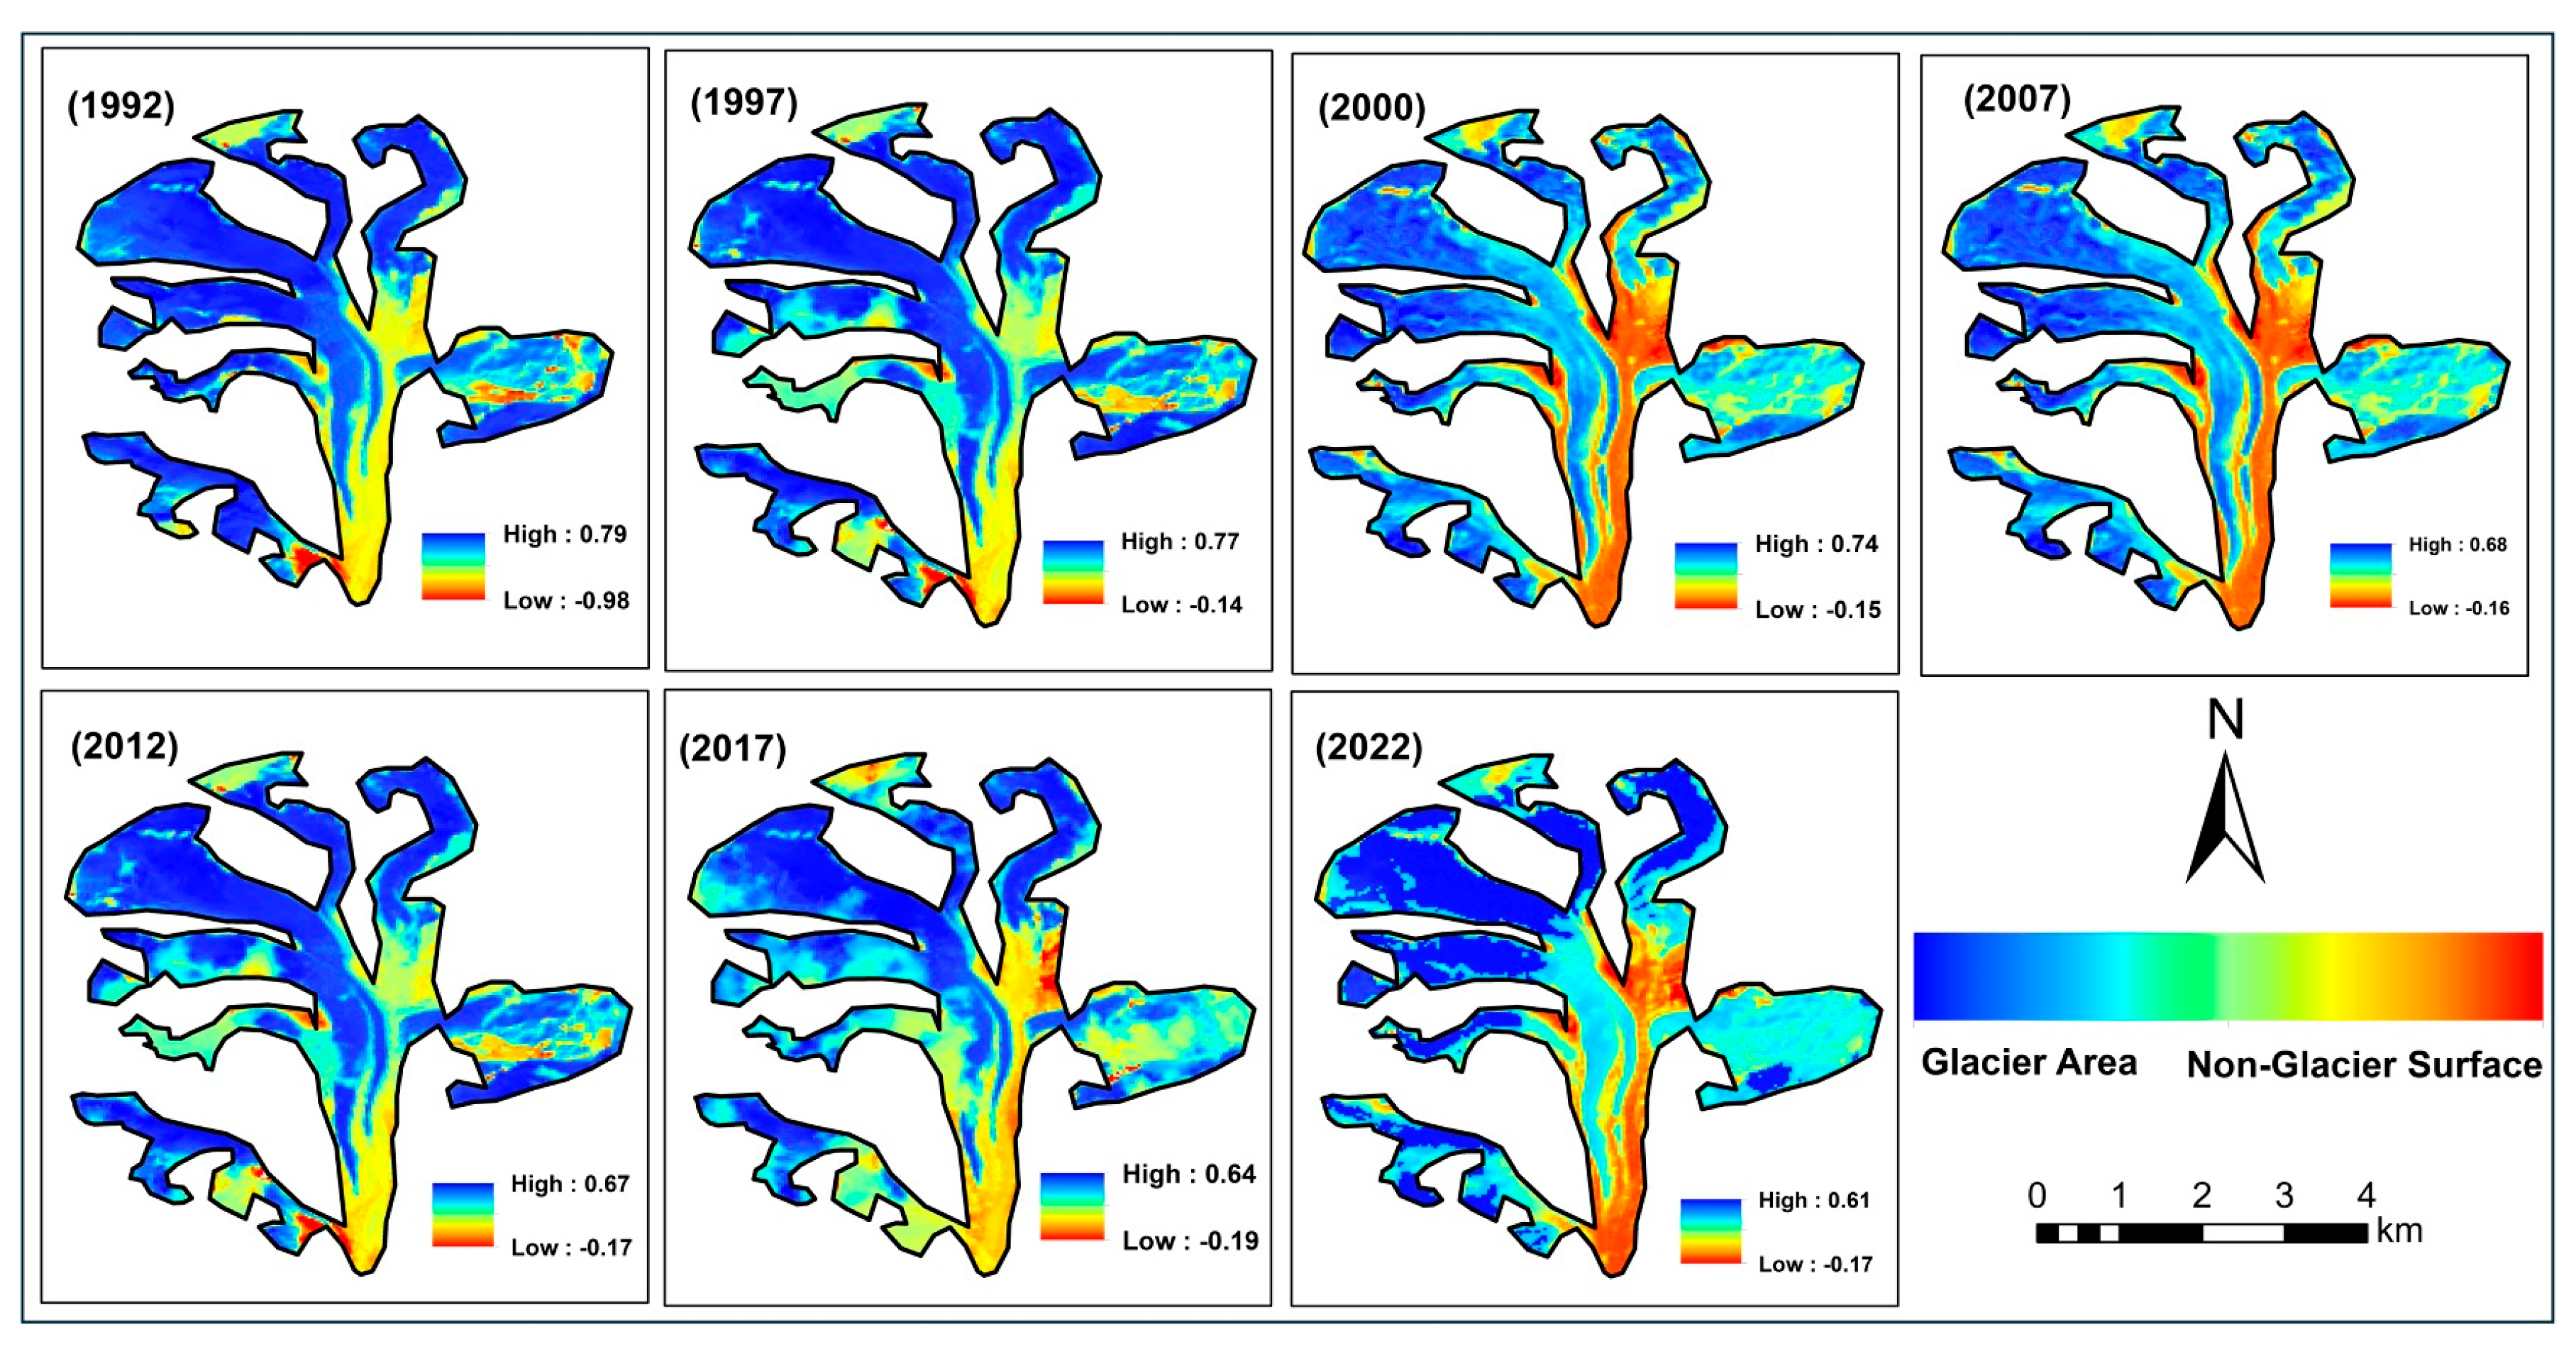
In 2022, glaciers covered 12.4% of Chitral’s area (Figure 2). Over the last three decades, the total clean-ice glacier area in Chitral decreased by 816 km2 (30.8%), from 2650 km2 in 1992 to 1834 km2 in 2022, at an average rate of 27.2 km2 annually (Table 3). Glacial recession accelerated from 1997 to 2002, slowed over the following five years, and then accelerated significantly again after 2007. While the five-year loss in the glacier area remained below 100 km2 before 2007, it rose to approximately 200 km2 in the periods that followed. As an example, the Raman Glacier shrank by 3.25 km2 (33.6%), from 9.66 km2 in 1992 to 6.41 km2 in 2022 (Table 4, Figure 3). Similar to the overall trend in Chitral, substantial glacier recession occurred particularly from 1997 to 2002 and after 2007.

4.2. Changes in Temperature

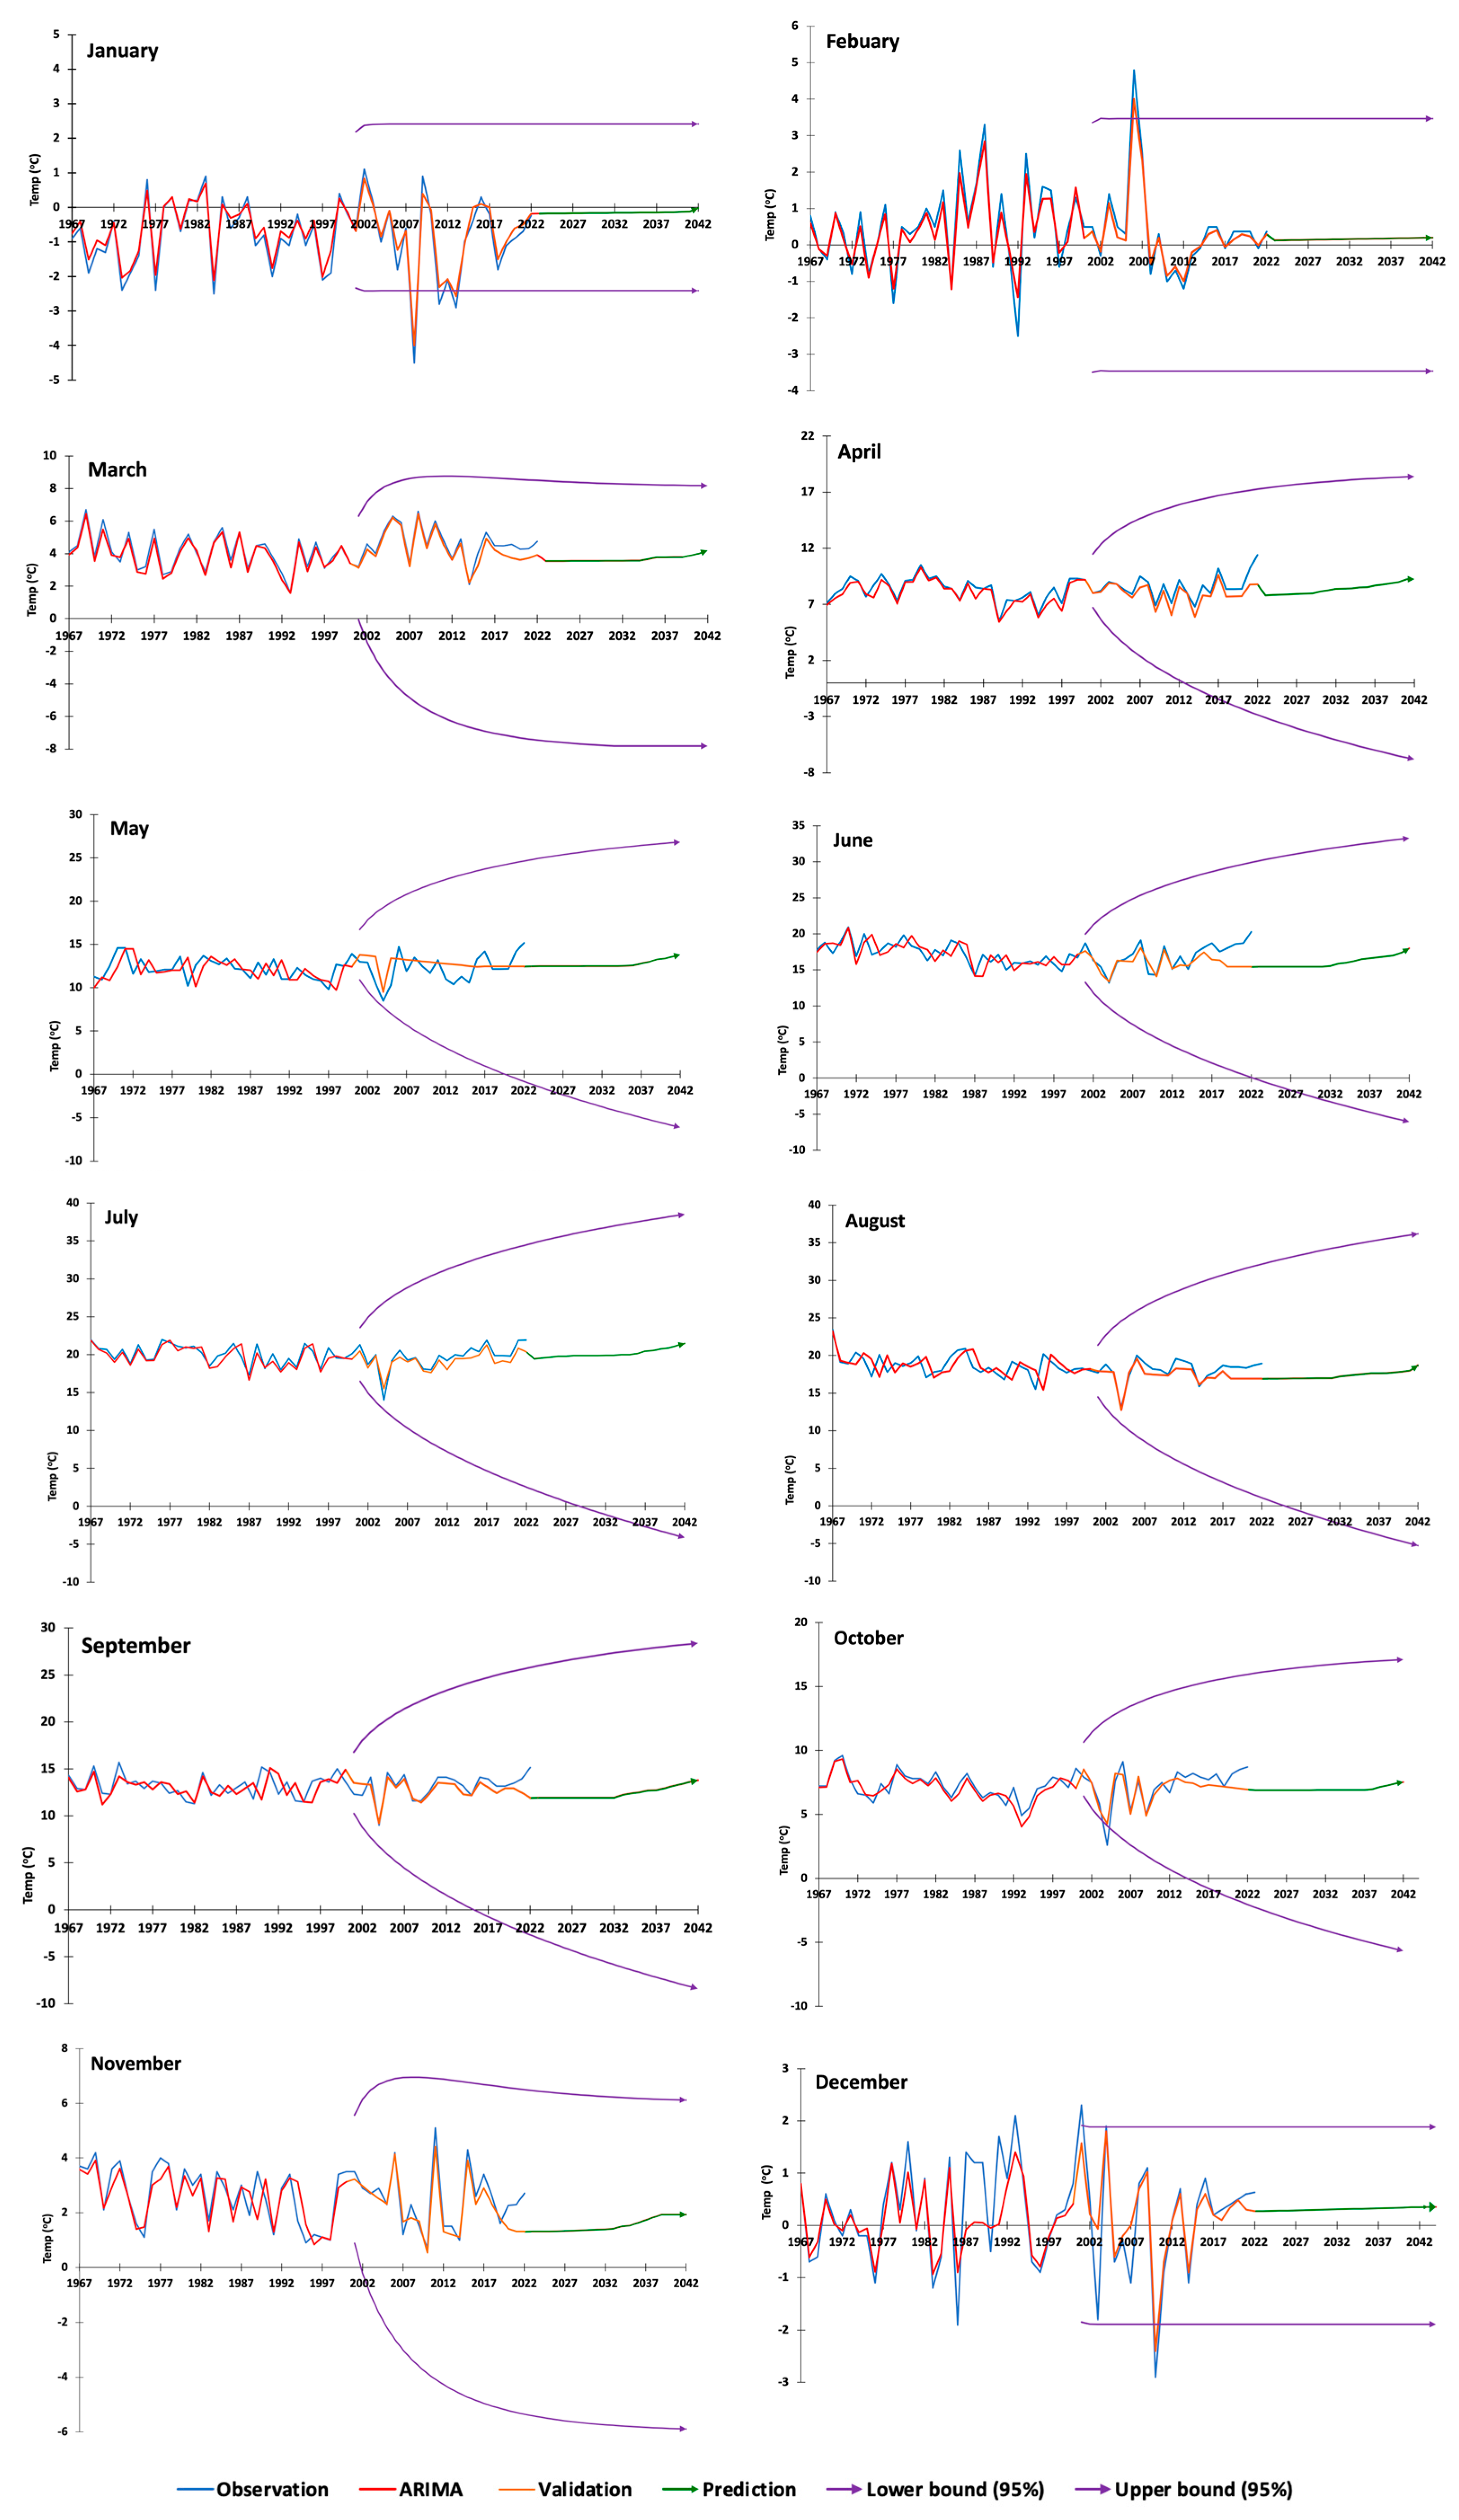
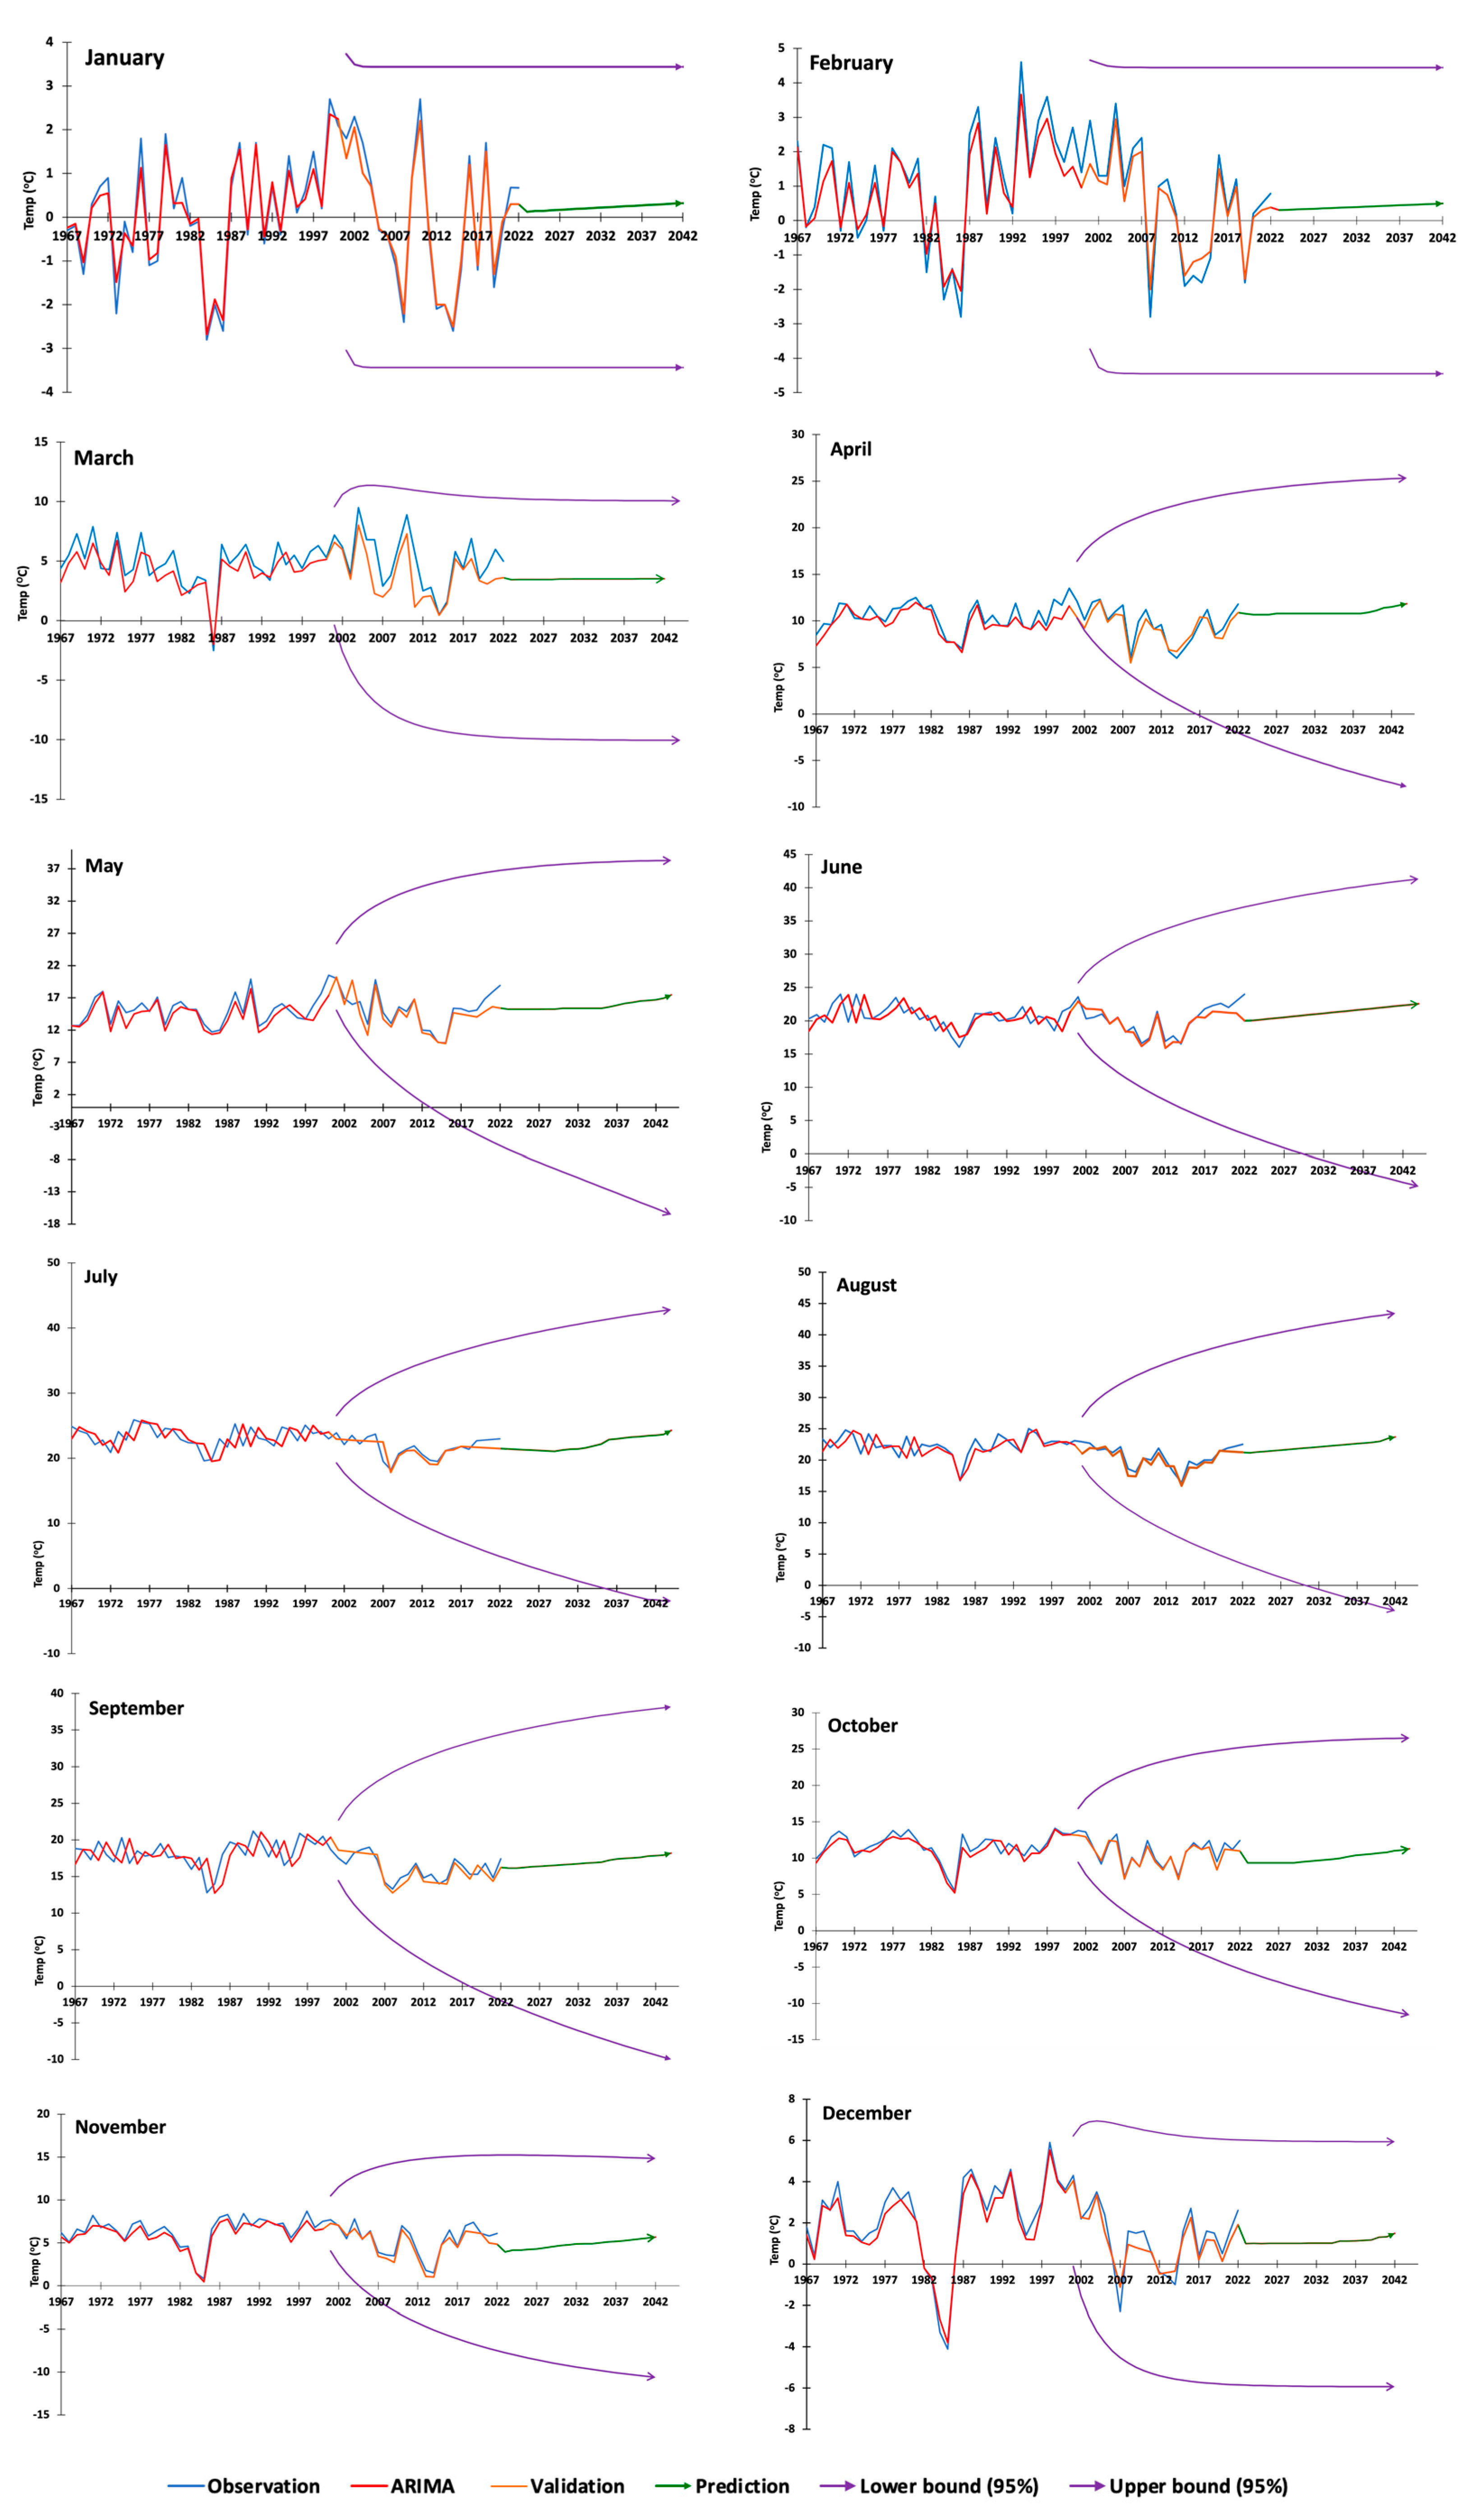
For both Chitral city and Drosh, MKT and TSS indicate a weak increasing trend in MMTmax between 1967 to 2022, particularly during June, July, August, September, December, and January (Table 5, Figure 4 and Figure 5). Additionally, TSS showed a strong increasing trend in MMTmax for Chitral in August, while a weak decreasing trend was observed for Drosh in September. Both MKT and TSS suggested a strong increase in MMTmin for Chitral city in June and a very strong increase for Drosh (Table 6, Figure 6 and Figure 7). For both cities, significant increases in MMTmin were found in July and August. The ARIMA model indicated a warming trend for both Chitral city and Drosh, particularly from May to September, with projections suggested that this trend will continue from 2022 to 2042 (Figure 4, Figure 5, Figure 6 and Figure 7).
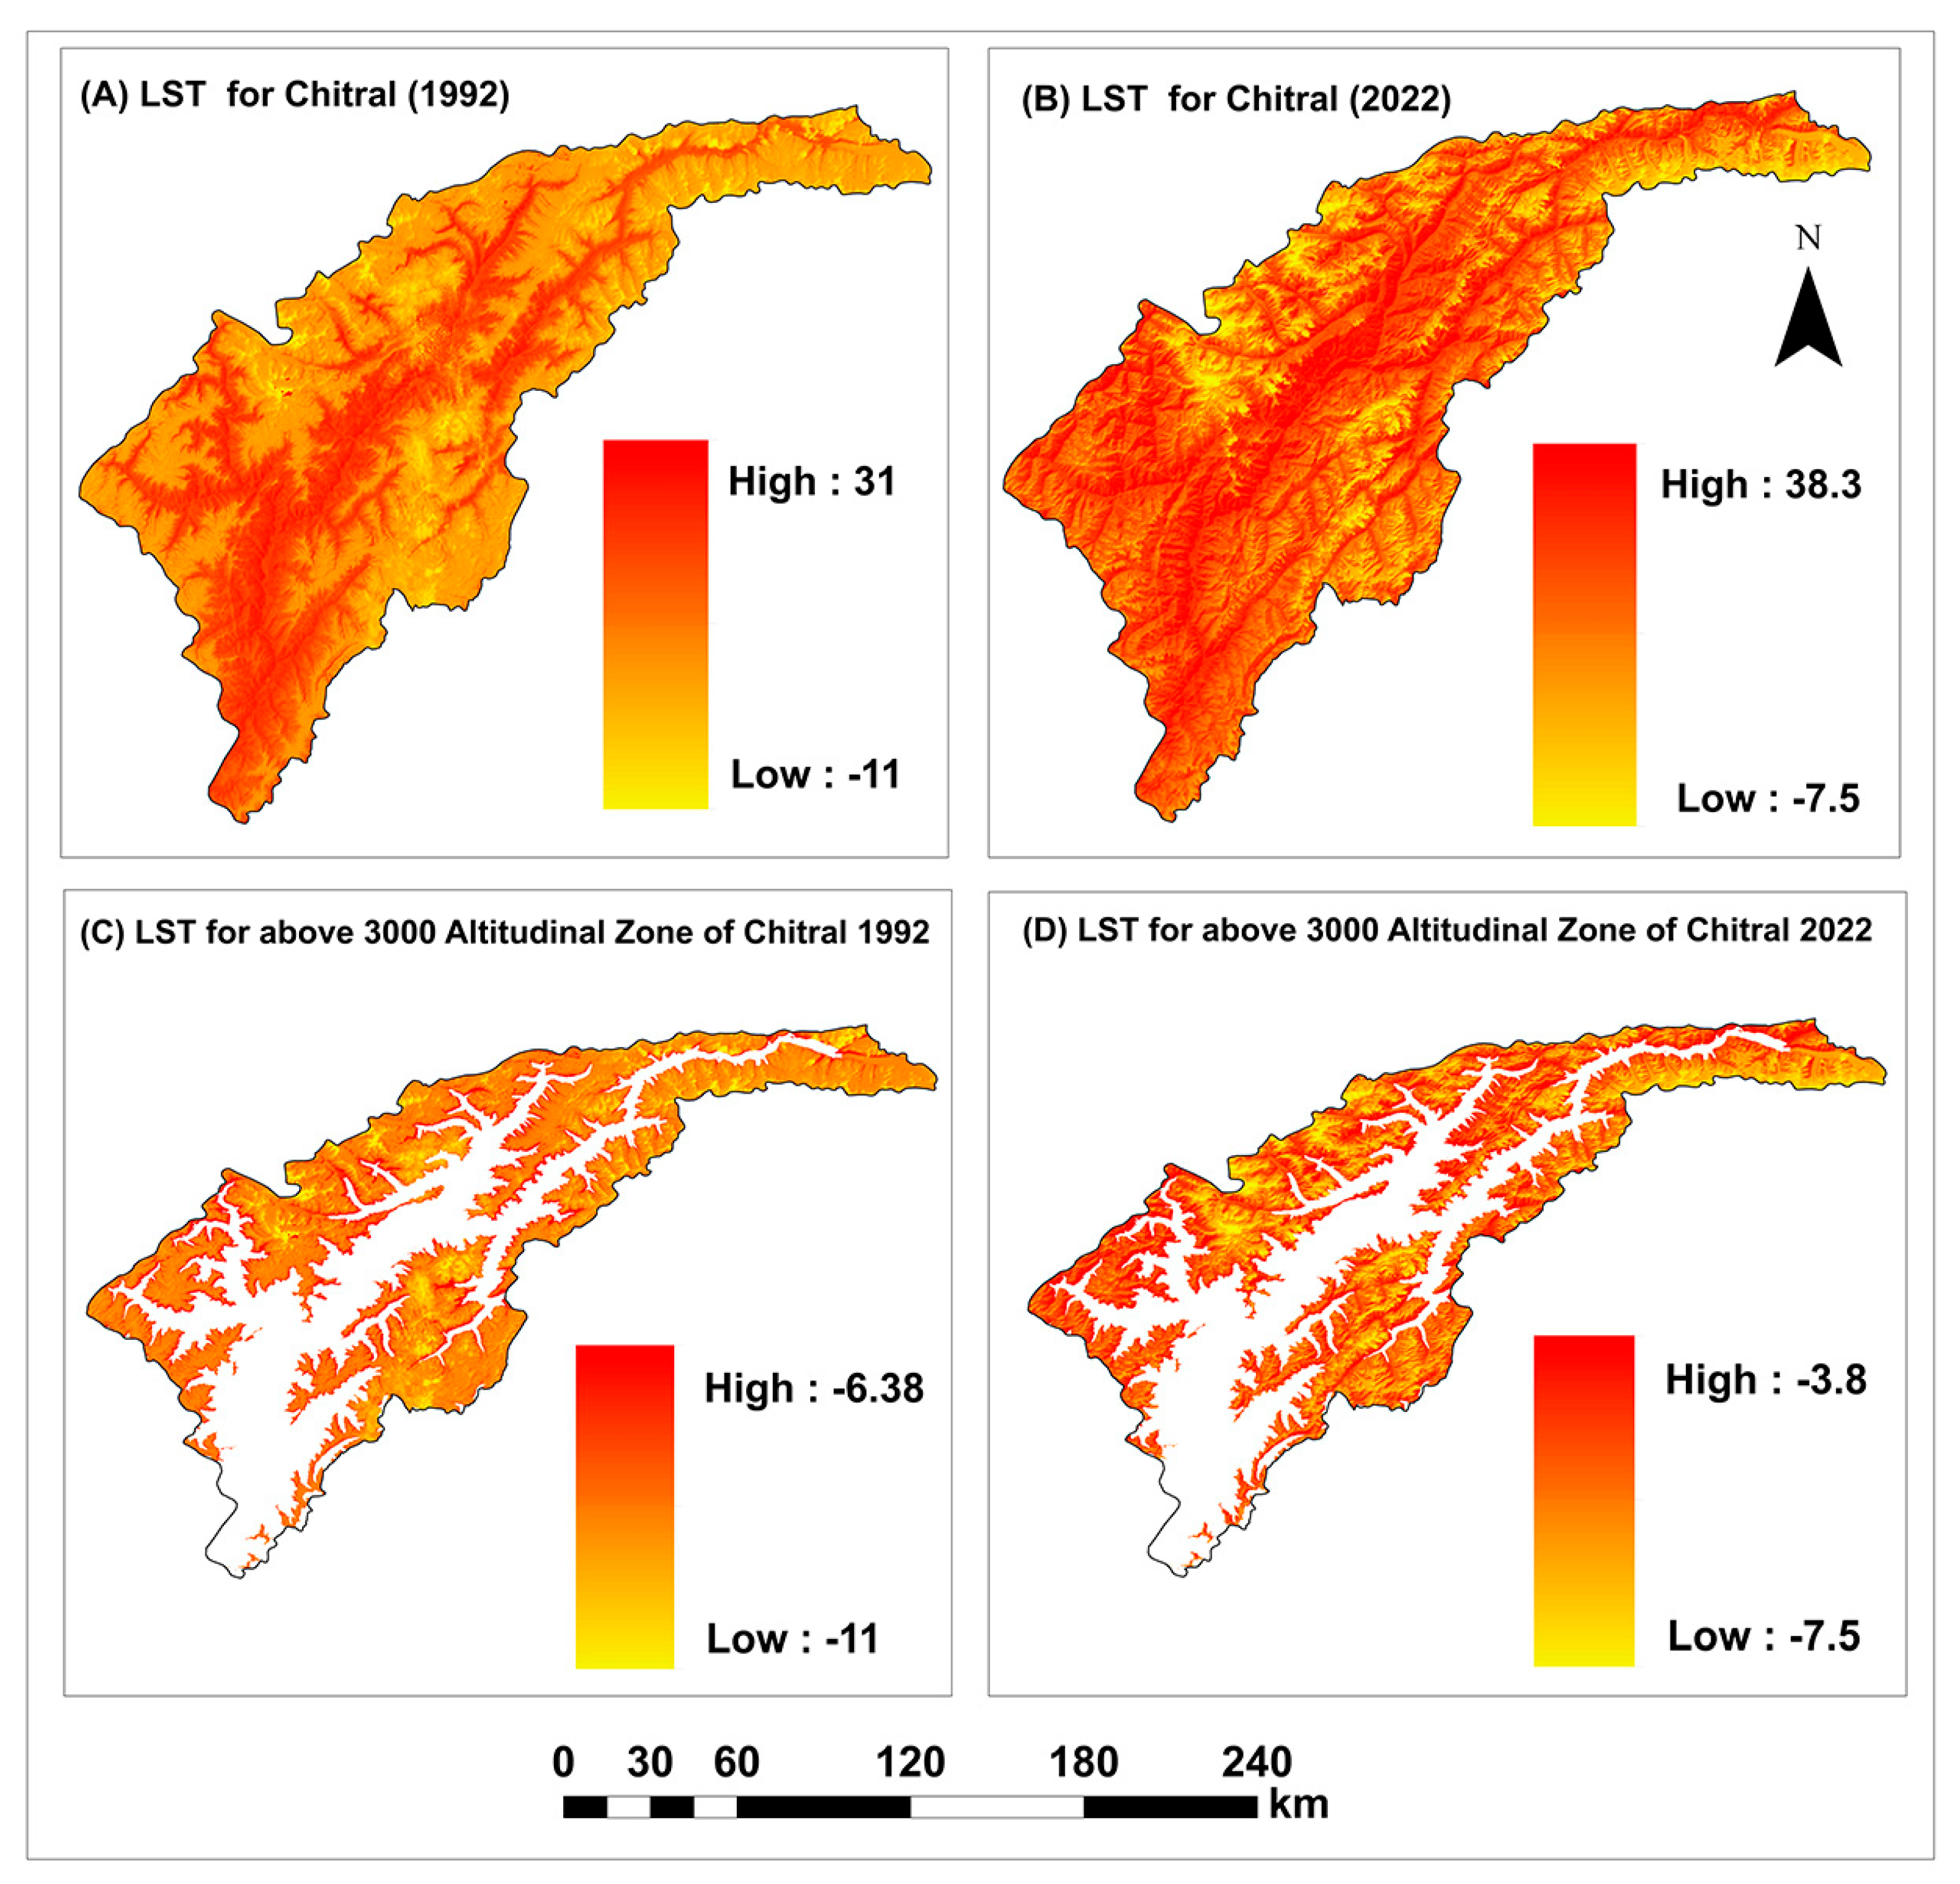
In 1992, land surface temperature (LST) ranged from a maximum of 31.0 °C to a minimum of −11.0 °C (Figure 8). By 2022, it had increased to a maximum of 38.3 °C (by 7.3 °C) and a minimum of −7.4 °C (by 3.6 °C). Over the study period, a significant warming trend has been observed in elevations above 3000 m asl. While in 1992 the LST ranged from −6.4 °C to −11.0 °C, it had increased to a minimum temperature of −3.8 °C by 2022.

4.3. Changes in Precipitation

Both Chitral city and Drosh experienced decreases in precipitation between 1967 and 2022. In Chitral city, the most significant reduction was observed in December and January (Table 7). A more pronounced decrease was observed in Drosh, particularly in December. In contrast, precipitation slightly increased in both cities during the summer months of June to August. However, the p-values indicate that these increases were statistically insignificant, suggesting that precipitation likely remained stable during the summer. Nevertheless, it is important to continue monitoring changes in precipitation amounts.
The ARIMA results revealed variations in annual precipitation. In Chitral city, the highest annual precipitation of 664 mm occurred in 2022, while the lowest, 73 mm, was recorded in 1997, indicating a relatively large range (Figure 9). The 56-year mean annual precipitation was 258 mm, with a standard deviation of 130 mm. The analysis identified a trend of decreasing annual precipitation from 1967 to 2022. In Drosh, the highest annual precipitation of 952 mm occurred in 1972, while the lowest, 302 mm, was recorded in 1971. The mean annual precipitation was 577 mm, with a standard deviation of 135 mm. Annual precipitation fluctuated significantly and showed a decreasing trend between 1967 and 2022, with projections suggesting that this trend will continue from 2022 to 2042.

5. Illegal Ice and Snow Harvesting

Over the past decades, illegal harvesting and commercial exploitation of snow and glacier ice have become significant economic activities in Chitral (Figure 10). According to interviews and focus group discussions with local ice sellers, forty to fifty vehicles transport harvested snow and ice to Chitral town daily from May to September. This activity is managed by various contractors, who collect the snow and ice from different locations around Lawari Pass. Each vehicle carries between 45 and 55 nuks (approximately 40 kg), resulting in a total daily harvest of between 72 and 110 tons of snow and ice. Over the five-month harvesting season, this amounts to between 10,800 and 16,500 tons, or roughly 12 to 18 million cubic meters. Snow and ice are also harvested from other areas in Upper Chitral, such as Attakh and Tirich. With rising temperatures during the summer, more frequent heatwaves, and electricity load shedding, the demand for snow and ice has increased. Local vendors sell the snow and ice for domestic use at a rate of PKR 100 (~35 US cents) per kg.

6. Discussion

Our glacier mapping based on Sentinel-2 imagery and the Normalized Difference Glacier Index (NDGI) method revealed a total glacier area of 1834 km2 in 2022, covering 12.4% of the Chitral Valley’s landscape. This closely aligns with the 1850 km2 in the GLIMS database and the 1822 km2 reported by the Pakistan New Glacier Inventory for the same year [53]. While both studies utilized Sentinel-2 imagery, the inventory employed a different approach, combining the Normalized Difference Snow Index (NDSI), Normalized Difference Vegetation Index (NDVI), and Band 4 (Red). The NDSI is calculated as NDGI = (Green − SWIR)/(Green + SWIR), whereas the NDVI is determined as NDVI = (Near Infrared − Red)/(Near Infrared + Red). Despite this consistency in total glacier area, discrepancies arise when comparing our results with those of an earlier study that followed a different method that delineates glaciers through variations in grey scale values in panchromatic satellite images [54]. Using Landsat-7 images, that study estimated a glacier area of 1903 km2 in 2001, whereas our analysis found a significantly larger area of 2501 km2 in 2002. The nearly 600 km2 difference likely reflects advancements in glacier mapping techniques. Notably, it remains unclear why the 2014 study employed a methodology dating back to 1977. The glacier recession pattern follows a typical trend, with an increasing number of glaciers resulting from the progressive disintegration of larger glaciers into smaller ones over time. For 2001, different studies identified 542 and 546 glaciers, respectively [54,55]. By 2013, the count had risen to 806 [55], and in 2022, it reached 1872 [53]. However, some caution is necessary interpreting these numbers, as defining the exact boundaries of a glacier and distinguishing individual glaciers within a larger glacierized area remain challenging.
Our study highlights significant glacier recession in the Eastern Hindu Kush of Chitral over the past three decades. Between 1992 and 2022, glaciers lost 816 km2 (31%) of their total area, with an average annual loss of 27 km2. Accelerated glacier recession occurred between 1997 and 2002, when a severe drought occurred, and again after 2007. A study on six larger glacier networks (>20 km2) revealed a mean glacier terminus retreat of 130 m from 2001 to 2018 [56].
Simultaneously, both maximum and minimum monthly mean air temperatures increased between 1992 and 2022, particularly during the summer months of June, July, and August. Our findings are supported by a seasonal trend analysis study indicating a significant increase in temperature [57]. In contrast, an analysis of temperature data from the Chitral weather station for the period 1990–2013 described the mean temperature as stable [56]. Furthermore, our study found that both maximum (+7.3 °C) and minimum (+3.6 °C) land surface temperatures significantly increased from 1992 to 2022 across Chitral, and they increased significantly in elevations above 3000 m asl. This warming trend is projected to continue at least until 2042, which is further supported by RCP4.5 and RCP 8.5 scenarios projecting a temperature increase across Chitral by the end of the century [58,59].
Between 1967 and 2022, a trend of decreasing annual precipitation was observed, primarily due to reduced precipitation during the winter months, although there was a slight (but statistically insignificant) increase in summer precipitation. Similar to the temperature findings, an analysis of precipitation data from the Chitral city weather station from 1990 to 2013 also reported stable annual precipitation [56].
Nevertheless, our results suggest that less snow fed the glacial accumulation zones at higher elevations during winter, while increased rainfall in the summer may have contributed to glacier melt, particularly at lower elevations. Additionally, the earlier onset of the snowmelt season further exacerbated the glacier recession. Our results suggested a continuation of decrease in annual precipitation, which is supported by some other studies [58,59,60]. A decline in precipitation by the end of the century has been predicted in estimates using the RCP4.5 scenario, by 16%, and using the RCP8.5 scenario, by 35% [59]. Furthermore, the RCP8.5 scenario predicted a decline in winter precipitation by almost 10% and an increase in summer precipitation by almost 29%. In contrast, other studies predicted a substantial increase, predominantly during the winter months [61,62].
Our findings on glacier recession align with trends observed regionally [63,64,65,66] and globally [67,68,69], which have been primarily attributed to climate change [70]. Some studies also highlight the deposition of black carbon and dust on glacier surfaces, which lowers albedo and accelerates melting, as an additional factor driving the accelerated glacier retreat [71,72]. While the recent harvesting of snow and ice is not currently a major contributor to the retreat of Chitral’s glaciers, the volumes harvested are significant and may increase. This could further impact smaller glaciers, especially considering the population growth of approximately 200,000 people (>60%) over the last twenty-five years.
The melting of glaciers may initially lead to increased runoff and water availability [73] but also poses a significant risk of flooding, particularly through glacial lake outburst floods (GLOFs) [74,75,76,77,78]. For the Chitral River Basin, estimates based on RCP4.5 scenarios indicate that snowmelt currently contributes 95.1% of the total stream flow, followed by glacier melt at 4.6% and rainfall at 0.2% [58]. By the end of the century, snowmelt contributions are projected to decline to 87.4%, while glacier melt is expected to rise to 12.2%. However, the study does not clarify whether this increase in glacier melt represents an absolute increase or merely a relative shift due to reduced snowfall and declining snowmelt. A separate study estimated that the mean summer discharge of the Chitral River will increase by 14–19% under the three mid-century RCP scenarios and by 13–37% under the three late-century RCP scenarios compared to that in the reference period of 2000–2005 [32]. While these projections suggest a long-term increase in meltwater runoff, other studies indicated that once glaciers retreat to higher elevations—where conditions may still support ice accumulation—water availability for ecosystems and human activities will eventually diminish, which could lead to severe water shortages and potential crises [76,79]. Secondary consequences, such as agricultural decline and food insecurity, may also emerge as a result [77].

7. Conclusions

The increase in land surface and summer air temperatures, coupled with decreasing winter precipitation, has driven significant glacial recession in the Eastern Hindu Kush of Chitral, Pakistan over the past thirty years. Modeling results project that this trend will continue over the next two decades. The expected impacts of glacier recession include the formation of new glacial lakes, increased flooding and sedimentation. Additionally, while an initial phase of increased runoff and heightened flood risk is anticipated, it is likely to be followed by a long-term runoff deficit and worsening water scarcity. Therefore, monitoring Chitral’s snow and ice resources, along with their careful management, is crucial for sustainable development that reduces vulnerabilities and enhances resilience. Future investigations should explore the impact of black carbon from anthropogenic industrial and transportation activities on the accelerated recession of Chitral’s glaciers.

Author Contributions

Z.A., F.A., U.K., F.R. and S.M.M. contributed to conceptualization and writing; Z.A. and F.A. produced the illustrations. All authors have read and agreed to the published version of the manuscript.

Funding

This research received no external funding.

Data Availability Statement

The raw data supporting the conclusions of this article will be made available by the authors on request.

Conflicts of Interest

The authors declare no conflicts of interest.

References

  1. Hori, M.; Sugiura, K.; Kobayashi, K. A 38-year (1978–2015) Northern Hemisphere daily snow cover extent product derived using consistent objective criteria from satellite-borne optical sensors. Remote Sens. Environ. 2017, 191, 402–418. [Google Scholar] [CrossRef]
  2. Rowan, A.V.; Quincey, D.J.; Gibson, M.J.; Glasser, N.F.; Westoby, M.J.; Irvine-Fynn, T.D.L.; Porter, P.R.; Hambrey, M.J. The sustainability of water resources in High Mountain Asia in the context of recent and future glacier change. Geol. Soc. Spec. Publ. 2018, 462, 189–204. [Google Scholar] [CrossRef]
  3. Hussain, A.; Sagin, J.; Bekbayeva, A.; Abid, M. Climate change and its impact on glaciers in Hindu Kush region: A case study of Yarkhun Valley, Chitral Pakistan. In Proceedings of the 40th Asian Conference on Remote Sensing (ACRS 2019): Progress of Remote Sensing Technology for Smart Future, Daejeon, Republic of Korea, 14–18 October 2019; pp. 3007–3018. [Google Scholar]
  4. Sahu, R.; Gupta, R.D. Snow cover area analysis and its relation with climate variability in Chandra basin, Western Himalaya, during 2001–2017 using MODIS and ERA5 data. Environ. Monit. Assess. 2020, 192, 489. [Google Scholar] [CrossRef] [PubMed]
  5. Viviroli, D.; Kummu, M.; Meybeck, M.; Kallio, M.; Wada, Y. Increasing dependence of lowland populations on mountain water resources. Nat. Sustain. 2020, 3, 917–928. [Google Scholar] [CrossRef]
  6. Wang, X.; Liu, S.W.; Zhang, J.L. A new look at roles of the cryosphere in sustainable development. Adv. Clim. Change Res. 2019, 10, 124–131. [Google Scholar] [CrossRef]
  7. Terzi, S.; Torresan, S.; Schneiderbauer, S.; Critto, A.; Zebisch, M.; Marcomini, A. Multi-risk assessment in mountain regions: A review of modelling approaches for climate change adaptation. J. Environ. Manag. 2019, 232, 759–771. [Google Scholar] [CrossRef]
  8. Wester, P.; Mishra, A.; Mukherji, A.; Shrestha, A.B. (Eds.) The Hindu Kush Himalaya Assessment: Mountains, Climate Change, Sustainability and People; Springer Nature: Cham, Switzerland, 2019. [Google Scholar]
  9. Kraaijenbrink, P.D.A.; Bierkens, M.F.P.; Lutz, A.F.; Immerzeel, W.W. Impact of a global temperature rise of 1.5 degrees Celsius on Asia’s glaciers. Nature 2017, 549, 257–260. [Google Scholar] [CrossRef]
  10. Rangwala, I.; Miller, J.R. Climate change in mountains: A review of elevation-dependent warming and its possible causes. Clim. Change 2012, 114, 527–547. [Google Scholar] [CrossRef]
  11. Mountain Research Initiative EDW Working Group (MRI). Elevation-depending warming in mountain regions of the world. Nat. Clim. Change 2015, 5, 424–430. [Google Scholar] [CrossRef]
  12. Yasmeen, Z.; Afzaal, M. Application of remote sensing for temporal mapping of glacier and glacial lake. Pak. J. Meteorol. 2017, 13, 1–8. [Google Scholar]
  13. Tahir, A.A.; Hakeem, S.A.; Hu, T.; Hayat, H.; Yasir, M. Simulation of snowmelt-runoff under climate change scenarios in a data-scarce mountain environment. Int. J. Digit. Earth 2017, 12, 910–930. [Google Scholar] [CrossRef]
  14. Farhan, M.; Moazzam, U. Trend of snow cover under the influence of climate change using Google Earth Engine platform: A case study of Astore (Western Himalayas) and Shigar (Karakoram region). Front. Environ. Sci. 2022, 10, 1006399. [Google Scholar]
  15. Banerjee, A.; Chen, R.; Meadows, M.E.; Semgupta, D.; Pathak, S.; Zilong, X.; Mal, S. Tracking 21st century climate dynamics of the Third Pole: An analysis of topo-climate impacts on snow cover in the central Himalaya using Google Earth Engine. Int. J. Appl. Earth Obs. Geoinf. 2021, 103, 102490. [Google Scholar] [CrossRef]
  16. International Centre for Integrated Mountain Development (ICIMOD). ICIMOD at COP29, and at 41: Bolstering Our Climate Action for Mountains and Vulnerable Communities. 2024. Available online: https://www.icimod.org/icimod-at-cop29-and-at-41-bolstering-our-climate-action-for-mountains-and-vulnerable-communities/?utm_source=emailoctopus&utm_medium=email&utm_campaign=Newsletter (accessed on 14 February 2025).
  17. Rasul, G.; Mahmood, A.; Sadiq, A.; Khan, S.I. Vulnerability of the Indus delta to climate change in Pakistan. Pak. J. Meteorol. 2012, 8, 89–107. [Google Scholar]
  18. Krishnan, R.; Shrestha, A.R.; Ren, G.; Rajbhandari, R.; Saeed, S.; Sanjay, J.; Syed, M.A.; Vellore, R.; Xu, Y.; You, Q.; et al. Unravelling climate change in the Hindu Kush Himalaya: Rapid warming in the mountains and increasing extremes. In The Hindu Kush Himalaya Assessment: Mountains, Climate Change, Sustainability and People; Wester, P., Mishra, A., Mukherji, A., Shrestha, A.B., Eds.; Springer Nature: Cham, Switzerland, 2019; pp. 57–97. [Google Scholar]
  19. Bajracharya, S.R.; Maharjan, S.B.; Shrestha, F.; Guo, W.; Liu, S.; Immerzeel, W.; Shrestha, B. The glaciers of the Hindu Kush Himalayas: Current status and observed changes from the 1980s to 2010. Int. J. Water Resour. Dev. 2015, 31, 161–173. [Google Scholar] [CrossRef]
  20. Hewitt, K. The Karakoram anomaly? Glacier expansion and the “Elevation effect,” Karakoram Himalaya. Mt. Res. Dev. 2005, 25, 332–340. [Google Scholar] [CrossRef]
  21. Hewitt, K. Glacier change, concentration, and elevation effects in the Karakoram Himalaya, upper Indus basin. Mt. Res. Dev. 2011, 31, 188–200. [Google Scholar] [CrossRef]
  22. Miller, J.D.; Immerzeel, W.W.; Rees, G. Climate change impacts on glacier hydrology and river discharge in the Hindu Kush-Himalayas. Mt. Res. Dev. 2012, 32, 461–467. [Google Scholar] [CrossRef]
  23. Brun, F.; Berthier, E.; Wagnon, P.; Kääb, A.; Treichler, D. A spatially resolved estimate of High Mountain Asia glacier mass balances from 2000 to 2016. Nat. Geosci. 2017, 10, 668–673. [Google Scholar] [CrossRef]
  24. Sakai, A. Updated GAMDAM glacier inventory over high-mountain Asia. Cryosphere 2019, 13, 2043–2049. [Google Scholar] [CrossRef]
  25. Shean, D.E.; Bhushan, S.; Montesano, P.; Rounce, D.R.; Arendt, A.; Osmanoglu, B. A systematic, regional assessment of High Mountain Asia glacier mass balance. Front. Earth Sci. 2020, 7, 363. [Google Scholar] [CrossRef]
  26. Zekollari, H.; Huss, M.; Farinotti, D. On the imbalance and response time of glaciers in the European Alps. Geophys. Res. Lett. 2020, 47, e2019GL085578. [Google Scholar] [CrossRef]
  27. Eckstein, D.; Künzel, V.; Schäfer, L. (Eds.) Global Climate Risk Index 2018: Who Suffers Most from Extreme Weather Events? Weather-related Loss Events in 2016 and 1997 to 2016; Germanwatch: Bonn, Germany, 2018. [Google Scholar]
  28. Moazzam, M.F.U.; Rahman, G.; Ali, K.S.; Lee, B.G. Spatio-temporal snow cover change in the early twenty-first century using improved MODIS dataset: A case study of District Hunza, Pakistan. Clim. Dyn. 2023, 60, 3417–3433. [Google Scholar] [CrossRef]
  29. Rai, S.C.; Mukherjee, N.R. Spatio-temporal change delineation and forecasting of snow/ice-covered areas of Sikkim Himalaya using multispectral and thermal band combinations of Landsat imagery. Environ. Chall. 2021, 4, 100163. [Google Scholar] [CrossRef]
  30. Intergovernmental Panel on Climate Change (IPCC). The Ocean and Cryosphere in a Changing Climate; Cambridge University Press: Cambridge, UK, 2022. [Google Scholar]
  31. Carrivick, J.L.; Tweed, F.S. A review of glacier outburst floods in Iceland and Greenland with a megafloods perspective. Earth-Sci. Rev. 2019, 196, 102876. [Google Scholar] [CrossRef]
  32. Hayat, H.; Tahir, A.A.; Wajid, S.; Abbassi, A.M.; Zubair, F.; Hashmi, Z.R.; Khan, A.; Khan, A.J.; Irshad, M. Simulation of the meltwater under different climate change scenarios in a poorly gauged snow and glacier-fed Chitral River catchment (Hindukush region). Geocarto Int. 2022, 37, 103–119. [Google Scholar] [CrossRef]
  33. Rahman, F. Persistence and Transformation in the Eastern Hindu Kush: A Study of Resource Management Systems in Mehlp Valley, Chitral, North Pakistan; Bonner Geographische Abhandlungen 118: Bonn, Germany, 2007. [Google Scholar]
  34. Government of Pakistan. Seventh Population and Housing Census 2023; Pakistan Bureau of Statistics: Islamabad, Pakistan, 2023. [Google Scholar]
  35. Ahmad, Z. The Changing Pattern of Mountain Agriculture and Its Impact on Livelihood Strategies in the Eastern Hindu Kush: A Study of Lotkoh Valley, Chitral, North Pakistan. Ph.D. Thesis, University of Peshawar, Peshawar, Pakistan, 2021. [Google Scholar]
  36. Altaf, F. Impact of Climate Change on the Cryosphere: A Geospatial Assessment of Glaciers of the Eastern Hindu Kush, Chitral, Pakistan. Master’s Thesis, The Islamia University of Bahawalpur, Bahawalpur, Pakistan, 2023. [Google Scholar]
  37. Keshri, A.K.; Shukla, A.; Gupta, R.P. ASTER ratio indices for supraglacial terrain mapping. Int. J. Remote Sens. 2009, 30, 519–524. [Google Scholar] [CrossRef]
  38. Mann, H.B. Nonparametric tests against trend. Econometrica 1945, 13, 245–259. [Google Scholar] [CrossRef]
  39. Kendall, M.G.; Stuart, A. The advanced theory of statistics. Technometrics 1961, 5, 525–528. [Google Scholar]
  40. Yadav, R.; Tripathi, S.K.; Pranuthi, G.; Dubey, S.K. Trend analysis by Mann–Kendall test for precipitation and temperature for thirteen districts of Uttarakhand. J. Agrometeorol. 2014, 16, 164–171. [Google Scholar] [CrossRef]
  41. Kendall, M.G. Rank Correlation Measures; Charles Griffin: London, UK, 1975. [Google Scholar]
  42. Suryavanshi, S.; Panday, A.; Chaube, U.C.; Joshi, N. Long-term historic changes in climatic variables of Betla Basin, India. Theor. Appl. Climatol. 2014, 117, 403–418. [Google Scholar] [CrossRef]
  43. Frimpong, B.F.; Koranteng, A.; Molkenthin, F. Analysis of temperature variability utilizing Mann–Kendall and Sen’s slope estimator tests in the Accra and Kumasi metropolises in Ghana. Environ. Syst. Res. 2022, 11, 24. [Google Scholar] [CrossRef]
  44. Vinh, V.D.; Ouillon, S.; Hai, N.M. Sea surface temperature trend analysis by Mann-Kendall test and sen’s slope estimator: A study of the Hai Phong coastal area (Vietnam) for the period 1995-2020. Vietnam J. Earth Sci. 2022, 44, 73–91. [Google Scholar]
  45. Mamo, B.M.; Ndunda, E.; Muriuki, J. Temperature and rainfall trends analysis using Mann–Kendall and Sen’s slope estimator test in Marsabit County, Kenya. Int. J. Appl. Environ. Sci. 2024, 19, 107–127. [Google Scholar]
  46. Sen, P.K. Estimates of the regression coefficient based on Kendall’s tau. J. Am. Stat. Assoc. 1968, 63, 1379–1389. [Google Scholar] [CrossRef]
  47. Box, G.E.P.; Jenkins, G.M. Time Series Analysis, Forecasting and Control; Holden Day: San Francisco, CA, USA, 1970. [Google Scholar]
  48. Wilks, D.S. Statistical Methods in the Atmospheric Sciences; Academic Press: Burlington, UK, 2006. [Google Scholar]
  49. Hyndman, R.J.; Athanasopoulos, G. Forecasting: Principles and Practice; OTexts: Melbourne, Australia, 2018. [Google Scholar]
  50. Islam, M.; Zakaria, M.T. Forecasting of maximum and minimum temperature in the Cox’s Bazar Region of Bangladesh based on time series analysis. IOSR J. Math. 2019, 15, 56–67. [Google Scholar]
  51. Lai, Y.; Dzombak, D.A. Use of the autoregressive integrated moving average (ARIMA) model to forecast near-term regional temperature and precipitation. Weather Forecast. 2020, 35, 959–976. [Google Scholar] [CrossRef]
  52. Amjad, M.; Khan, A.; Fatima, K.; Ajazm, O.; Ali, S.; Main, M. Analysis of temperature variability, trends and prediction in the Karachi region of Pakistan using ARIMA models. Atmosphere 2023, 14, 88. [Google Scholar] [CrossRef]
  53. Diolaiuti, G.; Fugazza, D.; Gallo, M.; Melis, M.T. (Eds.) The New Inventory of 13,032 Glaciers in Pakistan: The “Glaciers and Students” Project; EvK2 CNR: Islamabad, Pakistan, 2024. [Google Scholar]
  54. Ashraf, A.; Roohi, R.; Naz, R.; Mustafa, N. Monitoring cryosphere and associated flood hazards in high mountain ranges of Pakistan using remote sensing technique. Nat. Hazards 2014, 73, 933–949. [Google Scholar] [CrossRef]
  55. Ashraf, A.; Batool, A. Evaluation of glacier resource potential for sustaining kuhl irrigation system under changing climate in the Himalayan region. J. Mt. Sci. 2019, 16, 1150–1159. [Google Scholar] [CrossRef]
  56. Gul, J.; Muhammad, S.; Liu, S.; Ullah, S.; Ahmad, S.; Hayat, H.; Tahir, A.A. Spatio-temporal changes in the six major glaciers of the Chitral River basin (Hindukush region of Pakistan) between 2001 and 2018. J. Mt. Sci. 2020, 17, 572–587. [Google Scholar] [CrossRef]
  57. Ahmad, S.; Israr, M.; Liu, S.; Hayat, H.; Gul, J.; Wajid, S.; Ashraf, M.; Baig, S.U.; Tahir, A.A. Spatio-temporal trends in snow extent and their linkage to hydro-climatological and topographical factors in the Chitral River Basin (Hindukush, Pakistan). Geocarto Int. 2018, 35, 711–734. [Google Scholar] [CrossRef]
  58. Burhan, A.; Usman, M.; Bukhari, S.A.A.; Sajjad, H. Contribution of glacier, snow and rain components in flow regime projected with HBV under AR5 based climate change scenarios over Chitral River Basin (Hindukush ranges, Pakistan). Int. J. Clim. Res. 2020, 4, 24–36. [Google Scholar]
  59. Syed, Z.; Ahmad, S.; Dahri, Z.H.; Azmat, M.; Shoaib, M.; Inam, A.; Qamar, M.U.; Hussain, S.Z.; Ahmad, S. Hydroclimatology of the Chitral River in the Indus Basin under changing climate. Atmosphere 2022, 13, 295. [Google Scholar] [CrossRef]
  60. Bokhari, S.; Ahmad, B.; Ali, J.; Ahmad, S.; Mushtaq, H.; Rasul, G. Future climate change projections of the Kabul River basin using a multi-model ensemble of high-resolution statistically downscaled data. Earth Syst. Environ. 2018, 2, 477–497. [Google Scholar] [CrossRef]
  61. Nizami, A.; Ali, J.; Zulfiqar, M. Climate change, hydro-meteorological hazards and adaptation for sustainable livelihood in Chitral Pakistan. Sarhad J. Agric. 2019, 35, 432–441. [Google Scholar] [CrossRef]
  62. Ahmed, K.; Iqbal, Z.; Khan, N.; Rasheed, B.; Nawaz, N.; Malik, I.; Noor, M. Quantitative assessment of precipitation changes under CMIP5 RCP scenarios over the northern Sub-Himalayan region of Pakistan. Environ. Dev. Sustain. 2020, 22, 7831–7845. [Google Scholar] [CrossRef]
  63. Armstrong, R.L. The Glaciers of the Hindu Kush-Himalayan Region: A Summary of the Science Regarding Glacier Melt/Retreat in the Himalayan, Hindu Kush, Karakoram, Pamir, and Tien Shan Mountain Ranges; CIRES/NSIDC, University of Colorado: Boulder, CO, USA, 2010. [Google Scholar]
  64. Romshoo, S.A.; Fayaz, M.; Meraj, G.; Bahuguna, I.M. Satellite-observed glacier recession in the Kashmir Himalaya, India, from 1980 to 2018. Environ. Monit. Assess. 2020, 192, 597. [Google Scholar] [CrossRef]
  65. Joya, E.; Bromand, M.T.; Murtaza, K.O.; Dar, R.A. Current glacier status and ELA changes since the Late Pleistocene in the Hindu Kush Mountains of Afghanistan. J. Asian Earth Sci. 2021, 219, 104897. [Google Scholar] [CrossRef]
  66. Scher, C.; Steiner, N.C.; McDonald, K.C. Mapping seasonal glacier melt across the Hindu Kush Himalaya with time series synthetic aperture radar (SAR). Cryosphere 2021, 15, 4465–4482. [Google Scholar] [CrossRef]
  67. López-Moreno, J.I.; Fontaneda, S.; Bazo, J.; Revuelto, J.; Azorin-Molina, C.; Valero-Garcés, B.; Morán-Tejeda, E.; Vicente-Serrano, S.M.; Zubieta, R.; Alejo-Cochachín, J. Recent glacier retreat and climate trends in Cordillera Huaytapallana, Peru. Glob. Planet. Change 2014, 112, 1–11. [Google Scholar] [CrossRef]
  68. Nuimura, T.; Sakai, A.; Taniguchi, K.; Nagai, H.; Lamsal, D.; Tsutaki, S.; Kozawa, A.; Hoshina, Y.; Takenaka, S.; Omiya, S.; et al. The GAMDAM glacier inventory: A quality-controlled inventory of Asian glaciers. Cryosphere 2015, 9, 849–864. [Google Scholar] [CrossRef]
  69. Abid, Z.; Zia, S. Mapping and analysis of Baltoro Glacier and Shigar River. Pak. Geogr. Rev. 2019, 74, 20–32. [Google Scholar]
  70. Wiltshire, A.J. Climate change implications for the glaciers of the Hindu Kush, Karakoram and Himalayan region. Cryosphere 2014, 8, 941–958. [Google Scholar] [CrossRef]
  71. Ming, J.; Xiao, C.; Du, Z.; Yang, X. An overview of black carbon deposition in High Asia glaciers and its impacts on radiation balance. Adv. Water Resour. 2013, 55, 80–87. [Google Scholar] [CrossRef]
  72. Wang, X.; Luo, X.; Zhang, Y.; Kang, S.; Chen, P.; Niu, H. Black carbon: A general review of its sources, analytical methods, and environmental effects in snow and ice in the Tibetan Plateau. Environ. Sci. Pollut. Res. Int. 2023, 31, 3413–3424. [Google Scholar] [CrossRef]
  73. Ashraf, A.; Naz, R.; Iqbal, M.B. Altitudinal dynamics of glacial lakes under changing climate in the Hindu Kush, Karakoram, and Himalaya ranges. Geomorphology 2017, 283, 72–79. [Google Scholar] [CrossRef]
  74. Ashraf, A.; Naz, R.; Roohi, R. Glacial lake outburst flood hazard in Hindukush, Karakoram and Himalayan ranges of Pakistan: Implications and risk analysis. Geomat. Nat. Hazards Risk 2012, 3, 113–132. [Google Scholar] [CrossRef]
  75. Emmer, A. Glacier Retreat and Glacial Lake Outburst Floods (GLOFs). 2017. Oxford Research Encyclopedias, Natural Hazard Science. Available online: https://oxfordre.com/naturalhazardscience/display/10.1093/acrefore/9780199389407.001.0001/acrefore-9780199389407-e-275 (accessed on 16 March 2025).
  76. Nie, Y.; Pritchard, H.D.; Liu, Q.; Hennig, T.; Wang, W.; Wang, X.; Liu, S.; Nepal, S.; Samyn, D.; Hewitt, K.; et al. Glacial change and hydrological implications in the Himalaya and Karakoram. Nat. Rev. Earth Environ. 2021, 2, 91–106. [Google Scholar] [CrossRef]
  77. Khan, S.W. Climate change and its devastating impact on the mountainous valley of Chitral. Compet. Res. J. Arch. 2024, 2, 235–244. [Google Scholar]
  78. Sun, H.; Yao, T.-D.; Su, F.-G.; Ou, T.; He, Z.; Tang, G.; Chen, D. Increased glacier melt enhances future extreme floods in the southern Tibetan Plateau. Adv. Clim. Change Res. 2024, 15, 431–441. [Google Scholar] [CrossRef]
  79. Azam, M.F.; Kargel, J.S.; Shea, J.M.; Nepal, S.; Haritashya, U.K.; Srivastava, S.; Maussion, F.; Qazi, N.; Chevallier, P.; Dimri, A.P.; et al. Glaciohydrology of the Himalaya-Karakoram. Science 2021, 373, 6557. [Google Scholar] [CrossRef] [PubMed]
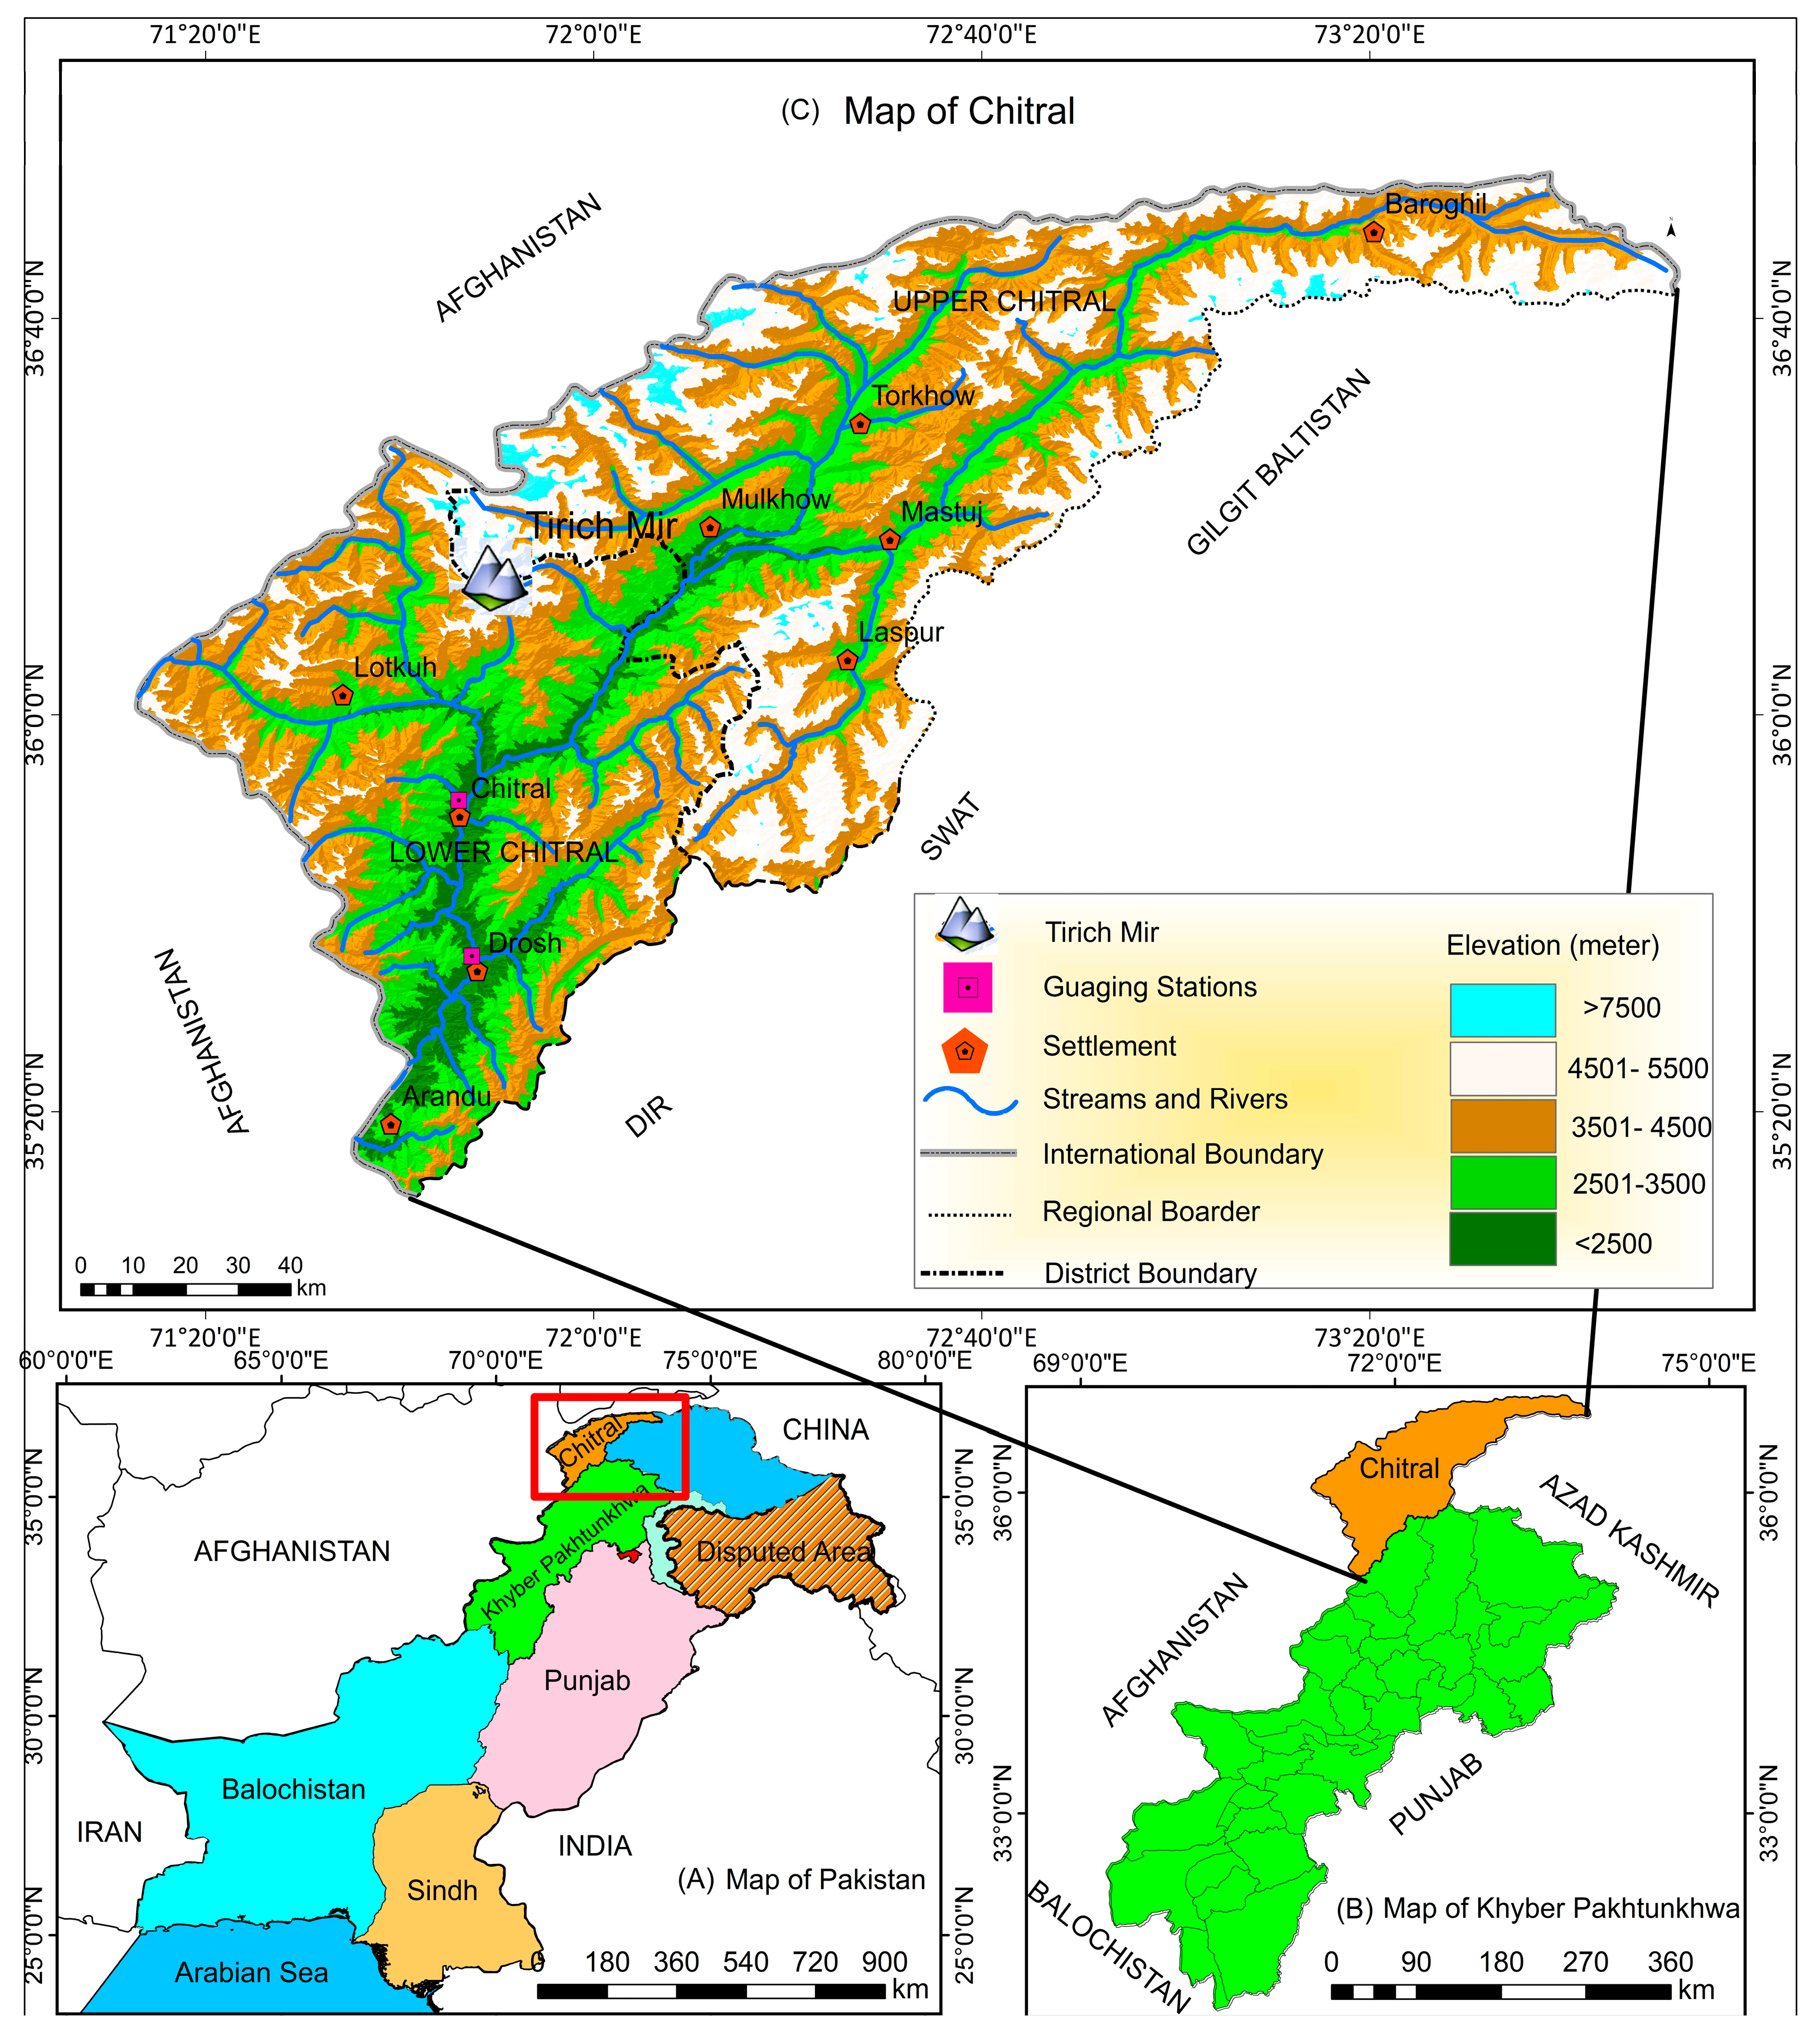
Figure 1. Chitral in northwestern Pakistan.
Geosciences 15 00167 g001
Figure 2. Distribution of glaciers in Chitral in 1992 and 2022 using NDGI analysis.
Geosciences 15 00167 g002
Figure 3. Change in glacial area of the Raman Glacier in Upper Chitral between 1992 and 2022.
Geosciences 15 00167 g003
Figure 4. Modeled monthly mean maximum temperature (MMTmax) from January to December in Chitral city.
Geosciences 15 00167 g004
Figure 5. Modeled monthly mean maximum temperature (MMTmax) from January to December in Drosh.
Geosciences 15 00167 g005
Figure 6. Modeled monthly mean minimum temperature (MMTmin) from January to December in Chitral city.
Geosciences 15 00167 g006
Figure 7. Modeled monthly mean minimum temperature (MMTmin) from January to December in Drosh.
Geosciences 15 00167 g007
Figure 8. Changes in land surface temperature (LST) in Chitral from 1992 to 2022.
Geosciences 15 00167 g008
Figure 9. Variations in annual precipitation in (A) Chitral city and (B) Drosh between 1967 and 2022, and projections until 2042.
Geosciences 15 00167 g009
Figure 10. Illegal ice harvesting at Lawari Pass in Chitral in 2024.
Geosciences 15 00167 g010
Table 1. Satellite data utilized in this study.
Acquisition DateDatasetSensorIDSpatial ResolutionCloud Cover
RowPath
31 August 1992LT05TM150, 151034, 035, 03630 m<10%
16 July 1997LT05TM150, 151034, 035, 03630 m<10%
30 August 2002LT05TM150, 151034, 035, 03630 m<10%
17 July 2007LE05TM150, 151034, 035, 03630 m<10%
8 July 2012LE05TM150, 151034, 035, 03630 m<10%
15 August 2017LC08OLI150, 151034, 035, 03630 m<10%
23 September 2022LC08OLI150, 151034, 035, 03630 m<10%
8 July 2022Sentinel-2AMSIT42SXEA03598110 m<10%
Table 2. Accuracy assessment of the NDGI analysis results.
YearOverall
Accuracy (%)
User’s
Accuracy (%)
Producer’s
Accuracy (%)
Commission
Error (%)
Omission
Error (%)
Kappa
Coefficient (%)
199286.783.979.422.412.50.84
199789.586.182.116.710.40.87
200291.789.880.618.513.70.89
200793.591.486.224.618.20.91
201292.880.486.714.910.60.88
201787.591.189.120.315.70.92
202294.789.787.717.29.80.95
Table 3. Change in total clean-ice glacier area in Chitral between 1992 and 2022.
YearArea
(km2)
Change
(km2)
Change
(%)
Average Annual Change
(km2)
19922650---------
19972600−50−1.9−10.0
20022501−99−3.8−19.8
20072462−39−1.6−7.8
20122236−226−9.2−45.2
20172009−227−10.2−45.4
20221834−175−8.7−35.0
1992–2022---−816−30.8−27.2
Table 4. Change in clean-ice area of the Raman Glacier in Upper Chitral between 1992 and 2022.
YearArea
(km2)
Change
(km2)
Change
(%)
Average Annual Change
(km2)
19929.66---------
19979.50−0.16−1.7−0.03
20027.52−1.98−20.8−0.40
20077.30−0.22−2.9−0.04
20127.00−0.30−4.1−0.06
20176.73−0.27−3.9−0.05
20226.41−0.32−4.8−0.06
1992–2022---−3.25−33.6−0.67
Table 5. Mann–Kendall test results for the monthly mean maximum temperature (MMTmax) in Chitral city and Drosh between 1967 and 2022. (TSS: Theil–Sen Slope, Ho: null hypothesis).
MonthChitral CityDrosh
Kendall’s Tau (τ)S′
(S Prime)
Var
(S′)
pTSSHoKendall’s Tau (τ)S′
(S Prime)
Var
(S′)
pTSSHo
Jan0.32231490.0430.75Rejected0.0641040.0360.48Rejected
Feb0.21151440.0210.64Rejected0.0641040.7690.29Accepted
Mar0.33241550.5410.55Accepted0.1071030.5540.42Accepted
Apr0.31221460.0490.50Rejected0.0861020.6210.05Accepted
May0.2115930.1190.54Accepted0.1391030.0430.41Rejected
Jun0.0321060.0150.01Rejected0.14101020.0420.02Rejected
Jul0.14101260.0430.46Rejected0.0431010.0320.30Rejected
Aug0.0321480.0520.30Rejected0.0431030.0340.34Rejected
Sep0.032.590.0450.10Rejected0.23161020.0370.20Rejected
Oct0.24171450.0480.30Rejected−0.06−41040.769−0.05Accepted
Nov0.18131130.0210.24Rejected−0.06−4970.761−0.25Accepted
Dec0.20141620.0270.45Rejected0.0751030.0390.17Rejected
Table 6. Mann–Kendall test results for the monthly mean minimum temperature (MMTmin) in Chitral city and Drosh between 1967 and 2022. (TSS: Theil–Sen Slope, Ho: null hypothesis).
MonthChitral cityDrosh
Kendall’s Tau (τ)S′
(S Prime)
Var
(S′)
pTSSHoKendall’s Tau (τ)S′
(S Prime)
Var
(S′)
pTSSHo
Jan0.12−91030.0370.14Rejected0.0641040.0250.01Rejected
Feb0.0321020.0250.02Rejected0.0821040.413−0.01Accepted
Mar0.20141020.2030.10Accepted−0.07−11030.437−0.01Accepted
Apr0.1181020.492−0.22Accepted0.20161040.0140.03Rejected
May0.22161040.014−0.57Rejected0.0851030.0260.02Rejected
Jun0.54381020.0171.07Rejected0.29201020.0010.06Rejected
Jul0.39281040.0120.44Rejected0.38261040.00010.06Rejected
Aug0.35251030.0240.16Rejected0.40271030.00010.06Rejected
Sep0.0111030.0170.02Rejected0.33151030.0010.07Rejected
Oct0.1391030.4300.04Accepted0.22131030.0240.04Rejected
Nov0.40281000.012−0.53Rejected0.2151030.0280.04Rejected
Dec0.1181040.0490.10Rejected0.1271010.0340.02Rejected
Table 7. Mann–Kendall test results for the monthly mean precipitation in Chitral city and Drosh between 1967 and 2022. (TSS: Theil–Sen Slope, Ho: null hypothesis).
MonthChitral cityDrosh
Kendall’s tau (τ)S′
(S Prime)
Var
(S′)
pTSSHoKendall’s tau (τ)S′
(S Prime)
Var
(S′)
pTSSHo
Jan−0.57−4.01040.017−2.68Rejected−0.46−41040.007−7.26Rejected
Feb−0.17−12.01040.028−8.29Rejected−0.62−161040.014−8.48Rejected
Mar−0.03−2.01040.032−4.72Rejected−0.06−41040.037−3.30Rejected
Apr−0.06−4.01040.7690.81Accepted−0.25−181040.102−9.92Accepted
May0.064.01040.7694.33Accepted−0.08−61040.624−5.63Accepted
Jun0.1511.01030.324−0.16Accepted0.24171030.1104.50Accepted
Jul0.22−16.01040.141−1.22Accepted0.08−61040.104−2.90Accepted
Aug0.011.01030.154−1.03Accepted0.0861040.6200.31Accepted
Sep0.3626.01040.0141.97Rejected−0.01−11031.0010.32Accepted
Oct0.086.01040.6241.66Accepted−0.11−81040.490−2.27Accepted
Nov0.2216.01040.1416.29Accepted0.19141040.2004.82Accepted
Dec−0.76−4.01040.039−1.28Rejected−0.25−181040.001−10.58Rejected
Disclaimer/Publisher’s Note: The statements, opinions and data contained in all publications are solely those of the individual author(s) and contributor(s) and not of MDPI and/or the editor(s). MDPI and/or the editor(s) disclaim responsibility for any injury to people or property resulting from any ideas, methods, instructions or products referred to in the content.