Abstract
This article presents a comparative analysis of rock mass fracturing at the Karasu gold deposit, located approximately 400 km northwest of Karaganda, Kazakhstan. The analysis is based on core drilling data and measurements from underground workings, including an old mine that was explored and investigated to gather missing information. The spatial characteristics of fractures and their relationship with tectonic faults are identified. The feasibility of using the Rock Quality Designation (RQD) index for classifying fracture systems is assessed. Engineering and geological studies include the identification of major fracture systems and their characteristics using Leapfrog and Rocscience software, chosen for their ease of use and extensive functionality. The stability parameters of open-pit slopes are calculated, considering the physical and mechanical properties of rocks, the degree of fracturing, and the influence of groundwater. Key engineering and geological elements of the rock mass are identified, emphasizing the necessity of integrating fracture data from various sources to improve the accuracy of mine design and ensure the safe operation of open pits. These studies are part of the exploration phase to assess the geological situation and the physico-mechanical properties of these rocks for further quarry design.
1. Introduction
The study of fractures in rocks is of great interest, not only in terms of assessing their strength, but also for reconstructing the geodynamic processes that they have undergone during their geological history. It is well known that stress arises in the contact zone of faults and intrusions, forming networks of fractures that act as conduits for fluids from deep-seated sources [1].
In these zones, under the influence of thermodynamic processes, new mineral paragenetic groups are formed, along with metasomatites, hornfels, and skarned rocks, which, in many cases, are mineralized [2]. Various fracture systems near the contact between intrusions and host rocks create zones of weakening, primarily in the host rocks, where ore mineral associations are formed [3]. These zones serve as conduits for deep hydrothermal fluids [4].
Intrusions and the metasomatic mineralization associated with them are linked to the intersections of tectonic faults. These formations, known as stockworks, typically have an elongated shape that usually coincides with the strike of the fault. An example of such intrusions and mineralization zones is the Karasu gold deposit under study.
The combination of fracture systems divides the rock mass, forming blocks [5,6]. The assessment of blockiness and its classification are provided in research [7], while recommendations for their application are given in [8,9]. A key role in the rating assessment of blockiness is played by modeling methods for the set of fracture systems that divide the rock mass into blocks [10,11]. Experimental studies on fracture formation in rock models of various compositions are presented in works [12,13,14]. These studies identify regularities characteristic of metamorphic rocks and intrusions [15]. Methodological and scientific interest lies in the work [16], where a structural–paragenetic analysis of fault-associated fractures was developed, along with their genetic classification and structural grouping.
The fracturing of rock mass determines the choice of technical solutions for open-pit, underground, or combined mining methods, the organization of transport routes, and the arrangement of mining and industrial complexes, among other factors. Fracturing plays a crucial role in assessing the stability of open-pit slopes and identifying the most hazardous areas prone to collapse [17].
To study fracturing, core samples from engineering–geological boreholes, as well as from boreholes drilled at various stages of exploration, are analyzed. The degree of fracturing is assessed based on identified engineering–geological elements (EGEs) using the Rock Quality Designation (RQD) index [18]. This index is applied in geomechanical rock mass classification, including the RMR (Bieniawski method) and Q (Barton method), and is used in selecting design solutions for ore deposit development [19].
A large number of RQD measurements conducted during engineering–geological studies, as well as the prospect of increasing data through the analysis of core samples from previously drilled boreholes, provide a basis for evaluating the potential use of these measurements in identifying fracture systems and determining the genetic causes of their formation [20].
To achieve this goal, a comparative analysis was performed on RQD measurements from boreholes and underground workings within a specific geological region. The study determined the azimuth and dip angles of fracture planes, as well as the length and filling characteristics of fractures for each engineering–geological element of the rock mass. These results make it possible to correlate RQD values from engineering–geological boreholes with the spatial characteristics of fracture systems obtained from underground workings [21].
The theoretical framework for analyzing fractures in faults within a shear zone is based on a set of three mutually orthogonal fracture systems, where the primary and secondary systems form a classic pair of conjugate shear fractures (Riedel shears) [22]. Under near-surface conditions, the angle between them depends on the rock type and ranges between 30 and 70°. The third, additional extensional fracture system forms at greater depths under geostatic pressure and is oriented perpendicular to both the primary and secondary fracture systems, creating an approximately orthogonal triplet of fracture systems, as follows: primary–secondary–additional [23]. Fractures (Riedel shears) form within the shear zone at angles close to 30° relative to the shear direction, while fractures with angles of 75–85° to the shear direction develop during deformation in the process of fold formation, appearing subparallel to the shear plane.
This triplet paragenesis is most frequently observed within tectonic fault zones, as confirmed by our studies [24]. The superposition of multiple sets of fracture system triplets is associated with changes in the stress state of the rock mass and the formation of later faults or the simultaneous influence of multiple faulting events [25,26]. In our case, northeast-, sublatitudinal-, and submeridional-trending tectonic disturbances were formed almost simultaneously during the Ordovician geological period.
2. Materials and Methods
2.1. Geological Characteristics of the Deposit
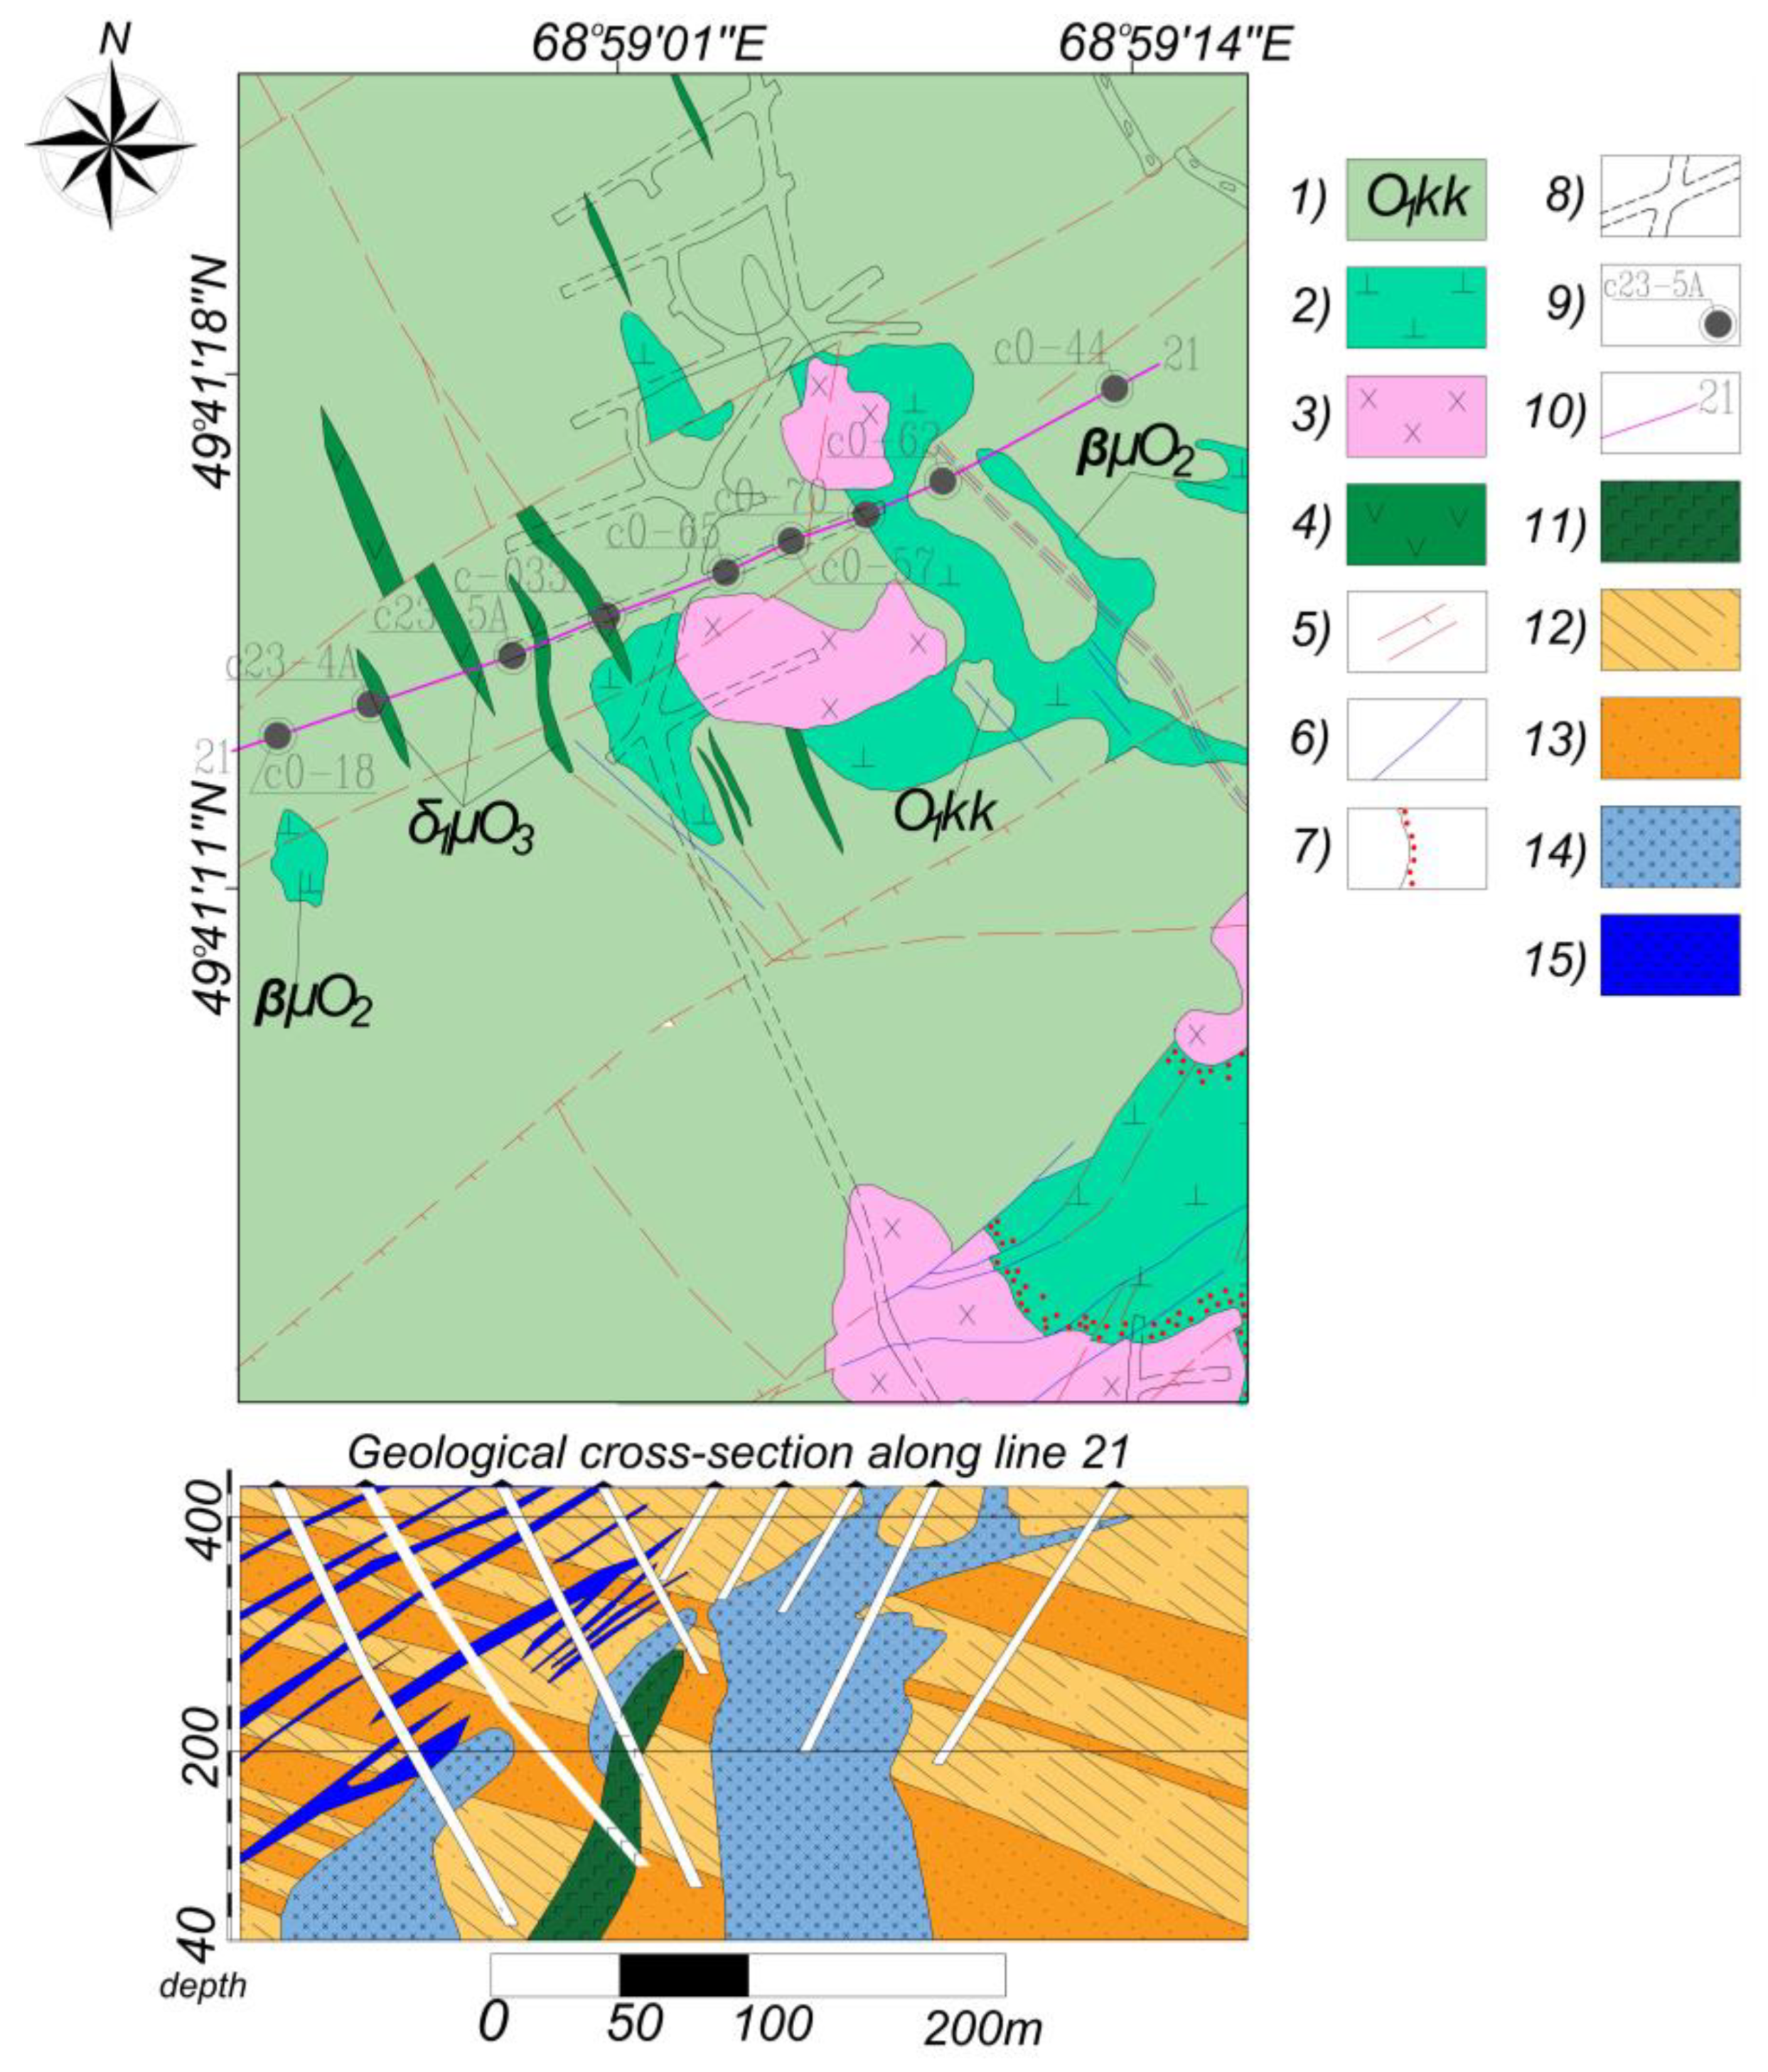
The Karasu gold deposit is confined to the southeastern flank of the Kirey horst-anticline. Its geological structure includes Cambrian- and Ordovician-aged rocks, which are intruded by granite and granodiorite intrusions of the Late Ordovician age (Figure 1).
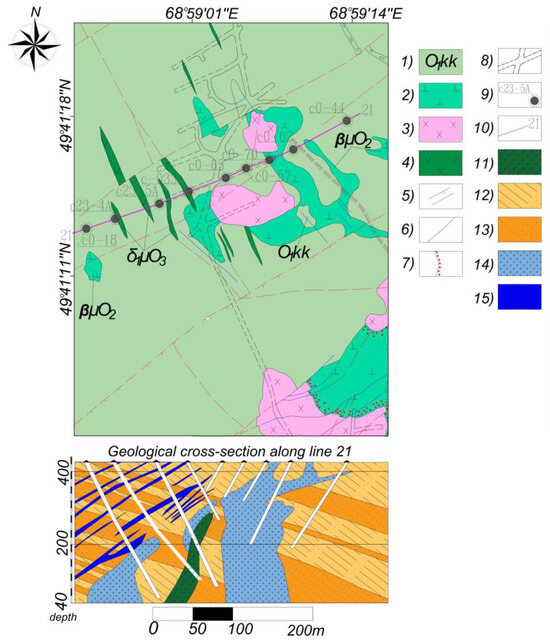
Figure 1.
Geological map and cross-section along line 21 of the Karasu deposit; (1) Lower to Middle Devonian deposits of the Kokdombak Formation—sandstones and siltstones with interlayers of conglomerates and gravelites; (2) basaltic, dioritic, and andesitic porphyrites of the subvolcanic facies; (3) diorites and quartz diorites; (4) dyke rocks of mafic and intermediate composition; (5) zones of quartzification and schistosity; (6) quartz veins and their structural elements; (7) hornfelsification; (8) underground mining excavation; (9) borehole; (10) profile 21; (11) EGE-2 Dolerites; (12) EGE-3 siltstones; (13) EGE-4 sandstones; (14) EGE-5 quartz diorites; and (15) EGE-6 diorite porphyrites.
The ores are of the vein-type gold-quartz moderately sulfide formation, dating back to the Upper Ordovician, and are associated with a sequence of terrigenous rocks, including argillites, siltstones, polymictic sandstones of various grain sizes, and interlayers of conglomerates. The terrigenous deposits exhibit a meridional strike and dip eastward at an angle ranging from 25° to 50°, reaching up to 80°.
The sedimentary rocks are intruded by subvolcanic bodies of basaltic and andesitic porphyrites, with sizes ranging from 20 × 30 m to 90 × 450 m. In their cross-section, these subvolcanic bodies display both discordant and concordant relationships with the sedimentary rocks and are tentatively assigned to the Middle Ordovician (Figure 2). The subvolcanic facies rocks include augite basalts and plagioclase andesitic porphyrites.
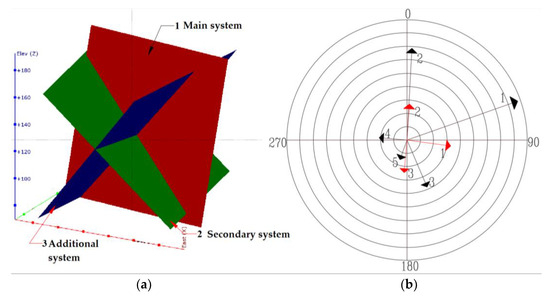
Figure 2.
(a) Fracture systems of the rock mass at the Karasu deposit based on 2936 measurements. (b) Vector diagram (red) represents triplets of fracture systems: 1—main, 2—secondary, and 3—additional. Black vectors (1–5) represent structural faults, characterizing the fracture system of Central Kazakhstan.
The outcrops of intrusive bodies on the surface range in size from 10 × 40 m to 150 × 320 m. At depths of 120–160 m, some stock-like bodies merge, forming the following three intrusive domains separated by faults: northern, central, and southeastern. These stock-like intrusive bodies are elongated in a submeridional direction. Their contacts dip steeply at 50–80° to the west and northwest.
The intrusive rocks in the northern and central areas are compositionally similar to diorites and gabbro-diorites. The diorites consist of 65–70% plagioclase, 25–30% hornblende, and up to 5% quartz. The gabbro-diorites are quartz-bearing hornblende–pyroxene rocks, often exhibiting a porphyritic texture. Occasionally, quartz diorites and gabbros are observed. In the southern area, quartz diorites are most prevalent.
2.2. Tectonic Features and Ore Mineralization
Gold mineralization is associated with Late Ordovician diorite and gabbro-diorite intrusions, which are confined to the intersections of tectonic faults with submeridional and northeastern orientations.
The deposit is characterized by widespread dyke-facies rocks, including microdiorites, dioritic porphyrites, dolerites, and, less commonly, spessartites and microgranites. Most of the dykes have undergone extensive hydrothermal alteration and are classified as pre-ore or syn-ore in age. The intrusive rocks and dykes exhibit similar compositions.
Pre-ore hydrothermal–metasomatic alterations are widespread and include chloritic subfacies and propylitic facies. The most intensely altered rocks are subvolcanic mafic rocks, diorites, gabbro-diorites, and dyke-facies dioritic porphyrites. Subvolcanic rocks have undergone albite–quartz–chlorite–carbonate metasomatism with leucoxene. The diorites and gabbro-diorites exhibit varying degrees of propylitization, while in the selvages of quartz veins, they have been altered to quartz–carbonate–chlorite–sericite metasomatites with pyrite. The dioritic porphyrites also show different degrees of propylitization, and in quartz veinlet zones, they have been transformed into quartz–chlorite–sericite–carbonate metasomatites with pyrite.
In the central area and partially on the southern flank of the deposit, albite alteration of the rock mass is intensively developed along zones of increased fracturing. Intrusive and adjacent sedimentary rocks, as well as quartz veins and veinlets, are significantly pyritized, appearing as fine-grained to densely disseminated inclusions, veinlets, and cross-cutting structures. These rocks do not contain significant gold concentrations. The host sedimentary and subvolcanic rocks in contact with the intrusions exhibit weak hornfelsification. The aureole of hornfelsed rocks in the footwall generally does not exceed a few meters. Contact metamorphism is more widespread in the superintrusive zone, where it can reach tens of meters in thickness. In sandstones and siltstones, andalusite–biotite–quartz hornfels are developed, while amphibole–plagioclase hornfels with magnetite are observed in subvolcanic rocks. At the deposit, especially in the central and southern areas, metasomatic quartzites are formed from quartz sandstones. In relation to the quartz-vein mineralization, they are considered as pre-ore formations.
Several disjunctive fault systems have been identified at the deposit, the most significant of which are steeply dipping faults with northeastern, near-latitudinal, and near-meridional orientations, with numerous smaller tectonic fractures and faults branching off in various directions. Most of these faults formed simultaneously with folding and the intrusion of igneous bodies. The steeply dipping faults of the northeastern and near-meridional orientations are long-lived structures that have been reactivated multiple times in later geological periods. They offset diorite-porphyry dykes and quartz veins by distances of 1–5 m and are represented by crushed and sheared rock zones, where lenses and fragments of ore-bearing quartz from displaced quartz veins are observed. The primary fault structures of the deposit, which caused vertical displacements with amplitudes of up to 150 m and segmented the deposit into separate blocks, are the northeastern faults, oriented along an azimuth of 50–60°.
Mineralization is controlled by small stock-like and dyke-like intrusive bodies of gabbro-dioritic and dioritic composition of the Upper Ordovician age. The contact morphology of the intrusions is irregular. The dyke series consists of dioritic porphyrites, which frequently fill long-lived, steeply dipping tectonic zones with northeastern and sublatitudinal orientations. In addition, thin dykes of microdiorites, microgranites, and aplites are present, sealing vein-adjacent fractures and even tectonic zones containing ore-bearing quartz veins.
2.3. Identification of Fracture Systems Based on the General Measurement Database
2.3.1. Methodology for Identifying Main Fracture Systems
A total of 2936 fracture measurements were conducted in borehole cores and underground mine workings. Typically, the number of measurements required to construct a stereonet diagram ranges from 100 to 150. In the case of single-system fracture networks with low orientation variability, fewer measurements may suffice. For more complex networks, this number may be increased to 200 [27]. Therefore, our sample is considered representative. Further processing of the results was carried out using Leapfrog Geo and Dips Rocscience software. This software was selected due to its widespread use in the mining industry, ease of use, and extensive functionality.
Based on the measurement results, three main fracture systems were identified (Figure 2, Table 1). A comparison was also made between these main fracture systems and the most characteristic systems typical for deposits in central Kazakhstan [24].

Table 1.
Characteristics of the main fracture systems for the entire rock mass of the Karasu deposit.
The position of the main fracture systems of the Karasu deposit rock mass, as shown on the vector diagram (Figure 2), indicates that the second and third fracture systems (Table 1) align with the submeridional fault, while the first system corresponds to the sublatitudinal fault, which was the primary cause of shear fracturing across all geological units of the rock mass. The influence of the northeastern fault was assessed based on 209 measurements, revealing its impact on the formation of a fracture system with an average orientation of 71.1/45° (azimuth/dip angle) for all lithological units of the rock mass.
The vector diagrams of the main fracture systems (Figure 2b) show a strong correlation with the principal fracture system values of rock masses in central Kazakhstan, suggesting that they were formed within a single geodynamic period during the global processes of Devonian volcanic–plutonic belt formation.
The methodology for identifying fracture systems is demonstrated using 1396 sandstone measurements (Figure 3a). Using the Leapfrog software, three main fracture systems (main_1, 2, 3) were identified (Figure 3b). Subsequently, by sequentially excluding the primary systems (S_2.1, 2.2, 2.3) (Figure 3c), subsystems and residual fracture systems (Other 1, 2, 3) were identified (Figure 3d). Their characteristics are presented in Table 2 and Figure 3.
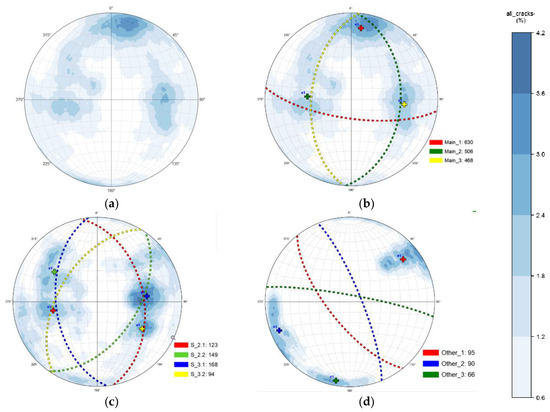
Figure 3.
(a) Results of 1396 measurements; (b) fracture systems after identifying the main systems (Main_1, 2, 3); (c) secondary fracture systems (S_2.1, S_2.2, S_3.1, S_3.2) obtained after excluding the main fracture systems; and (d) residual fracture systems (Other_1, 2, 3) obtained after excluding all main and secondary fracture systems.
Table 2.
Characteristics of fracture systems in sandstones.
A comparative analysis of the results identifying the main fracture systems for the entire rock mass (systems 1, 2, and 3 in Table 1) and for sandstones (systems 1, 2, and 3 in Table 2) confirms the similarity of characteristics and the validity of the assertion that there exists a primary fracture system common to all lithological units of the region.
2.3.2. Analysis of Possible Errors in Fracture Measurements
The analysis of the convergence of measurement results obtained using Clino was carried out through calibration with the RGK DQL-2A mining–geological compass. The accuracy of measurements performed with the compass is determined by its technical capabilities and is ±0.5°.
Every 50 measurements, a comparison was made between the Clino readings and the readings from the mining–geological compass. The results are presented in Table 3.
Table 3.
Results of error calculations in measuring fracture characteristics.
2.4. Methodology for Determining the Physical and Mechanical Properties of Rocks
2.4.1. Drilling and Core Sampling Methods
To identify engineering–geological elements and establish the relationship between fracturing and the physical and mechanical properties of rocks within the study area, the physical and mechanical properties of the rocks were examined in accordance with the regulatory documents of the Republic of Kazakhstan [28]. The study was based on core samples from the engineering–geological boreholes C-23-4a and C-23-5a. Drilling was carried out using a HQ diameter (96 mm) with a TDS-NR-89 double-tube core barrel within the planned boundaries of the open-pit mine. The borehole locations were selected to intersect the maximum possible number of structural heterogeneities in order to assess their impact on the stability of open-pit benches, as well as to include a number of exploration boreholes.
2.4.2. Identification of Engineering–Geological Elements
Based on borehole core obtained from drilling and underground workings, engineering–geological elements (EGEs) were identified. An EGE is a zone of soil or rock mass characterized by a set of consistent indicators, including genesis, age, composition, structure, condition, and geotechnical properties. The following engineering-geological elements (EGEs) were identified in the study area:
EGE-1. Weathering crust with an average thickness of 12 m, brown in color, moderately ferruginized and weakly limonitized. It consistsedof clayey, clayey-gravelly, and gravelly material with a clay matrix, containing grus and fragments of underlying rocks (Figure 4a).
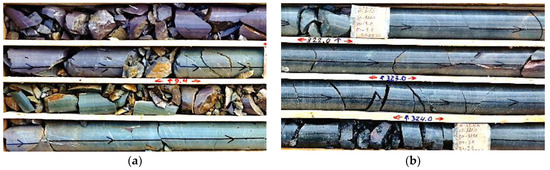
Figure 4.
Weathering crust (a) and dolerites (b).
EGE-2. Dolerites with an average thickness of 29 m, encountered at depths ranging from 145.0 to 339 m. These were black, dark gray, and greenish microcrystalline rocks with a massive texture. The groundmass exhibited a doleritic, prismatic granular, and micro-ophitic structure, composed of prismatic crystals of primary plagioclase, with interstitial spaces filled with pyroxene, which was almost completely replaced by epidote, chlorite, and carbonate. The rock contained quartz–carbonate veinlets ranging in width from fractions of a millimeter to 3–4 cm. Hematitization, K-feldspar alteration (potassic alteration), and chloritization were observed along fractures. The veinlet network had a randomly fibrous texture. Microfracturing was weakly developed and filled with quartz–carbonate mineral aggregates. Secondary alterations were minor and associated with chloritization and epidotization. The rock contained open fractures with iron oxides. Fracturing was moderate, consisting of a series of equiangular fractures of various orientations at angles of 30–40° and 20–80° to the core axis (Figure 4b).
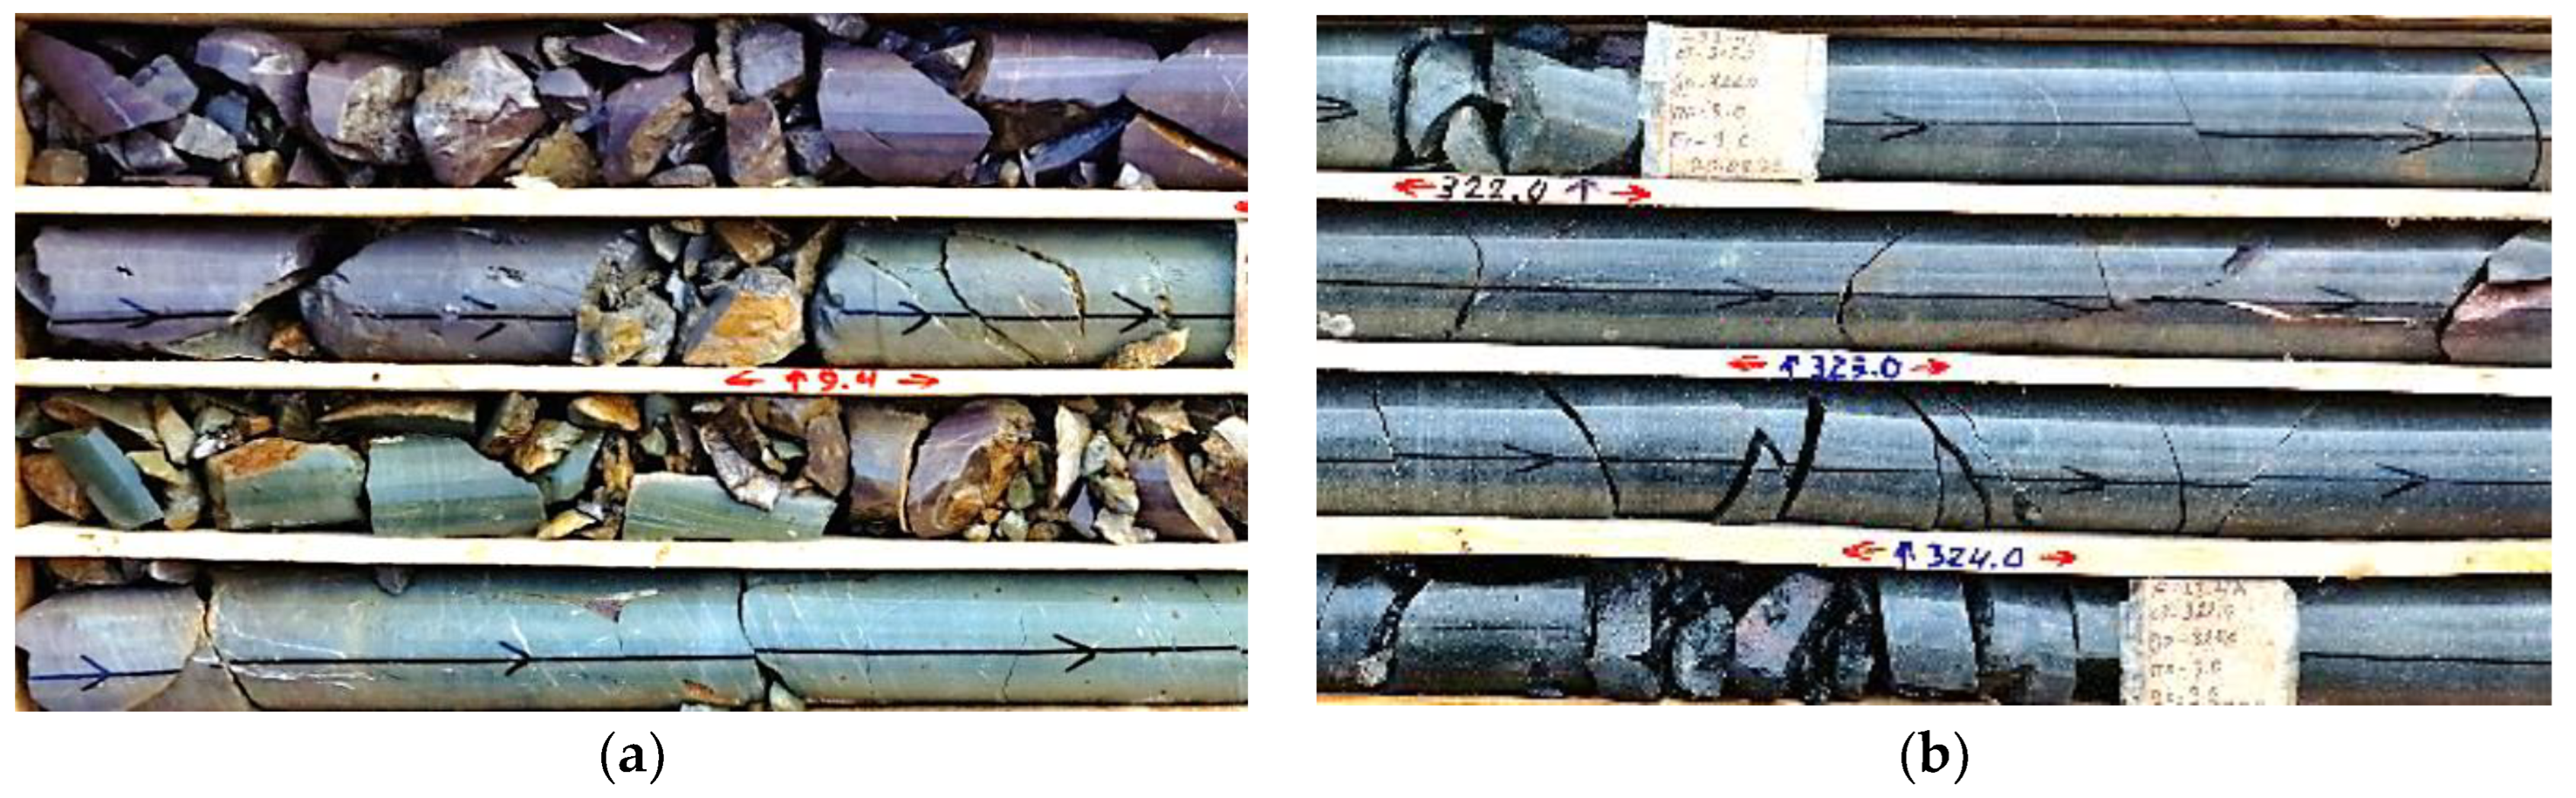
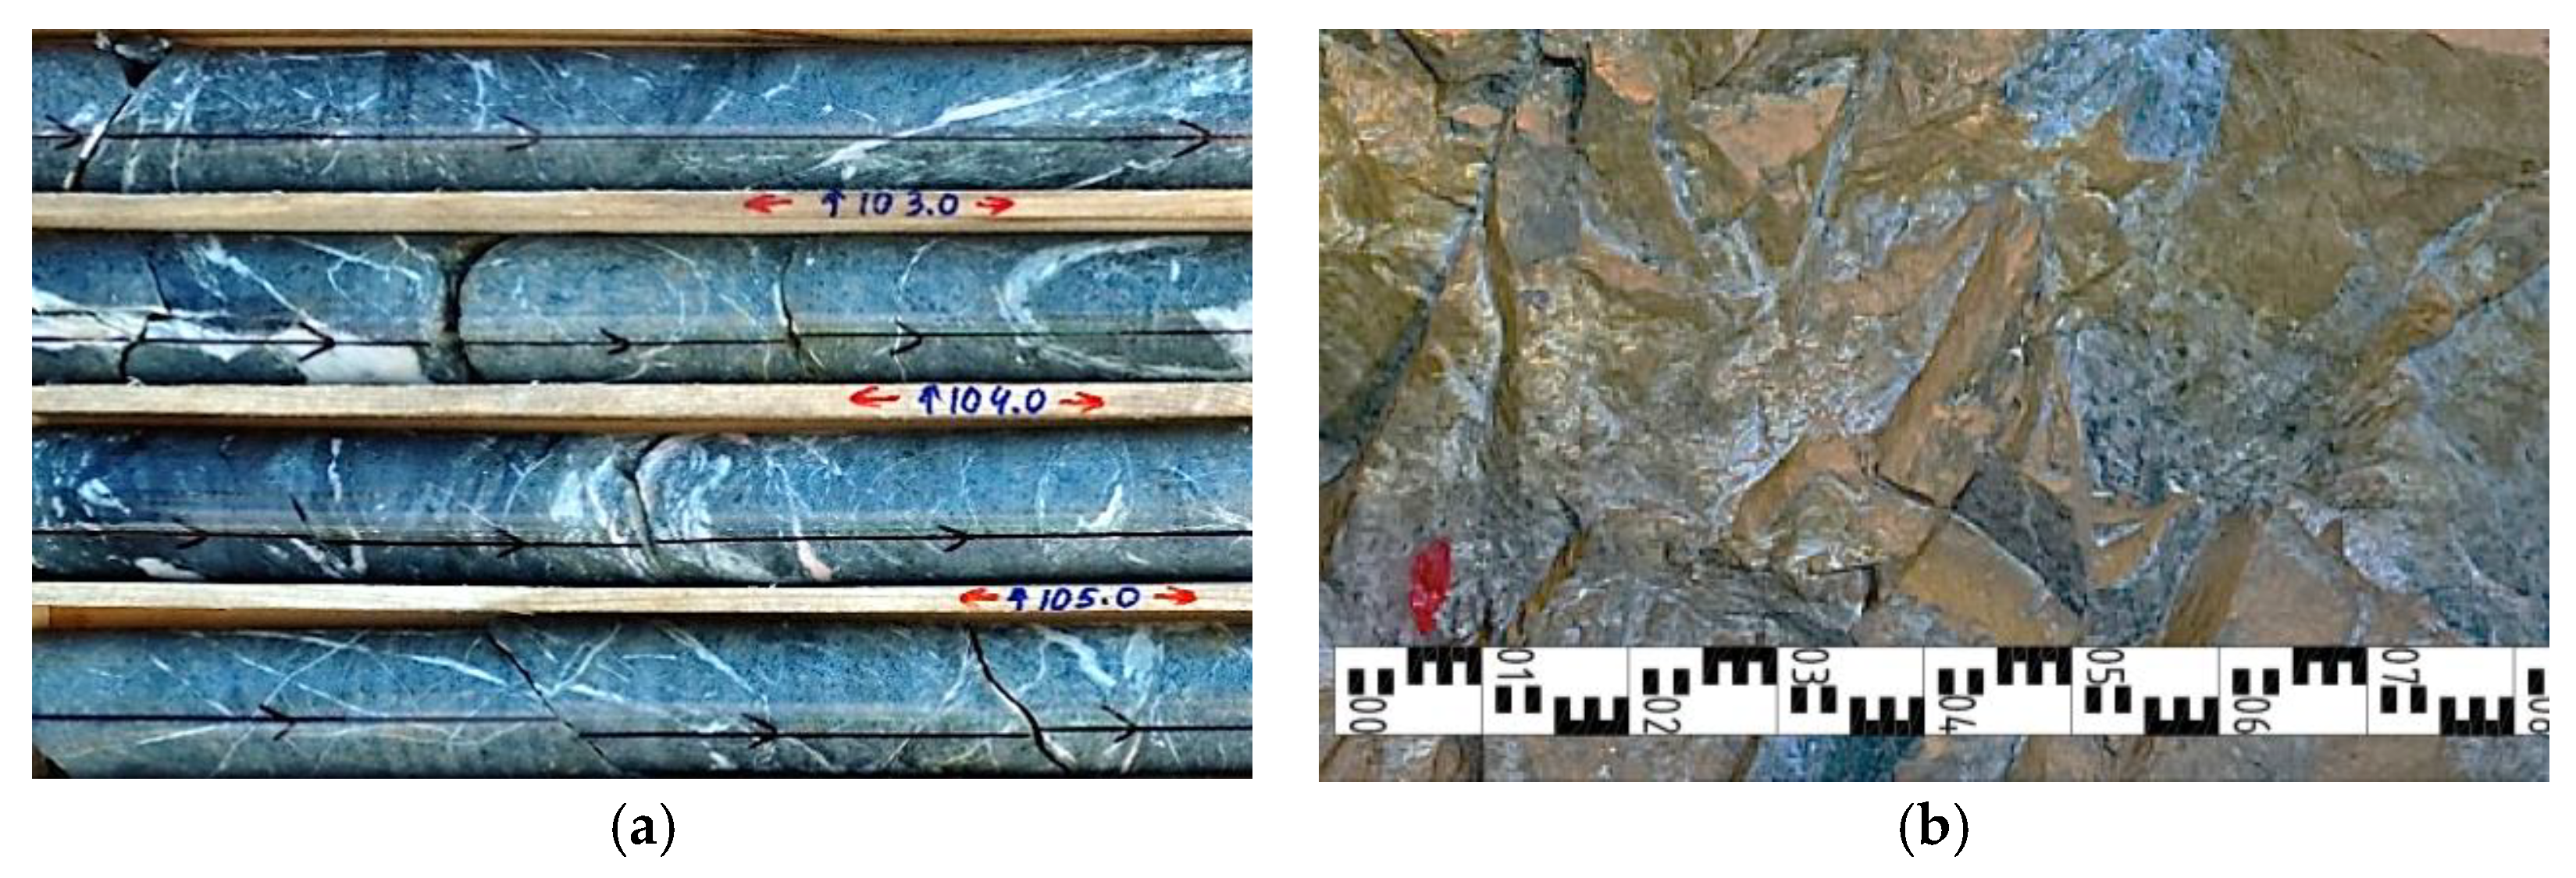
EGE-3. Siltstones (a-index in Table 3) had an average thickness of 16.2 m and were encountered at depths ranging from 1.5 to 350 m. These rocks were gray, burgundy-gray, and greenish-gray with parallel and cross-bedding, often containing quartz veinlets. The veinlets exhibited a randomly fibrous texture along microfractures, predominantly oriented at 40–70° to the core axis, and rarely at 15°, 20°, and 80° (Figure 5a,b).
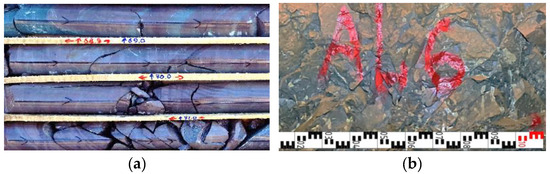
Figure 5.
Siltstones, (a) core and (b) wall of the underground working.
Siltstones were often silicified and hornfelsed, most intensely in zones alternating with magmatic rocks. This fracture series was associated with the northeastern and sublatitudinal tectonic fault zones, which they branched from, forming a moderate network of variably oriented fractures at angles of 20–30°, 45–55°, and 80–90°. The fractures were sealed with quartz–carbonate mineral aggregates.
Microfracturing was observed at 5–20 mm intervals. Quartz veinlets up to 5 mm thick were present at depths of 160–170 m, 240–243 m, and 255 m, while veinlets with thicknesses of 10–30 mm exhibited fracturing along their bedding planes. Some fracture systems cut through siltstones along flat surfaces, creating individual blocks ranging from 5 to 50 mm in size. The fracture network was equiangular, with smooth, planar fracture surfaces. The fracture openings reached up to 1 mm and were filled with clays and iron oxides.
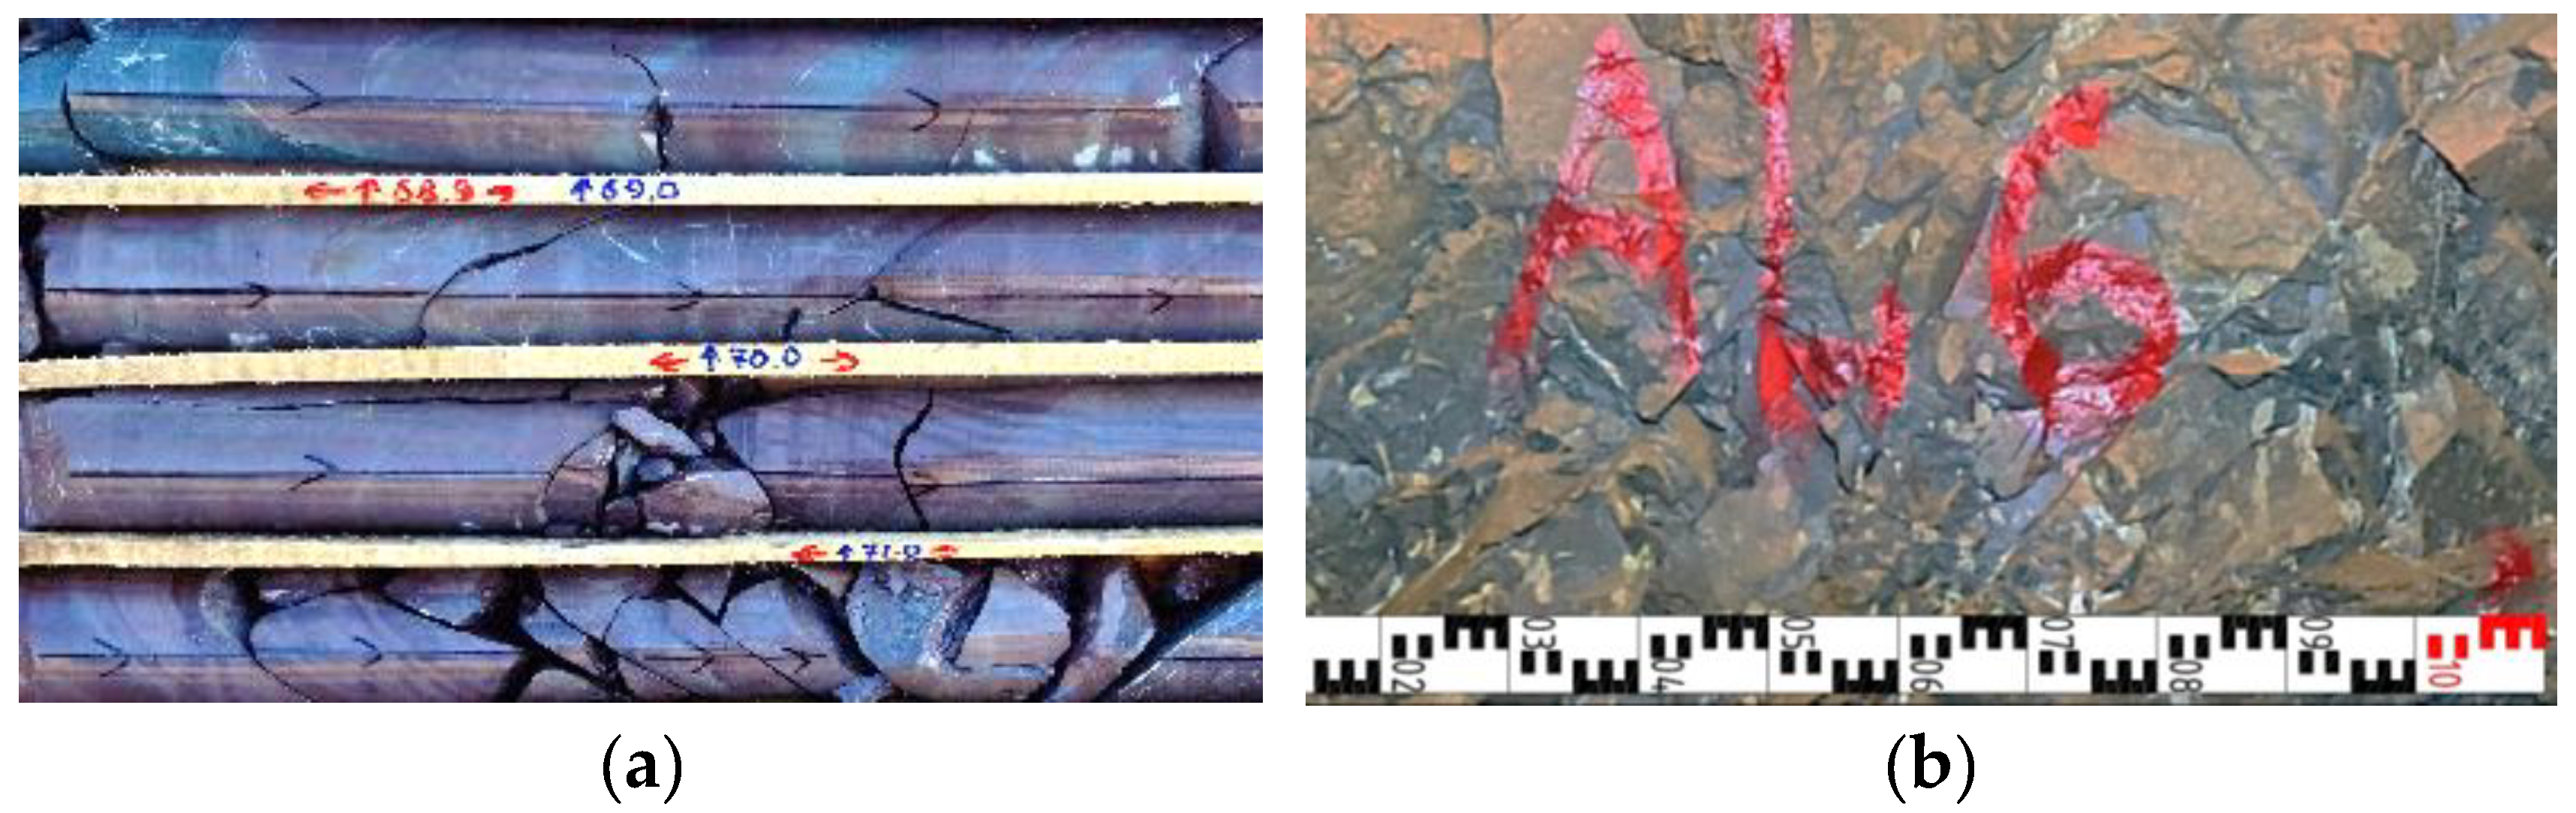
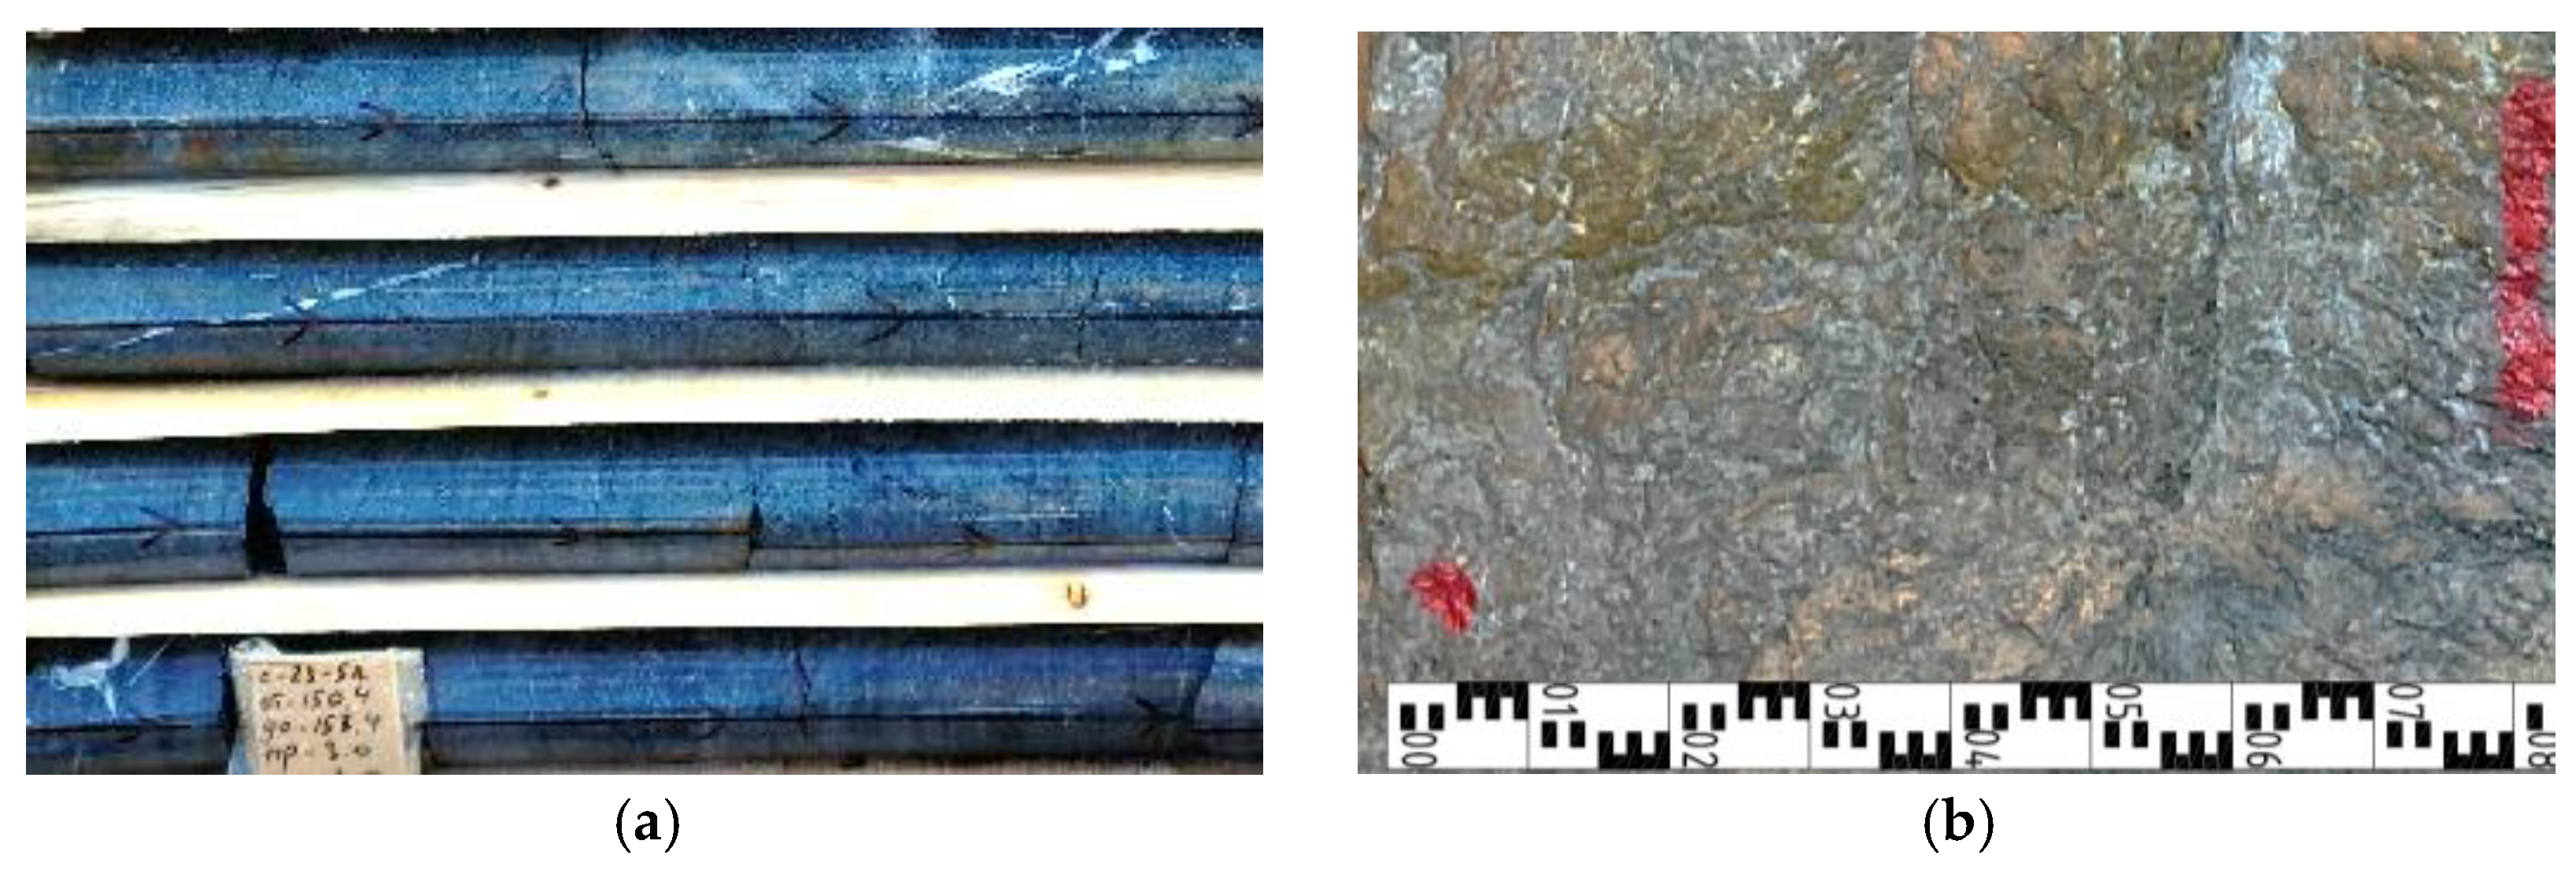
EGE-4. Sandstones (p) with an average thickness of 9.8 m were encountered at depths ranging from 2.5 to 345.1 m. These rocks were gray, dark gray, and greenish-gray and fine-grained, with parallel and cross-bedding, often containing interlayers of siltstones. The displacement of marker layers within the core was observed along a slip fracture sealed with a quartz aggregate.
Microfracturing was low and uneven, appearing as isolated clusters spaced 10–100 mm apart. The fractures were sealed with quartz–carbonate mineral aggregates, with a thickness of 1–5 mm, but open fractures were also present. Sulfide mineralization was observed along fractures and throughout the rock mass. Fracturing was moderate, with a series of variably oriented fractures at angles of 20–30°, 45–55°, and 80–90° (Figure 6).
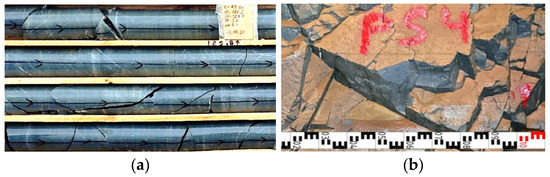
Figure 6.
Sandstones, (a) core and (b) wall of the underground working.
In borehole cores at a depth interval of 37.7–37.84 m, a tectonic fault was identified, characterized by a friction clay zone at an angle of 35° to the core axis.
Quartz–carbonate veinlets, with a thickness of up to 5 mm, were present throughout the core interval, while veinlets of 10–30 mm occurred at depths of 66–67 m, primarily at an angle of 70–80° to the core axis. Below 189 m, veinlets became less frequent, with a thickness of up to 5 mm, displaying varied orientations from 15° to 80°. This fracture system was responsible for block detachments. The fracture network was equiangular, with flat and rough fracture surfaces and open fractures up to 1 mm wide. Open fractures were filled with clays and iron oxides, whereas closed fractures contained quartz–carbonate mineral aggregates.
EGE-5. Quartz diorites (qd) (Figure 7) had an average thickness of 6.59 m and occurred at depths ranging from 49.3 to 280.9 m. They were gray to dark gray, medium- to coarse-crystalline, and porphyritic, with a massive and mottled texture. The rocks were replaced by secondary epidote.
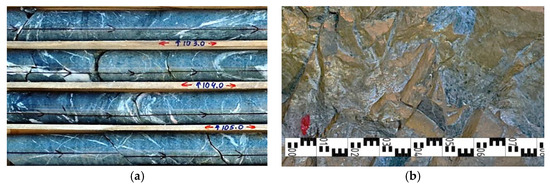
Figure 7.
Quartz diorites, (a) core and (b) wall of the underground working.
Quartz veinlets, ranging in thickness from 1 to 5 mm, were abundantly developed, spaced 10–100 mm apart, occurring both linearly oriented and as folded segregations, often with schlieren accumulations of sulfides. Pyrite occurred as disseminations and within the veinlets. Vein mineralization iwa moderate, consisting of quartz–carbonate and quartz–chlorite compositions, oriented at 20–30° and 50°. Fracturing was moderate, with a series of variably oriented fractures at angles of 20–30°, 45–55°, and 80–90°.
The quartz diorites along the walls of underground workings can be described as blocky failures, though less significant than in terrigenous rocks. The fractures were irregular and wavy, with rough surfaces and apertures up to 1 mm wide. The fractures were filled with clays, iron oxides, and quartz–carbonate mineral aggregates (Figure 7).
EGE-6. Diorite porphyrites (Figure 8) had an average thickness of 3.77 m and were encountered at depths ranging from 18.2 to 346.7 m. They were gray to light gray fine-crystalline porphyries composed mainly of plagioclase.

Figure 8.
Diorite porphyrites, (a) core and (b) wall of the underground working.
The rocks exhibited microfracturing with spacings of 10–50 mm, which were unevenly distributed, occurring both as linear features and as folded segregations with schlieren accumulations of sulfides. Larger fractures were sealed with quartz–carbonate mineral aggregates. Fracturing was moderate, with a series of variably oriented fractures, often containing xenoliths of diorites.
Up to a depth of 145 m, quartz–carbonate veinlets were primarily oriented at 30–50° and 70–80°. Below this depth, no predominant veinlet orientation was observed, with angles varying between 20 and 80°, forming groups at 20–40°, 50–70°, and 70–80°.
Diorite–porphyrites did not form distinct fracture systems, and individual blocks and detachments along fracture systems were not observed (Figure 8). The fractures were closed and filled with quartz–carbonate minerals.
Based on the study of the geological structure and rock fracturing, engineering–geological elements (EGEs) were identified, and fracture features were analyzed along the walls of an exploration excavation at the 120 meter level of the existing mine.
2.4.3. Determination of the Physical and Mechanical Properties of Rocks
The study of the physical and mechanical properties of rocks is one of the most important stages in the comprehensive investigation of a planned mineral extraction area, as the obtained results are used for the design and justification of excavation and mining technologies. In this study, these data were applied to calculate slope angles for the planned mine workings and to identify the relationship between fracturing and strength characteristics.
The determination of the strength properties in the rock core samples from engineering–geological boreholes was conducted in a certified laboratory of LLP “Centrgeolanalit”, Karaganda, in accordance with national standards. This laboratory was selected due to its proximity to the study area. The core samples had a minimum length of 20 cm, with a total volume of 3.5 m of core per test sample. Six composite samples were collected for each engineering–geological element (EGE).
A large number of studies have focused on the influence of fractures on the strength properties of rock masses. In this study, the methodology of IGD MGM USSR for fracture analysis—which is widely used by geologists in Kazakhstan—was applied. Research on fracture parameters, system identification, and their relationship with the rock mass was extensively conducted. This study presents a comparative analysis of the correlation between field observations and calculated data using the Dips Rocscience software.
3. Results
3.1. Establishing the Relationship Between Fracture Systems Identified for All EGEs and the Main Fracture Systems
Based on the methodology described in Section 2.3.1 (Fracture System Identification), the main (characteristic) fracture systems were identified for each engineering–geological element (EGE). This made it possible to establish how the engineering–geological elements were related to tectonic faults and how these faults influenced the development of fracture systems. In other words, typical fracture systems were determined for each EGE, followed by the identification of their correlation with the location and orientation of tectonic faults within the study area.
Table 4 presents the results of the siltstone (a) fracture system identification. Six fracture systems were identified from the total dataset of fracture measurements (Figure 5a, Table 3), as follows:
Table 4.
Comparison of fracture systems from the general dataset with fracture systems by geological elements and their relationship with tectonic faults.
System 1a—268°/53°, corresponding to General Fracture System No. 2 (264°/51°).
Systems 2a and 4a are combined into General Fracture System No. 3 (120°/46°).
System 5a corresponds to General Fracture System No. 4 (69°/45°).
System 3a is a narrower analog of General Fracture System No. 1 (180°/77°).
System 6a (150°/71°) closely aligns with General Fracture System No. 7 (148°/65°).
Table 4 presents the results of the sandstone (p) fracture system identification. System 1p (180°/81°) corresponds to Fracture System No. 1 (180°/77°). After its exclusion from the dataset, smaller fracture systems (2p, 7p, and 8p) emerge, with average values close to System No. 2 (264°/55°) of the general dataset.
Fracture system 4p (75°/51°) corresponds to System No. 4 (89°/45°) and is spatially similar to the northeastern fault (70°/68°), suggesting that it represents a proto-fracture system.
Fracture system 2p (221°/81°) also closely aligns with the northeastern fault characteristics and represents fractures oriented along the displacement direction near the fault zone (second-order Riedel shears), correlating with Fracture System No. 6 of the general dataset (Table 4).
The identified fracture system 6p (73°/80°) corresponds to System No. 8 (79°/76°) and the quartz diorite fracture system 4qd (82°/89°), which most likely indicates their simultaneous formation during tectonic reactivation.
From the general fracture system of quartz diorites (qd), system 1qd (175°/66°) coincides with the main fracture system of the entire rock mass (180°/77°). The same applies to system 3qd (269°/52°), which corresponds to the secondary Fracture System No. 2 (264°/51°) of the general dataset.
The overall conclusion from the fracture analysis results is that the formation of the tectonic Fracture Systems No. 1 (180°/77°)—main, No. 2 (264°/51°)—secondary, and No. 3 (120°/46°)—additional is controlled by the following orthogonal faults: the submeridional fault (3°/60°) and sublatitudinal fault (276°/51°). Additionally, the supplementary extensional fracture system is caused by static pressure from faulting.
This triplet of fracture systems is significantly complicated by the superposition of a second triplet of tectonic fractures, which formed due to the subsequent development of the northeastern fault. This fault resulted in the displacement of already existing intrusions and contacts, affecting almost all lithological units near the fault. The overlapping of these two fracture triplets created a complex fracture system, from which the primary shear tectonic System No. 4 (69°/65°) can be distinguished. It is observed in the following three EGE units: siltstones (79°/45°), sandstones (71°/54°), and quartz diorites (64°/33°).
The associated fracture system is identified in the general dataset as No. 8 (79°/76°), and in sandstones (73°/80°) and quartz diorites (82°/89°). The secondary fracture system is represented in the general dataset as No. 13 (176°/51°) and in sandstones (174°/54°). The additional system is characterized by Fracture System No. 6 (218°/84°) and fractures in sandstones (221°/81°).
The identified fracture systems from the general dataset include the following characteristics: No. 9 (199°/40°, 65 measurements); No. 10 (46°/75°, 62 measurements); No. 11 (92°/54°, 60 measurements); No. 14 (36°/36°, 38 measurements); No. 15 (75°/19°, 31 measurements); No. 16 (311°/67°, 30 measurements); No. 17 (310°/44°, 27 measurements); and No. 19 (155°/41°, 25 measurements), where No.—fracture system number (A/α—azimuth of strike/dip angle, number of measurements). These belong to complexly oriented fractures near tectonic faults, as well as random weathering fractures, gravitational fractures (surface deformation fractures), and fractures associated with metasomatic alterations.
Surface deformations (solar–lunar tidal forces) can reach up to 18 cm in vertical displacement and 30 cm in horizontal displacement, with their intensity increasing by up to 20% near tectonic faults. Their common characteristic is a high degree of microfracturing.
All fractures, except for bedding fractures, are relatively short. In dolerites, quartz dolerites, and diorite porphyries, they are filled with quartz–carbonate minerals, chlorites, and iron oxides. In terrigenous rocks (siltstones and sandstones), fractures also contain iron oxides (ilmenite and hydrogoethite), sulfide minerals (pyrite and chalcopyrite), and clays (products of weathering of underlying rocks).
The identified fracture systems belong partially to second-order fractures, with lengths ranging from 0.5 to 5.0 m and widths ranging from several millimeters to several centimeters. The majority of fractures belong to the third-order fractures, with lengths not exceeding 0.5 m and widths of 0.2 mm [29]. These fractures play a key role in the formation of primary blocks in the planned open-pit mine.
By comparing the characteristics of the main fracture systems and their spatial similarities, it can be concluded that faults influenced the formation of the triplet fracture system (Table 4) across all EGE units, providing evidence that these fractures should be classified as proto-fractures, meaning they were formed during ancient crustal movements as primary shear fractures.
The triplet fracture system, which includes Systems No. 4, No. 13, and No. 6 from the general dataset, also represents a tectonic shear fracture system, which overprints the first triplet system due to the later influence of a near-meridional fault (Late Ordovician), in contrast to the northeastern and sublatitudinal faults (Cambrian–Early Ordovician).
Based on the proximity of the parameters of the identified fracture systems (angle and azimuth of dip) for three engineering–geological elements (EGEs) (aleurolites, sandstones, and quartz diorites) to tectonic faults (Table 2) in the deposit area, a connection is shown between the stresses they create with the primary, secondary, and additional tectonic fracture systems in each EGE, which confirms the influence of tectonic stresses on the development of fracture systems.
3.2. Results of Determining the Physical and Mechanical Properties of Rocks for Assessing the Stability Parameters of Open-Pit Slopes and Underground Excavations
The results of the study on the physical and mechanical properties of the Karasu deposit rocks, categorized by engineering–geological elements (EGE) and analyzed using Student’s t-test, are presented in Table 5.
Table 5.
Physical and mechanical characteristics of rocks in the engineering–geological section of the Karasu deposit.
Based on the obtained laboratory data (Table 5), the following conclusions can be drawn:
- -
- The highest compressive strength is observed in sandstones (96.60 MPa), indicating a high mechanical reliability and low fracturing.
- -
- Siltstones and diorites show similar strength values (approximately 95–96 MPa), suggesting relatively stable conditions within these rock masses.
- -
- Quartz diorites (81.72 MPa) exhibit a comparatively lower strength, which may indicate greater fracturing and a reduced slope stability in this rock type.
- -
- Porosity is higher in siltstones and sandstones (0.97%), indicating greater permeability and the need to consider hydrogeological conditions during design.
- -
- Poisson’s ratio is approximately the same across all rock types (0.21–0.23), suggesting similar deformation behavior of the rock mass.
However, it should be noted that these are laboratory data reflecting the properties of individual samples rather than the rock mass as a whole. The study of fracturing is essential for developing rock strength certificates and converting sample characteristics into parameters applicable to the rock mass.
3.3. Evaluation of the Geological Index of Rock Strength Certificates Based on Borehole Core from Geological Profile 21
The geological strength index (GSI) of rocks from engineering–geological boreholes was calculated by borehole run based on RQD values within each engineering–geological element (EGE) and averaged over the interval length (Table 6).
Table 6.
Calculation of RQD/GSI values at the Karasu deposit.
Rock fracturing in the section is highly variable, with alternating zones of moderate, strong, and extremely strong fracturing. Zones of intensely fragmented, gravel-like rock have an average thickness of 0.5–1 m.
For EGE-3 (siltstones) and EGE-4 (sandstones), the fracture aperture reaches up to 5 mm, and fractures are filled with weak rock material.
For EGE-2 (diorites), EGE-4 (sandstones), and EGE-6 (diorite porphyrites), the fracture aperture is 1 mm. Fractures have a smooth surface in EGE-3 (siltstones) and a rough surface in EGE-4 (sandstones), or they are filled with weak rock material.
A comparison of the RQD values from underground workings and boreholes shows convergence, although the values from boreholes are slightly overestimated by 2–4%. This is explained by the fact that some mechanical fractures formed during drilling were classified as natural fractures, due to the difficulty in distinguishing them from mechanical fractures. The applied principle was that if there is uncertainty about the origin of a fracture, it should be classified as natural.
The strength characteristics of the rock mass were obtained by constructing rock strength certificates for a slope height of 400 m (Table 7).
Table 7.
Rock strength certificates for a slope height of 400 m.
The rock property values presented in Table 5 are significantly higher than those of the actual rock mass (Table 7) due to structural weakening and fracturing. This highlights the necessity of conducting field-based engineering–geological investigations and calculations for the design of stable mining structures.
3.4. Evaluation of the Blockiness of the Rock Mass
One of the most important parameters affecting the stability of a rock mass is its blockiness—the size and shape of individual blocks formed by the intersection of natural fractures and structural discontinuities. Blockiness directly influences slope stability and determines the choice of design solutions for deposit development.
In the present study, the blockiness of the rock mass was evaluated using the Rock Quality Designation (RQD) index, which indicates the percentage of intact core pieces longer than 10 cm obtained during drilling.
Additionally, Table 8 includes values for the linear fracture intensity coefficient (Jt), which is calculated as the number of fractures per meter in the direction perpendicular to the fracture plane. This coefficient is used to estimate the reduction in the elastic modulus of rocks, comparing the modulus in monolithic rock (E0) and that in fractured rock mass.
Table 8.
Classification of fracturing and blockiness of the rock mass.
Based on the RQD values of the rocks and the developed classification (Table 8), the size of the fragments in the rock mass of the Karasu deposit was evaluated (Table 9).
Table 9.
Rock mass characteristics by fracturing degree, block parameters.
The blockiness calculation results (Table 8) show that different engineering–geological elements are characterized by significantly varying block sizes.
Thus, the use of Table 8 allows for an estimation of the average size of fragments in cases where the RQD methodology cannot be applied (e.g., for core pieces less than 10 cm long or in highly fractured and extremely fractured rocks).
For example, the elastic modulus (Et) under uniaxial tension (Brazilian test method) for dolerites and sandstones is 4.15 GPa and 0.13 GPa, respectively. In our case, the average RQD value for dolerites (EGE-2) is 63%. Based on Table 8, the value of It is 7, resulting in an elastic modulus of 0.92 GPa for fractured dolerites. For sandstones with an RQD (EGE-4) of 47%, at Et = 0.13 GPa and It = 10, the Et is calculated as 0.02 GPa. The average size of fragments for dolerites is 80 mm, and for sandstones is 50 mm.
For EGE-3 and EGE-6 (siltstones and porphyrites), the resulting characteristics will differ insignificantly due to the similarity of their average RQD values.
The convergence of results with experimental studies supports the use of the RQD-based methodology for estimating the strength characteristics in rock masses.
Analysis of Errors in RQD Value Calculation
One of the potential sources of measurement errors during research is the inaccuracy in determining the RQD index. The error may be due to the occurrence of technogenic fracturing that arises during drilling. The conducted analysis comparing the RQD index for core material from exploration wells drilled using standard technology showed that these errors were insignificant (less than 2% of RQD determinations), which was taken into account by the large number of determinations for each engineering–geological element (EGE). Sample selection and the measurement of angles were carried out in strict accordance with the RQD research methodology and systems of fractures in the mining work.
3.5. Determination of Parameters for Stable Quarry Slope
The calculations for determining the parameters of a stable quarry slope at the Karasu deposit (height and slope angle for a given safety factor) were performed using the Rocscience software suite. Based on the data from the table, a model of the rock mass was created. The calculations were carried out using the limit equilibrium method with the specified safety factor parameters (for the quarry bench—1.3, for the slope—1.5).
In the slope model, a specific angle of inclination was set, and the safety factor was calculated. If the calculated safety factor exceeded 1.3 for the bench and 1.5 for the slopes, the angle was reduced; if it was lower, the angle was increased until the calculated factors matched the set values. The calculated safety factors were obtained for each individual EGE at slope heights of 5, 10, 15, and 25 m to evaluate the slope angle and the preliminary overall bench angle of the quarry for a quarry height of 400 m (Table 10).
Table 10.
Results of slope angle calculations.
When calculating the slope angle for the benches, the possibility of groundwater and rock saturation was taken into account. For the purpose of modeling the quarry benches along the cross-section (profile 21), the cross-section areas not included in the calculations were expanded to the west and east, as well as to a depth of up to 100 m. Additionally, geological features of the cross-section were extrapolated in the specified directions.
The analysis of slope stability at heights of 5, 10, 15, and 25 m (Table 10) showed that the most unstable rocks were those in EGE-1 (weathering crust). The rocky formations in EGE-2 and EGE-5 (dolomites and quartz diorites) demonstrated the highest stability, maintaining this high stability at slope heights of up to 15 m, with safety factors ranging from 1.6 to 4. The rocky formations in EGE-4 and EGE-6 (sandstones and diorite porphyrites) showed a lower stability, but still maintained a high stability at slope heights of up to 5 m, with safety factors between 2 and 2.2. The slope angle of these engineering–geological elements was determined by their surface degradation during blasting operations and the possible occurrence of rockfalls on weak surfaces of the benches during quarry operation.
The slope angle is also influenced by the orientation of fracture systems relative to the plane of the bench, which leads to processes such as overturning, sliding, and wedge sliding of the rocks. Rocky formations in EGE-3 (siltstones) showed the lowest stability during modeling. At slope heights of up to 5 m, the stability must be compensated by a slope angle of 88°.
Modeling the bench and slope angles revealed that the water table (with a groundwater level of 5 m) had a significant effect on the safety factor of the surrounding rock formations. This resulted in a reduction in the allowable slope angles for dispersive soils by approximately half and for rocky formations in the range of 20–30%.
The engineering–geological cross-section of the deposit was complex in structure and had variability in the composition and thickness of the rocks. At profile 21, there was a series of steeply dipping dykes with a north–northwest strike, complicating the stability of the quarry bench with a slope to the west–southwest. The same applied to the alternation of lithological differences (sandstones and siltstones) in the cross-strike of the dykes, with a slope to the east–northeast. To study and model the stability, these geological situations were considered with the direction of the quarry bench towards the dip of the diorite porphyrite dykes and along the strike of the terrigenous rocks.
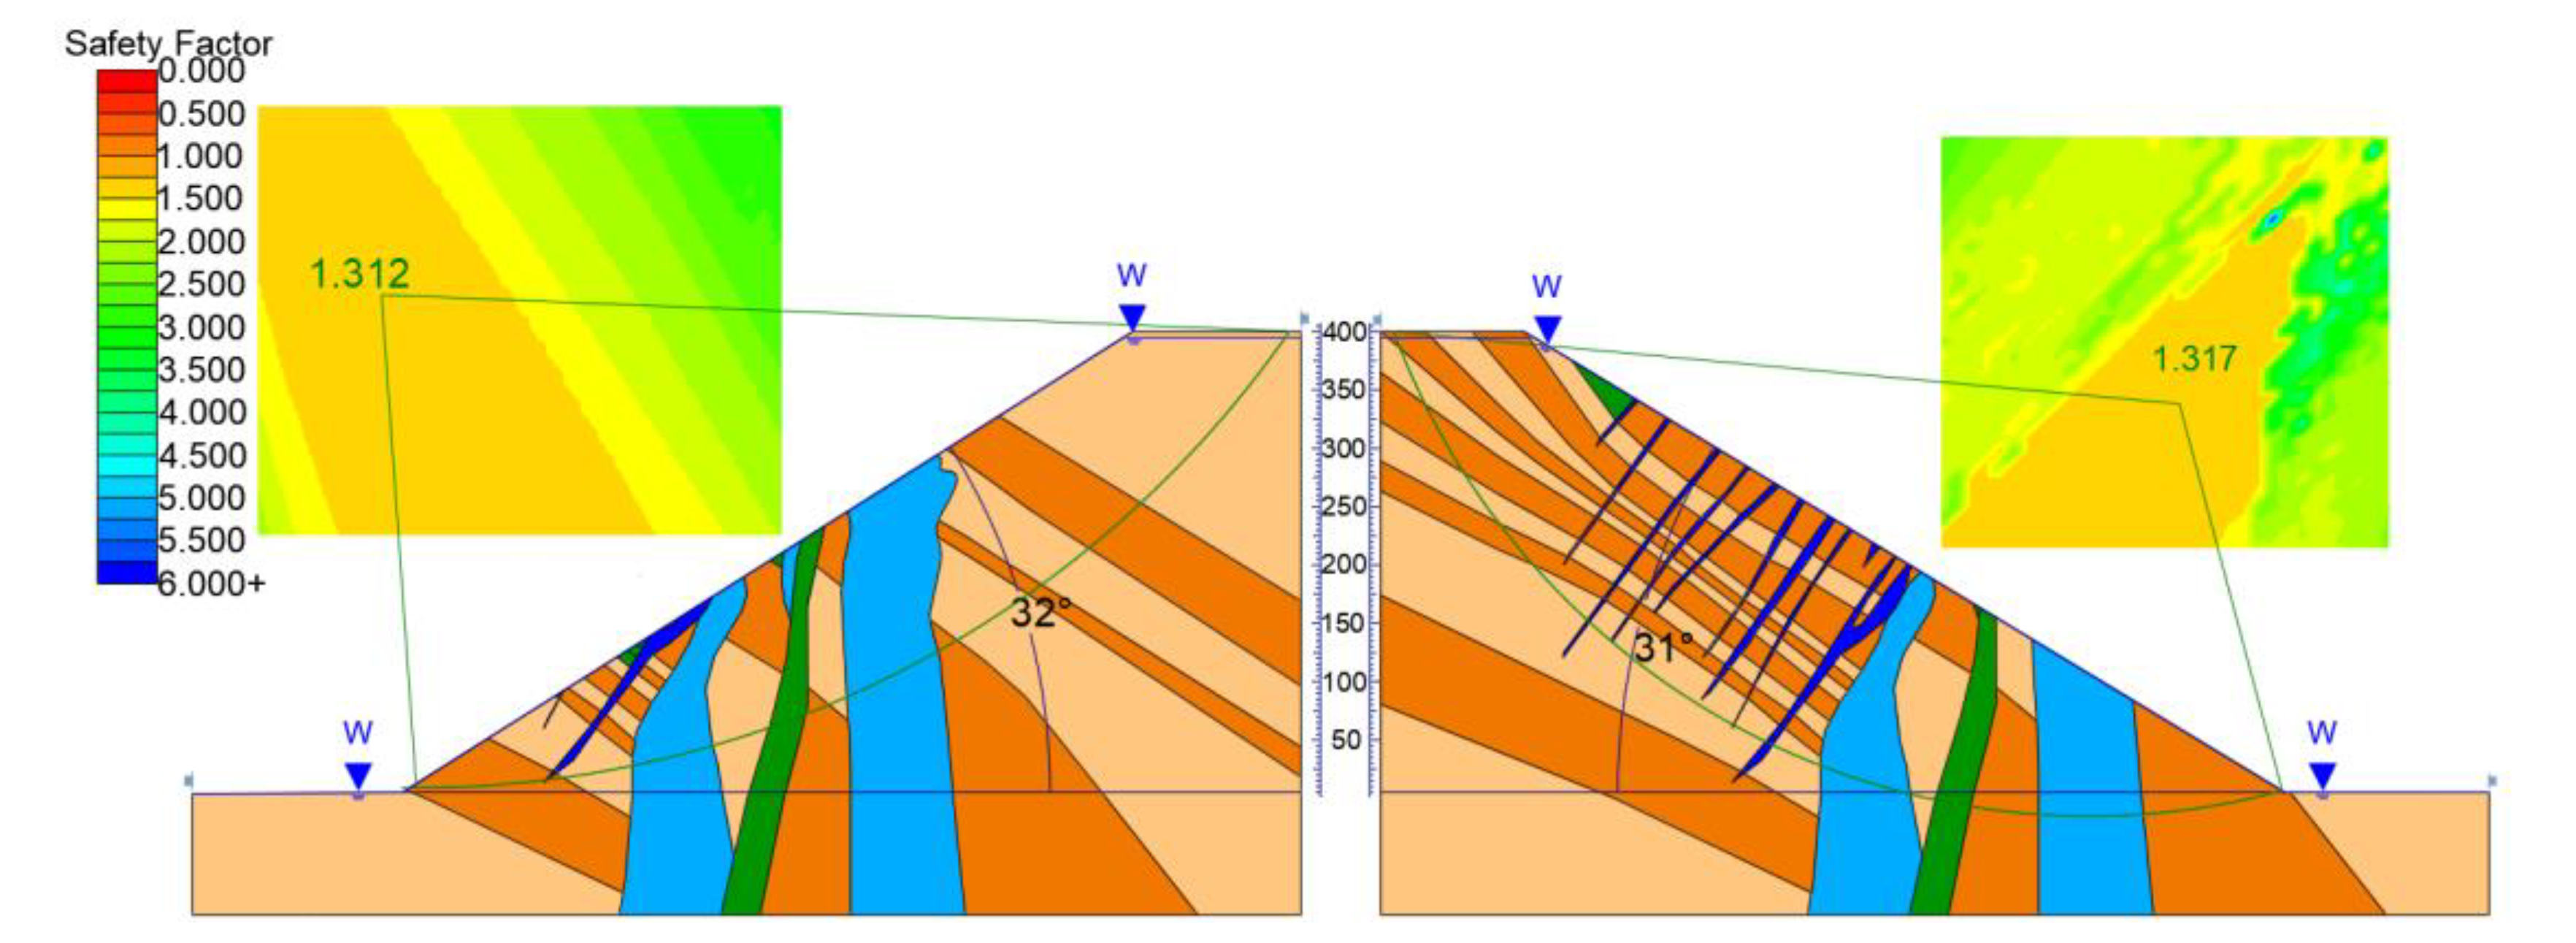
Let us consider the stability of the quarry bench for the section of the profile with alternating inclined subparallel dykes of diorite porphyries (Figure 9). For a quarry slope directed west–southwest, the stability calculation, using the limit equilibrium method, showed that, to compensate for the stability of the rocks, the bench angle should be 32°. For the section of the geological cross-section with alternating lithological differences (Figure 10), the quarry benches with a slope to the east–northeast required the bench angle to be 31° to compensate for the stability of the rocks, using the same safety factor.
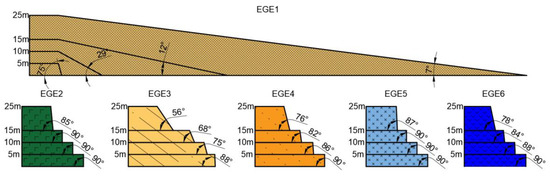
Figure 9.
Slope angles depending on height.
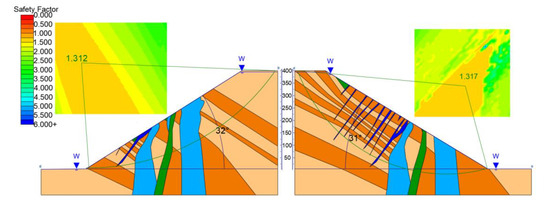
Figure 10.
Calculation of the overall slope angle of the quarry considering the safety factor.
The geological structure of the quarry area affects its characteristics. The key factors influencing the stability of the quarry bench are the physical and mechanical properties of the rock mass, as well as the geological structure of the cross-section of the area where the quarry is planned to be built and operated.
4. Conclusions
Engineering–geological elements were identified, based on which fracturing measurements were taken from borehole cores and underground working walls. A reliable connection between the measurements was established, which provided the basis for identifying the fracture systems of the rock mass. The relationship between the main, secondary, and additional fracture systems and the stresses induced by the action of faults was determined.
The physical properties of the rock samples and the rock mass were defined. Based on the developed classification of rocks by blockiness, the relationship between the rock quality index and the degree of fracturing, as well as the average size of fragments and their content in the mass and in each engineering–geological element, were established.
The relationship between the calculated slope angles of the quarry and the physical characteristics of the rocks and the geological structure of the cross-section was demonstrated.
The combined use of a large number of RQD measurements from borehole cores at all stages of exploration with fracturing measurements along the walls of the underground workings was justified.
The calculations in the Rocscience software suite for the quarry benches were performed with the aim of calculating the preliminary overall slope angle of the quarry with a given safety factor of 1.3. The physical and mechanical parameters of the rocks in the software were input based on the geological features and the geological strength index for each section, with data taken from Table 8, Table 9 and Table 10. The groundwater level in the software was set based on historical data, with a level of 5 m.
The dynamics of fracture system development in the considered rock mass during the exploration stage were associated with the influence of gravitational deformations (solar–lunar attractions), which were manifested near tectonic faults. It was shown that a common characteristic was micro-fracturing. The nature of its distribution is described in Section 2.3 (page 14) when describing EGEs (engineering–geological elements). The authors are aware of studies [30] on the discrete model of crack propagation under various stress conditions. In the considered work, an assessment of the physico-mechanical properties of the rock mass was conducted at the stage of substantiating the calculated parameters of the quarry. This analysis will become the next step when there are design parameters for the quarry—at the stage of operational exploration.
The results obtained can be used in studying the relationship between fracture systems and the physico-mechanical properties of rock masses in geologically similar gold ore deposits, as well as in studying other types of ore deposits (iron, polymetallic, etc.). At the exploration stage, the dynamics of fracture system development are associated with the influence of gravitational deformations (solar–lunar attractions), which are most intensely manifested near tectonic breaks. A common characteristic of rock masses is micro-fracturing, caused by the aforementioned factors, which is confirmed by the results of other authors who studied the discrete model of crack propagation under various stress conditions. The conducted comparative analysis of the physico-mechanical properties and fracture parameters confirms the significant influence of tectonic stresses on the formation of the main fracture systems of the rock mass.
Author Contributions
Conceptualization and methodology—V.P. (Vasiliy Portov), S.V. and T.K.; software, investigation, and data curation—V.M.; supervision, visualization, and project administration—V.P. (Vitaliy Puchkov), G.R. and G.D.; data curation, software, resources—N.A. All authors have read and agreed to the published version of the manuscript.
Funding
This research received no external funding.
Data Availability Statement
Restrictions apply to the availability of these data. The data were obtained from LLP “Geomarksheider” and LLP “Saryarka Altyn” and are available from the corresponding author with the permission of LLP “Geomarksheider” and LLP “Saryarka Altyn”.
Acknowledgments
The authors express their gratitude to LLP “Geomarksheider” for providing the initial data and for their assistance in conducting the investigations.
Conflicts of Interest
The authors declare no conflicts of interest.
References
- Burzunova, Y.P. Rock fractures near faults: Specific features of structural-paragenetic analysis. Geodyn. Tectonophys. 2017, 8, 673–693. [Google Scholar] [CrossRef]
- Seminsky, K.Z.; Cheremnykh, A.V. Jointing patterns and stress tensors in Cenozoic sediments of the Baikal rift: Development of the structural-genetic approach. Russ. Geol. Geophys. 2011, 52, 353–367. [Google Scholar] [CrossRef]
- Ramsey, J.M.; Chester, F.M. Hybrid fracture and the transition from extension fracture to shear fracture. Nature 2004, 428, 63–66. [Google Scholar] [CrossRef]
- Roman, A.T.; Portnov, V.S.; Askarova, N.S. Tectonic peculiarities of the Zhailma structure formation. Nauk. Visnyk Natsionalnoho Hirnychoho Universytetu 2022, 3, 11–16. [Google Scholar] [CrossRef]
- Bieniawski, Z.T. Engineering Rock Mass Classification; Wiley: New York, NY, USA, 1989; 251p. [Google Scholar]
- Laubscher, D.H. A geomechanics classification system for the rating of rock mass in mine design. J. Sth. Afr. Inst. Min. Met. 1990, 90, 257–273. [Google Scholar]
- Kuzmin, E.V.; Uzbekova, A.P. Rating classifications of rock masses: Application, creation, development. GIA 2004, 4, 201–202. [Google Scholar]
- Rahnama, M.; Gloaguen, R. TecLines: A MATLAB-Based toolbox for tectonic lineament analysis from satellite images and DEMs. Remote Sens. 2014, 6, 5938–5958. [Google Scholar] [CrossRef]
- Naved, M.; Devi, V.A.; Gaur, L.; Elngar, A.A. IoT-Enabled Convolutional Neural Networks Techniques and Applications; River Publishers: New York, NY, USA, 2023; 409p. [Google Scholar] [CrossRef]
- Gorbunova, N.; Mirkushov, O. Determination of the State of Rock Mass by the Mathematical Modeling Method. IOP Conf. Ser. Earth Environ. Sci. 2021, 720, 012088. [Google Scholar]
- International science and technology conference “Earth science”. IOP Conf. Ser. Earth Environ. Sci. 2021, 720, 012088. [CrossRef]
- Horibe, T.; Kobayashi, R. Physical properties of coal-measures rocks under triaxial pressure. J. Min. Soc. Jpn. 1958, 74, 142–146. [Google Scholar]
- Paterson, M.S. A high-pressure, high-temperature apparatus for rock deformation. Intern. J. Rock Mech. Min. Sci. 1970, 7, 517–526. [Google Scholar]
- Zhang, H.; Li, C.C. Effects of confining stress on the post-peak behavior and fracture angle of Fauske Marble and Iddefjord Granite. Rock Mech. Rock Eng. 2019, 52, 1377–1385. [Google Scholar]
- Zong, Y.; Han, L.; Jin, Y.; Zhao, W.; Meng, L. Experimental Investigation on the Post-Peak Short-Term and Creep Behavior of Fractured Sandstone. Energies 2020, 13, 598. [Google Scholar] [CrossRef]
- Nguyen, T.S.; Li, Z.; Su, G.; Nasseri, M.H.B.; Young, R.P. Hydro-mechanical behavior of an argillaceous limestone considered as a potential host formation for radioactive waste disposal. J. Rock Mech. Geotech. Eng. 2018, 10, 1063–1081. [Google Scholar] [CrossRef]
- Rostekhnadzor Order No. 439 of 13.11.2020; “On the Approval of Federal Regulations and Rules in the Field of Industrial Safety”, “Rules for Ensuring the Stability of Quarry Slopes and Benches, Open Pit Cuts, and Embankment Slopes”.
- Gushchin, V.V.; Epimakhov, Y.A. Recommendations for Studying Rock Fracturing During Engineering-Geological Surveys for Construction; Stroyizdat: Moscow, Russia, 1974; 36p. [Google Scholar]
- Pan, M.V.; Cheremnykh, S.N. Fracturing and Properties of Fractured Rocks; Nedra: Kopingsvik, Sweden, 1970; 150p. [Google Scholar]
- Wyllie, D.C.; Mah, C.W. Rock Slope Engineering: Civil and Mining, 4th ed.; Spon Press: London, UK, 2004; 425p. [Google Scholar]
- Read, J.R.L.; Stacey, P.F. Guidelines for Open Pit Slope Design, 1st ed.; CRC Press/Balkema: Leiden, The Netherlands, 2009; 494p. [Google Scholar]
- Malchenko, E.G.; Roman, A.T.; Portnoy, V.S.; Askarova, N.S. Peculiarities of the formation of the Zhailma volcano-tectonic deep. Nauk. Visnyk Natsionalnoho Hirnychoho Universytetu 2023, 1, 26–31. [Google Scholar] [CrossRef]
- Sherman, S.I.; Seminsky, K.Z.; Bornyakov, S.A.; Adamovich, A.N.; Lobatskaya, R.M.; Lysak, S.V.; Levi, K.G. Faulting in the Lithosphere. In Extension Zones; Nauka: Novosibirsk, Russia, 1992; 228p. [Google Scholar]
- Popov, I.I.; Nizammetdinov, F.K.; Okatov, R.P.; Dolgonosov, V.N. Natural and Technogenic Foundations of Slope and Bench Stability Management at Quarries; Gylim: Almaty, Kazakhstan, 1997. [Google Scholar]
- Patterns of changes in the strength characteristics of rocks of the Shuak massif. In Proceedings of the 6th IEEE International Symposium on Logistics and Industrial Informatics, Karaganda, Kazakhstan, 23–25 October 2024. [CrossRef]
- Identification of fracture systems based on drilling data and existing underground mining work during engineering-geological surveys. In Proceedings of the 6th IEEE International Symposium on Logistics and Industrial Informatics, Karaganda, Kazakhstan, 23–25 October 2024. [CrossRef]
- Epifantsev, O.G.; Pletenchuk, N.S. Rock Fracturing: Fundamentals of Theory and Methods of Study (Methodological Recommendations); SibGIU: Novokuznetsk, Russia, 2008; T66, 41p. [Google Scholar]
- GOST R 51776-2001; Rocks. Methods for Determination of Strength and Deformability Characteristics. Interstate Council for Standardization, Metrology, and Certification (ISC); Standartinform: Moscow, Russia, 2001. (In Russian)
- Shchedrina, N.N. Development of Methods for Evaluating Mechanical Properties of Sedimentary Rock Massifs at Deposits with Unstudied Subsidence Processes. Ph.D. Dissertation, Institute of Comprehensive Exploitation of Mineral Resources, Russian Academy of Sciences, Moscow, Russia, 2014; 131p. (In Russian). [Google Scholar]
- Elmo, D.; Rogers, S.; Stead, D.; Eberhardt, E. Discrete Fracture Network approach to characterise rock mass fragmentation and implications for geomechanical upscaling. Min. Technol. 2014, 123, 149–161. [Google Scholar] [CrossRef]


Disclaimer/Publisher’s Note: The statements, opinions and data contained in all publications are solely those of the individual author(s) and contributor(s) and not of MDPI and/or the editor(s). MDPI and/or the editor(s) disclaim responsibility for any injury to people or property resulting from any ideas, methods, instructions or products referred to in the content. |
© 2025 by the authors. Licensee MDPI, Basel, Switzerland. This article is an open access article distributed under the terms and conditions of the Creative Commons Attribution (CC BY) license (https://creativecommons.org/licenses/by/4.0/).