
Simulation of a Multi-Stage Stress Field and Regional Prediction of Structural Fractures in the Tucheng Syncline, Western Guizhou, China


Abstract
1. Introduction
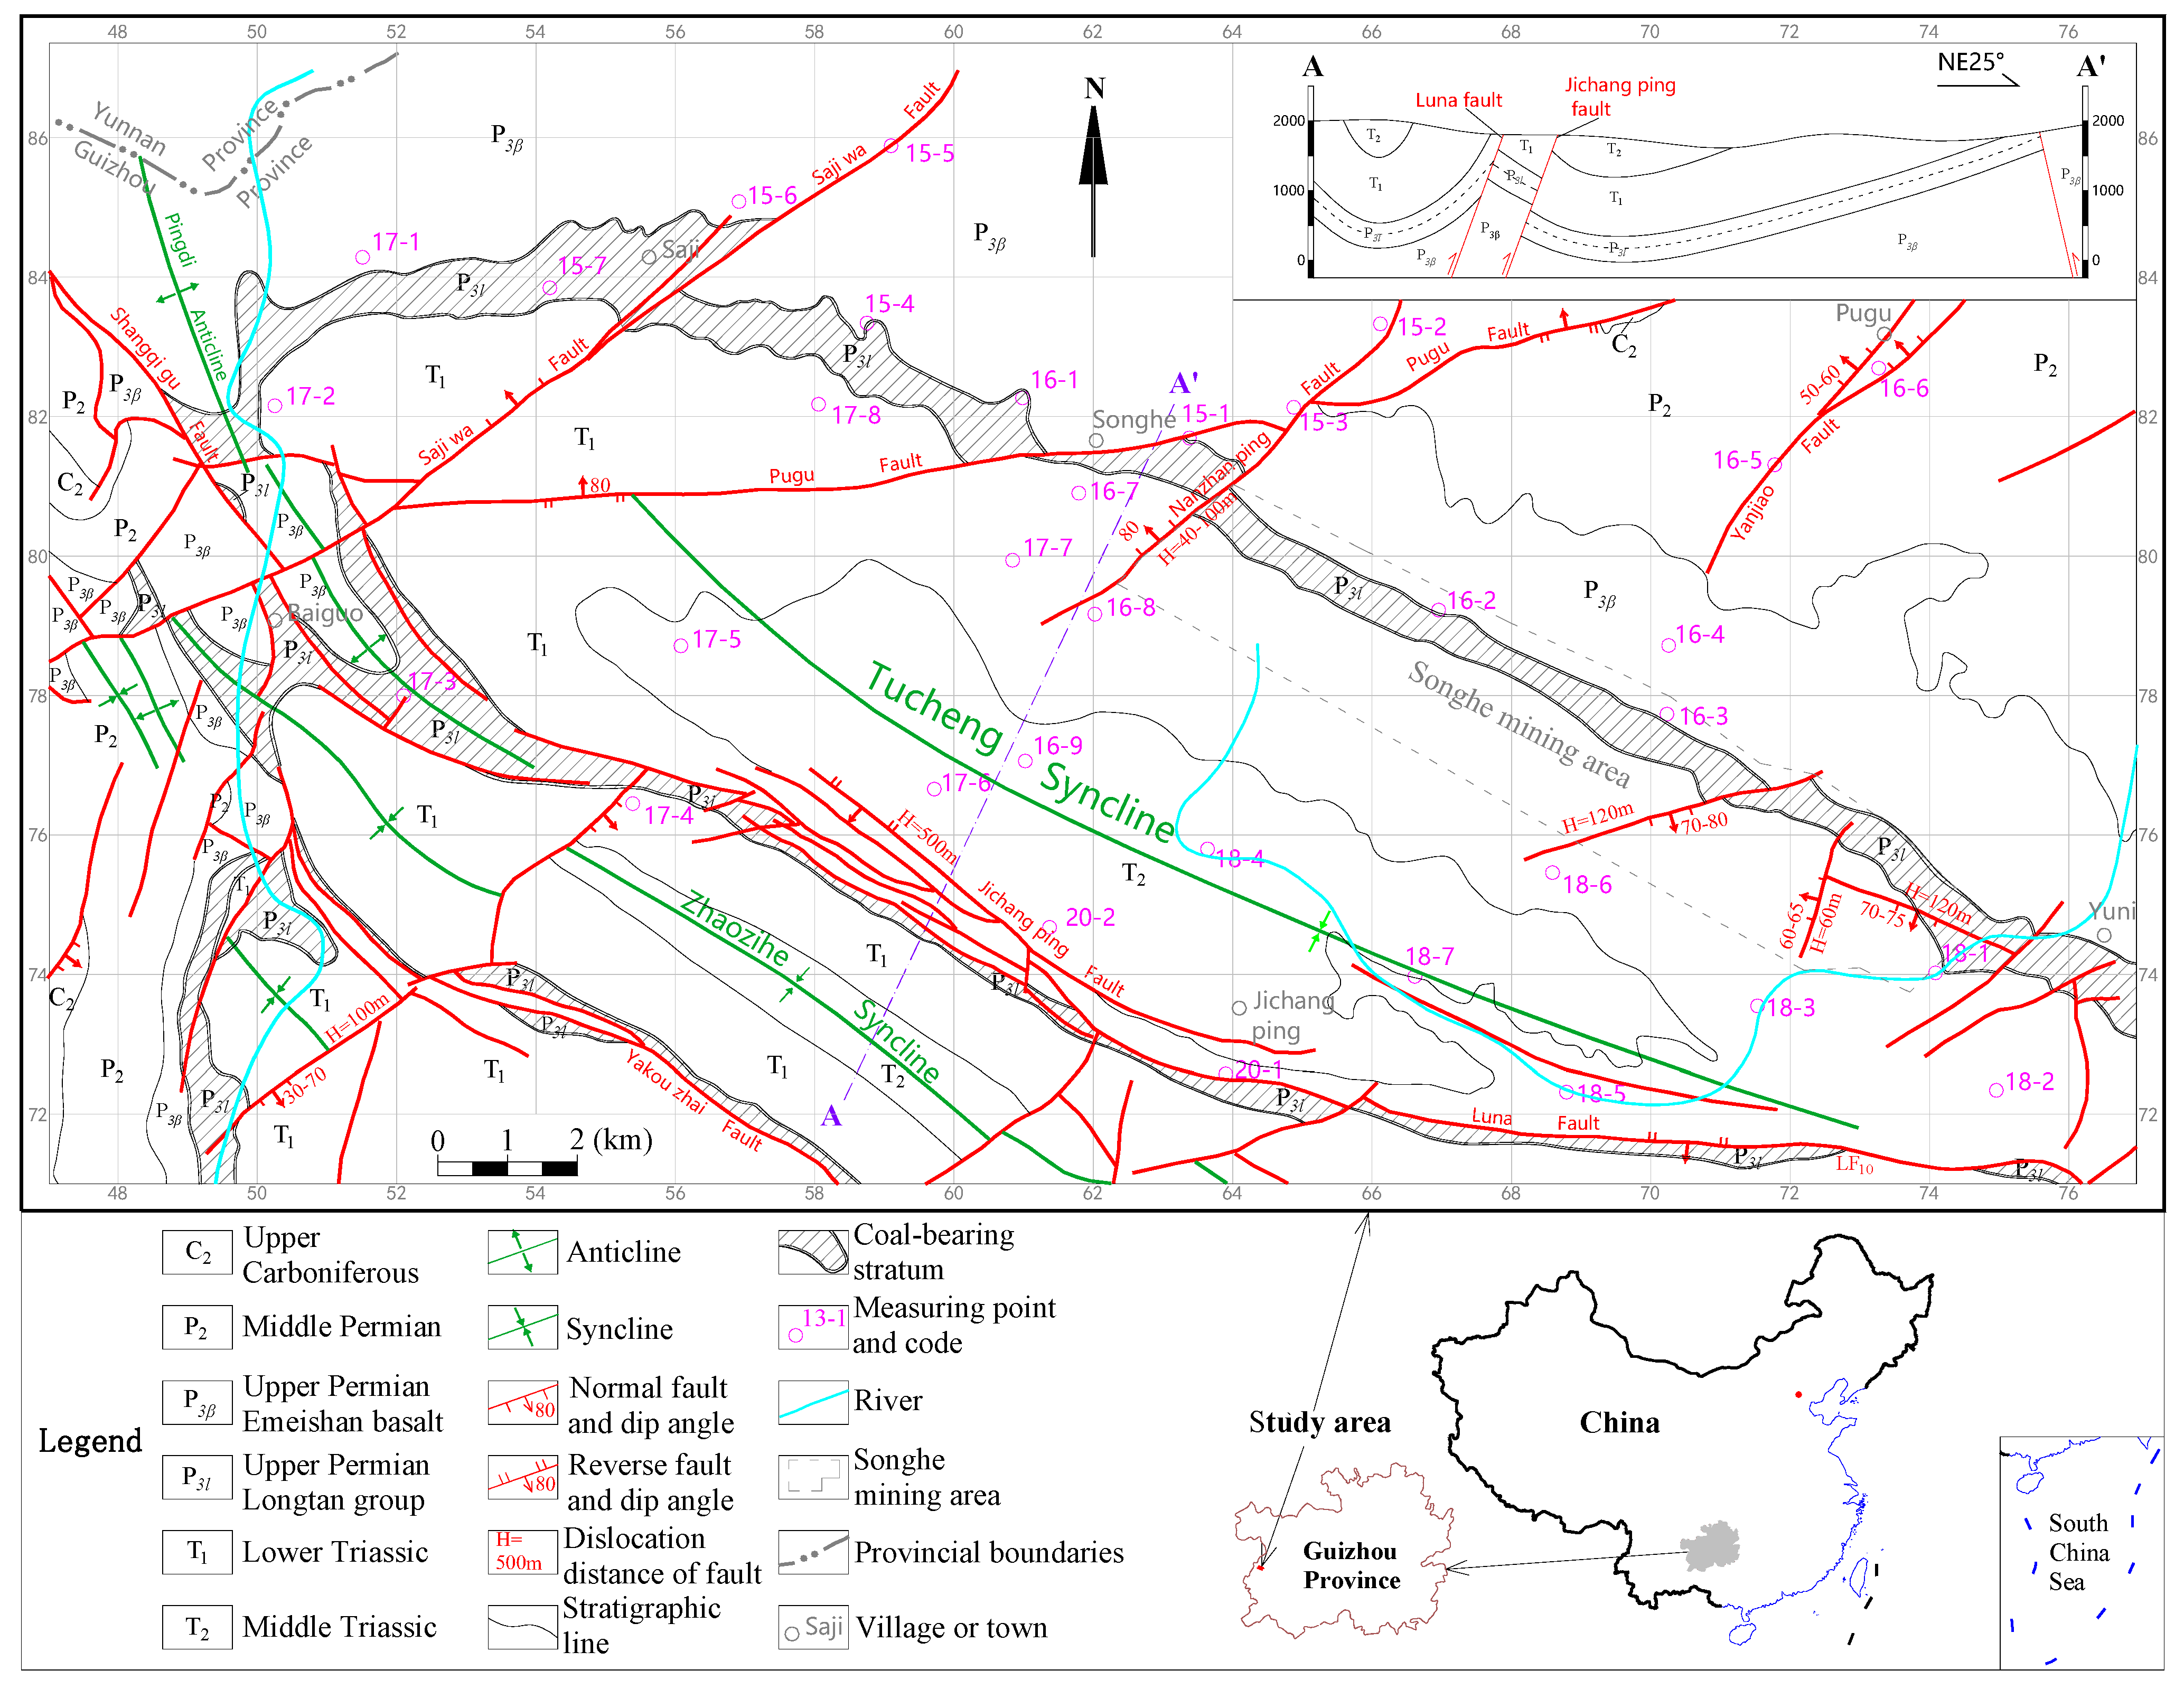
2. Geological Setting
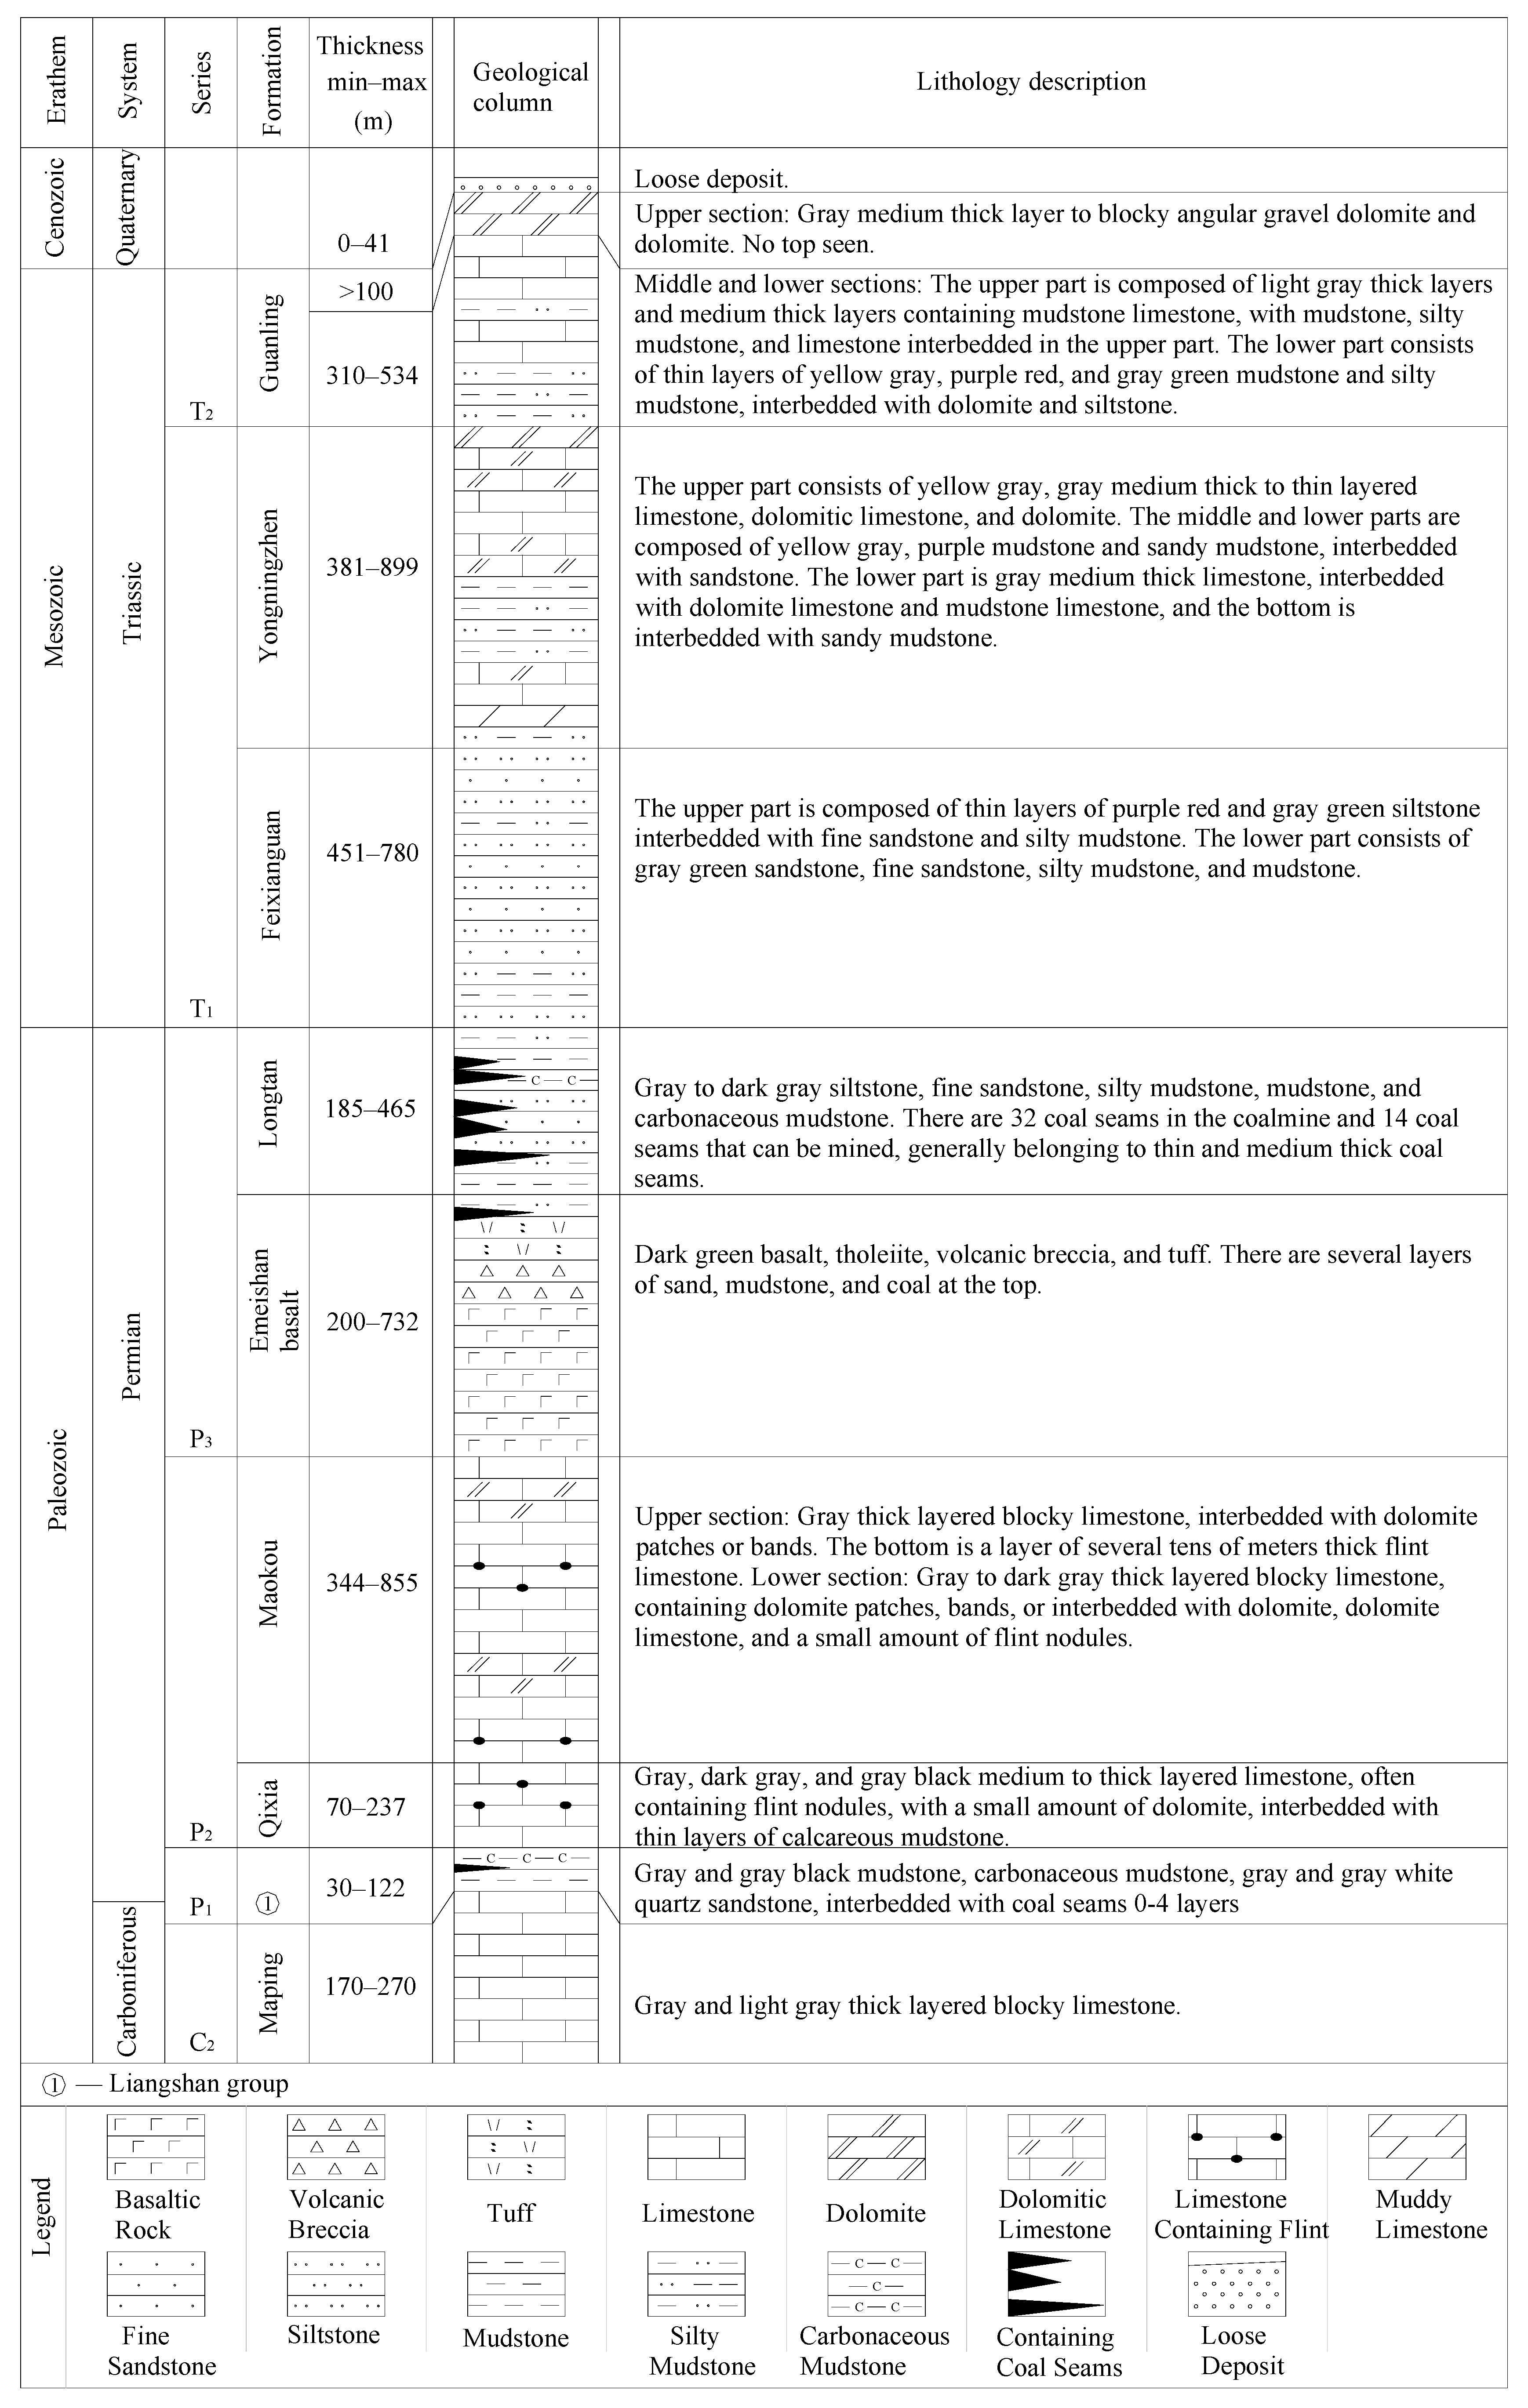
2.1. Stratigraphy
2.2. Tectonics
3. Data and Methods
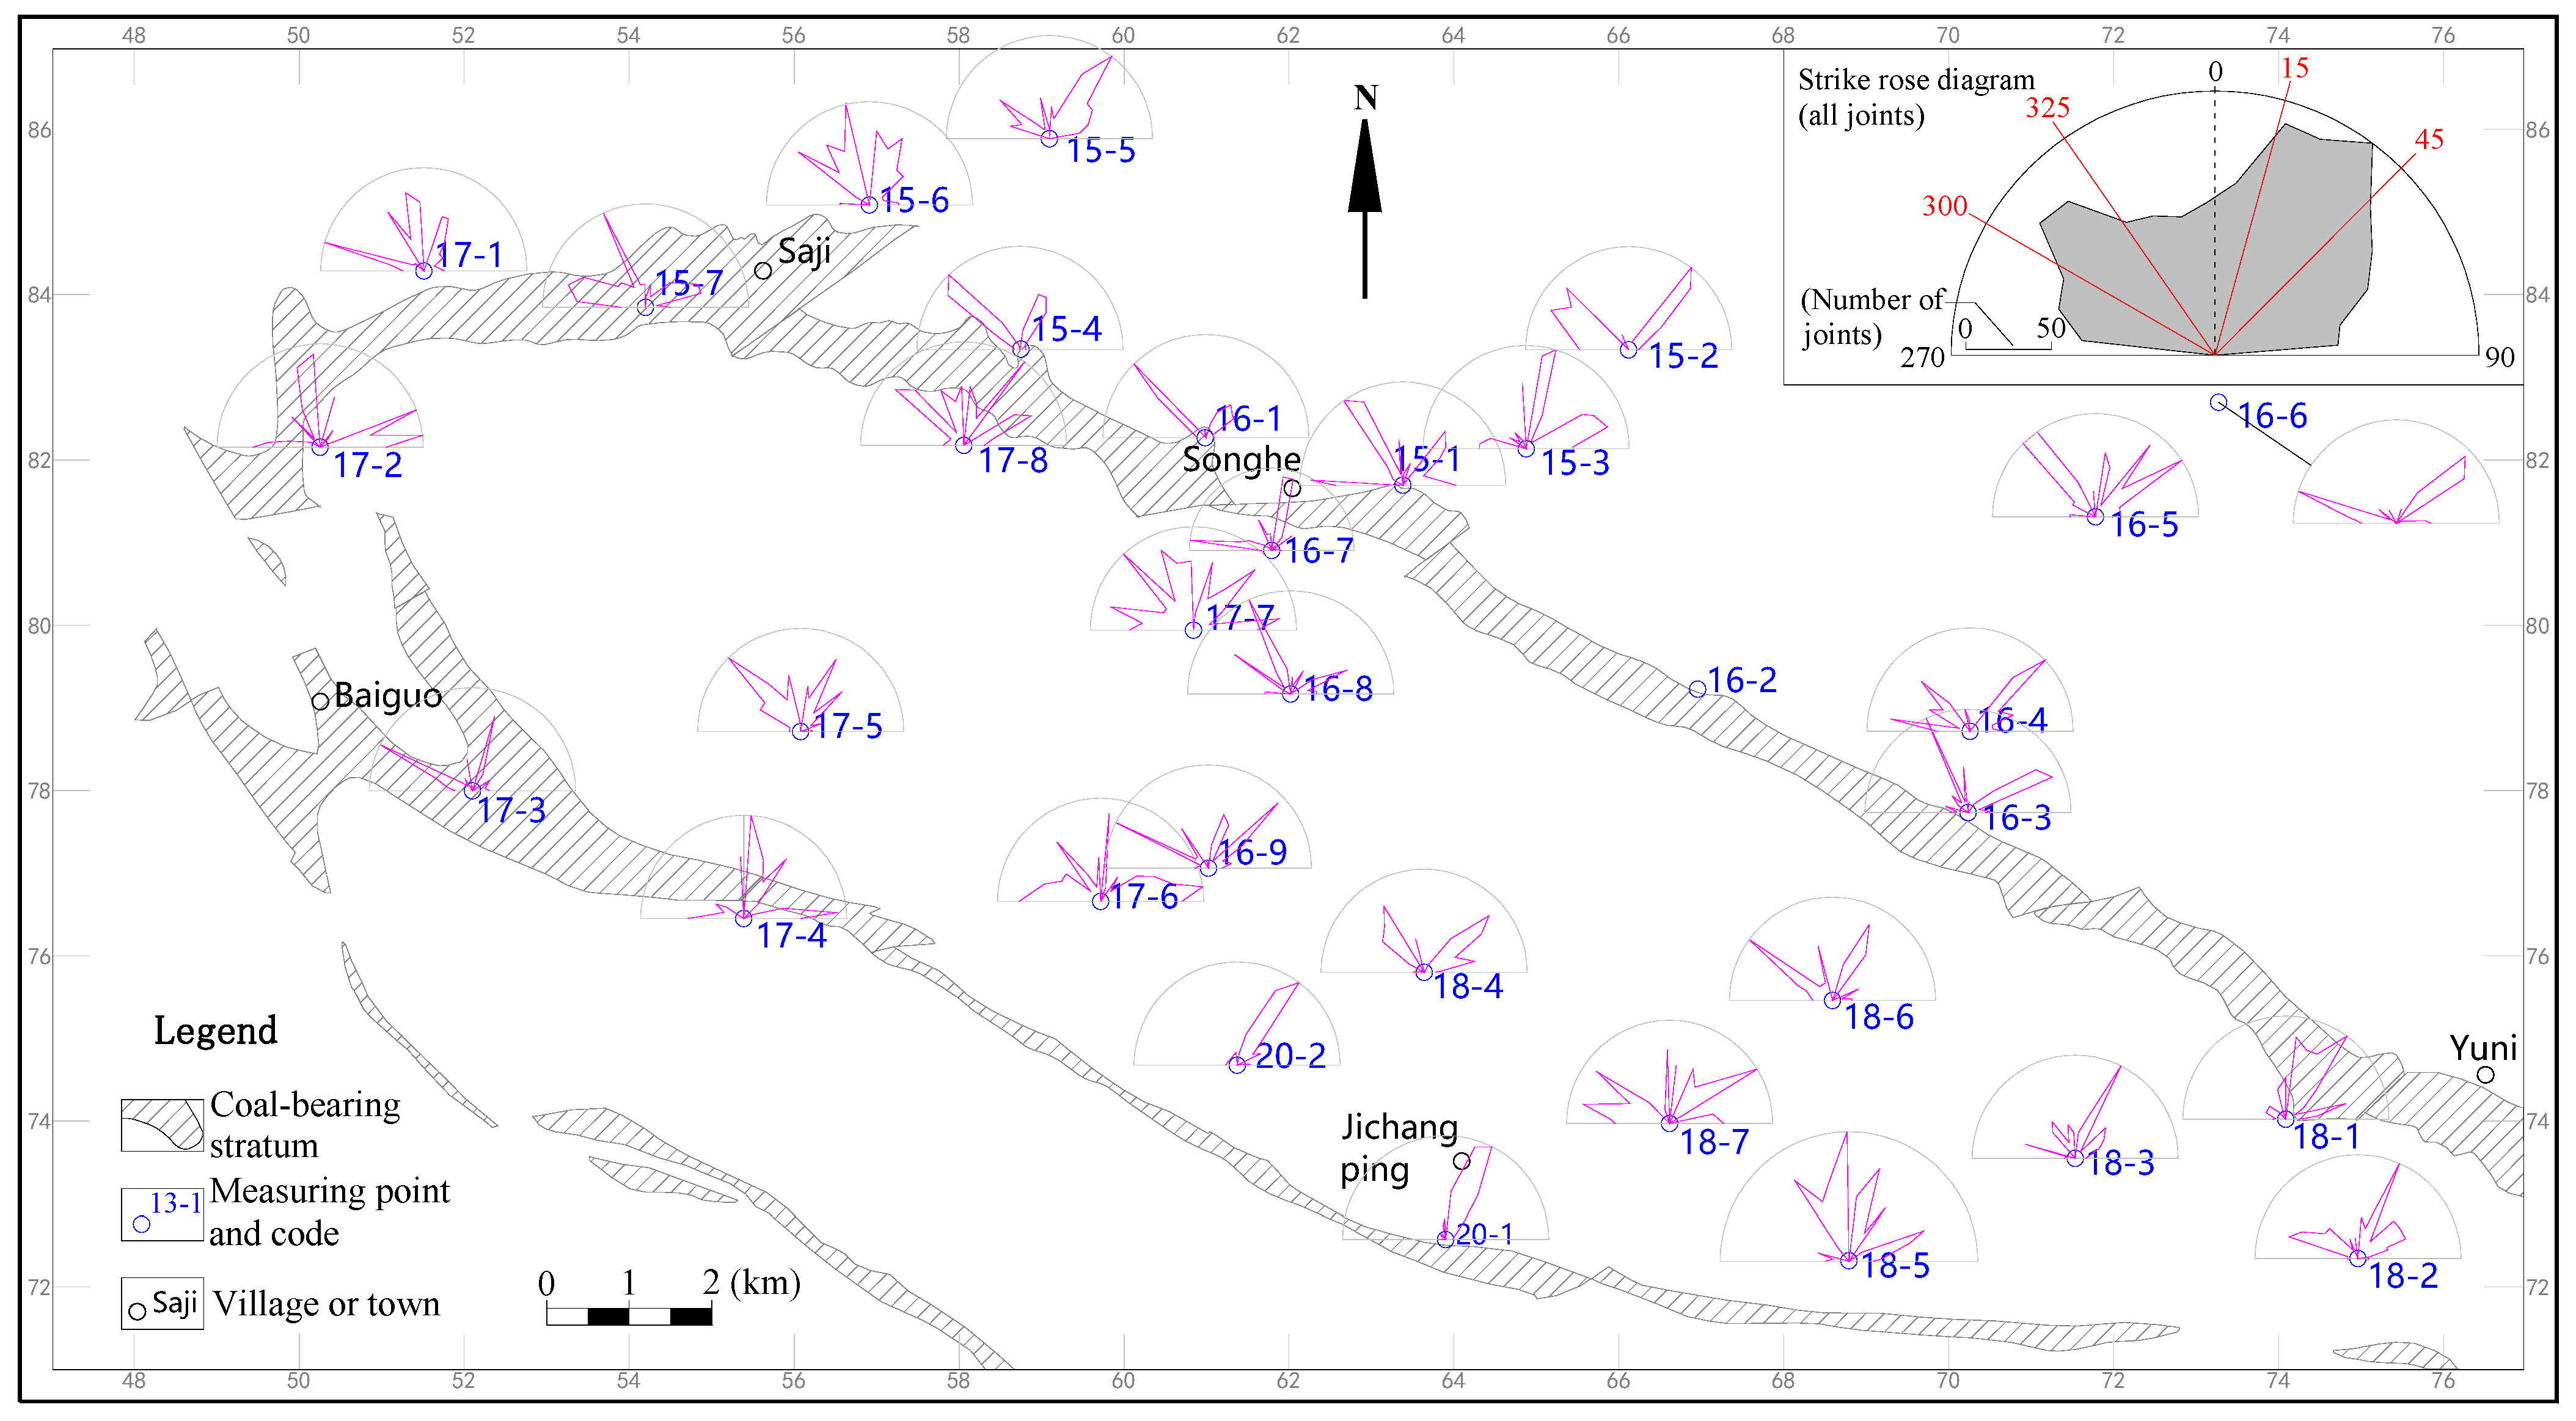
3.1. Characteristics of Tectonic Joints
3.2. Principal Stress Restoration
3.3. Numerical Simulation of Paleotectonic Stress Fields
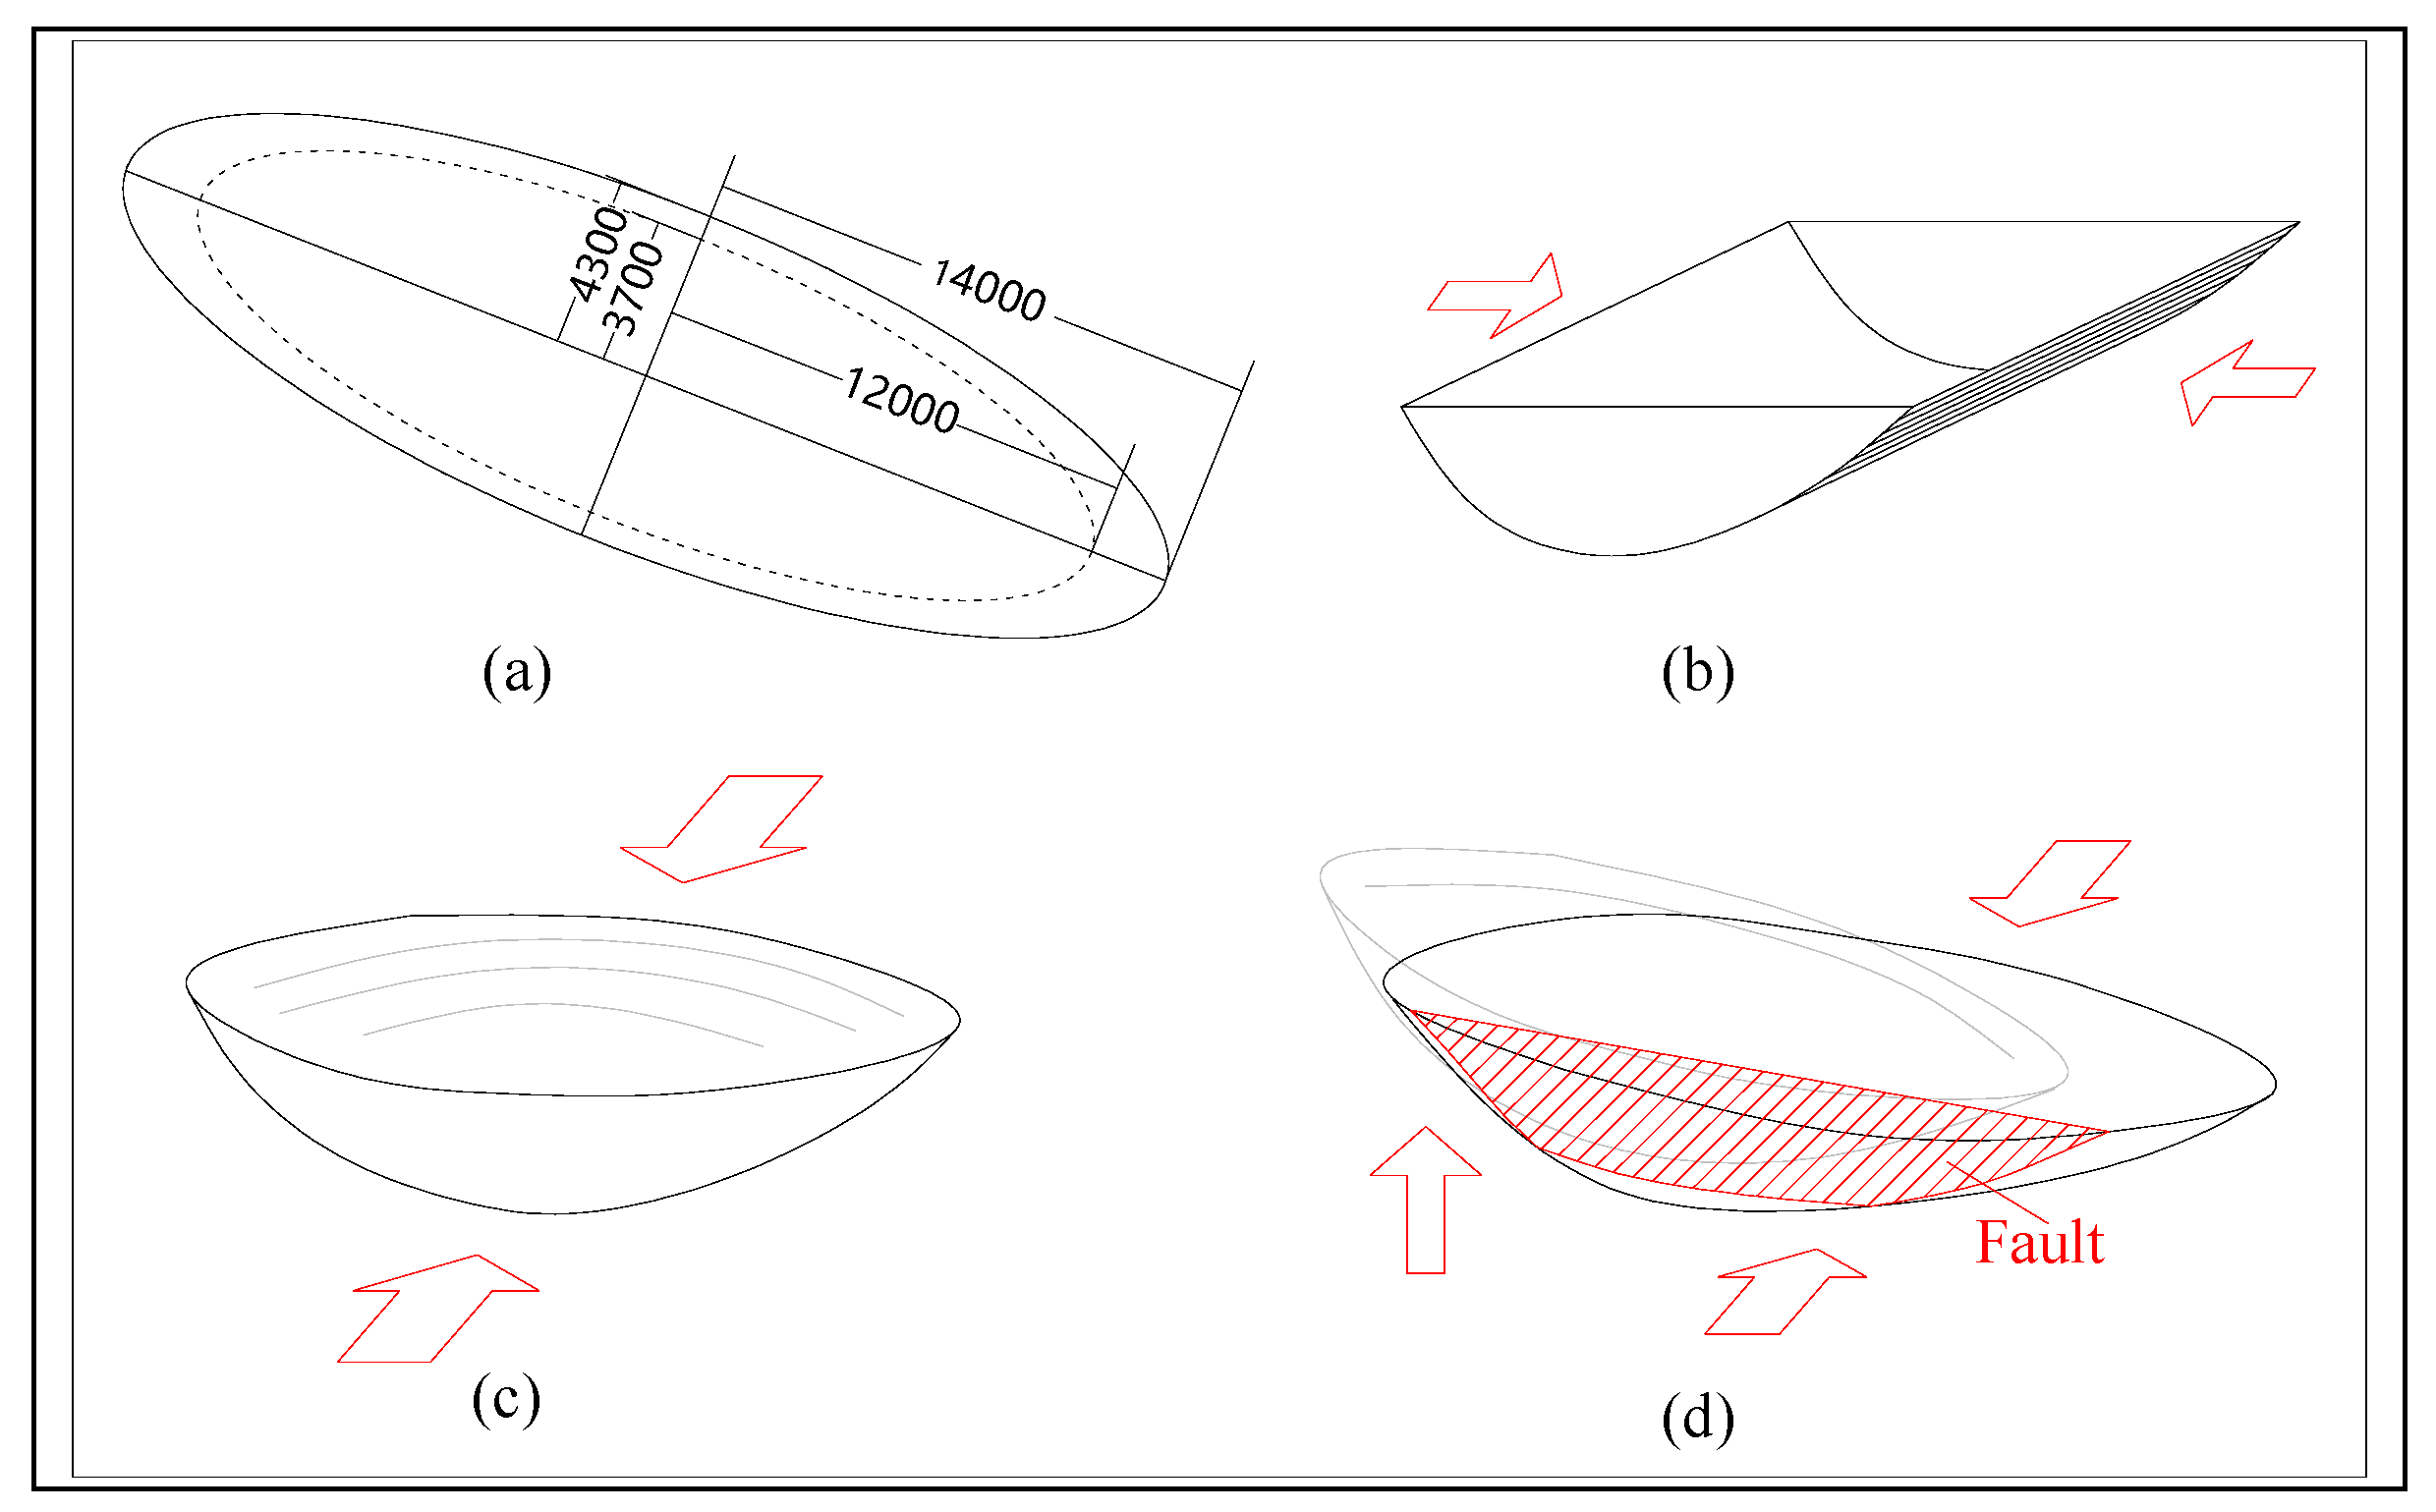
3.3.1. Geological Models in Different Stages
3.3.2. Division of Rock Stratum Groups and Rock Mechanical Parameters
3.3.3. Boundary Conditions of Tectonic Stress
3.4. Prediction of Structural Fractures
4. Results
4.1. Tectonic Deformation and Evolution
4.1.1. Mechanical Analysis of Regional Tectonic Deformation
4.1.2. Tectonic Evolution of the Study Area
4.2. Reconstruction of the Paleotectonic Stress Field
4.3. Numerical Simulation of the Paleotectonic Stress Fields in Different Stages
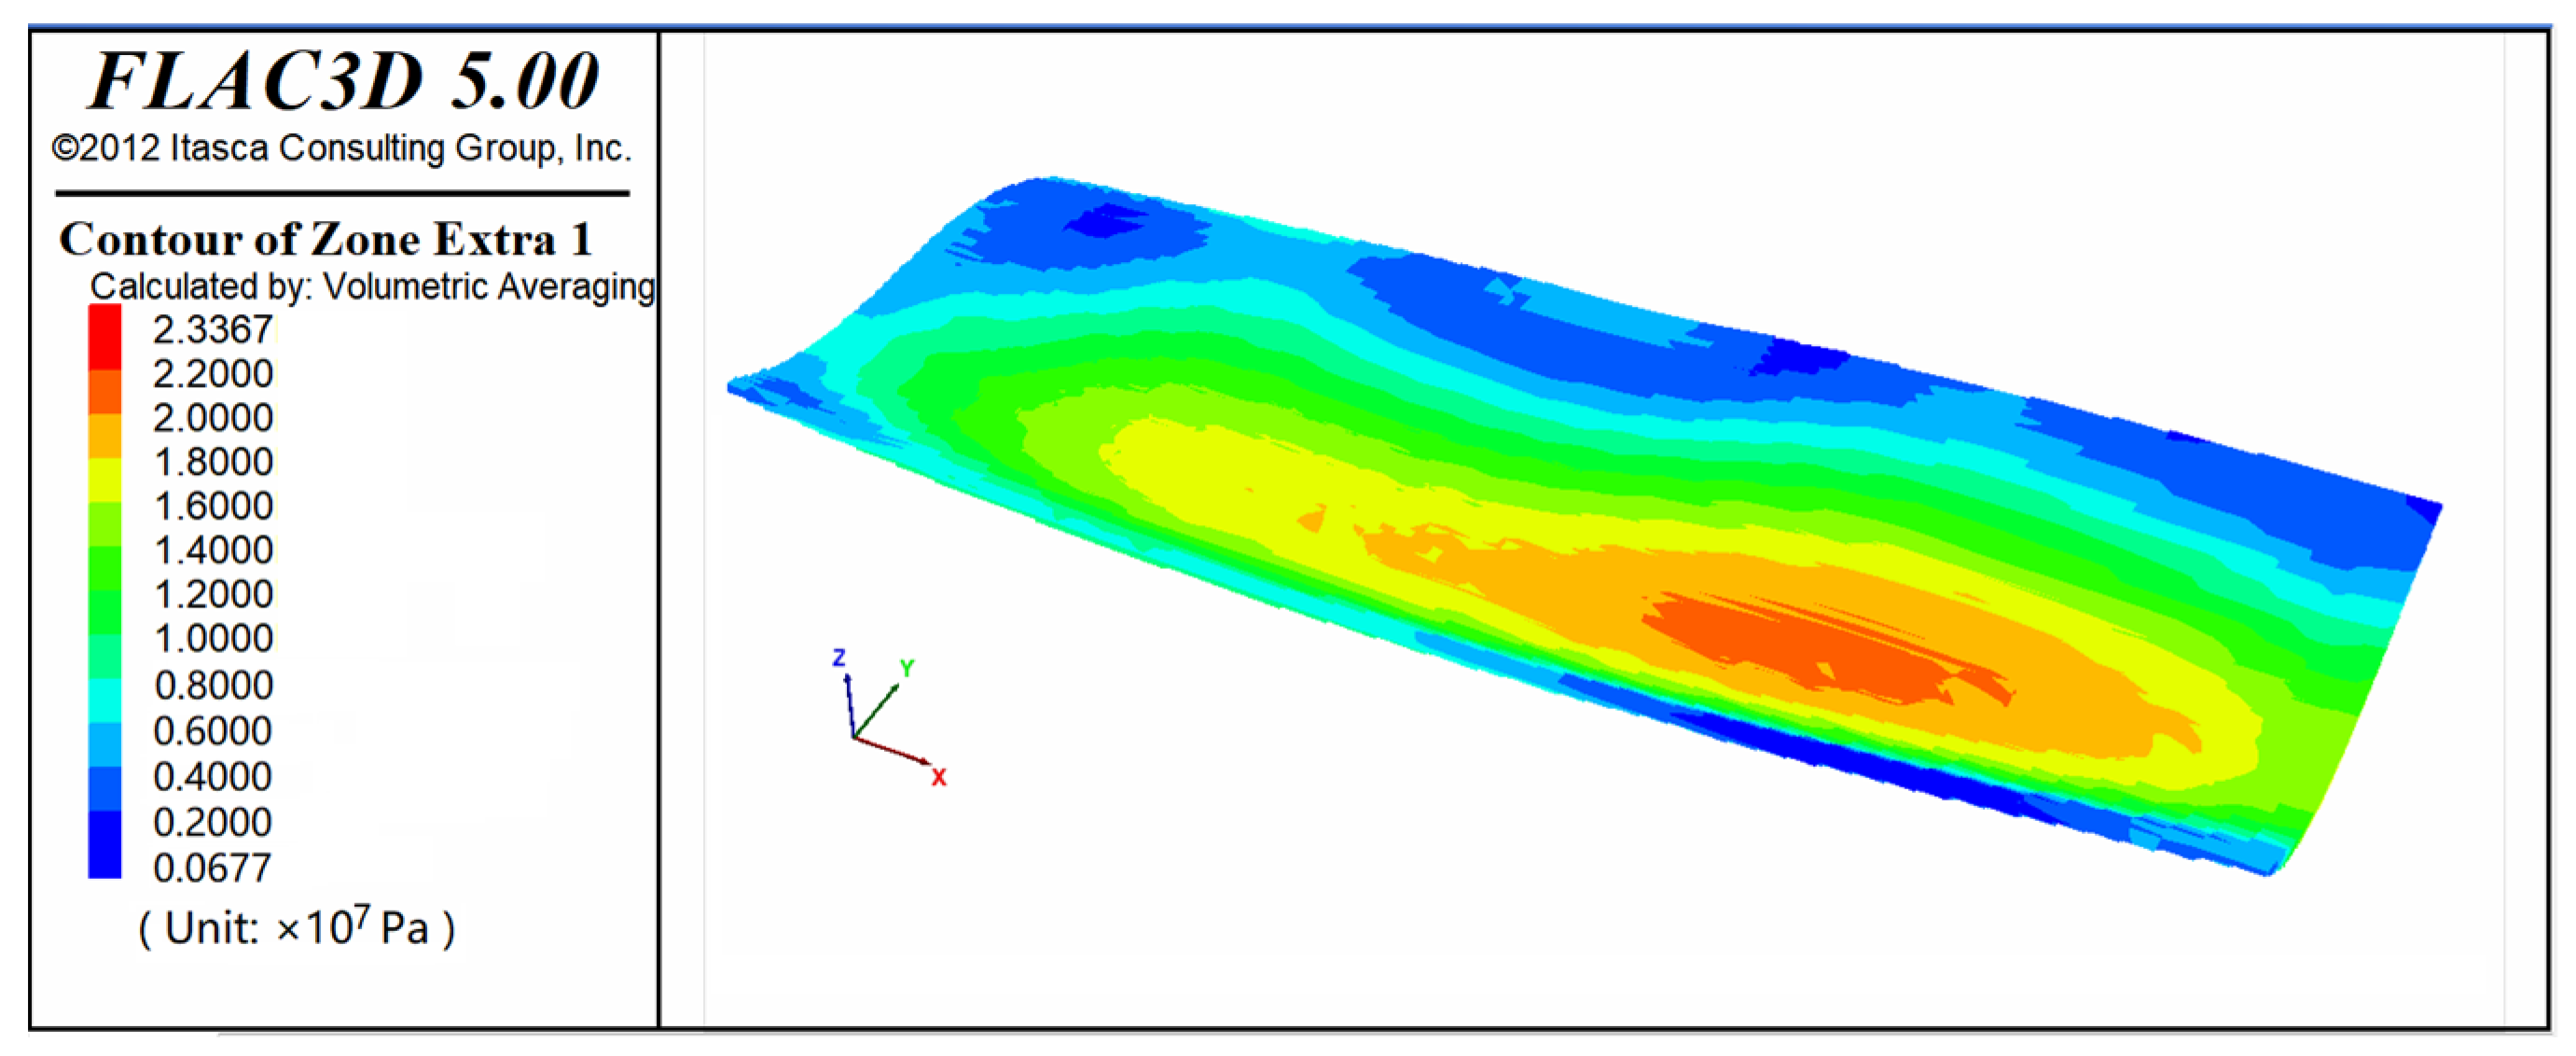
4.3.1. Simulation of the First Stage (Cylindrical Surface Model)
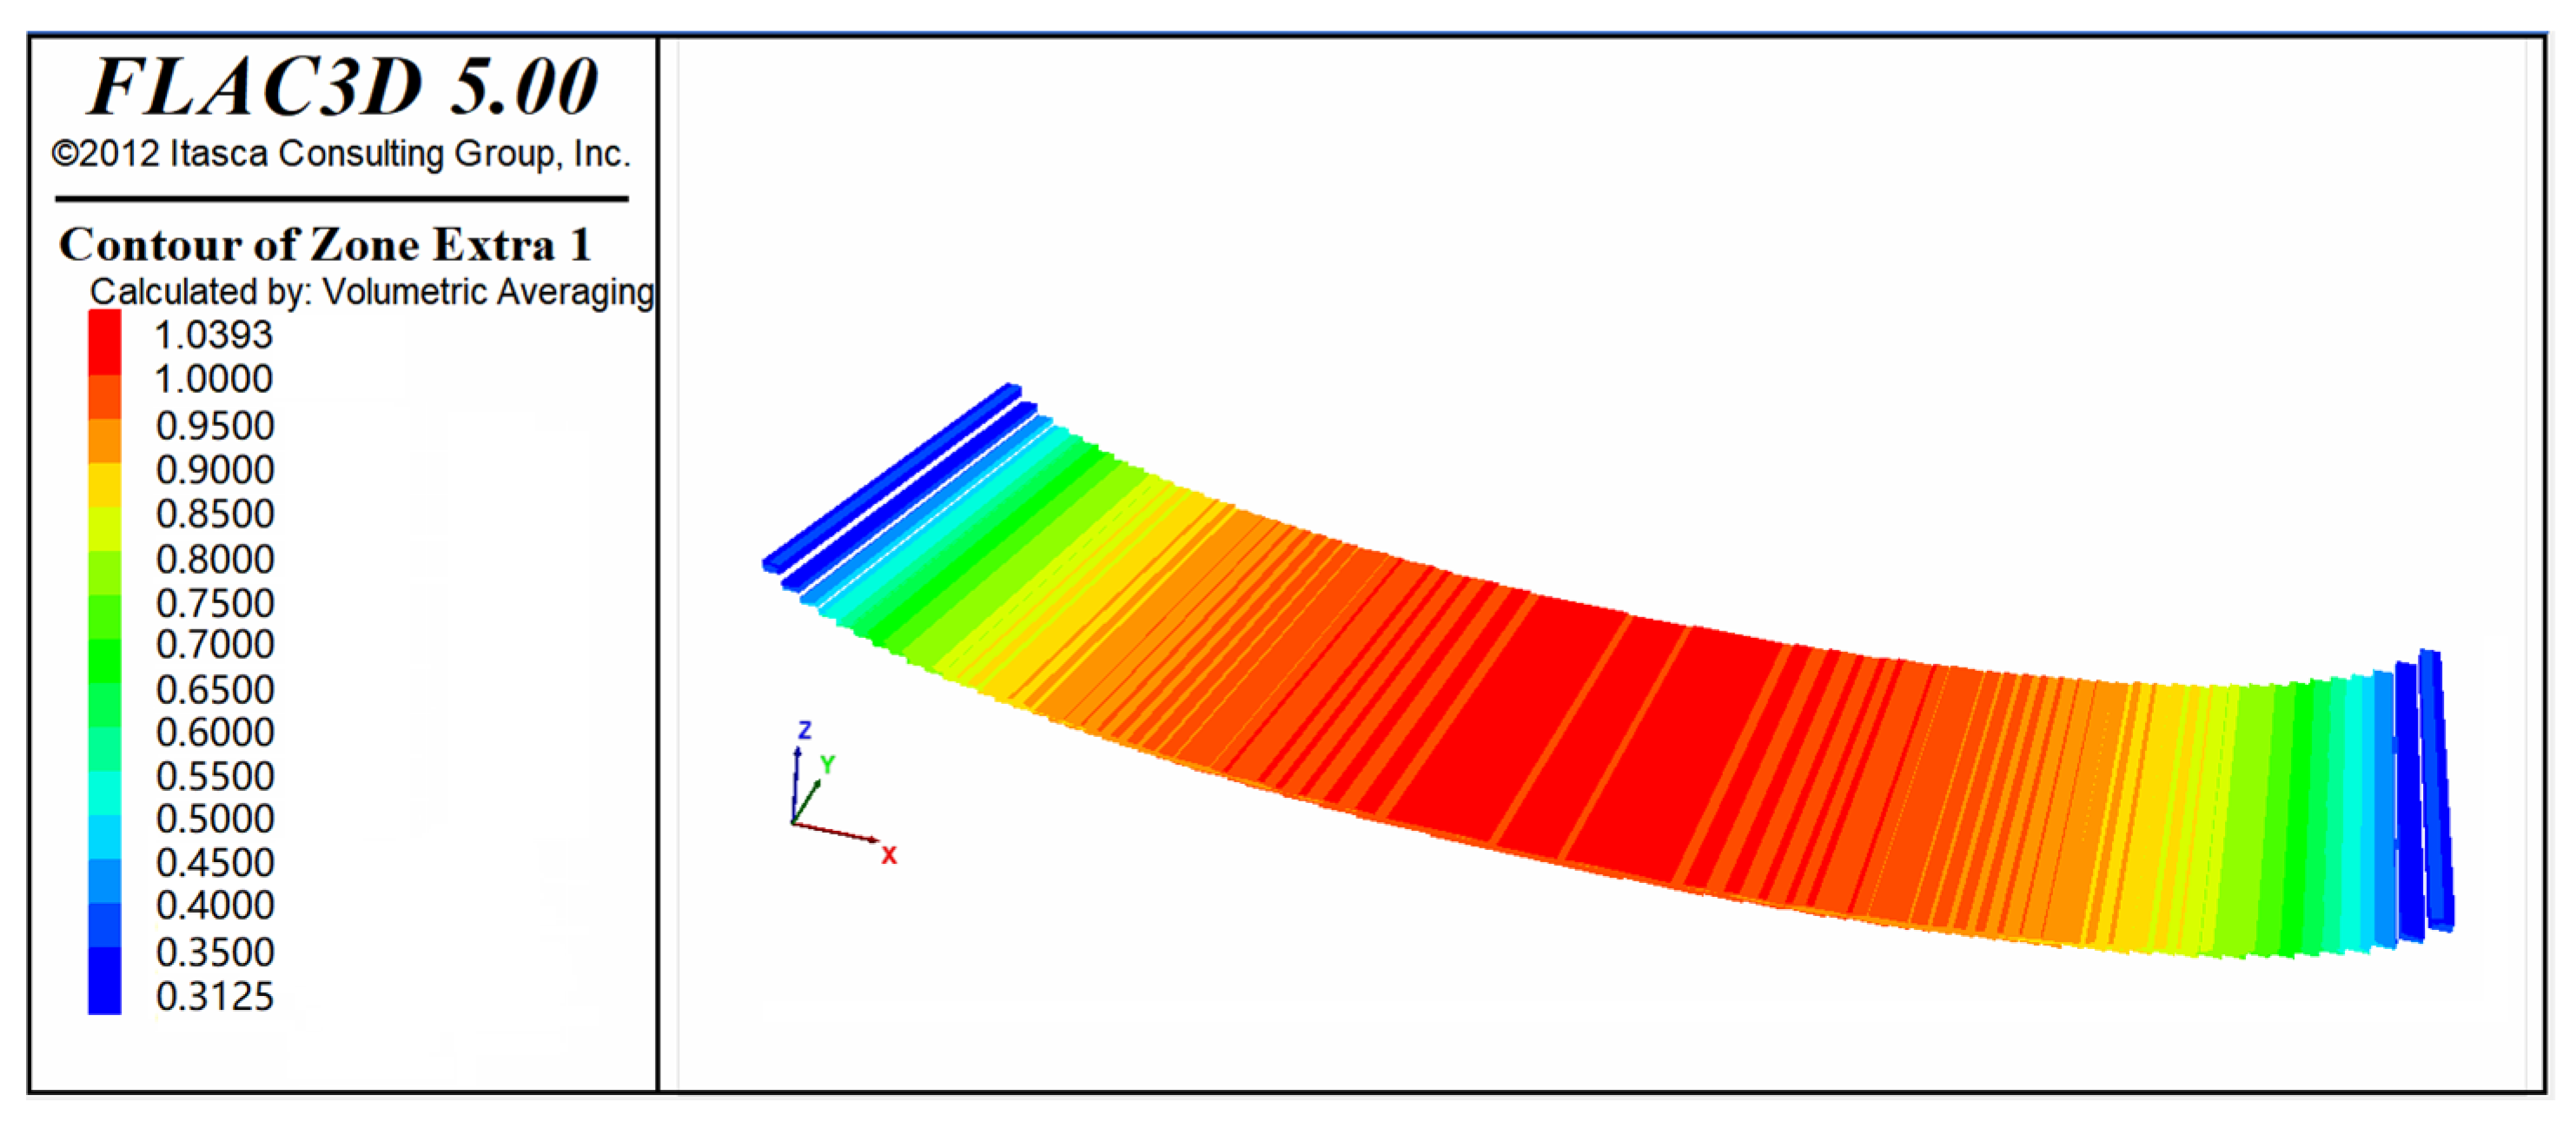
4.3.2. Simulation of the Second Stage (Ellipsoid Surface Model)
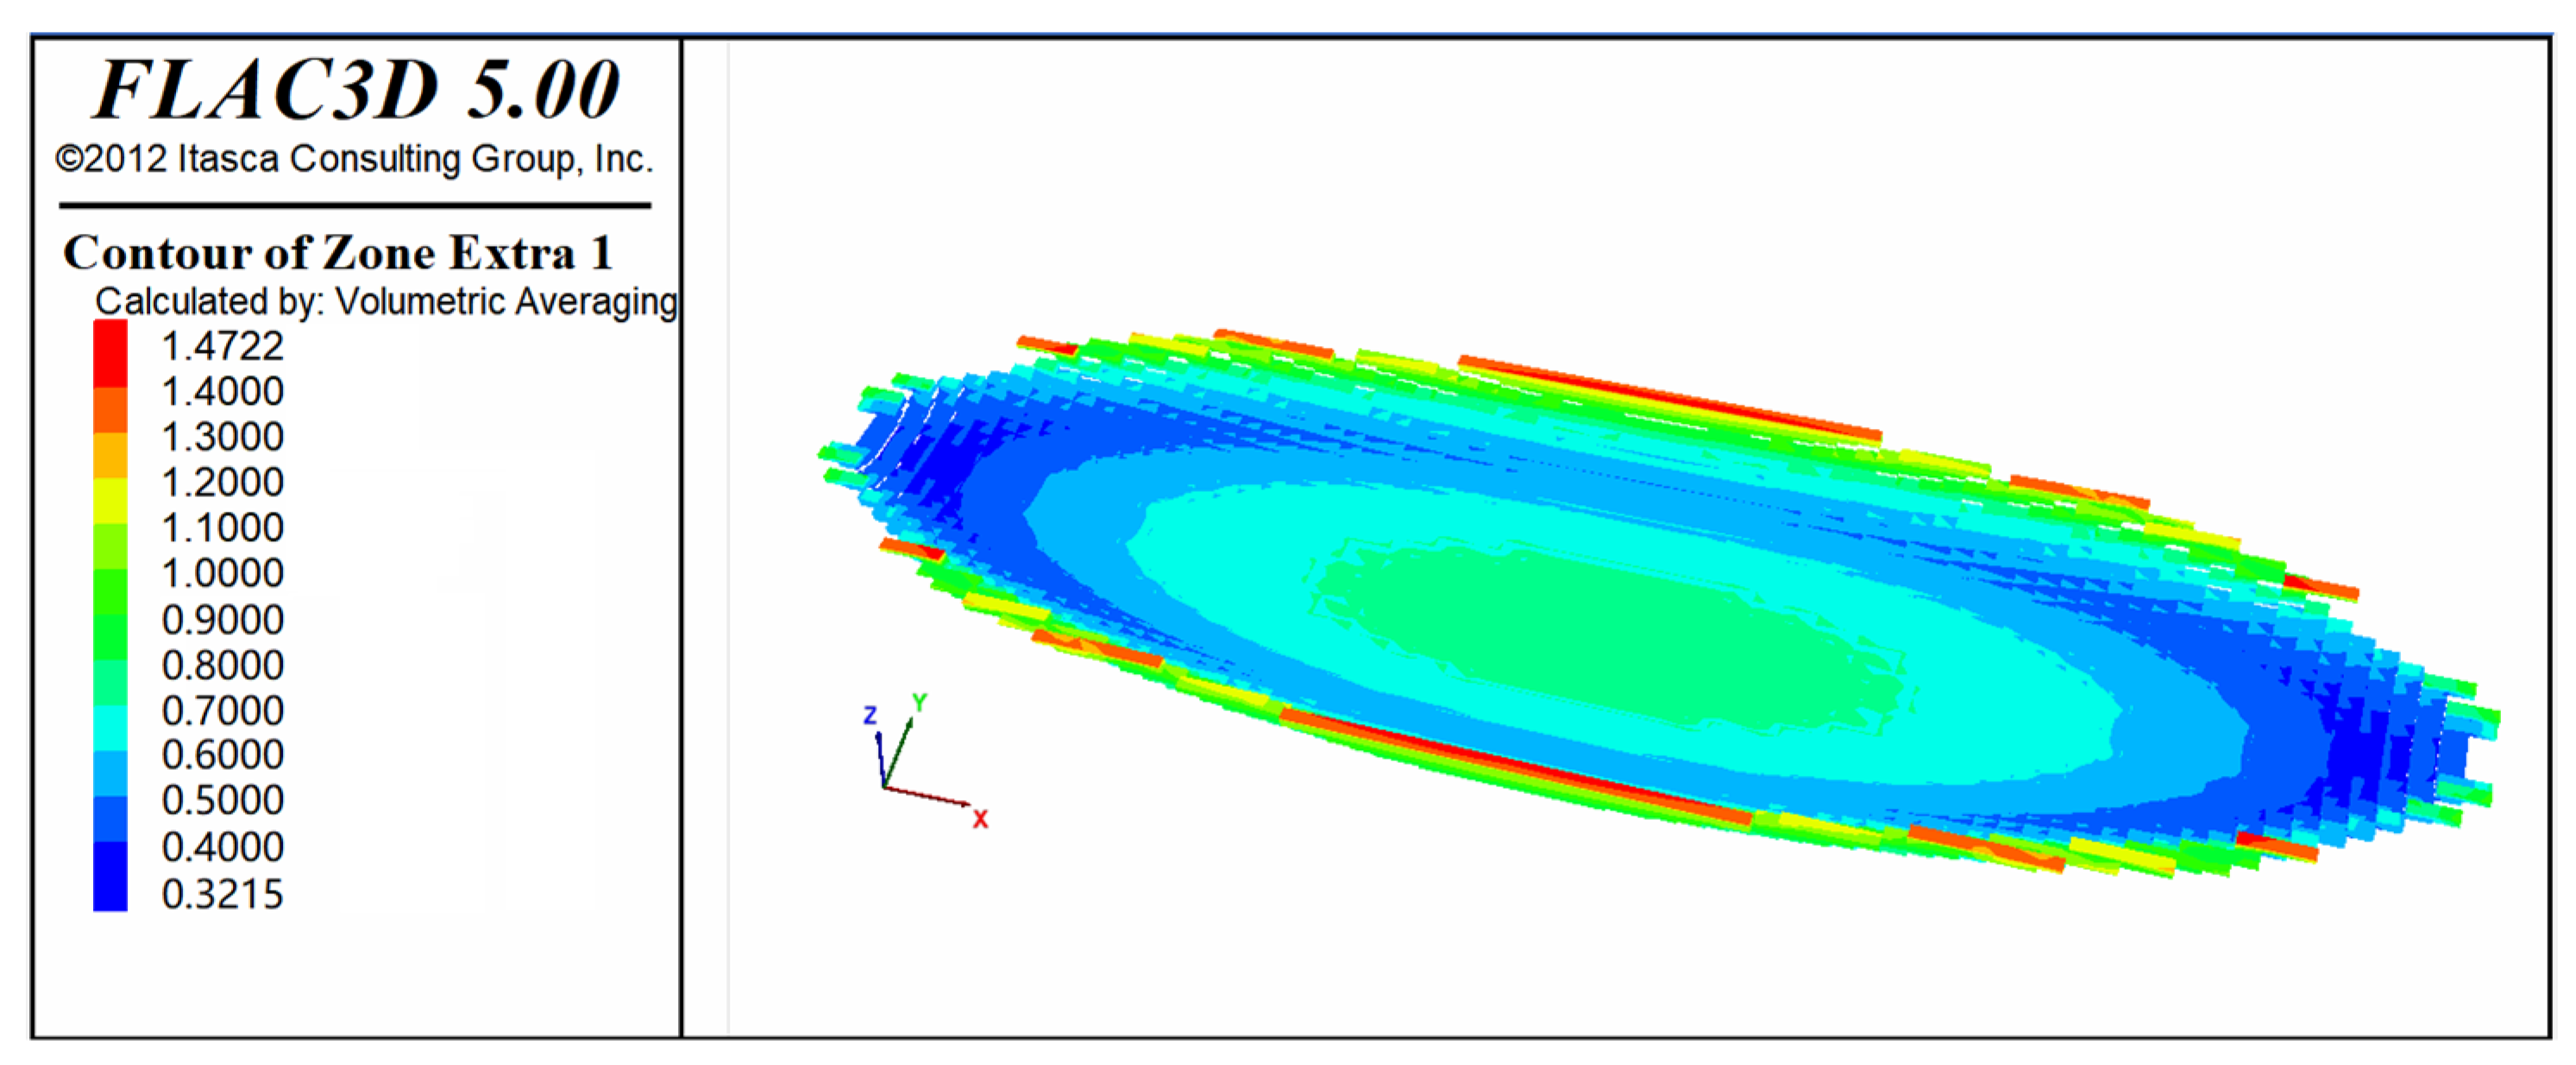
4.3.3. Simulation of the Third Stage (Trend Surface Model)
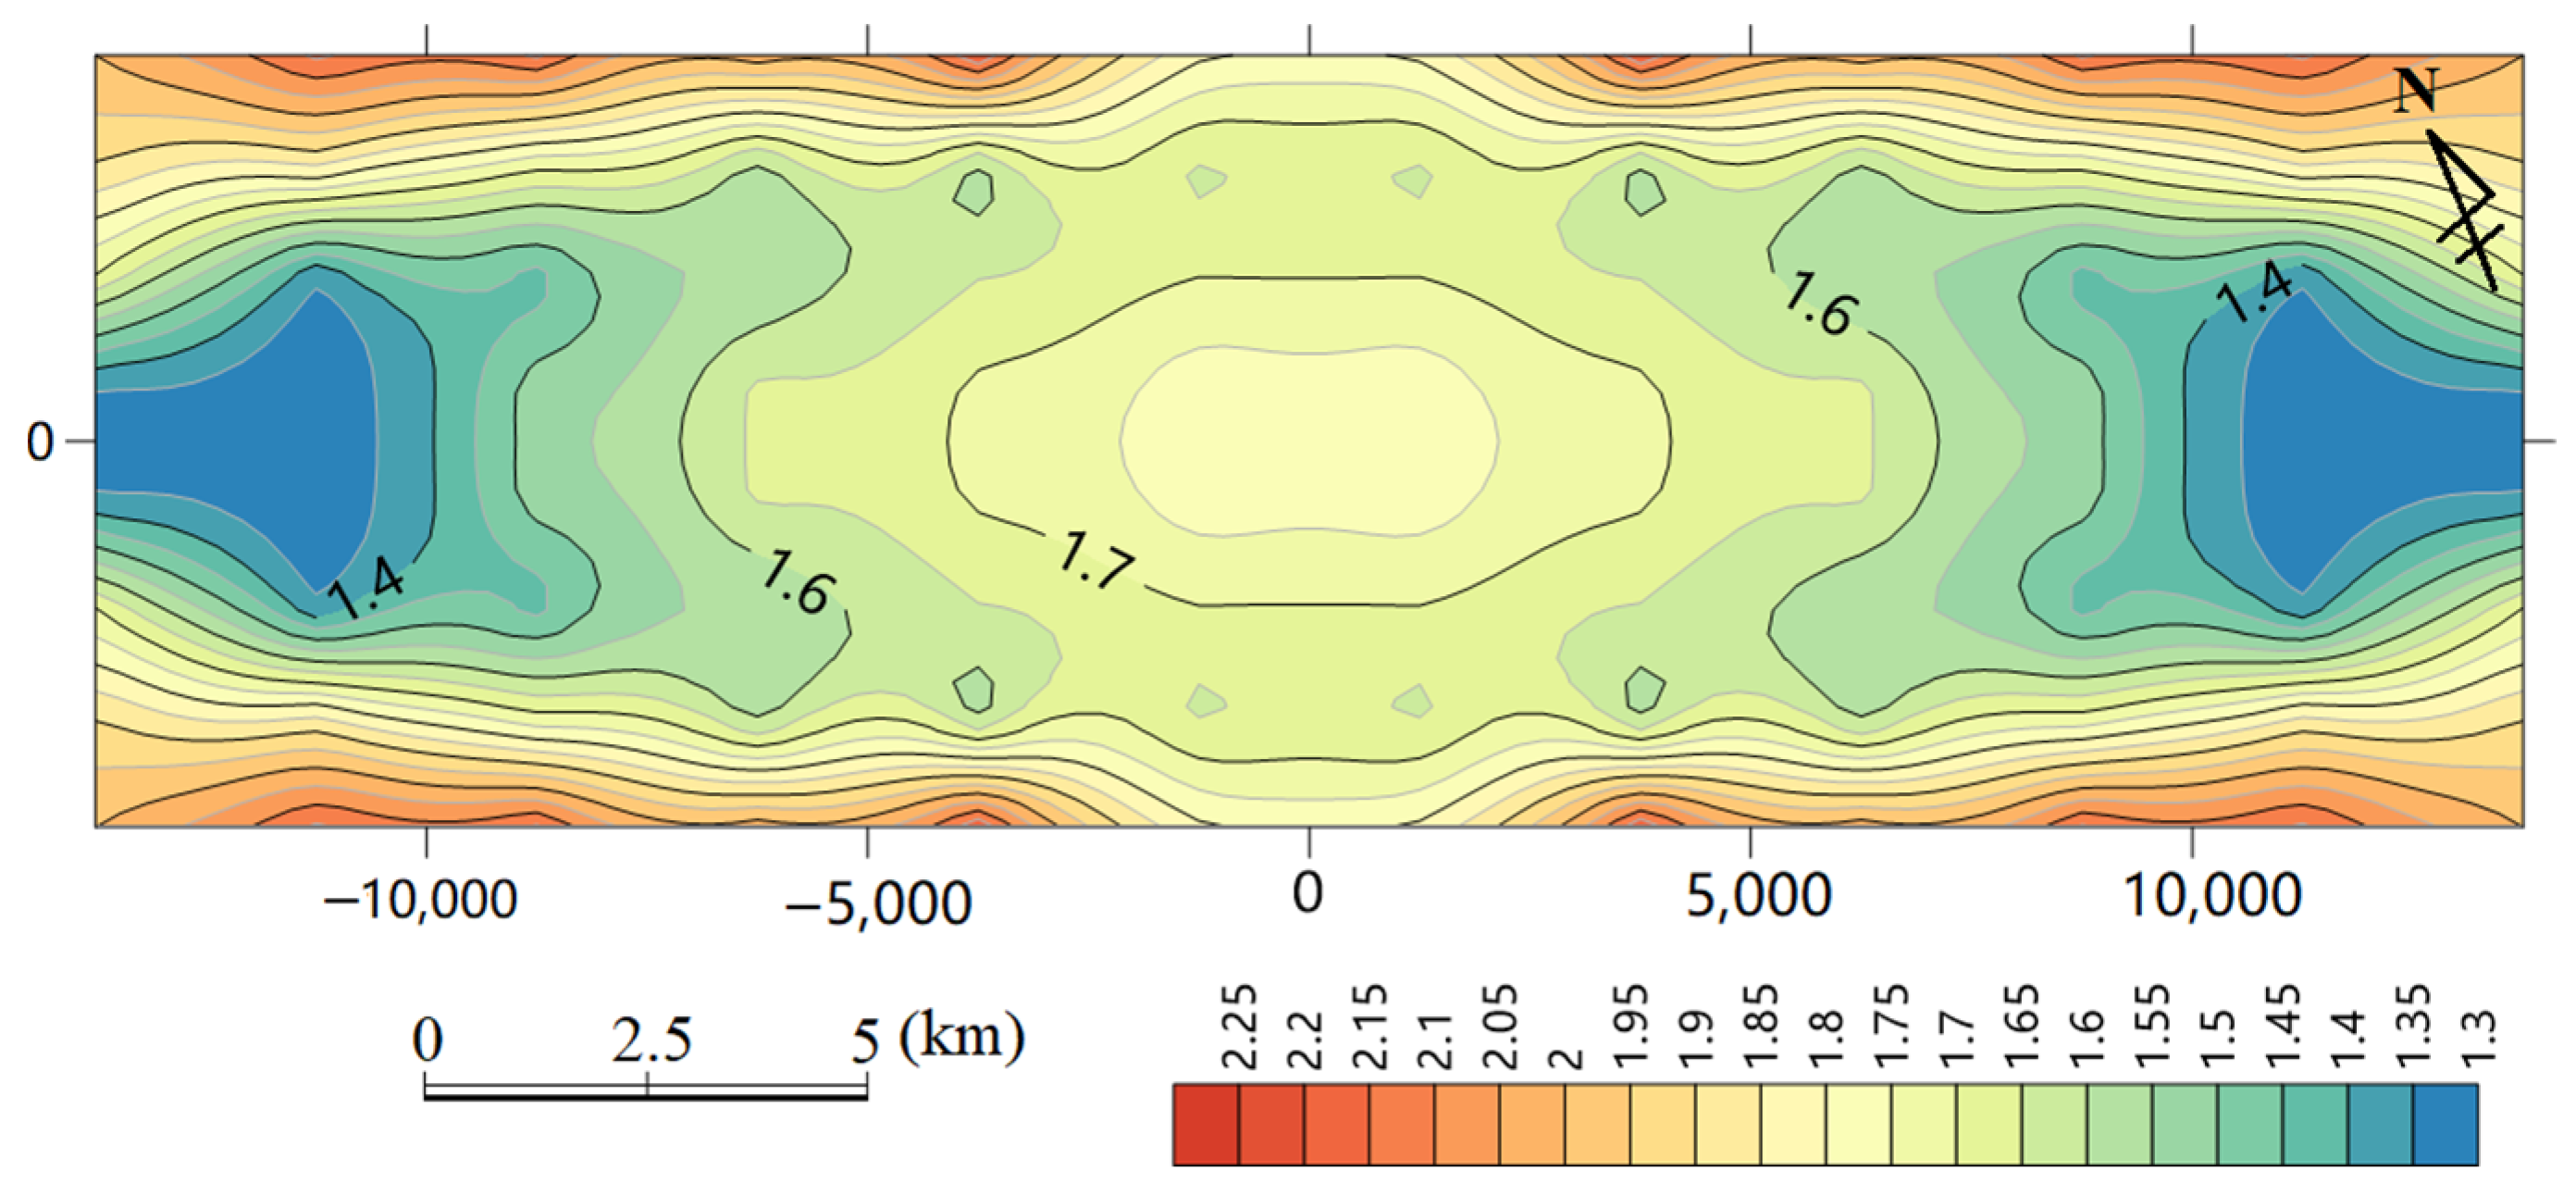
4.4. Prediction Results of Structural Fractures
5. Discussion
5.1. Analysis of the Structural Fracture Development Trend
5.2. The Effect of Structural Position on Structural Fractures
5.3. Control of CBM Migration by the Modern Stress Field and Structural Fractures
5.4. Problems and Shortcomings
6. Conclusions
Author Contributions
Funding
Data Availability Statement
Conflicts of Interest
Appendix A
Appendix A.1. The Core Program Segments of Fish Language Programming
References
- Shi, J.X.; Zeng, L.B.; Zhao, X.Y.; Zhang, Y.Z.; Wang, J.P. Characteristics of natural fractures in the upper Paleozoic coal bearing strata in the southern Qinshui Basin, China: Implications for coalbed methane (CBM) development. Mar. Pet. Geol. 2020, 113, 104152. [Google Scholar]
- Wang, L.L.; Jiang, B.; Wang, J.L.; Wang, J.Y.; Qu, Z.H. Effects of in-situ stress and joint on permeability of the coal bed in Linfen block, southeastern Ordos asin, China. Russ. Geol. Geophys. 2018, 59, 299–312. [Google Scholar] [CrossRef]
- Liu, H.H.; Sang, S.X.; Xue, J.H.; Wang, G.X.; Xu, H.J.; Ren, B.; Liu, C.J.; Liu, S.Q. Characteristics of an in situ stress field and its control on coal fractures and coal permeability in the Gucheng block, southern Qinshui Basin, China. J. Nat. Gas Sci. Eng. 2016, 36, 1130–1139. [Google Scholar]
- Karimpoulia, S.; Tahmasebib, P.; Ramandi, H.L. A review of experimental and numerical modeling of digital coalbed methane: Imaging, segmentation, fracture modeling and permeability prediction. Int. J. Coal Geol. 2020, 228, 103552. [Google Scholar] [CrossRef]
- Yang, S.Y.; Cai, Y.D.; Wei, R.; Zhou, Y.F. A new fracture permeability model of CBM reservoir with high-dip angle in the southern Junggar Basin, NW China. Energy Explor. Exploit. 2019, 37, 125–143. [Google Scholar] [CrossRef]
- Engelder, T.; Lash, G.G.; Uzcátegui, R.S. Joint sets that enhance production from Middle and Upper Devonian gas shales of the Appalachian Basin. AAPG Bull. 2009, 93, 857–889. [Google Scholar]
- Wang, K.; Guo, L.; Xu, C.; Wang, W.J.; Yang, T.; Lin, S.S.; Cai, Y.B. Multiscale characteristics of pore-fracture structures in coal reservoirs and their influence on coalbed methane (CBM) transport: A review. Geoenergy Sci. Eng. 2024, 242, 213181. [Google Scholar] [CrossRef]
- Fang, H.H.; Sang, S.X.; Wang, J.L.; Liu, S.Q.; Ju, W. Simulation of Paleotectonic Stress Fields and Distribution Prediction of Tectonic Fractures at the Hudi Coal Mine, Qinshui Basin. Acta Geol. Sin. 2017, 91, 2007–2023. [Google Scholar] [CrossRef]
- Gong, W.D. Paleo-tectonic Stress Field and Tectonic Evolution since the Mesozoic in the Eastern Mining Area of Pingdingshan. Earth Sci. Res. J. 2019, 23, 347–357. [Google Scholar] [CrossRef]
- Lin, C. Tectonic Stress Reconstruction Based on Structural Features in Tectonic Superposition Areas. Min. Metall. Explor. 2020, 37, 387–397. [Google Scholar] [CrossRef]
- Zhang, H.T.; Xu, G.Q.; Zhan, H.B.; Li, X.; He, J.H. Simulation of multi-period paleotectonic stress fields and distribution prediction of natural Ordovician fractures in the Huainan coalfield, Northern China. J. Hydrol. 2022, 612, 128291. [Google Scholar] [CrossRef]
- Song, L.J.; Wang, Z.Z. Late Triassic tectonic stress field of the southwestern Ordos Basin and its tectonic implications: Insights from finite-element numerical simulations. Geosphere 2023, 19, 770–781. [Google Scholar] [CrossRef]
- Ju, W.; Wang, J.L.; Fang, H.H.; Gong, Y.P.; Zhang, S.J. Paleostress reconstructions and stress regimes in the Nanchuan region of Sichuan Basin, South China: Implications for hydrocarbon exploration. Geosci. J. 2017, 21, 553–564. [Google Scholar] [CrossRef]
- Li, H.; Qin, Q.R.; Zhang, B.J.; Ge, X.Y.; Hu, X.; Fan, C.H.; Tang, H.M. Tectonic Fracture Formation and Distribution in Ultradeep Marine Carbonate Gas Reservoirs: A Case Study of the Maokou Formation in the Jiulongshan Gas Field, Sichuan Basin, Southwest China. Energy Fuels 2020, 34, 14132–14146. [Google Scholar]
- Wang, J.L.; Wang, Y.K.; Zhou, X.Z.; Xiang, W.X.; Chen, C.R. Paleotectonic Stress and Present Geostress Fields and Their Implications for Coalbed Methane Exploitation: A Case Study from Dahebian Block, Liupanshui Coalfield, Guizhou, China. Energies 2024, 17, 101. [Google Scholar] [CrossRef]
- De Guidi, G.; Caputo, R.; Scudero, S. Regional and local stress field orientation inferred from quantitative analyses of extension joints: Case study from southern Italy. Tectonics 2013, 32, 239–251. [Google Scholar] [CrossRef]
- Kumaira, S.; Guadagnin, F.; Magalhães, A.J.; Pimentel, N.L.; Chemale, F., Jr. Post-Jurassic brittle deformation of Lusitanian Basin in the context of W Iberia evolution. Basin Res. 2023, 35, 2165–2192. [Google Scholar] [CrossRef]
- Lash, G.G.; Engelder, T. Tracking the burial and tectonic history of Devonian shale of the Appalachian Basin by analysis of joint intersection style. Geol. Soc. Am. Bull. 2009, 121, 265–277. [Google Scholar] [CrossRef]
- Seminsky, K.Z.; Cheremnykh, A.V. Jointing patterns and stress tensors in Cenozoic sediments of the Baikal rift: Development of the structural-genetic approach. Russ. Geol. Geophys. 2011, 52, 353–367. [Google Scholar] [CrossRef]
- Eshiet, K.I.I.; Sheng, Y.; Yang, D.M. Evaluating the corollary of the interdependency of rock joint properties on subsurface fracturing. Bull. Eng. Geol. Environ. 2021, 80, 567–597. [Google Scholar] [CrossRef]
- Li, H.; Lin, C.Y.; Ren, L.H.; Zhang, G.Y.; Chang, L.J.; Dong, C.M. Quantitative prediction of multi-period tectonic fractures based on integrated geological-geophysical and geomechanics data in deep carbonate reservoirs of Halahatang oilfield in northern Tarim Basin. Mar. Pet. Geol. 2021, 134, 105377. [Google Scholar]
- Roy, D.G.; Singh, T.N.; Kodikara, J. Influence of joint anisotropy on the fracturing behavior of a sedimentary rock. Eng. Geol. 2017, 228, 224–237. [Google Scholar]
- Eyssautier-Chuine, S.; Odonne, F.; Massonnat, G. Control of bioclast abundance on natural joint density in carbonate rocks: Data from Oman, Provence and Languedoc (France). Terra Nova 2002, 14, 198–204. [Google Scholar]
- Whitaker, A.E.; Engelder, T. Characterizing stress fields in the upper crust using joint orientation distributions. J. Struct. Geol. 2005, 27, 1778–1787. [Google Scholar]
- Guo, P.; Yao, L.H.; Ren, D.S. Simulation of three-dimensional tectonic stress fields and quantitative prediction of tectonic fracture within the Damintun Depression, Liaohe Basin, northeast China. J. Struct. Geol. 2016, 86, 211–223. [Google Scholar]
- Liu, H.; Zuo, Y.J.; Rodriguez-Dono, A.; Wu, Z.H.; Sun, W.J.; Zheng, L.L.; Pan, C.; Lin, J.Y.; Du, S.Y. Study on multi-period palaeotectonic stress fields simulation and fractures distribution prediction in Lannigou gold mine, Guizhou. Geomech. Geophys. Geo-Energy Geo-Resour. 2023, 9, 92. [Google Scholar] [CrossRef]
- Xie, Q.; Li, G.; Yang, X.; Peng, H.L. Evaluating the Degree of Tectonic Fracture Development in the Fourth Member of the Leikoupo Formation in Pengzhou, Western Sichuan, China. Energies 2023, 16, 1797. [Google Scholar] [CrossRef]
- Fu, X.L.; Dai, J.S.; Feng, J.W. Prediction of tectonic fractures in coal reservoirs using geomechanical method. Geosci. J. 2018, 22, 589–608. [Google Scholar]
- Ju, W.; Yang, Z.B.; Qin, Y.; Yi, T.S.; Zhang, Z.G. Characteristics of in-situ stress state and prediction of the permeability in the Upper Permian coalbed methane reservoir, western Guizhou region, SW China. J. Pet. Sci. Eng. 2018, 165, 199–211. [Google Scholar]
- Wang, J.L.; Li, M.; Xu, S.C.; Qu, Z.H.; Jiang, B. Simulation of Ground Stress Field and Advanced Prediction of Gas Outburst Risks in the Non-Mining Area of Xinjing Mine, China. Energies 2018, 11, 1285. [Google Scholar] [CrossRef]
- Li, S.G. An Introduction to Geomechanics: The Method and Practice of Geomechanics, Volume I, 2nd ed.; Geological Publishing House: Beijing, China, 1999; pp. 41–49, 80. (In Chinese) [Google Scholar]
- Yue, G.Y. A New Discussion on the Tectonic Framework in Liuzhi–Panxian–Shuicheng Region, Guizhou Province. Geol. Guizhou 1991, 8, 289–300, (In Chinese with English Abstract). [Google Scholar]
- Xie, R.H.; Qu, T.X.; Qian, G.M. Structural Geology; China University of Mining and Technology Press: Xuzhou, China, 1991; p. 230. (In Chinese) [Google Scholar]
- Wang, Y.; Du, W.; Wang, Y.Y.; Lin, R.Q.; Zhang, D.Q.; Zhao, F.P.; Sun, Z.; Chen, Y.; Wang, Y. Meso-cenozoic tectonic evolution of the Ziyun-Luodian fault in SW China. Front. Earth Sci. 2022, 10, 970944. [Google Scholar] [CrossRef]
- Ramsay, J.G.; Huber, M.I. The Techniques of Modern Structural Geology, Volume 2: Folds and Fractures; Academic Press: London, UK, 1997; pp. 641–666. [Google Scholar]
- Dou, X.Z.; Jiang, B.; Qin, Y.; Qu, Z.H.; Li, M. Tectonic Control of Coalbed Methane Reservoirs in Panxian, Western Guizhou. Geol. J. China Univ. 2012, 18, 447–452, (In Chinese with English Abstract). [Google Scholar]
- Yang, X.J.; Zhang, M.; Yan, X.Z. Study on acoustic logging-based rock elasticity parameters. Pet. Geol. Eng. 2008, 22, 39–42, (In Chinese with English Abstract). [Google Scholar]
- Liu, J.; Huang, C.; Zhou, L.; Chen, Q.; Zhang, S.L. Estimation of the rock mechanics and in-situ stress parameters of carbonate reservoirs using array sonic logging: A case study of Shunbei No.4 block. J. Geomech. 2024, 30, 394–407, (In Chinese with English Abstract). [Google Scholar] [CrossRef]
- Wu, Y.Y.; Zhao, Z.A.; Lai, Q.; Zhuang, C.X.; Zhang, Y.H.; Wang, Z.Y. Application of array acoustic logging technology in volcanic reservoir evaluation. Nat. Gas Explor. Dev. 2023, 46, 33–41, (In Chinese with English Abstract). [Google Scholar]
- Heidbach, O.; Rajabi, M.; Reiter, K.; Ziegler, M.; WSM Team. World Stress Map Database Release 2016; GFZ Data Services: Potsdam, Germany, 2016. [Google Scholar] [CrossRef]
- Heidbach, O.; Rajabi, M.; Reiter, K.; Ziegler, M. World Stress Map 2016; GFZ Data Services: Potsdam, Germany, 2016. [Google Scholar] [CrossRef]
- Xu, H.J.; Sang, S.X.; Yang, J.F.; Jin, J.; Hu, Y.B.; Liu, H.H.; Ren, P.; Gao, W. In-situ stress measurements by hydraulic fracturing and its implication on coalbed methane development in Western Guizhou, SW China. J. Unconv. Oil Gas Resour. 2016, 15, 1–10. [Google Scholar]
- Chen, S.D.; Tang, D.Z.; Tao, S.; Xu, H.; Zhao, J.L.; Fu, H.J.; Ren, P.F. In-situ stress, stress-dependent permeability, pore pressure and gas-bearing system in multiple coal seams in the Panguan area, western Guizhou, China. J. Nat. Gas Sci. Eng. 2018, 49, 110–122. [Google Scholar]
- Zhao, X.L.; Ju, W.; Yang, Z.B.; Wang, S.Y. Analysis of Present-day In-situ Stress Difference and Its Influencing Factors Between Two Limbs of Panguan Syncline in Western Guizhou Region. Coal Geol. China 2024, 36, 1–6, (In Chinese with English Abstract). [Google Scholar]
- Wan, T.F. Mesozoic Cenozoic intraplate deformation and tectonic stress field in China. J. Geomech. 1996, 2, 13. (In Chinese) [Google Scholar]
- Wan, T.F. Outline of Chinese Geotectonics; Geological Publishing House: Beijing, China, 2004; pp. 135–165. (In Chinese) [Google Scholar]
- Xie, J.T.; Qin, Q.R.; Fan, C.H. Quantitative Prediction of Fracture Distribution of the Longmaxi Formation in the Dingshan Area, China using FEM Numerical Simulation. Acta Geol. Sin. 2019, 93, 1662–1672. [Google Scholar] [CrossRef]
- Wong, W.H. The Mesozoic orogenic movement in eastern China. Bull. Geol. Soc. China 1929, 8, 33–44. [Google Scholar] [CrossRef]
- Wang, H.Z.; Mo, X.X. An outline of the tectonic evolution of China. Episodes 1995, 18, 6–16. [Google Scholar] [CrossRef] [PubMed]
- Dong, S.W.; Zhang, Y.Q.; Long, C.X.; Yang, Z.Y.; Ji, Q.; Wang, T.; Hu, J.M.; Chen, X.H. Jurassic Tectonic Revolution in China and New Interpretation of the Yanshan Movement. Aata Geol. Sin. 2007, 81, 1449–1461, (In Chinese with English Abstract). [Google Scholar]
- Yang, Z.B.; Zhang, Z.G.; Qin, Y.; Wu, C.C.; Yi, T.S.; Li, Y.Y.; Tang, J.; Chen, J. Optimization methods of production layer combination for coalbed methane development in multi-coal seams. Petrol. Explor. Dev. 2018, 45, 312–320. [Google Scholar] [CrossRef]


| Serial Number | Characteristics | Rock Formation Code | Stratigraphy | Thickness (m) | Thickness in the Model | Main Lithology | ||
|---|---|---|---|---|---|---|---|---|
| Adopted Values (m) | Illustrations | |||||||
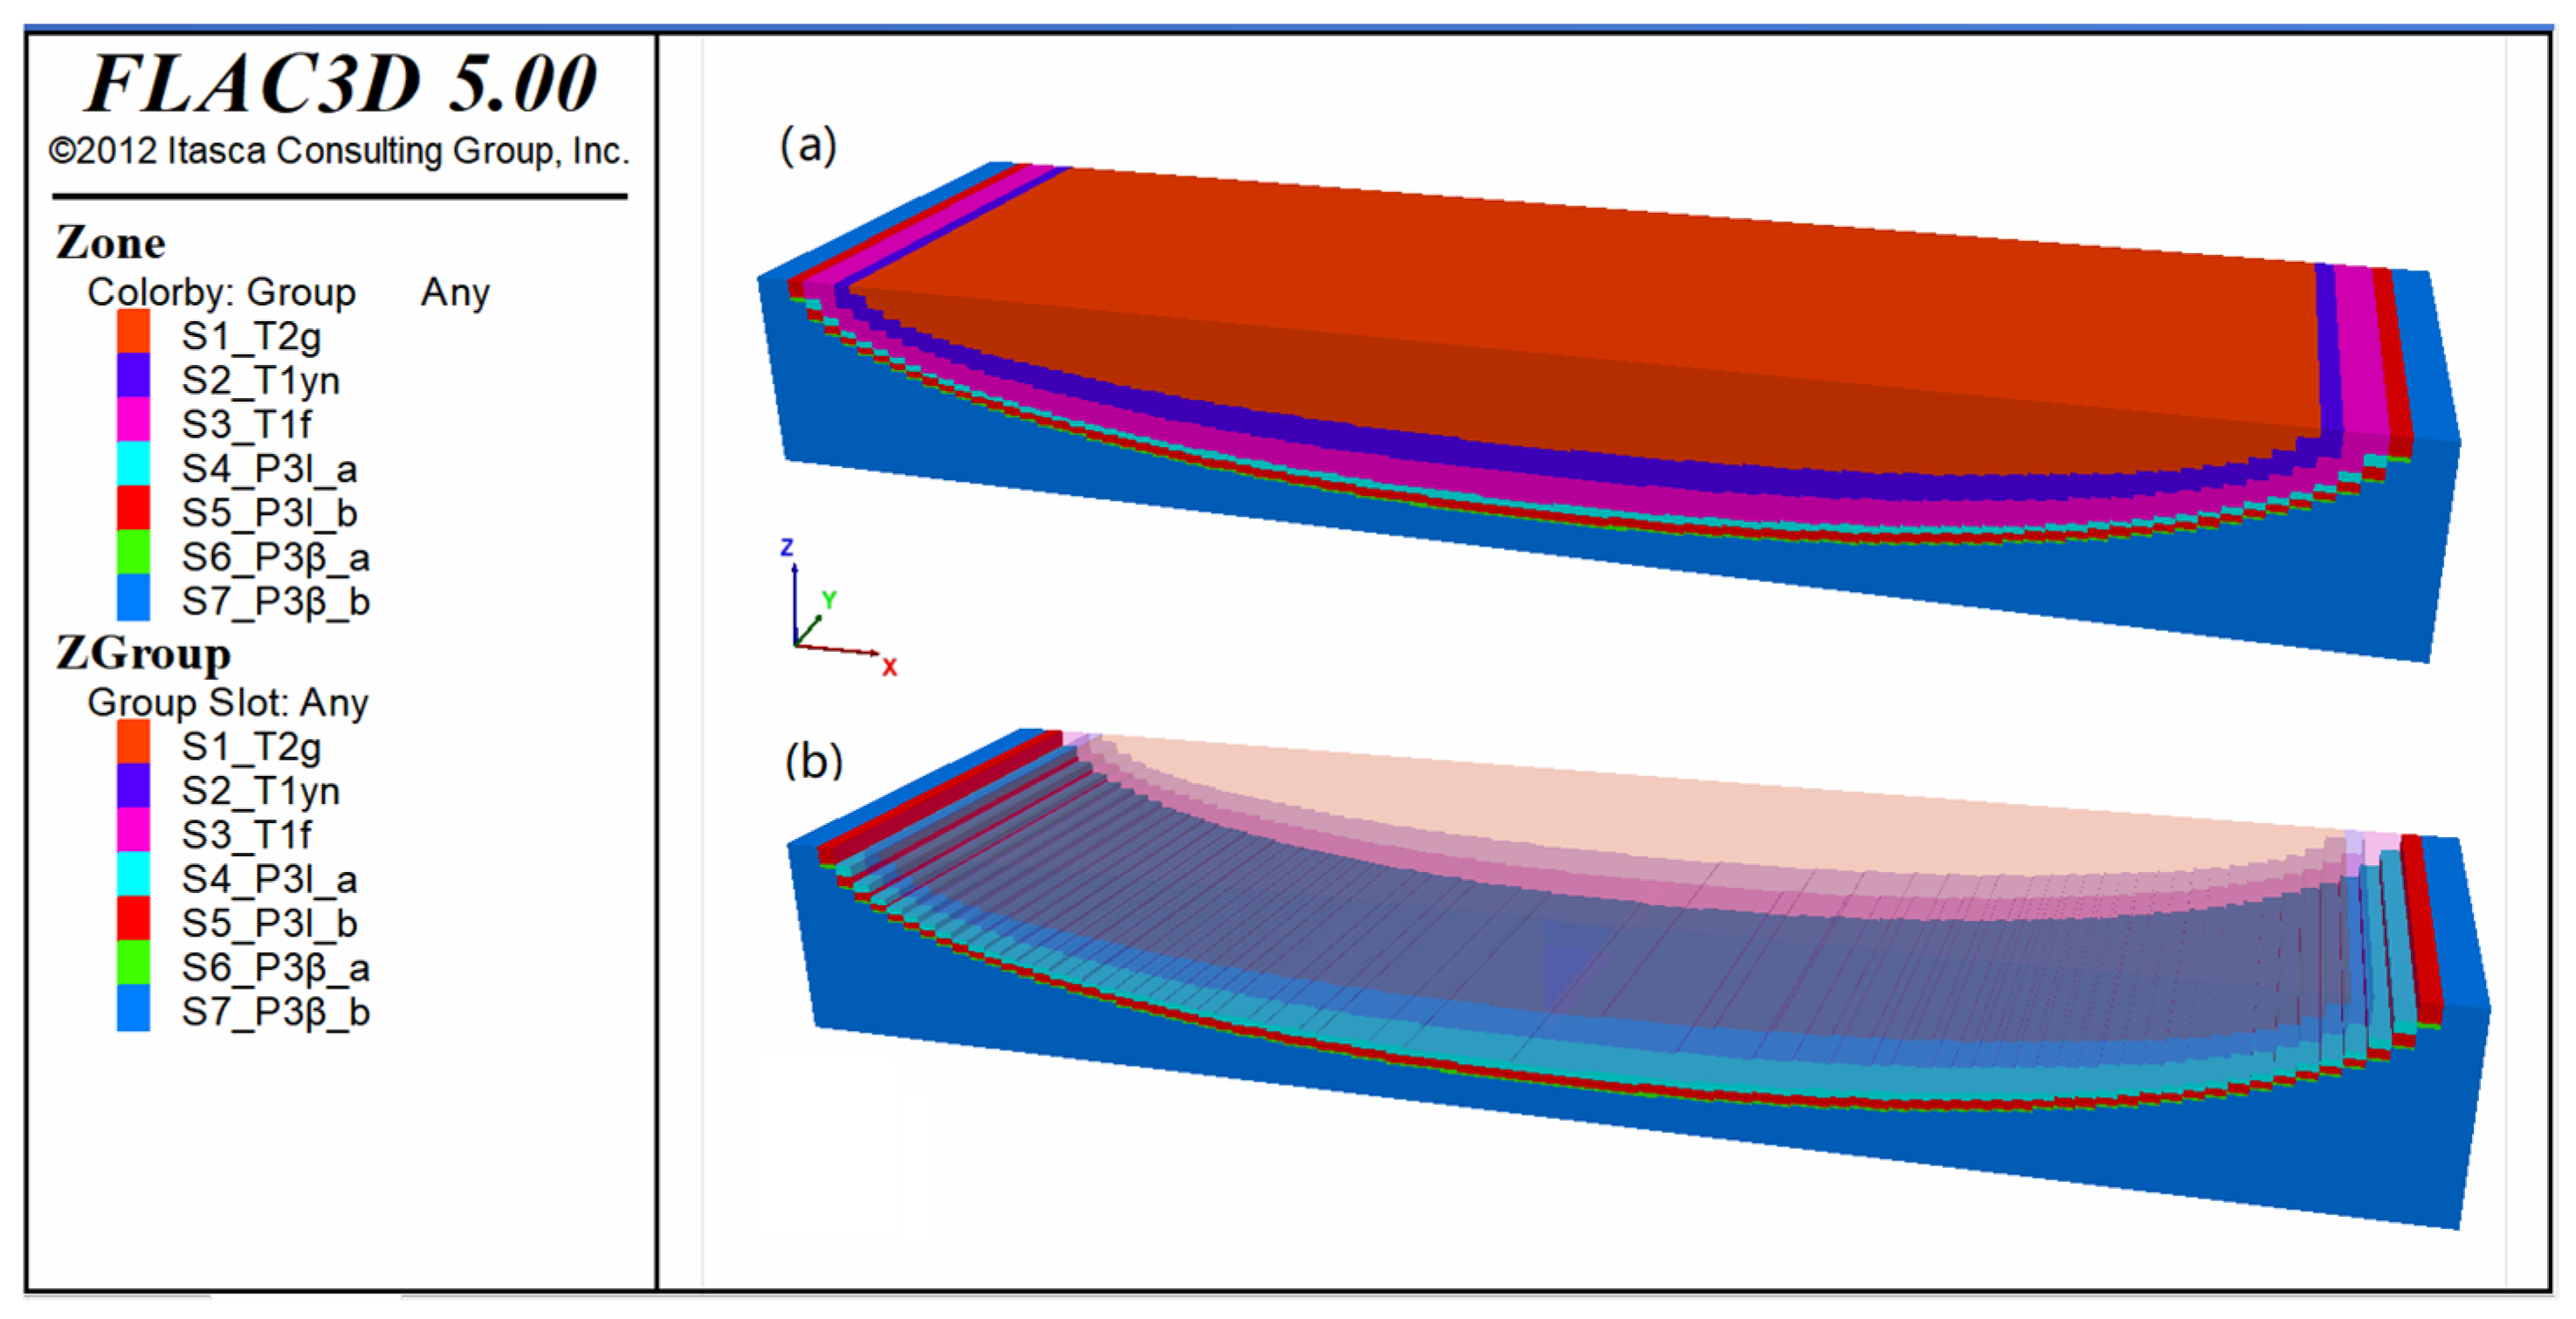
| 1 | Hard | S1_T2g | T2g | >600 | Determined based on the model size | Medium-thick dolomite and thick limestone. | ||
| 2 | Medium-hard | S2_T1yn | T1yn | 381–899 | 640 | Mid-value | Medium-thick limestone, containing dolomite. | |
| 3 | Medium-soft | S3_T1f | T1f | 451–780 | 610 | Mid-value | Medium-thick–thin sandstone, fine sandstone, and silty mudstone. | |
| 4 | Soft– | S4_P3l_a | P3l | 185–465 | 170 | Average value of drilling statistics | Above 17# coal | Siltstone, fine sandstone, silty mudstone, mudstone and carbonaceous mudstone, coal seams, etc. The 17# coal is one of the main mineable coal seams. |
| 5 | Coal seam | 17# coal | ||||||
| 6 | Soft+ | S5_P3l_b | 200 | Under 17# coal | ||||
| 7 | Medium-soft | S6_P3beta_a | P3β | 200–732 | 60 | Average value of drilling statistics | Coal-bearing | Mainly tuff, interbedded with sand, mudstone, and thin coal seams. |
| 8 | Hard | S7_P3beta_b | Determined based on the model size | Coal-excluding | Basalt, volcanic breccia, and tuff. | |||
| Serial Number | Stratigraphy | Rock Formation Code | Density (kg/m3) | Elastic Modulus (GPa) | Poisson’s Ratio | Bulk Modulus (GPa) | Shear Modulus (GPa) |
|---|---|---|---|---|---|---|---|
| 1 | T2g | S1_T2g | 2700 | 60.0 | 0.23 | 37.0 | 24.4 |
| 2 | T1yn | S2_T1yn | 2650 | 45.0 | 0.25 | 30.0 | 18.0 |
| 3 | T1f | S3_T1f | 2600 | 32.0 | 0.27 | 23.2 | 12.6 |
| 4 | P3l | S4_P3l_a | 2350 | 21.0 | 0.30 | 17.5 | 8.1 |
| 5 | S5_P3l_b | 2400 | 24.0 | 0.29 | 19.0 | 9.3 | |
| 6 | P3β | S6_P3beta_a | 2600 | 30.0 | 0.27 | 21.7 | 11.8 |
| 7 | S7_P3beta_b | 2800 | 63.0 | 0.22 | 37.5 | 25.8 | |
| 8 | P3l | S8_P3l_a+b | 2350 | 22.0 | 0.29 | 17.5 | 8.5 |
| Serial Number | Stratigraphy | Rock Formation Code | Normal Stiffness (GPa) | Tangential Stiffness (GPa) | Tensile Strength (MPa) | Cohesion (MPa) | Internal Friction Angle (°) |
| 9 | Fault zone | Interface 1 | 0.1 | 0.1 | 0.2 | 0.3 | 15 |
| Site | Axes | Principal Stress (First Stage) | Principal Stress (Second Stage) | Site | Axes | Principal Stress (First Stage) | Principal Stress (Second Stage) | ||||
|---|---|---|---|---|---|---|---|---|---|---|---|
| Azimuth (°) | Plunge (°) | Azimuth (°) | Plunge (°) | Azimuth (°) | Plunge (°) | Azimuth (°) | Plunge (°) | ||||
| 15–1 | σ1 | 296 | 16 | / | / | 17–5 | σ1 | 127 | 15 | / | / |
| σ2 | 97 | 74 | / | / | σ2 | 268 | 71 | / | / | ||
| σ3 | 204 | 6 | / | / | σ3 | 34 | 12 | / | / | ||
| 15–2 | σ1 | 292 | 31 | / | / | 17–6 | σ1 | 126 | 33 | 212 | 11 |
| σ2 | 114 | 59 | / | / | σ2 | 295 | 57 | 95 | 68 | ||
| σ3 | 22 | 2 | / | / | σ3 | 33 | 6 | 305 | 19 | ||
| 15–4 | σ1 | / | / | 186 | 21 | 17–7 | σ1 | 132 | 27 | 19 | 31 |
| σ2 | / | / | 342 | 68 | σ2 | 329 | 63 | 185 | 59 | ||
| σ3 | / | / | 92 | 11 | σ3 | 226 | 7 | 286 | 7 | ||
| 15–5 | σ1 | / | / | 9 | 9 | 17–8 | σ1 | 106 | 6 | 202 | 2 |
| σ2 | / | / | 212 | 80 | σ2 | 210 | 69 | 51 | 88 | ||
| σ3 | / | / | 100 | 4 | σ3 | 13 | 21 | 292 | 1 | ||
| 15–7 | σ1 | 127 | 8 | / | / | 18–1 | σ1 | / | / | 206 | 32 |
| σ2 | 348 | 79 | / | / | σ2 | / | / | 28 | 58 | ||
| σ3 | 218 | 7 | / | / | σ3 | / | / | 297 | 2 | ||
| 16–1 | σ1 | 104 | 3 | / | / | 18–2 | σ1 | 85 | 19 | / | / |
| σ2 | 352 | 73 | / | / | σ2 | 263 | 71 | / | / | ||
| σ3 | 195 | 7 | / | / | σ3 | 354 | 1 | / | / | ||
| 16–3 | σ1 | 288 | 6 | / | / | 18–3 | σ1 | 282 | 21 | 33 | 8 |
| σ2 | 170 | 78 | / | / | σ2 | / | / | 139 | 65 | ||
| σ3 | 19 | 11 | / | / | σ3 | / | / | 301 | 24 | ||
| 16–5 | σ1 | 286 | 20 | / | / | 18–4 | σ1 | / | / | 5 | 16 |
| σ2 | 78 | 68 | / | / | σ2 | / | / | 230 | 68 | ||
| σ3 | 192 | 10 | / | / | σ3 | / | / | 99 | 14 | ||
| 16–8 | σ1 | / | / | 221 | 5 | 18–5 | σ1 | / | / | 38 | 13 |
| σ2 | / | / | 109 | 79 | σ2 | / | / | 192 | 74 | ||
| σ3 | / | / | 312 | 10 | σ3 | / | / | 307 | 7 | ||
| 16–9 | σ1 | / | / | 38 | 17 | 18–6 | σ1 | 284 | 29 | 234 | 9 |
| σ2 | / | / | 246 | 71 | σ2 | 97 | 61 | 111 | 73 | ||
| σ3 | / | / | 125 | 10 | σ3 | 202 | 8 | 327 | 13 | ||
| 17–2 | σ1 | 111 | 18 | / | / | 18–7 | σ1 | 110 | 30 | 212 | 28 |
| σ2 | 321 | 70 | / | / | σ2 | 268 | 58 | 60 | 60 | ||
| σ3 | 204 | 10 | / | / | σ3 | 14 | 10 | 318 | 8 | ||
| 17–3 | σ1 | / | / | 25 | 5 | 20–1 | σ1 | 288 | 9 | / | / |
| σ2 | / | / | 266 | 79 | σ2 | 140 | 79 | / | / | ||
| σ3 | / | / | 115 | 10 | σ3 | 18 | 6 | / | / | ||
| 17–4 | σ1 | / | / | 200 | 15 | 20–2 | σ1 | 127 | 6 | / | / |
| σ2 | / | / | 70 | 68 | σ2 | 270 | 83 | / | / | ||
| σ3 | / | / | 294 | 17 | σ3 | 37 | 4 | / | / | ||
Disclaimer/Publisher’s Note: The statements, opinions and data contained in all publications are solely those of the individual author(s) and contributor(s) and not of MDPI and/or the editor(s). MDPI and/or the editor(s) disclaim responsibility for any injury to people or property resulting from any ideas, methods, instructions or products referred to in the content. |
© 2025 by the authors. Licensee MDPI, Basel, Switzerland. This article is an open access article distributed under the terms and conditions of the Creative Commons Attribution (CC BY) license (https://creativecommons.org/licenses/by/4.0/).
Share and Cite
Wang, J.; Jiang, L.; Cang, T.; Zhou, X.; Wang, B. Simulation of a Multi-Stage Stress Field and Regional Prediction of Structural Fractures in the Tucheng Syncline, Western Guizhou, China. Geosciences 2025, 15, 132. https://doi.org/10.3390/geosciences15040132
Wang J, Jiang L, Cang T, Zhou X, Wang B. Simulation of a Multi-Stage Stress Field and Regional Prediction of Structural Fractures in the Tucheng Syncline, Western Guizhou, China. Geosciences. 2025; 15(4):132. https://doi.org/10.3390/geosciences15040132
Chicago/Turabian StyleWang, Jilin, Lijun Jiang, Tiancheng Cang, Xiaozhi Zhou, and Bicong Wang. 2025. "Simulation of a Multi-Stage Stress Field and Regional Prediction of Structural Fractures in the Tucheng Syncline, Western Guizhou, China" Geosciences 15, no. 4: 132. https://doi.org/10.3390/geosciences15040132
APA StyleWang, J., Jiang, L., Cang, T., Zhou, X., & Wang, B. (2025). Simulation of a Multi-Stage Stress Field and Regional Prediction of Structural Fractures in the Tucheng Syncline, Western Guizhou, China. Geosciences, 15(4), 132. https://doi.org/10.3390/geosciences15040132