
A Comparison of Array Configurations in Python-Based Software for ERT Data in Shallow Hazard Detection

 ,
,  ,
,  , , and
Abstract
1. Introduction
2. Methodology
2.1. Open-Source Framework
- PyGIMLi
- BERT
2.2. Numerical Modeling
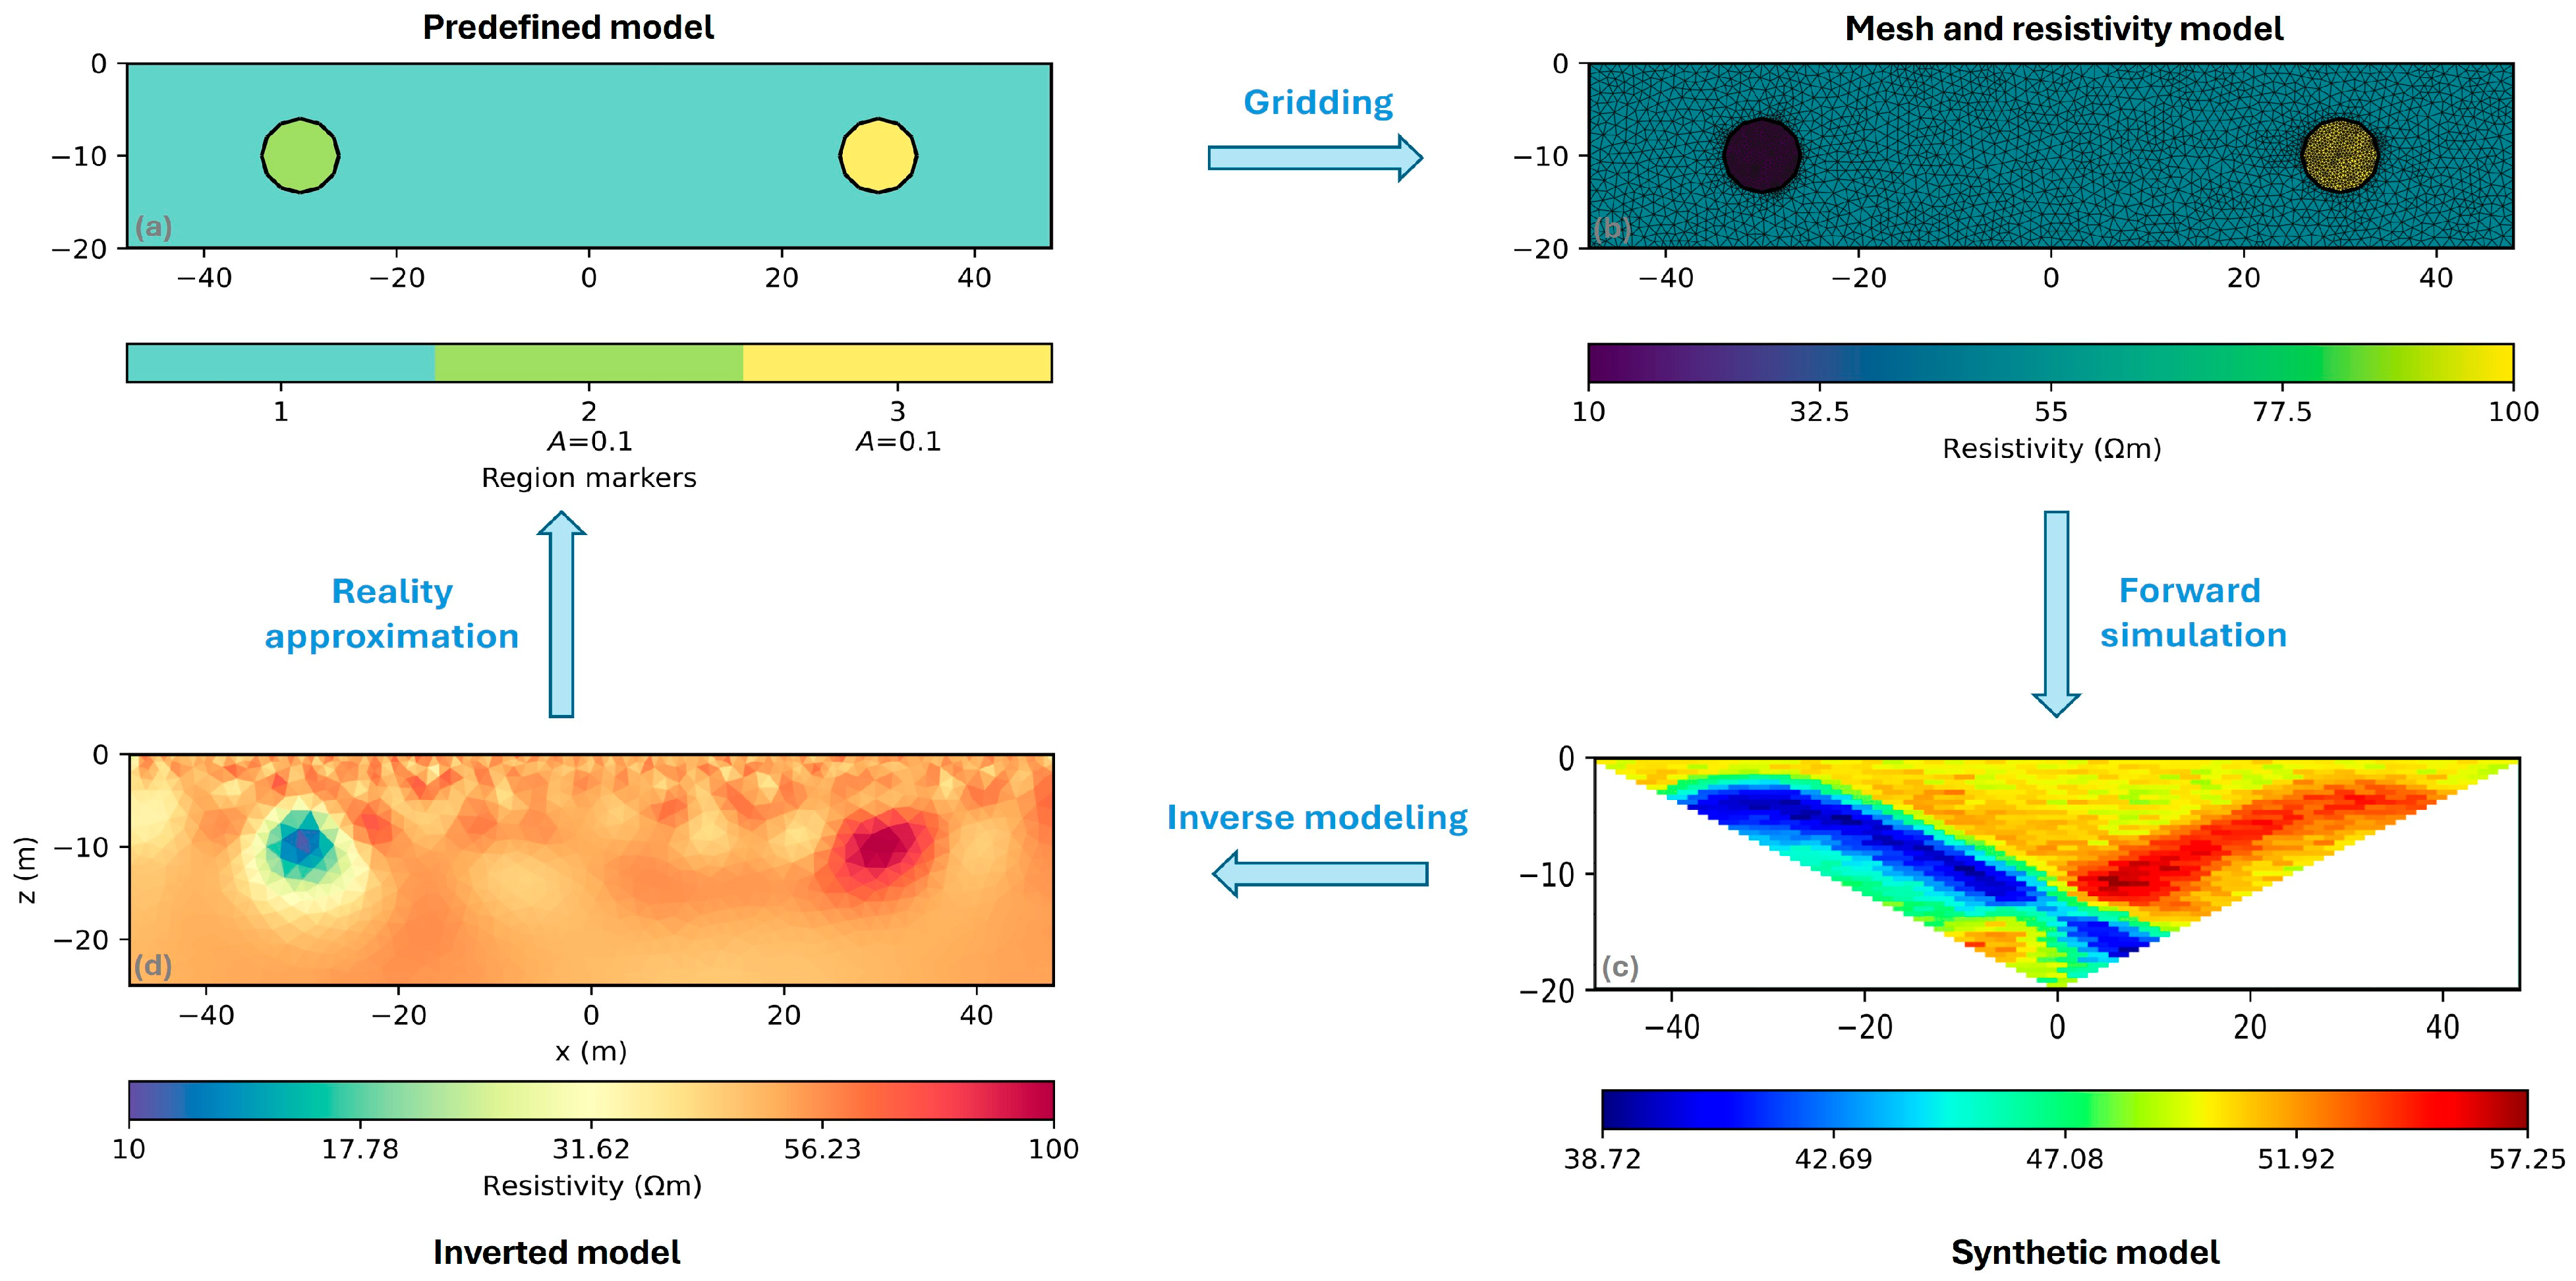
2.2.1. ERT Synthetic Model 1: Underground Cavities
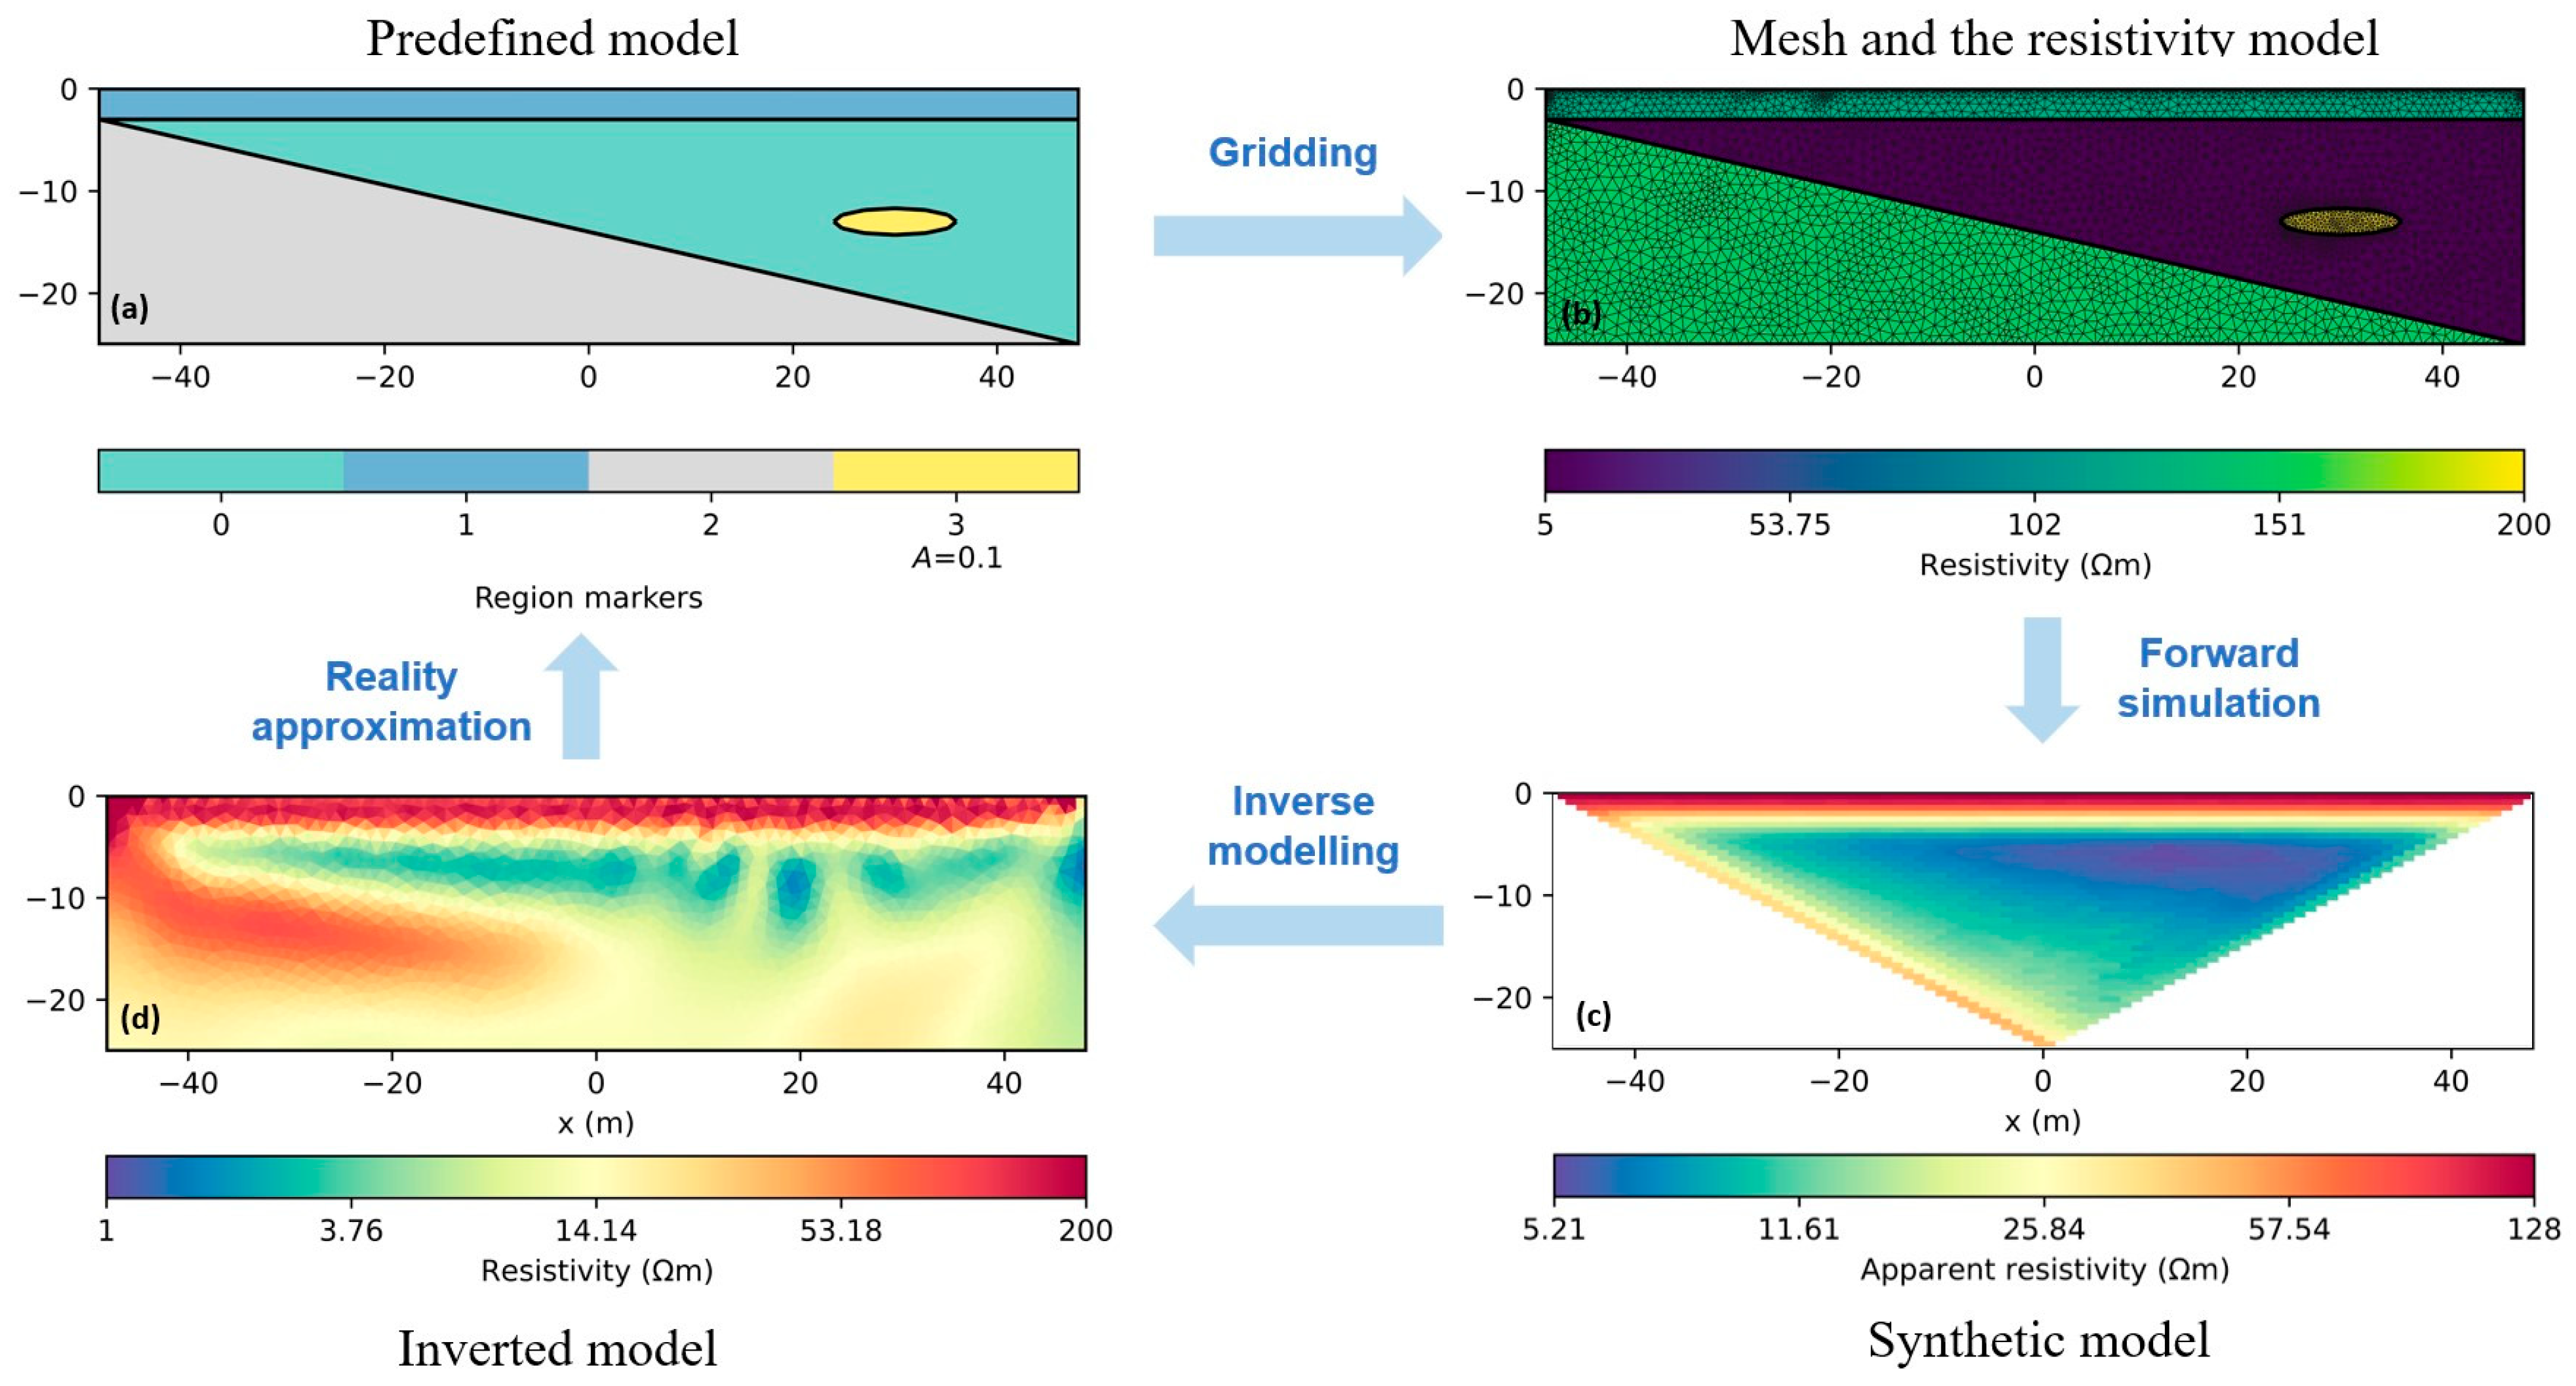
2.2.2. ERT Synthetic Model 2: Landslide
2.3. Inverse Modeling
3. Results and Discussion
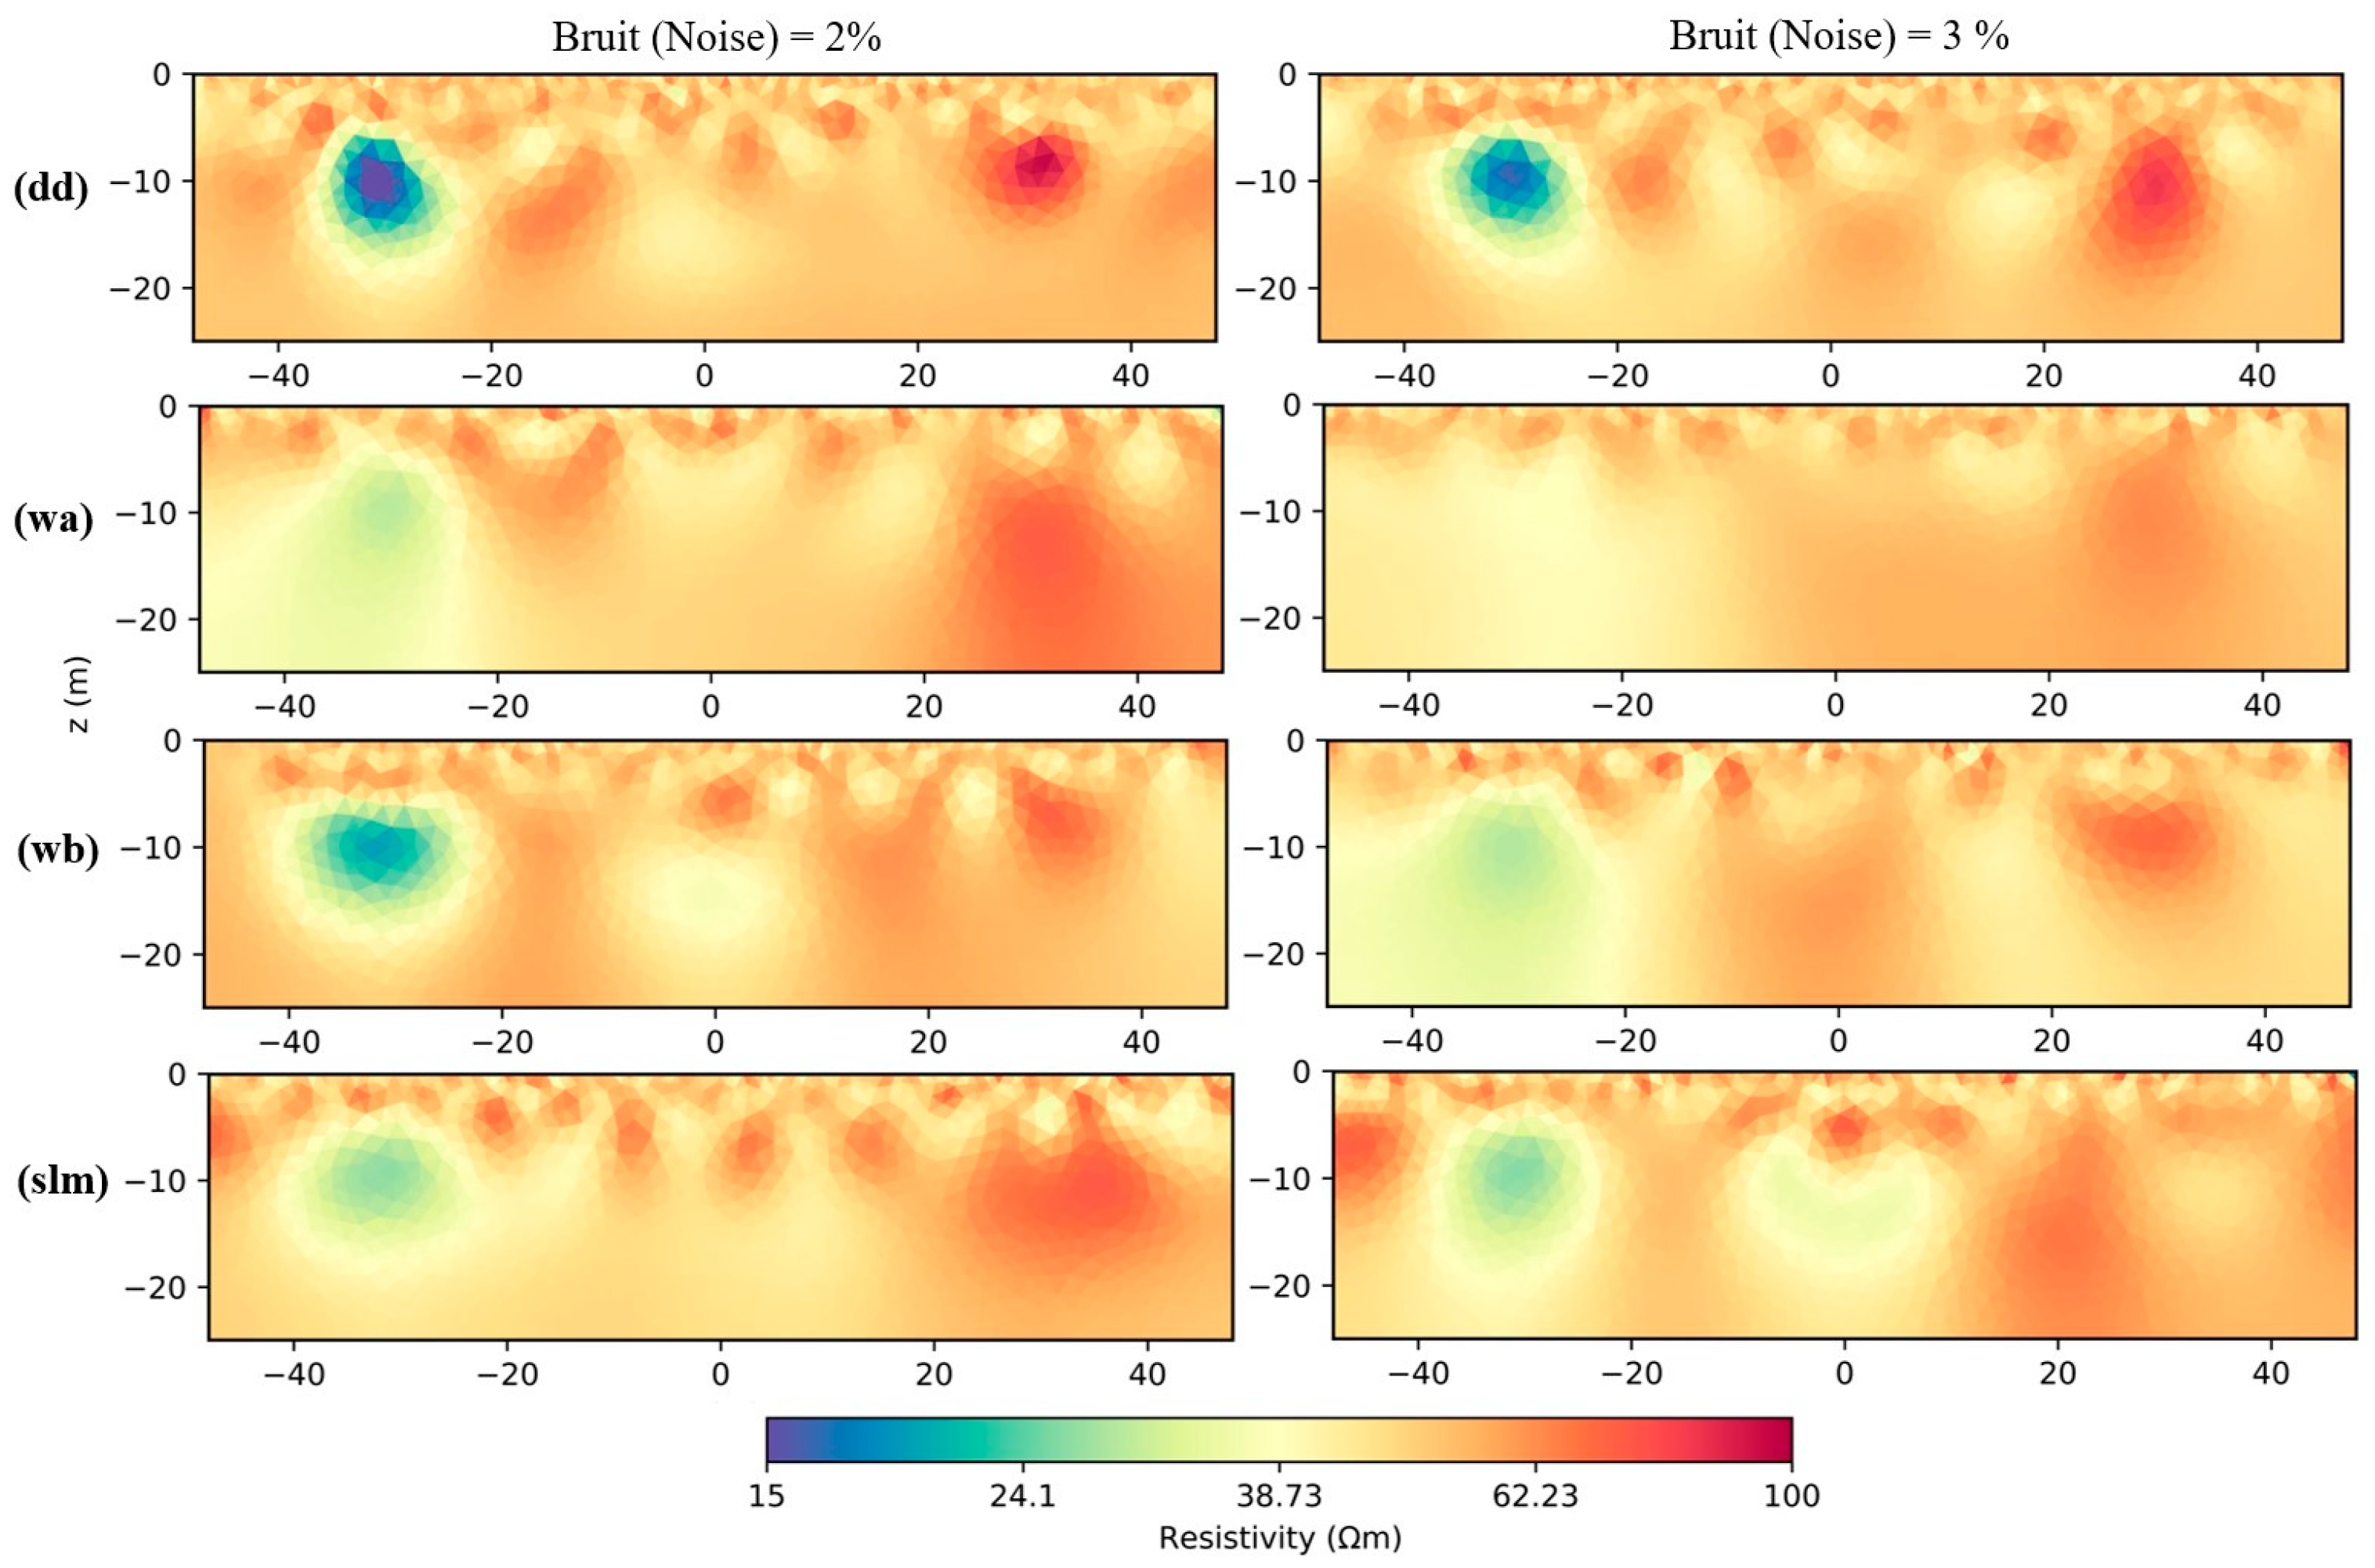
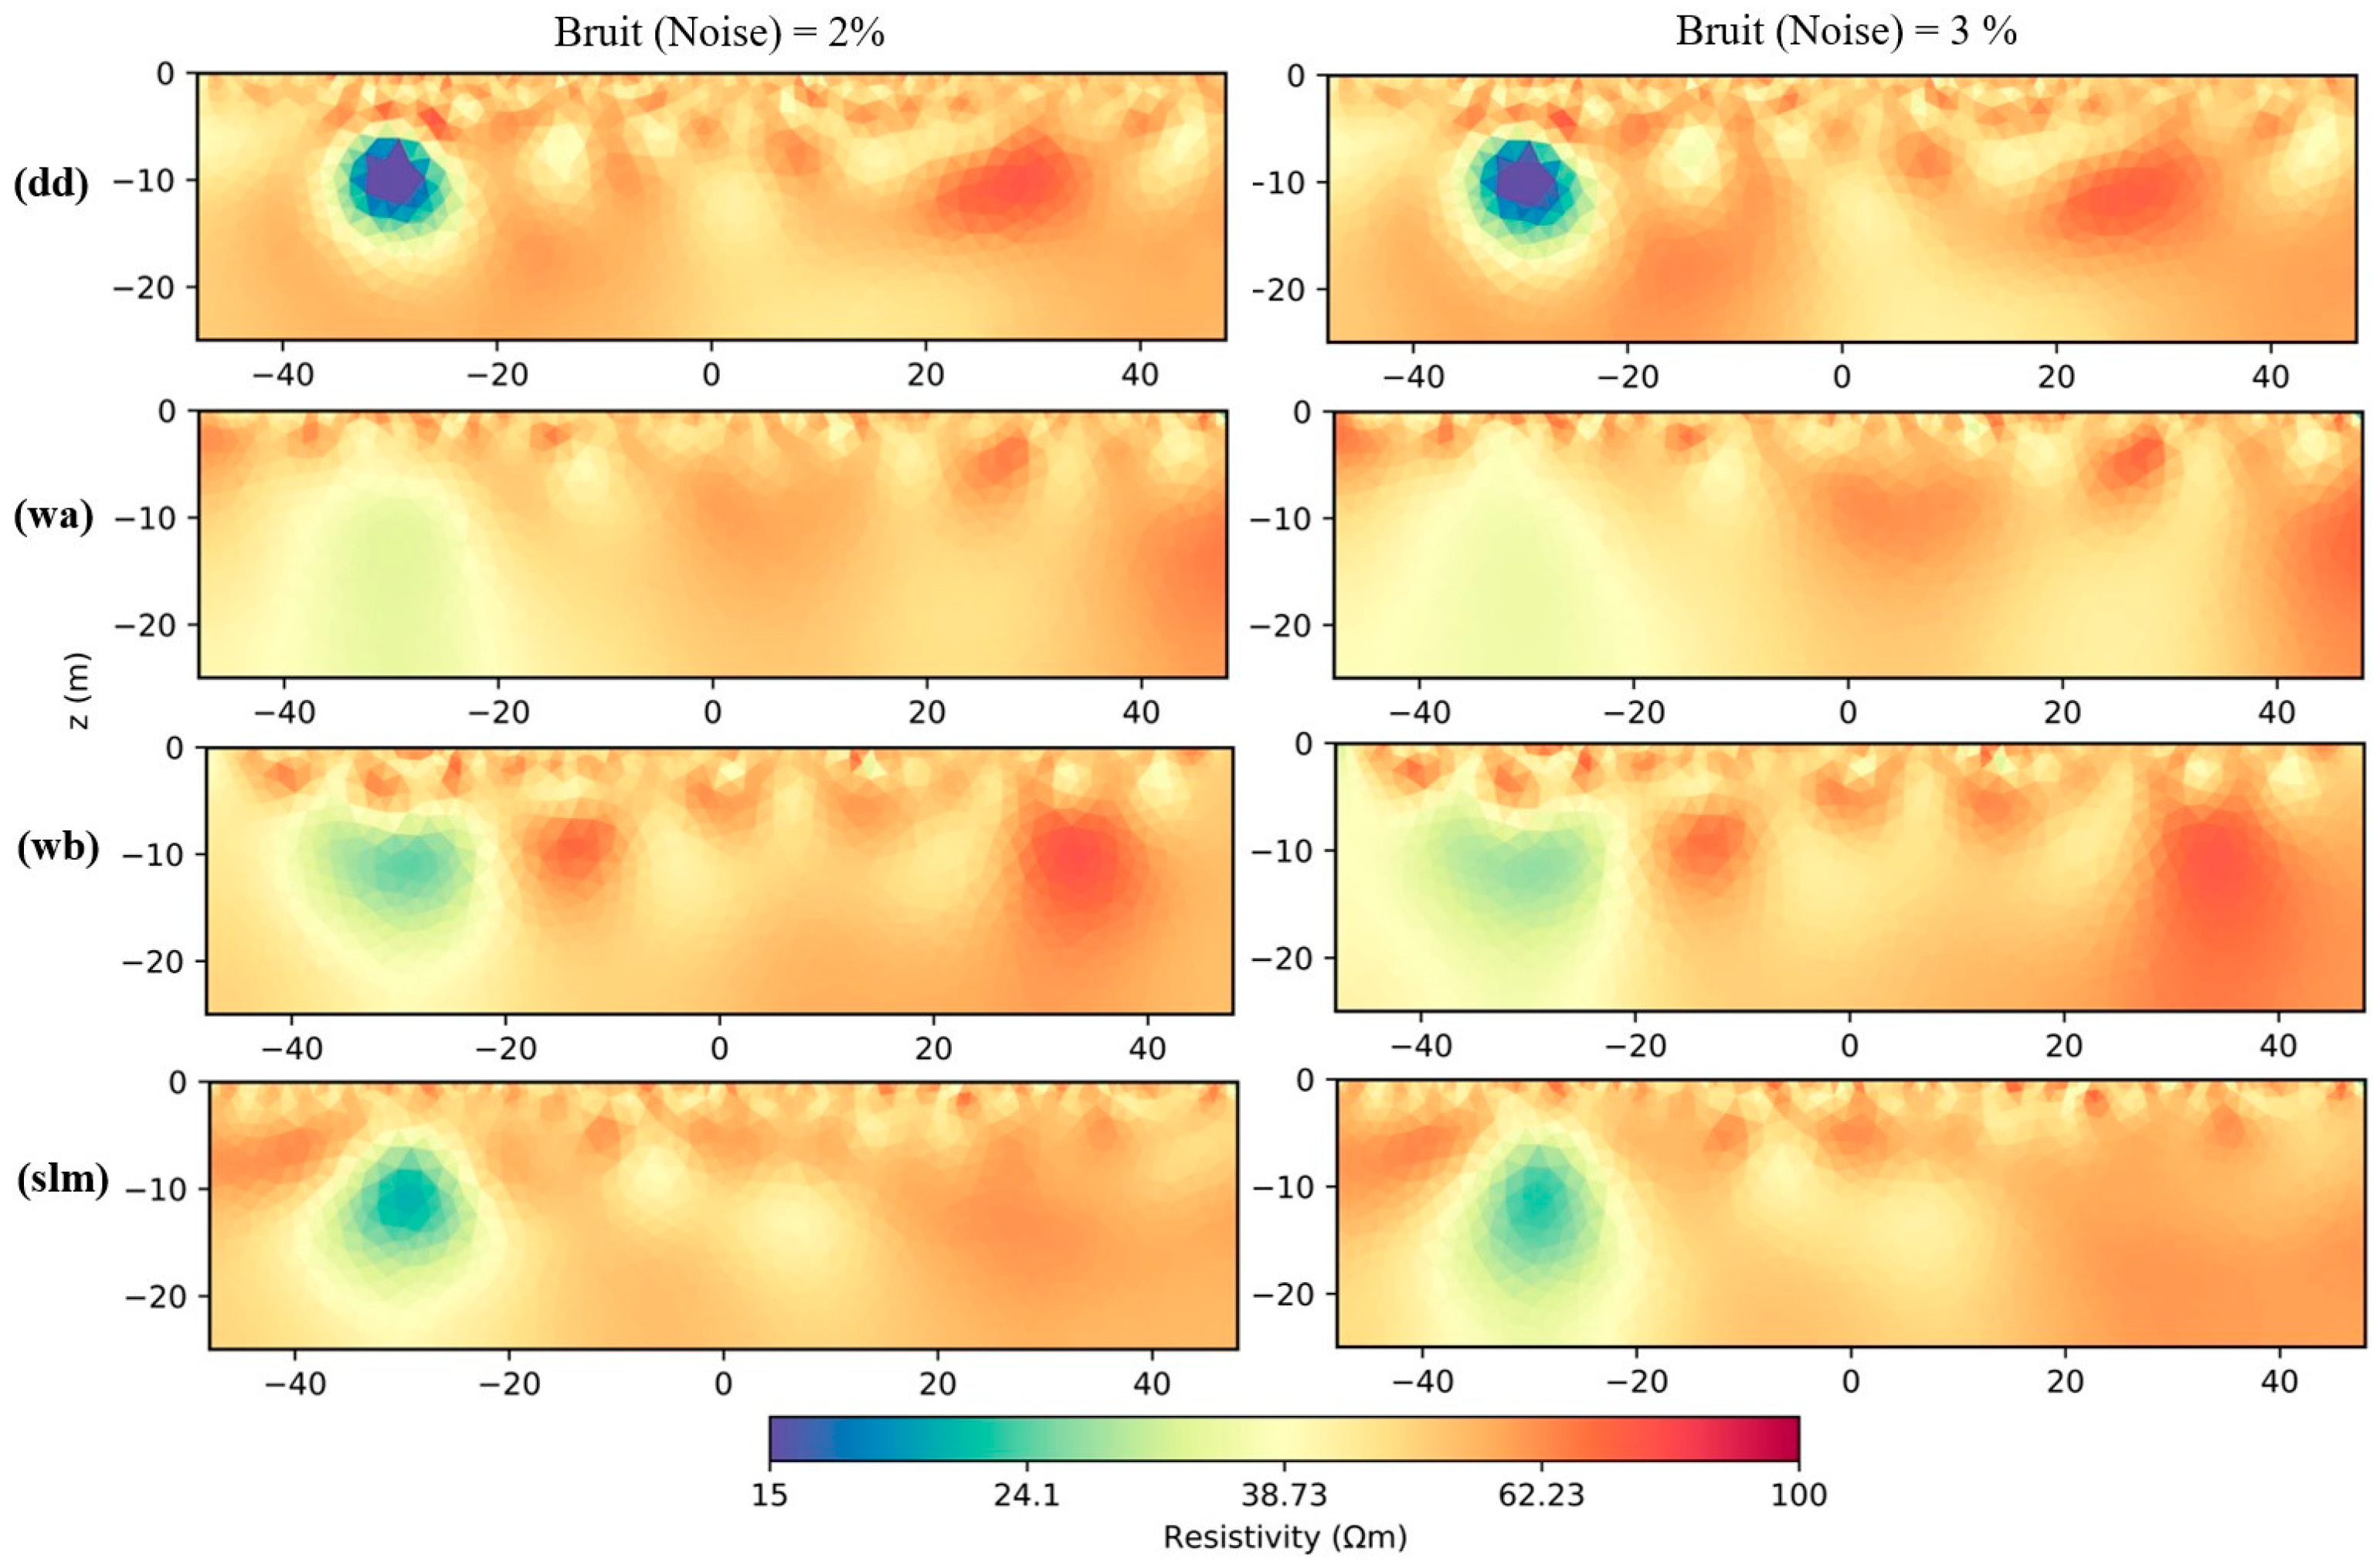
3.1. Synthetic Model 1 Inversion Results
3.1.1. BERT M1 Inversion Results
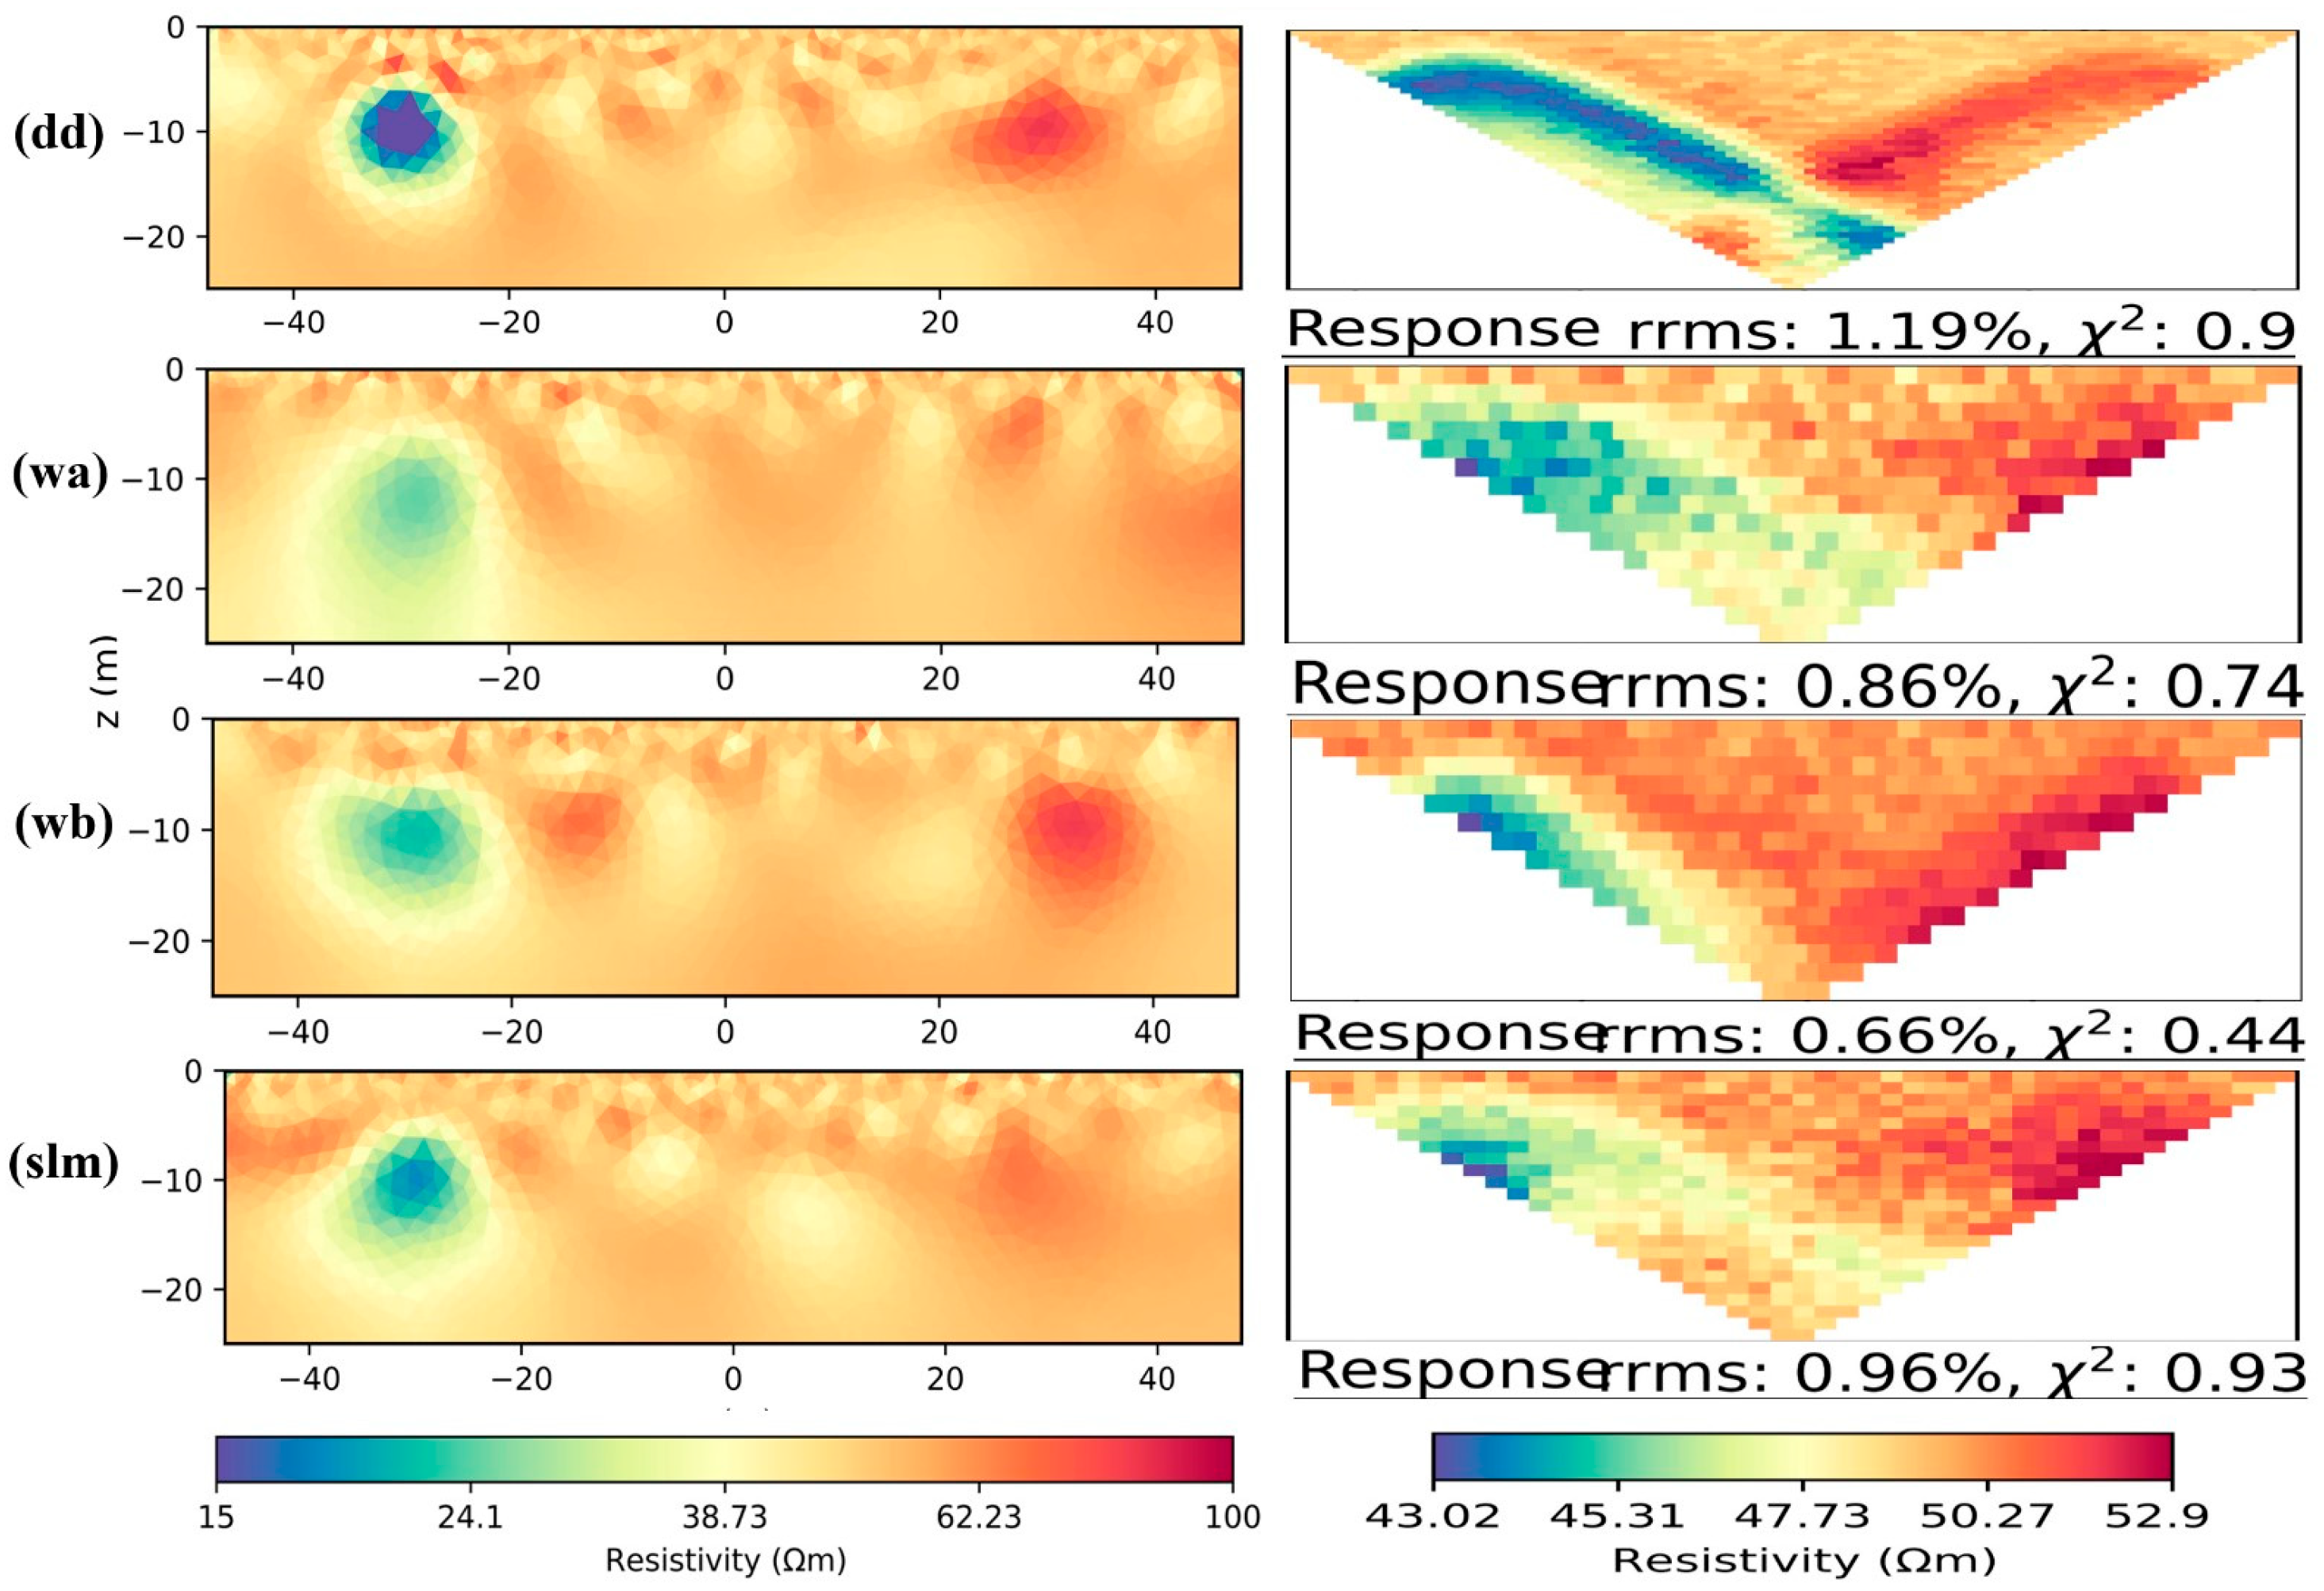
3.1.2. PyGIMLi M1 Inversion Results
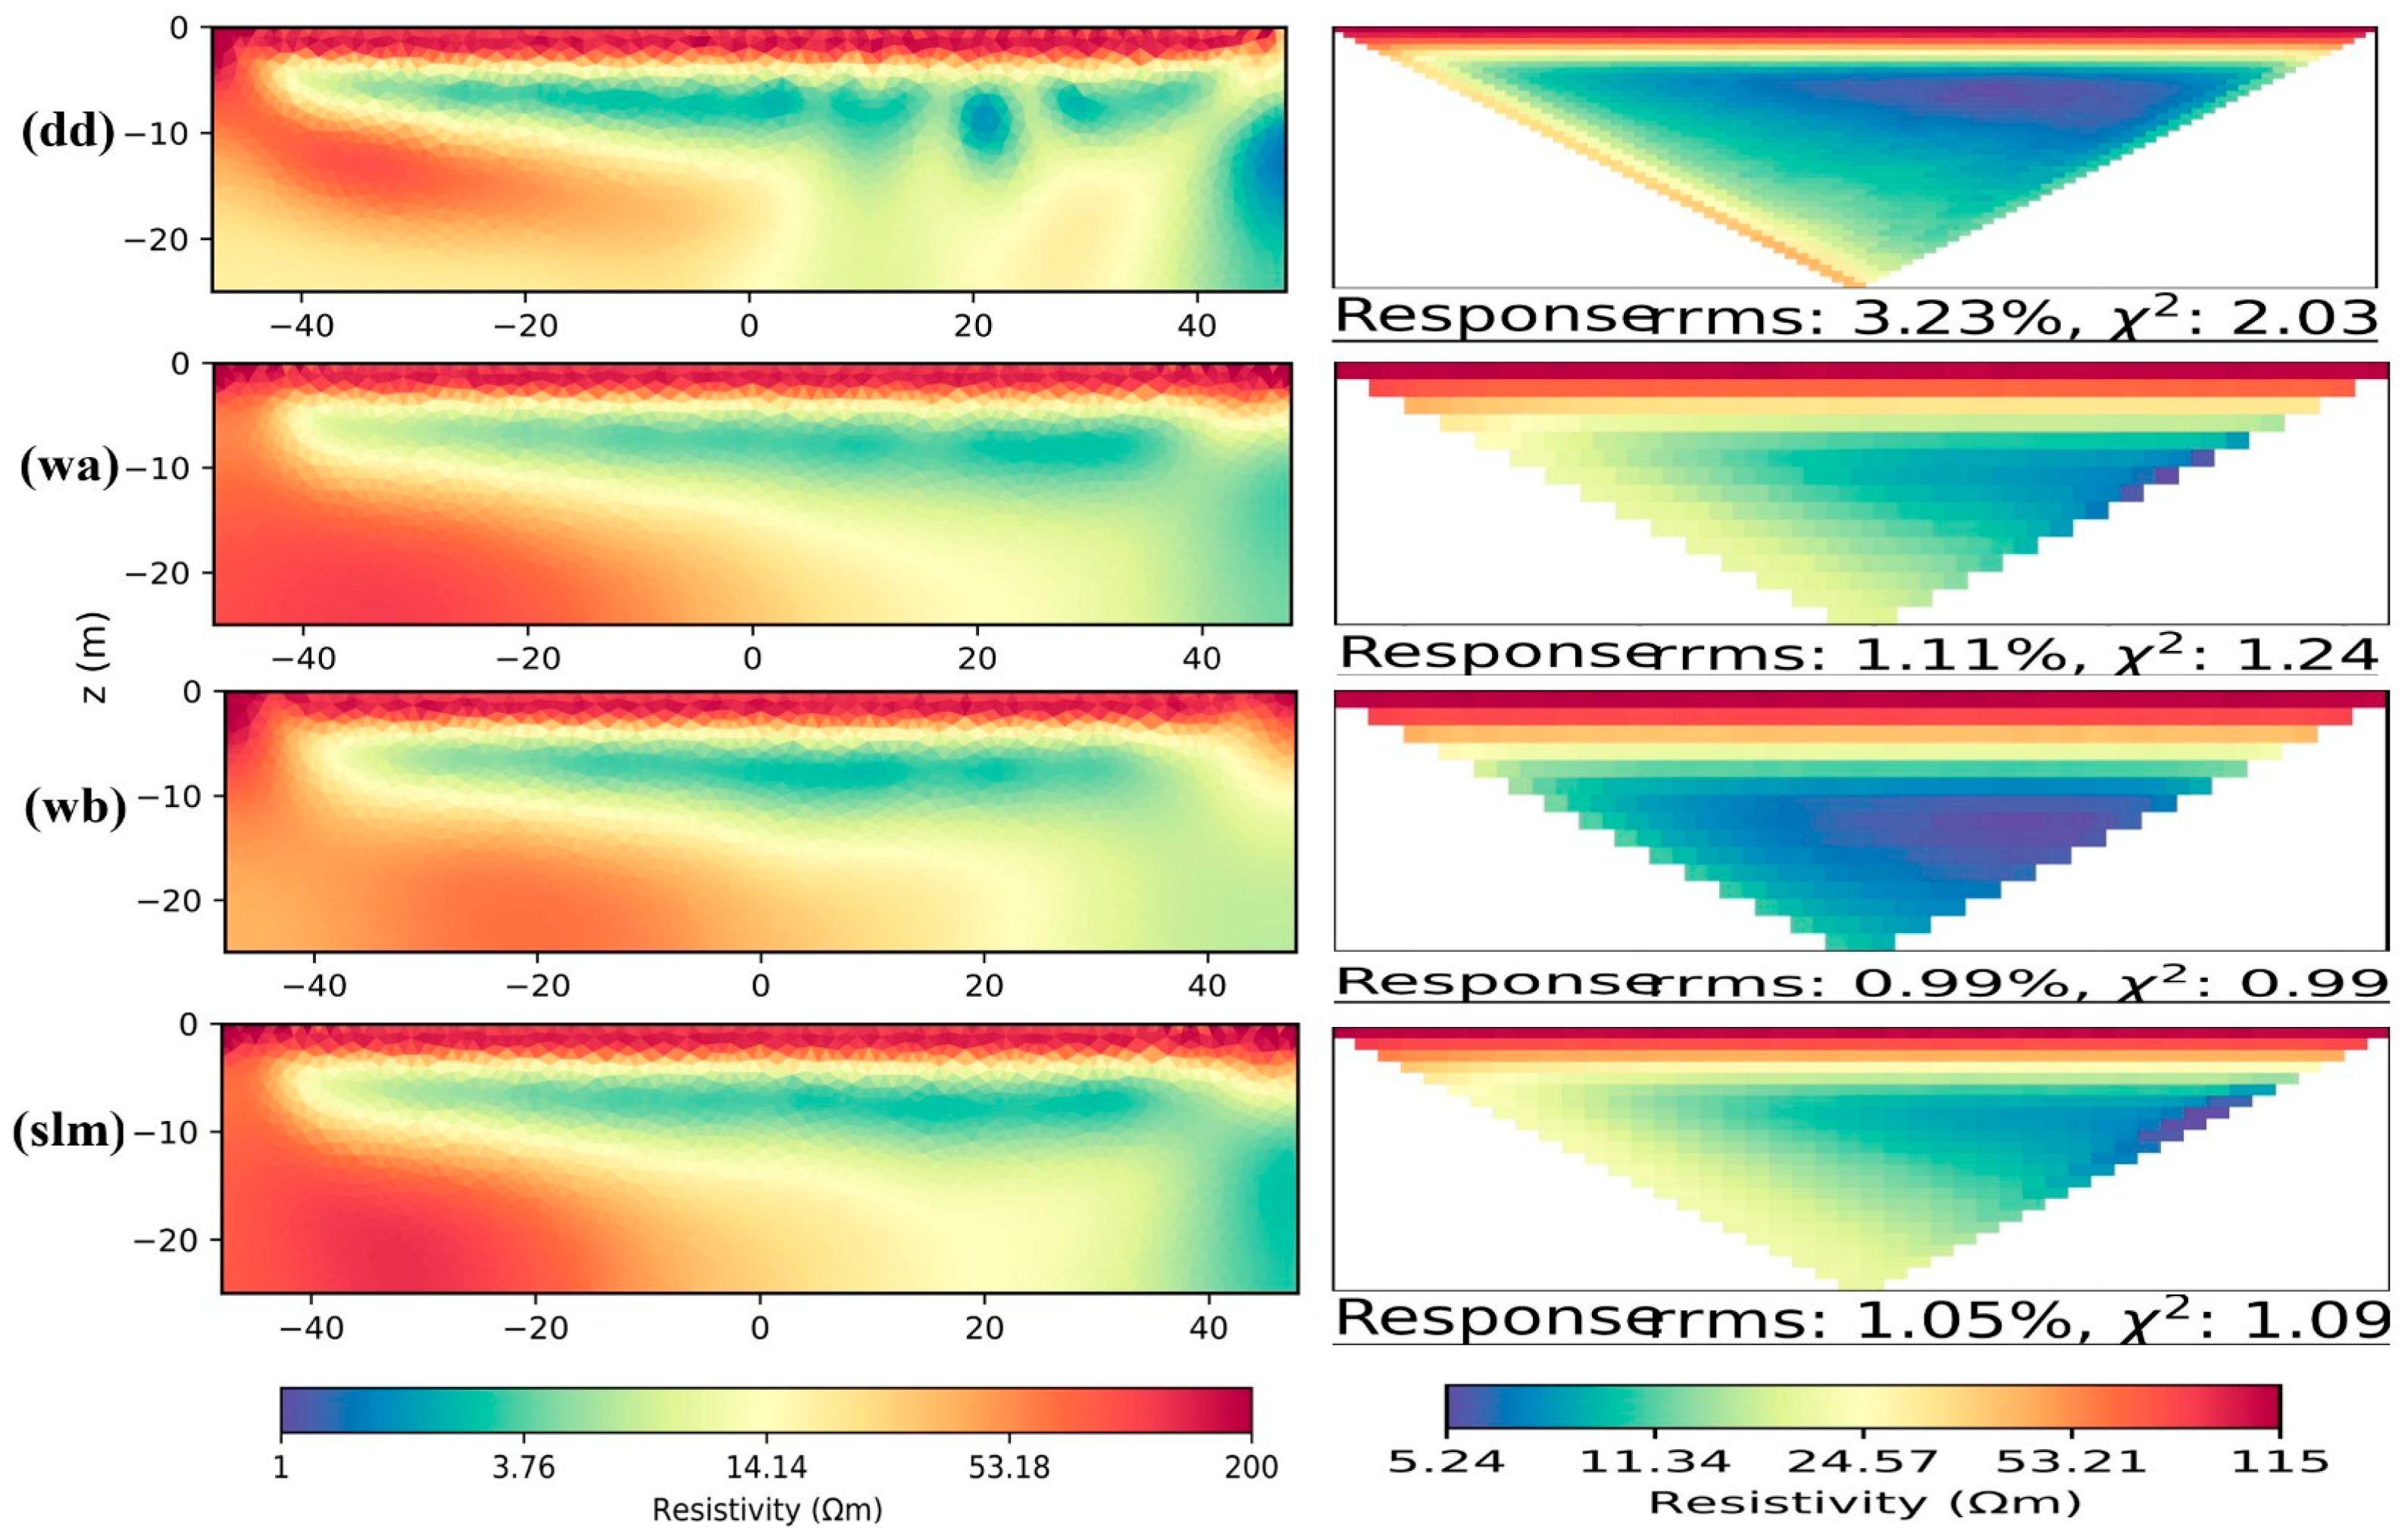
3.2. Synthetic Model 2 Inversion Results
3.2.1. BERT M2 Inversion Results
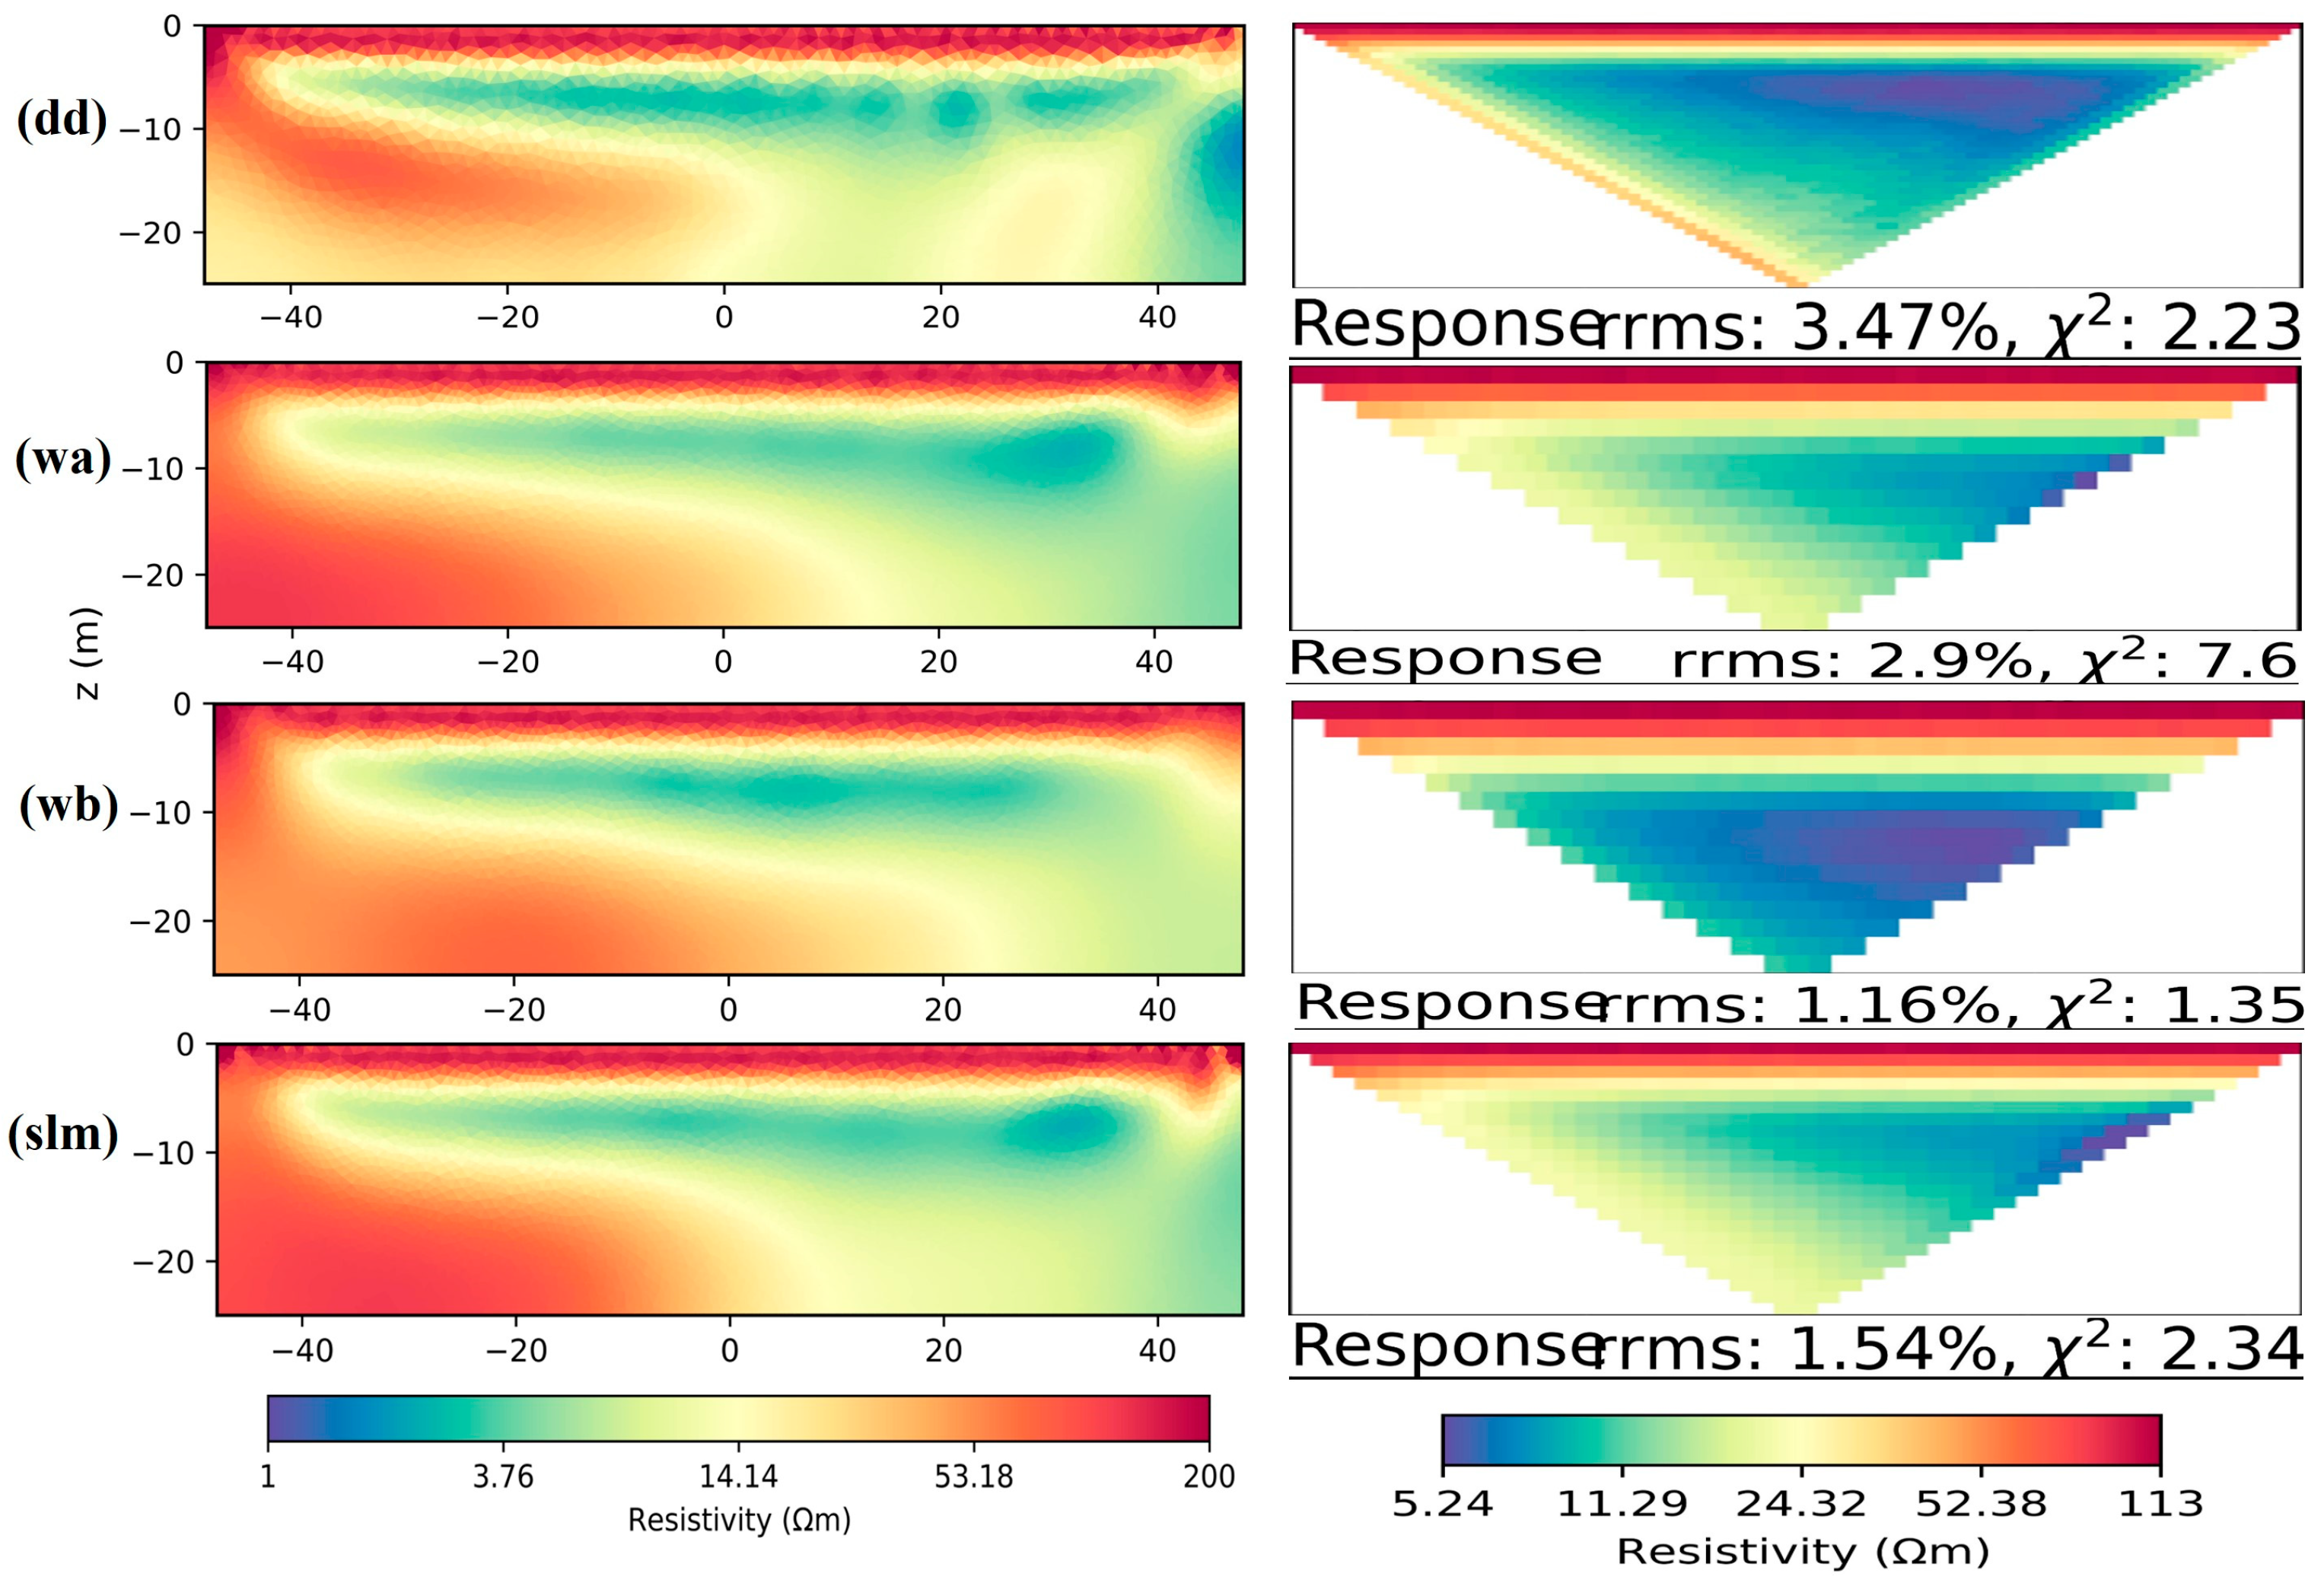
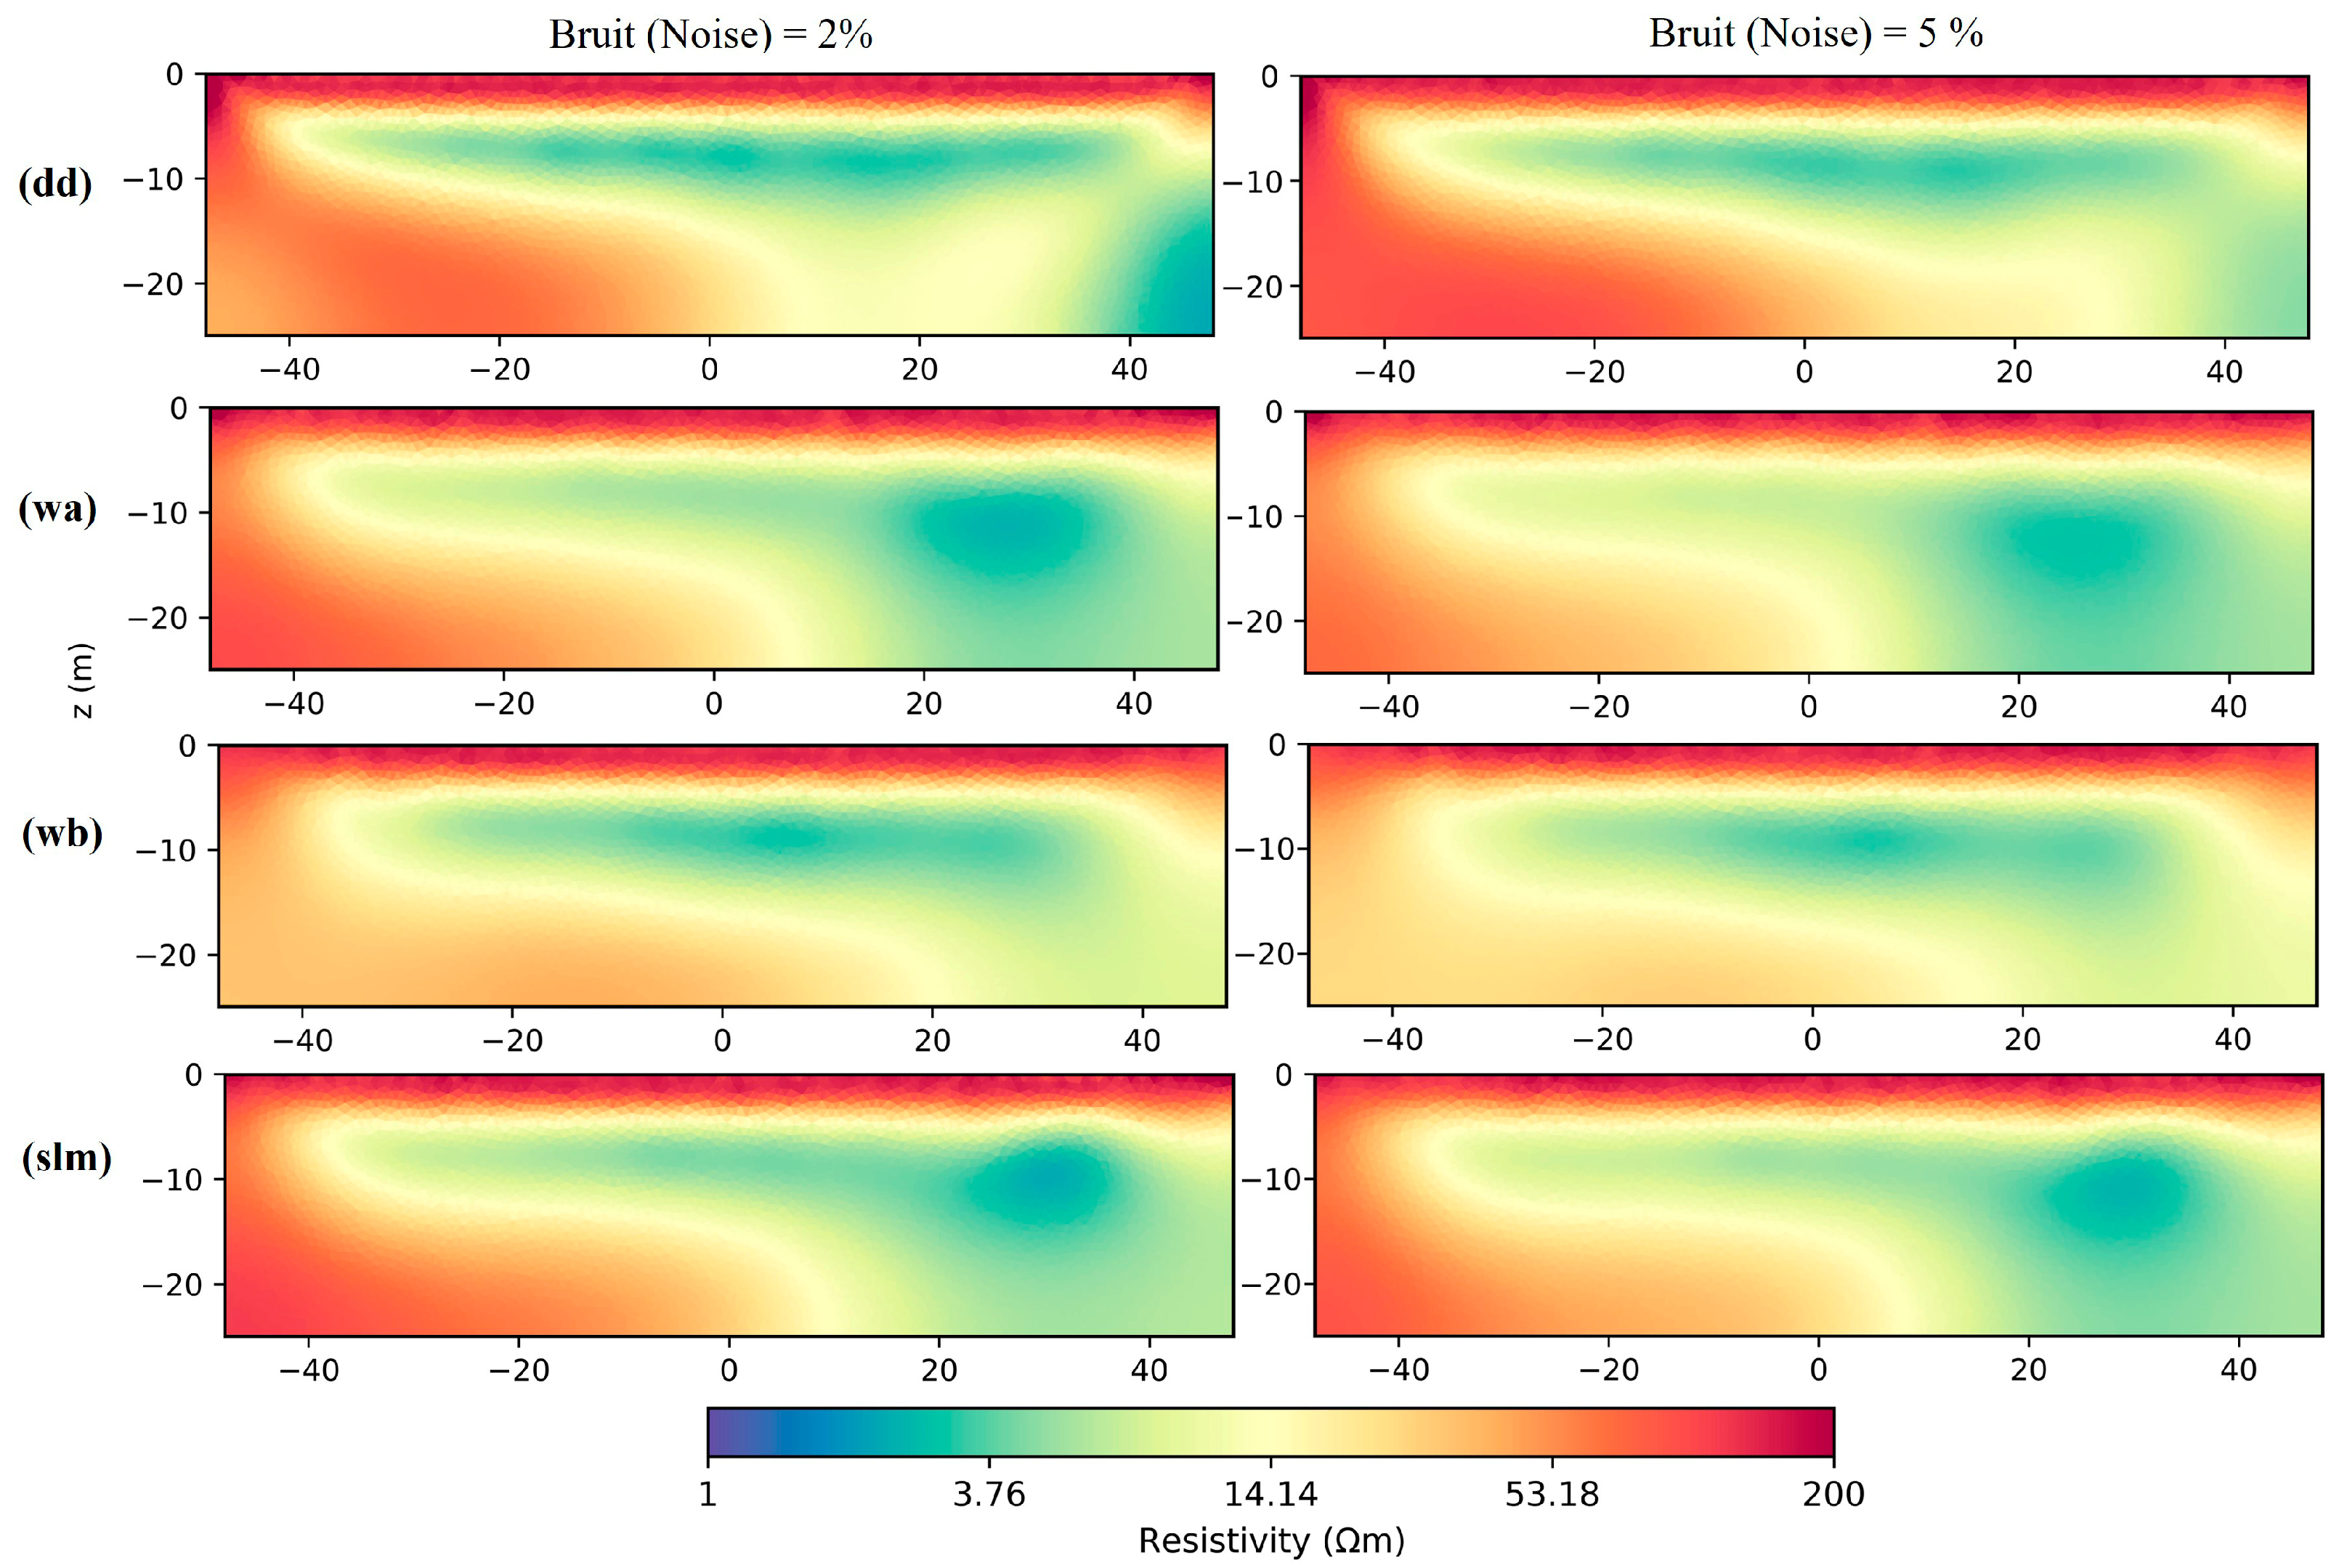
3.2.2. PyGIMLi M2 Inversion Results
3.3. Limitations and Real-World Applicability of Synthetic Model
4. Conclusions
Author Contributions
Funding
Data Availability Statement
Acknowledgments
Conflicts of Interest
References
- Rey, J.; Mendoza, R.; Vilchez, J.; Hidalgo, M.C.; Fernández, I.; Berman, S. A Multidisciplinary Geophysical Approach to Characterize a Fracture Zone: The Southern Limit of the Mining District of Linares-La Carolina, Spain. Geosciences 2024, 14, 228. [Google Scholar] [CrossRef]
- Rupesh, R.; Tiwari, P.; Sharma, S.P. Estimation of Geotechnical Parameters for Coal Exploration from Quasi-3D Electrical Resistivity Measurements. Minerals 2024, 14, 102. [Google Scholar] [CrossRef]
- Papadopoulos, A.; Apostolopoulos, G.; Kallioras, A. An Integrated Hydrogeophysical Approach for Unsaturated Zone Monitoring Using Time Domain Reflectometry, Electrical Resistivity Tomography and Ground Penetrating Radar. Water 2024, 16, 2559. [Google Scholar] [CrossRef]
- Mendoza Trujillo, B.G.; Cadena Rojas, L.S.; Cisneros Barahona, A.S. Identification of the Hydrogeological Potential in Langos-San Andres, by Means of Electrical Resistivity Tomography Interpretation. Eng. Proc. 2023, 57, 44. [Google Scholar] [CrossRef]
- Hussain, Y.; Uagoda, R.; Borges, W.; Nunes, J.; Hamza, O.; Condori, C.; Aslam, K.; Dou, J.; Cárdenas-Soto, M. The Potential Use of Geophysical Methods to Identify Cavities, Sinkholes and Pathways for Water Infiltration. Water 2020, 12, 2289. [Google Scholar] [CrossRef]
- Jabrane, O.; Martínez-Pagán, P.; Martínez-Segura, M.A.; Alcalá, F.J.; El Azzab, D.; Vásconez-Maza, M.D.; Charroud, M. Integration of Electrical Resistivity Tomography and Seismic Refraction Tomography to Investigate Subsiding Sinkholes in Karst Areas. Water 2023, 15, 2192. [Google Scholar] [CrossRef]
- Lech, M.; Skutnik, Z.; Bajda, M.; Markowska-Lech, K. Applications of Electrical Resistivity Surveys in Solving Selected Geotechnical and Environmental Problems. Appl. Sci. 2020, 10, 2263. [Google Scholar] [CrossRef]
- Alam, M.J.B.; Ahmed, A.; Alam, M.Z. Application of Electrical Resistivity Tomography in Geotechnical and Geoenvironmental Engineering Aspect. Geotechnics 2024, 4, 399–414. [Google Scholar] [CrossRef]
- Dahlin, T.; Zhou, B. A numerical comparison of 2D resistivity imaging with 10 electrode arrays. Geophys. Prospect. 2004, 52, 379–398. [Google Scholar] [CrossRef]
- Sharma, S.; Verma, G.K. Inversion of Electrical Resistivity Data: A Review. Int. J. Comput. Syst. Eng. 2015, 9, 400–406. [Google Scholar]
- Romano, G.; Capozzoli, L.; Abate, N.; De Girolamo, M.; Liso, I.S.; Patella, D.; Parise, M. An Integrated Geophysical and Unmanned Aerial Systems Surveys for Multi-Sensory, Multi-Scale and Multi-Resolution Cave Detection: The Gravaglione Site (Canale di Pirro Polje, Apulia). Remote Sens. 2023, 15, 3820. [Google Scholar] [CrossRef]
- Martinez-Lòpez, J.; Rey, J.; Duenas, J.; Hidalgo, C.; Benavente, J. Electrical tomography applied to the detection of subsurfacecavities. J. Cave Karst Stud. 2013, 75, 28–37. [Google Scholar] [CrossRef]
- Jabrane, O.; El Azzab, D.; Martínez-Pagán, P.; Charroud, M.; El Mansouri, B.; Martínez-Segura, M.A.; Himi, M.; Elgettafi, M. Comparison of the PyGIMLi and BERT packages for Landslide and Cavity Detection: A Case Study from Tghat-Oued Fez, Morocco. J. Earth Syst. Sci. 2023, 132, 107. [Google Scholar] [CrossRef]
- Telford, W.M.; Geldart, L.P.; Sheriff, R.E.; Keys, D.A. Applied Geophysics; This book covers various methods, including ERT configurations; Cambridge University Press: Cambridge, UK, 1990. [Google Scholar]
- Szalai, S.; Szarka, L. On the classification of surface geo-electric arrays. Geophys. Prospect. 2008, 56, 159–175. [Google Scholar] [CrossRef]
- Wilkinson, P.B.; Meldrum, P.I.; Kuras, O.; Chambers, J.E.; Holyoake, S.J.; Ogilvy, R.D. High-Resolution Electrical Resistivity Tomography Monitoring of a Tracer Test in a Confined Aquifer. J. Appl. Geophys. 2010, 70, 268–276. [Google Scholar] [CrossRef]
- Loke, M.H. Tutorial: 2-D and 3-D Electrical Imaging Surveys. Geotomo Software, Res2dinv 3.5 Software. 2004. Available online: https://www.researchgate.net/publication/264739285_Tutorial_2-D_and_3-D_Electrical_Imaging_Surveys (accessed on 12 January 2025).
- Jabrane, O.; Azzab, D.E.; Himi, M.; Charroud, M.; Gettafi, M.E. Detection of Underground Cavities Using Electromagnetic GPR Method in Bhalil City (Morocco). In Proceedings of the International Conference on Digital Technologies and Applications, Fes, Morocco, 28–30 January 2021; pp. 1111–1120. [Google Scholar]
- Storz, H.; Storz, W.; Jacobs, F. Electrical Resistivity Tomography to Investigate Geological Structures of the Earth’s Upper Crust. Geophys. Prospect. 2000, 48, 455–471. [Google Scholar] [CrossRef]
- Martorana, R.; Capizzi, P.; D’Alessandro, A.; Luzio, D. Comparison of different sets of array configurations for multichannel 2D ERT acquisition. J. Appl. Geophys. 2017, 137, 34–48. [Google Scholar] [CrossRef]
- Cubbage, B.; Noonan, G.E.; Rucker, D.F. A Modified Wenner Array for Efficient Use of Eight-Channel Resistivity Meters. Pure Appl. Geophys. 2017, 174, 2705–2718. [Google Scholar] [CrossRef]
- AL-Hameedawi, M.M.; Thabit, J.M. Comparison between four electrode arrays in delineating sedimentary layers of alluvial fan deposits in eastern Iraq using a 2D imaging technique. Environ. Earth Sci. 2017, 76, 525. [Google Scholar] [CrossRef]
- Abdullah, F.M.; Loke, M.; Nawawi, M.; Abdullah, K. Assessing the reliability and performance of optimized and conventional resistivity arrays for shallow subsurface investigations. J. Appl. Geophys. 2018, 155, 237–245. [Google Scholar]
- Martorana, R.; Capizzi, P. Evaluation of Artifacts and Misinterpretation in 2D Electrical Resistivity Tomography Caused by Three-Dimensional Resistive Structures of Regular or Irregular Shapes. Appl. Sci. 2023, 13, 2015. [Google Scholar] [CrossRef]
- Doyoro, Y.G.; Chang, P.-Y.; Puntu, J.M. Uncertainty of the 2D Resistivity Survey on the Subsurface Cavities. Appl. Sci. 2021, 11, 3143. [Google Scholar] [CrossRef]
- Dosoky, W. Assessment of three mixed arrays dataset for subsurface cavities detection using resistivity tomography as inferred from numerical modelling. SN Appl. Sci. 2023, 5, 303. [Google Scholar] [CrossRef]
- Quiceno-Arenas, B.A.; Paniagua-Castrillón, J.G.; Muñoz-García, A.M.; Duque-Gómez, L.F.; Bustamante-Rúa, M.O. Open-Source Learning as a Skill for Geoelectrical Data Processing: The Case of PyGIMLi. 2022. Available online: https://www.researchgate.net/publication/362263536 (accessed on 12 January 2025).
- Jabrane, O.; El Azzab, D.; Martínez-Pagán, P.; Martínez-Segura, M.A.; Mahjoub, H.; Charroud, M. Contribution of Python-based BERT software for landslide monitoring using Electrical Resistivity Tomography datasets. A case study in Tghat-Fez (Morocco). Data Brief 2022, 46, 108763. [Google Scholar] [CrossRef] [PubMed]
- Nickschick, T.; Flechsig, C.; Mrlina, J.; Oppermann, F.; Löbig, F.; Günther, T. Large-Scale Electrical Resistivity Tomography in the Cheb Basin (Eger Rift) at an International Continental Drilling Program (ICDP) Monitoring Site to Image Fluid-Related Structures. Solid Earth 2019, 10, 1951–1969. [Google Scholar] [CrossRef]
- Doyoro, Y.G.; Chang, P.-Y.; Puntu, J.M.; Lin, D.-J.; Van Huu, T.; Rahmalia, D.A.; Shie, M.-S. A review of open software resources in python for electrical resistivity modelling. Geosci. Lett. 2022, 9, 3. [Google Scholar] [CrossRef]
- Yang, X.; Lagmanson, M.B. Planning resistivity surveys using numerical simulations. In Proceedings of the Annual Symposium for the Application of Geophysics to Environmental and Engineering Problems, San Antonio, TX, USA, 6–10 April 2003; Environmental and Engineering Geophysical Society: Denver, CO, USA, 2003; pp. 488–501. [Google Scholar]
- Olayinka, A.; Yaramanci, U. Assessment of the reliability of 2D inversion of apparent resistivitydata. Geophys. Prospect. 2000, 48, 293–316. [Google Scholar]
- Dahlin, T.; Loke, M.H. Resolution of 2D Wenner resistivity imaging as assessed by numerical modelling. J. Appl. Geophy. 1998, 38, 237–249. [Google Scholar] [CrossRef]
- Rücker, C.; Günther, T.; Wagner, F.M. PyGIMLi: An open-source library for modelling and inversion in geophysics. Comput. Geosci. 2017, 109, 106–123. [Google Scholar] [CrossRef]
- Du, Q.; Wang, D.; Zhu, L. On mesh geometry and stiffness matrix conditioning for general finite element spaces. SIAM J. Numer. Anal. 2009, 47, 1421–1444. [Google Scholar] [CrossRef]
- Neumaier, A. Solving ill-conditioned and singular linear systems: A tuto-rial on regularization. J. Soc. Ind. Appl. Math. 1998, 40, 636–666. [Google Scholar] [CrossRef]
- Shewchuk, J.R. Triangle: Engineering a 2D Quality Mesh Generator and Delaunay Triangulator, Workshop on Applied Computational Geometry; Springer: Berlin/Heidelberg, Germany, 1996; pp. 203–222. [Google Scholar]
- Si, H. TetGen, a Delaunay-based quality tetrahedral mesh generator. ACM Trans. Math. Softw. 2015, 41, 11. [Google Scholar] [CrossRef]
- Geuzaine, C.; Remacle, J.F. Gmsh: A 3-D finite element mesh generator with built-in pre-and post-processing facilities. Int. J. Numer. Methods Eng. 2009, 79, 1309–1331. [Google Scholar] [CrossRef]
- Hunter, J.D. Matplotlib: A 2D graphics environment. Comput. Sci. Eng. 2007, 9, 90–95. [Google Scholar] [CrossRef]
- Ayachit, U. The Paraview Guide: A Parallel Visualization Application; Kitware Inc.: New York, NY, USA, 2015. [Google Scholar]
- Günther, T.; Rücker, C.; Spitzer, K. 3D Modeling and Inversion of DC Resistivity Data Incorporating Topography—Part II: Inversion. Geophys. J. Int. 2006, 166, 506–517. [Google Scholar]
- Rücker, C.; Günther, T.; Spitzer, K. Three-Dimensional Modelling and Inversion of DC Resistivity Data Incorporating Topography—Part I: Modelling. Geophys. J. Int. 2006, 166, 495–505. [Google Scholar] [CrossRef]
- Tarantola, A. Inverse Problem Theory and Methods for Model Parameter Estimation, 1st ed.; The Society for Industrial and Applied Mathematics (SIAM): Philadelphia, PA, USA; Cambridge University Press: Cambridge, UK, 2005; 352p. [Google Scholar]
- Mehanee, S. A new scheme for gravity data interpretation by a faulted 2-D horizontal thin block: Theory, numerical examples and real data investigation. IEEE Trans. Geosci. Remote Sens. 2022, 60, 1–14. [Google Scholar] [CrossRef]
- Rücker, C.; Günther, T. The simulation of finite ERT electrodes using the complete electrode model. Geophysics 2011, 76, F227–F238. [Google Scholar]
- Ronczka, M.; Rücker, C.; Günther, T. Numerical study of long-electrode electric resistivity tomography—Accuracy, sensitivity, and resolution. Geophysics 2015, 80, E317–E328. [Google Scholar] [CrossRef]
- Günther, T.; Rücker, C. Boundless Electrical Resistivity Tomography BERT2—The User Tutorial. 26 April 2023, Version 2.4.1. 2019. Available online: http://www.resistivity.net/download/bert-tutorial.pdf (accessed on 13 October 2024).
- Zhou, B.; Greenhalgh, S.A. Cross-Hole Resistivity Tomography Using Different Electrode Configurations. Geophys. Prospect. 2000, 48, 887–912. [Google Scholar] [CrossRef]
- Jabrane, O.; Martínez-Pagán, P.; El Azzab, D.; Martínez-Segura, M.A.; Urruela, A. A review of Python-based code for landslide modeling and inversion using Electrical Resistivity Tomography method. Simul. Model. Pract. Theory 2023, 111, 101501. [Google Scholar] [CrossRef]
- Audebert, M.; Clément, R.; Grossin-Debattista, J.; Günther, T.; Touze-Foltz, N.; Moreau, S. Influence of the geomembrane on time-lapse ERT measurements for leachate injection monitoring. J. Waste Manag. 2014, 34, 780–790. [Google Scholar] [CrossRef] [PubMed]
- Blanchy, G.; Saneiyan, S.; Boyd, J.; McLachlan, P.; Binley, A. ResIPy, an intuitive open source software for complex geoelectrical inversion/modeling. Comput. Geosci. 2020, 137, 104423. [Google Scholar] [CrossRef]
- Flechsig, C.; Fabig, T.; Rücker, C.; Schütze, C. Geoelectrical Investigations in the Cheb Basin/W-Bohemia: An Approach to Evaluate the Near-Surface Conductivity Structure. Stud. Geophys. Geod. 2010, 54, 443–463. [Google Scholar] [CrossRef]
- Jordi, C.; Doetsch, J.; Günther, T.; Schmelzbach, C.; Maurer, H.; Robertsson, J. Structural joint inversion on irregular meshes. Geophys. J. Int. 2020, 220, 1995–2008. [Google Scholar] [CrossRef]
- Portniaguine, O.; Zhdanov, M.S. Focusing Geophysical Inversion Images. Geophysics 1999, 64, 874–887. [Google Scholar] [CrossRef]


| Application | Scope | Limitations |
|---|---|---|
| Cavity detection | Simulates the resistivity response of air- or water-filled voids to assess detectability. | Depth penetration and resolution depend on the chosen array. Dipole–dipole enhances shallow cavity detection but loses sensitivity at depth. Wenner-Alpha and Beta improve lateral resolution, while Schlumberger provides better depth sensitivity but lower detail. |
| Landslide detection | Models’ resistivity variations to identify weak zones and potential failure planes. | Sensitivity to landslide features varies with electrode configuration. Dipole–dipole captures near-surface instabilities, Wenner arrays highlight lateral changes, and Schlumberger is better for deeper slip surfaces but less effective in complex terrains. |
| Parameter | Value | Details |
|---|---|---|
| Total Length | 96 m | The horizontal distance of the electrode array used in the survey, as indicated in the code (grange(start = −48, end = 48, n = 48)). |
| Mesh Quality | 33.5 | Mesh quality specified in the code during mesh creation: quality = 33.5. The mesh is generated with a target quality factor to ensure that the resulting mesh elements are geometrically suitable for inversion. |
| Maximum Depth | 25 m | The maximum investigation depth, set to 25 m in the code (paraDepth = 25). The inversion depth is limited to 25 m for all electrode configurations. |
| λ (Regularization) | 5 | Regularization parameters are used to control the smoothing of the inversion model. A higher value of λ leads to a smoother model. This value is provided in the inversion function (lam = 5). |
| Max Cell Size | 1 m | The maximum cell size is used in the inversion model. This is defined in the code (paraMaxCellSize = 1), which affects the spatial resolution of the model. |
| Verbosity | True | The verbosity setting is enabled (verbose = True) to show detailed output during the inversion process. |
| Data Noise Level | 1 | The code specifies this as noiseLevel = 1, which adds Gaussian noise to the simulated data. The standard deviation mof the noise is proportional to the data values, ensuring a realistic representation of measurement uncertainty. |
| Data Noise Absolute | 1e-6 | The absolute noise level specified as noiseAbs = 1e-6, indicating the minimum possible noise added to the data. |
| Chi-Squared (χ2) | Root Mean Square (RMS) | |
|---|---|---|
| BERT Cavity Model | dd = 0.84 wa = 0.87 wb = 0.59 slm = 0.8 | dd = 1.11% wa = 0.94% wb = 0.77% slm = 0.9% |
| PyGIMLi Cavity Model | dd = 0.9 wa = 0.74 wb = 0.44 slm = 0.93 | dd = 1.19% wa = 0.86% wb = 0.66% slm = 0.96% |
| Chi-Squared (χ2) | Root Mean Square (RMS) | |
|---|---|---|
| BERT Landslide Model | dd = 2.03 wa = 1.24 wb = 0.99 slm = 1.09 | dd = 3.23% wa = 1.11% wb = 0.99% slm = 1.05% |
| PyGIMLi Landslide Model | dd = 2.23 wa = 7.6 wb = 1.35 slm = 2.34 | dd = 3.47% wa = 2.9% wb = 1.16% slm = 1.54% |
Disclaimer/Publisher’s Note: The statements, opinions and data contained in all publications are solely those of the individual author(s) and contributor(s) and not of MDPI and/or the editor(s). MDPI and/or the editor(s) disclaim responsibility for any injury to people or property resulting from any ideas, methods, instructions or products referred to in the content. |
© 2025 by the authors. Licensee MDPI, Basel, Switzerland. This article is an open access article distributed under the terms and conditions of the Creative Commons Attribution (CC BY) license (https://creativecommons.org/licenses/by/4.0/).
Share and Cite
Jabrane, O.; Martínez-Pagán, P.; Martínez-Segura, M.A.; Capa-Camacho, X.; Delimi, K.; Chourak, M. A Comparison of Array Configurations in Python-Based Software for ERT Data in Shallow Hazard Detection. Geosciences 2025, 15, 127. https://doi.org/10.3390/geosciences15040127
Jabrane O, Martínez-Pagán P, Martínez-Segura MA, Capa-Camacho X, Delimi K, Chourak M. A Comparison of Array Configurations in Python-Based Software for ERT Data in Shallow Hazard Detection. Geosciences. 2025; 15(4):127. https://doi.org/10.3390/geosciences15040127
Chicago/Turabian StyleJabrane, Oussama, Pedro Martínez-Pagán, Marcos A. Martínez-Segura, Ximena Capa-Camacho, Khadidja Delimi, and Mimoun Chourak. 2025. "A Comparison of Array Configurations in Python-Based Software for ERT Data in Shallow Hazard Detection" Geosciences 15, no. 4: 127. https://doi.org/10.3390/geosciences15040127
APA StyleJabrane, O., Martínez-Pagán, P., Martínez-Segura, M. A., Capa-Camacho, X., Delimi, K., & Chourak, M. (2025). A Comparison of Array Configurations in Python-Based Software for ERT Data in Shallow Hazard Detection. Geosciences, 15(4), 127. https://doi.org/10.3390/geosciences15040127