Article

Terrestrial Response to Maastrichtian Climate Change Determined from Paleosols of the Dawson Creek Section, Big Bend National Park, Texas

Department of Geology, Baylor University, Waco, TX 76706, USA
*
Author to whom correspondence should be addressed.
Geosciences 2025, 15(4), 119; https://doi.org/10.3390/geosciences15040119
Submission received: 27 January 2025 / Revised: 12 March 2025 / Accepted: 26 March 2025 / Published: 28 March 2025
(This article belongs to the Section Climate and Environment)

Abstract

:
Climate during the Late Cretaceous is characterized by a long-term cooling trend interrupted by several periods of increased warming. This study focuses on the terrestrial response to two rapid climate events just prior to the K-Pg boundary marked by the Chicxulub impact: the Mid-Maastrichtian Event (MME) and the Late Maastrichtian Warming Event (LMWE). These hyperthermals caused widespread biotic and greenhouse gas-related disturbances, and clarification about their timing and environmental character reveals the independent nature of all three events. Using element concentrations in bulk paleosols, as well as element concentrations in pedogenic calcite from paleosols in the Tornillo Basin of West Texas, we reconstruct mean annual precipitation (MAP) and the character of soil weathering across the K-Pg boundary. Modelled MAP indicates increased precipitation during the first half of the MME and rapid high amplitude changes in precipitation during the second half of the MME. The Tornillo Basin became increasingly dry during the LMWE followed by wet conditions that continued across the K-Pg boundary. This study documents the co-occurrence of sedimentation patterns, sea level change, and climate change caused by separate tectonic events prior to the K-Pg boundary.

1. Introduction

The history of Earth’s climate can be characterized as recurrent short-duration climate excursions occurring throughout long-term climate trends [1,2,3]. The Latest Cretaceous Maastrichtian Stage exemplifies this environmental pattern as it was a time dominated by a long-term cooling trend [4,5] punctuated by four temporally distinct perturbations to global climate (Figure 1A). The best known of these short-term events occurred at the Cretaceous–Paleogene (K-Pg) boundary and was driven by a bolide impact that created environmental conditions unsuitable for 75% of Earth’s species [6,7,8,9,10]. Three earlier Maastrichtian climate events are known by their biotic disruptions and perturbations to the carbon cycle [11,12]. The oldest of these events was the Campanian–Maastrichtian boundary event that exhibits a distinct negative carbon isotope excursion and is known primarily from the marine carbonate record [13,14,15]. The other two Maastrichtian climate events, which are the focus of this study, are the Mid-Maastrichtian Event (MME) and the Late Maastrichtian Warming Event (LMWE) [11,12,16,17,18,19].
Of these two short-term events, the LMWE has attracted the most attention because it immediately precedes the K-Pg boundary. The LMWE is a short interval of warming likely caused by a period of intense volcanism associated with the initial volcanic phase of the Deccan Traps [10]. The lesser-known MME (first rigorously identified by MacLeod et al. [26]) is an episode of widespread biotic and oceanographic change that is characterized by abrupt warming of surface and deep marine waters, the extinction of inoceramid and rudist bivalves, and small-scale carbon isotope excursions [12,19,26,27,28]. These pronounced episodes of short-term warming during the Maastrichtian have been suggested to be precursors to, yet independent of, the K-Pg mass extinction [10,29,30].
Both the MME and LMWE global warming events are well-documented in marine sediments based on carbon and oxygen isotopic excursions in carbonates [11,20,25,31,32,33] (Figure 1C–E). In contrast, terrestrial environments that capture these hyperthermals are much less common. The LMWE is documented in the terrestrial Hell Creek Formation in North Dakota where leaf margin analysis demonstrates a 4 to 6 °C rise in temperature [34]. The MME has been identified in terrestrial sediments of the Cantwell Formation in Alaska [35], where carbon isotope ratios in bulk organics indicate that it was a relatively dry interval. The only terrestrial section where both hyperthermals have been identified is the Dawson Creek section in Big Bend National Park, Texas [16] (Figure 1, Figure 2 and Figure 3), and this is the field area for the present study.
This study builds upon the pCO2 and temperature reconstructions from the Cretaceous and Paleocene strata preserved in the Dawson Creek section of the Tornillo Basin, Big Bend region, Texas [16], where carbon and oxygen isotope excursions documented from pedogenic carbonate nodules reveal the presence of both the MME and the LMWE. The isotope records for both events indicate a rise in atmospheric pCO2 and a corresponding increase in temperature [16,36] (Figure 2). However, other environmental changes such as trends in mean annual precipitation (MAP) and resulting changes in weathering intensity during the MME and LMWE are unknown. Documenting fluctuations in precipitation and weathering intensity spanning the K-Pg boundary is essential for understanding the drivers of environmental, evolutionary, and ecological changes.
Therefore, in this study, evolving hydrologic conditions are modeled using the most recently developed bulk element paleosol-transfer functions [37] that reflect the loss or gain of base cations due to climate-controlled weathering reactions. Additionally, the trace element chemistry of pedogenic calcite is used to reconstruct paleopore-water chemistry which, in turn, reflects climate-controlled pedogenic processes such as weathering intensity, cation exchange, adsorption, and secondary mineral formation. The revised age model, developed for the Dawson Creek section [23,38], allows for the comparison of tectonically controlled sedimentation patterns to the evolving climate when combined with our newly reconstructed Late Cretaceous paleoclimate history. Overall, these results provide insight into the relationships between tectonism, sea level, depositional patterns, and variations in climate during the Late Cretaceous and Early Paleogene.

2. Geologic Setting

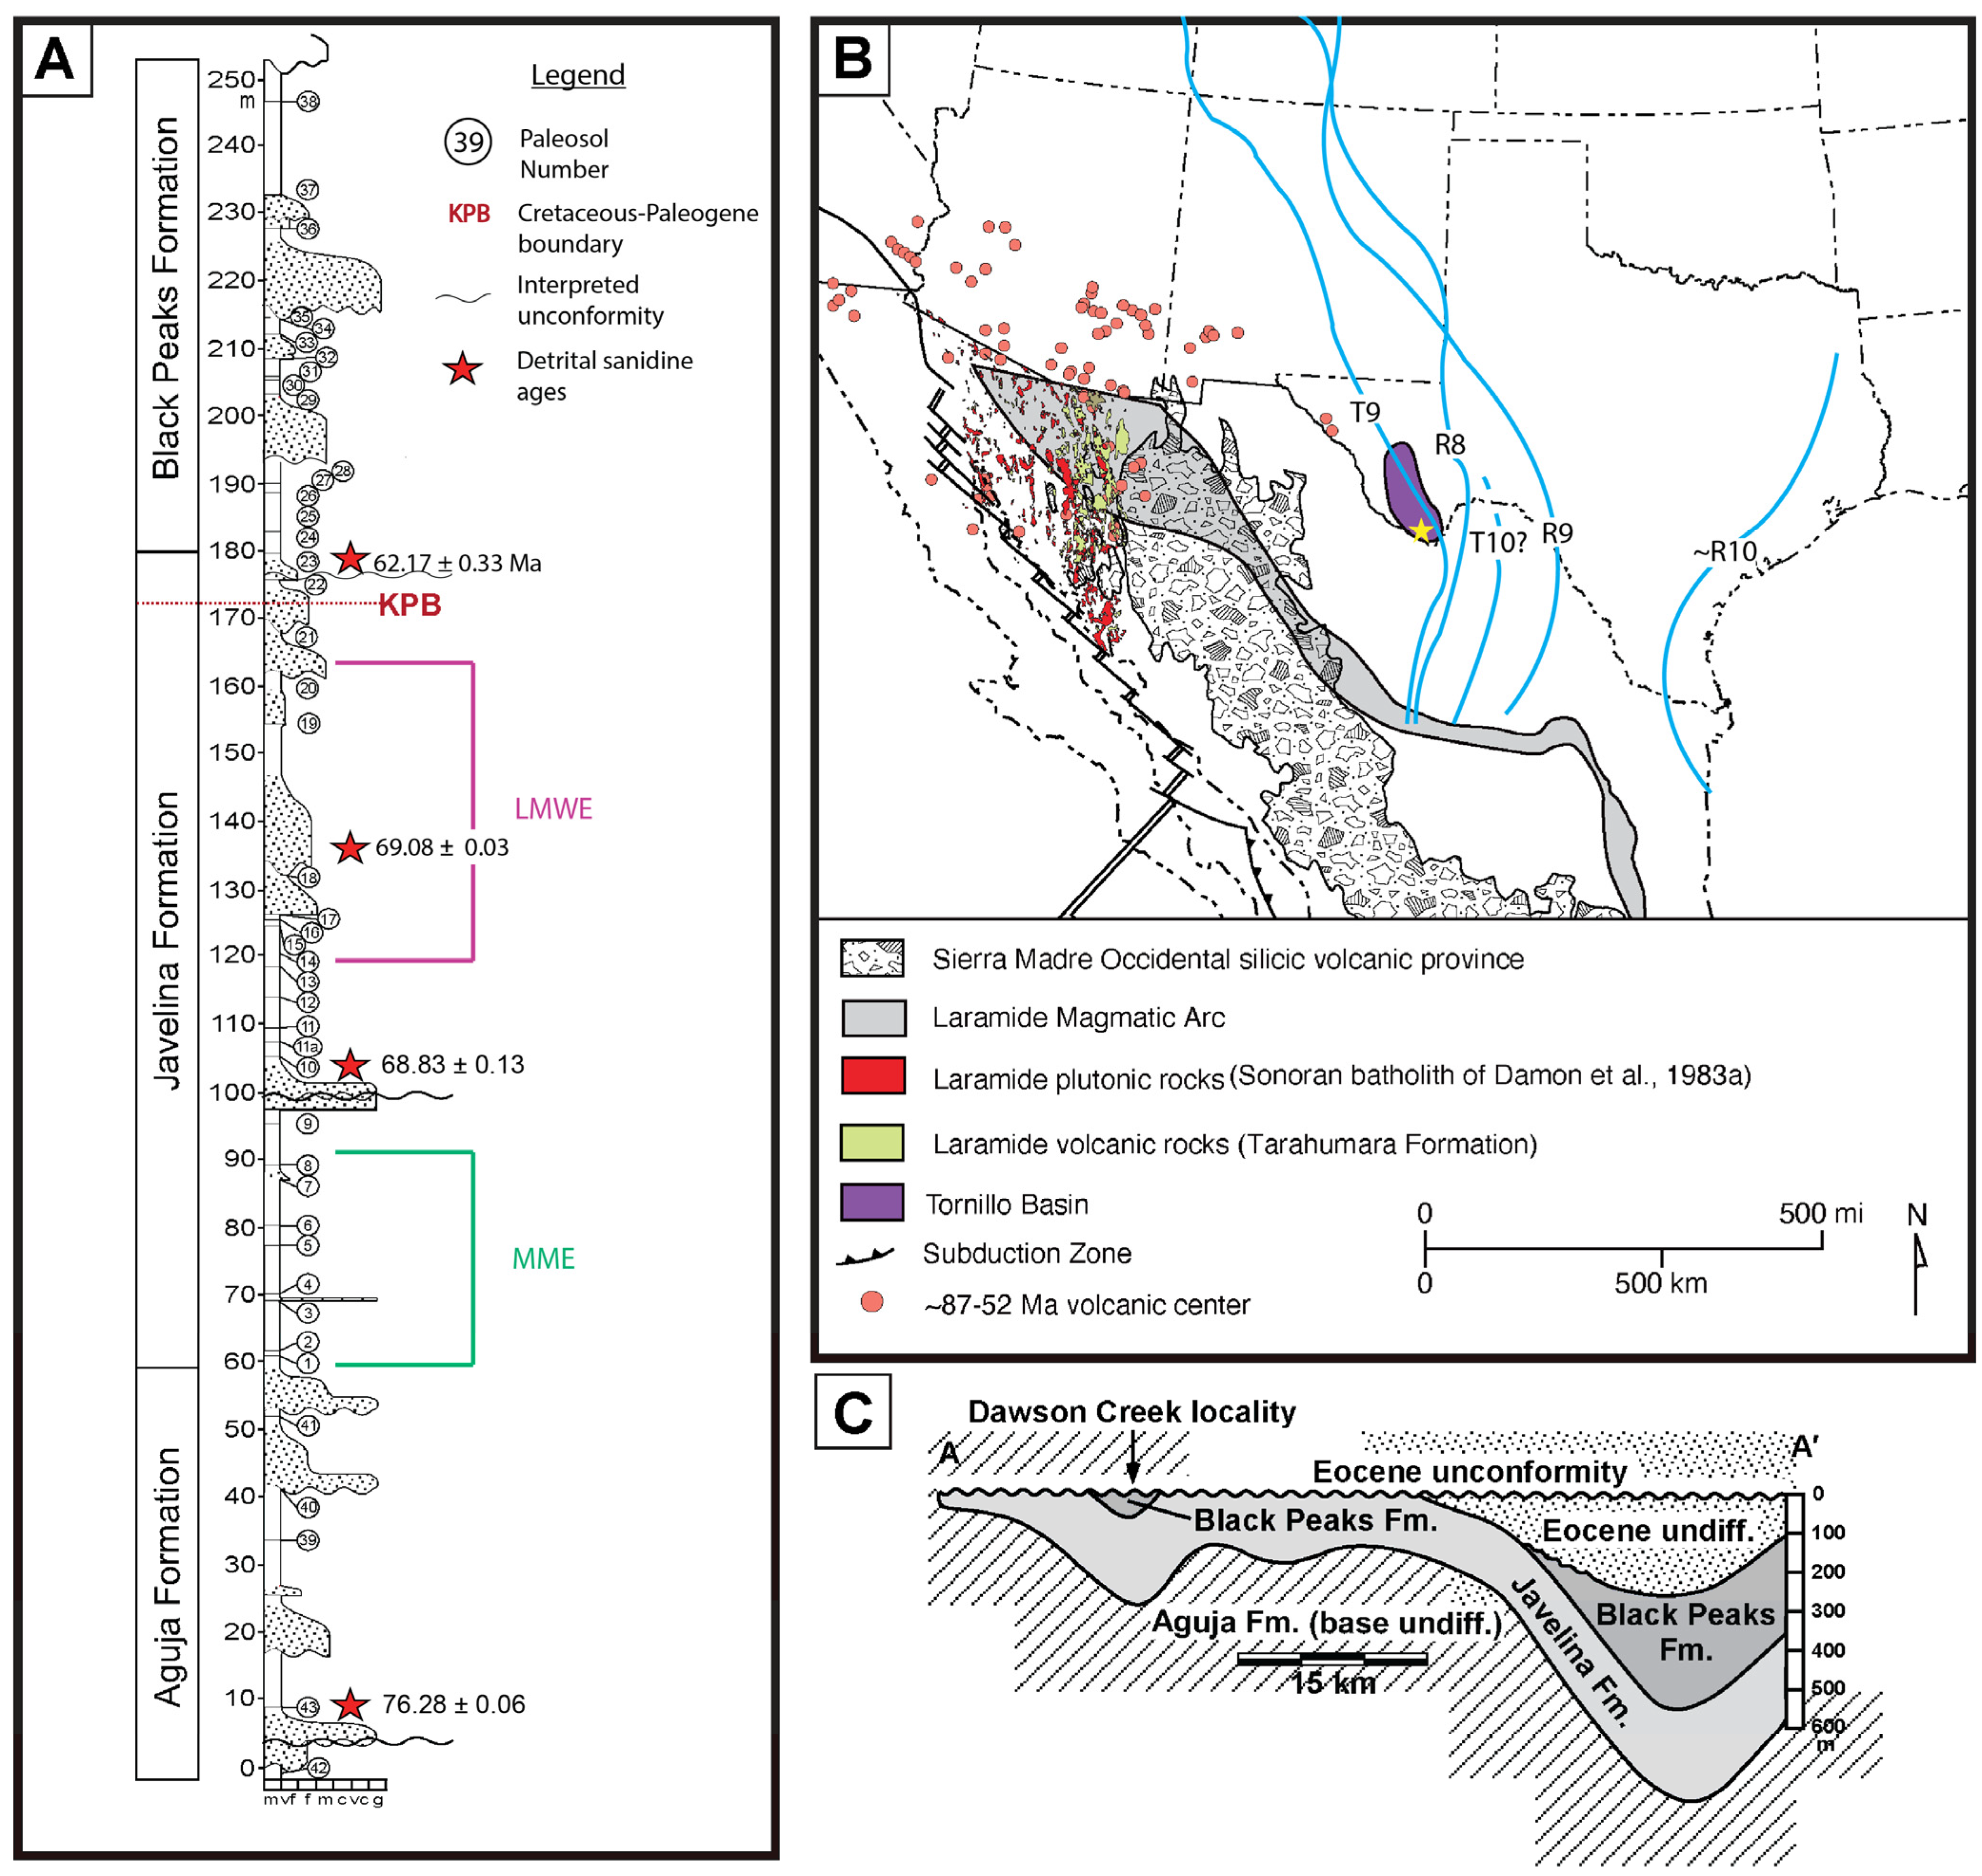
2.1. Geology of the Study Area

The Tornillo Basin is a Laramide-aged foreland basin located along the Texas–Mexico border (Figure 3). The geologic record preserved in this basin is important for our understanding of Late Cretaceous climate change because it is the southernmost Laramide intermontane basin in North American [39]. Tectonism that formed the Tornillo Basin occurred between 70 and 50 Ma during a particularly active phase of volcanic activity associated with the Laramide arc [40]. The tectonic setting on the west side of the basin included the west coast convergent margin composed of an active subduction zone, the associated Laramide arc, the Chihuahua fold, and the thrust Tectonic Belt (Figure 3). The basin axis trends to the southeast and is characterized by thick accumulations of alluvial channel and over bank deposits [41]. Because the WIS was hydrologically connected to the basin, the alluvial and over bank deposits were influenced by eustatic sea level fluctuations [41,42]. During the Late Cretaceous, the WIS shorelines were within 25–100 km of the Tornillo Basin (T9-10) (Figure 3) [39,41,43,44]. By the Paleocene, the WIS shoreline regressed and was approximately 500 km from the Tornillo Basin (R10) [41,42].
Figure 3. (A) Measured composite stratigraphic section. Paleosols are labeled with circled numbers and correlated with either the Aguja, Javelina, or Black Peaks Formation, modified from Nordt et al. [16]. Detrital sanidine ages were determined by Leslie et al. [23], and Lehman [38]. (B) The tectonic setting of the western side of the Tornillo Basin, modified from Ferrari et al. [45], Galloway et al. [46], González-León et al. [47], and Kortyna et al. [48]. The yellow star represents the location of the measured section. Paleo-shorelines of the WIS are represented by the blue transgressive (T) and regressive (R) events modified from Lehman [43], Lillegraven and Ostresh [43], Davidoff and Yanccy [42], Moran-Zenteno [44], and Atchley et al. [41]. The shoreline of the Western Interior Seaway during the latest Maastrichtian to Danian (R10) is estimated from Davidoff and Yanccy [42] and modified from Atchley et al. [41] (C) An A-A’ cross-section through the Tornillo Basin, modified from Lehman [49] and Leslie et al. [23].
Geosciences 15 00119 g003
Sedimentary fill within the Tornillo Basin includes the Late Cretaceous and Paleocene Aguja, Javelina, and Black Peaks Formations with the K-Pg boundary located within the Javelina Formation [23,41] (Figure 3B). In this study, we follow the age model of Leslie et al. [23] with updates from new detrital zircon U-Pb dating from Lehmann et al. [38]. Leslie et al. [23] developed an age model for the Dawson Creek section by combining vertebrate biostratigraphy and sediment accumulation rates based on magnetostratigraphy and detrital sanidine geochronology, with estimates of paleosol duration based on weathering indices. Leslie et al. [23] also followed the interpretations of Wiest et al. [50] and placed the K-Pg boundary during a hiatus between paleosols 21 and 22 (Figure 3). Leslie et al. [23] suggested that the uppermost positions of the Javelina Formation and the base of the Black Peaks Formation correlated to C29r and was deposited in the earliest Paleocene; however, this part of the section was poorly constrained in age because it occurs in an interval of reversed polarity that had no radiometric dates and was between the uppermost dinosaur fossils and the lowermost middle Paleocene mammal fossils. More recent detrital U-Pb dates from zircons in the Javelina and Black Peaks Formations indicate that the interval Leslie et al. [23] correlated to C29r was instead deposited much later in the Paleocene and must be younger than 62.3 Ma (Figure 2 and Figure 3) [38]. Based on these detrital dates [38], we updated the Leslie et al. [23] age model for the uppermost Javelina and lower Black Peaks Formations (Figure 3). These new dates only change the Paleocene portion of the section. Based on Leslie et al.’s [23] age model for the Tornillo Basin, as well as the carbon isotope data, the MME occurred between 69.4 and 69.3 mya at the end of polarity chron 31r, and the LMWE occurred between 66.32 and 66.05 mya during chron 29r [16,23].
The Aguja, Javelina, and Black Peak Formations preserve two prominent cycles of fluvial accretion separated by large hiatuses that occurred during the Late Maastrichtian [23,41] (Figure 1). The Dawson Creek section is characterized by abundant over bank mudrocks and channel sandstones, and the fine-grained sediments have been extensively weathered into paleosols. Paleosols of the Dawson Creek section have well-defined horizons including dark A horizons, poorly developed Bw horizons, zones where carbonate is present (Bk horizons), slickensides (Bss horizons), or increased clay abundance (Bt horizon) [16].

2.2. Late Cretaceous Paleoclimate

The MME and LMWE at the Dawson Creek locality were identified by carbon and oxygen isotope excursions preserved within pedogenic carbonate nodules that were collected in stratigraphic succession (Figure 2). Using these stable isotope ratios, Nordt et al. [16] reconstructed atmospheric pCO2 and temperature and demonstrated that pCO2 values during the MME and LMWE were elevated from 400 ppmV to values as high as approximately 1000–1400 ppmV (i.e., 4x preindustrial levels) [16]. Temperature during this time was reconstructed from oxygen isotope ratios and indicate two warming events of 5 to 7 °C during the MME and LMWE [36]. This temperature increase is similar in magnitude to those documented in a leaf margin study completed by Wilf [34] in Late Maastrichtian age-equivalent strata of North Dakota.
Both the MME and LMWE exhibit similar magnitudes of atmospheric pCO2 increase, although these hyperthermal events have dissimilar temporal patterns. The LMWE is characterized by one distinct carbon isotope excursion (CIE), whereas the CIE for the MME has been characterized as having a double excursion pattern [11]. Therefore, the MME is divided into two parts by Voigt et al. (2012) and Vancoppenolle et al. (2022) [11,12]. Based on carbon isotope excursions for this section documented by Nordt et al. [16], we also divide the MME into two parts with the first positive CIE named MME1, (between 69.42 and 69.32 mya) and the second positive CIE (between 69.32 and 69.24 mya) identified as MME2 (Figure 2) [16].
The MME is far less studied than the LMWE and remains poorly understood [12,51]. Proposed driving mechanisms for the MME include changes in ocean circulation [17,52,53,54,55], lowering of eustatic sea level [17,31,56], and the development of ephemeral ice sheets [22,57,58]. The MME can be characterized as a complex global ocean–climate perturbation that led to a significant loss of marine biotic diversity [19].
In contrast, there is consensus regarding the driving mechanism of the LMWE and its cause has been attributed to Deccan Trap volcanism [11,20,25,31,32,33]. Multiple, well dated Deccan trap eruptive episodes have been documented [11,59,60] and outgassing of CO2 has been quantified in attempts to correlate climate change with this large igneous province volcanism [10,61,62].
While the MME and LMWE both exhibit similar changes in atmospheric pCO2 and temperature, it is unclear if the two hyperthermals had similar causal mechanisms. Although the timing of climate change during the LMWE strongly correlates to the main phase of Deccan volcanism [10,18,63], there is controversy surrounding an earlier episode of Deccan activity as the cause of climate change during the MME [10,11,12,51,64]. Therefore, this study will refine and contrast the differences between these two climate events by characterizing and comparing the dynamic MAP conditions during the Late Cretaceous using a paleosol–paleoclimate model [37] and redox geochemistry from pedogenic carbonate nodules.

3. Materials and Methods

We resampled every first B horizon (including Bt, Bg, and Bk horizons) from the Dawson Creek composite stratigraphic section. In total, 43 paleosol samples were collected from the same locale that had previously been measured and described by Nordt et al. [16,41]. A detailed measured section and description of the paleosols can be found in Nordt et al. and Atchley et al. [16,41]. Bulk paleosol samples and pedogenic carbonate nodules were analyzed for element concentrations as discussed below.
Crushed bulk paleosols were fused into glass discs using a lithium borate flux that were then measured for the concentration of 11 elements (Al2O3, ZrO2, TiO2, Fe2O3, P2O5, MnO, CaO, MgO, Na2O, K2O, and SiO2) on a Primus II wavelength dispersive X-ray fluorescence spectrometer. Precision of analysis is reported as the relative standard deviation of duplicate analyses of standards (n = 32) and is better than +/−3% for all elements.
The chemistry of the pedogenic carbonates was measured by sampling the finest grained portion of nodules with a microdrill. To avoid sampling any areas with diagenetic alterations, thin-sections were created and examined under a petrographic microscope. The powders were dissolved by reaction with ultrapure 4% acetic acid. Elemental analysis was conducted using inductively coupled plasma-optical emission spectrometry (ICP-OES). Precision of analysis for metal determinations was better than +/−5%.
Bulk paleosol element concentrations from XRF analysis were used to model MAP using a paleosol–paleoclimate model (PPM1.0) transfer function [37]. The data-driven paleosol–paleoclimate model uses bulk paleosol element concentrations of 11 major and minor oxides [37]. The transfer function calculates MAP by using a combined partial least squares regression and a nonlinear spline on modern soil B horizons that form under varying and well-characterized environmental conditions [37]. From these data, the model then analyzes the major and minor oxide ratios to predict precipitation abundance. These MAP reconstructions will be complimented by alkali metals within pedogenic nodules that also serve as a precipitation proxy.

4. Results

4.1. Mean Annual Precipitation

Modeled MAP from the PPM1.0 indicates that mean annual precipitation varied between 316 and 1263 mm/yr across the Aguja, Javelina, and Black Peaks interval (Figure 4; Supplementary Tables S1 and S2). For this study, precipitation values under 650 mm/yr are referred to as being indicative of a dry climate, values between 650 mm/yr and 800 mm/yr will be considered an intermediate climate, and values above 800 mm/yr represent a wet climate regime. Characterization of wet and dry fluctuations is based on the temporal fluctuations occurring within the Tornillo Basin.
MAP during MME1 is characterized by an overall wet climate averaging about 1030 mm of rain per year (Figure 4). Conversely, MAP during MME2 is characterized by a much drier environment that averages 635 mm/year, with the exception of one paleosol that records a MAP value of 1250 mm (Figure 4).
The LMWE has modeled MAP values that average 521 mm/yr and these are the lowest observed within the Dawson Creek section. Hydrologic conditions during this second hyperthermal were consistently dry.
Rainfall amounts predicted from the PPM1.0 model indicate that the remaining younger portion of the section above the LMWE is represented by a wet climate. These hydrologic conditions are significantly wetter than the LMWE and have an average MAP during of 894 mm/yr while ranging between 640 mm/yr and 1200 mm/yr. These precipitation conditions start at the end of the LMWE and continue through the K-Pg boundary into the early part of the Paleocene.

4.2. Concentration of Redox Sensitive Elements in Pedogenic Calcite

The concentration of metals in pedogenic carbonate was measured from carbonate nodules that were present in 36 of the 43 soil horizons, and these data are used to reconstruct soil redox conditions and intensity of weathering resulting from changes of MAP (Figure 4; Supplementary Table S3). The concentration of redox sensitive elements (U, Fe, and Mn) as well as other trace elements (Rb and K) exhibit changes in concentration associated with the hyperthermals and the K-Pg boundary.
Uranium (U) concentrations in pedogenic carbonates range between 0.2 and 15 ppm (Figure 4). Two stratigraphic intervals have high average U concentrations, and these occur during the MME1 (averaging 4.8 ppm) and during the early Paleocene section (averaging 4.4 ppm). In contrast, very low U is observed in both the MME2 and LMWE with average concentrations of 0.8 and 0.5 ppm, respectively. U concentrations in pedogenic carbonates are particularly low and temporally similar throughout the LMWE (Figure 4B).
Iron (Fe) and manganese (Mn) concentrations in pedogenic carbonates display positive covarying temporal patterns (Figure 4). Fe abundance reaches values as high as 2300 ppm, whereas Mn concentrations are generally much higher and reach concentrations approaching 1 wt.%. These transition metals exhibit a negative covariation with U (Figure 4). Fe and Mn have notably higher concentrations in pedogenic carbonates associated with the MME2 and LMWE paleosols, whereas lower concentrations of these metals occur during the MME1 and post K-Pg.

4.3. Alkali Metals

Both rubidium (Rb) and potassium (K) concentrations in pedogenic carbonates are severely depleted during the MME1 to concentrations less than 0.5 ppm (Figure 4). For the rest of the section, Rb displays concentrations of about 2 ppm whereas K averages about 100 ppm.

5. Discussion

5.1. Sedimentation, Sea Level, and Climate Change

Lehman [39] recognized two major pulses of fluvial sedimentation within the Tornillo Basin and ascribed the temporal sedimentation pattern to Laramide tectonic events. Derivation of Tornillo Basin sediments from the west coast convergent margin is corroborated by zircon geochronology [48] which shows that Tornillo Basin strata were sourced from first cycle volcanic and plutonic rocks from the Laramide Arc in northern Sonora. During the sedimentation events, the Tornillo basin received mineralogically immature volcanic detritus that experienced variable amounts of weathering during pedogenesis.
During the Late Cretaceous, fluvial transport within the Tornillo Basin was controlled by eustatic changes of the Western Interior Seaway (WIS) [41,65]. This control is exhibited by coeval deposition within the Tornillo Basin and episodes of sea level rise [23] that resulted in upstream gradient backfilling causing fluvial aggradation and sediment deposition. In contrast, the prolonged periods of sea level decline during much of the time represented by the Dawson Creek section resulted in erosion and sediment bypass. Therefore, Late Cretaceous sedimentation within the Tornillo Basin is represented by two short depositional episodes separated by much longer hiatuses (Figure 1). Significantly, the hyperthermal events occurred during these short time periods of sedimentation indicating that the mechanism controlling sea level is related to, or is the cause of, environmental changes during the MME and LMWE. Changes in sea level at the time scale of the MME and LMWE are discussed by Dubicka et al. [19], and they consider geotectonic-related processes such as the Kerguelen hotspot production of oceanic plateaus as a likely mechanism for the MME. Deccan Trap volcanism was likely the trigger for the LMWE [10]. Regardless, each volcanic event perturbed the carbon cycle causing both warming and eustatic sea level changes.
Because the Dawson Creek fluvial system was hydrologically influenced by the base level of the WIS [41], the paleosol morphology reflects these changes. During sea level transgressive phases, the paleosols are poorly drained and contain smaller root traces. As sea level transitioned to regressive phases, these paleosols became more mature, better drained, and developed larger root systems [41,66].

5.2. Evolution of Hydrologic Conditions in the Tornillo Basin

Although the magnitude of the carbon and oxygen isotopic excursions in the MME and LWME hyperthermal events are comparable [16], the hydrologic response within the Tornillo Basin to these changing environmental conditions is different (Figure 4). During MME1, precipitation increases initially at the base of MME1 but then decreases up-section during the MME2. The LMWE experienced limited rainfall and a resulting dry climate. The soil geochemical response to these changing conditions is archived in pedogenic calcite and lends insight into the character of the environmental conditions. Element concentrations measured in the pedogenic calcite within each of the characterized paleosol horizons mimics the MAP pattern.

5.2.1. MME1

Volcanism associated with the earliest phase of Deccan volcanism [67,68] or the Kerguelen hotspot [19] resulted in high atmospheric pCO2 driving increases in temperature. The high MAP during MME1 was most likely caused by the geographically close location of the shoreline to the Tornillo Basin at this time [41,69] and possibly to tectonically driven orographic changes associated with Laramide tectonism that placed the Tornillo Basin into a wet altitudinal zone.
Oxidizing and well-drained pedogenic conditions during these times of higher MAP, none-the-less, is indicated by both the soil drainage index, characterized by Atchley et al. [41], as well as geochemical data collected from this study. For example, uranium cycles through soil by being initially mobilized from primary mineral sources through weathering and dissolution. Once released, uranium may undergo reduction to less soluble U(IV) forms under reducing conditions, or it can complex with organic matter [70]. Under oxidizing conditions, uranium is reoxidized to its mobile U(VI) form. The U(VI) can then adsorb onto mineral surfaces, particularly iron and clay minerals, or it may precipitate as uranyl–carbonate complexes within soil calcite in alkaline environments [70]. The cycling of U through the soils of this study exhibits high U concentrations that may have been the result of weathering of silicic volcanic parent material with abundant U. These oxidizing conditions contributed to the low Fe and Mn concentrations that are found in the pedogenic carbonate. Lastly, it appears that the elevated MAP of MME1 resulted in a robust and dense plant community causing soil pore-waters to be low in alkali metals (K and Rb) which plants scour as a nutrient from soil waters [66].

5.2.2. MME2

Paleosols during the MME2 are characterized by having soil waters with low U and elevated Fe and Mn. Pedogenic carbonate with elevated Fe and Mn concentrations indicate that these elements were being cycled through the solum during MME2. Mobilization of Fe and Mn is ultimately controlled by redox conditions but the enrichment of these elements in soils, and subsequently pedogenic carbonate, occurs when repeated wetting and drying episodes ensue [71,72,73]. This is consistent with the rapidly changing MAP observed in the MME2 (Figure 4A). The lack of U cycling could have been caused by reducing conditions during monsoon events, low U in parent materials, or low pH conditions that control U speciation and severely limit the mobility of U [74]. Rapidly evolving hydrologic conditions were likely caused by orographic changes induced by the development of the Tornillo Basin bounding Chihuahua Tectonic Belt to the west and the Marathon uplift to the east. Laramide-style tectonism experienced in this area lasted from ~70 Ma to ~50 Ma [39]. This type of climate system would be similar to the hydrologic behavior seen in the modern North American Monsoon that is influenced by the topography of the Sierra Madre Occidentals which focuses Gulf of Mexico moisture into the southwest United States during summer months [75].

5.2.3. LMWE

The LMWE has the lowest MAP of any stratigraphic interval in the Dawson Creek section. These dry hydrologic conditions resulted in low metal concentrations within the solute weathering flux as is shown by very low U concentrations and moderate amounts of Fe, Mn, and alkali metals. The timing of Deccan Traps volcanism corresponds to this hyperthermal, and we attribute this tectonic event as the driving mechanism causing warmer temperatures due to increased atmospheric pCO2 [10,76]. Even though sea level is at a highstand towards the end of the LMWE, the decline in rainfall may be due to the WIS shoreline’s continuous regression (Figure 3), thus being farther from the Tornillo Basin at this time [39,43,77]. Alternatively, a rain shadow may have developed in the Tornillo basin due to the Laramide arc to the west.

5.2.4. Conditions Following the LMWE

Immediately following the LMWE, global temperatures began to cool and stabilize to pre-LMWE conditions [10,33,78,79,80,81,82]. MAP results from this study show that rainfall increased and remained high through the uppermost (post K-Pg) portion of the Dawson Creek stratigraphic interval. Increasing precipitation patterns found in the Tornillo Basin are consistent with other Laramide age basins such as the San Juan, Denver, Williston, Bighorn, and Hanna Basins [34,83,84,85,86]. In addition, basins closer to the equator experienced a warmer and wetter climate which also resulted in a rapid floral recovery and expansion following the Chicxulub impact [87,88]. Because other basins in North America exhibit similar climate patterns, we suggest that the climate recovered and stabilized following the LMWE and long-term climate perturbations post-K-Pg impact did not influence precipitation patterns within the Tornillo Basin [34,83,84,85,86,88].

6. Conclusions

MAP throughout the section was determined using a bulk paleosol elemental chemistry transfer function [37]. The MME was divided into two sections, MME1 and MME2, based on the double carbon isotope excursion and MAP trends. During the MME1, precipitation increased resulting in accelerated weathering that is revealed as the active cycling of elements in the soils. Rapid and contrasting changes in MAP, as well as changes in U, Fe, Mn, K, and Rb compared to the MME1, reveal monsoon-like conditions during the MME2. Following the MME, the Tornillo Basin experienced dry environmental conditions with low MAP and reduced weathering intensity but recovery to wet and stable environmental conditions occurred after this hyperthermal for the rest of the section.
Increases in sea floor spreading rates, magmatic processes, and CO2 emissions associated with Kerguelen hotspot may also have influenced rising sea levels during the Late Cretaceous [19]. The LMWE corresponds to the timing of the main phase of Deccan Trap volcanism, and we attribute this as the driving mechanism for this hyperthermal.
Hydrologic conditions during the hyperthermals were controlled by the position of the WIS shoreline and Laramide driven orography. During the MME, the Tornillo Basin was in close proximity to the shoreline of the WIS, whereas we attribute the drying conditions observed in the LMWE as a response to a retreating WIS, which was the most likely source of moisture for precipitation within the Tornillo Basin.

Supplementary Materials

The following supporting information can be downloaded at: https://www.mdpi.com/article/10.3390/geosciences15040119/s1, Table S1 mean annual precipitation data for the PPM1.0; Table S2 bulk paleosol chemistry data; Table S3 pedogenic carbonate chemistry data.

Author Contributions

Conceptualization, S.I.D., A.K.L. and S.C.A.; Methodology, A.K.L.; Formal analysis, A.K.L. and S.I.D.; Data curation, A.K.L.; Writing—original draft preparation, A.K.L., S.I.D. and S.C.A.; Writing—editing and reviewing, A.K.L., S.I.D. and S.C.A.; Supervision, S.I.D.; Funding acquisition, S.I.D. and A.K.L. All authors have read and agreed to the published version of the manuscript.

Funding

This work was supported by the Geosciences Department at Baylor University. We thank the Geosciences Department for providing funding for fieldwork and quantitative analysis.

Data Availability Statement

The original data presented in this study are openly available in the Texas Data Repository at https://doi.org/10.18738/T8/KYJQD3 (accessed on 29 January 2025).

Acknowledgments

We would like to thank Dan Peppe and Lee Nordt for their support, editing, and suggestions regarding this manuscript as well as Gary Stinchcomb for his support and suggestions. A special thanks is also extended to William Brewer, Venanzio Munyaka, and Vivian Yale for their help with fieldwork.

Conflicts of Interest

The authors declare no conflicts of interest. The funders had no role in the design of this study; in the collection, analyses, or interpretation of data; in the writing of the manuscript; or in the decision to publish the results.

Abbreviations

K-PgCretaceous–Paleogene
MMEMid-Maastrichtian Warming Event
LMWELate Maastrichtian Warming Event
MAPmean annual precipitation
CIEcarbon isotope excursion
ICP-OESinductively coupled plasma-optical emission spectrometry
PPM1.0Paleosol–paleoclimate model
WISWestern Interior Seaway

References

  1. Scotese, C.R.; Song, H.; Mills, B.J.W.; Van Der Meer, D.G. Phanerozoic Paleotemperatures: The Earth’s Changing Climate during the Last 540 Million Years. Earth-Sci. Rev. 2021, 215, 103503. [Google Scholar] [CrossRef]
  2. Lauretano, V.; Littler, K.; Polling, M.; Zachos, J.C.; Lourens, L.J. Frequency, Magnitude and Character of Hyperthermal Events at the Onset of the Early Eocene Climatic Optimum. Clim. Past 2015, 11, 1313–1324. [Google Scholar] [CrossRef]
  3. Zachos, J. Trends, Rhythms, and Aberrations in Global Climate 65 Ma to Present. Science 2001, 292, 686–693. [Google Scholar] [CrossRef] [PubMed]
  4. Clarke, L.J.; Jenkyns, H.C. New Oxygen Isotope Evidence for Long-Term Cretaceous Climatic Change in the Southern Hemisphere. Geol 1999, 27, 699. [Google Scholar] [CrossRef]
  5. Linnert, C.; Robinson, S.A.; Lees, J.A.; Bown, P.R.; Pérez-Rodríguez, I.; Petrizzo, M.R.; Falzoni, F.; Littler, K.; Arz, J.A.; Russell, E.E. Evidence for Global Cooling in the Late Cretaceous. Nat. Commun. 2014, 5, 4194. [Google Scholar] [CrossRef]
  6. Sepkoski, J.J. Patterns of Phanerozoic Extinction: A Perspective from Global Data Bases. In Global Events and Event Stratigraphy in the Phanerozoic; Walliser, O.H., Ed.; Springer: Berlin/Heidelberg, Germany, 1996; pp. 35–51. ISBN 978-3-642-79636-4. [Google Scholar]
  7. Schulte, P.; Alegret, L.; Arenillas, I.; Arz, J.A.; Barton, P.J.; Bown, P.R.; Bralower, T.J.; Christeson, G.L.; Claeys, P.; Cockell, C.S.; et al. The Chicxulub Asteroid Impact and Mass Extinction at the Cretaceous-Paleogene Boundary. Science 2010, 327, 1214–1218. [Google Scholar] [CrossRef]
  8. McGhee, G.R.; Clapham, M.E.; Sheehan, P.M.; Bottjer, D.J.; Droser, M.L. A New Ecological-Severity Ranking of Major Phanerozoic Biodiversity Crises. Palaeogeogr. Palaeoclimatol. Palaeoecol. 2013, 370, 260–270. [Google Scholar] [CrossRef]
  9. Bond, D.P.G.; Grasby, S.E. On the Causes of Mass Extinctions. Palaeogeogr. Palaeoclimatol. Palaeoecol. 2017, 478, 3–29. [Google Scholar] [CrossRef]
  10. Hull, P.M.; Bornemann, A.; Penman, D.E.; Henehan, M.J.; Norris, R.D.; Wilson, P.A.; Blum, P.; Alegret, L.; Batenburg, S.J.; Bown, P.R.; et al. On Impact and Volcanism across the Cretaceous-Paleogene Boundary. Science 2020, 367, 266–272. [Google Scholar] [CrossRef]
  11. Voigt, S.; Gale, A.S.; Jung, C.; Jenkyns, H.C. Global Correlation of Upper Campanian—Maastrichtian Successions Using Carbon-Isotope Stratigraphy: Development of a New Maastrichtian Timescale. Newslett. Stratigr. 2012, 45, 25–53. [Google Scholar] [CrossRef]
  12. Vancoppenolle, I.; Vellekoop, J.; Doubrawa, M.; Kaskes, P.; Sinnesael, M.; Jagt, J.W.M.; Claeys, P.; Speijer, R.P. The Benthic Foraminiferal Response to the Mid-Maastrichtian Event in the NW-European Chalk Sea of the Maastrichtian Type Area. Neth. J. Geosci. 2022, 101, e12. [Google Scholar] [CrossRef]
  13. Jarvis, I.; Mabrouk, A.; Moody, R.T.J.; De Cabrera, S. Late Cretaceous (Campanian) Carbon Isotope Events, Sea-Level Change and Correlation of the Tethyan and Boreal Realms. Palaeogeogr. Palaeoclimatol. Palaeoecol. 2002, 188, 215–248. [Google Scholar] [CrossRef]
  14. Voigt, S.; Friedrich, O.; Norris, R.D.; Schönfeld, J. Campanian Maastrichtian Carbon Isotope Stratigraphy: Shelf-Ocean Correlation between the European Shelf Sea and the Tropical Pacific Ocean. Newslett. Stratigr. 2010, 44, 57–72. [Google Scholar] [CrossRef]
  15. Thibault, N.; Husson, D.; Harlou, R.; Gardin, S.; Galbrun, B.; Huret, E.; Minoletti, F. Astronomical Calibration of Upper Campanian–Maastrichtian Carbon Isotope Events and Calcareous Plankton Biostratigraphy in the Indian Ocean (ODP Hole 762C): Implication for the Age of the Campanian–Maastrichtian Boundary. Palaeogeogr. Palaeoclimatol. Palaeoecol. 2012, 337–338, 52–71. [Google Scholar] [CrossRef]
  16. Nordt, L.; Atchley, S.; Dworkin, S. Terrestrial Evidence for Two Greenhouse Events in the Latest Cretaceous. GSA Today 2003, 13, 4. [Google Scholar]
  17. Barrera, E.; Savin, S.M.; Thomas, E.; Jones, C.E. Evidence for Thermohaline-Circulation Reversals Controlled by Sea-Level Change in the Latest Cretaceous. Geol 1997, 25, 715. [Google Scholar] [CrossRef]
  18. Barnet, J.S.K.; Littler, K.; Kroon, D.; Leng, M.J.; Westerhold, T.; Röhl, U.; Zachos, J.C. A New High-Resolution Chronology for the Late Maastrichtian Warming Event: Establishing Robust Temporal Links with the Onset of Deccan Volcanism. Geology 2018, 46, 147–150. [Google Scholar] [CrossRef]
  19. Dubicka, Z.; Wierny, W.; Bojanowski, M.J.; Rakociński, M.; Walaszczyk, I.; Thibault, N. Multi-Proxy Record of the Mid-Maastrichtian Event in the European Chalk Sea: Paleoceanographic Implications. Gondwana Res. 2024, 129, 1–22. [Google Scholar] [CrossRef]
  20. Li, L.; Keller, G. Maastrichtian Climate, Productivity and Faunal Turnovers in Planktic Foraminifera in South Atlantic DSDP Sites 525A and 21. Mar. Micropaleontol. 1998, 33, 55–86. [Google Scholar] [CrossRef]
  21. Gardin, S.; Galbrun, B.; Thibault, N.; Coccioni, R.; Silva, I.P. Bio-Magnetochronology for the Upper Campanian—Maastrichtian from the Gubbio Area, Italy: New Results from the Contessa Highway and Bottaccione Sections. Newslett. Stratigr. 2012, 45, 75–103. [Google Scholar] [CrossRef]
  22. Miller, K.G.; Wright, J.D.; Browning, J.V. Visions of Ice Sheets in a Greenhouse World. Mar. Geol. 2005, 217, 215–231. [Google Scholar] [CrossRef]
  23. Leslie, C.E.; Peppe, D.J.; Williamson, T.E.; Heizler, M.; Jackson, M.; Atchley, S.C.; Nordt, L.; Standhardt, B. Revised Age Constraints for Late Cretaceous to Early Paleocene Terrestrial Strata from the Dawson Creek Section, Big Bend National Park, West Texas. GSA Bull. 2018, 130, 1143–1163. [Google Scholar] [CrossRef]
  24. Westerhold, T.; Röhl, U.; Donner, B.; McCarren, H.K.; Zachos, J.C. A Complete High-resolution Paleocene Benthic Stable Isotope Record for the Central Pacific (ODP Site 1209). Paleoceanography 2011, 26, 2010PA002092. [Google Scholar] [CrossRef]
  25. Li, L.; Keller, G. Diversification and Extinction in Campanian-Maastrichtian Planktic Foraminifera of Northwestern Tunisia. Eclogae Geol. Helv. 1998, 91, 75–102. [Google Scholar]
  26. Alvarez, W.; Black, D.; Bourgeois, J.; Burke, K.; Ginsburg, R.; Keller, G.; Koeberl, C.; Longoria, J.; Ryder, G.; Sharpton, V.; et al. New Developments Regarding the KT Event and Other Catastrophes in Earth History; Lunar and Planetary Institute: Houston, TX, USA, 1994; 138p. [Google Scholar]
  27. Chauris, H.; LeRousseau, J.; Beaudoin, B.; Propson, S.; Montanari, A. Inoceramid Extinction in the Gubbio Basin (Northeastern Apennines of Italy) and Relations with Mid-Maastrichtian Environmental Changes. Palaeogeogr. Palaeoclimatol. Palaeoecol. 1998, 139, 177–193. [Google Scholar] [CrossRef]
  28. Jagt, J.W.M.; Jagt-Yazykova, E.A.; Kaddumi, H.F.; Lindgren, J. Ammonite Dating of Latest Cretaceous Mosasaurid Reptiles (Squamata, Mosasauroidea) from Jordan—Preliminary Observations. Alcheringa Australas. J. Palaeontol. 2018, 42, 587–596. [Google Scholar] [CrossRef]
  29. Frank, T.D.; Arthur, M.A. Tectonic Forcings of Maastrichtian Ocean-Climate Evolution. Paleoceanography 1999, 14, 103–117. [Google Scholar] [CrossRef]
  30. Keller, G. The End-Cretaceous Mass Extinction in the Marine Realm: Year 2000 Assessment. Planet. Space Sci. 2001, 49, 817–830. [Google Scholar] [CrossRef]
  31. Barrera, E.; Savin, S.M. Evolution of Late Campanian-Maastrichtian Marine Climates and Oceans. In Evolution of the Cretaceous Ocean-Climate System; Geological Society of America: Boulder, CO, USA, 1999; ISBN 978-0-8137-2332-7. [Google Scholar]
  32. Abramovich, S.; Keller, G. Planktonic Foraminiferal Response to the Latest Maastrichtian Abrupt Warm Event: A Case Study from South Atlantic DSDP Site 525A. Mar. Micropaleontol. 2003, 48, 225–249. [Google Scholar] [CrossRef]
  33. Gilabert, V.; Arz, J.A.; Arenillas, I.; Robinson, S.A.; Ferrer, D. Influence of the Latest Maastrichtian Warming Event on Planktic Foraminiferal Assemblages and Ocean Carbonate Saturation at Caravaca, Spain. Cretac. Res. 2021, 125, 104844. [Google Scholar] [CrossRef]
  34. Wilf, P.; Johnson, K.R.; Huber, B.T. Correlated Terrestrial and Marine Evidence for Global Climate Changes before Mass Extinction at the Cretaceous-Paleogene Boundary. Proc. Natl. Acad. Sci. USA 2003, 100, 599–604. [Google Scholar] [CrossRef] [PubMed]
  35. Salazar-Jaramillo, S.; Fowell, S.J.; McCarthy, P.J.; Benowitz, J.A.; Śliwiński, M.G.; Tomsich, C.S. Terrestrial Isotopic Evidence for a Middle-Maastrichtian Warming Event from the Lower Cantwell Formation, Alaska. Palaeogeogr. Palaeoclimatol. Palaeoecol. 2016, 441, 360–376. [Google Scholar] [CrossRef]
  36. Dworkin, S.I.; Nordt, L.; Atchley, S. Determining Terrestrial Paleotemperatures Using the Oxygen Isotopic Composition of Pedogenic Carbonate. Earth Planet. Sci. Lett. 2005, 237, 56–68. [Google Scholar] [CrossRef]
  37. Stinchcomb, G.E.; Nordt, L.C.; Driese, S.G.; Lukens, W.E.; Williamson, F.C.; Tubbs, J.D. A Data-Driven Spline Model Designed to Predict Paleoclimate Using Paleosol Geochemistry. Am. J. Sci. 2016, 316, 746–777. [Google Scholar] [CrossRef]
  38. Lehman, T.M.; Cobb, J.; Sylvester, P.; Souders, A.K. The Cretaceous-Paleogene Contact in the Tornillo Group of Big Bend National Park, West Texas, USA. Geosphere 2022, 18, 1851–1884. [Google Scholar] [CrossRef]
  39. Lehman, T.M. Sedimentation and Tectonism in the Laramide Tornillo Basin of West Texas. Sediment. Geol. 1991, 75, 9–28. [Google Scholar] [CrossRef]
  40. González-León, C. Stratigraphy, Geochronology, and Geochemistry of the Laramide Magmatic Arc in North-Central Sonora, Mexico. Geosphere 2011, 7, 1392. [Google Scholar] [CrossRef]
  41. Atchley, S.C.; Nordt, L.C.; Dworkin, S.I. Eustatic Control on Alluvial Sequence Stratigraphy: A Possible Example from the Cretaceous-Tertiary Transition of the Tornillo Basin, Big Bend National Park, West Texas, U.S.A. J. Sediment. Res. 2004, 74, 391–404. [Google Scholar] [CrossRef]
  42. Davidoff, A.J.; Yanccy, T.E. Eustatic Cyclicity in the Paleocene and Eocene: Data from the Brazos River Valley, Texas. Tectonophysics 1993, 222, 371–395. [Google Scholar] [CrossRef]
  43. Lillegraven, J.A.; Ostresh, L.M. Late Cretaceous (Earliest Campanian/Maastrichtian) Evolution of Western Shorelines of the North American Western Interior Seaway in Relation to Known Mammalian Faunas. In Geological Society of America Special Papers; Geological Society of America: Boulder, CO, USA, 1990; Volume 243, pp. 1–30. ISBN 978-0-8137-2243-6. [Google Scholar]
  44. Morán-Zenteno, D. The Geology of the Mexican Republic; American Association of Petroleum Geologists: Tulsa, OK, USA, 1994; ISBN 978-1-62981-094-2. [Google Scholar]
  45. Ferrari, L.; Tagami, T.; Eguchi, M.; Orozco-Esquivel, M.T.; Petrone, C.M.; Jacobo-Albarrán, J.; López-Martínez, M. Geology, Geochronology and Tectonic Setting of Late Cenozoic Volcanism along the Southwestern Gulf of Mexico: The Eastern Alkaline Province Revisited. J. Volcanol. Geotherm. Res. 2005, 146, 284–306. [Google Scholar] [CrossRef]
  46. Galloway, W.E.; Whiteaker, T.L.; Ganey-Curry, P. History of Cenozoic North American Drainage Basin Evolution, Sediment Yield, and Accumulation in the Gulf of Mexico Basin. Geosphere 2011, 7, 938–973. [Google Scholar] [CrossRef]
  47. González-León, C.M.; Solari, L.; Valencia-Moreno, M.; Heimpel, M.A.R.; Solé, J.; Becuar, E.G.; Santacruz, R.L.; Arvizu, O.P. Late Cretaceous to Early Eocene Magmatic Evolution of the Laramide Arc in the Nacozari Quadrangle, Northeastern Sonora, Mexico and Its Regional Implications. Ore Geol. Rev. 2017, 81, 1137–1157. [Google Scholar] [CrossRef]
  48. Kortyna, C.; Stockli, D.F.; Lawton, T.F.; Covault, J.A.; Sharman, G.R. Impact of Mexican Border Rift Structural Inheritance on Laramide Rivers of the Tornillo Basin, West Texas (USA): Insights from Detrital Zircon Provenance. Geosphere 2023, 19, 1747–1787. [Google Scholar] [CrossRef]
  49. Lehman, T.M. Late Cretaceous Sedimentation in Trans-Pecos Texas. In Geology of the Big Bend Area and Solitario Dome, Texas: West Texas Geological Society Fieldtrip Guidebook; Pause, P.H., Spears, R.G., Eds.; West Texas Geological Society: Midland, TX, USA, 1986; pp. 105–110. [Google Scholar]
  50. Wiest, L.A.; Lukens, W.E.; Peppe, D.J.; Driese, S.G.; Tubbs, J. Terrestrial Evidence for the Lilliput Effect across the Cretaceous-Paleogene (K-Pg) Boundary. Palaeogeogr. Palaeoclimatol. Palaeoecol. 2018, 491, 161–169. [Google Scholar] [CrossRef]
  51. Jung, C.; Voigt, S.; Friedrich, O.; Koch, M.C.; Frank, M. Campanian-Maastrichtian Ocean Circulation in the Tropical Pacific. Paleoceanography 2013, 28, 562–573. [Google Scholar] [CrossRef]
  52. Li, L.; Keller, G. Variability in Late Cretaceous Climate and Deep Waters: Evidence from Stable Isotopes. Mar. Geol. 1999, 161, 171–190. [Google Scholar] [CrossRef]
  53. D’Hondt, S.; Arthur, M.A. Deep Water in the Late Maastrichtian Ocean. Paleoceanography 2002, 17, 8-1–8-11. [Google Scholar] [CrossRef]
  54. Friedrich, O.; Herrle, J.O.; Wilson, P.A.; Cooper, M.J.; Erbacher, J.; Hemleben, C. Early Maastrichtian Carbon Cycle Perturbation and Cooling Event: Implications from the South Atlantic Ocean. Paleoceanography 2009, 24, 2008PA001654. [Google Scholar] [CrossRef]
  55. Koch, M.C.; Friedrich, O. Campanian-Maastrichtian Intermediate- to Deep-water Changes in the High Latitudes: Benthic Foraminiferal Evidence. Paleoceanography 2012, 27, 2011PA002259. [Google Scholar] [CrossRef]
  56. Li, L.; Keller, G.; Adatte, T.; Stinnesbeck, W. Late Cretaceous Sea-level Changes in Tunisia: A Multi-disciplinary Approach. J. Geol. Soc. 2000, 157, 447–458. [Google Scholar] [CrossRef]
  57. Miller, K.G.; Barrera, E.; Olsson, R.K.; Sugarman, P.J.; Savin, S.M. Does Ice Drive Early Maastrichtian Eustasy? Geol 1999, 27, 783. [Google Scholar] [CrossRef]
  58. Miller, K.G.; Sugarman, P.J.; Browning, J.V.; Kominz, M.A.; Hernández, J.C.; Olsson, R.K.; Wright, J.D.; Feigenson, M.D.; Van Sickel, W. Late Cretaceous Chronology of Large, Rapid Sea-Level Changes: Glacioeustasy during the Greenhouse World. Geol 2003, 31, 585. [Google Scholar] [CrossRef]
  59. Font, E.; Adatte, T.; Keller, G.; Abrajevitch, A.; Sial, A.N.; de Lacerda, L.D.; Punekar, J. Mercury Anomaly, Deccan Volcanism and the End-Cretaceous Mass Extinction: REPLY. Geology 2016, 44, e382. [Google Scholar] [CrossRef]
  60. Schoene, B.; Eddy, M.P.; Samperton, K.M.; Keller, C.B.; Keller, G.; Adatte, T.; Khadri, S.F.R. U-Pb Constraints on Pulsed Eruption of the Deccan Traps across the End-Cretaceous Mass Extinction. Science 2019, 363, 862–866. [Google Scholar] [CrossRef]
  61. Tobin, T.S.; Bitz, C.M.; Archer, D. Modeling Climatic Effects of Carbon Dioxide Emissions from Deccan Traps Volcanic Eruptions around the Cretaceous–Paleogene Boundary. Palaeogeogr. Palaeoclimatol. Palaeoecol. 2017, 478, 139–148. [Google Scholar] [CrossRef]
  62. Hernandez Nava, A.; Black, B.A.; Gibson, S.A.; Bodnar, R.J.; Renne, P.R.; Vanderkluysen, L. Reconciling Early Deccan Traps CO2 Outgassing and Pre-KPB Global Climate. Proc. Natl. Acad. Sci. USA 2021, 118, e2007797118. [Google Scholar] [CrossRef]
  63. Li, X.; Huang, Y.; Zhang, Z.; Wang, C. Chemical Weathering Characteristics of the Late Cretaceous Nenjiang Formation from the Songliao Basin (Northeastern China) Reveal Prominent Milankovitch Band Variations. Palaeogeogr. Palaeoclimatol. Palaeoecol. 2022, 601, 111130. [Google Scholar] [CrossRef]
  64. Keller, G.; Punekar, J.; Mateo, P. Upheavals during the Late Maastrichtian: Volcanism, Climate and Faunal Events Preceding the End-Cretaceous Mass Extinction. Palaeogeogr. Palaeoclimatol. Palaeoecol. 2016, 441, 137–151. [Google Scholar] [CrossRef]
  65. Atchley, S.C.; Nordt, L.C.; Dworkin, S.I.; Cleveland, D.M.; Mintz, J.S.; Harlow, R.H. Alluvial Stacking Pattern Analysis and Sequence Stratigraphy: Concepts and Case Studies. In New Frontiers in Paleopedology and Terrestrial Paleoclimatology: Paleosols and Soil Surface Analog Systems; Driese, S.G., Ed.; SEPM (Society for Sedimentary Geology): Broken Arrow, OK, USA, 2013; pp. 109–129. ISBN 978-1-56576-322-7. [Google Scholar]
  66. Nordt, L.C.; Dworkin, S.I.; Atchley, S.C. Ecosystem Response to Soil Biogeochemical Behavior during the Late Cretaceous and Early Paleocene within the Western Interior of North America. Geol. Soc. Am. Bull. 2011, 123, 1745–1762. [Google Scholar] [CrossRef]
  67. Parisio, L.; Jourdan, F.; Marzoli, A.; Melluso, L.; Sethna, S.F.; Bellieni, G. 40Ar/39Ar Ages of Alkaline and Tholeiitic Rocks from the Northern Deccan Traps: Implications for Magmatic Processes and the K–Pg Boundary. J. Geol. Soc. 2016, 173, 679–688. [Google Scholar] [CrossRef]
  68. Manu Prasanth, M.P.; Hari, K.R.; Santosh, M. Tholeiitic Basalts of Deccan Large Igneous Province, India: An Overview. Geol. J. 2019, 54, 2980–2993. [Google Scholar] [CrossRef]
  69. Chang, C.; Liu, L. Investigating the Formation of the Cretaceous Western Interior Seaway Using Landscape Evolution Simulations. GSA Bull. 2021, 133, 347–361. [Google Scholar] [CrossRef]
  70. Aguirre Palafox, L.E.; Möller, A.; McLean, N.M.; Ludvigson, G.A.; Colombi, C.E.; Montañez, I.P. U-Pb Geochronology of Paleosol Carbonate Cements by LA-ICP-MS: A Proof of Concept and Strategy for Dating the Terrestrial Record. Geochem. Geophys. Geosyst. 2024, 25, e2024GC011488. [Google Scholar] [CrossRef]
  71. Glasby, G.P.; Rankin, P.C.; Meylan, M.A. Manganiferous Soil Concretions from Hawaii. Pac. Sci. 1979, 33, 103–115. [Google Scholar]
  72. Yu, X.-L.; Fu, Y.-N.; Brookes, P.C.; Lu, S.-G. Insights into the Formation Process and Environmental Fingerprints of Iron-Manganese Nodules in Subtropical Soils of China. Soil Sci. Soc. Am. J. 2015, 79, 1101–1114. [Google Scholar] [CrossRef]
  73. Fischel, M.H.H.; Clarke, C.E.; Sparks, D.L. Synchrotron Resolved Microscale and Bulk Mineralogy in Manganese-Rich Soils and Associated Pedogenic Concretions. Geoderma 2023, 430, 116305. [Google Scholar] [CrossRef]
  74. Echevarria, G.; Sheppard, M.I.; Morel, J. Effect of pH on the Sorption of Uranium in Soils. J. Environ. Radioact. 2001, 53, 257–264. [Google Scholar] [CrossRef]
  75. Boos, W.R.; Pascale, S. Mechanical Forcing of the North American Monsoon by Orography. Nature 2021, 599, 611–615. [Google Scholar] [CrossRef]
  76. Li, S.; Grasby, S.E.; Zhao, X.; Chen, J.; Zheng, D.; Wang, H.; Fang, Y.; Zhang, Q.; Yu, T.; Tian, J.; et al. Mercury Evidence of Deccan Volcanism Driving the Latest Maastrichtian Warming Event. Geology 2022, 50, 1140–1144. [Google Scholar] [CrossRef]
  77. Rogers, R.R. Sequence Analysis of the Upper Cretaceous Two Medicine and Judith River Formations, Montana; Nonmarine Response to the Claggett and Bearpaw Marine Cycles. J. Sediment. Res. 1998, 68, 615–631. [Google Scholar] [CrossRef]
  78. Petersen, S.V.; Dutton, A.; Lohmann, K.C. End-Cretaceous Extinction in Antarctica Linked to Both Deccan Volcanism and Meteorite Impact via Climate Change. Nat. Commun. 2016, 7, 12079. [Google Scholar] [CrossRef] [PubMed]
  79. Woelders, L.; Vellekoop, J.; Kroon, D.; Smit, J.; Casadío, S.; Prámparo, M.B.; Dinarès-Turell, J.; Peterse, F.; Sluijs, A.; Lenaerts, J.T.M.; et al. Latest Cretaceous Climatic and Environmental Change in the South Atlantic Region: LATEST CRETACEOUS CHANGE SOUTH ATLANTIC. Paleoceanography 2017, 32, 466–483. [Google Scholar] [CrossRef]
  80. Vellekoop, J.; Sluijs, A.; Smit, J.; Schouten, S.; Weijers, J.W.H.; Sinninghe Damsté, J.S.; Brinkhuis, H. Rapid Short-Term Cooling Following the Chicxulub Impact at the Cretaceous–Paleogene Boundary. Proc. Natl. Acad. Sci. USA 2014, 111, 7537–7541. [Google Scholar] [CrossRef]
  81. Woelders, L.; Vellekoop, J.; Weltje, G.J.; De Nooijer, L.; Reichart, G.-J.; Peterse, F.; Claeys, P.; Speijer, R.P. Robust Multi-Proxy Data Integration, Using Late Cretaceous Paleotemperature Records as a Case Study. Earth Planet. Sci. Lett. 2018, 500, 215–224. [Google Scholar] [CrossRef]
  82. Thibault, N.; Harlou, R.; Schovsbo, N.H.; Stemmerik, L.; Surlyk, F. Late Cretaceous (Late Campanian–Maastrichtian) Sea-Surface Temperature Record of the Boreal Chalk Sea. Clim. Past 2016, 12, 429–438. [Google Scholar] [CrossRef]
  83. Barclay, R.S. Stratigraphy and Megaflora of a K-T Boundary Section in the Eastern Denver Basin, Colorado. Rocky Mt. Geol. 2003, 38, 45–71. [Google Scholar] [CrossRef]
  84. Johnson, K.R. Overview of the Late Cretaceous, Early Paleocene, and Early Eocene Megafloras of the Denver Basin, Colorado. Rocky Mt. Geol. 2003, 38, 101–120. [Google Scholar] [CrossRef]
  85. Peppe, D.J. Megafloral Change in the Early and Middle Paleocene in the Williston Basin, North Dakota, USA. Palaeogeogr. Palaeoclimatol. Palaeoecol. 2010, 298, 224–234. [Google Scholar] [CrossRef]
  86. Davis, A.J.; Peppe, D.J.; Atchley, S.C.; Williamson, T.E.; Flynn, A.G. Climate and Landscape Reconstruction of the Arroyo Chijuillita Member of the Nacimiento Formation, San Juan Basin, New Mexico: Providing Environmental Context to Early Paleocene Mammal Evolution. Palaeogeogr. Palaeoclimatol. Palaeoecol. 2016, 463, 27–44. [Google Scholar] [CrossRef]
  87. Marcot, J.D.; Fox, D.L.; Niebuhr, S.R. Late Cenozoic Onset of the Latitudinal Diversity Gradient of North American Mammals. Proc. Natl. Acad. Sci. USA 2016, 113, 7189–7194. [Google Scholar] [CrossRef]
  88. Flynn, A.G.; Peppe, D.J. Early Paleocene Tropical Forest from the Ojo Alamo Sandstone, San Juan Basin, New Mexico, USA. Paleobiology 2019, 45, 612–635. [Google Scholar] [CrossRef]
Figure 1. Correlated Late Cretaceous sections that reveal perturbations in climate during the Mid- and Late Maastrichtian warming events. (A) Depositional pattern for the Dawson Creek section illustrating the temporally large hiatuses between the hyperthermals. Yellow stippled area indicates sediment deposition. (B) Dawson Creek δ13C (PDB) record from pedogenic carbonate nodules [16]. (C) δ13C (VPDB) data from micritic marine limestone collected at Bottaccione Gorge from Voigt et al. [11]. Brackets highlight the double positive carbon isotope excursion in the MME. (D) δ13C (VPDB) data from micritic marine limestone collected at Contessa Highway from Voigt et al. [11]. Brackets highlight the double positive carbon isotope excursion in the MME. (E) δ13C (PDB) isotopic record from benthic foraminifera, data from Li & Keller [20]. (F) Sedimentation rates from Bottaccione and Contessa from Gardin et al. [21]. The black line represents Bottaccione, and the blue line represents Contessa. (G) Global sea level curve [22] and modified by Leslie et al. [23]. (H) Ocean temperature data that have been calculated from δ18O isotopic values from benthic foraminifera gathered by the Deep Sea Drilling Project (DSDP) 1209 and published by Westerhold et al. [24]. The other ocean temperature data are from DSDP 525A [20] as well as DSDP 525 [25]. For this study, the ocean temperature that is correlated has been modified from Leslie et al. [23]. The green zone represents the MME, and the pink zone represents the duration of the LMWE. Unconformities are depicted by the gray zones labelled “Hiatus”.
Geosciences 15 00119 g001
Figure 2. (A,B) Stratigraphic distribution of carbon and oxygen isotope ratios from pedogenic carbonate nodules, (C,D) the corresponding atmospheric pCO2 and mean annual temperature curves; modified from Nordt et al. [16]. The green and pink zone represents the MME and LMWE, respectively.
Geosciences 15 00119 g002
Figure 4. (A) Modeled MAP data from bulk paleosol. (BF) Metal concentrations in pedogenic carbonate nodules, (G) polarity chrons for the Dawson Creek section. The green zone represents the duration of MME, and the pink zone represents the period of the LMWE. The gray zones labeled hiatus highlight the extent of the unconformities compared to the period of deposition within the stratigraphic section, and the blue dots represent samples collected from every B horizon within the soil profile.
Geosciences 15 00119 g004
Disclaimer/Publisher’s Note: The statements, opinions and data contained in all publications are solely those of the individual author(s) and contributor(s) and not of MDPI and/or the editor(s). MDPI and/or the editor(s) disclaim responsibility for any injury to people or property resulting from any ideas, methods, instructions or products referred to in the content.

