Article

Bridging Perceived and Actual Data Quality: Automating the Framework for Governance Reliability

by
Tomaž Podobnikar
1,2
1
Ministry of Natural Resources and Spatial Planning, 1000 Ljubljana, Slovenia
2
Faculty of Information Studies in Novo mesto, 8000 Novo mesto, Slovenia
Geosciences 2025, 15(4), 117; https://doi.org/10.3390/geosciences15040117
Submission received: 6 January 2025 / Revised: 27 February 2025 / Accepted: 21 March 2025 / Published: 26 March 2025

Abstract

:
The discrepancy between perceived and actual data quality, shaped by stakeholders’ interpretations of technical specifications, poses significant challenges in governance, impacting decision-making and stakeholder trust. To address this, we introduce an automated data quality management (DQM) framework, implemented through the NRPvalid toolkit, as a standalone solution incorporating over 100 assessment tools. This framework strengthens data quality evaluation and stakeholder collaboration by systematically bridging subjective perceptions with objective quality metrics. Unlike traditional producer–user models, it accounts for complex, multi-stakeholder interactions to improve data governance. Applied to planned land use (PLU) data, the framework significantly reduces discrepancy, as quantified by error score metrics, and directly enhances building permit issuance by streamlining interactions among administrative units, municipalities, and investors. By evaluating, refining, and seamlessly integrating spatial data into the enterprise spatial information system, this scalable, automated solution supports constant data quality improvement. The DQM and its toolkit have been widely adopted, promoting transparent, reliable, and efficient geospatial data governance.

Graphical Abstract

1. Introduction

Data quality is a complex and critical topic that requires a comprehensive understanding of the various issues associated with diverse data. Ensuring high data quality requires transparent interaction, including effective communication, coordination, and collaboration. It encompasses various aspects, such as accuracy and consistency, while addressing challenges such as interoperability, harmonization, common geographies, and metadata management to ensure data alignment with selected real-world phenomena. Attaining high-quality data requires interdisciplinary collaboration among data producers, data stewards, analysts, and end users/customers to fulfill the requirements of decision-making processes and operational applications. Overcoming these challenges requires not only technical expertise but also the development of a shared understanding of quality metrics and their practical implications across various stakeholders.
For example, aligning spatial data quality with global sustainability initiatives, such as the United Nations’ Sustainable Development Goals (SDGs), is essential because high-quality spatial data enable accurate land use planning, effective environmental monitoring, and sustainable resource management. Several SDGs rely on spatial data, including SDG 6 (Water), SDG 11 (Cities), SDG 13 (Climate), and SDG 15 (Land). Specifically, for SDG 11, consistent spatial data quality directly impacts multiple targets. For instance, Target 11.3: Inclusive and Sustainable Urbanization enhances land use planning and zoning by supporting efficient urban expansion while preserving green spaces, leading to more sustainable and livable cities.
In the context of data quality, numerous critical issues are often overlooked or underestimated. The quality of data, and consequently of resulting applications, is often inconsistent with users’ expectations [1], particularly when users lack a holistic understanding of metadata and data lineage, rely on it too much, or ignore it altogether (Figure 1). Furthermore, achieving a comprehensive understanding of the complexities of data quality presents a significant challenge due to the countless inherent uncertainties, biases, and subjectivities that can propagate uncontrollably through data analytics processes. The lineage of data, along with their context and narrative, requires in-depth knowledge that is often hidden by inaccessible documentation, dependent on the insights of data producers, or lost amidst the dynamic nature of data quality driven by changing requirements and real-world conditions.

1.1. Overview of Advanced Spatial Data Quality Evaluation Techniques

There is considerable evidence that spatial data quality often falls short of expectations [3], due to factors such as siloed data, insufficient technical skills, and lack of transparency in data management workflows [4]. The primary challenge with most data sources is not their inadequacy or the lack of available statistical methods, but the quality of the data themselves. Automation is a promising way to address these challenges by improving efficiency and reducing human error in quality control processes [5]. Quality assurance and quality control (QA/QC) of spatial data are crucial for understanding and improving actual data thereby enhancing its reliability and usability.
Established methods for evaluating the spatial data quality are based on international standards, such as the ISO 19157 series [6,7] and the OGC guidelines [8], which provide systematic frameworks for evaluating accuracy, completeness, consistency, and other aspects of quality. Comprehensive tools for GIS data quality management are available in commercial software [9]; however, they are primarily not designed for seamless integration into fully automated, purpose-specific workflows. These approaches are well suited for structured environments but may not fully leverage advances in technology and interdisciplinary methodologies [10], including artificial intelligence (AI) and machine learning (ML) for automated anomaly detection [11]. Most of them rely on statistical models or trained personnel, such as data custodians, who ensure the integrity of spatial datasets. For example, positional accuracy is typically evaluated by comparison with other, more relevant, usually authoritative data. However, there are numerous alternatives where such evidence is not available.
Alternatives include mathematical, empirical, and visual methods, a combination of these, and other methods [12]. Mathematical methods, such as spatial interpolation, statistical techniques, error propagation through different types of spatial analysis [13], etc., help to quantify spatial data quality. Other approaches to addressing random and systematic errors in spatial data, such as locally systematic interpretation, can improve the characterization and understanding of spatial inaccuracies [14].
Empirical approaches evaluate data quality through user-centered metrics and performance testing [15]. Other options include mathematical methods for managing spatial data quality, such as uncertainty and unpredictability modeling through Monte Carlo simulations [13] (based on empirical data and simulations), and advanced probabilistic frameworks, such as Bayesian networks and Markov random fields, that represent spatial dependencies and predict errors in spatial attributes [16]. These techniques enhance the understanding of potential errors and their propagation [17]. Ontology-based frameworks provide structured methods for identifying inconsistencies [18].
Techniques such as visual analytics provide exploratory tools for detecting patterns and anomalies, thereby improving the understanding of spatial errors and their distribution [19]. Similarly, digital twins offer a promising approach for real-time monitoring and iterative updating of spatial data quality, enabling dynamic and adaptive management [20]. While these methods may lack the robustness of traditional approaches when used in isolation, their intelligent and flexible combination can lead to superior results in spatial data quality management.
Collaborative methods, including gamification [21] as a user-centric approach, can engage users and foster collective data validation [22]. Gamification approaches have proven effective in improving crowdsourced spatial data quality, as demonstrated by projects such as OpenStreetMap [23].
AI-driven quality assurance leverages ML techniques, such as neural networks and decision trees, for predictive modeling to identify potential data quality issues, thereby improving proactive error detection and management [24]. Blockchain technology offers tamper-proof solutions for tracking changes, ensuring data integrity, and maintaining trust in spatial datasets, although considerations of scalability and computational overhead are essential for its effective implementation [25].
Techniques such as data conflation, fusion, merging, and integration play a critical role in resolving spatial inconsistencies by combining multiple data sources to improve accuracy and completeness [26]. Dimensionality reduction methods, such as principal component analysis (PCA), t-distributed stochastic neighbor embedding (t-SNE), and automated feature engineering, preserve meaningful properties of data through transformation. These methods enhance spatial data analysis by retaining critical information, minimizing noise, and reducing computational complexity [27].

1.2. Data Quality Evaluation and Stakeholder Engagement

There are numerous commercial and open-source QA/QC tools, many of which are designed to measure and validate data quality based on predefined metrics. These tools often include automated data profiling and data quality checks [28] and can even proactively monitor quality data issues [29]. However, they typically fail to account for the subjective interpretations of data quality held by different stakeholders, leading to misalignment between what is perceived by them and what is actual data quality. Additionally, these tools often fail to account for human and contextual factors that influence quality perceptions, as stakeholders’ interpretations can vary significantly and may not always align with technical specifications.
While standards such as the ISO 19157 series provide a solid foundation for defining and evaluating data quality, they predominantly emphasize technical aspects and elements like accuracy, completeness, and consistency. They do not fully incorporate management considerations, such as automated interaction mechanisms to enhance stakeholder engagement [30], for example, by facilitating various forms of quality reporting. This limitation creates a gap in addressing broader governance and operational challenges associated with spatial data quality, as well as in enabling scalable and proactive quality management within geospatial ecosystems.

1.3. Problem Statement

Different stakeholders, such as data producers, custodians, stewards, and users from diverse backgrounds, have often conflicting subjective interpretations and priorities about what constitutes data quality. These differences influence both conceptual specifications and database implementation. Moreover, when stakeholders lack the necessary skills or a clear understanding of the data, they may unintentionally miscommunicate their intentions or remain unaware of subconscious decisions they have made [31]. These discrepancies can lead to mistrust of the data and inefficiencies in decision-making.
A significant challenge lies in the interaction between data producers and data stewards, who manage data for input or ingestion into enterprise platforms. These challenges often arise from biased interpretations of concepts implemented through technical specifications or data quality standards. Such specifications strike a balance between simplicity, comprehensiveness, and correctness but cannot encompass all details or fully reflect the diverse perspectives of stakeholders. Their implementation heavily depends on expert knowledge.
To address these interaction challenges and conflicting interpretations, this study introduces a framework for reliable governance, particularly in stakeholder interaction, to ensure automation through a comprehensive definition of spatial data quality. This definition integrates managerial and technical aspects along with the geospatial perspective. A key element of this approach is distinguishing between perceived and actual data quality, which often diverge due to various factors. The framework, based on this comprehensive definition, aims to minimize this discrepancy by automating tasks, reducing human error, increasing transparency, and ensuring compliance with policies and standards (Figure 2).
The individual spatial data evaluation techniques discussed previously may be less robust when used in isolation compared to well-established procedures. However, an intelligent and flexible combination of these methods can deliver superior results. In addition, plugins, APIs, or standalone programs facilitate seamless interaction between data producers and data stewards, minimizing manual oversight and fostering dynamic, efficient collaboration. By enabling automated data exchange and continuous feedback, these tools help to bridge perceived and actual data quality instantly, as demonstrated in this study.

2. Materials and Methods

The methods are built on the identified knowledge gap (Figure 2), which includes a comprehensive definition of spatial data quality followed by a solution to minimize the discrepancy between perceived and actual data quality. The data sources consist of structured vector or raster spatial data, typically processed and analyzed using any GIS software. These datasets ultimately serve as the foundation for comprehensive enterprise databases and data warehouses. These systems form the backbone of spatial data infrastructures or integrated geospatial ecosystems, supporting a wide range of applications and services.
Quality is generally defined as a timeless concept, often described as being error-free and fit for its intended purpose. Many authors and organizations have proposed alternative definitions that reflect various perspectives, such as those of business, customer, process, data, and geospatial. The complexity of this concept is evident in definitions that highlight various aspects, including fitness for use [32], meeting expectations [33], fitness for the purpose of use, achieving a level of excellence, meeting specifications, the degree to which a set of inherent characteristics meet requirements [34], and a focus on specific types of metadata.

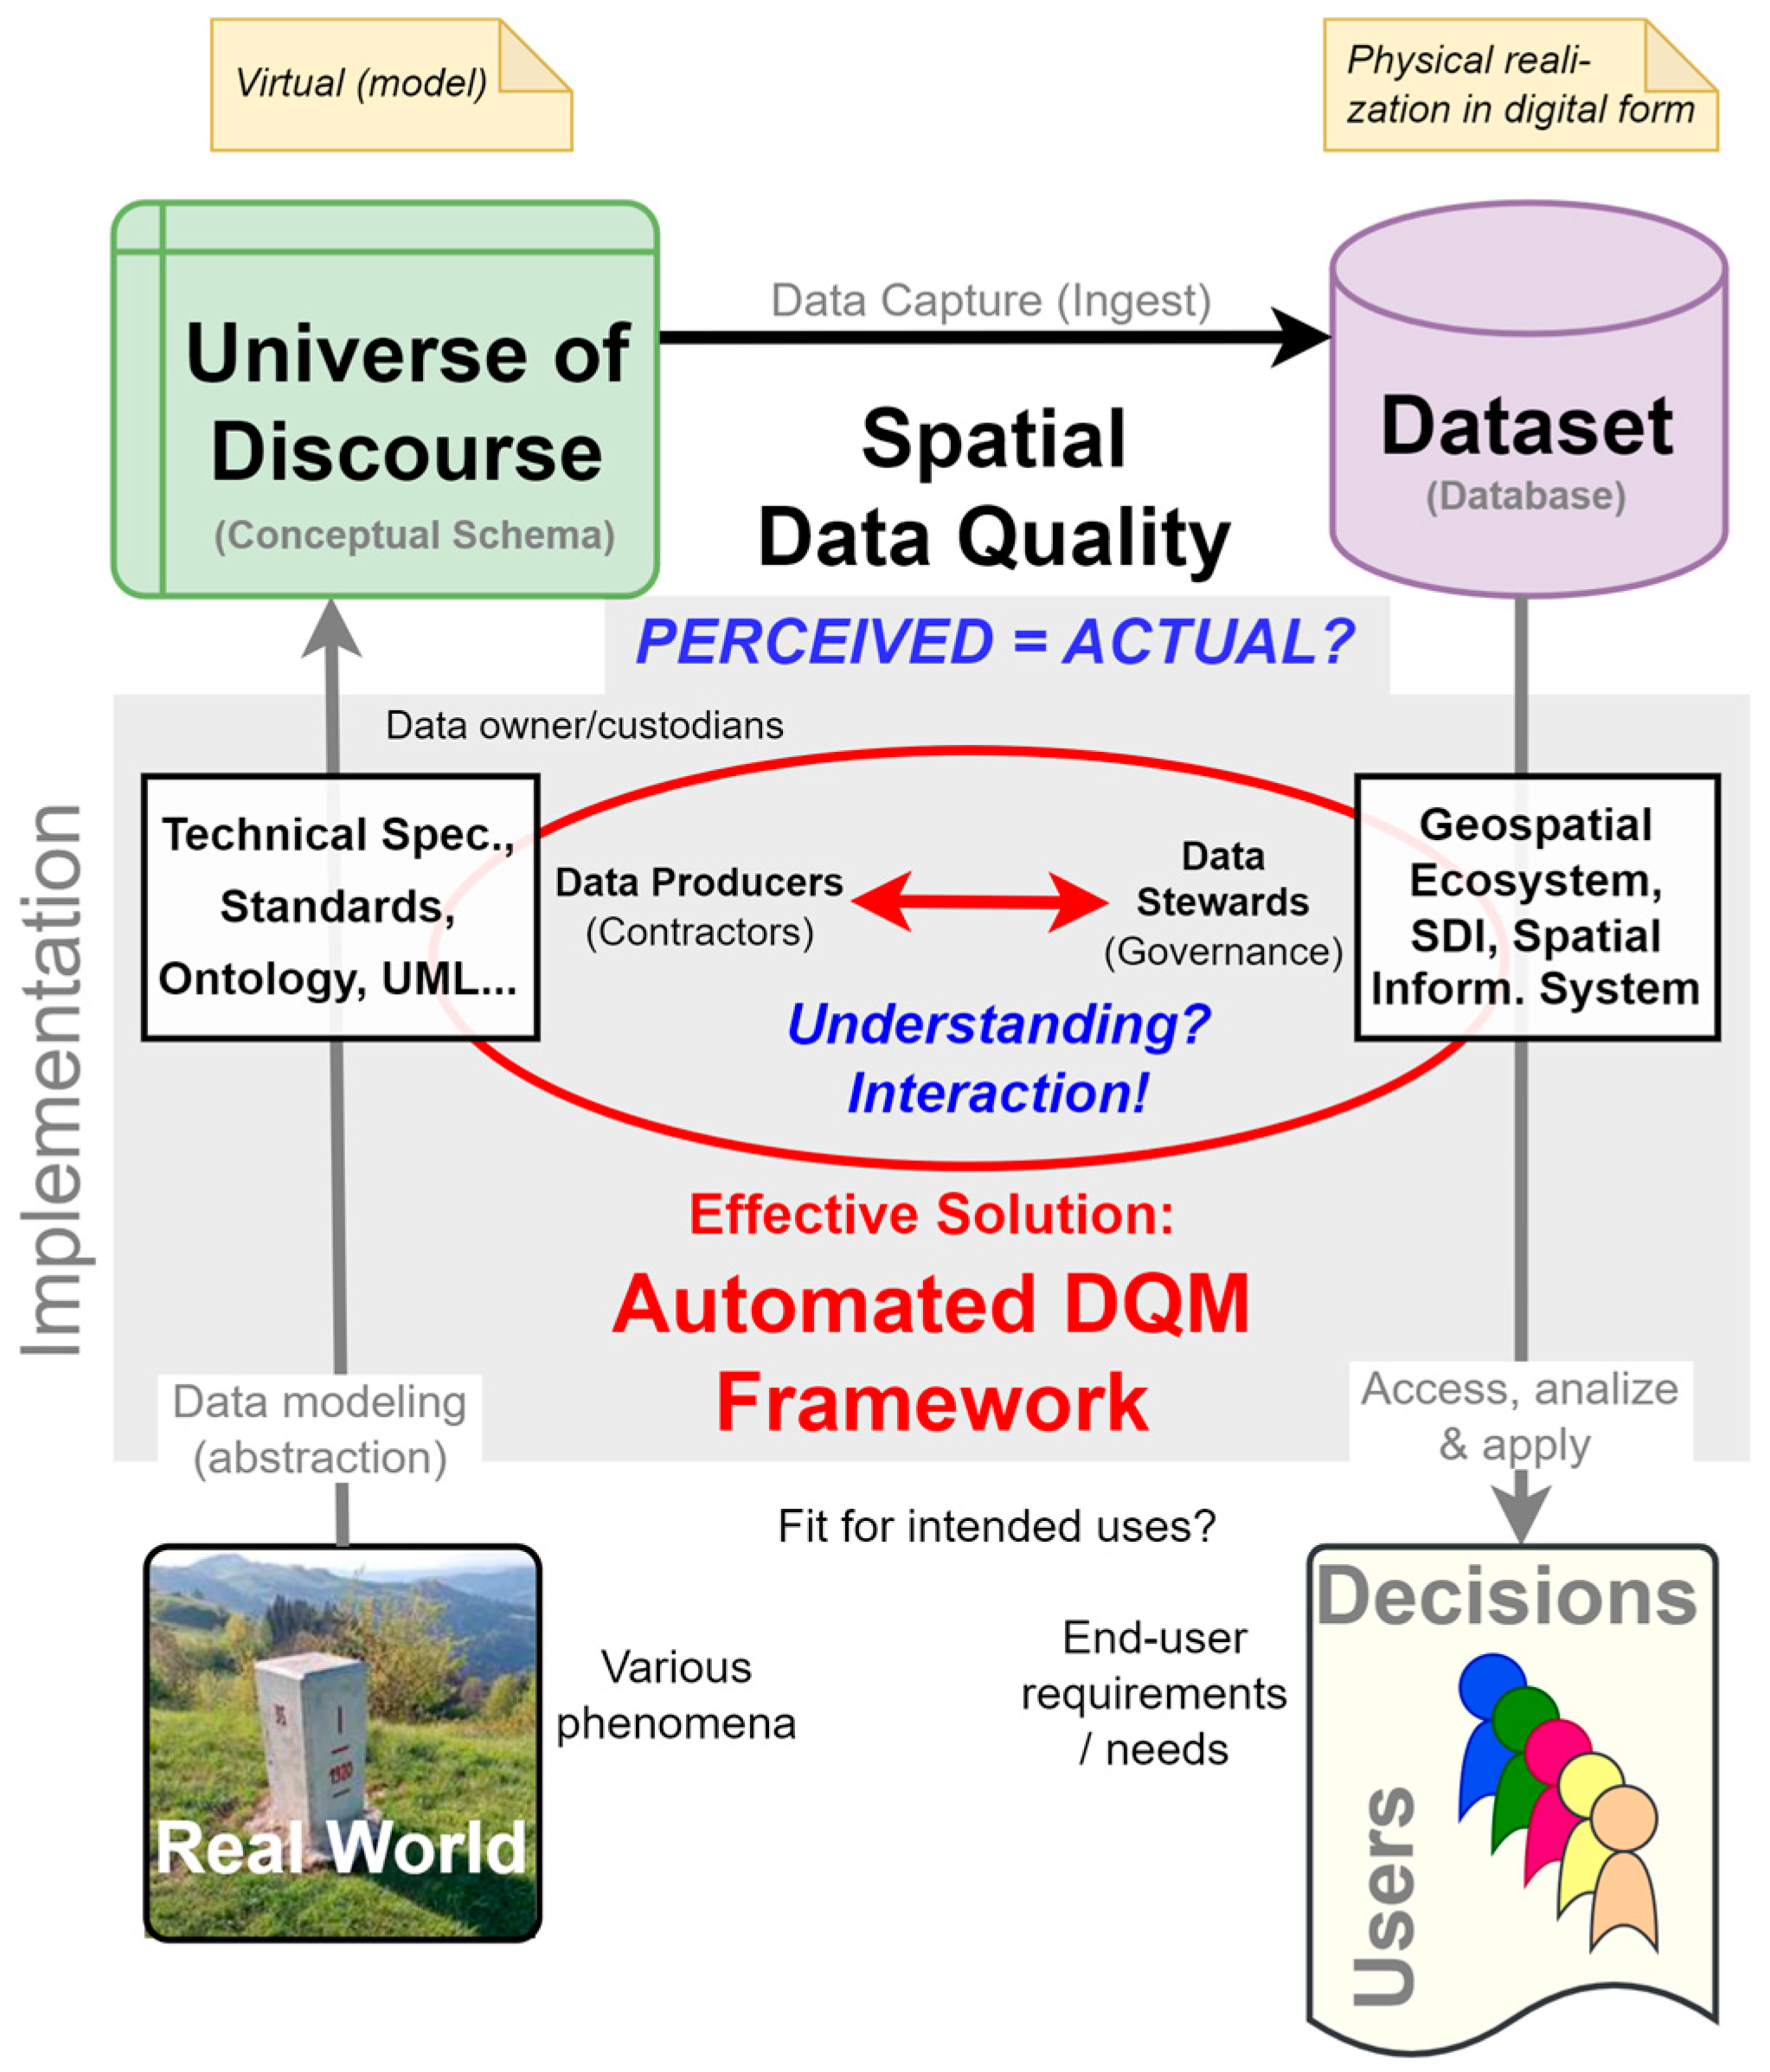
2.1. Technical Definition of Spatial Data Quality

In the context of data, quality can be simply defined as the extent to which data meets user requirements and serves its intended purpose. This definition is particularly relevant to external data quality, which is evaluated outside the organization by end users. However, this study primarily relies on internal data quality managed within the organization, where data capture processes and databases can be more effectively controlled to ensure alignment with technical specifications.
Moreover, this study focuses on (geo)spatial data quality, which can be examined from various perspectives. Currently, no universally accepted definition of (spatial) data quality exists. However, a common understanding of data quality principles is essential. Data quality is generally defined as the degree to which a dataset accurately and appropriately represents the intended aspects of the real world within a defined universe of discourse. The universe of discourse refers to a specific view of the real world that includes all elements of interest (Figure 3). This definition is adopted in international standards, such as ISO 19157-1 for geographic information [6]. Understanding this relationship between the real world, the universe of discourse, and digital representation is fundamental to improving spatial data quality management.
For example, consider a real-world phenomenon, such as a boundary marker. It is initially modeled using technical specifications that define the universe of discourse, encompassing all relevant properties from the real world, such as the concept of a vector point feature with specific attributes or other relevant representations, depending on the application. These properties are then implemented in a digital format, such as a dataset or database, and subsequently used to meet specific user needs.
The most uncertain aspect of the discussed concept is the interpretation of reality or real-world phenomena as a universe of discourse, realized by conceptual schema through abstraction. People can adopt any of the various conceptualizations of geographic space, which may reflect the distinctions between perceptual and cognitive spaces or be influenced by different geometric properties, such as continuous or discrete representations [35]. This study relies on a single conceptualization, which is clearly defined in technical specifications. However, its interpretation may vary across experts from different fields, including geodesists, urban planners, IT specialists, and other stakeholders, making quality evaluation uncertain.

2.2. Integrating Technical and Managerial Aspects of Data Quality

Technical aspects are fundamental when examining data quality, as highlighted in the previous section. The managerial or organizational part of spatial data quality focuses on implementing standardized protocols to ensure consistency and reliability. These protocols are defined by international standards such as ISO 19157-1 for geographic information and the broader ISO 9000 family for quality systems management [34], including ISO 9001 for quality management systems. This approach aligns with the principles of Six Sigma, which emphasize total data quality management (TDQM) [36]. Such practices are particularly valuable for addressing the unique complexities inherent in spatial data quality management.
Effective spatial data quality management also requires the design and implementation of workflows that systematically handle data from collection through to database and analysis. Well-structured workflows ensure the consistent application of QA/QC processes, such as validation, transformation, and integration. Robust data governance practices complement these efforts by establishing policies and procedures that oversee data management throughout its lifecycle. Critical practices include maintaining accurate metadata, ensuring compliance with legal and ethical standards, and conducting regular audits to monitor and improve data quality.
It is commonly known that geospatial specialists and data scientists spend a significant portion of 80% or more of their time preparing data for analysis. This preparation typically includes time-consuming tasks such as data cleaning and validation. Alarmingly, studies suggest that nearly half of all newly created data records contain at least one critical error, and only a small percentage of organizational data meets basic quality standards [1]. Poor data quality can lead to significant long-term costs, highlighting the importance of robust management practices [37]. The highlighted topics present various issues that prevent the datasets from aligning with common quality expectations. These challenges highlight the urgent need for greater focus on data quality management, underscoring its pivotal role in ensuring the reliability and usability of analytical outcomes.
A shared focus on effective management and advanced technical solutions is crucial for ensuring that spatial data meet the demands of critical applications. These methodologies emphasize continuous improvement, operational efficiency, and error minimization, making them integral to spatial data quality management. In this study, it is essential to use tools that enhance the understanding of data quality requirements, thereby reducing the transmission of misunderstood draft data between the data producer and the data steward.
Achieving successful data quality management requires the harmonious integration of managerial and technical aspects. Managerial efforts establish policy standards and strategic frameworks to guide data processes, while technical solutions ensure the practical implementation of these policies, delivering reliable, high-quality data to support decision-making. This study addresses both aspects.

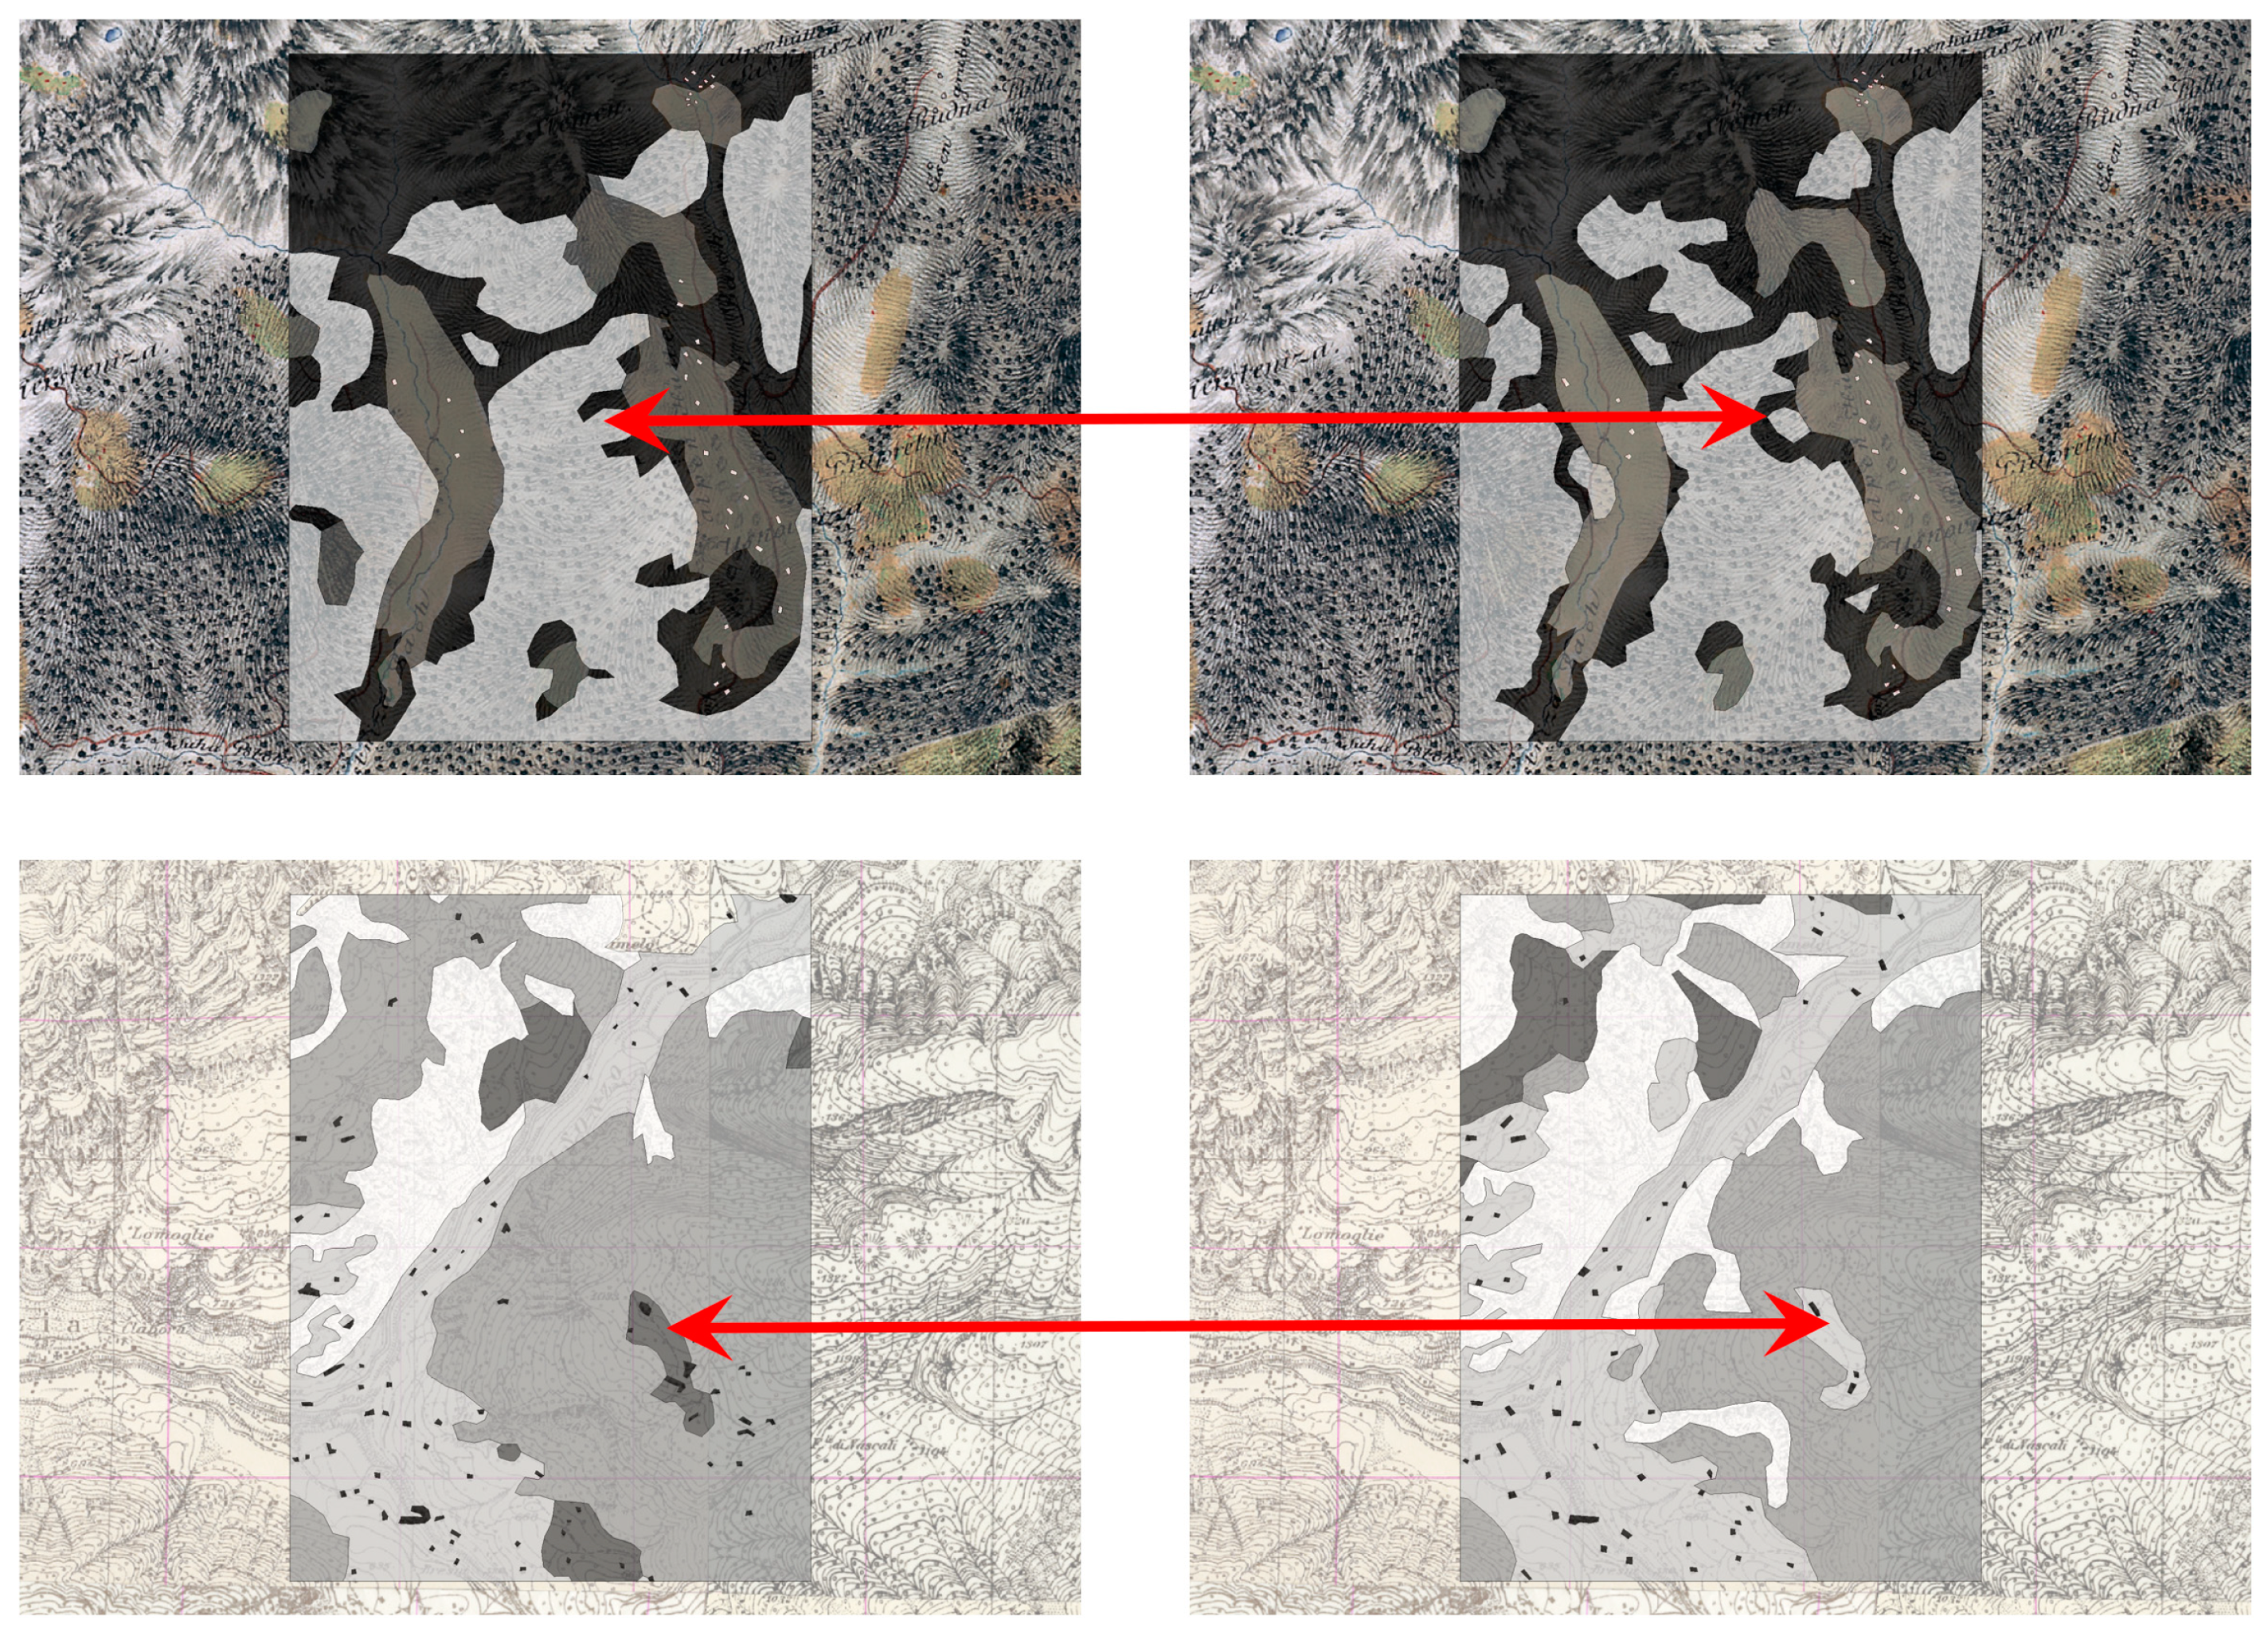
2.3. Geospatial Perspective of Data Quality

The geospatial perspective on data quality focuses on 2D or 3D spatial attributes, including more complex quality elements of accuracy and completeness, with particular attention to coordinate reference systems (CRSs), topology, data structures, data formats, spatial relationships, and other geospatial concepts. Specialized technical software, including GIS, remote sensing tools, and BIM, plays an important role in managing and analyzing spatial data. The geospatial perspective also explores how spatial inaccuracies affect data quality, propagate through geospatial analysis, and introduce uncertainties that impact decision-making tied to location-based data.
Unlike non-spatial approaches, the geospatial approach requires a deep understanding of the spatial component of data, and, consequently, its associated quality aspects. High-quality spatial data are critical for applications such as mapping, construction, spatial planning, navigation, and environmental monitoring, where spatial accuracy and other elements of data quality are essential to achieving reliable outcomes.

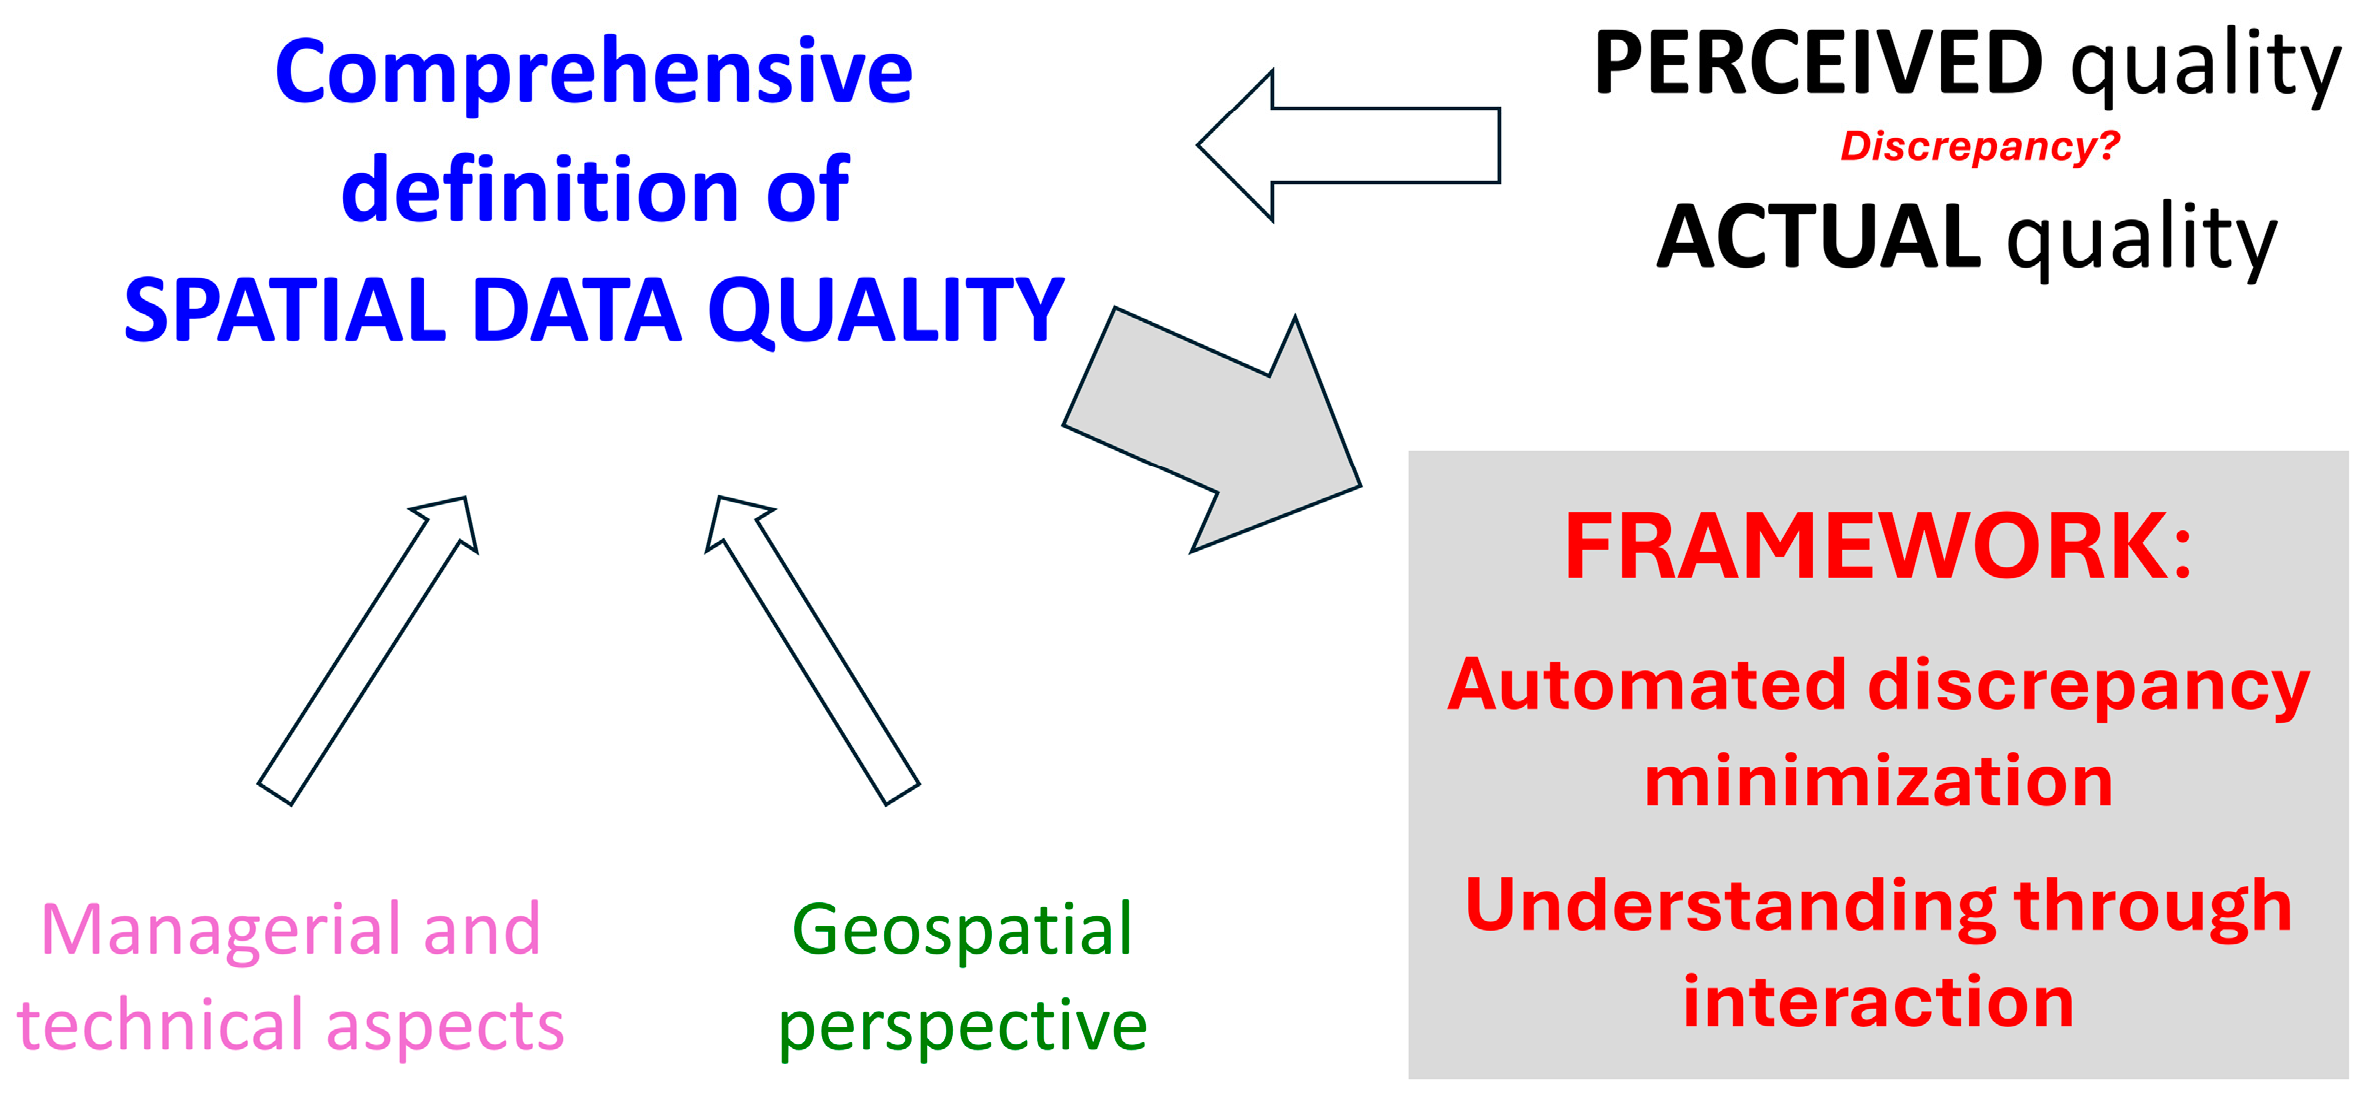
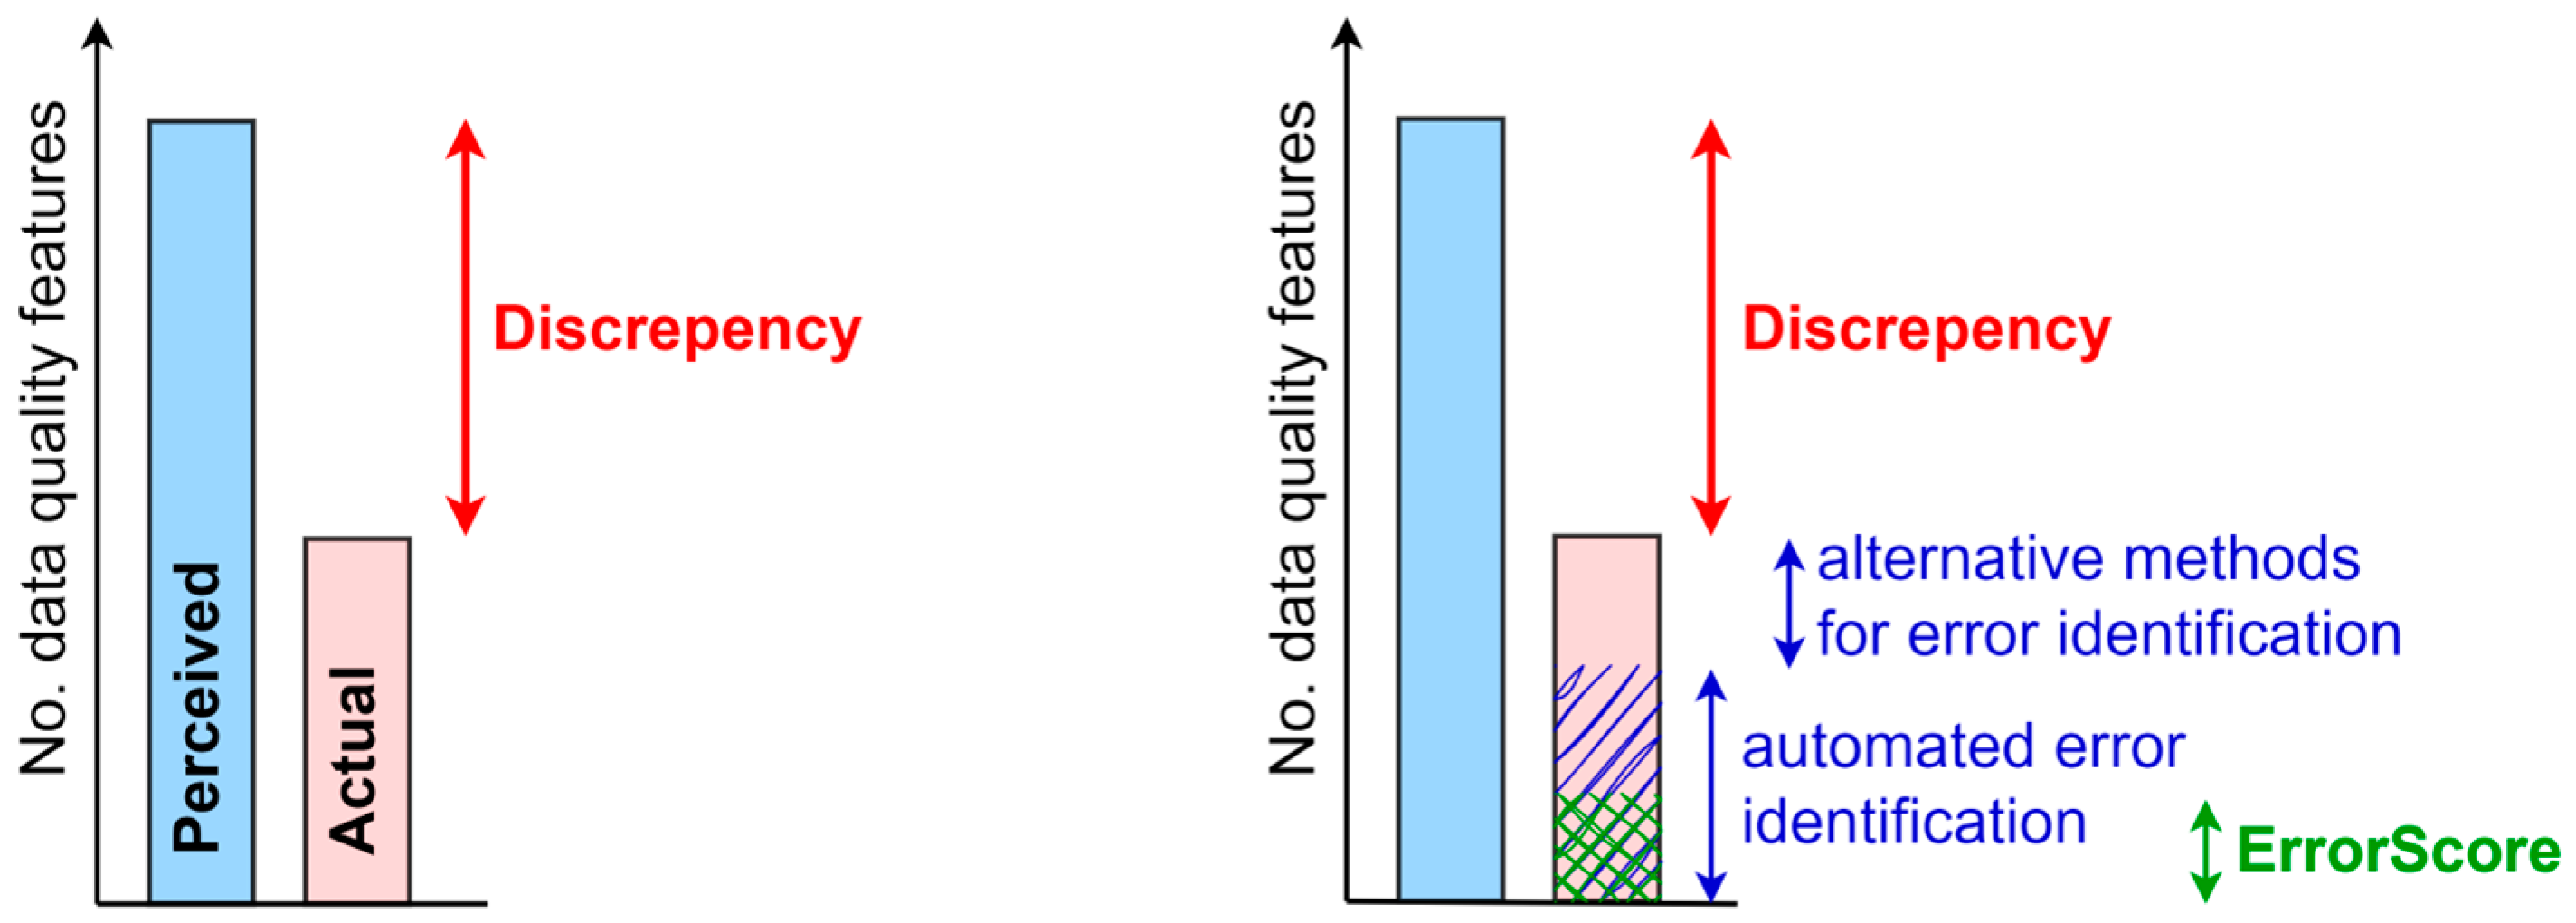
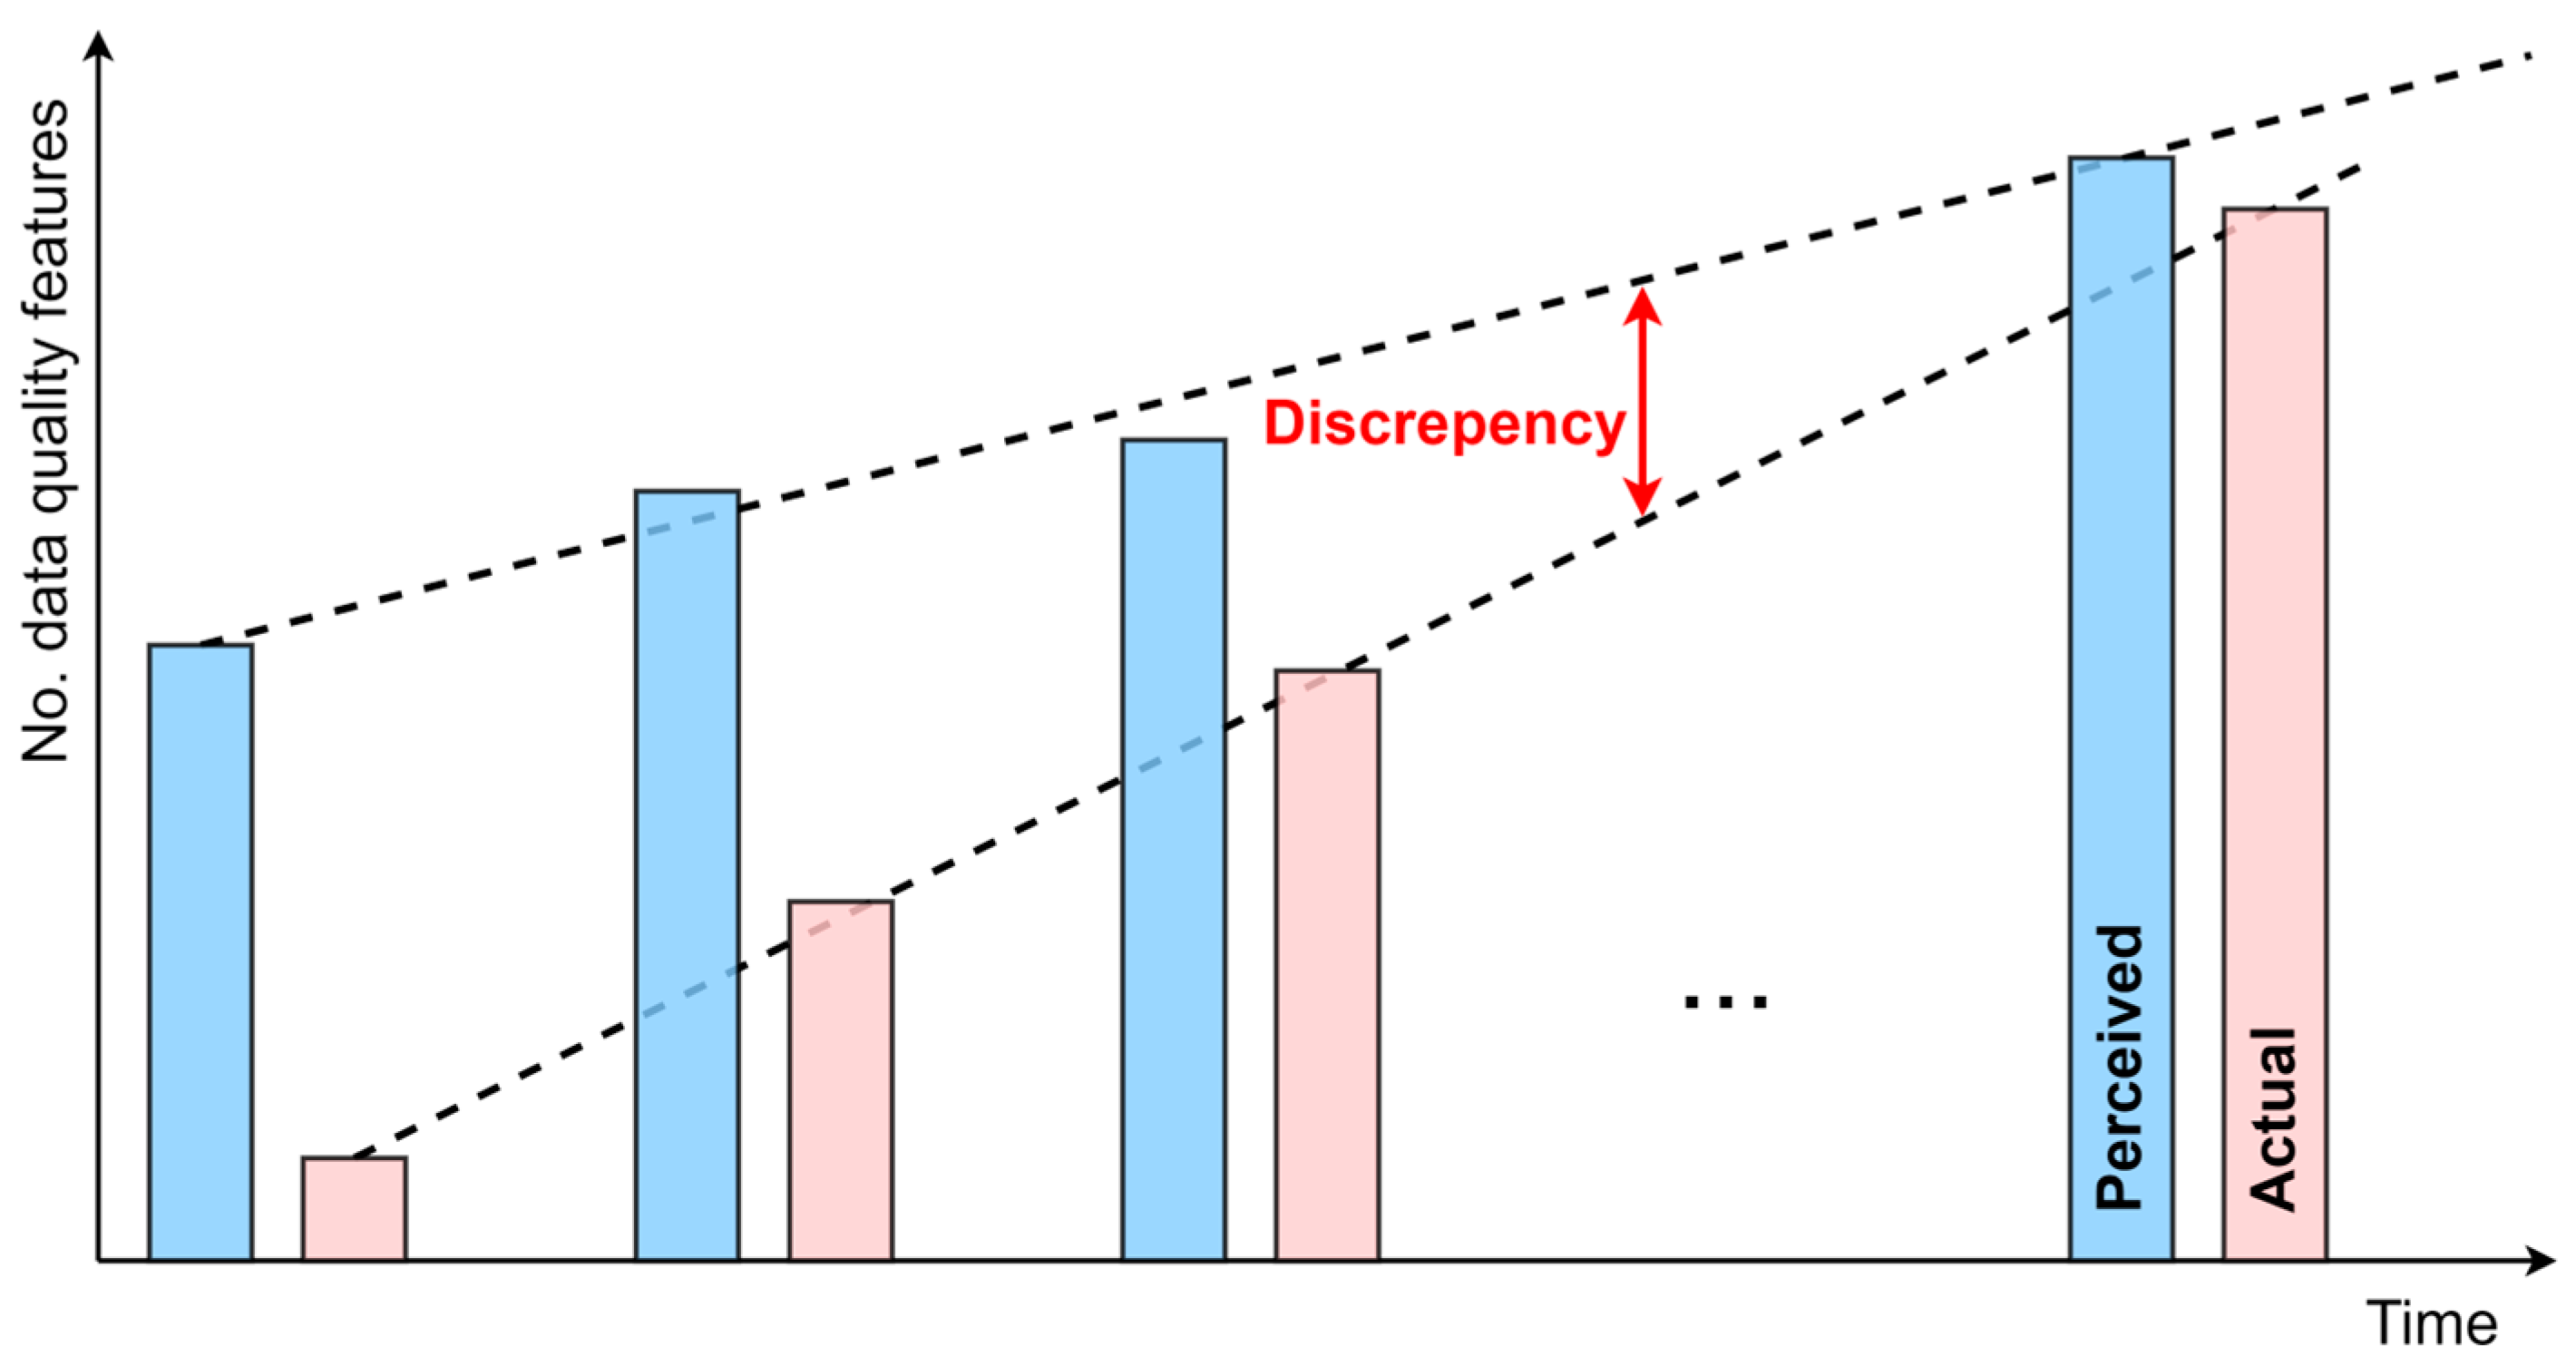
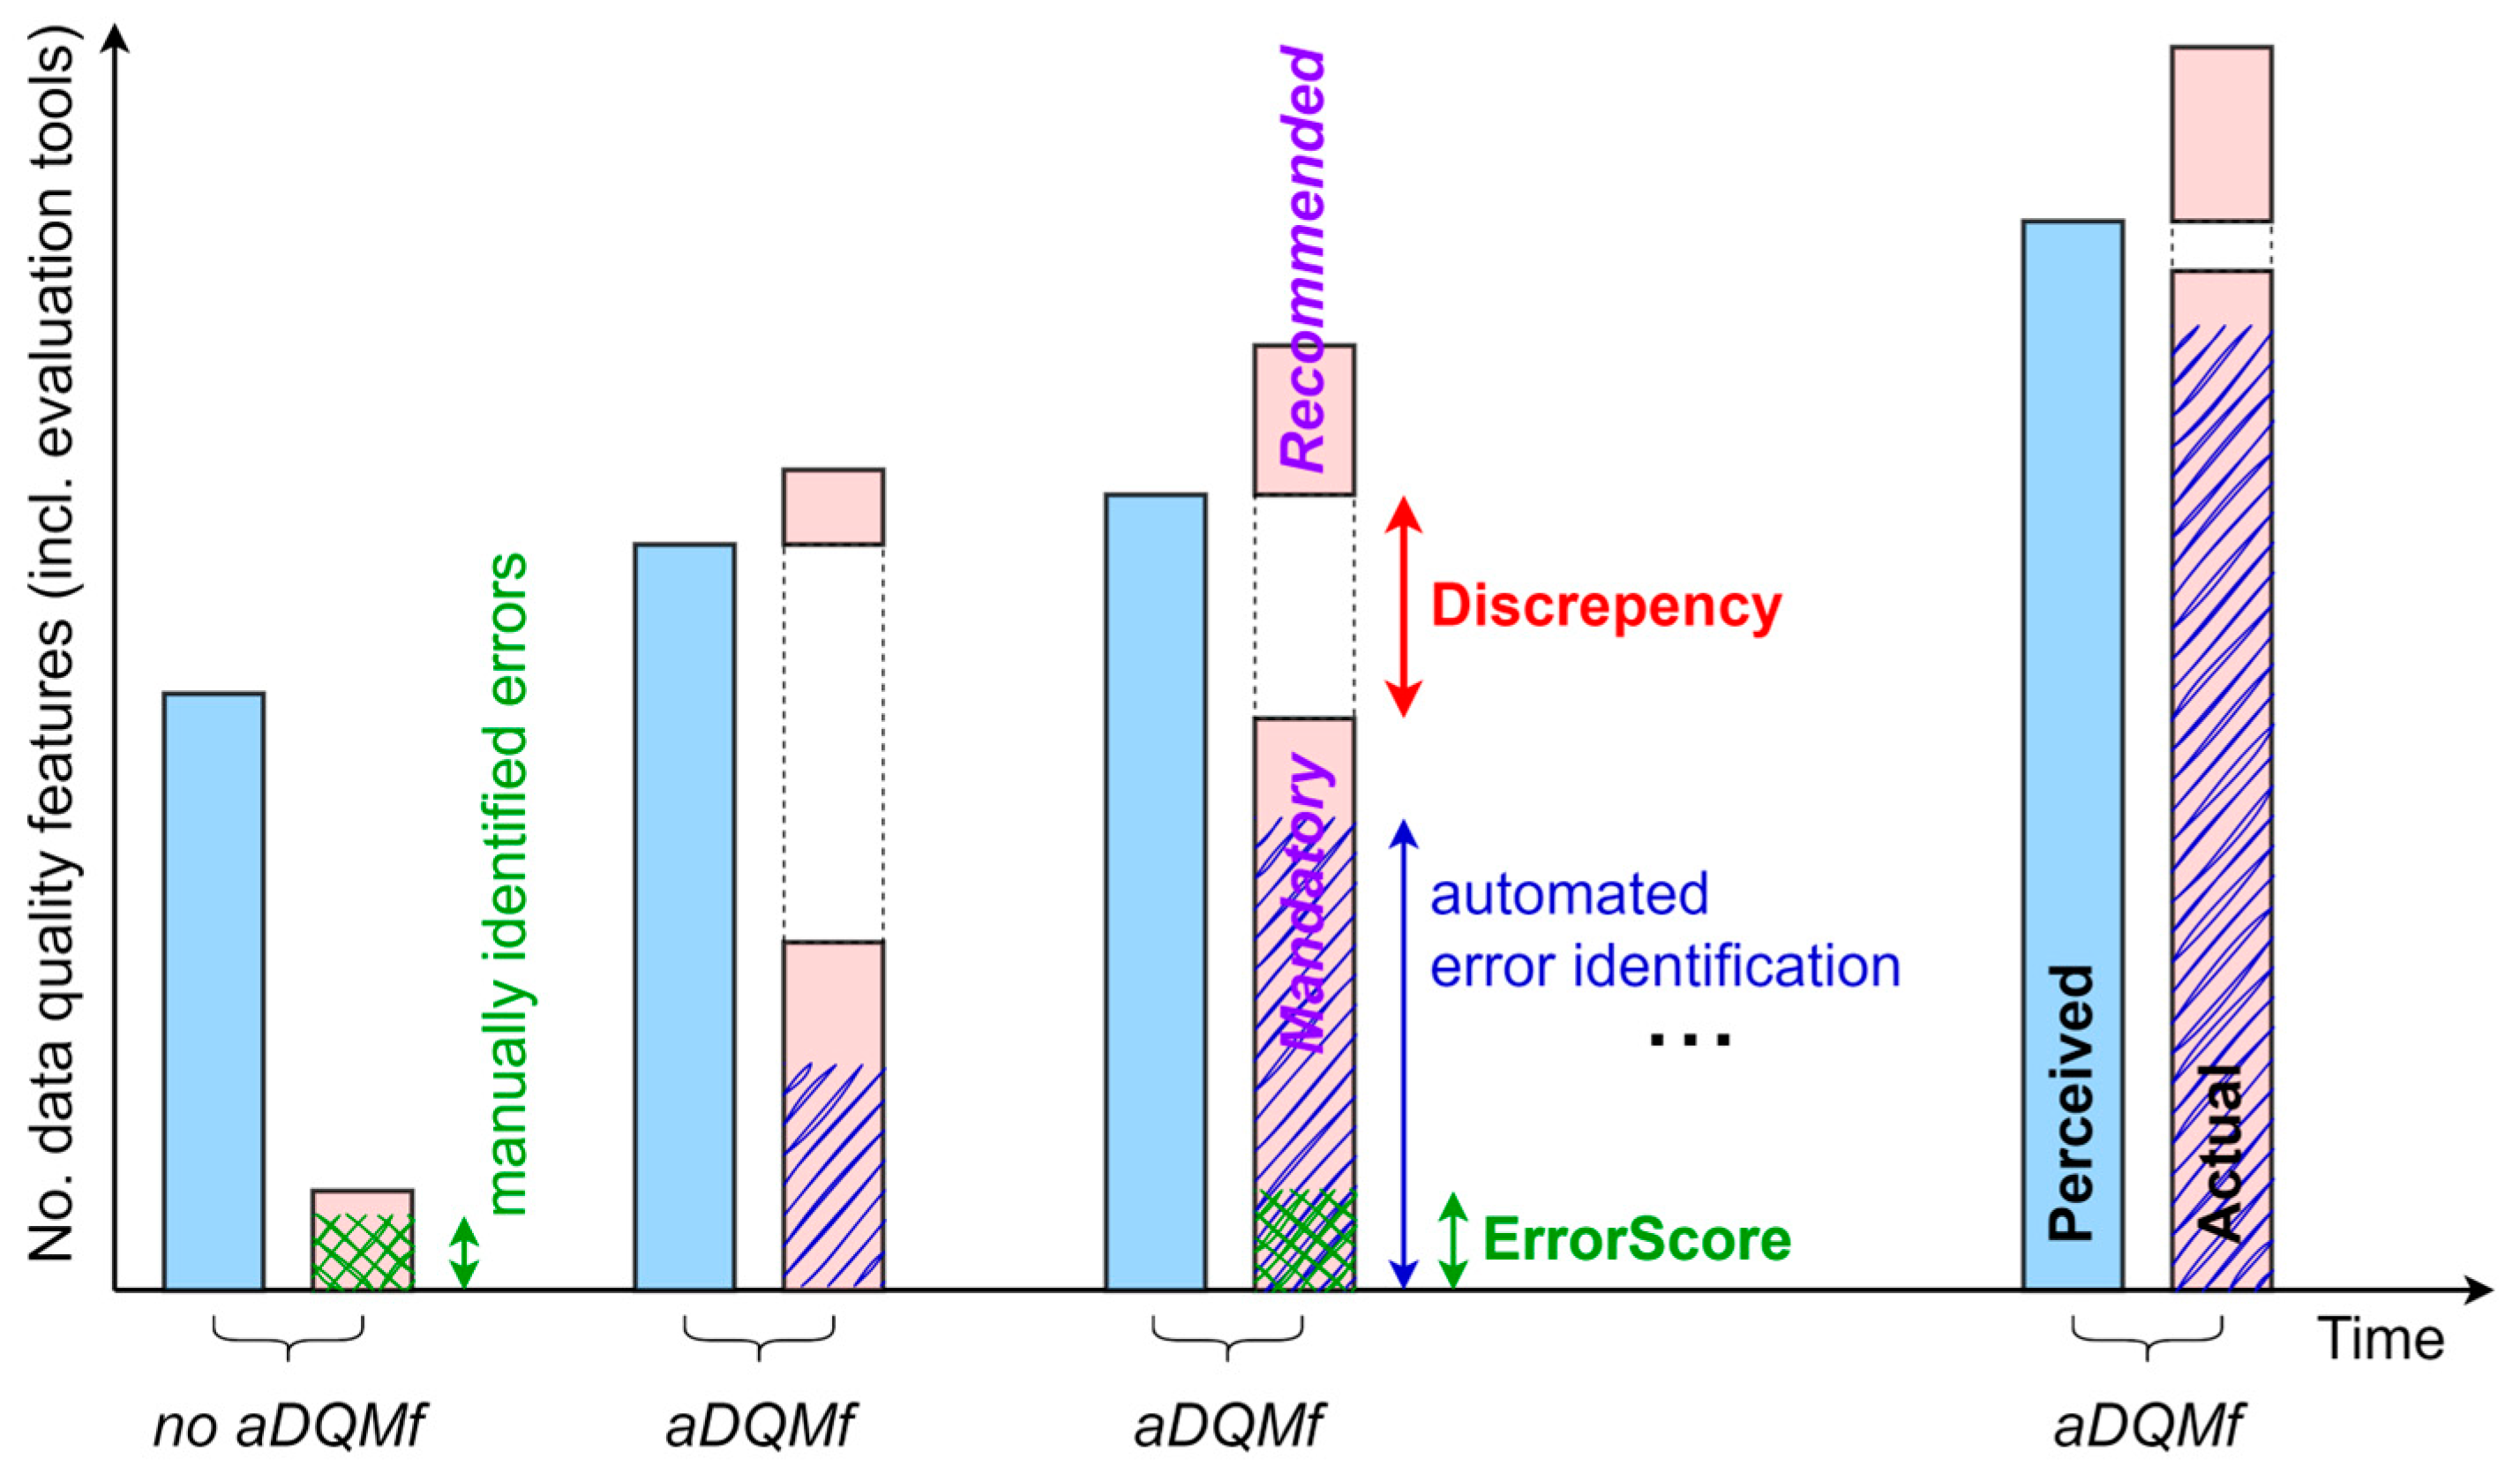
2.4. Understanding Perceived and Actual Data Quality

A further question is whether stakeholders, especially data producers and data stewards, adequately and consistently understand how spatial data quality is defined, as well as the characteristics of the produced dataset. To address this question, we propose the concept of perceived and actual data quality (Figure 4, left).
Based on the data quality definition in Section 2.1, an ideal scenario is assumed where perceived data quality aligns perfectly with the universe of discourse, which is realized with a number of data features defined in the conceptual schema or technical specifications and thus satisfies all data quality requirements. Simply put, perceived data quality (light blue) reflects stakeholders’ understanding or interpretation of data performance as they believe it conforms to established standards. In contrast, actual data quality (light red) objectively reflects the performance of the data when measured [38]. The actual data quality is often lower than the perceived quality due to the stakeholders’ limited understanding of the universe of discourse schema or, more specifically, technical specifications, as well as the presence of incomplete or erroneous data in the dataset. This issue is common, as the complexity of real-world phenomena makes their formalization inherently challenging. This gap highlights a clear discrepancy between perceived and actual data quality, based on the assumption that stakeholders believe all requirements from the conceptual schema are correctly reflected in the data.
Realizing the discrepancy between perceived and actual data quality (Figure 4, left) involves calculating the total number of data quality features (Ns; light blue) specified in the conceptual schema or technical specifications (and perceived by stakeholders) and comparing them to the subset of these features that are error-free and acknowledged by stakeholders as being actual (Nsef; light red):
Discrepancy = Ns − Nsef.
A key challenge in quantifying this discrepancy lies in determining Nsef, which includes a highly uncertain component: the extent to which stakeholders are aware of a feature’s existence. Traditionally, this aspect of quality management is assessed through extensive stakeholder interactions and expert use of GIS software, a process that is often time-consuming and inefficient for ensuring data quality.
This issue can be addressed by leveraging accurate metadata and, more importantly, an automated processing toolkit as the core of the proposed automated DQM framework. The proposed framework evaluates a broad range of data features based on technical specifications using metrics such as accuracy, completeness, and timeliness. While automation significantly improves estimation, it cannot fully capture the complexity of specifications. Consequently, the discrepancy metric can only be approximated rather than precisely quantified. However, this approach substantially reduces uncertainty and minimizes the discrepancy.
Despite its importance, the discrepancy metric is often overlooked in DQM processes due to a lack of knowledge, limited access to appropriate tools, or intentional disregard, as illustrated in Figure 1. This gap poses a significant challenge to governance reliability, particularly when stakeholders rely solely on perceived quality without recognizing underlying data issues.
A key component supporting discrepancy estimation within the automated toolkit for error evaluation is the quantitative error metric, ErrorScore (Figure 4, right), which assesses overall data quality. This metric follows a rules-based approach that generates fundamental quality indicators. ErrorScore (green cross-hatching) represents the difference between the total number of tools (Nt) available for automated evaluation (blue hachured area with green cross-hatching) and the number of tools reporting no errors (Ntef; blue-hachured area). In other words, ErrorScore is the sum of the number of tools within the automated quality evaluation toolkit where a Boolean value of 0 indicates no error, and 1 indicates that at least one error was detected and identified by a given tool.
This results in an integer value ≥ 0, formulated as follows:
ErrorScore = Nt − Ntef.
The automated error-identification approach requires further clarification. Since the toolset cannot be perfect, multiple tools may identify the same error in the dataset, while some errors may remain undetected due to the absence of a suitable tool. Alternative error-identification methods (Figure 4, right), such as visualizations, as described in the Introduction section, can, to some extent, improve error identification. However, certain errors, such as random errors and those influenced by human interpretation, cannot be entirely eliminated due to their inherent nature. Despite these limitations, this approach provides a systematic and highly objective measure of data quality while highlighting specific data properties that require cleaning. Furthermore, calculating the ErrorScore can help minimize the discrepancy between perceived and actual data quality.
The definition of data quality is time-sensitive and evolves alongside changing contexts and requirements. Therefore, the conceptual schema and technical specifications representing the universe of discourse must align with business, user, or customer perspectives to ensure it remains fit for its intended purpose. This schema incorporates new features, attributes, their interconnections, and datasets as they emerge. Consequently, actual data must continuously adapt to these developments to maintain their relevance.
This evolution is illustrated in Figure 5, which depicts how the concept of perceived and actual spatial data quality changes over time. As the conceptual schema evolves, driven by a deeper understanding of user requirements, stakeholders refine their perception of data quality. In parallel, actual data quality improves, gradually reducing the discrepancy between perceived and actual quality.

2.5. Automated DQM Framework Principles

By adopting a critical perspective, this study proposes an automated DQM framework designed to align actual spatial data quality with perceived quality while enhancing stakeholder understanding through effective interaction. Specifically, the framework emphasizes improved interaction between contractors responsible for data production (data producers) and data stewards responsible for quality governance and adherence to organizational standards. This focus ensures both improved data reliability and more effective collaboration among all spatial data stakeholders, such as users, producers, and data stewards.
The previously described straightforward definition of data quality is transitioning from real-world phenomena, through the universe of discourse, to the database, and, finally, to the end users. The implementation focus lies in the intermediate space between the universe of discourse and the database (Figure 6). Highlighted with a grey background, this area emphasizes the operationalization of the universe of discourse through conceptual schema, technical specifications, standards, or ontologies, which, together, form the backbone of the geospatial ecosystem represented or spatial data infrastructure (SDI) by actual data or databases.
To improve understanding through interaction and align actual spatial data quality with perceived quality, various practical solutions are available. These include training and education, data quality audits, advanced stakeholder collaboration, comprehensive metadata management, data quality dashboards, continuous feedback mechanisms, and automated programs or toolkits, which are the primary focus of this study. Overall, the automated DQM framework is based on the following principles:
  • Reducing the data quality gap minimizes the discrepancy between perceived and actual data quality based on a comprehensive definition of spatial data quality.
  • Reliable governance and stakeholder interaction improve stakeholder communication through automated support to enhance governance, ensure shared understanding, improve collaboration, reduce human error, and support continuous education.
  • Comprehensive data quality evaluation ensures compliance with policies and standards by integrating management, technical, and geospatial perspectives into a holistic evaluation approach, guaranteeing that data quality is high and aligned with technical specifications.
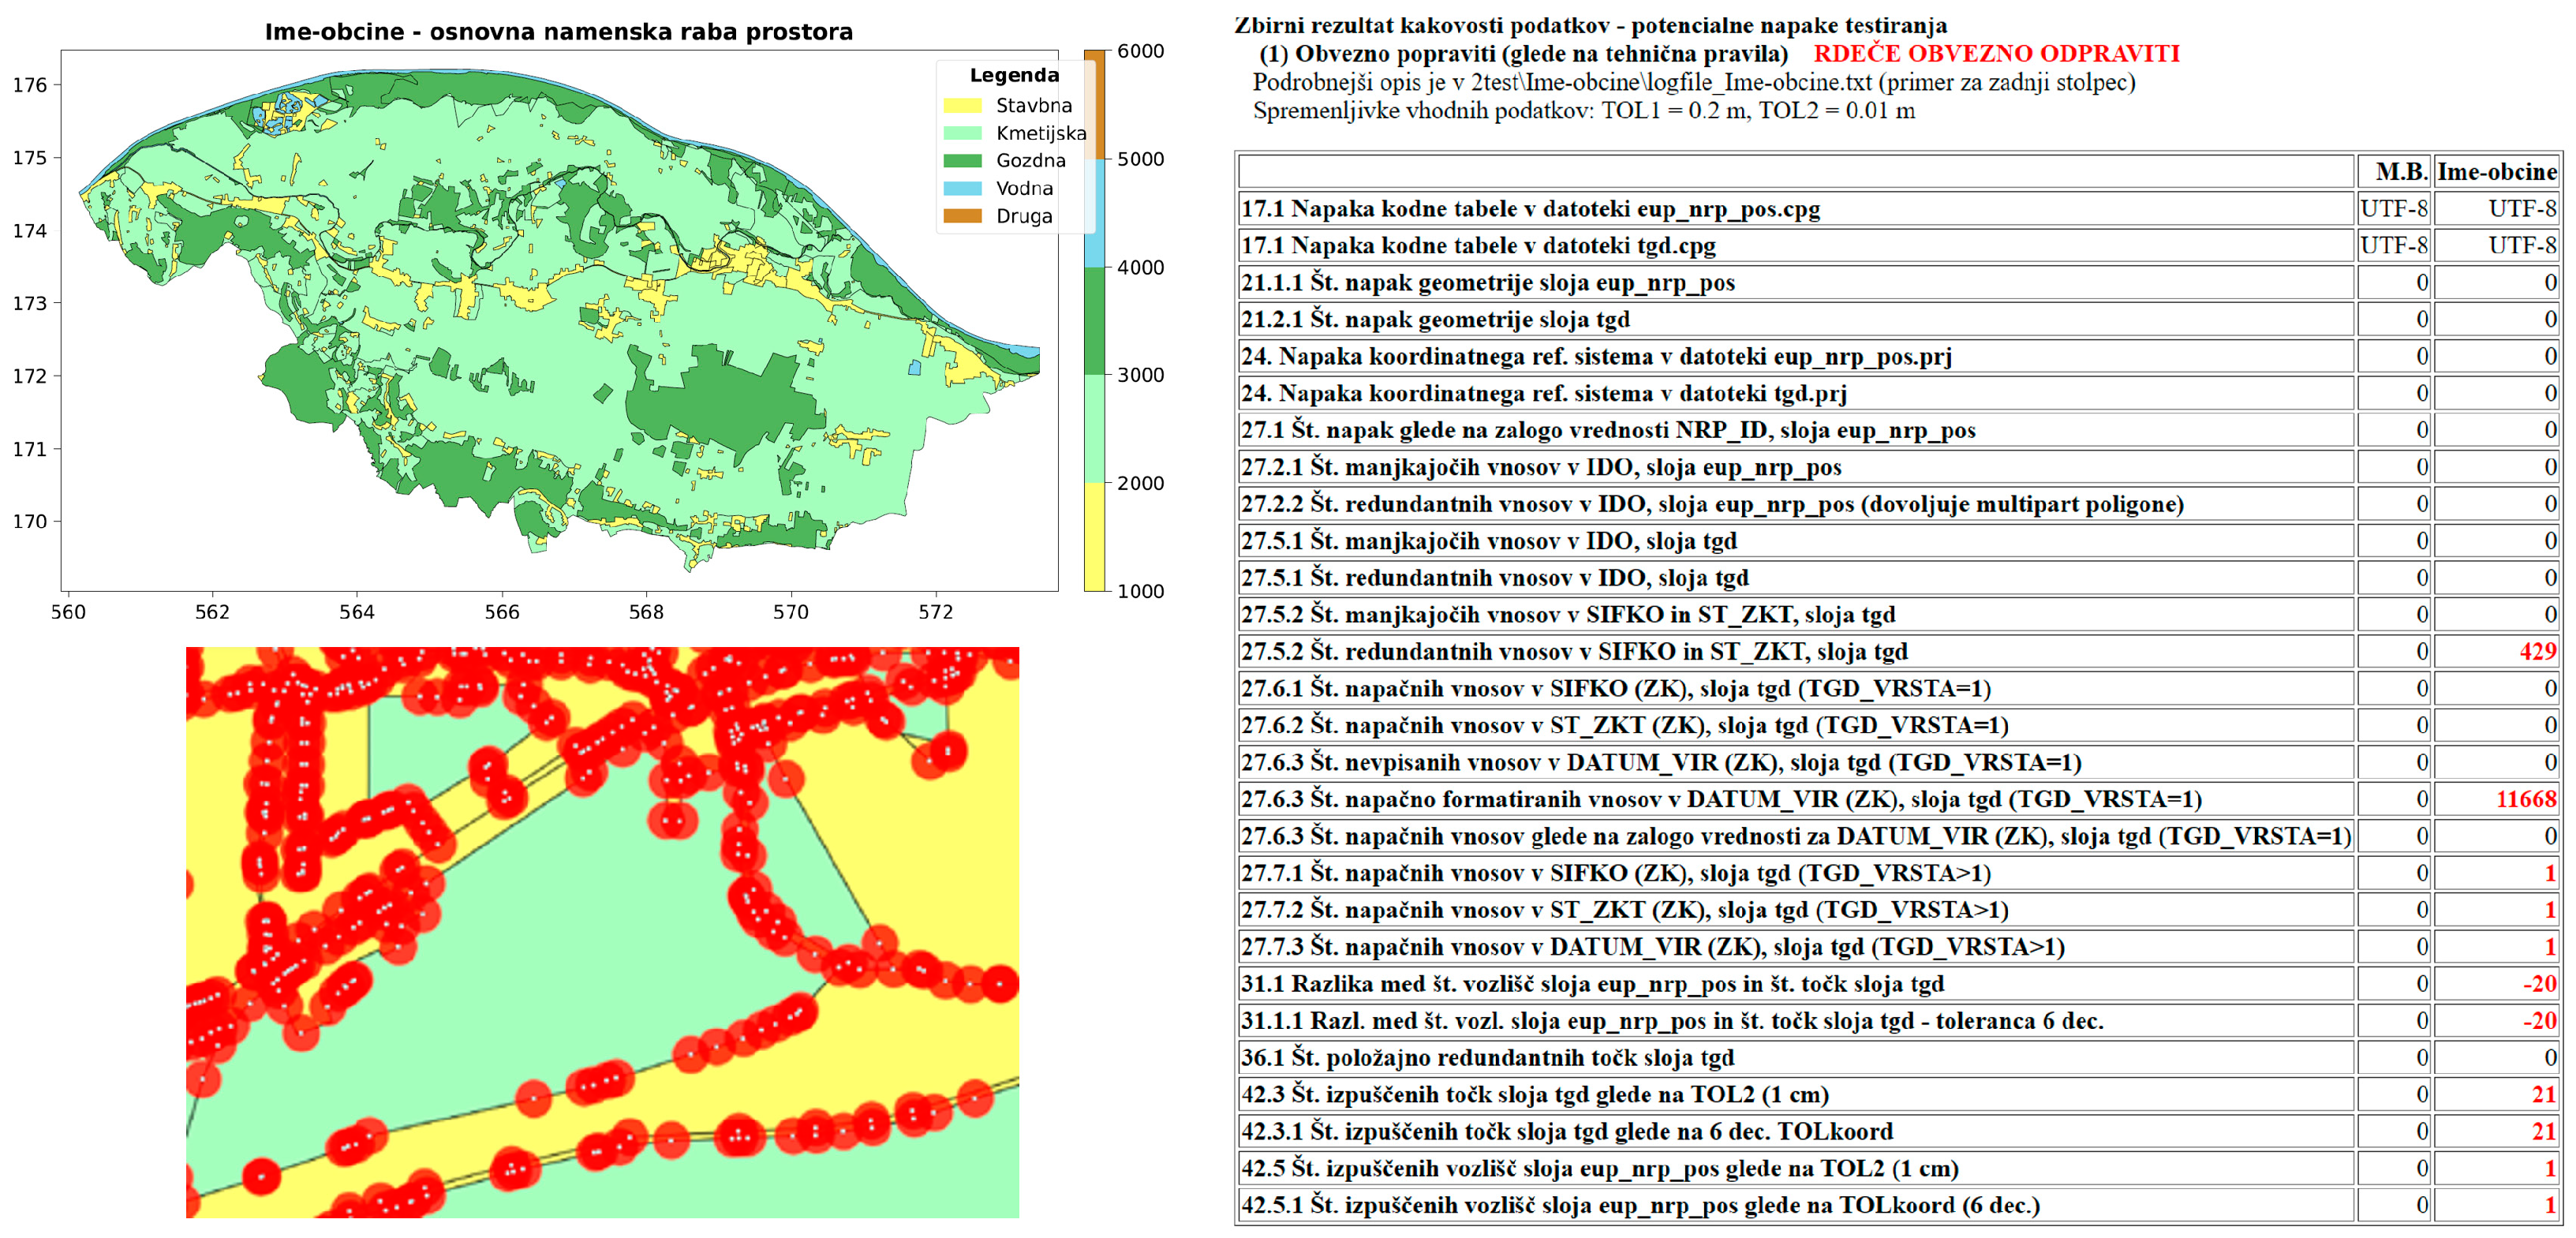
  • Error identification and cleaning utilizes statistical methods and visualization to effectively detect, present, and interpret errors, facilitating efficient data cleaning and quality improvement.
  • Enhanced efficiency and integration optimize workflows for spatial data management, ensuring seamless integration into enterprise geospatial systems.
  • Advancing DQM maturity strengthens data quality management through continuous automation, governance reliability, and iterative improvements in data quality.
  • Scalability and adaptability ensure that technical specifications are continuously refined and that the framework remains flexible and scalable to accommodate evolving data requirements, new datasets, and technological advancements, ensuring long-term sustainability.
The proposed automated DQM framework methods can be implemented in global geographic data quality standards, such as ISO 19157-1, to improve the already exposed framework of data quality concepts.

2.6. Toolkit for Automated DQM Framework Implementation

The practical focus is on the automated program, hereinafter referred to as the toolkit, to implement the developed automated DQM framework. The solution emphasizes the implementation of comprehensive, automated data evaluation procedures, particularly quality assurance (QA), with the following key features designed to effectively address these challenges, improve operational efficiency, and optimize the user experience (UX):
  • Design for consistent use by both the data producers and the data stewards who oversee its governance;
  • A fully automated data evaluation toolkit built on the QA/QC process and extended with additional capabilities;
  • A standalone desktop toolkit, independent of the internet and designed as a cross-platform interaction interface that works independently and is not a plugin or API;
  • The use of the toolkit and results does not require the use of GIS or other geospatial tools;
  • The design of the toolkit operates seamlessly on all major operating systems and is optimized for execution on any modern computer;
  • No toolkit installation and intuitive interfaces to minimize operating instructions;
  • Ensures scalability of the toolkit by enabling it to handle increasing amounts of data, computational tasks, and the integration of new databases without significant performance degradation;
  • Ongoing adaptation of the toolkit based on collective feedback from diverse stakeholders, particularly domain experts and end users, to optimize performance, address potential conflicts, and align with national and international strategies and plans;
  • Minimum number of required configuration parameters for processing;
  • Highly efficient algorithms designed to process data and deliver results within expected timeframes;
  • Compliance of the implemented methods with the requirements of the technical specifications for data production and international standards;
  • Prioritizes end user’s needs, preferences, and workflows to improve usability;
  • The robust toolkit design anticipates and warns of unexpected errors without crashing;
  • Comprehensive understanding of potential inaccuracies through a combination of descriptive statistics, georeferenced data files, and error visualization.

3. Results

The automated DQM framework was designed to meet the objectives of the Ministry of Natural Resources and Spatial Planning of Slovenia, ensuring high-quality, interoperable data to support sustainable development initiatives in alignment with the broader SDGs. The datasets are accessible through the enterprise open data platform (geospatial ecosystem) known as the Spatial Information System [39]. This system plays a critical role in governance and decision-making supported by e-commerce in public administration across multiple fields, including spatial planning and construction. It integrates spatial data with various information sources and documents, enabling users to analyze patterns, relationships, and trends within the context of physical space. The names of the datasets, attributes, configuration files, and related elements used in this section are detailed in Appendix A to facilitate the effective use of the provided automated toolkit.

3.1. Data Used

The main source is authorized structured spatial data of the municipalities on the planned land use (PLU) [40] in Slovenia. The PLU data refer to spatial data representing classifications of land based on its permitted use, management objectives, or restrictions as determined by zoning regulations, planning guidelines, or environmental policies. The PLU data are organized in vector format as polygons representing municipalities in Slovenia with designated land use types, such as buildings, agriculture, forests, water bodies, and other zones. In addition, the data related to the Land Cadaster (LC) points outline five methods for determining the graphical representation of PLU polygons.
Standards based on ISO and OGC ensure compatibility across systems. The CRS used for spatial data is EPSG:3794 (Slovenia 1996), which is used in a wide range of mapping and geospatial applications in the country. The system accepts input data in Esri shapefile and OGC GeoPackage formats.
The universe of discourse is realized through the technical rules and specifications [41], which specifies the structure and attributes for the textual and graphical parts. The PLU data must be interoperable both internally and externally and must be subordinate to the design of the Real Estate Cadaster (REC). In this respect, they are also connected to the dynamics of the LC points reflecting the temporal variation in cadastral geographical positions.
The quality of PLU data is highly dependent on the source and methods used for data acquisition, in our context, cadastral surveys and field mapping. Errors can arise from several factors, including outdated maps or datasets, the skill level and accuracy of operators, digitization processes, misalignments with other spatial datasets, and similar issues. These factors underscore the importance of rigorous quality control measures and continuous updates to ensure data accuracy and reliability. By understanding these characteristics, stakeholders can effectively analyze, manage, and apply PLU data to achieve planning, development, and environmental objectives.

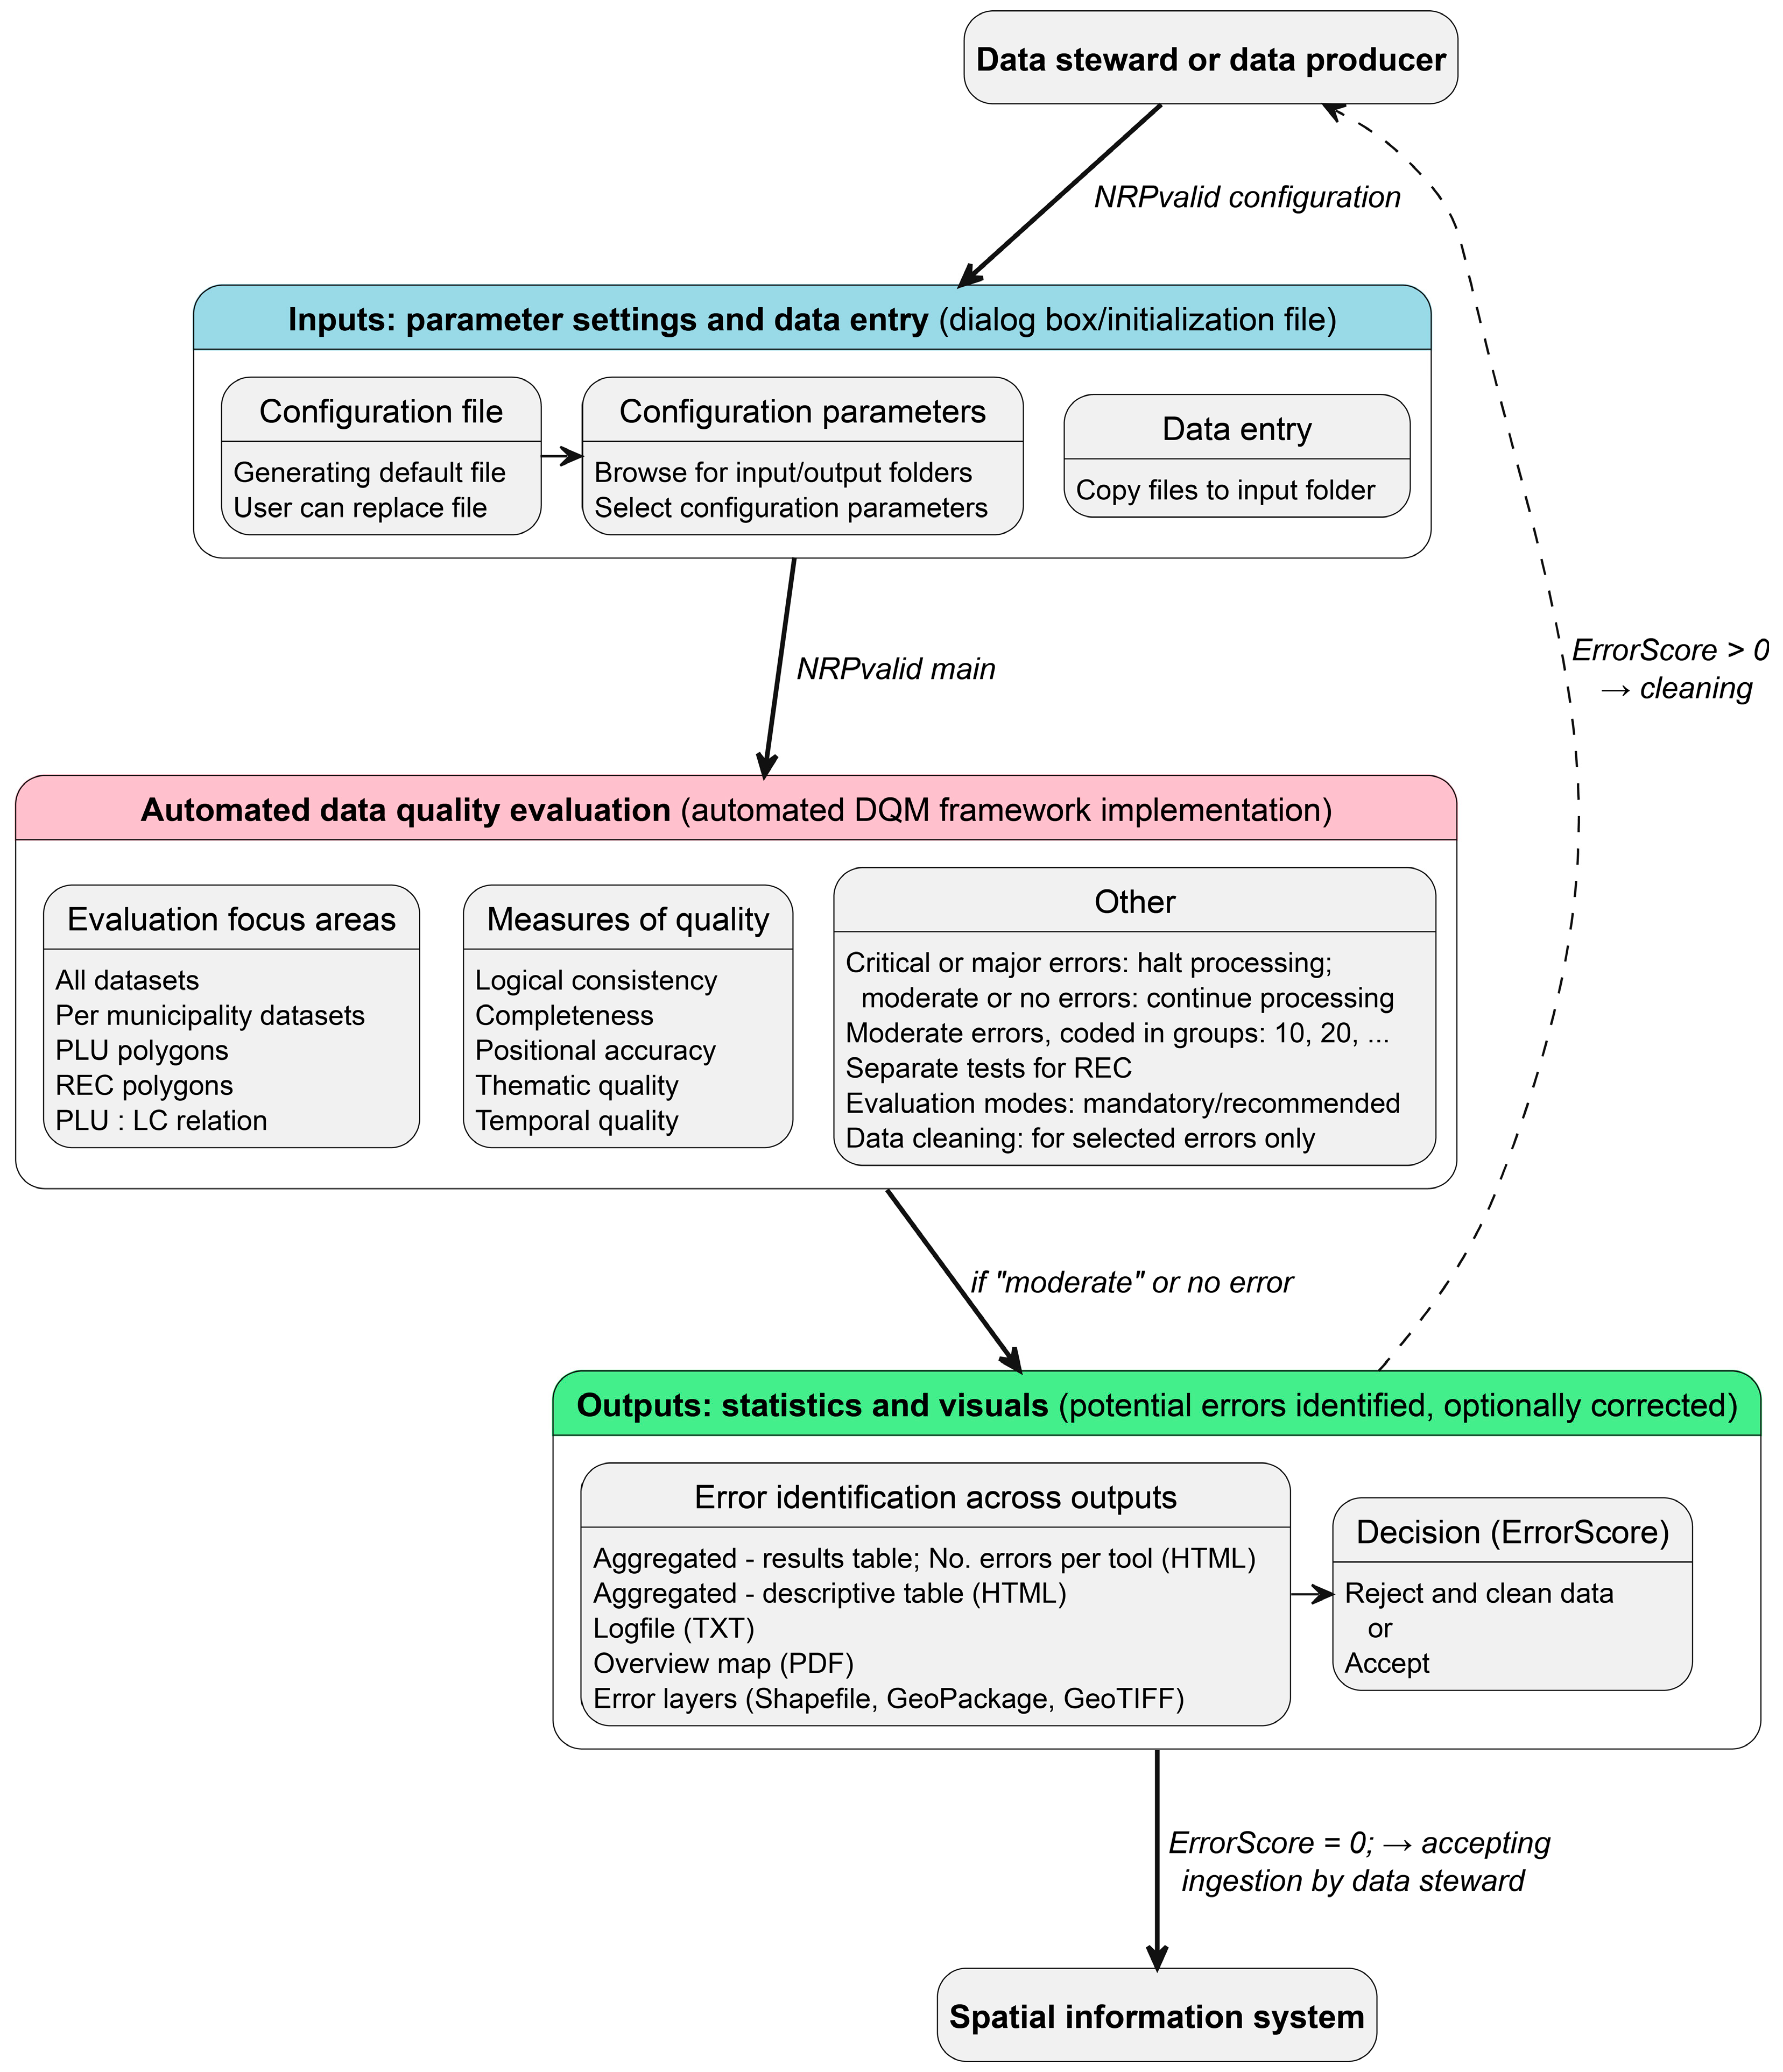
3.2. Functional Design of the Automated DQM Framework

The core of the developed automated DQM framework enhances understanding through improved interaction, bridging the discrepancy between actual and perceived spatial data quality. It operationalizes the universe of discourse through the application of technical rules and specifications.
Suppose a stakeholder (data producer or data steward) initially operates without the automated DQM framework (as illustrated in the first set of two columns in Figure 7). Their understanding of dataset quality and technical specifications is limited, leading to a significant discrepancy between perceived and actual data quality. Error identification relies primarily on manual inspection or GIS tools (green cross-hatching), which may not comprehensively identify all inaccuracies. Furthermore, the stakeholder may acknowledge that completely eliminating errors is unfeasible, leaving a certain level of inaccuracies within the dataset.
Over time, stakeholders can progressively adopt the automated DQM framework, which systematically expands to cover an increasing number of data features within the technical specifications. This framework provides a comprehensive data evaluation toolkit, incorporating both mandatory and recommended data quality assessment features (as illustrated in the second to last set of two columns in Figure 7).
The primary objective of the recommended evaluation component is to inform data stewards and producers about emerging standard evaluation tools that will be sustainably implemented to support the long-term evolution of data quality improvement. In other words, these recommended data quality features are not yet part of existing technical specifications but serve as a catalyst for the iterative refinement of technical specifications and the successive development of future versions of the automated DQM framework.
Figure 7 also illustrates the increasing number of data quality features for automated error identification using the tools of the automated toolkit (blue hachured area) and the ErrorScore (green cross-hatching). The ErrorScore can be applied either to mandatory data quality assessment features or to a combination of both mandatory and recommended features. As a result, the discrepancy between perceived and actual data quality decreases over time, supported by an expanding set of evaluation tools, ultimately leading to improved data quality.

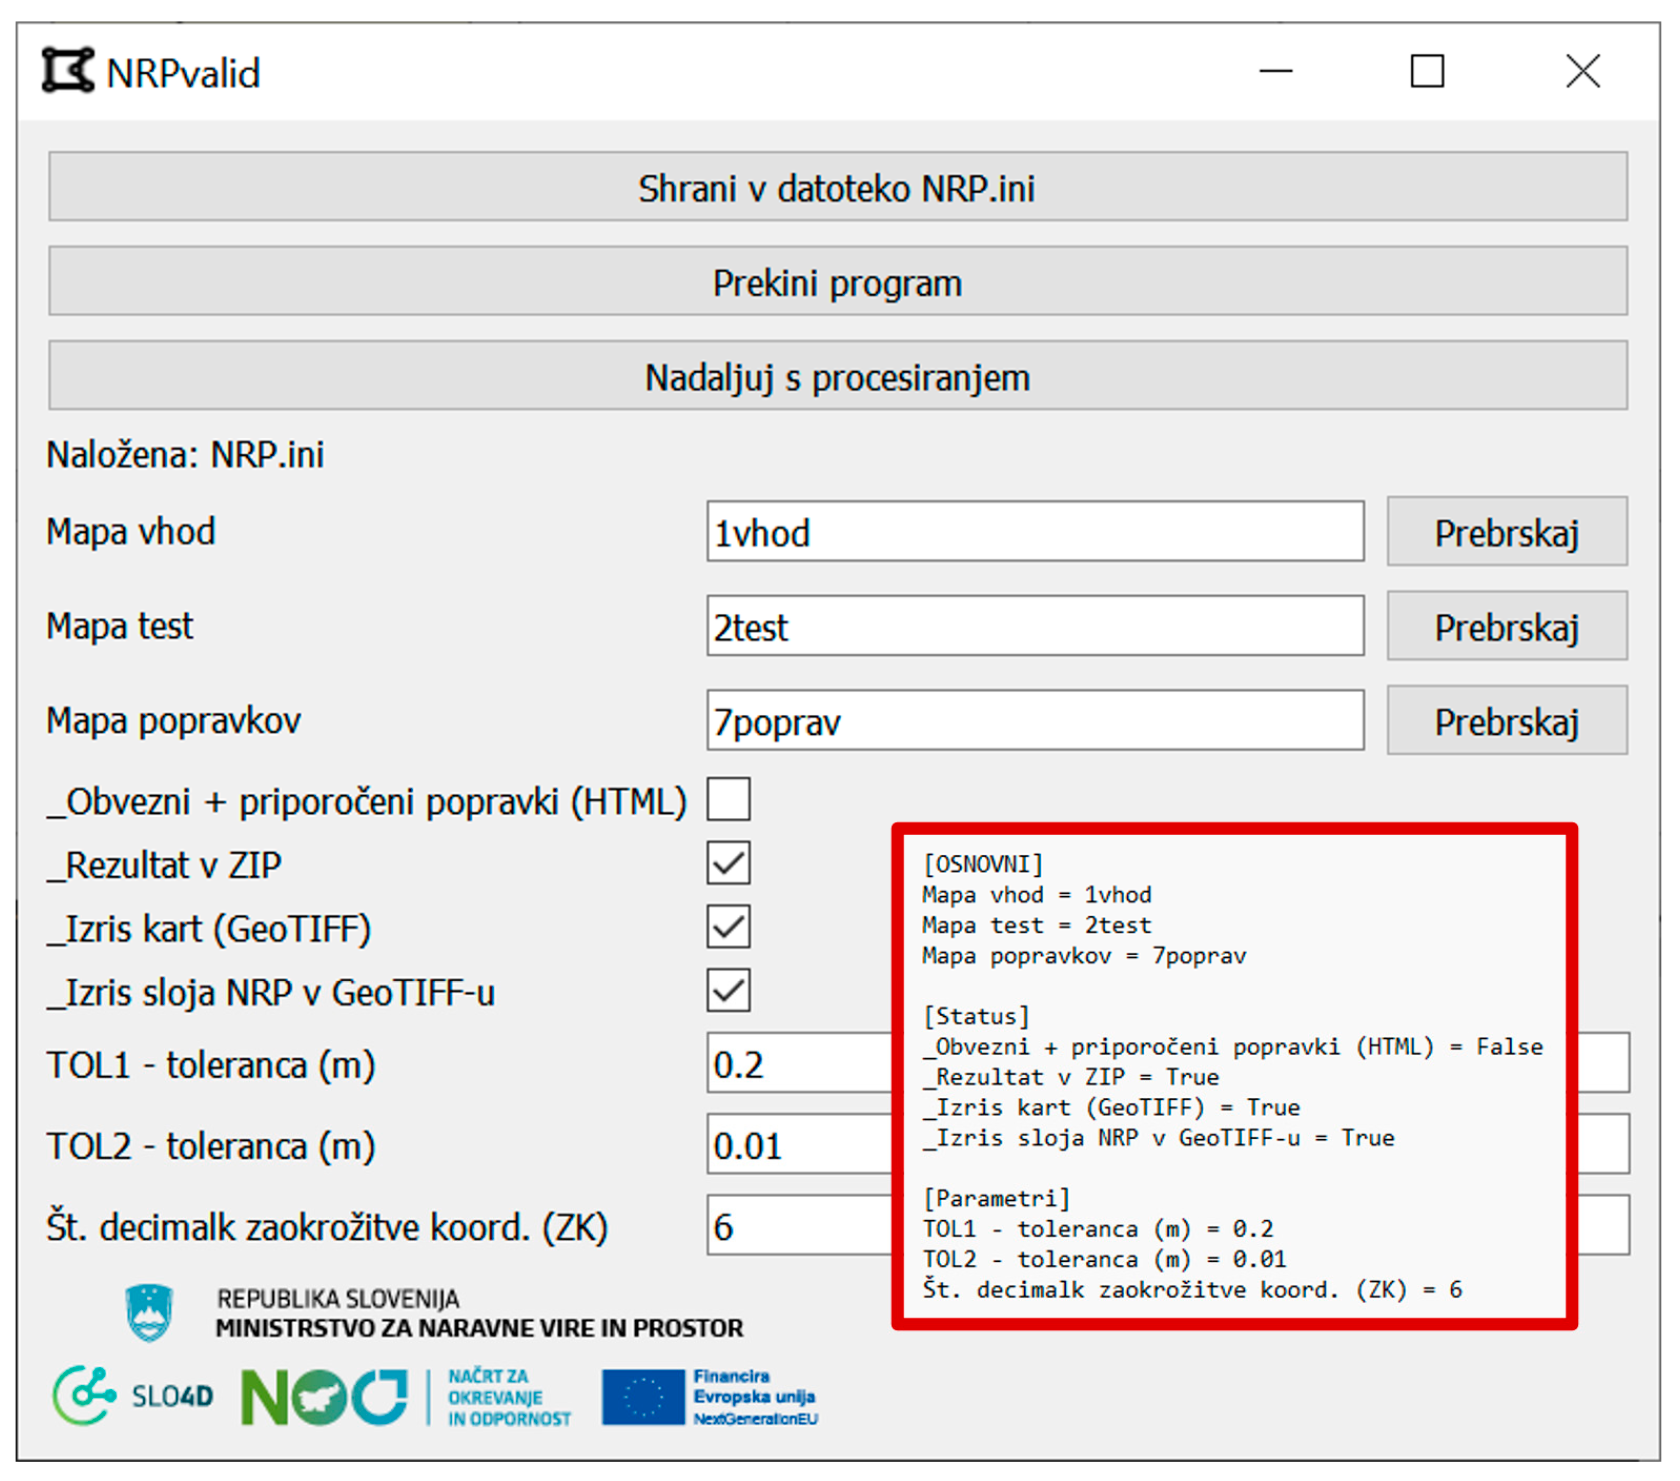
3.3. Deployment of the Automated DQM Framework Within the NRPvalid Toolkit

The NRPvalid toolkit provides an automated QA/QC evaluation system aligned with the automated DQM framework, effectively addressing all the characteristics outlined in the Methods section. Its implementation can significantly reduce the discrepancy between perceived and actual data quality. The toolkit consists of a configuration module for setting input/output folders and parameter thresholds, which are then used to generate a configuration file (Figure 8), and a data processing module that evaluates PLU polygons and LC points based on the configured parameters, ensuring automated quality evaluation.
The second, main module forms the core of the NRPvalid toolkit. It executes data quality evaluation tools, beginning with a basic check of file presence and format validation, and progressively increasing the complexity of quality measures in a structured, step-by-step manner. This approach successively calculates outputs for all tested municipality datasets, ensuring a high degree of transparency and objectivity.
The toolkit differentiates between various error levels and responds accordingly. The highest error level, “critical”, includes issues such as missing input files, which prevent further quality evaluation. In such cases, the toolkit immediately terminates execution and sends a notification specifying the error type. The next level, “major”, involves errors that halt evaluation for the affected municipality while allowing the process to continue for others with no disruption. An example of this is a missing attribute of the attribute table (data field in the table). The third level, “moderate”, includes less severe inconsistencies that do not disrupt overall processing. If an error cannot be explicitly identified but relates to a “major” or “critical” issue, the message “Unidentified error during toolkit execution” is displayed, and the toolkit halts.
The outputs of the evaluation highlight potential “moderate” errors and are presented in multiple forms, including an aggregated results table, a descriptive table, a log file, an overview map, and error layers where various suspicious patterns and inaccuracies are visually marked for easier identification of spatial errors (Figure 9). The cartographic visualization approach serves as an alternative spatial data quality evaluation technique, reinforcing previous introductions and discussions on spatial error detection and identification.
The most important output is the aggregated results table, where each row represents a predefined tool designed to evaluate data quality. These tools are categorized into groups based on similar evaluations or specific focus areas, coded as 10, 20, and so on, as described in Table 1. Since no method is perfect, the data quality measures or elements used in these tools may be interdependent or apply different concepts to identify the same error from multiple perspectives. In total, over 100 tools have been developed and implemented as a rules-based solution, many of which are based on ISO 19157-1 standard quality measures. The tools act as data quality indicators, identifying potential errors and assessing overall dataset quality. While automated data cleaning is beyond this study’s scope, the toolkit provides experimental outputs. As described earlier, evaluation results are divided into mandatory and recommended components, ensuring the toolkit effectively addresses key challenges, including UX optimization.
The ErrorScore is determined by evaluating a set of tools, including the CRS_parameters tool, which validates projection parameters from input vector files against the EPSG:3794 code. In the aggregated results table (Figure 9, right), the left two columns list error descriptions and each tool’s unique code. Key attributes include the expected value (M.B.), typically set to 0 (indicating no errors), and the observed value (Ime-obcine). The number of errors is recorded separately for each tool. If the observed value differs from M.B., it is flagged as incorrect and highlighted in red for visibility. For example, if the CRS_parameters tool identified two errors, the corresponding Ime-obcine value is set to 2 and displayed in red. This value is then converted to 1 using Boolean logic. The ErrorScore is calculated by summing these Boolean values for all tools, as presented in Equation (2). If the ErrorScore is greater than 0, data cleaning is required, followed by re-evaluation with the NRP toolkit to verify corrections. Additionally, the toolkit generates a vector file, in this example, with the corrected CRS parameters, as an experimental output, demonstrating its ability to systematically detect, document, and support the resolution of discrepancies.
The strategy for error identification across outputs involves a combination of results. The primary output consists of various statistics and visuals, enabling the use of a combination of methods to effectively evaluate, assure, and improve data quality. They require experienced stakeholders, such as data stewards and data producers, to conduct semi-automated and manual data cleaning reviews to ensure objectivity. Such experience involves geospatial literacy, which relies on the ability to “read” geospatial visualizations, which is a complex task that is not as straightforward as interpreting text.
One of the effective strategies developed is to perform before-and-after analysis by visually comparing error layers generated by NRPvalid before and after corrections to data layers. This approach clearly demonstrated improvements in data quality, empowering data producers to ensure more accurate and reliable outcomes. Additionally, these analyses highlighted opportunities for further improvements, such as refining data collection methods, optimizing evaluation processes, and developing new quality evaluation tools for the NRPvalid toolkit.
Throughout the development of the NRPvalid toolkit, several highly complex errors were identified in the datasets, leading to the creation of specialized data validation procedures. These procedures integrate results from multiple tools and measures to ensure accurate identification and effective cleaning. Additionally, all these outputs serve as a powerful instrument to enhance understanding and interaction, helping to align actual data quality with perceived quality.
Figure 10 illustrates the NRPvalid toolkit workflow as a flowchart. Stakeholders, including data stewards and data producers, execute the toolkit and analyze the outputs to determine whether the data meet the required quality standards. If the ErrorScore is 0, the dataset is deemed high-quality and can be ingested into the Spatial Information System. If the ErrorScore is greater than 0, the files are rejected and require further cleaning, often performed manually using GIS or other specialized software. The evaluation process is iteratively repeated until the ErrorScore reaches 0 for mandatory assessments or, optionally, for both mandatory and recommended evaluation criteria.
Considering the practical evolution of the automated DQM framework over time, the proposed solution systematically evaluates target datasets and identifies potential errors, ensuring that only error-free data are ingested into the Spatial Information System. Since an ErrorScore of 0 (Equation (2)) guarantees seamless ingestion, the framework effectively streamlines data validation. Moreover, the continuous development and implementation of the NRPvalid toolkit contributes to a step-by-step reduction in the Discrepancy (Equation (1)) between perceived and actual data quality, ultimately enhancing overall data reliability and usability.

4. Discussion

This study diverges from traditional producer–user communication research, focusing instead on detailed interactions within the data quality assurance process. By fostering improved collaboration between key stakeholders, specifically data producers and data stewards, this study achieves a significantly deeper understanding of spatial data. This advancement, supported by positive stakeholder feedback, is both impactful and encouraging.
A key contribution of this research is the development of an automated DQM framework, implemented through a dedicated toolkit. This framework addresses the critical gap between perceived data quality, often based on technical specifications or rules, and actual data quality. While the discrepancy between perceived and actual data quality had been suspected in prior research, this study provides solid evidence to confirm its existence, marking a significant step forward in the field.
This study’s framework is fully aligned with the United Nations Integrated Geospatial Information Framework (UN-IGIF), established under the guidance of the UN Committee of Experts on Global Geospatial Information Management (UN-GGIM). The UN-IGIF promotes structured institutional arrangements and policy frameworks for transparent, accountable geospatial data governance. It emphasizes interoperability, adherence to international spatial data standards, and the need for accurate, consistent, and well-documented geospatial data while fostering effective stakeholder engagement and information sharing. In addition, this study aligns with ITIL 4 knowledge management practices by mitigating risks related to inaccurate or incomplete information in reports and knowledge bases. It also supports service desk and service level management practices by minimizing communication gaps between stakeholders, thereby improving service quality and decision-making.

4.1. Technical Implications

Considering prior research, numerous studies demonstrate that spatial data quality is a far more critical issue than is often acknowledged [1]. For example, the propagation of errors through spatial analysis [13,42] is more complex than the average data user might anticipate. Furthermore, a significant portion of scientific studies fail due to the neglect of inaccurate measurements as a primary source of error in spatial data processing [43], the misuse of AI to generate inappropriate synthetic data [44], or the failure to apply semantic layer principles to translate data into a standardized language within a customer context [45]. These previous findings were carefully considered in the development of this study, which focuses on specific aspects of enhancing geospatial literacy and, consequently, improving interaction, collaboration and partnership, consistency, and data quality.
The concept of perceived vs. actual data quality should not be confused with producer vs. user accuracy. Although producer vs. user accuracy is commonly used in many fields to describe different perspectives on the quality of data generated vs. its products in various applications, it involves different metrics. Unlike perceived vs. actual data quality, which focuses on data representation and interpretation, producer vs. user accuracy evaluates classification reliability. Specifically, the producer’s metrics are comparable to those used in our perceived vs. actual data quality, while the user’s metrics are related to fitness for use, interoperability, or relevance. Moreover, in remote sensing, producer vs. user accuracy is closely linked to omission and commission errors, which reflect the completeness element of data quality. Producer accuracy reflects omission errors by measuring the probability that reference pixels are correctly classified. On the other hand, user accuracy reflects commission errors by measuring the likelihood that classified pixels truly represent the corresponding ground category. Nevertheless, the proposed automated DQM framework focuses primarily on the producers.
As outlined in this study, over 100 tools have been developed as part of a comprehensive toolkit and implemented as rule-based solutions within the automated DQM framework, integrated into the NRPvalid toolkit. The main goal is to follow the evaluation of technical specifications and to further reduce the discrepancy between perceived and actual quality over time. The tools follow a combination of mathematical, empirical, and visual approaches, where many of them were specifically designed for this study. There is significant potential for further automation of quality evaluation, particularly in developing methods to detect and identify complex contextual and semantic errors. These methods would consider the previous state of the data and adhere to legal constraints, such as those prohibiting changes to the PLU. From a technical perspective, future developments of the tools in the NRPvalid toolkit are going to focus on regression and cluster analysis, significance tests or simulations, area and shape analysis, as well as the application of predictive models using selected indicators, ML, AI techniques, and generalization techniques. Additionally, more sophisticated tools for visualization of complex datasets are planned for implementation [19] to enhance the synergy of combining different approaches. The toolkit is also going to incorporate selected human- and machine-readable measures from the upcoming ISO 19157-3 Data Quality Measures Register standard, enabling more comprehensive evaluation and reporting [46]. Additionally, we can contribute our proposed solutions to this publicly accessible register online.
The NRPvalid toolkit is optimized for standard computer configurations and can process average datasets within a reasonable timeframe of one to three minutes. As previously mentioned, future updates will include additional tools and support for other datasets, such as the Building Land Register, along with various other datasets. Most of the already developed quality evaluation tools can be easily applied to different vector datasets, ensuring reusability. While processing times may increase slightly with the addition of new tools and datasets, the impact is not expected to be significant. Furthermore, the developed NRPvalid toolkit follows the automated DQM framework; therefore, the solution is versatile and can be applied to any vector-based layer spatial data.
In the developed case, the target enterprise Spatial Information System ingests data and performs basic data checks using the build-then-test method [47]. However, these and similar enterprise systems lack flexibility and effectiveness compared to the proposed solution, which employs an independent toolkit approach based on the test-then-build method. The implemented solution not only offers enhanced adaptability and accuracy but is also significantly easier to develop and is exempt from safety requirements imposed on enterprise systems.
In a broader context, quality evaluation software within the geospatial ecosystem, such as the target governmental Spatial Information System, should aim to provide simple, predefined analytical functions that leverage its comprehensive datasets. For example, this software could perform spatial intersections between selected parcels and other datasets, including external sources like DEMs. Utilizing well-established data quality properties, the system could incorporate transparent optimization and harmonization processes, such as semantic data generalization, aggregation, or resampling, while also providing key parameters about the quality of the output data. Enhanced with appropriate data quality visualizations, this approach would enable a quality-in, quality-out workflow, ensuring reliable and meaningful results. The already developed NRPvalid toolkit algorithms can be integrated into the Spatial Information System as dynamic, proactive quality evaluation tools, enabling real-time data quality assessments.
When high-quality data are utilized, decision-making becomes more accurate and reliable. Users develop greater confidence in the data, allowing them to concentrate on the analysis rather than questioning their validity. This leads to a smother exchange and integration with other quality datasets, further increasing the value of the data or their ecosystem. Additionally, high-quality data are more easily reusable for diverse purposes. Although ensuring data quality requires a significant initial investment in effort and resources, the long-term benefits often far exceed these costs.
Understanding and incorporating metadata including data lineage, as discussed earlier in this study, is a critical aspect planned for future implementation in the toolkit. This information plays a vital role in dataset governance, providing essential insights that support informed decision-making and enhance the overall reliability of the data.

4.2. Societal and Governance Implications

Trust in data is hard to earn but easy to lose. Continuous improvement concerns greater emphasis on quality assurance (QA) over quality control (QC) and prioritizing automated tools and services over extensive human resources. This philosophy is already integrated into the proposed toolkit. The inclusive framework describes enhanced interaction among stakeholders and fosters significantly higher confidence in decision-making processes.
The standalone desktop toolkit significantly improves interaction among stakeholders, addressing a common issue where data producers faced repeated rejections from data stewards and the Spatial Information System, creating unnecessary burdens. Now, with improved data quality, a single interaction is typically sufficient, leading to exceptional cost–benefit outcomes. The toolkit empowers data stewards to establish best practices for data evaluation and management, fostering a stronger organizational culture and encouraging greater responsiveness from local government data producers.
The results demonstrate that bridging the discrepancy between perceived and actual data quality is a challenging task. As shown in this study, this discrepancy cannot be precisely measured. However, it can be estimated by employing the automated DQM framework, particularly using the NRPvalid toolkit. This approach enables a better understanding of technical specifications, calculation of the ErrorScore, and improved interaction. These steps lead us to estimate that the discrepancy at this stage is already below 10%. While there is still room for improving the tools in the NRPvalid toolkit, our rule-of-thumb feasibility assessment suggests that further enhancements could reduce the ErrorScore to 5%. This includes time-sensitive analysis using historical data and analyses that account for simultaneous changes in both geometry and attributes of the datasets.
Although the proposed NRPvalid toolkit within the automated DQM framework is not specifically designed for end users, it remains accessible to all stakeholders. In fact, any user can contribute to the improvement of technical specifications and data quality. This is going to be further enhanced by expanding the current standalone solution into a web-based data quality dashboard, enabling collaborative feedback and continuous improvement. Through this approach, potential data quality disputes can be efficiently resolved without the need for additional mechanisms. Therefore, NRPvalid serves only as a set of tools to support the existing process, without any ambition to change the overall management framework [48].
The proposed automated DQM framework, particularly its role in bridging the gap through minimizing the discrepancy between perceived and actual data quality, offers significant societal benefits, especially in domains where data-driven decision-making is essential. By enhancing confidence in government policies, such as those addressing climate change, and, in our case, urban and land use planning, the framework contributes to more informed and effective governance. Furthermore, high-quality, well-documented spatial data support advanced spatial analysis in scientific research and the development of robust organizational strategies. Additionally, the framework’s transparent methodologies, combined with a web-based spatial ecosystem, promote inclusivity, enhance stakeholder engagement, and foster economic justice by ensuring equitable access to reliable data.
A significant direct impact of the proposed framework is the enhanced interaction between data stewards and data producers, which is the focus of this study. More specifically, data producers include municipalities acting as legal preparers and private entities serving as legal drafters. Both gained valuable insights from the automated DQM framework. Additional beneficiaries include managers of the enterprise Spatial Information System and key governmental stakeholders involved in spatial planning. However, the primary impact is on end users and their interaction with administrative units’ staff. Improved PLU data quality has already had a tangible impact on decision-making, particularly in the issuance of building permits, which now rely on high-quality information about buildable land. Administrative units can now rely on higher-quality PLU data, reducing inefficient and time-consuming interactions between municipalities, administrative units, and investors. This, in turn, facilitates more effective adoption of sustainable land management practices.
The solution accelerates the adoption of a participatory governance model, enabling data producers to actively contribute to data quality improvements. This collaborative approach ensures that evaluation procedures align with stakeholder needs, particularly those of end users, while promoting transparency, accountability, and overall quality management. Enhanced interactions further improve geospatial literacy, support the continuous refinement of technical specifications, and strengthen the effectiveness of the automated DQM framework. These advancements have been validated through positive structured feedback from diverse stakeholders.

5. Conclusions

The developed approach extends beyond traditional producer–user interaction studies by analyzing more nuanced interactions within the data quality assurance process across multiple stakeholders. The proposed automated data quality management (DQM) framework bridges the gap between perceived and actual data quality, both fundamental components of the framework. It accomplishes this by addressing key aspects, including a comprehensive definition of data quality, improved data management through enhanced interaction between data producers and data stewards, and technical considerations of spatial data quality, from a geospatial perspective.
The DQM framework has been implemented through the NRPvalid toolkit, an independent standalone program featuring over 100 data quality evaluation tools, many based on the ISO 19157-1 standard. Once evaluated and cleaned, the data are seamlessly ingested into the geospatial ecosystem, specifically within the enterprise Spatial Information System. This study uses planned land use (PLU) data, which play a crucial role in governance, particularly in the issuance of building permits. The automated solution not only ensures sustainable improvements in data quality but also enhances accessibility and usability for a broader range of stakeholders.
Before implementing the proposed framework, the discrepancy between perceived and actual data quality was significant. Following implementation, this discrepancy was substantially reduced, as measured by using a quantitative error metric (ErrorScore). Additionally, data quality, stakeholder interactions, comprehension of data, and evaluation efficiency have all improved. The framework also facilitates continuous enhancements in technical specifications through iterative updates.
The NRPvalid toolkit has been widely accepted by stakeholders and has actively engaged them in the data quality improvement process. While one of the most notable impacts of the framework is the strengthened interaction between data stewards and data producers, the primary benefit is observed at the end user level, particularly in administrative units responsible for land governance. The improved quality of PLU data has already led to more informed decision-making, especially in building permit issuance, which now relies on high-quality buildable land information. This has, in turn, reduced inefficiencies and streamlined interactions between administrative units, municipalities, and investors, ultimately supporting the adoption of sustainable land management practices.
Looking ahead, the future of holistic, automated geospatial data quality evaluation lies in integrating diverse methodologies, combining traditional approaches with innovative techniques. While maintaining the NRPvalid toolkit as a standalone solution, its capabilities will continue to evolve, addressing specific challenges and enabling continuous learning from diverse data perspectives. Future enhancements will include time-sensitive analysis using historical data and an interactive dashboard that allows stakeholders to explore data quality metrics, filter error types, and visualize changes over time. These advancements are designed to provide more accurate, reliable, and timely spatial data and geospatial information that effectively meets the needs of a broad and diverse user base.

Funding

This research was funded by the Green Slovenian Location Framework (GreenSLO4D, No. 2550-22-0013) for 2021–2026, under the Recovery and Resilience Plan (development area: Digital Transformation), founded by the European Union through NextGenerationEU.

Data Availability Statement

A data package is freely available at https://zenodo.org/records/14677904, assessed on 17 January 2025, and includes the NRPvalid toolkit (version 1.0.13, 64-bit Windows), based on the automated data quality management (DQM) framework and licensed under CC-BY-NC-ND 4.0. The package also includes a user manual (in Slovenian) and test data.

Acknowledgments

The author would like to express his sincere gratitude to Jurij Mlinar and his team for their invaluable support, as well as to all contributing stakeholders for their essential contributions and feedback throughout the development of this work.

Conflicts of Interest

The author declares no conflicts of interest.

Abbreviations

The following abbreviations are used in this manuscript:
AIArtificial intelligence
APIApplication programming interface
BIMBuilding information modeling
CRSCoordinate reference system
DEMDigital elevation model
DQMData quality management
EPSGGeodetic parameter registry with codes
GISGeographic information system
ISOInternational Organization for Standardization
LCLand Cadaster
MLMachine learning
OGCOpen Geospatial Consortium
PCAPrincipal component analysis
PLUPlanned land use
QA/QCQuality assurance/quality control
RECReal Estate Cadaster
SDGsSustainable Development Goals
SDISpatial data infrastructure
TDQMTotal data quality management
t-SNEt-distributed stochastic neighbor embedding
UMLUnified modeling language
UN-GGIMUnited Nations Committee of Experts on Global Geospatial Information Management
UN-IGIFUnited Nations Integrated Geospatial Information Framework
UTF-8Unicode transformation format (8-bit)
UXUser experience

Appendix A

The simplified expressions of datasets, attributes, configuration files, and other elements used in the automated DQM framework, developed in the programming language Python 3.12, correspond to the descriptions in the NRPvalid toolkit, as shown in the Results section (Table A1).
Table A1. Simplifications used in this article and corresponding codes used in the toolkit.
Simplified ExpressionDescription
Planned land use (PLU) polygonseup_nrp_pos data
Land Cadaster (LC) pointstgd data with attributes TGD_VRSTA = 1
Real Estate Cadaster (REC) pointstgd data with attribute NRP_ID = 3000 to 3999
Planned land use (PLU) attributeeup_nrp_pos data with attributes NRP_ID (land use types of group codes: 1000, 2000, 3000, 4000, 5000)
Land Cadaster (LC) attributetgd data with attributes TGD_VRSTA = 1
configuration file*.INI file (NRP.ini, NRP_sablona.ini and others)
NRPvalid configurationNRPvalid_start.exe file
NRPvalid coreNRPvalid.exe file

References

  1. Nagle, T.; Redman, T.C.; Sammon, D. Only 3% of Companies’ Data Meets Basic Quality Standards. Harv. Bus. Rev. 2017, 98, 2–5. Available online: https://hbr.org/2017/09/only-3-of-companies-data-meets-basic-quality-standards (accessed on 8 December 2024).
  2. Deming, W.E. Elementary Principles of the Statistical Control of Quality: A Series of Lectures; Nippon Kagaku Gijutsu Remmei: Tokyo, Japan, 1950; p. 103. [Google Scholar]
  3. Fujimaki, R. Most Data Science Projects Fail, But Yours Doesn’t Have To. BigDATAwire. 2020. Available online: https://www.bigdatawire.com/2020/10/01/most-data-science-projects-fail-but-yours-doesnt-have-to/ (accessed on 7 December 2024).
  4. Goodchild, M.F.; Li, L. Assuring the Quality of Volunteered Geographic Information. Spat. Stat. 2012, 1, 110–120. [Google Scholar] [CrossRef]
  5. MXavier, E.M.A.; Ariza-López, F.J.; Ureña-Cámara, M.A. Automatic Evaluation of Geospatial Data Quality Using Web Services. Rev. Cartográfica 2019, 98, 59–73. [Google Scholar] [CrossRef]
  6. ISO 19157-1:2023(En); Geographic Information—Data Quality—Part 1: General Requirements. ISO: Geneva, Switzerland, 2023.
  7. Parslow, P.; Jamieson, A. 30 Years of Geospatial Standards. GIM Int. 2024, 3, 28–30. [Google Scholar]
  8. OGC (Open Geospatial Consortium). Available online: https://www.ogc.org/ (accessed on 7 December 2024).
  9. GIS Data Quality Management & Validation|ArcGIS Data Reviewer. Available online: https://www.esri.com/en-us/arcgis/products/arcgis-data-reviewer/overview (accessed on 15 December 2024).
  10. Follin, J.-M.; Girres, J.-F.; Olteanu Raimond, A.-M.; Sheeren, D. The Origins of Imperfection in Geographic Data; Wiley: Hoboken, NJ, USA, 2019; pp. 25–44. ISBN 978-1-78630-297-7. [Google Scholar]
  11. Nassif, A.B.; Talib, M.A.; Nasir, Q.; Dakalbab, F.M. Machine Learning for Anomaly Detection: A Systematic Review. IEEE Access 2021, 9, 78658–78700. [Google Scholar] [CrossRef]
  12. Chen, D. Reviewing Methods for Controlling Spatial Data Quality from Multiple Perspectives. Geosci. Remote Sens. 2022, 5, 22–27. [Google Scholar] [CrossRef]
  13. Heuvelink, G.B.M. Error Propagation in Environmental Modelling With GIS, 1st ed.; CRC Press: Boca Raton, FL, USA, 1998; p. 146. [Google Scholar]
  14. Podobnikar, T. Simulation and Representation of the Positional Errors of Boundary and Interior Regions in Maps. In Geospatial Vision: New Dimensions in Cartography; Moore, A., Drecki, I., Eds.; Springer: Berlin/Heidelberg, Germany, 2008; pp. 141–169. ISBN 978-3-540-70970-1. [Google Scholar]
  15. Devillers, R.; Bédard, Y.; Jeansoulin, R. Multidimensional Management of Geospatial Data Quality Information for Its Dynamic Use Within GIS. Photogramm. Eng. Remote Sens. 2005, 71, 205–215. [Google Scholar] [CrossRef]
  16. Kersting, K.; De Raedt, L. Basic Principles of Learning Bayesian Logic Programs. In Probabilistic Inductive Logic Programming: Theory and Applications; De Raedt, L., Frasconi, P., Kersting, K., Muggleton, S., Eds.; Lecture Notes in Computer Science; Springer: Berlin/Heidelberg, Germany, 2008; pp. 189–221. ISBN 978-3-540-78652-8. [Google Scholar]
  17. Fotheringham, S.A.; Rogerson, P.A. The SAGE Handbook of Spatial Analysis, 1st ed.; SAGE Publications, Ltd.: London, UK, 2009; ISBN 978-0-85702-013-0. [Google Scholar]
  18. Yılmaz, C.; Cömert, Ç.; Yıldırım, D. Ontology-Based Spatial Data Quality Assessment Framework. Appl. Sci. 2024, 14, 10045. [Google Scholar] [CrossRef]
  19. Podobnikar, T. Methods for Visual Quality Assessment of a Digital Terrain Model. SAPIENS Surv. Perspect. Integrating Environ. Soc. 2009, 2, 10. [Google Scholar]
  20. Grieves, M.; Vickers, J. Digital Twin: Mitigating Unpredictable, Undesirable Emergent Behavior in Complex Systems. In Transdisciplinary Perspectives on Complex Systems: New Findings and Approaches; Kahlen, F.-J., Flumerfelt, S., Alves, A., Eds.; Springer International Publishing: Cham, Switzerland, 2017; pp. 85–113. ISBN 978-3-319-38756-7. [Google Scholar]
  21. Yanenko, O.; Schlieder, C. Game Principles for Enhancing the Quality of User-Generated Data Collections. In Proceedings of the 17th AGILE Conference on Geographic Information Science, Castellón, Spain, 3–6 June 2014. [Google Scholar]
  22. Sui, D.; Elwood, S.; Goodchild, M. (Eds.) Crowdsourcing Geographic Knowledge: Volunteered Geographic Information (VGI) in Theory and Practice; Springer: Dordrecht, The Netherlands, 2013; ISBN 978-94-007-4586-5. [Google Scholar]
  23. Mooney, P.; Corcoran, P. The Annotation Process in OpenStreetMap. Trans. GIS 2012, 16, 561–579. [Google Scholar] [CrossRef]
  24. Ataman, A. Data Quality in AI: Challenges, Importance & Best Practices. Available online: https://research.aimultiple.com/data-quality-ai/ (accessed on 8 December 2024).
  25. Chafiq, T.; Azmi, R.; Fadil, A.; Mohammed, O. Investigating the Potential of Blockchain Technology for Geospatial Data Sharing: Opportunities, Challenges, and Solutions. Geomatica 2024, 76, 100026. [Google Scholar] [CrossRef]
  26. Podobnikar, T. Production of Integrated Digital Terrain Model from Multiple Datasets of Different Quality. Int. J. Geogr. Inf. Sci. 2005, 19, 69–89. [Google Scholar] [CrossRef]
  27. Vaddi, R.; Phaneendra Kumar, B.L.N.; Manoharan, P.; Agilandeeswari, L.; Sangeetha, V. Strategies for Dimensionality Reduction in Hyperspectral Remote Sensing: A Comprehensive Overview. Egypt. J. Remote Sens. Space Sci. 2024, 27, 82–92. [Google Scholar] [CrossRef]
  28. Shivaprasad, N. Enhancing Data Quality through Automated Data Profiling. Int. J. Res. Publ. Semin. 2024, 15, 108–117. [Google Scholar] [CrossRef]
  29. Thumburu, S.K.R. Real-Time Data Quality Monitoring and Remediation in EDI. Adv. Comput. Sci. 2021, 4, 21. [Google Scholar]
  30. Ariza López, F.J.; Barreira González, P.; Masó Pau, J.; Zabala Torres, A.; Rodríguez Pascual, A.F.; Moreno Vergara, G.; García Balboa, J.L. Geospatial Data Quality (ISO 19157-1): Evolve or Perish. Rev. Cartográfica 2020, 100, 129–154. [Google Scholar] [CrossRef]
  31. Kruger, J.; Dunning, D. Unskilled and Unaware of It: How Difficulties in Recognizing One’s Own Incompetence Lead to Inflated Self-Assessments. J. Pers. Soc. Psychol. 1999, 77, 1121–1134. [Google Scholar] [CrossRef] [PubMed]
  32. Devillers, R.; Stein, A.; Bédard, Y.; Chrisman, N.; Fisher, P.; Shi, W. Thirty Years of Research on Spatial Data Quality: Achievements, Failures, and Opportunities. Trans. GIS 2010, 14, 387–400. [Google Scholar] [CrossRef]
  33. Hayes, G.E.; Romig, H.G. Modern Quality Control; Macmillan Pub Co.: Sydney, Australia, 1977; p. 874. ISBN 978-0-02-802910-8. [Google Scholar]
  34. ISO 9000; Family—Quality Management. ISO: Geneva, Switzerland, 2021.
  35. Egenhofer, M.J.; Mark, D.M. Naive Geography. In Spatial Information Theory: A Theoretical Basis for GIS; Frank, A.U., Kuhn, W., Eds.; Springer: Berlin/Heidelberg, Germany, 1995; pp. 1–15. [Google Scholar]
  36. Ehrlinger, L.; Wöß, W. A Survey of Data Quality Measurement and Monitoring Tools. Front. Big Data 2022, 5, 850611. [Google Scholar] [CrossRef] [PubMed]
  37. Sakpal, M. 12 Actions to Improve Your Data Quality. Available online: https://www.gartner.com/smarterwithgartner/how-to-improve-your-data-quality (accessed on 16 December 2024).
  38. Nolasco, H.R.; Vargo, A.; Komatsu, Y.; Iwata, M.; Kise, K. Perception Versus Reality: How User Self-Reflections Compare to Actual Data. In Proceedings of the Human-Computer Interaction—INTERACT 2023, York, UK, 28 August–1 September 2023; pp. 665–674. [Google Scholar]
  39. Spatial Information System. Available online: https://pis.eprostor.gov.si/en/pis/predstavitev-sistema.html?changeLang=true (accessed on 20 September 2024).
  40. INSPIRE Maintenance and Implementation Group (MIG). INSPIRE Data Specification on Land Use—Technical Guidelines; INSPIRE: Brussels, Belgium, 2024. [Google Scholar]
  41. Ministry of Natural Resources and Spatial Planning. Technical Rules for the Preparation of Municipal Spatial Acts in Digital Form (Tehnična Pravila za Pripravo Občinskih Prostorskih Izvedbenih Aktov v Digitalni Obliki); Ministry of Natural Resources and Spatial Planning: Ljubljana, Slovenia, 2024.
  42. Selmy, S.A.H.; Kucher, D.E.; Yang, Y.; García-Navarro, F.J.; Selmy, S.A.H.; Kucher, D.E.; Yang, Y.; García-Navarro, F.J. Geospatial Data: Acquisition, Applications, and Challenges; IntechOpen: London, UK, 2024; ISBN 978-1-83769-828-8. [Google Scholar]
  43. Haining, R. (Ed.) Data Quality: Implications for Spatial Data Analysis. In Spatial Data Analysis: Theory and Practice; Cambridge University Press: Cambridge, UK, 2003; pp. 116–178. ISBN 978-0-521-77437-6. [Google Scholar]
  44. Romano, A. Synthetic Geospatial Data and Fake Geography: A Case Study on the Implications of AI-Derived Data in a Data-Intensive Society. Digit. Geogr. Soc. 2025, 8, 100108. [Google Scholar] [CrossRef]
  45. Southekal, P. Data for Business Performance: The Goal-Question-Metric (GQM) Model to Transform Business Data into an Enterprise Asset, 1st ed.; Technics Publications: Basking Ridge, NJ, USA, 2017; p. 316. ISBN 978-1-63462-184-7. [Google Scholar]
  46. ISO 19157-3; Geographic Information—Data Quality—Part 3: Data Quality Measures Register. ISO: Geneva, Switzerland, 2025.
  47. Parry-Jones, C. Data Quality Doesn’t Need to Be Complicated: Three Zero-Cost Solutions That Take Hours, Not Months. Data Sci. 2024. Available online: https://towardsdatascience.com/stop-overcomplicating-data-quality-4569fc6d35a4 (accessed on 16 December 2024).
  48. Taylor, F.W. The Principles of Scientific Management; Harper: New York, NY, USA, 1913; p. 156. [Google Scholar]
Figure 1. An example of unexpected inconsistencies occurs from an expert operator digitizing land use data twice, approximately a week apart. The data sources include the Josephine 1st Military Topographic Survey from the 18th century at a scale of 1:28,800 (above) and a topographic map from the early 20th century at a scale of 1:25,000 (below). The results reveal significant differences in the identification of object boundaries and the assignment of their attributes, highlighting the bias and subjectivity inherent in interpreting data (red arrows). This can be verified through inspection or statistical process control [2]; however, it is crucial to approach the data with a certain skepticism before making any decisions.
Geosciences 15 00117 g001
Figure 2. Interrelated concepts for addressing the identified knowledge gaps.
Geosciences 15 00117 g002
Figure 3. From the real world, through the universe of discourse and dataset, to the users, with a focus on spatial data quality definition.
Geosciences 15 00117 g003
Figure 4. (Left): Perceived data quality (light blue) and actual data quality (light red) are depicted. (Right): Illustration of automated error detection and identification using ErrorScore alongside alternative methods.
Geosciences 15 00117 g004
Figure 5. Changes in perceived (light blue) and actual (light red) spatial data quality, along with discrepancy, over time.
Geosciences 15 00117 g005
Figure 6. From the real world, through the universe of discourse and dataset, to the users, with a focus on the developed automated DQM framework.
Geosciences 15 00117 g006
Figure 7. Functional design of the automated DQM framework (aDQMf) in relation to the perceived (light blue) and actual (light red) spatial data quality over time.
Geosciences 15 00117 g007
Figure 8. NRPvalid toolkit configuration module dialog box for setting input parameters (in Slovenian) along with the corresponding generated configuration file (highlighted in red).
Geosciences 15 00117 g008
Figure 9. Selected outputs of the NRPvalid toolkit. Top left: Overview map (PDF format) of the PLU data with classifications for buildings (yellow), agricultural areas (light green), forests (green), and water bodies (blue). Bottom left: Identified errors highlighted with red circles on the error layer map (GeoTIFF format). Right: Aggregated results table (HTML format, in Slovenian) displaying detected and identified errors in red.
Geosciences 15 00117 g009
Figure 10. Flowchart illustrating the holistic data quality evaluation workflow of the NRPvalid toolkit, based on the automated DQM framework.
Geosciences 15 00117 g010
Table 1. The quality evaluation toolkit, organized into coded groups and associated tools, each targeting a specific focus area of data quality evaluation.
Coded GroupMeasure/ElementToolFocus Area
10completenessfile presenceall datasets
.logical consistencyformat, readabilityconfiguration file, all datasets
.logical consistencyUTF-8, Windows-1250per municipality datasets
20logical consistencygeometry, topologyper municipality datasets
.logical consistencydata schema/attribute typeper municipality datasets
.logical/thematicattribute domainper municipality (attributes)
.completn./temporalmissing/duplicate/invalid val.per municipality datasets
.logical consistencyCRS parametersper municipality datasets
30completenesscountingPLU and LC datasets
.positional accuracycountingPLU and LC datasets
.completenessduplicates, matchingPLU and LC datasets
40completenessdifferent No. pointsrelation PLU: LC
.positional accuracymatching with diff. tolerancesrelation PLU: LC
100logical consistencyverification coord. roundingper PLU attribute
.completenessdescriptive statisticsper PLU attribute
.completenessdescriptive statisticsall/LC attribute
900(data cleaning)UTF-8, CRS, data schemaper municipality datasets
Disclaimer/Publisher’s Note: The statements, opinions and data contained in all publications are solely those of the individual author(s) and contributor(s) and not of MDPI and/or the editor(s). MDPI and/or the editor(s) disclaim responsibility for any injury to people or property resulting from any ideas, methods, instructions or products referred to in the content.

