
Geochemical and Isotopic Features of Geothermal Fluids Around the Sea of Marmara, NW Turkey

 , and
, and
Abstract
1. Introduction
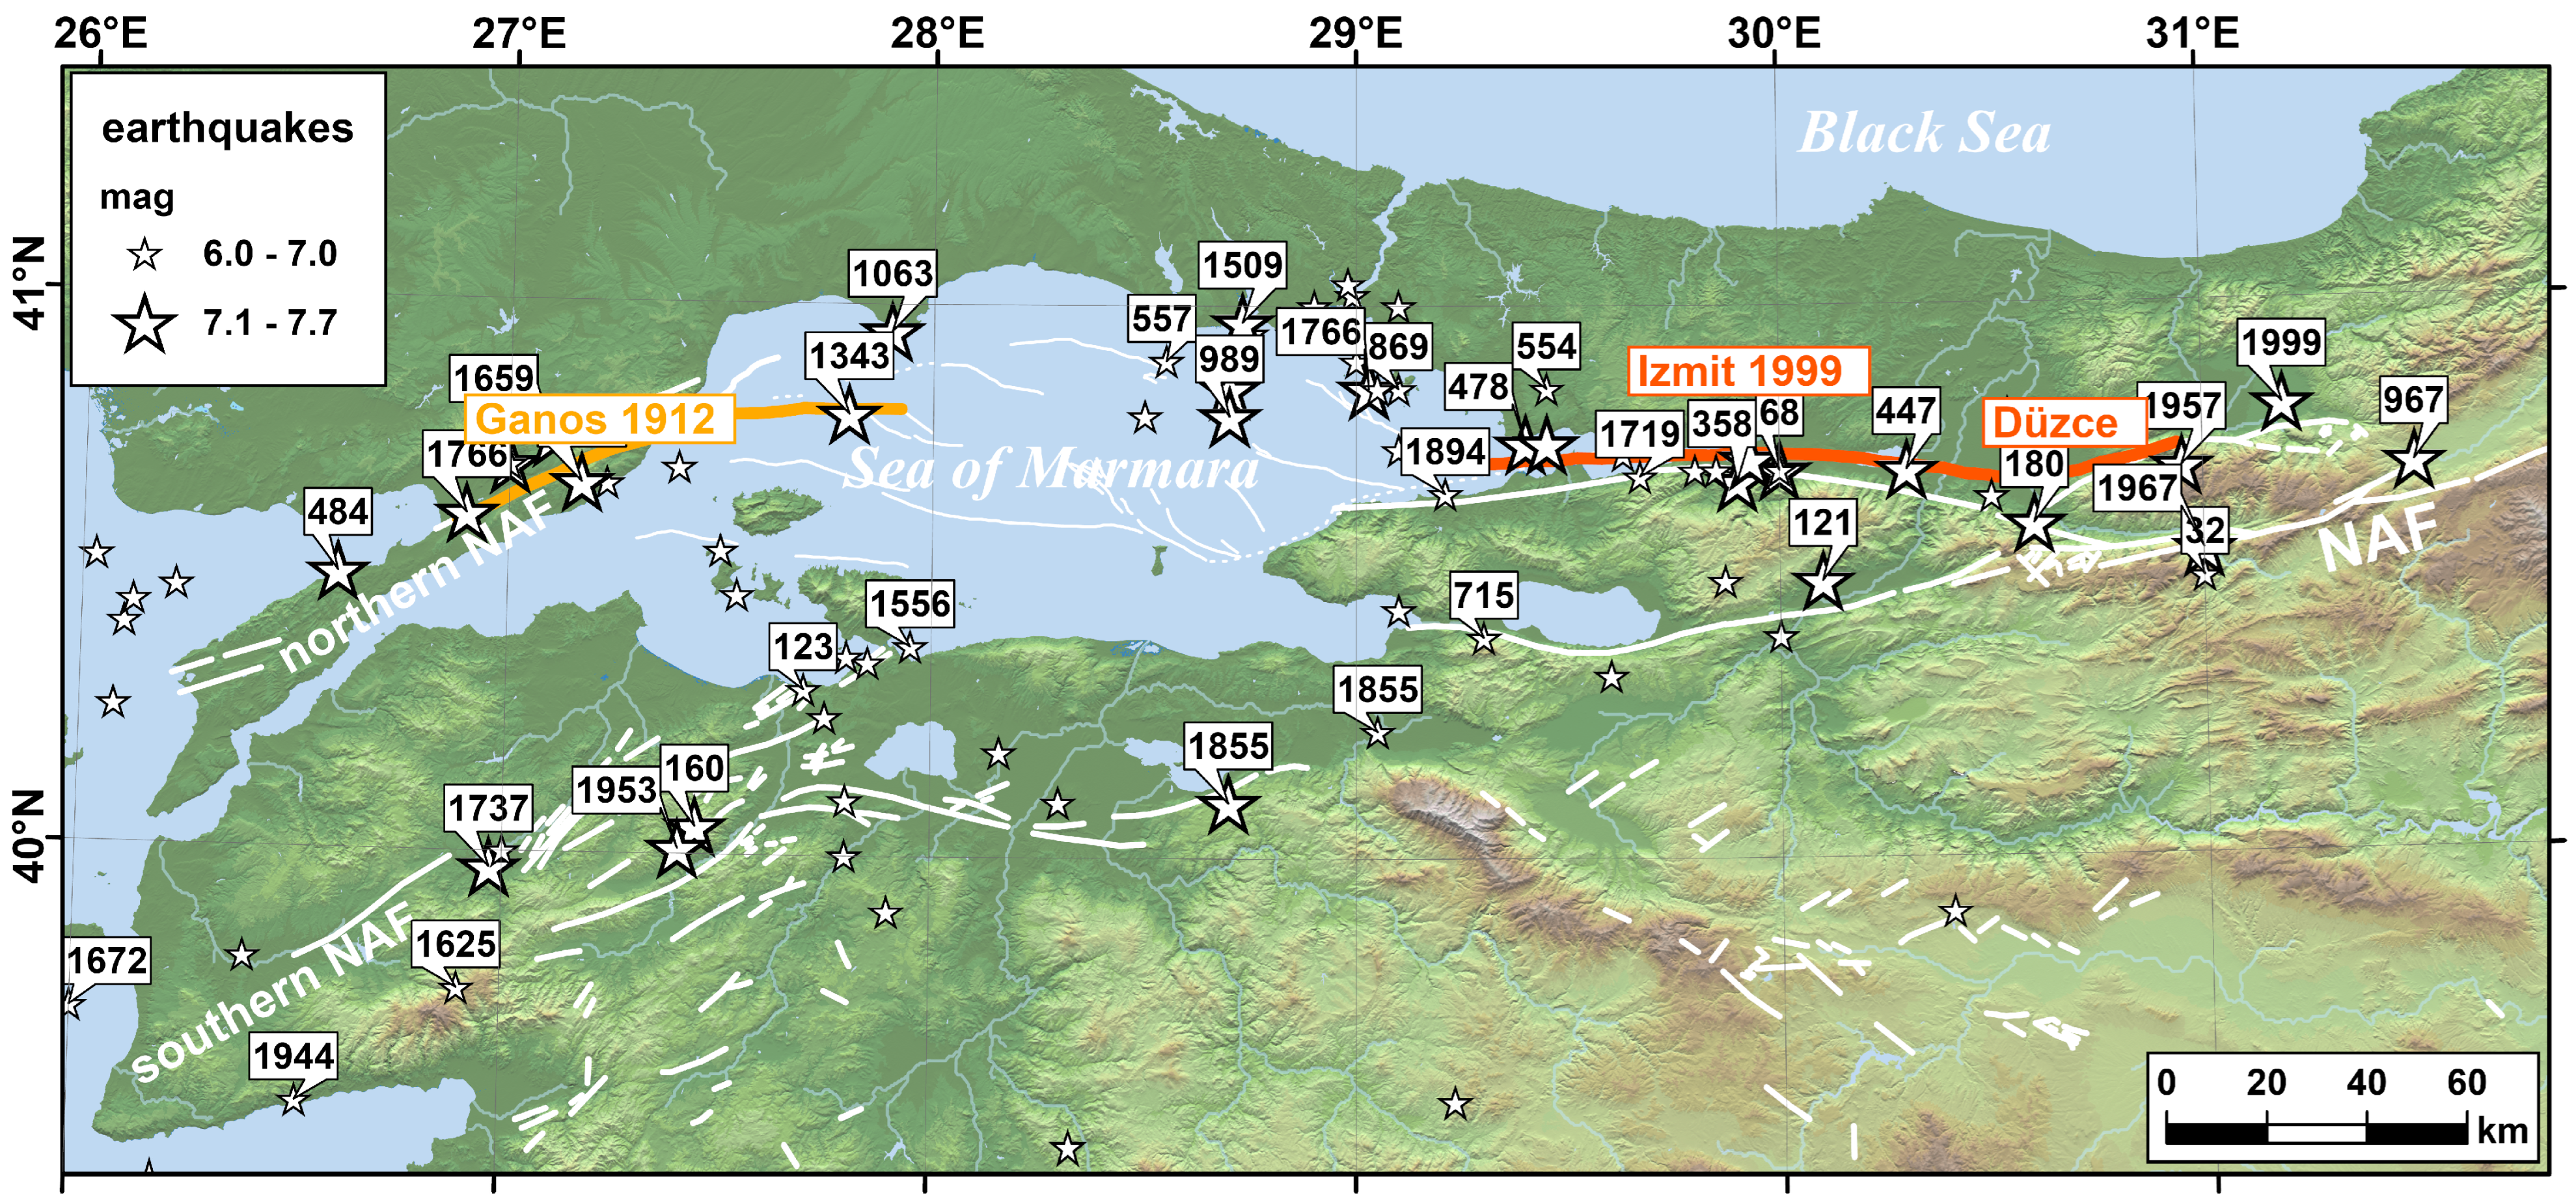
2. Seismotectonics of the Marmara Region
3. Materials and Methods
4. Results
4.1. Water Chemistry
4.2. Gas Geochemistry
4.2.1. Dissolved Gases
4.2.2. Bubbling Gases
5. Discussion
5.1. Water Geochemistry
5.2. Stable Isotopes
5.3. Gas Composition
5.4. Helium–Carbon Systematics
5.5. Fluid Circulation and Fault Activity
6. Conclusions
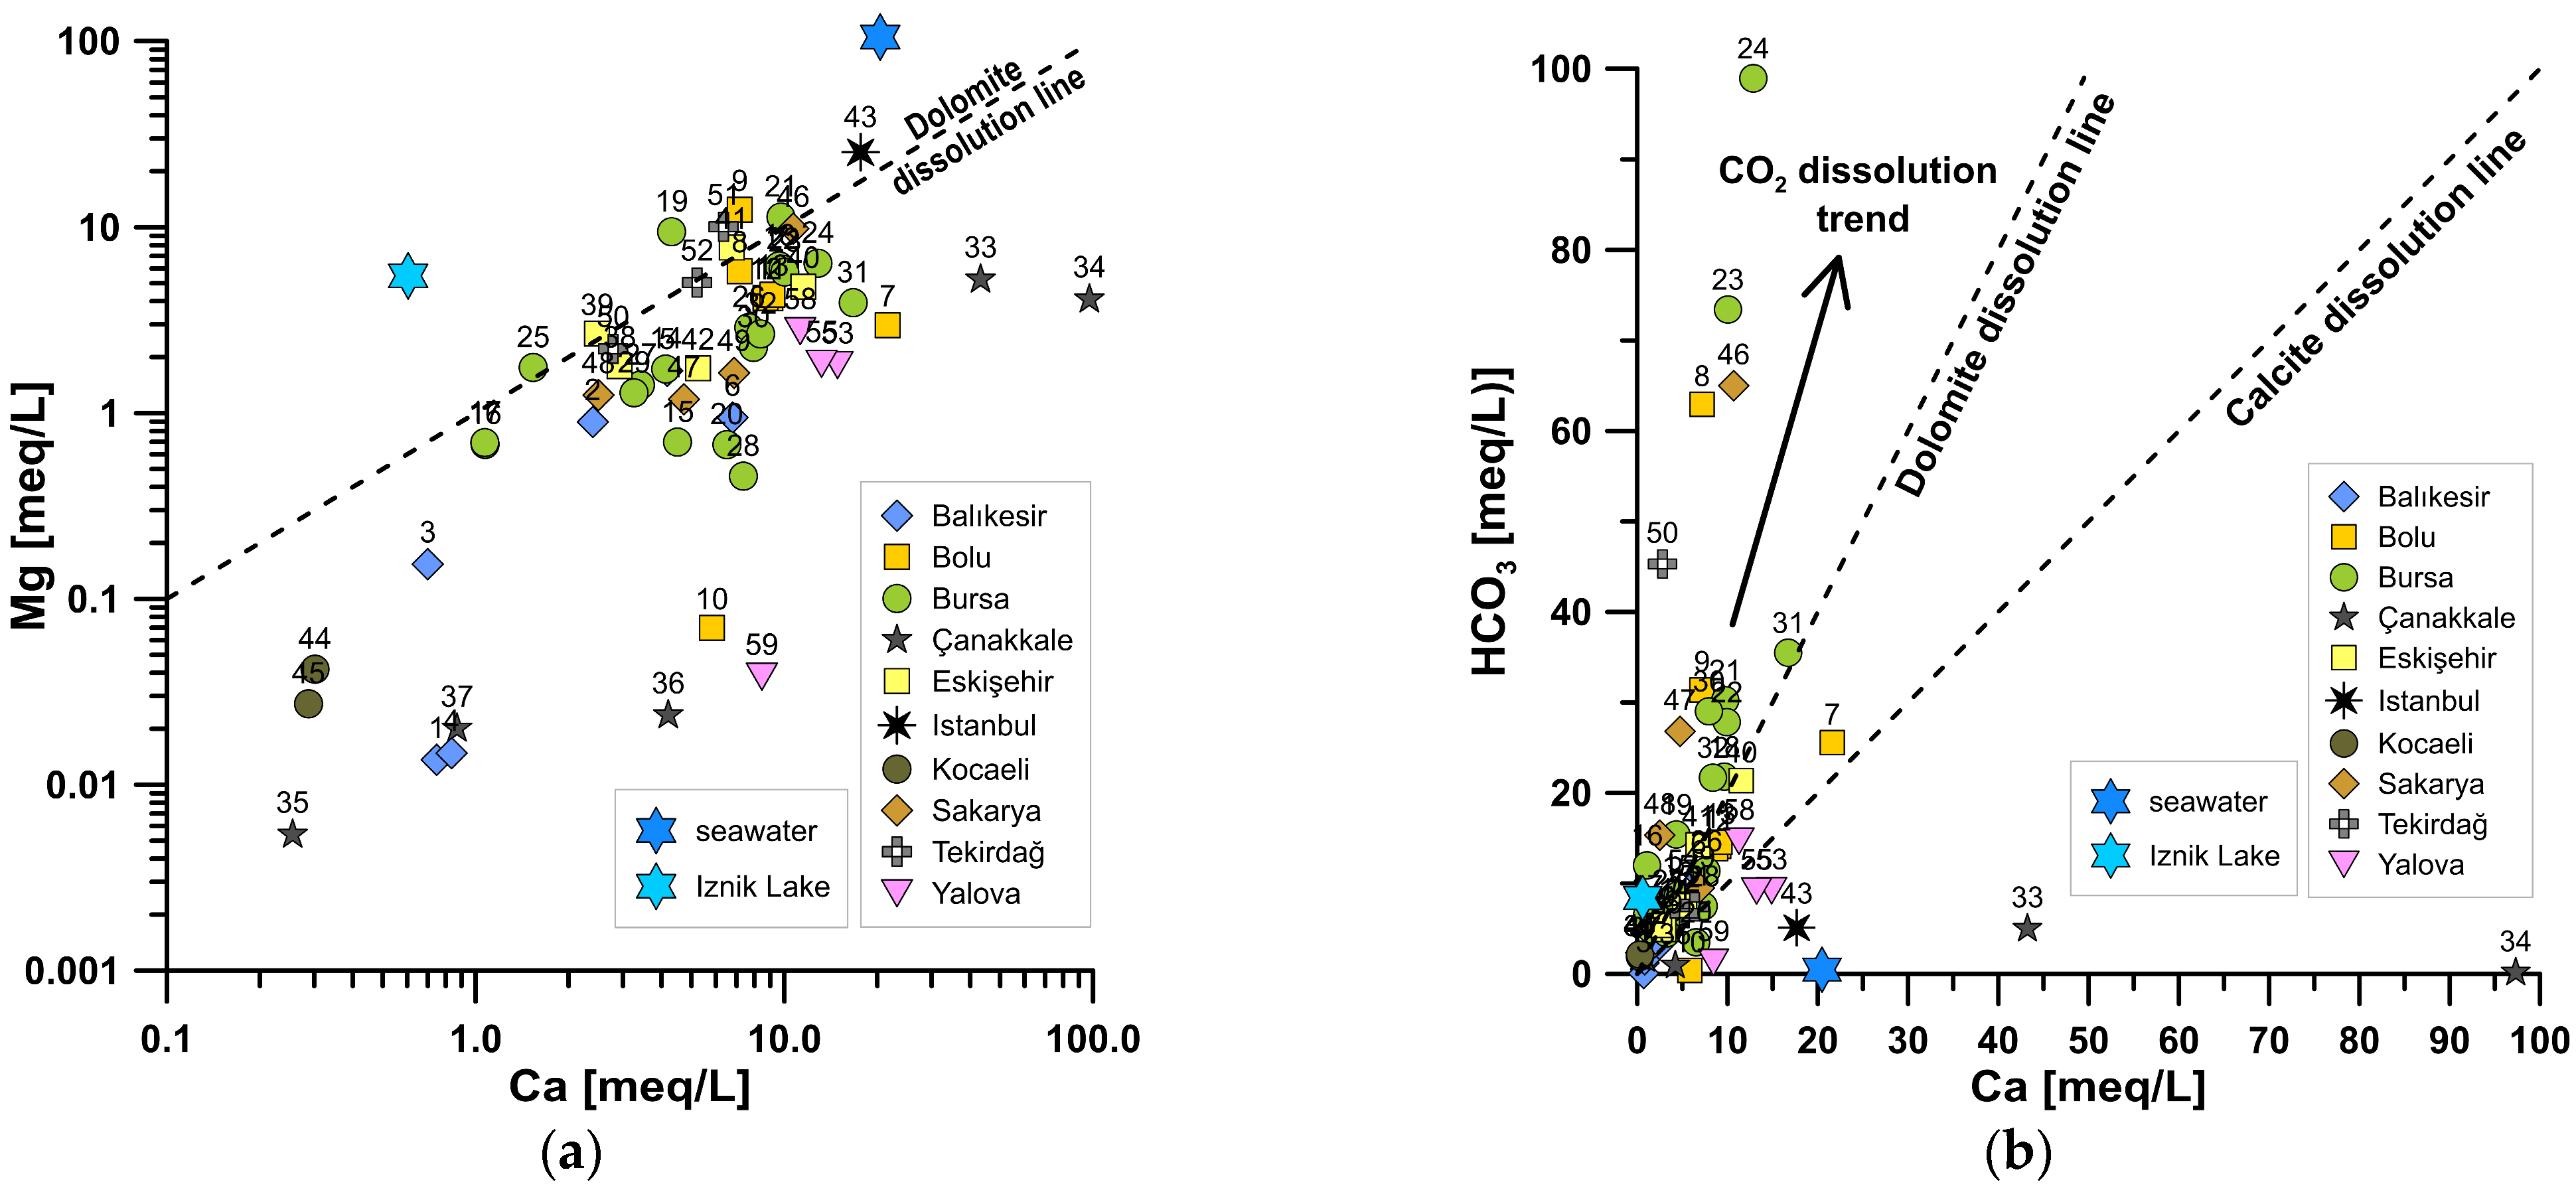
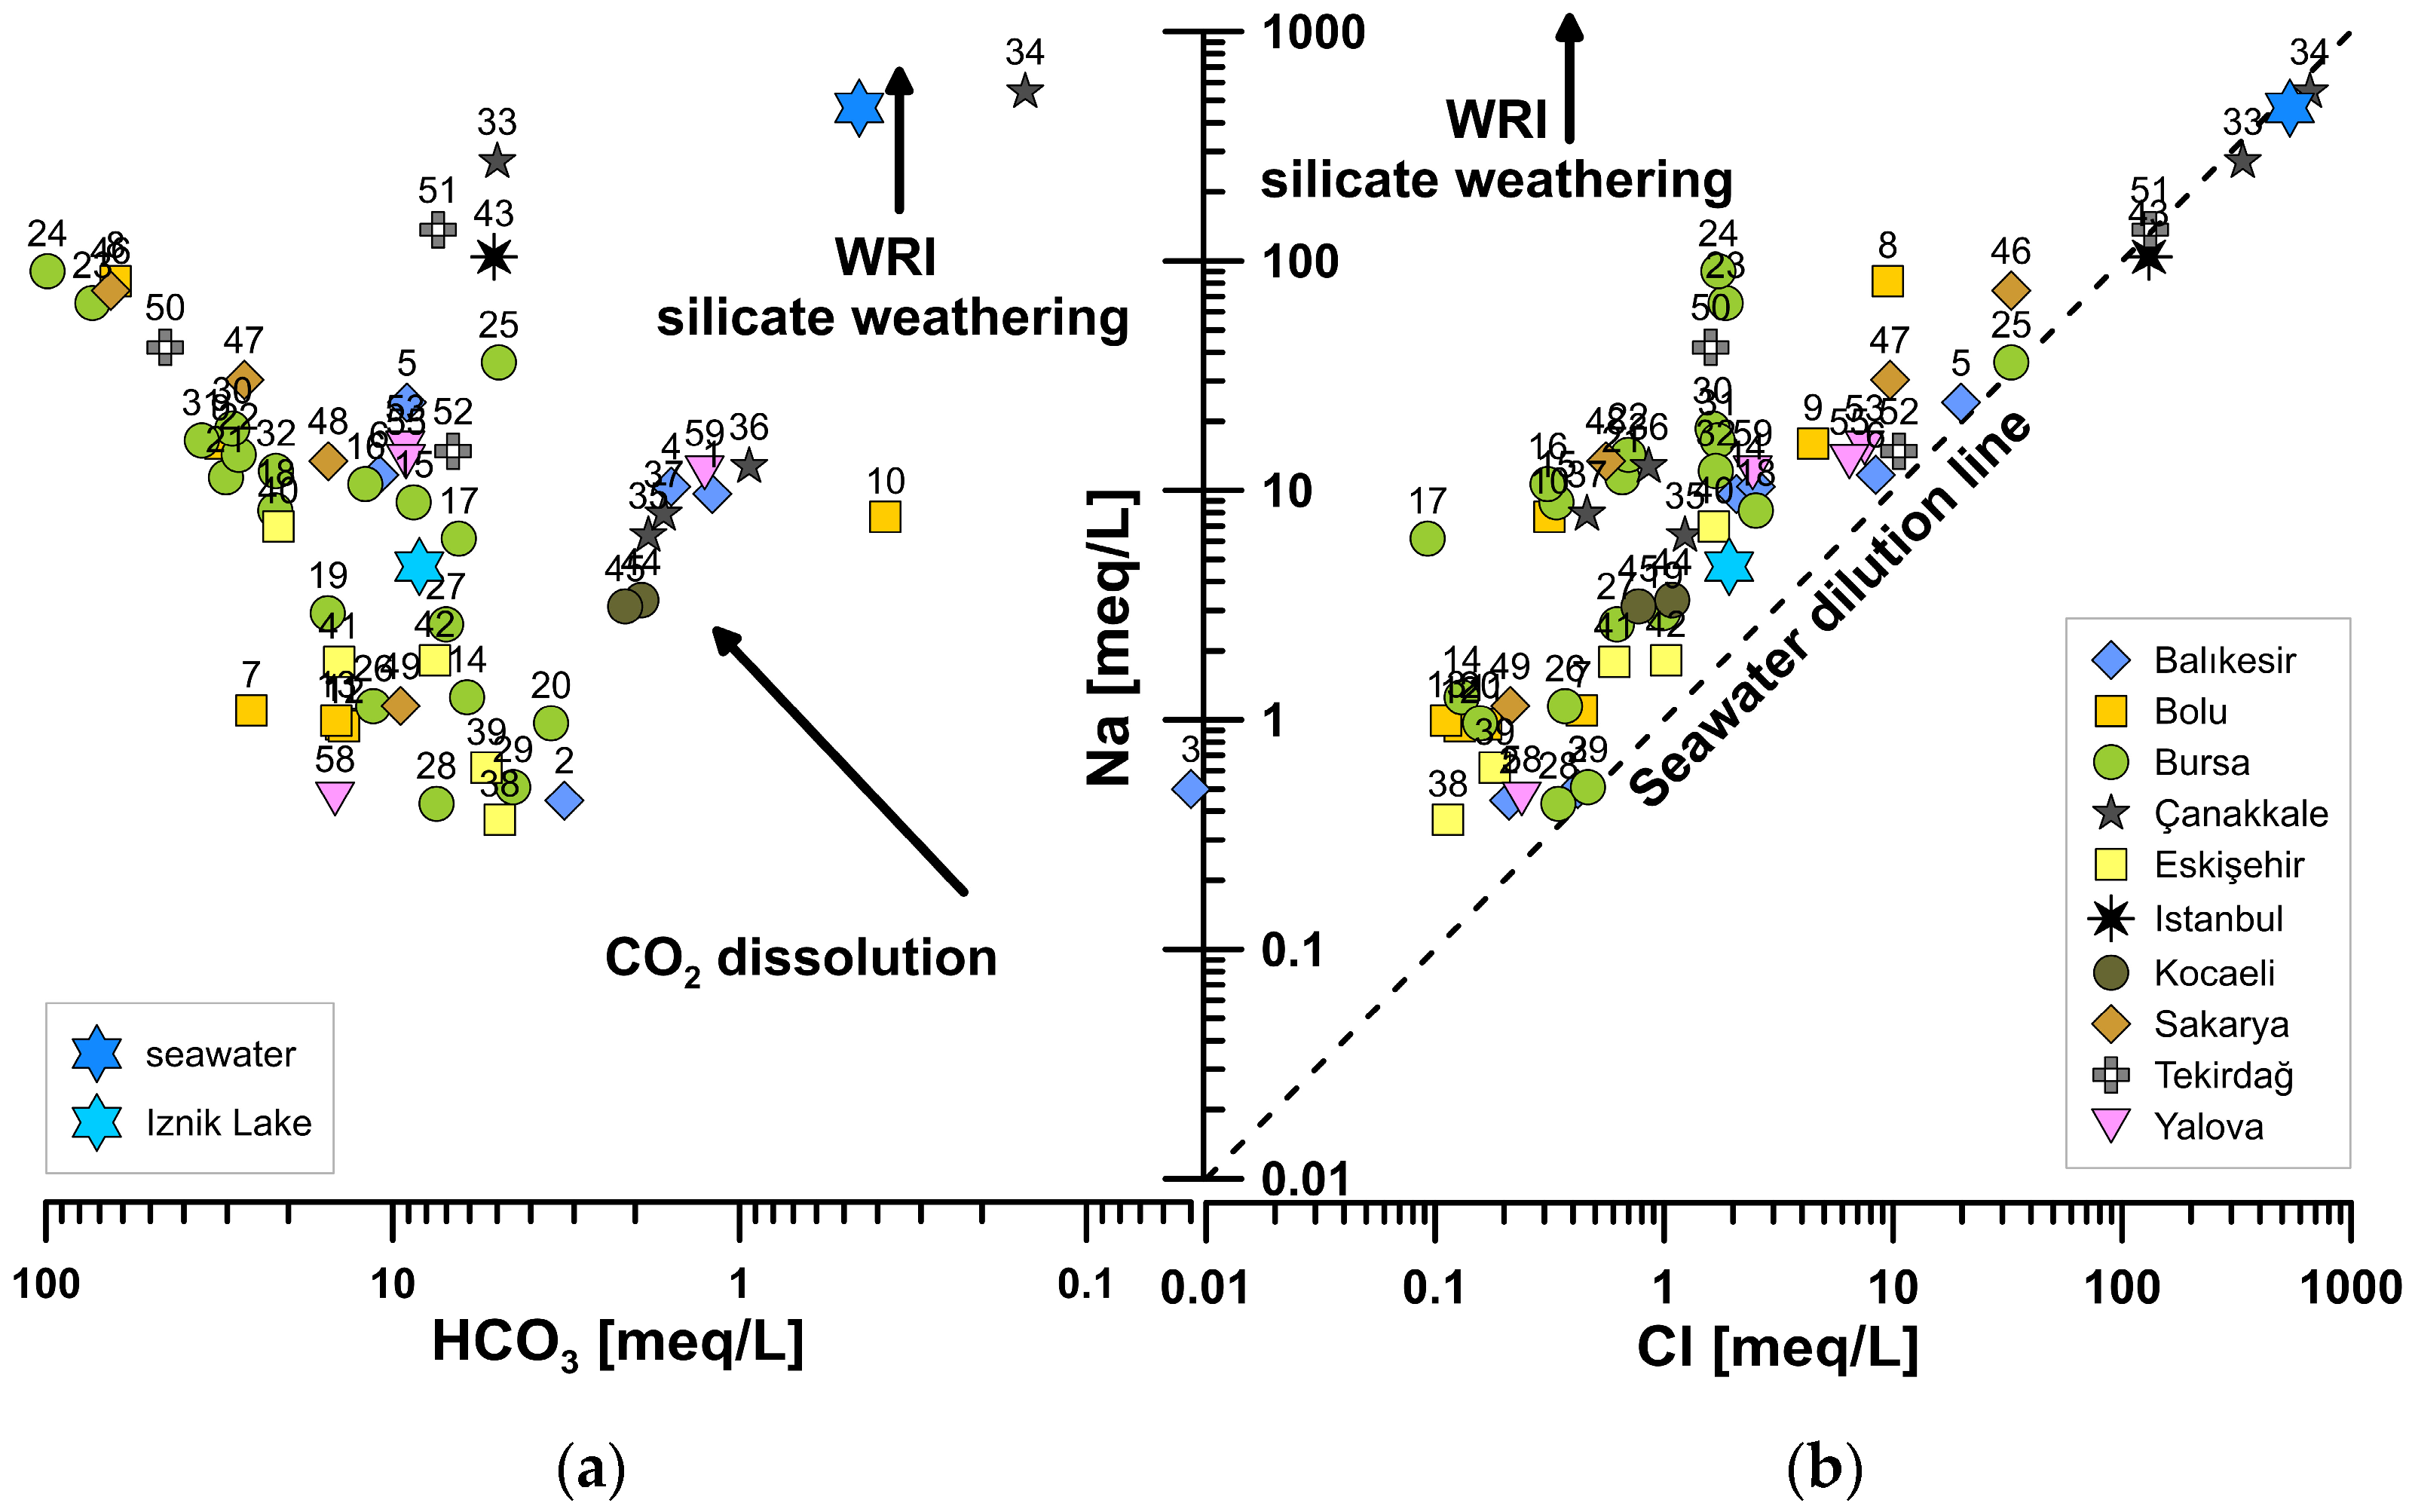
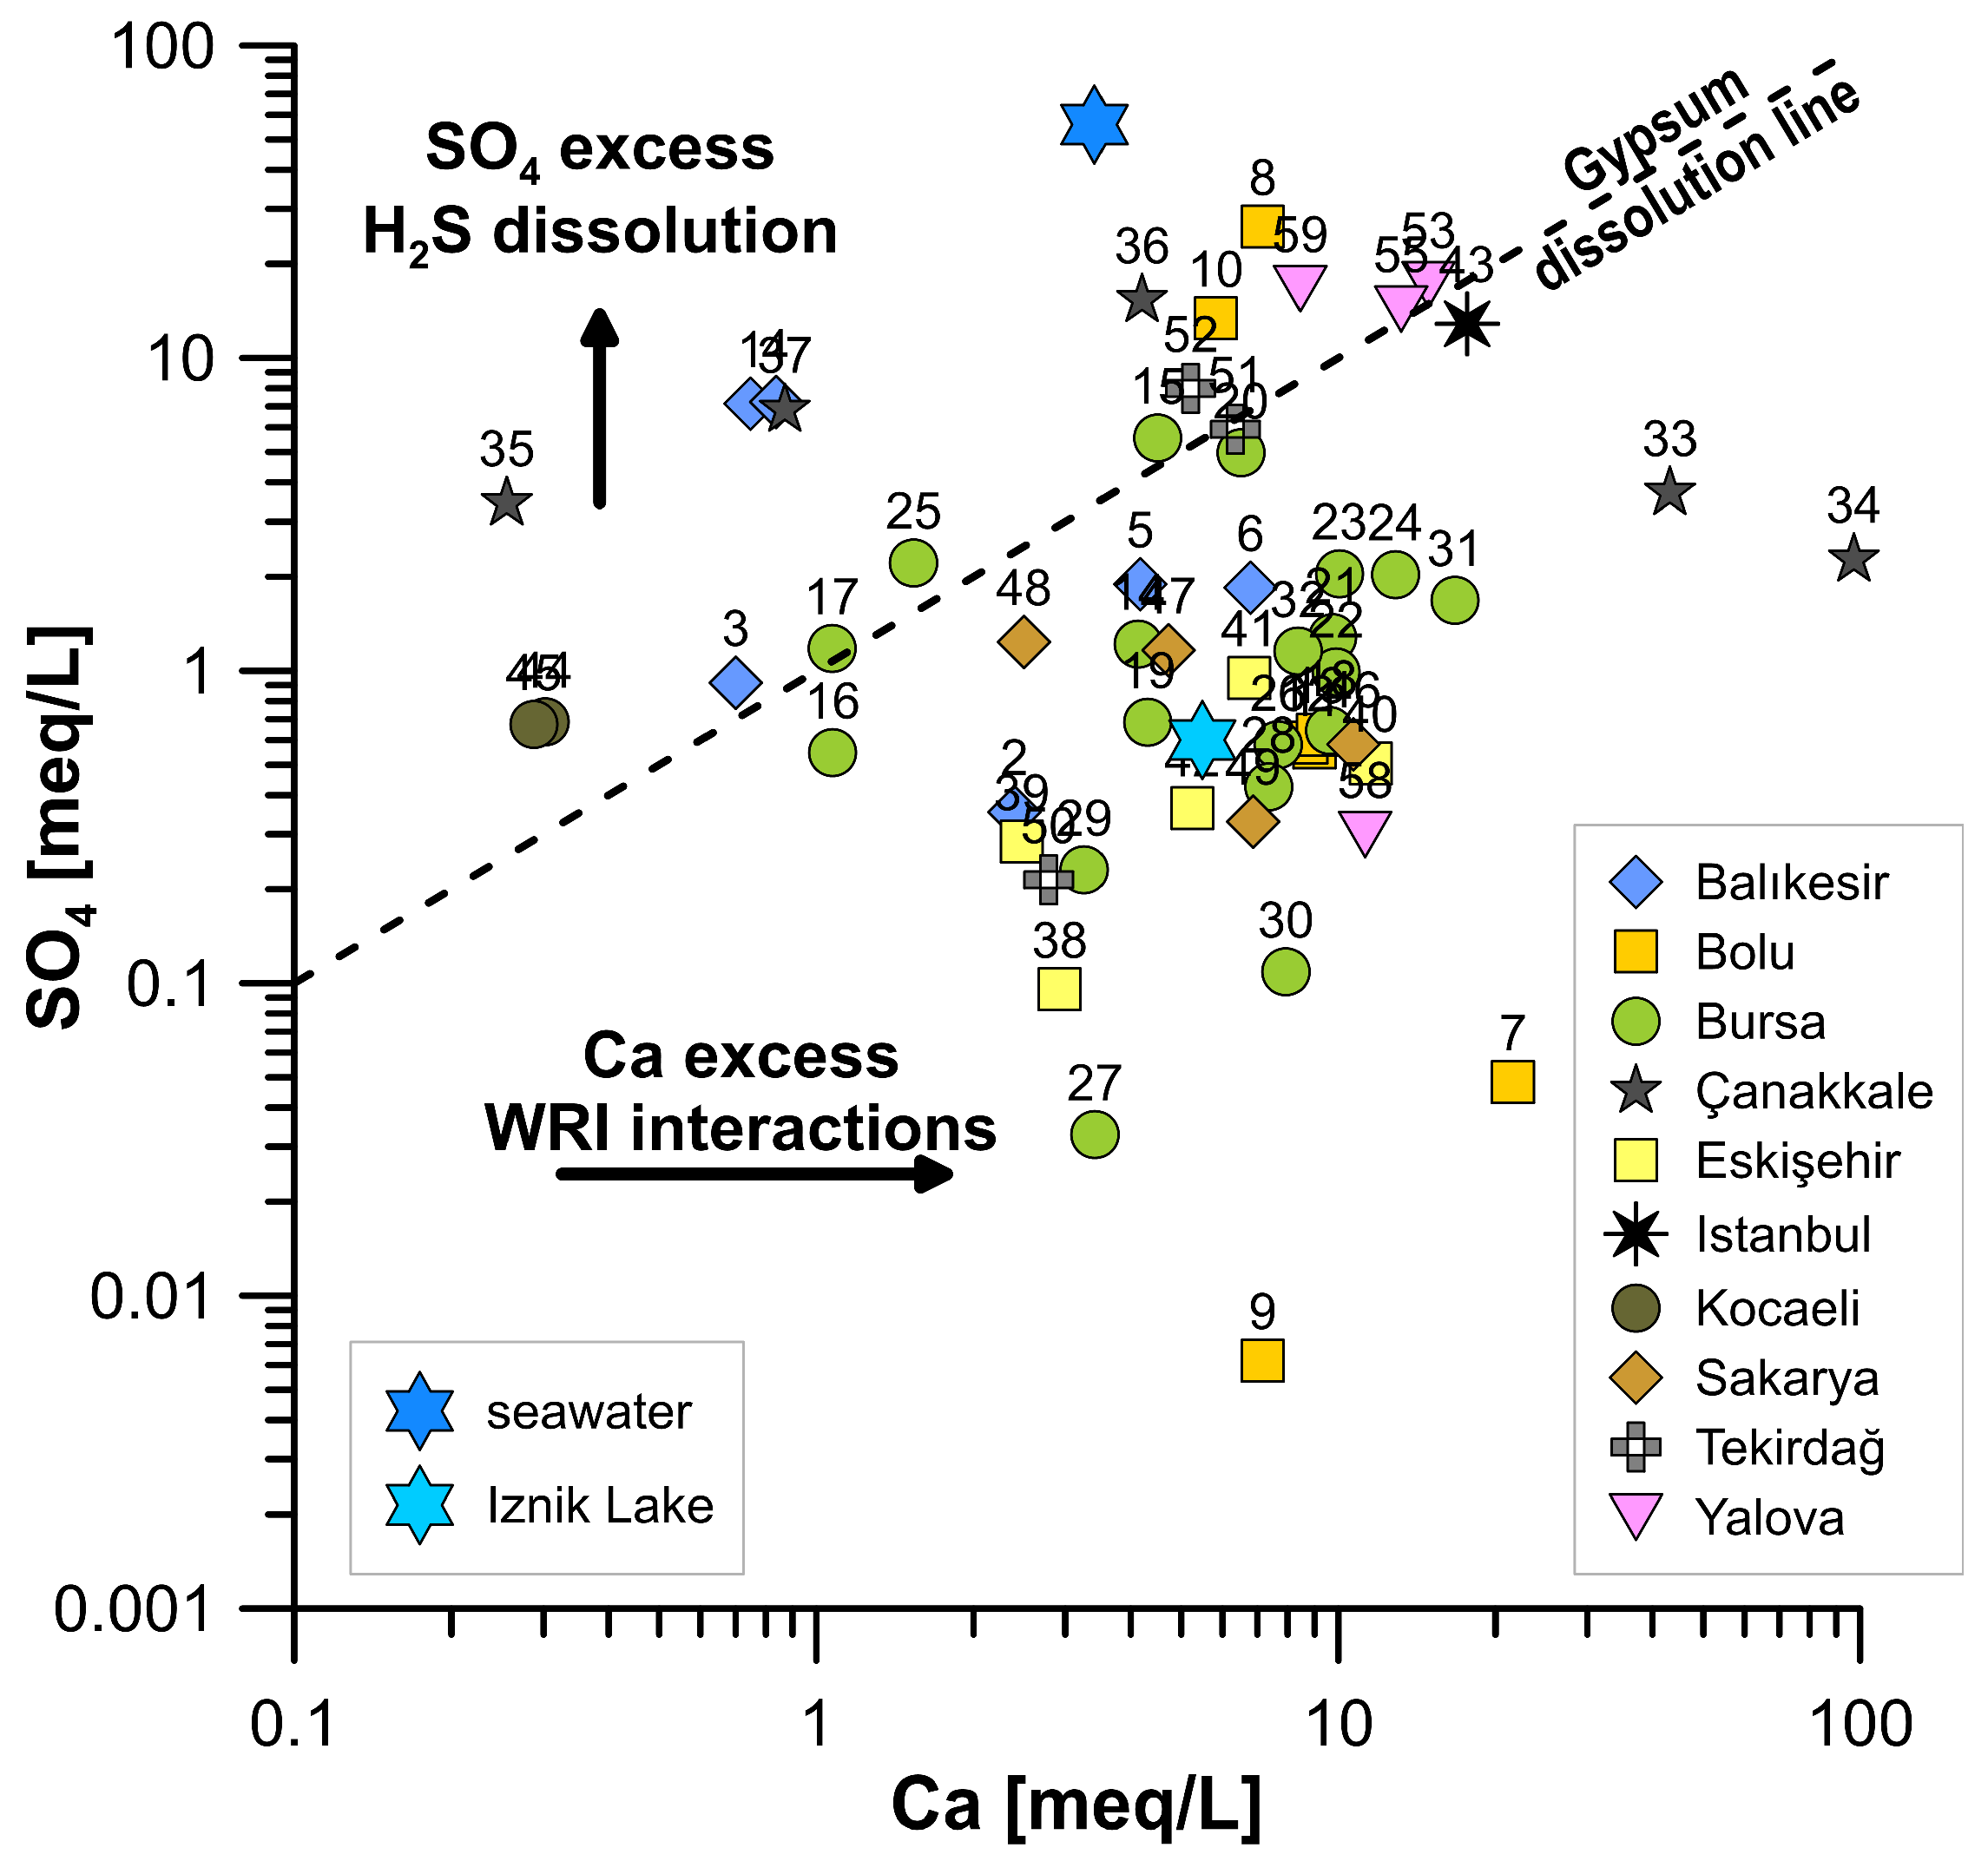
- Water geochemistry: Water temperatures range from 14 °C to 97 °C, and electrical conductivity from 198 µS/cm to 93 mS/cm. Geochemical “water types” Ca-HCO3, Na-HCO3, Ca-SO4, Na-SO4 and Na (Ca)-Cl (SO4) indicate the geologic complexity of the Marmara area driven by the occurrence of different geochemical processes (i.e., water–rock interaction, mixing between aquifers, dissolution of gases of different origins, repeated gas–water interactions, etc.) affecting the final water’s features.
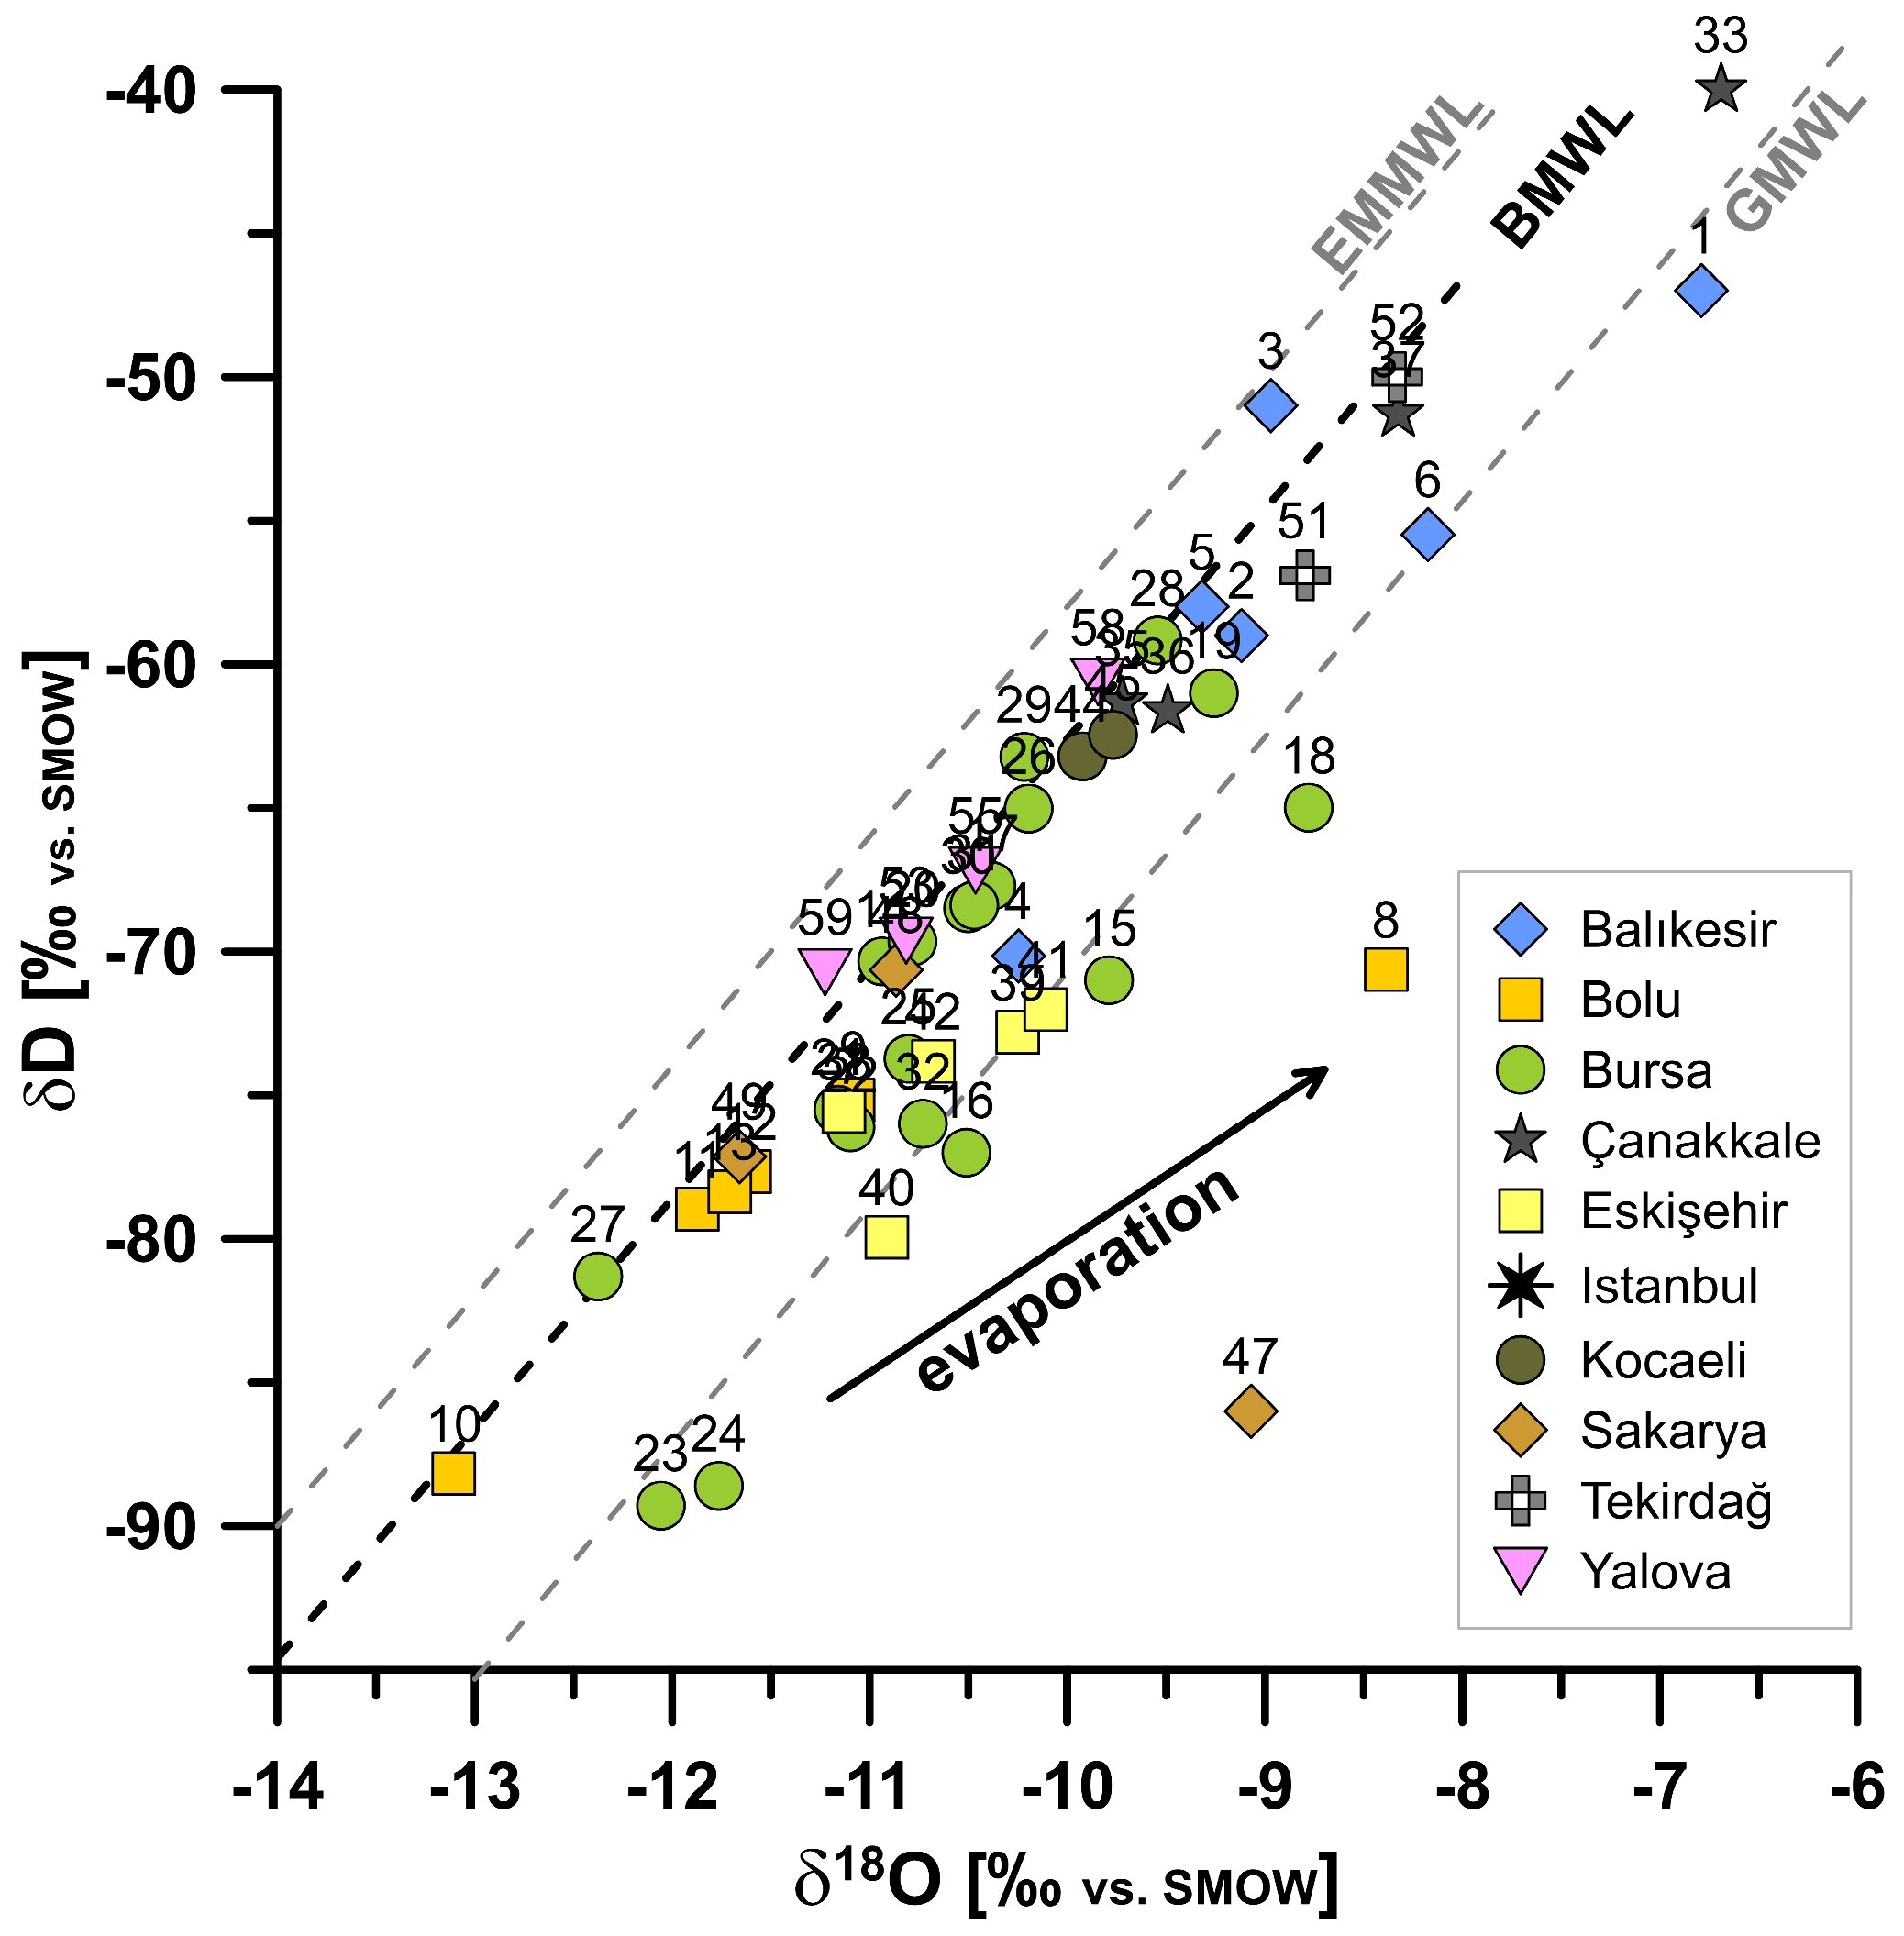
- Stable isotopes: The measured δ18O–δD values are consistent with a meteoric origin of the groundwater and denote the occurrence, sometimes significant, of evaporation effects.
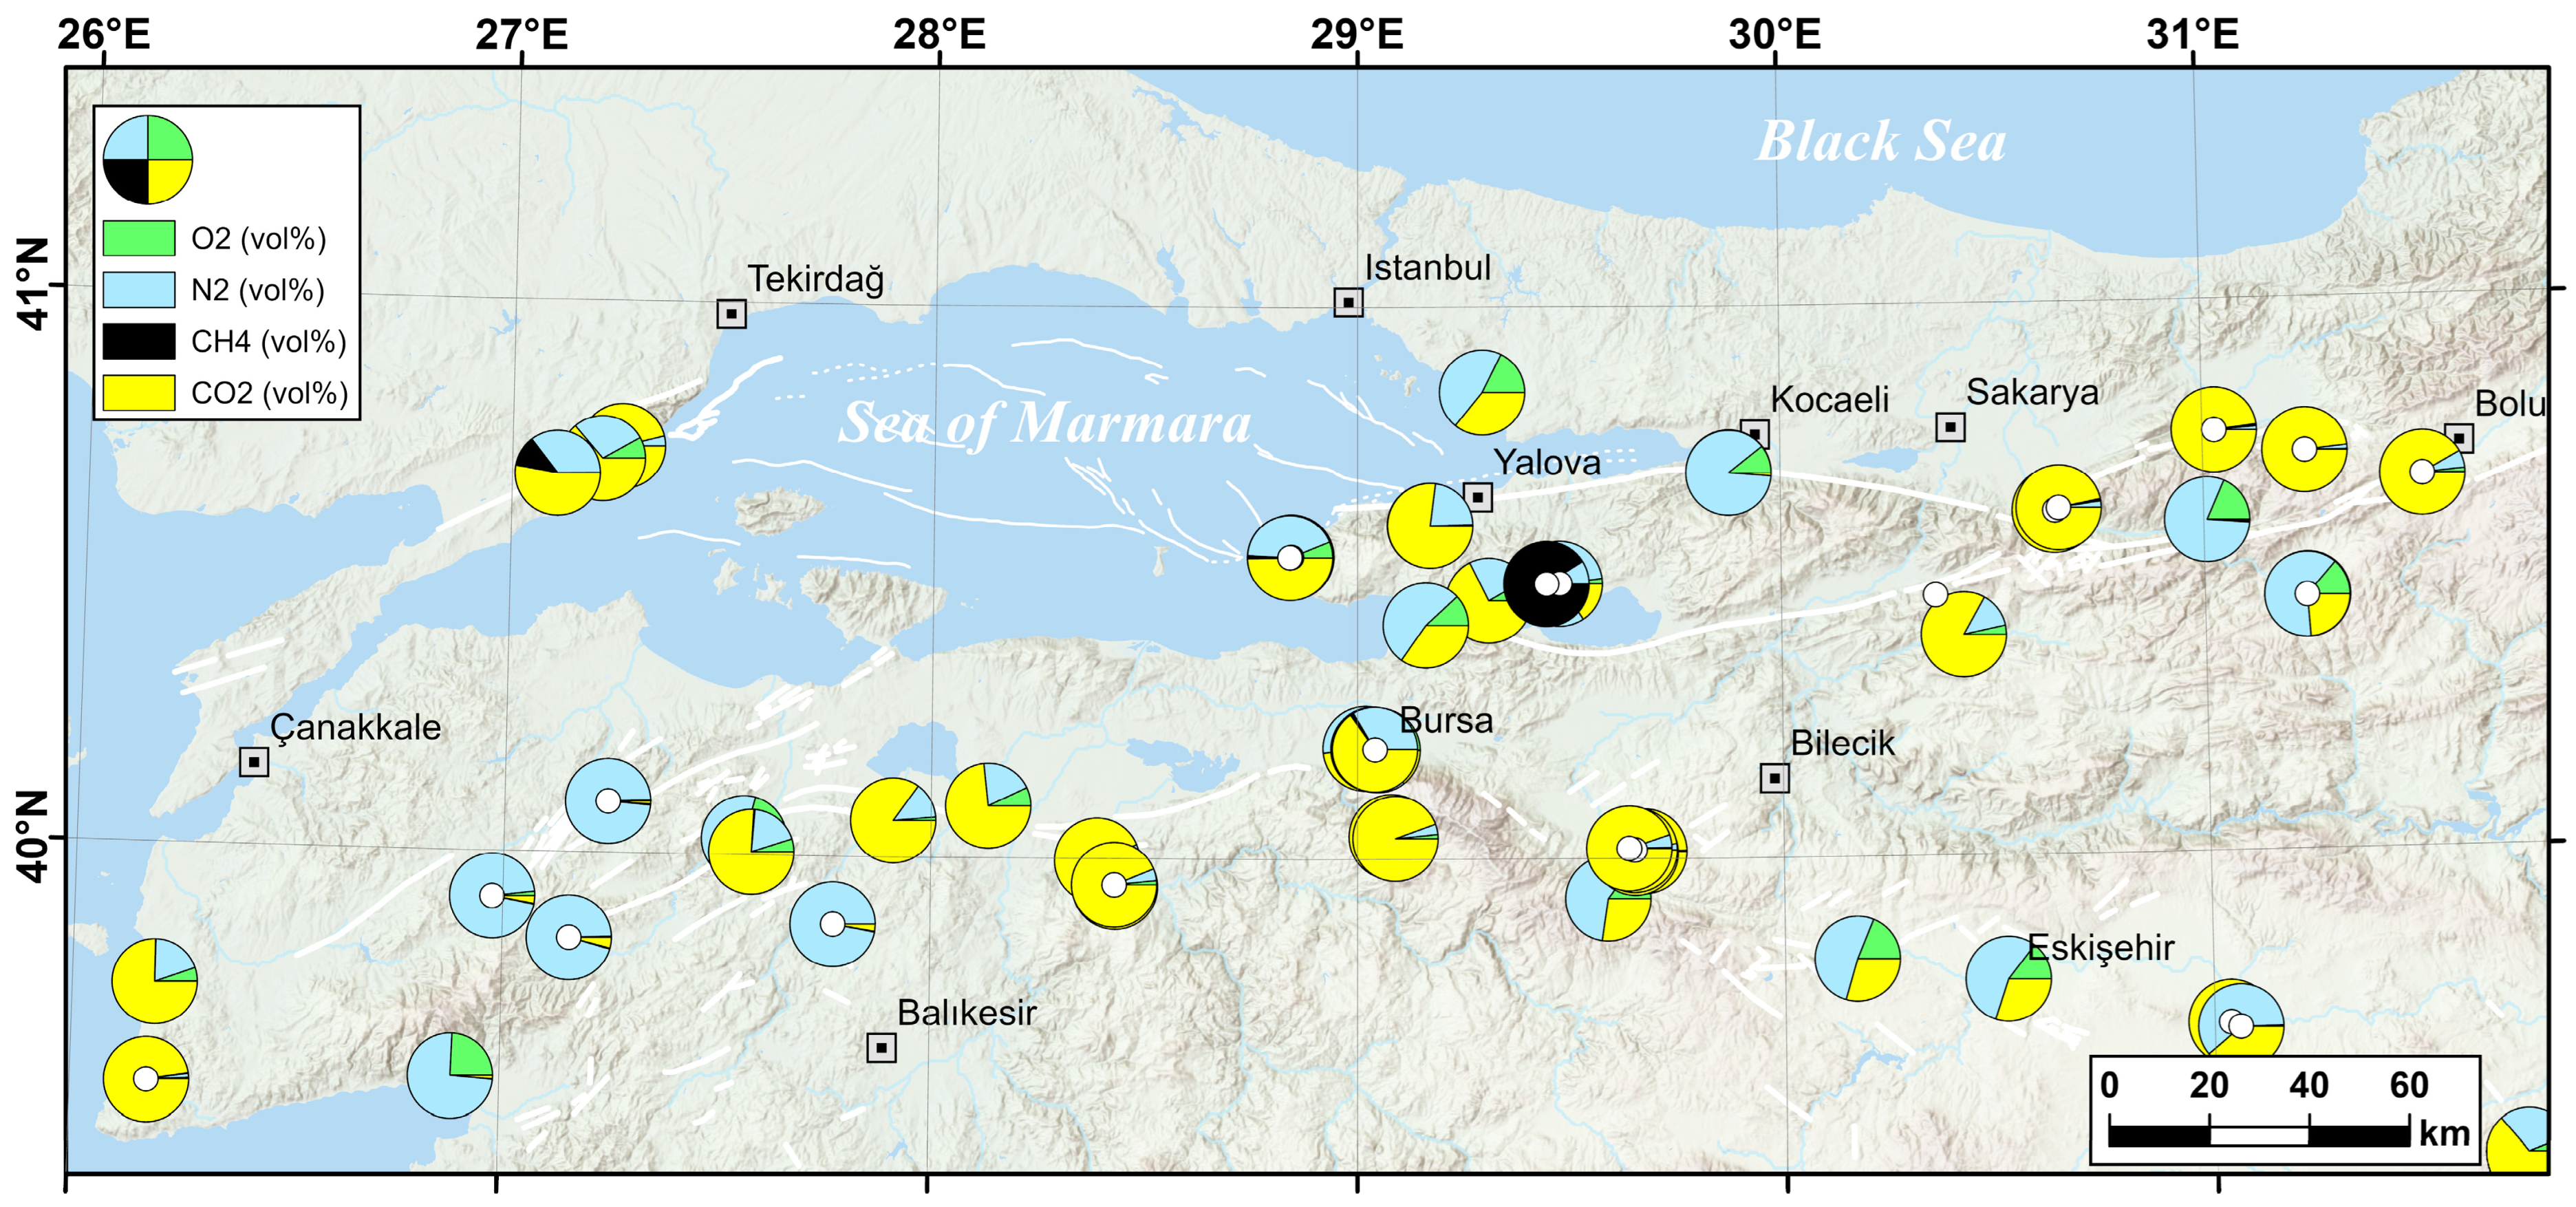
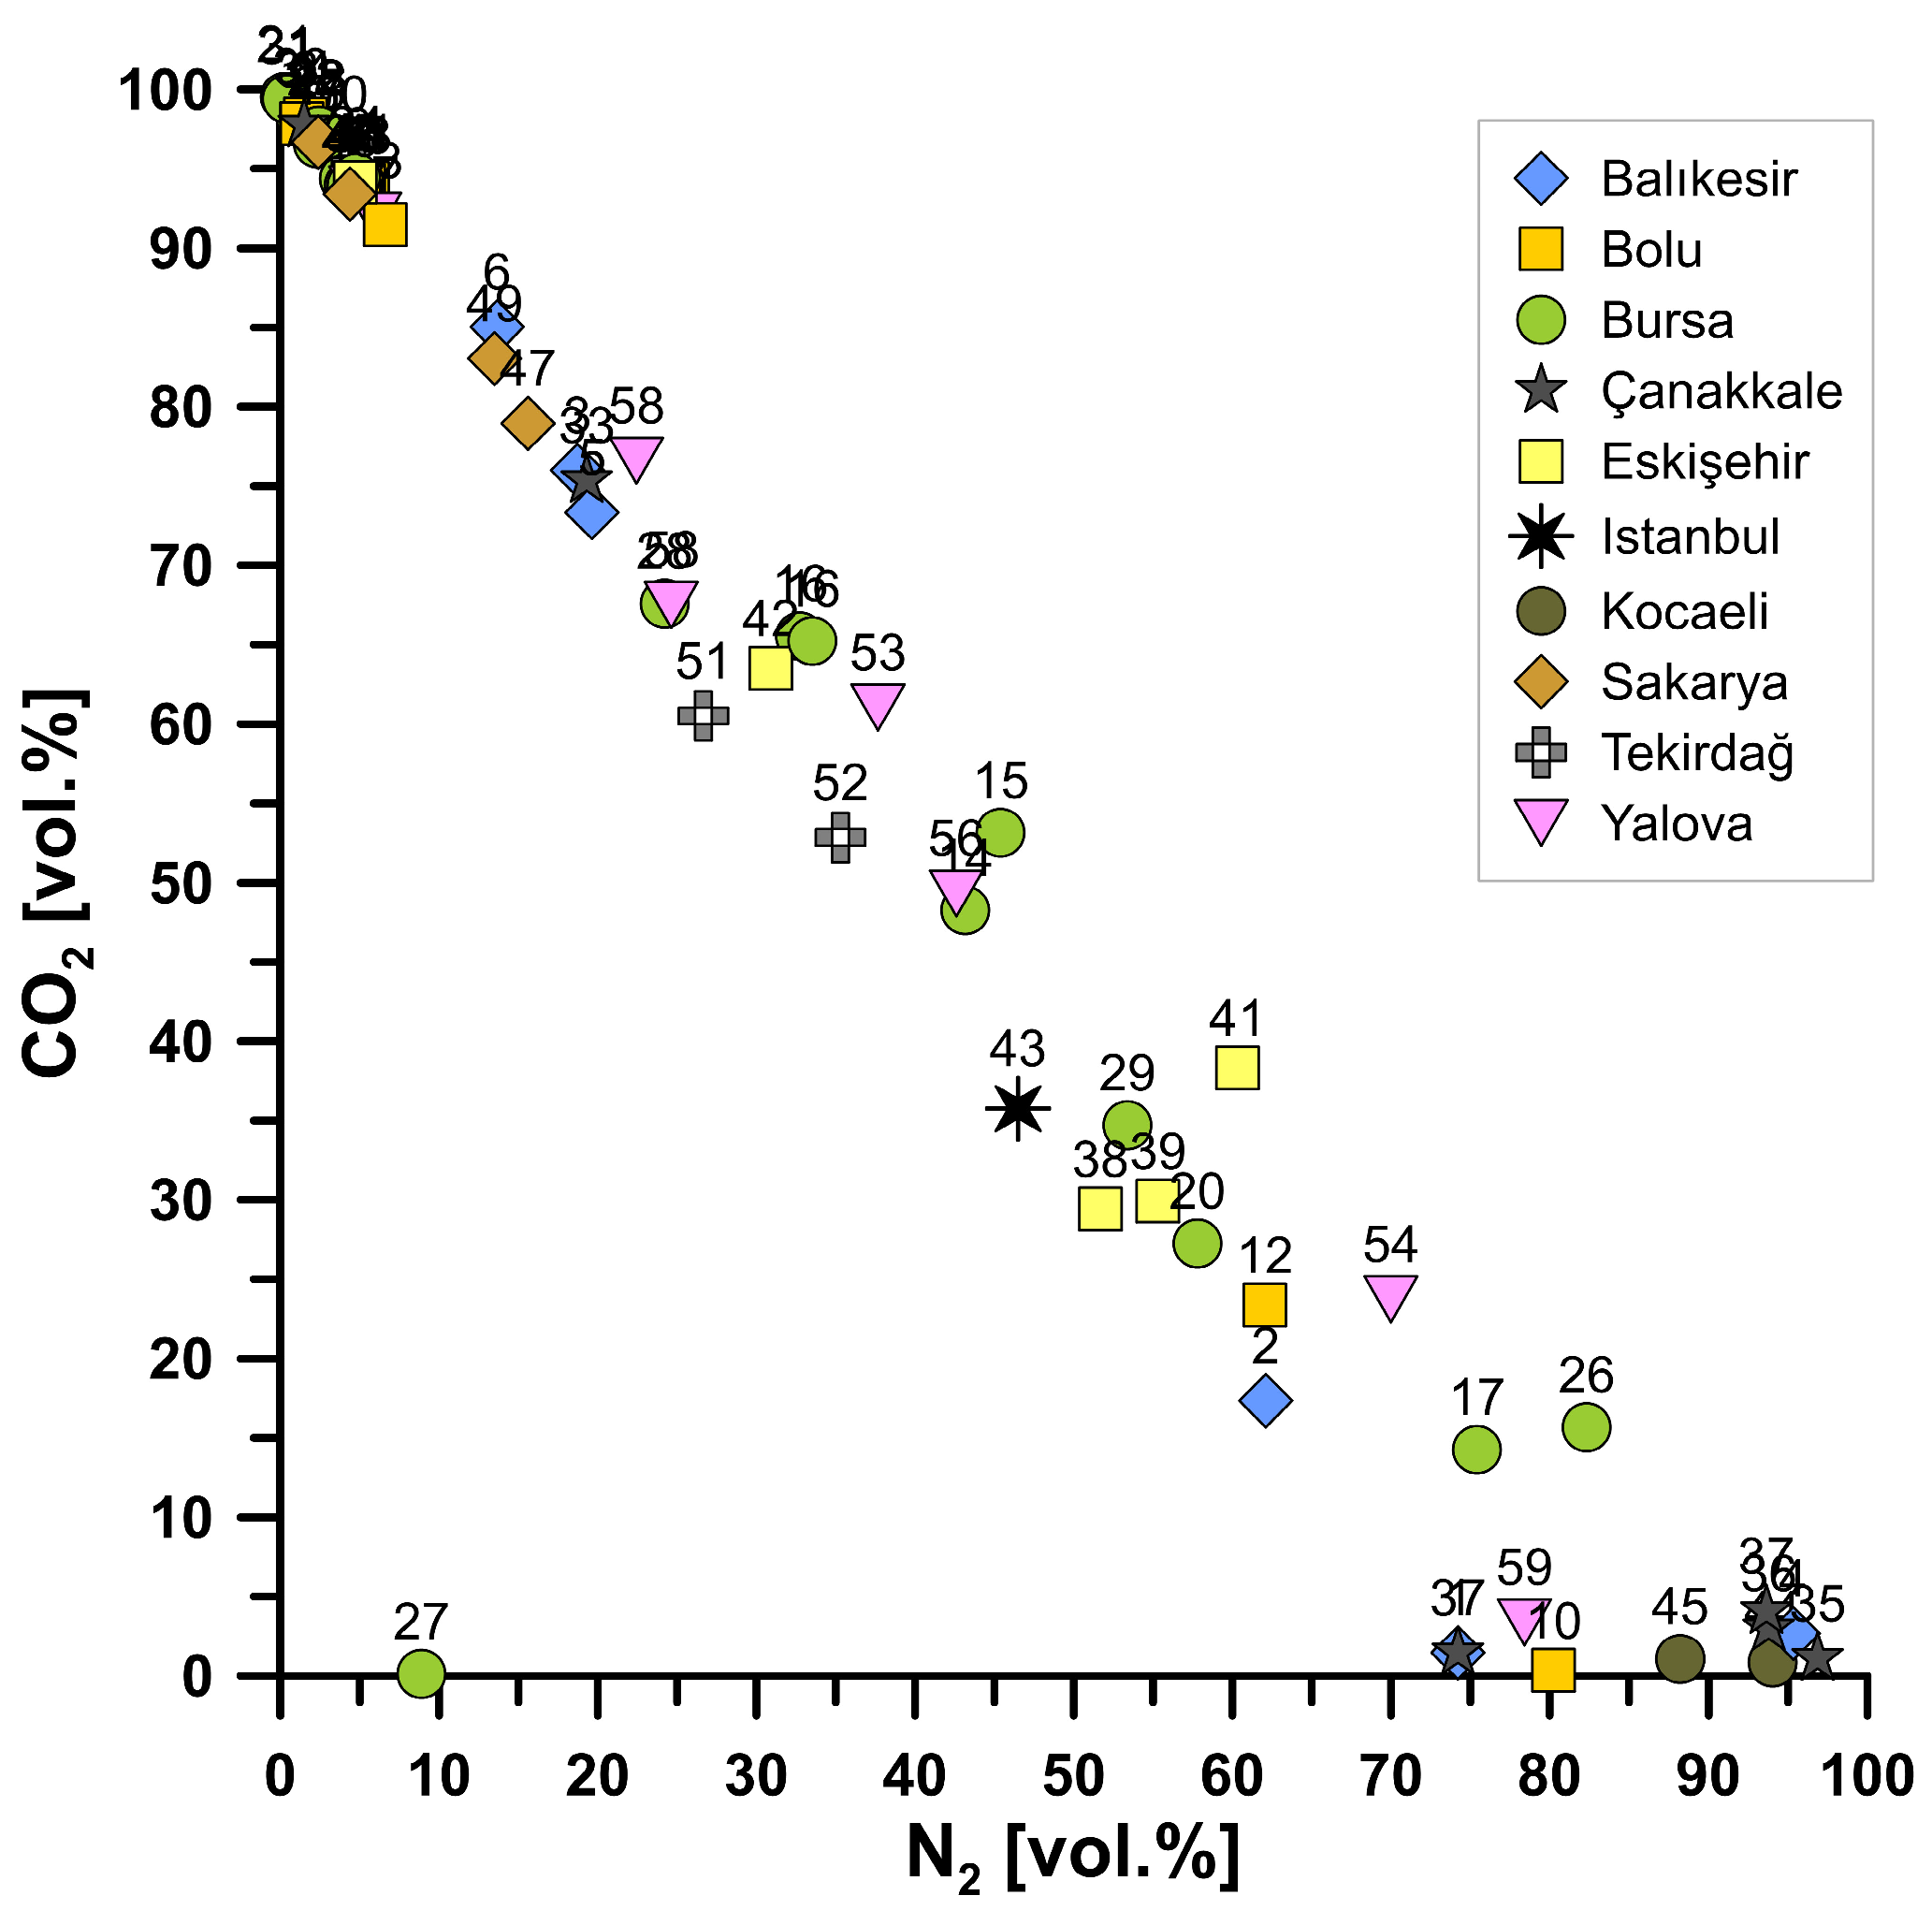
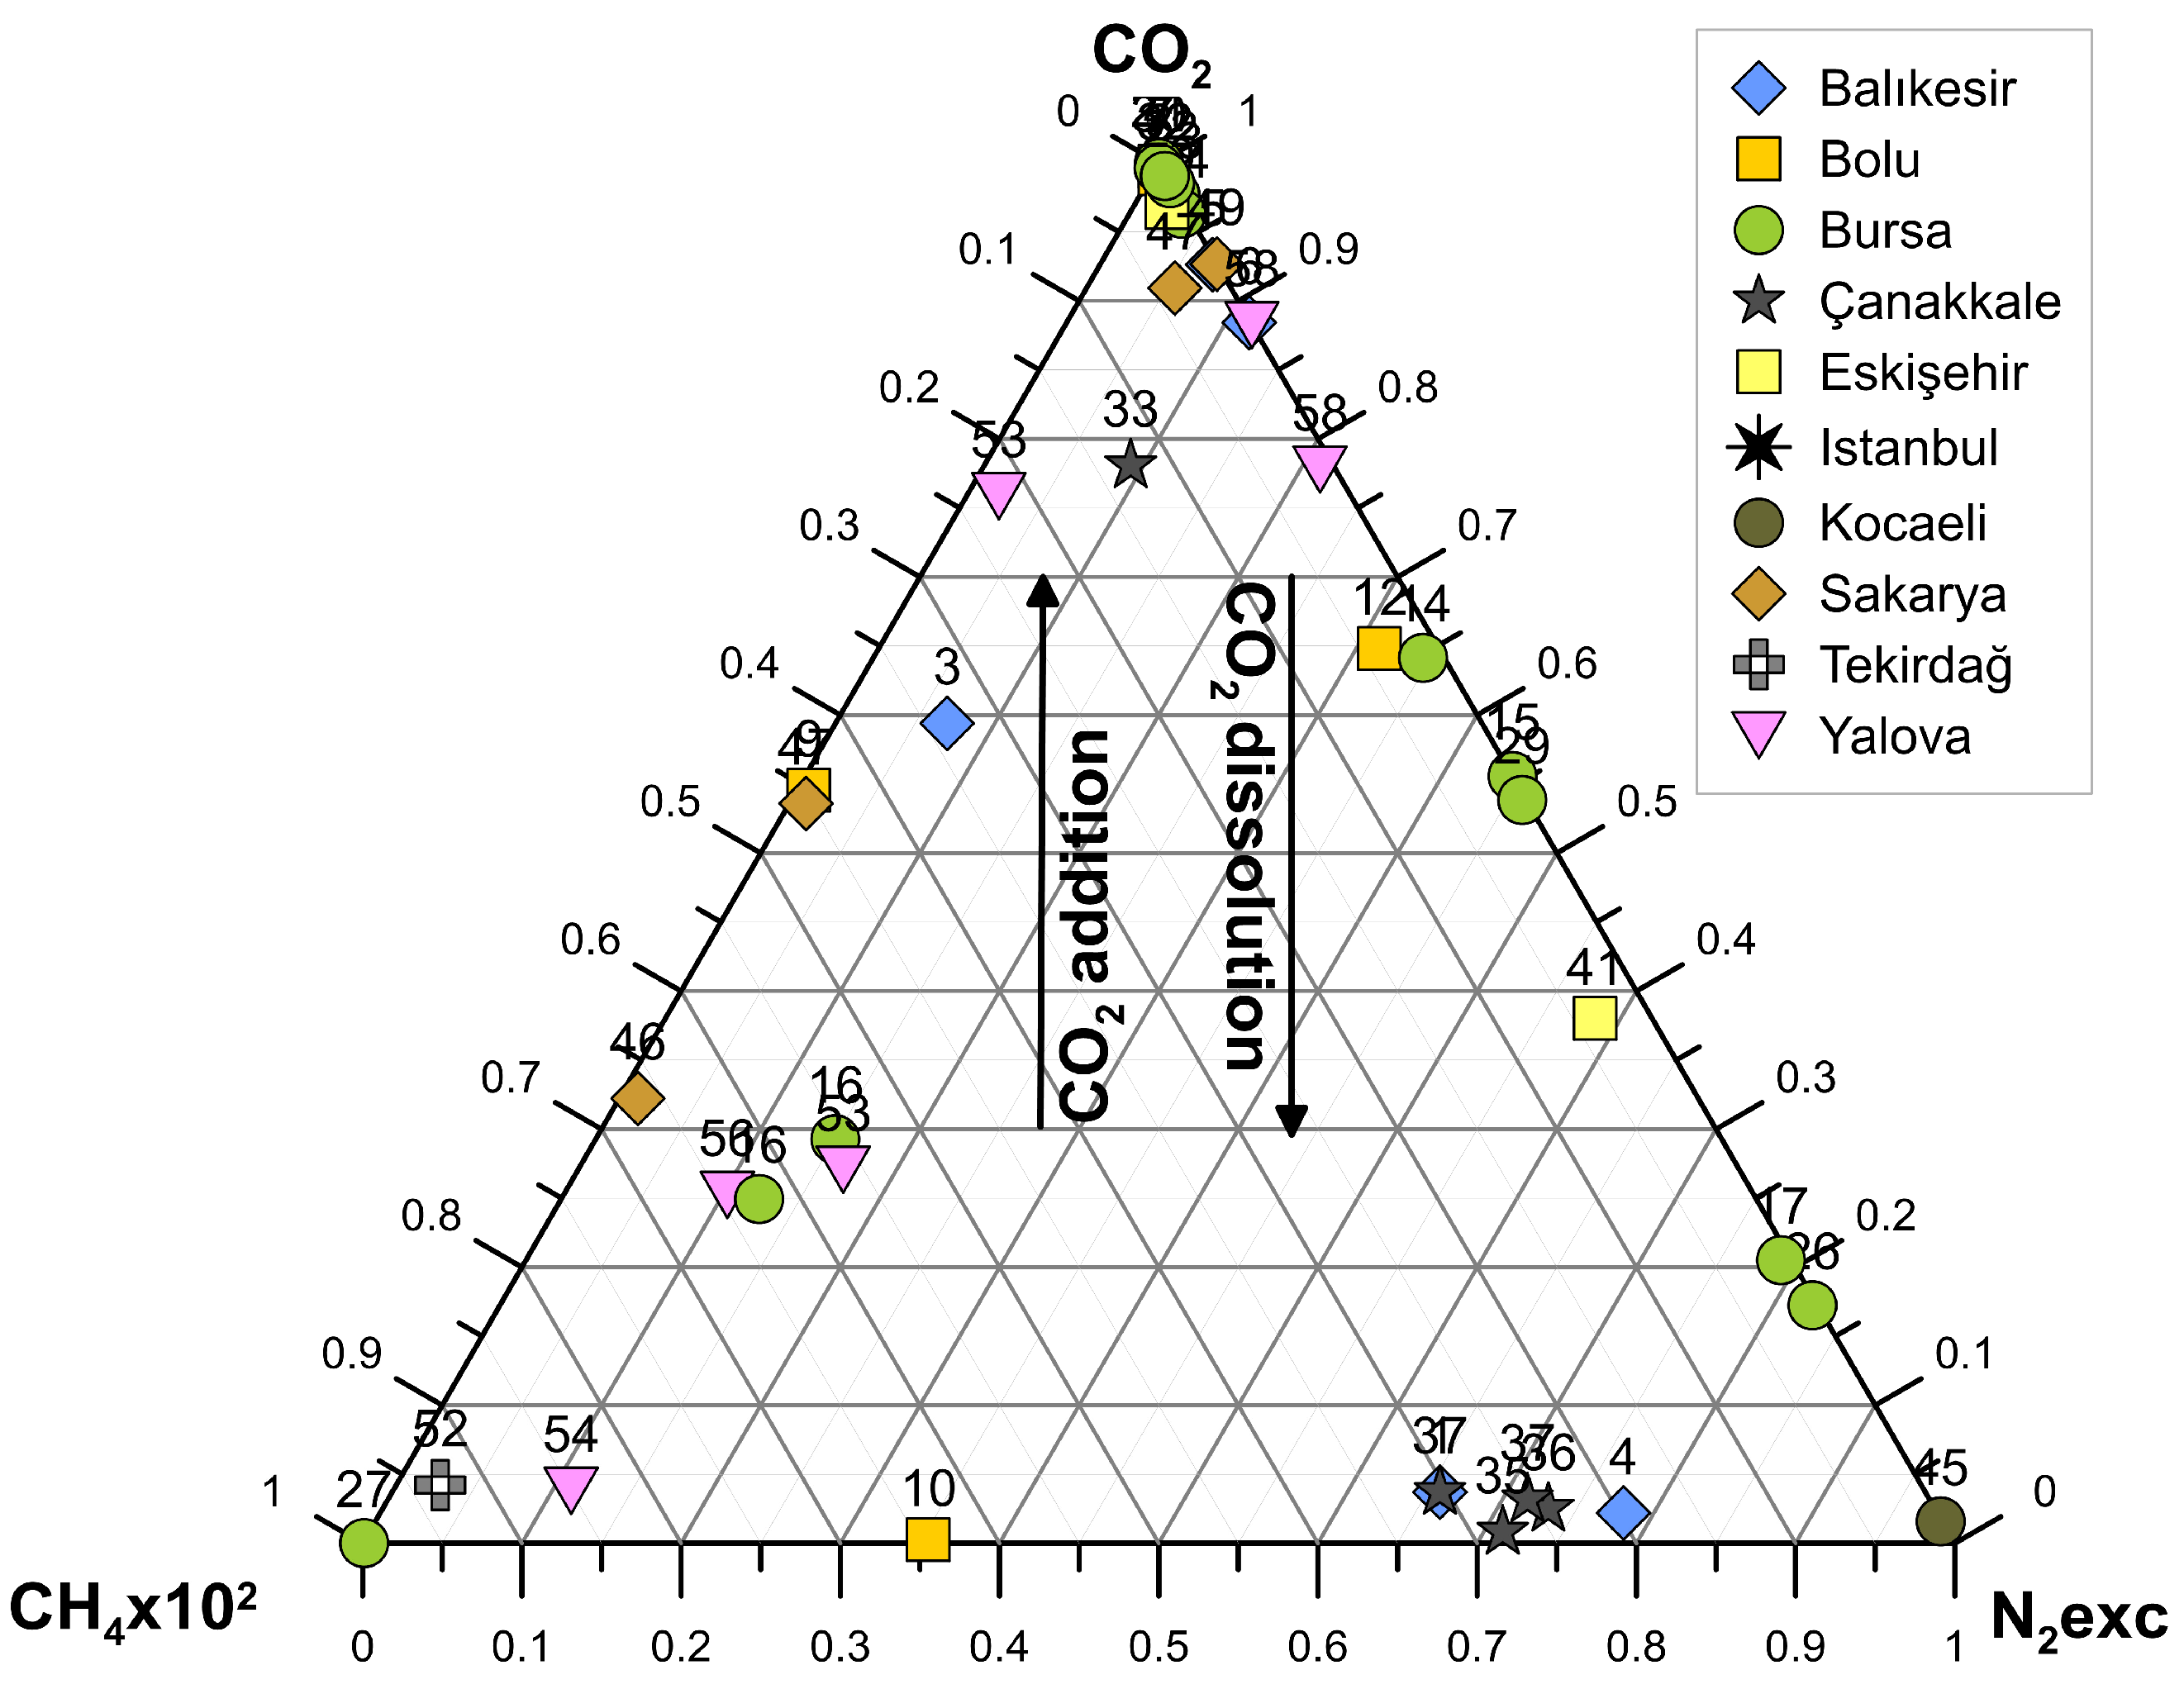
- Gas composition: Bubbling gases are a binary mixture of two end members, namely CO2 and N2. Only a few samples contain CH4 in significant amounts. The increase in N2 and CO2 decreases shows that the chemical composition of the bubbling gases is the result of the combination of two effects: mixing between components of different origin and Gas–Water Interactions (GWIs) that lead to CO2 loss due to dissolution and consequent virtual N2 increase.
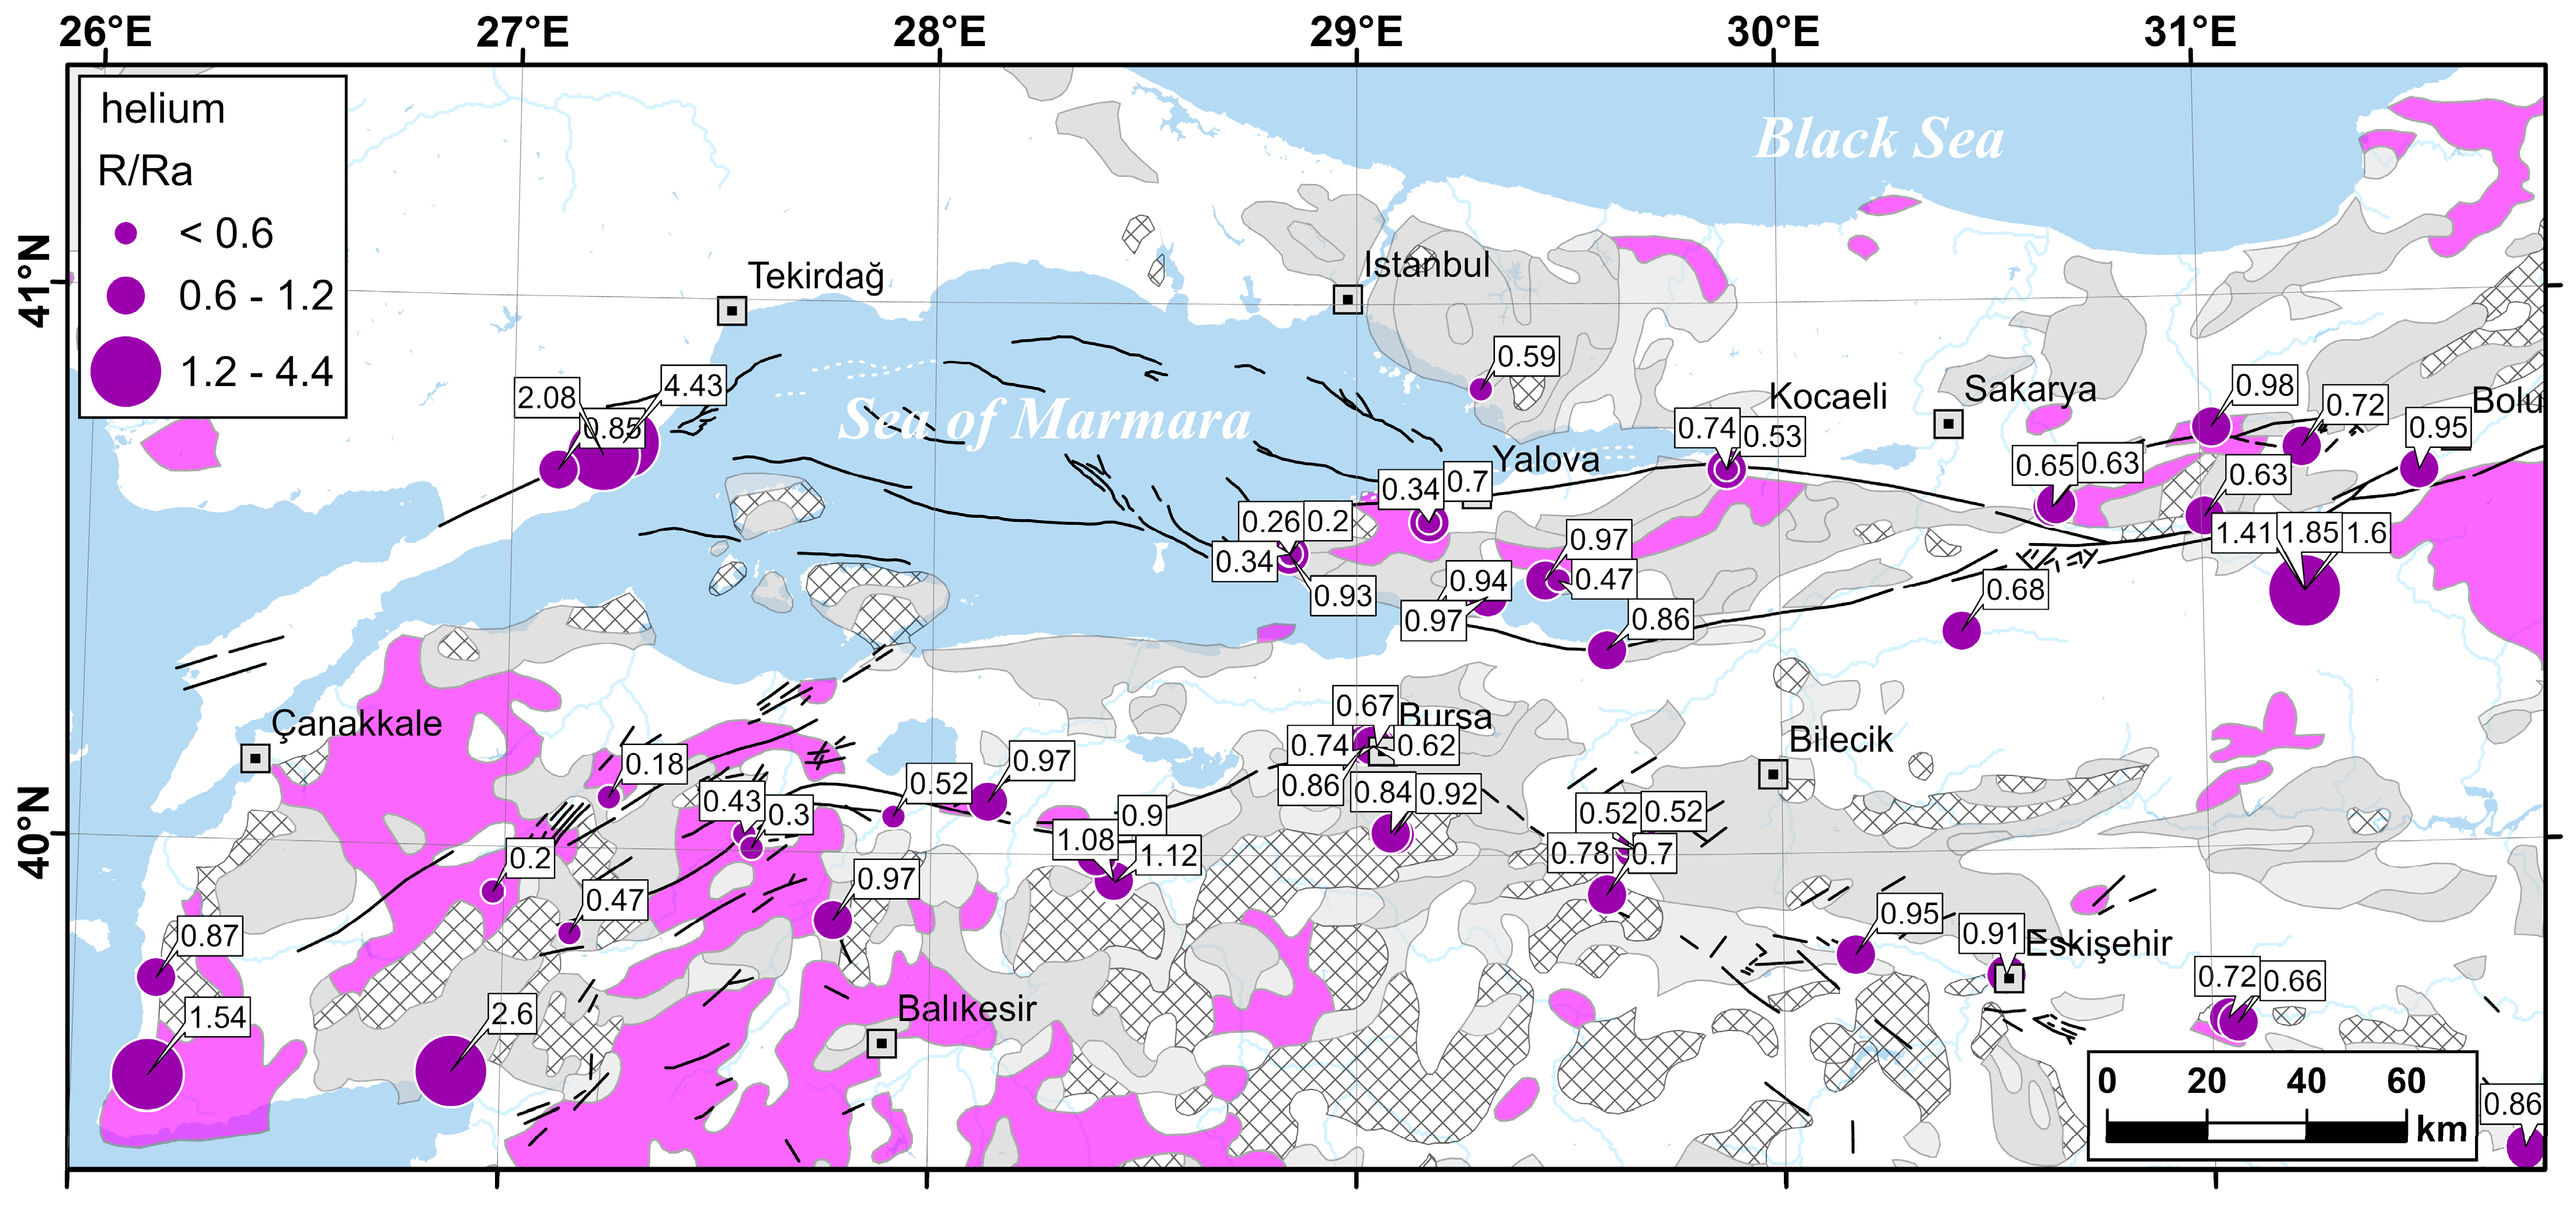
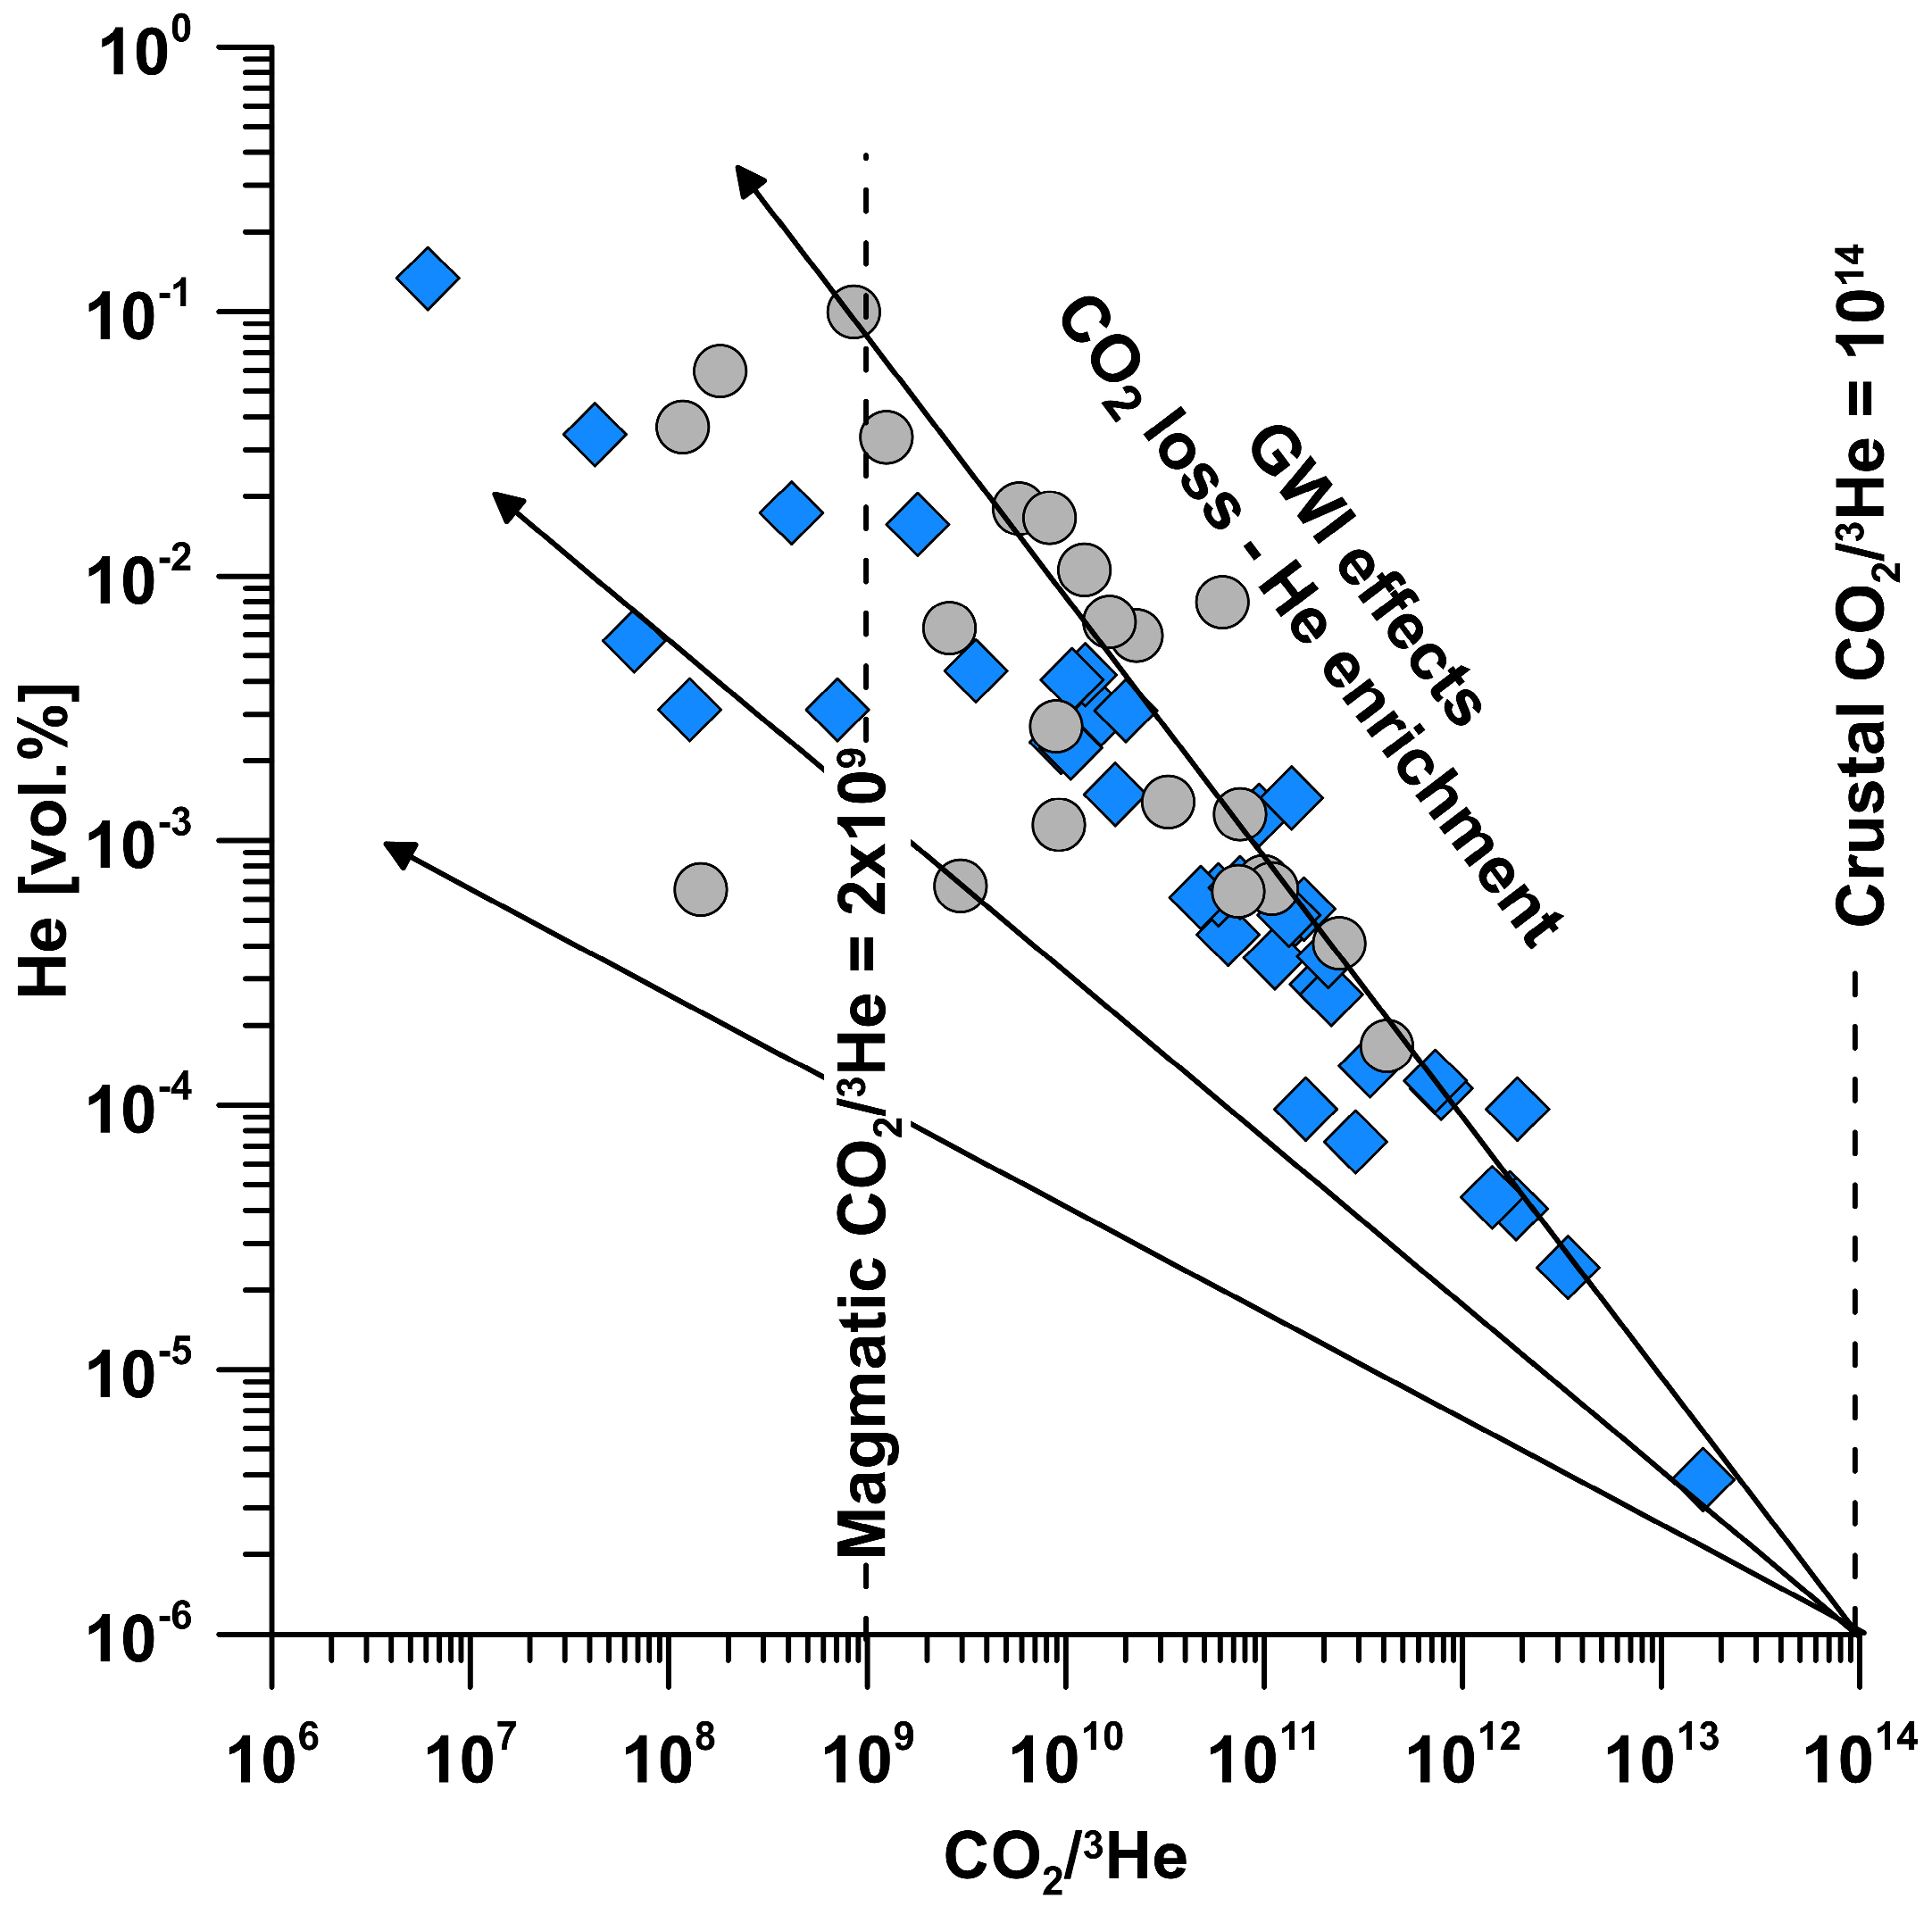
- Helium–carbon systematics: The measured 3He/4He ratios span from 0.11 to 4.43 R/Ra, indicating a widespread mantle contribution at all sampled sites. Mantle helium does not show any obvious relation to the distribution of volcanic rocks. Spatial variations of the 3He/4He isotopic ratios are possibly related to fault segments with different rock permeability. High isotopic ratios do not exclude the presence of magmatic intrusions in the shallow crustal levels.
Author Contributions
Funding
Data Availability Statement
Acknowledgments
Conflicts of Interest
Appendix A
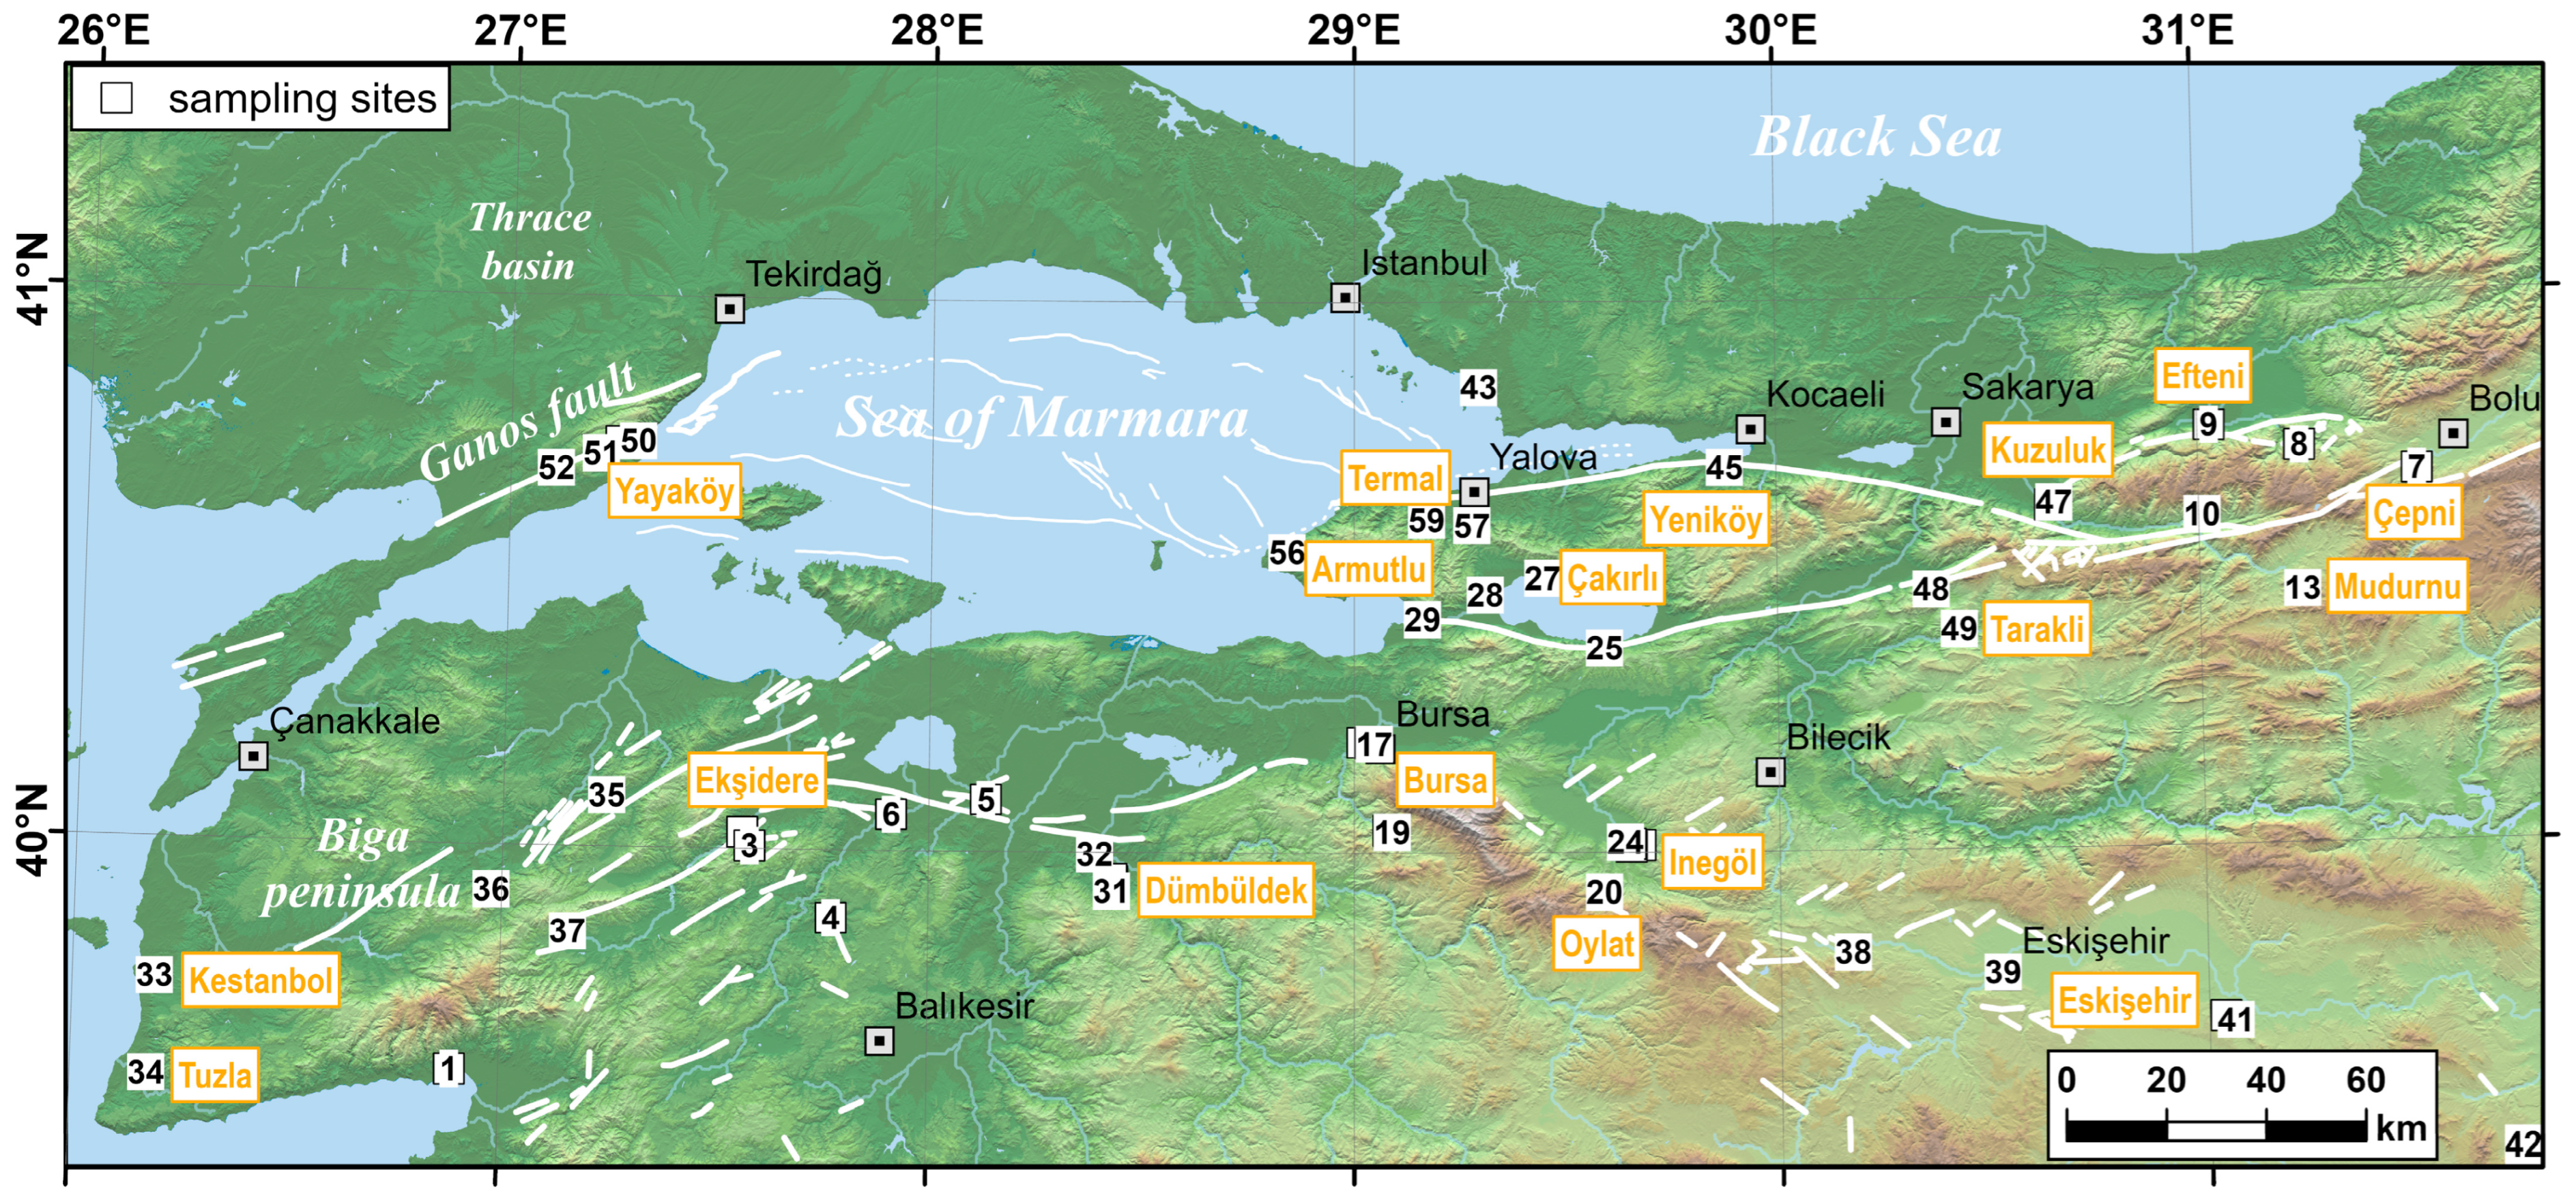
Locations
Appendix B
Appendix B.1. Water Analyses
Appendix B.2. Gas Analyses
Appendix C
Appendix C.1. Water Chemistry

Appendix C.2. Gas Composition
Appendix C.3. Helium Isotopes

| Site | ID | 1984 | 1985 | 1989 | 1990 | 1992 | 1993 | 1995 g | 2000 | 2001 i | 2002 i | 2003 i | 2004 i | 2005 j | 2013 | 2014 |
|---|---|---|---|---|---|---|---|---|---|---|---|---|---|---|---|---|
| Manyas Kizik | 6 | 0.41 k | 0.49 | |||||||||||||
| Derdin | 8 | 0.75 a | 0.75 | 0.61 | 0.59 | |||||||||||
| Efteni | 9 | 1.93 a | 1.83 | 0.71 h 0.81 i | 0.76 | 0.76 | 0.88 | 0.83 | 0.66 | |||||||
| Mudurnu | 11 | 4.78 a | 4.65 | 2.19 h,i | 2.30 | 2.22 | 2.18 | 2.81 | 2.09 | |||||||
| Bursa Çekirge | 14 | 0.52 b | 0.60 b | 0.48 d | 0.48 | 0.46 | ||||||||||
| Bursa Kükürt | 15 | 0.44 c | 0.45 d | 0.54 | 0.46 | |||||||||||
| Oylat | 20 | 0.66 | 0.67 | |||||||||||||
| Keramet | 26 | 0.26 a | 0.29 | 0.34 | 0.29 | |||||||||||
| Gemlik | 29 | 0.05 b | 0.15 f | 0.13 | ||||||||||||
| Kestanbol | 33 | 0.80 k | 0.87 | |||||||||||||
| Tuzla | 34 | 0.42 a | 1.47 e | 1.44 k | 1.55 | |||||||||||
| Tuzla Büyüyk Iç. | 43 | 0.42 | 0.52 | 0.58 | ||||||||||||
| Kuzuluk | 47 | 0.63 d | 0.63 | 0.63 | ||||||||||||
| Sarköy | 50 | 4.85 | 4.80 | |||||||||||||
| Armutlu | 53 | 0.22 a | 0.24 f | 0.41 | 0.25 | 0.22 | ||||||||||
| Yalova Termal | 59 | 0.27 f | 0.29 h,i | 0.29 | 0.28 | 0.32 | 0.28 | 0.29 |
References
- Wang, C.-Y.; Manga, M. Earthquakes and Water; Lecture Notes in Earth Sciences; Springer: Berlin/Heidelberg, Germany, 2010; Volume 114. [Google Scholar]
- Mogi, K.; Mochizuki, H.; Kurokawa, Y. Temperature Changes in an Artesian Spring at Usami in the Izu Peninsula (Japan) and Their Relation to Earthquakes. Tectonophysics 1989, 159, 95–108. [Google Scholar] [CrossRef]
- Malakootian, M.; Nouri, J. Chemical Variations of Ground Water Affected by the Earthquake in Bam Region. Int. J. Environ. Res. 2010, 4, 443–454. [Google Scholar]
- Woith, H.; Wang, R.; Milkereit, C.; Zschau, J.; Maiwald, U.; Pekdeger, A. Heterogeneous Response of Hydrogeological Systems to the Izmit and Duzce (Turkey) Earthquakes of 1999. Hydrogeol. J. 2003, 11, 113–121. [Google Scholar] [CrossRef]
- Heinicke, J.; Braun, T.; Burgassi, P.; Italiano, F.; Martinelli, G. Gas Flow Anomalies in Seismogenic Zones in the Upper Tiber Valley, Central Italy. Geophys. J. Int. 2006, 167, 794–806. [Google Scholar] [CrossRef]
- Hilton, D.R. The Leaking Mantle. Science 2007, 318, 1389–1390. [Google Scholar] [CrossRef]
- Mutlu, H.; Güleç, N.; Hilton, D.R.; Aydın, H.; Halldórsson, S.A. Spatial Variations in Gas and Stable Isotope Compositions of Thermal Fluids around Lake Van: Implications for Crust–Mantle Dynamics in Eastern Turkey. Chem. Geol. 2012, 300, 165–176. [Google Scholar] [CrossRef]
- Woith, H.; Wang, R.; Maiwald, U.; Pekdeger, A.; Zschau, J. On the Origin of Geochemical Anomalies in Groundwaters Induced by the Adana 1998 Earthquake. Chem. Geol. 2013, 339, 177–186. [Google Scholar] [CrossRef]
- Bozkurt, E. Neotectonics of Turkey—A Synthesis. Geodin. Acta 2001, 14, 3–30. [Google Scholar] [CrossRef]
- Şengör, A.M.C.; Tuysuz, O.; Imren, C.; Sakinc, M.; Eyidogan, H.; Gorur, G.; Le Pichon, X.; Rangin, C. The North Anatolian Fault: A New Look. Annu. Rev. Earth Planet. Sci. 2005, 33, 37–112. [Google Scholar] [CrossRef]
- Reilinger, R.; McClusky, S.; Vernant, P.; Lawrence, S.; Ergintav, S.; Cakmak, R.; Ozener, H.; Kadirov, F.; Guliev, I.; Stepanyan, R.; et al. GPS Constraints on Continental Deformation in the Africa-Arabia-Eurasia Continental Collision Zone and Implications for the Dynamics of Plate Interactions. J. Geophys. Res. 2006, 111, 26. [Google Scholar] [CrossRef]
- Tatar, O.; Poyraz, F.; Gürsoy, H.; Cakir, Z.; Ergintav, S.; Akpınar, Z.; Koçbulut, F.; Sezen, F.; Türk, T.; Hastaoğlu, K.Ö.; et al. Crustal Deformation and Kinematics of the Eastern Part of the North Anatolian Fault Zone (Turkey) from GPS Measurements. Tectonophysics 2012, 518–521, 55–62. [Google Scholar] [CrossRef]
- Duman, T.Y.; Çan, T.; Emre, Ö.; Kadirioğlu, F.T.; Baştürk, N.B.; Kılıç, T.; Arslan, S.; Özalp, S.; Kartal, R.F.; Kalafat, D.; et al. Seismotectonic Database of Turkey. Bull. Earthq. Eng. 2016, 16, 3277–3316. [Google Scholar] [CrossRef]
- Armijo, R.; Meyer, B.; Navarro, S.; King, G.; Barka, A. Asymmetric Slip Partitioning in the Sea of Marmara Pull-Apart: A Clue to Propagation Processes of the North Anatolian Fault? Terra Nova 2002, 14, 80–86. [Google Scholar] [CrossRef]
- Flerit, F.; Armijo, R.; King, G.C.P.; Meyer, B.; Barka, A. Slip Partitioning in the Sea of Marmara Pull-Apart Determined from Gps Velocity Vectors. Geophys. J. Int. 2003, 154, 1–7. [Google Scholar] [CrossRef]
- Karakaş, Ç.; Armijo, R.; Lacassin, R.; Suc, J.; Melinte-Dobrinescu, M.C. Crustal Strain in the Marmara Pull-Apart Region Associated with the Propagation Process of the North Anatolian Fault. Tectonics 2018, 37, 1507–1523. [Google Scholar] [CrossRef]
- Ambraseys, N.; Finkel, C. Long-Term Seismicity of Istanbul and of the Marmara Sea Region. Terra Nova 1991, 3, 527–539. [Google Scholar] [CrossRef]
- Ambraseys, N.N. The Seismicity of The Marmara Sea Area 1800–1899. J. Earthq. Eng. 2000, 4, 377–401. [Google Scholar] [CrossRef]
- Ambraseys, N.N.; Jackson, J.A. Seismicity of the Sea of Marmara (Turkey) since 1500. Geophys. J. Int. 2000, 141, F1–F6. [Google Scholar] [CrossRef]
- Ambraseys, N. The Seismic Activity of the Marmara Sea Region over the Last 2000 Years. Bull. Seism. Soc. Am. 2002, 92, 1–18. [Google Scholar] [CrossRef]
- Şaroğlu, F.; Emre, Ö.; Kuscu, I. Active Fault Map of Turkey; MTA: Ankara, Türkiye, 1992. [Google Scholar]
- Stein, R.S.; Barka, A.A.; Dieterich, J.H. Progressive Failure on the North Anatolian Fault since 1939 by Earthquake Stress Triggering. Geophys. J. Int. 1997, 128, 594–604. [Google Scholar] [CrossRef]
- Barka, A. The 17 August 1999 Izmit Earthquake. Science 1999, 285, 1858–1859. [Google Scholar] [CrossRef]
- Reilinger, R.E.; Ergintav, S.; Buergmann, R.; McClusky, S.; Lenk, O.; Barka, A.; Gurkan, O.; Hearn, L.; Feigl, K.L.; Cakmak, R.; et al. Coseismic and Postseismic Fault Slip for the 17 August 1999, M = 7.5, Izmit, Turkey Earthquake. Science 2000, 289, 1519–1524. [Google Scholar] [CrossRef] [PubMed]
- Tibi, R.; Bock, G.; Xia, Y.; Baumbach, M.; Grosser, H.; Milkereit, C.; Karakisa, S.; Zünbül, S.; Kind, R.; Zschau, J. Rupture Processes of the 1999 August 17 Izmit and November 12 Düzce (Turkey) Earthquakes. Geophys. J. Int. 2001, 144, F1–F7. [Google Scholar] [CrossRef]
- Ambraseys, N.N.; Finkel, C.F. The Saros-Marmara Earthquake of 9 August 1912. Earthq. Eng. Struct. Dyn. 1987, 15, 189–211. [Google Scholar] [CrossRef]
- Polonia, A.; Gasperini, L.; Amorosi, A.; Bonatti, E.; Bortoluzzi, G.; Çagatay, N.; Capotondi, L.; Cormier, M.-H.; Gorur, N.; McHugh, C.; et al. Holocene Slip Rate of the North Anatolian Fault beneath the Sea of Marmara. Earth Planet. Sci. Lett. 2004, 227, 411–426. [Google Scholar] [CrossRef]
- Ergintav, S.; Reilinger, R.E.; Çakmak, R.; Floyd, M.; Cakir, Z.; Doğan, U.; King, R.W.; McClusky, S.; Özener, H. Istanbul’s Earthquake Hot Spots: Geodetic Constraints on Strain Accumulation Along Faults in the Marmara Seismic Gap. Geophys. Res. Lett. 2014, 41, 5783–5788. [Google Scholar] [CrossRef]
- Yilmaz, Y. Comparison of Young Volcanic Associations of Western and Eastern Anatolia Formed Under a Compressional Regime: A review. J. Volcanol. Geotherm. Res. 1990, 44, 69–87. [Google Scholar] [CrossRef]
- Şimşek, Ş. Geothermal Potential in Northwestern Turkey. In Active Tectonics of Northwestern Anatolia; Schindler, C., Pfister, M., Eds.; the Marmara Poly-Project; a Multidisciplinary Approach by Space-Geodesy, Geology, Hydrogeology, Geothermics and Seismology; CHE: Zurich, Switzerland, 1997; pp. 111–123. [Google Scholar]
- Hoşgörmez, H.; Yalçın, M.N. Gas-Source Rock Correlation in Thrace Basin, Turkey. Mar. Pet. Geol. 2005, 22, 901–916. [Google Scholar] [CrossRef]
- Pfister, M.; Rybach, L.; Simsek, S. Geothermal Reconnaissance of the Marmara Sea Region (NW Turkey): Surface Heat Flow Density in an Area of Active Continental Extension. Tectonophysics 1998, 291, 77–89. [Google Scholar] [CrossRef]
- Yuce, G.; Italiano, F.; Yasin, D.; Taskiran, L.; Gulbay, A.H. Assessment of the Origin and Geothermal Potential of the Thermal Waters by Hydro-Isotope Geochemistry: Eskisehir Province, Turkey. Isot. Environ. Health Stud. 2017, 53, 198–211. [Google Scholar] [CrossRef]
- Balderer, W.; Greber, E.; Imbach, T.; Rauert, W.; Trimborn, P.; Guler, S. Environmental Isotope Study of Thermal, Mineral and Normal Ground Water within the Bursa and Kuzuluk/Adapazari Areas of Northwestern Turkey. In Isotope Techniques in Water Resources Development 1991; IAEA-SM: Vienna, Austria, 1991; pp. 1–4. [Google Scholar]
- Greber, E. Deep Circulation of Co2-Rich Paleowaters in Deep Seismically Active Zone (Kuzuluk/Adapazarı, Northwestern Turkey). Geothermics 1994, 23, 151–174. [Google Scholar] [CrossRef]
- Eisenlohr, T. The Thermal Springs of the Armutlu Peninsula (Nw Turkey) and Their Relationship to Geology and Tectonic. In Active Tectonics of Northwestern Anatolia; Schindler, C., Pfister, M., Eds.; the Marmara Poly-Project; a Multidisciplinary Approach by Space-Geodesy, Geology, Hydrogeology, Geothermics and Seismology; CHE: Zurich, Switzerland, 1997; pp. 197–228. [Google Scholar]
- Pasvanoğlu, S. Hydrogeochemical and Isotopic Investigation of the Bursa-Oylat Thermal Waters, Turkey. Environ. Earth Sci. 2011, 64, 1157–1167. [Google Scholar] [CrossRef]
- Imbach, T. Deep Groundwater Circulation in the Tectonically Active Area of Bursa, Northwest Anatolia, Turkey. Geothermics 1997, 26, 251–278. [Google Scholar] [CrossRef]
- Tut Haklidir, F. Hydrogeochemical Evaluation of Thermal, Mineral and Cold Waters between Bursa City and Mount Uludaǧ in the South Marmara Region of Turkey. Geothermics 2013, 48, 132–145. [Google Scholar] [CrossRef]
- Yalcin, T. Hydrogeological Investigations of the Gönen and Eksidere Thermal Waters (Nw Turkey). In Active Tectonics of Northwestern Anatolia; Schindler, C., Pfister, M., Eds.; the Marmara Poly-Project; a Multidisciplinary Approach by Space-Geodesy, Geology, Hydrogeology, Geothermics and Seismology; CHE: Zurich, Switzerland, 1997; pp. 275–300. [Google Scholar]
- Yalcin, T. Geochemical Characterization of the Biga Peninsula Thermal Waters (Nw Turkey). Aquat. Geochem. 2007, 13, 75–93. [Google Scholar] [CrossRef]
- Mutlu, H. Constraints on the Origin of the Balikesir Thermal Waters (Turkey) from Stable Isotope (Delta O-18, Delta D, Delta C-13, Delta S-34) and Major-Trace Element Compositions. Turk. J. Earth Sci. 2007, 16, 13–32. [Google Scholar]
- Sanliyuksel, D.; Baba, A. Hydrogeochemical and Isotopic Composition of a Low-Temperature Geothermal Source in Northwest Turkey: Case Study of Kirkgecit Geothermal Area. Environ. Earth Sci. 2011, 62, 529–540. [Google Scholar] [CrossRef]
- Mützenberg, S. Nature and Origin of the Thermal Springs in the Tuzla Area, Western Anatolia, Turkey. In Active Tectonics of Northwestern Anatolia; Schindler, C., Pfister, M., Eds.; the Marmara Poly-Project; a Multidisciplinary Approach by Space-Geodesy, Geology, Hydrogeology, Geothermics and Seismology; CHE: Zurich, Switzerland, 1997; pp. 301–320. [Google Scholar]
- Baba, A.; Yuce, G.; Deniz, O.; Ugurluoglu, D.Y. Hydrochemical and Isotopic Composition of Tuzla Geothermal Field (Canakkale-Turkey) and Its Environmental Impacts. Environ. Forensics 2009, 10, 144–161. [Google Scholar] [CrossRef]
- Doğan, T.; Sumino, H.; Nagao, K.; Notsu, K.; Tuncer, M.K.; Çelik, C. Adjacent Releases of Mantle Helium and Soil CO2 from Active Faults: Observations from the Marmara Region of the North Anatolian Fault zone, Turkey. Geochem. Geophys. Geosyst. 2009, 10, Q11009. [Google Scholar] [CrossRef]
- Géli, L.; Henry, P.; Grall, C.; Tary, J.-B.; Lomax, A.; Batsi, E.; Riboulot, V.; Cros, E.; Gürbüz, C.; Işık, S.E.; et al. Gas and Seismicity within the Istanbul Seismic Gap. Sci. Rep. 2018, 8, 6819. [Google Scholar] [CrossRef]
- Weiss, R. Carbon Dioxide in Water and Seawater: The Solubility of a Non-Ideal Gas. Mar. Chem. 1974, 2, 203–215. [Google Scholar] [CrossRef]
- Holocher, J.; Peeters, F.; Aeschbach-Hertig, W.; Hofer, M.; Brennwald, M.; Kinzelbach, W.; Kipfer, R. Experimental Investigations on the Formation of Excess Air in Quasi-Saturated Porous Media. Geochim. Cosmochim. Acta 2002, 66, 4103–4117. [Google Scholar] [CrossRef]
- White, W.B. Chapter 6—Springwater Geochemistry. In Groundwater Hydrology of Springs; Kresic, N., Stevanovic, Z., Eds.; Butterworth-Heinemann: Boston, MA, USA, 2010; pp. 231–268. [Google Scholar]
- Giménez, E.; Morell, I. Hydrogeochemical Analysis of Salinization Processes in the Coastal Aquifer of Oropesa (Castellon, Spain). Environ. Geol. 1997, 29, 118–131. [Google Scholar] [CrossRef]
- White, W.M. Geochemistry; Wiley-Blackwell: Hoboken, NJ, USA, 2005. [Google Scholar]
- Navarre-Sitchler, A.; Thyne, G. Effects of Carbon Dioxide on Mineral Weathering Rates at Earth Surface Conditions. Chem. Geol. 2007, 243, 53–63. [Google Scholar] [CrossRef]
- Stanton, J.S.; Anning, D.W.; Brown, C.J.; Moore, R.B.; McGuire, V.L.; Qi, S.L.; Harris, A.C.; Dennehy, K.F.; McMahon, P.B.; Degnan, J.R.; et al. Brackish groundwater in the United States. In Professional Paper; US Geological Survey: Reston, VA, USA, 2017; p. 185. [Google Scholar] [CrossRef]
- Rhoades, J.D.; Kandish, A.; Mashali, A.M. The Use of Saline Waters for Crop Production. 1992. Available online: http://www.fao.org/3/a-t0667e.pdf (accessed on 1 February 2025).
- Balderer, W. Mechanisms and Porcesses of Groundwater Circulation in Tectonically Active Areas. In Active Tectonics of Northwestern Anatolia; Schindler, C., Pfister, M., Eds.; the Marmara Poly-Project; a Multidisciplinary Approach by Space-Geodesy, Geology, Hydrogeology, Geothermics and Seismology; CHE: Zurich, Switzerland, 1997; pp. 375–415. [Google Scholar]
- Mutlu, H.; Güleç, N. Hydrogeochemical Outline of Thermal Waters and Geothermometry Applications in Anatolia (Turkey). J. Volcanol. Geotherm. Res. 1998, 85, 495–515. [Google Scholar] [CrossRef]
- Ellis, A.; Mahon, W. Chemistry and Geothermal Systems; Academic Press: New York, NY, USA, 1977. [Google Scholar]
- Bigham, J.M.; Nordstrom, D.K. Iron and Aluminum Hydroxysulfates from Acid Sulfate Waters. Rev. Miner. Geochem. 2000, 40, 351–403. [Google Scholar] [CrossRef]
- Craig, H. Isotopic Variations in Meteoric Waters. Science 1961, 133, 1702–1703. [Google Scholar] [CrossRef]
- Gat, J.R.; Carmi, I. Evolution of the Isotropic Composition of Atmospheric Waters in the Mediterranean Sea Area. J. Geophys. Res. 1970, 75, 3039–3048. [Google Scholar] [CrossRef]
- Hatvani, I.G.; Smati, A.E.; Erdélyi, D.; Szatmári, G.; Vreča, P.; Kern, Z. Modeling the Spatial Distribution of the Meteoric Water Line of Modern Precipitation across the Broader Mediterranean region. J. Hydrol. 2023, 617, 128925. [Google Scholar] [CrossRef]
- Rozanski, K.; Araguás-Araguás, L.; Gonfiantini, R. Isotopic Patterns in Modern Global Precipitation. In Climate Change in Continental Isotopic Records; AGU Publications: Washington, DC, USA, 1993; pp. 1–36. [Google Scholar]
- Faure, G. Principles of Isotope Geology, 2nd ed.; Wiley: New York, NY, USA, 1986. [Google Scholar]
- Javoy, M.; Pineau, F.; Delorme, H. Carbon and Nitrogen Isotopes in the Mantle. Chem. Geol. 1986, 57, 41–62. [Google Scholar] [CrossRef]
- Sano, Y.; Marty, B. Origin of Carbon in Fumarolic Gas from Island Arcs. Chem. Geol. 1995, 119, 265–274. [Google Scholar] [CrossRef]
- Italiano, F.; Martinelli, G.; Plescia, P. CO2 Degassing over Seismic Areas: The Role of Mechanochemical Production at the Study Case of Central Apennines. Pure Appl. Geophys. 2008, 165, 75–94. [Google Scholar] [CrossRef]
- Burnard, P.; Bourlange, S.; Henry, P.; Géli, L.; Tryon, M.D.; Natal’in, B.; Sengör, A.M.C.; Özeren, M.S.; Çagatay, M.N. Constraints on Fluid Origins and Migration Velocities Along the Marmara Main Fault (Sea of Marmara, Turkey) Using Helium Isotopes. Earth Planet. Sci. Lett. 2012, 341–344, 68–78. [Google Scholar] [CrossRef]
- Italiano, F.; Martelli, M.; Martinelli, G.; Nuccio, P.M. Geochemical Evidence of Melt Intrusions Along Lithospheric Faults of the Southern Apennines, Italy: Geodynamic and Seismogenic Implications. J. Geophys. Res. Solid Earth 2000, 105, 13569–13578. [Google Scholar] [CrossRef]
- Woith, H.; Zschau, J.; Yilmaz, R.; Karakisa, S.; Zünbül, S.; Baumbach, M.; Grosser, H.; Milkereit, C.; Lang, D.H.; Raschke, M.; et al. Multidisciplinary Investigations of the German Task Force for Earthquakes Related to the Izmit Earthquake of August 17, 1999 and the Düzce Earthquake of November 12, 1999. In The 1999 Izmit and Düzce Earthquakes: Preliminary Results; Barka, A., Kozaci, Ö., Ayküz, S., Altunel, E., Eds.; Istanbul Technical University: Istanbul, Türkiye, 2000; pp. 233–245. [Google Scholar]
- Italiano, F.; Martinelli, G.; Bonfanti, P.; Caracausi, A. Long-Term (1997-2007) Geochemical Monitoring of Gases from the Umbria-Marche Region. Tectonophysics 2009, 476, 282–296. [Google Scholar] [CrossRef]
- Wang, C.-Y.; Manga, M. New Streams and Springs after the 2014 Mw6.0 South Napa Earthquake. Nat. Commun. 2015, 6, 7597. [Google Scholar] [CrossRef] [PubMed]
- Sato, T.; Kazahaya, K.; Matsumoto, N.; Takahashi, M. Deep Groundwater Discharge after the 2011 Mw 6.6 Iwaki Earthquake, Japan. Earth Planets Space 2020, 72, 54. [Google Scholar] [CrossRef]
- Epstein, S.A.; Mayeda, T.K. Variation of O18 Content of Waters from Natural Sources. Geochim. Cosmochim. Acta 1953, 4, 213–224. [Google Scholar] [CrossRef]
- Kendall, C.; Coplen, T.B. Multi-Sample Conversion of Water to Hydrogen by Zinc for Stable Isotope Determination. Anal. Chem. 1985, 57, 1437–1440. [Google Scholar] [CrossRef]
- Yuce, G.; Italiano, F.; D’Alessandro, W.; Yalcin, T.; Yasin, D.; Gulbay, A.; Ozyurt, N.; Rojay, B.; Karabacak, V.; Bellomo, S.; et al. Origin and Interactions of Fluids Circulating over the Amik Basin (Hatay, Turkey) and Relationships with the Hydrologic, Geologic and Tectonic Settings. Chem. Geol. 2014, 388, 23–39. [Google Scholar] [CrossRef]
- Parkhurst, D.L.; Appelo, C.A.J. User’s Guide to Phreeqc (Version 2): A Computer Program for Speciation Batch-Reaction, One-Dimensional Transport and Inverse Geochemical Calculations; US Geological Survey: Denver, CO, USA, 1999; p. 309.
- Italiano, F.; Bonfanti, P.; Ditta, M.; Petrini, R.; Slejko, F. Helium and Carbon Isotopes in the Dissolved Gases of Friuli Region (Ne Italy): Geochemical Evidence of Co2 Production and Degassing over a Seismically Active Area. Chem. Geol. 2009, 266, 76–85. [Google Scholar] [CrossRef]
- Italiano, F.; Yuce, G.; Uysal, I.; Gasparon, M.; Morelli, G. Insights into Mantle-Type Volatiles Contribution from Dissolved Gases in Artesian Waters of the Great Artesian Basin, Australia. Chem. Geol. 2014, 378, 75–88. [Google Scholar] [CrossRef]
- Sano, Y.; Wakita, H. Precise Measurement of Helium Isotopes in Terrestrial Gases. Bull. Chem. Soc. Jpn. 1988, 61, 1153–1157. [Google Scholar] [CrossRef]
- Hilton, D.R. The Helium and Carbon Isotope Systematics of a Continental Geothermal System: Results from Monitoring Studies at Long Valley Caldera (California, USA). Chem. Geol. 1996, 127, 269–295. [Google Scholar] [CrossRef]
- Italiano, F.; Martinelli, G.; Nuccio, P.M. Anomalies of Mantle-Derived Helium during the 1997-1998 Seismic Swarm of Umbria-Marche, Italy. Geophys. Res. Lett. 2001, 28, 839–842. [Google Scholar] [CrossRef]
- Pawlewicz, M.J.; Steinshouer, D.W.; Gautier, D.L. Map Showing Geology, Oil and Gas Fields, and Geologic Provinces of Europe Including Turkey. In Open-File Report; USGS: Reston, VA, USA, 1997. [Google Scholar]
- Stone, J.O.H. Helium Isotopic Tracing of Fluids in the Lithosphere. Ph.D. Thesis, University of Cambridge, Cambridge, UK, 1986. [Google Scholar]
- Gülec, N. Helium-3 Distribution in Western Turkey. Bull. Miner. Res. Explor. Inst. Turk. 1988, 108, 35–42. [Google Scholar]
- Imbach, T. Thermalwässer von Bursa. Geologische und Hydrogeologische Untersuchungen am Berg Uludag (Nw Türkei). Ph.D. Thesis, ETH Zürich, Zürich, Switzerland, 1992. [Google Scholar]
- Greber, E. Das Geothermalfeld von Kuzuluk/Adapazari (Nw Türkei). Ph.D. Thesis, ETH Zürich, Zürich, Switzerland, 1992. [Google Scholar]
- Eisenlohr, T. Die Thermalwässer der Armutlu-Halbinsel (Nw Türkei) und Deren Beziehung zu Geologie und Aktiver Tektonik. Ph.D. Thesis, ETH Zürich, Zürich, Switzerland, 1995. [Google Scholar]
- Ercan, T.; Matsuda, J.I.; Nagao, K.; Kita, I. Noble Gas Isotopic Compositions in Gas and Water Samples from Anatolia. In Geology of the Black Sea Region; Erler, A., Ed.; MTA: Ankara, Turkey, 1995; pp. 197–206. [Google Scholar]
- Gülec, N.; Hilton, D.R.; Mutlu, H. Helium Isotope Variations in Turkey; Relationship to Tectonics, Volcanism and Recent Seismic Activities. Chem. Geol. 2002, 187, 129–142. [Google Scholar] [CrossRef]
- De Leeuw, G.; Hilton, D.; Güleç, N.; Mutlu, H. Regional and Temporal Variations in Co2/He-3, He-3/He-4 and Delta C-13 Along the North Anatolian Fault Zone, Turkey. Appl. Geochem. 2010, 25, 524–539. [Google Scholar] [CrossRef]
- Mutlu, H.; Güleç, N.; Hilton, D.R. Helium-Carbon Relationships in Geothermal Fluids of Western Anatolia, Turkey. Chem. Geol. 2008, 247, 305–321. [Google Scholar] [CrossRef]


| ID | Lon | Lat | mNN | Area | Site | Type | Date | wT | EC | pH | EhSHE | Oxy | Gas |
|---|---|---|---|---|---|---|---|---|---|---|---|---|---|
| 1 | 26.8857 | 39.5894 | 11 | Balıkesir | Edremit Güre IGJ-1 | well 167 m | 03.09.2014 | 50.7 | 1114 | 8.59 | 28 | 1.2 | |
| 2 | 27.5614 | 40.0295 | 250 | Balıkesir | Ekşidere | spring | 03.09.2014 | 37.9 | 373 | 7.39 | 162 | 2.1 | |
| 3 | 27.5790 | 40.0050 | 225 | Balıkesir | Ekşidere “Gencli Su” | Çesme | 03.09.2014 | 19.3 | 198 | 3.87 | 461 | 2.5 | |
| 4 | 27.7719 | 39.8761 | 130 | Balıkesir | Ilica (Balya) | spring | 29.05.2013 | 55.4 | 1193 | 8.12 | 189 | x | |
| 5 | 28.1330 | 40.0939 | 20 | Balıkesir | Ilicaboğazi Susurluk | spring | 30.05.2013 | 58.6 | 3170 | 6.70 | |||
| 04.09.2014 | 53.0 | 3340 | 6.73 | 1.7 | |||||||||
| 6 | 27.9106 | 40.0654 | 34 | Balıkesir | Kızık (Manyas) | well 30 m | 30.05.2013 | 51.1 | 1807 | 6.64 | 241 | ||
| 7 | 31.5189 | 40.6746 | 821 | Bolu | Çepni Aci Su | spring | 04.06.2013 | 21.5 | 1957 | 6.16 | 429 | 0.3 | x |
| 8 | 31.2414 | 40.7212 | 423 | Bolu | Derdin | spring | 04.06.2013 | 30.5 | 8180 | 6.67 | 118 | 1.1 | x |
| 9 | 31.0279 | 40.7607 | 136 | Bolu | Efteni Kapl. | spring | 04.06.2013 | 42.5 | 3130 | 6.40 | 59 | 0.1 | x |
| 10 | 31.0074 | 40.5987 | 572 | Bolu | Ilica (Taşkesti) | well | 05.06.2013 | 59.8 | 1410 | 8.70 | 44 | ||
| 11 | 31.2401 | 40.4591 | 1044 | Bolu | Mudurnu Babas | well 125 m, artes. | 05.06.2013 | 38.1 | 1186 | 6.43 | 214 | 0.7 | |
| 12 | 31.2398 | 40.4595 | 1055 | Bolu | Mudurnu Babas NW | well 250 m, artes. | 05.06.2013 | 39.4 | 1178 | 6.52 | 139 | 1.9 | x |
| 13 | 31.2414 | 40.4604 | 1063 | Bolu | Mudurnu Babas NE | well 400 m, artes. | 05.06.2013 | 40.2 | 1174 | 6.37 | 184 | 0.1 | |
| 14 | 29.0183 | 40.2001 | 224 | Bursa | Çekirge Vakifbahce | spring | 30.05.2013 | 46.1 | 567 | 6.96 | 241 | ||
| 04.09.2014 | 46.5 | 601 | 7.04 | 342 | 1.2 | ||||||||
| 15 | 29.0368 | 40.1989 | 143 | Bursa | Kükürtlü Uni Hospital | spring | 03.06.2013 | 64.3 | 1407 | 6.65 | 224 | ||
| 08.09.2014 | 62.9 | 1430 | 6.84 | −21 | 3.9 | ||||||||
| 16 | 29.0404 | 40.1985 | 127 | Bursa | Kükürtlü BK2 | well 400 m, artes. | 03.06.2013 | 18.5 | 1305 | 7.65 | −26 | 0.1 | x |
| 08.09.2014 | 25.7 | 1141 | 8.24 | −286 | 0.3 | x | |||||||
| 17 | 29.0466 | 40.1973 | 135 | Bursa | Kükürtlü BJ-3 | well 750 m, artes. | 03.06.2013 | 16.5 | 667 | 8.29 | −56 | 1.9 | |
| 18 | 29.0795 | 40.0403 | 566 | Bursa | Çaybaşi Uludağ MS | well 32 m | 05.09.2014 | 22.2 | 2179 | 6.37 | 152 | 3.9 | |
| 19 | 29.0884 | 40.0372 | 590 | Bursa | Çaybaşi Özkaynak MS | spring | 08.09.2014 | 20.1 | 1307 | 6.08 | 213 | 3.3 | |
| 20 | 29.5863 | 39.9274 | 711 | Bursa | Oylat Eski Hamam | spring | 10.06.2013 | 40.7 | 735 | 7.38 | 394 | 4.2 | |
| 21 | 29.6715 | 40.0128 | 465 | Bursa | Özlüce “Suyu Çesme” | Çesme | 10.06.2013 | 15.8 | 2510 | 6.22 | 254 | 1.5 | |
| 22 | 29.6510 | 40.0100 | 358 | Bursa | Kınık Maden Suyu | well | 10.06.2013 | 14.5 | 2300 | 6.46 | 294 | 3.6 | |
| 23 | 29.6489 | 40.0151 | 353 | Bursa | Kınık Maden Suyu N | well, artesian | 10.06.2013 | 17.2 | 6510 | 6.58 | 179 | 0.2 | x |
| 24 | 29.6362 | 40.0181 | 370 | Bursa | Çitli (Inegöl) | Çesme | 10.06.2013 | 19.7 | 7980 | 6.70 | 134 | 0.1 | x |
| 25 | 29.5900 | 40.3708 | 298 | Bursa | Yk. Gölüce “Tuzlu Su” | Çesme | 02.06.2013 | 16.8 | 3580 | 7.47 | −56 | 5.7 | |
| 26 | 29.4766 | 40.4980 | 109 | Bursa | Keramet Ilica | spring in lake | 02.06.2013 | 31.9 | 902 | 6.75 | 444 | 1.0 | x |
| 27 | 29.4452 | 40.4977 | 86 | Bursa | Çakırlı CH4-Çesme | well 86 m | 02.06.2013 | 18.3 | 580 | 7.78 | 0.0 | x | |
| 28 | 29.3089 | 40.4679 | 102 | Bursa | Orhangazi Ilıpinar | spring in lake | 02.06.2013 | 17.0 | 666 | 7.01 | 364 | 6.7 | |
| 29 | 29.1604 | 40.4234 | 5 | Bursa | Gemlik Merkez Kapl. | well, artesian | 03.06.2013 | 36.2 | 425 | 7.42 | 232 | 5.3 | |
| 30 | 28.4315 | 39.9487 | 75 | Bursa | Dümbüldek | well, artesian | 30.05.2013 | 50.6 | 2520 | 6.38 | 165 | ||
| 31 | 28.4295 | 39.9526 | 67 | Bursa | Dümbüldek spring | spring | 30.05.2013 | 16.3 | 2930 | 6.05 | 204 | x | |
| 04.09.2014 | 19.4 | 3050 | 6.29 | 131 | 2.4 | x | |||||||
| 32 | 28.3894 | 39.9964 | 59 | Bursa | Yalıntaş Aci Su | Çesme | 04.09.2014 | 19.5 | 2133 | 6.14 | 411 | 0.3 | |
| 33 | 26.1916 | 39.7449 | 33 | Çanakkale | Kestanbol | well | 02.09.2014 | 75.7 | 31580 | 6.28 | 99 | 2.8 | |
| 34 | 26.1788 | 39.5677 | 39 | Çanakkale | Tuzla | spring | 02.09.2014 | 97.0 | 93000 | 6.74 | 109 | 3.9 | x |
| 35 | 27.2413 | 40.0923 | 195 | Çanakkale | Kirkgecit Kapl. | spring | 29.05.2013 | 52.1 | 662 | 9.03 | 24 | x | |
| 36 | 26.9745 | 39.9169 | 181 | Çanakkale | Bardakçılar Dağ Kapl. | spring | 29.05.2013 | 50.7 | 1608 | 8.18 | 264 | x | |
| 37 | 27.1557 | 39.8442 | 296 | Çanakkale | Yenice Hıdırlar Kapl. | spring | 29.05.2013 | 82.7 | 955 | 7.50 | 131 | x | |
| 03.09.2014 | 83.2 | 1073 | 8.08 | −18 | 4.1 | x | |||||||
| 38 | 30.1680 | 39.8143 | 859 | Eskişehir | Inönü Ilica | spring | 09.06.2013 | 27.4 | 431 | 7.51 | 384 | 5.8 | |
| 39 | 30.5198 | 39.7738 | 790 | Eskişehir | Eskişehir Hamamyolu | well | 09.06.2013 | 45.7 | 498 | 7.40 | 319 | 3.3 | |
| 40 | 31.0376 | 39.6878 | 817 | Eskişehir | Uyushamam E-8 | well 45 m | 08.06.2013 | 15.6 | 1814 | 5.99 | 389 | 1.0 | x |
| 41 | 31.0600 | 39.6794 | 800 | Eskişehir | Uyushamam | spring | 08.06.2013 | 28.3 | 1275 | 6.44 | 209 | 0.5 | x |
| 42 | 31.7223 | 39.4423 | 921 | Eskişehir | Hamamkarahisar Çardak | spring | 08.06.2013 | 35.0 | 768 | 7.13 | 224 | 3.6 | |
| 43 | 29.2948 | 40.8449 | 3 | Istanbul | Tuzla “Büyük Içmeler” | well 158 m, artes. | 31.08.2014 | 20.4 | 14740 | 6.86 | 359 | ||
| 44 | 29.8773 | 40.6975 | 28 | Kocaeli | Yeniköy | well, artesian | 04.06.2013 | 31.5 | 381 | 9.10 | −36 | 1.1 | |
| 45 | 29.8772 | 40.6967 | 37 | Kocaeli | Yeniköy Jazlik Ilica | spring | 04.06.2013 | 29.7 | 372.4 | 8.98 | 89 | ||
| 46 | 30.6477 | 40.6210 | 111 | Sakarya | Kuzuluk W | well | 31.08.2014 | 19.6 | 8020 | 6.54 | 134 | 3.3 | x |
| 47 | 30.6570 | 40.6257 | 127 | Sakarya | Kuzuluk K-3 | well 160 m | 31.08.2014 | 72.0 | 3750 | 6.89 | −11 | 1.8 | x |
| 48 | 30.3632 | 40.4715 | 412 | Sakarya | Ahibaba Ilık Su | spring | 05.06.2013 | 24.9 | 2210 | 6.29 | 239 | 0.8 | x |
| 49 | 30.4282 | 40.3989 | 415 | Sakarya | Taraklı | well, artesian | 05.06.2013 | 42.5 | 948 | 6.62 | 104 | 1.6 | |
| 50 | 27.2596 | 40.7355 | 221 | Tekirdağ | Hoşköy Özkaynak MS | spring | 01.09.2014 | 18.2 | 3810 | 6.80 | 49 | 1.4 | |
| 51 | 27.2125 | 40.7128 | 242 | Tekirdağ | Yayaköy (Şarköy) | Çesme | 28.05.2013 | 14.1 | 14800 | 6.95 | −164 | ||
| 52 | 27.1064 | 40.6847 | 158 | Tekirdağ | Gölcük | Çesme | 28.05.2013 | 14.9 | 4150 | 7.11 | −111 | ||
| 01.09.2014 | 15.8 | 2510 | 7.36 | −1 | 1.1 | ||||||||
| 53 | 28.8400 | 40.5457 | 76 | Yalova | Armutlu kapl. | well | 31.05.2013 | 74.6 | 2640 | 6.23 | 174 | x | |
| 54 | 28.8431 | 40.5465 | 87 | Yalova | Armutlu IPA2 | well 500 m | x | ||||||
| 55 | 28.8432 | 40.5465 | 82 | Yalova | Armutlu spring | spring | 01.06.2013 | 58.8 | 2600 | 6.40 | 64 | ||
| 56 | 28.8402 | 40.5455 | 78 | Yalova | Armutlu near bridge | well, artesian | 01.06.2013 | 75.6 | 3010 | 6.29 | 69 | x | |
| 57 | 29.2778 | 40.5939 | 178 | Yalova | Soğucak Aci Su | spring | 31.05.2013 | 21.4 | 1119 | 6.75 | 365 | ||
| 58 | 29.1712 | 40.6038 | 132 | Yalova | Termal “Göz Suyu” | Çesme | 31.05.2013 | 59.7 | 1870 | 7.57 | 174 | ||
| 59 | 29.1705 | 40.6039 | 136 | Yalova | Termal Kapl. | spring | 31.05.2013 | 63.4 | 1820 | 7.35 | 49 |
| ID | Site | Date | pCO2 | Li | Na | K | Mg | Ca | F | Cl | NO3 | SO4 | HCO3 | δ18O | δ2H | Water Type |
|---|---|---|---|---|---|---|---|---|---|---|---|---|---|---|---|---|
| 1 | Edremit | 03.09.2014 | 0.03 | 0.04 | 9.64 | 0.28 | 0.01 | 0.75 | 0.37 | 2.07 | 0.01 | 7.13 | 1.20 | −6.79 | −47.00 | Na-SO4 |
| 2 | Ekşidere | 03.09.2014 | 0.13 | 0.45 | 0.05 | 0.90 | 2.39 | 0.02 | 0.21 | 0.35 | 3.20 | −9.12 | −59.00 | Ca-HCO3 | ||
| 3 | Ekşi.Genc | 03.09.2014 | 0.50 | 0.04 | 0.15 | 0.70 | 0.00 | 0.42 | 0.92 | 0.05 | −8.97 | −51.00 | acid-SO4 | |||
| 4 | Ilica (Balya) | 29.05.2013 | 0.05 | 0.10 | 10.40 | 0.12 | 0.01 | 0.84 | 0.40 | 2.51 | 0.16 | 7.23 | 1.57 | −10.25 | −70.16 | Na-SO4 |
| 5 | Ilicaboğazi | 30.05.2013 | 0.44 | 0.10 | 25.97 | 0.43 | 1.83 | 4.16 | 0.05 | 21.21 | 0.01 | 2.03 | 9.97 | −9.23 | −58.71 | Na-Cl |
| 04.09.2014 | 0.40 | 0.07 | 24.15 | 0.49 | 1.69 | 4.17 | 0.05 | 19.78 | 0.06 | 1.89 | 9.10 | −9.32 | −58.00 | Na-Cl | ||
| 6 | Kızık | 30.05.2013 | 0.46 | 0.15 | 11.70 | 0.73 | 0.95 | 6.79 | 0.03 | 8.39 | 0.01 | 1.84 | 10.94 | −8.17 | −55.48 | Na(Ca)-HCO3(Cl) |
| 7 | Çepni | 04.06.2013 | 0.68 | 0.04 | 1.10 | 0.10 | 2.97 | 21.60 | 0.01 | 0.44 | 0.08 | 0.05 | 25.55 | −11.10 | −75.72 | Ca-HCO3 |
| 8 | Derdin | 04.06.2013 | 0.81 | 0.20 | 81.82 | 1.11 | 5.81 | 7.17 | 0.77 | 9.49 | 0.01 | 26.32 | 62.94 | −8.39 | −70.63 | Na-Cl |
| 9 | Efteni | 04.06.2013 | 0.79 | 0.13 | 16.02 | 0.31 | 12.41 | 7.17 | 0.04 | 4.47 | 0.01 | 31.38 | −11.08 | −75.16 | Na(Mg)-HCO3 | |
| 10 | Ilica (Taşk.) | 05.06.2013 | 0.02 | 0.04 | 7.66 | 0.11 | 0.07 | 5.82 | 0.05 | 0.32 | 13.39 | 0.38 | −13.11 | −88.17 | Na(Ca)-SO4 | |
| 11 | Mudurnu | 05.06.2013 | 0.53 | 0.04 | 0.96 | 0.15 | 4.15 | 9.02 | 0.06 | 0.17 | 0.57 | 14.10 | −11.87 | −78.98 | Ca(Mg)-HCO3 | |
| 12 | Mudur NW | 05.06.2013 | 0.51 | 0.04 | 0.94 | 0.15 | 4.16 | 8.69 | 0.06 | 0.13 | 0.59 | 13.82 | −11.61 | −77.67 | Ca(Mg)-HCO3 | |
| 13 | Mudurnu NE | 05.06.2013 | 0.57 | 0.04 | 0.99 | 0.15 | 4.34 | 9.15 | 0.06 | 0.11 | 0.62 | 14.55 | −11.71 | −78.36 | Ca(Mg)-HCO3 | |
| 14 | Çekirge | 30.05.2013 | 0.27 | 0.01 | 1.25 | 0.11 | 1.73 | 4.13 | 0.04 | 0.13 | 1.22 | 6.10 | −10.94 | −70.34 | Ca-HCO3 | |
| 04.09.2014 | 0.23 | 0.01 | 1.49 | 0.22 | 1.81 | 3.28 | 0.82 | 0.15 | 0.01 | 1.19 | 4.90 | −10.72 | −71.00 | Ca-HCO3 | ||
| 15 | Kükürtlü Uni | 03.06.2013 | 0.49 | 0.12 | 9.66 | 0.48 | 0.78 | 4.96 | 0.24 | 0.32 | 0.05 | 5.63 | 10.55 | n.a. | n.a. | Na(Ca)-HCO3(SO4) |
| 08.09.2014 | 0.39 | 0.09 | 8.88 | 0.50 | 0.70 | 4.51 | 0.24 | 0.34 | 0.01 | 5.55 | 8.70 | −9.79 | −71.00 | Na(Ca)-HCO3(SO4) | ||
| 16 | Kükürtlü BK2 | 03.06.2013 | 0.16 | 0.13 | 9.96 | 0.52 | 0.65 | 2.41 | 0.24 | 0.29 | 0.01 | 2.05 | 11.78 | −10.81 | −71.08 | Na-HCO3 |
| 08.09.2014 | 0.09 | 0.10 | 10.65 | 0.57 | 0.68 | 1.07 | 0.23 | 0.31 | 0.55 | 12.00 | −10.51 | −77.00 | Na-HCO3 | |||
| 17 | Kükürtlü BJ-3 | 03.06.2013 | 0.06 | 0.05 | 6.16 | 0.15 | 0.69 | 1.07 | 0.02 | 0.09 | 1.18 | 6.45 | −10.38 | −67.71 | Na-HCO3 | |
| 18 | Çaybaşi UMS | 05.09.2014 | 0.58 | 0.47 | 8.16 | 0.78 | 6.21 | 9.62 | 0.12 | 2.51 | 0.12 | 0.64 | 21.80 | −8.78 | −65.00 | Ca(Mg)-HCO3 |
| 19 | Çaybaşi ÖMS | 08.09.2014 | 0.55 | 0.14 | 2.92 | 0.26 | 9.47 | 4.31 | 0.04 | 0.99 | 0.01 | 0.68 | 15.40 | −9.26 | −61.00 | Mg(Ca)-HCO3 |
| 20 | Oylat | 10.06.2013 | 0.14 | 0.04 | 0.97 | 0.12 | 0.68 | 6.51 | 0.03 | 0.16 | 0.02 | 4.97 | 3.49 | −10.78 | −69.65 | Ca-SO4(HCO3) |
| 21 | Özlüce | 10.06.2013 | 0.67 | 0.11 | 11.40 | 0.38 | 11.37 | 9.75 | 0.02 | 0.66 | 1.28 | 30.23 | −11.16 | −75.50 | Na(Mg)-HCO3 | |
| 22 | Kınık | 10.06.2013 | 0.57 | 0.15 | 14.32 | 0.56 | 5.96 | 9.90 | 0.02 | 0.70 | 0.06 | 0.99 | 27.82 | −11.10 | −76.11 | Na(Ca)-HCO3 |
| 23 | Kınık N | 10.06.2013 | 0.82 | 0.46 | 65.54 | 2.69 | 5.75 | 10.04 | 0.01 | 1.86 | 2.05 | 73.43 | −12.06 | −89.28 | Na-HCO3 | |
| 24 | Çitli (Inegöl) | 10.06.2013 | 0.88 | 0.47 | 90.32 | 1.12 | 6.41 | 12.86 | 0.02 | 1.73 | 2.03 | 98.94 | −11.76 | −88.60 | Na(HCO3)-Cl | |
| 25 | Yk. Gölüce | 02.06.2013 | 0.13 | 0.08 | 36.14 | 0.44 | 1.76 | 1.54 | 0.37 | 32.83 | 0.05 | 2.22 | 4.95 | −10.80 | −73.73 | Na-Cl |
| 26 | Keramet | 02.06.2013 | 0.38 | 0.04 | 1.15 | 0.05 | 2.89 | 7.67 | 0.02 | 0.37 | 0.01 | 0.58 | 11.37 | −10.19 | −65.02 | Ca(Mg)-HCO3 |
| 27 | Çakırlı | 02.06.2013 | 0.11 | 0.04 | 2.61 | 0.04 | 1.42 | 3.42 | 0.01 | 0.62 | 0.03 | 7.02 | −12.37 | −81.31 | Ca(Mg)-HCO3 | |
| 28 | Orhangazi | 02.06.2013 | 0.23 | 0.43 | 0.03 | 0.46 | 7.36 | 0.35 | 0.34 | 0.43 | 7.48 | −9.54 | −59.18 | Ca-HCO3 | ||
| 29 | Gemlik | 03.06.2013 | 0.15 | 0.00 | 0.51 | 0.03 | 1.28 | 3.26 | 0.01 | 0.47 | 0.03 | 0.23 | 4.50 | −10.22 | −63.22 | Ca-HCO3 |
| 30 | Dümbüldek | 30.05.2013 | 0.82 | 0.16 | 18.61 | 1.72 | 2.26 | 7.93 | 0.08 | 1.63 | 0.11 | 29.03 | −10.50 | −68.49 | Na(Ca)-HCO3 | |
| 31 | Dümb. spr. | 30.05.2013 | 0.77 | 0.16 | 16.52 | 1.53 | 3.93 | 16.73 | 0.06 | 1.72 | 1.68 | 35.50 | −10.47 | −68.39 | Na(Ca)-HCO3 | |
| 04.09.2014 | 0.68 | 0.13 | 15.72 | 1.47 | 3.60 | 14.85 | 0.04 | 1.74 | 0.01 | 1.77 | 31.00 | n.a. | n.a. | Na(Ca)-HCO3 | ||
| 32 | Yalıntaş | 04.09.2014 | 0.63 | 0.13 | 12.14 | 1.21 | 2.67 | 8.37 | 0.09 | 1.68 | 0.01 | 1.16 | 21.70 | −10.73 | −76.00 | Na(Ca)-HCO3 |
| 33 | Kestanbol | 02.09.2014 | 0.48 | 2.45 | 271.3 | 18.13 | 5.24 | 43.23 | 0.48 | 336.7 | 0.35 | 3.70 | 5.00 | −6.69 | −40.00 | Na-Cl |
| 34 | Tuzla | 02.09.2014 | 0.09 | 2.74 | 547.0 | 33.10 | 4.10 | 97.31 | 660.0 | 0.25 | 2.27 | 0.15 | n.a. | n.a. | Na-Cl | |
| 35 | Kirkgecit | 29.05.2013 | 0.02 | 0.02 | 6.36 | 0.05 | 0.01 | 0.26 | 0.43 | 1.23 | 0.05 | 3.44 | 1.83 | −9.72 | −61.35 | Na-SO4 |
| 36 | Bardakcilar | 29.05.2013 | 0.04 | 0.05 | 12.70 | 0.17 | 0.02 | 4.21 | 0.29 | 0.86 | 15.32 | 0.94 | −9.49 | −61.63 | Na(Ca)-SO4 | |
| 37 | Hidirlar | 29.05.2013 | 0.12 | 0.05 | 7.88 | 0.17 | 0.02 | 0.87 | 0.36 | 0.46 | 6.83 | 1.66 | −8.32 | −51.30 | Na-SO4 | |
| 03.09.2014 | 0.06 | 0.01 | 8.06 | 0.20 | 0.01 | 0.85 | 0.38 | 0.47 | 0.01 | 7.12 | 1.20 | n.a. | n.a. | Na-SO4 | ||
| 38 | Inönü Ilica | 09.06.2013 | 0.13 | 0.04 | 0.37 | 0.02 | 1.79 | 2.93 | 0.01 | 0.11 | 0.10 | 0.10 | 4.92 | −11.13 | −75.57 | Ca-HCO3 |
| 39 | Eskişehir | 09.06.2013 | 0.17 | 0.04 | 0.62 | 0.04 | 2.67 | 2.47 | 0.01 | 0.18 | 0.05 | 0.28 | 5.36 | −10.25 | −72.82 | Mg(Ca)-HCO3 |
| 40 | Uyush. E-8 | 08.06.2013 | 0.63 | 0.06 | 6.97 | 0.19 | 4.79 | 11.53 | 0.02 | 1.65 | 0.12 | 0.51 | 21.35 | −10.91 | −79.95 | Ca(Mg)-HCO3 |
| 41 | Uyushamam | 08.06.2013 | 0.49 | 0.04 | 1.79 | 0.21 | 7.77 | 6.75 | 0.02 | 0.61 | 0.01 | 0.95 | 14.28 | −10.11 | −72.02 | Mg(Ca)-HCO3 |
| 42 | H.karahisar | 08.06.2013 | 0.24 | 1.82 | 0.09 | 1.74 | 5.25 | 0.01 | 1.02 | 0.07 | 0.36 | 7.56 | −10.68 | −73.82 | Ca-HCO3 | |
| 43 | Tuzla Içmeler | 31.08.2014 | 0.22 | 104.0 | 2.05 | 25.36 | 17.67 | 130.8 | 0.13 | 12.84 | 5.10 | n.a. | n.a. | Na-Cl | ||
| 44 | Yeniköy | 04.06.2013 | 0.02 | 0.04 | 3.33 | 0.01 | 0.04 | 0.30 | 0.03 | 1.09 | 0.69 | 1.92 | −9.92 | −63.21 | Na-HCO3 | |
| 45 | Yenik. Jazlik | 04.06.2013 | 0.02 | 0.04 | 3.12 | 0.01 | 0.03 | 0.29 | 0.02 | 0.77 | 0.01 | 0.67 | 2.14 | −9.77 | −62.45 | Na-HCO3 |
| 46 | Kuzuluk W | 31.08.2014 | 0.82 | 0.72 | 74.21 | 2.47 | 9.82 | 10.69 | 32.83 | 0.02 | 0.58 | 65.00 | 3.56 | −44.00 | Na-Cl | |
| 47 | Kuzuluk K-3 | 31.08.2014 | 0.63 | 0.37 | 30.28 | 1.07 | 1.19 | 4.73 | 0.23 | 9.71 | 0.01 | 1.16 | 26.80 | −9.07 | −86.00 | Na-HCO3 |
| 48 | Ahibaba | 05.06.2013 | 0.53 | 0.07 | 13.44 | 0.46 | 1.25 | 2.50 | 0.04 | 0.56 | 1.24 | 15.33 | −10.87 | −70.64 | Na-HCO3 | |
| 49 | Taraklı | 05.06.2013 | 0.41 | 0.04 | 1.15 | 0.11 | 1.65 | 6.87 | 0.04 | 0.21 | 0.33 | 9.49 | −11.66 | −77.14 | Ca-HCO3 | |
| 50 | Hoşköy ÖMS | 01.09.2014 | 0.58 | 0.12 | 42.08 | 0.39 | 2.22 | 2.79 | 0.13 | 1.60 | 0.01 | 0.21 | 45.30 | n.a. | n.a. | Na-HCO3 |
| 51 | Yayaköy | 28.05.2013 | 0.23 | 0.11 | 136.6 | 0.47 | 10.06 | 6.36 | 0.07 | 132.6 | 0.53 | 5.92 | 7.40 | −8.80 | −56.91 | Na-Cl |
| 52 | Gölcük | 28.05.2013 | 0.21 | 0.04 | 25.54 | 0.13 | 6.79 | 9.74 | 0.04 | 29.63 | 6.24 | 8.06 | −8.08 | −51.51 | Na(Ca)-Cl | |
| 01.09.2014 | 0.16 | 14.82 | 0.16 | 5.05 | 5.21 | 0.06 | 10.60 | 0.02 | 7.97 | 6.70 | −8.33 | −50.00 | Na(Ca)-Cl | |||
| 53 | Armutlu | 31.05.2013 | 0.64 | 0.21 | 15.32 | 0.75 | 1.81 | 14.88 | 0.11 | 7.50 | 17.13 | 9.19 | −10.81 | −69.62 | Na(Ca)-SO4 | |
| 55 | Armutlu spr. | 01.06.2013 | 0.53 | 0.19 | 13.35 | 0.64 | 1.84 | 13.20 | 0.09 | 6.44 | 0.01 | 14.35 | 9.16 | −10.46 | −67.18 | Na(Ca)-SO4 |
| 58 | Termal Göz | 31.05.2013 | 0.24 | 0.01 | 0.45 | 0.06 | 2.76 | 11.26 | 0.01 | 0.24 | 0.30 | 14.67 | −9.84 | −60.63 | Ca-HCO3 | |
| 59 | Termal | 31.05.2013 | 0.11 | 0.05 | 11.93 | 0.11 | 0.04 | 8.45 | 0.10 | 2.43 | 16.64 | 1.26 | −11.23 | −70.72 | Na(Ca)-SO4 | |
| Iznik Lake | 02.06.2013 | 4.70 | 0.30 | 5.50 | 0.60 | 1.90 | 0.60 | 8.40 | ||||||||
| Sea water | 464.3 | 10.11 | 105.1 | 20.44 | 539.7 | 0.83 | 55.83 | 0.45 |
| ID | Site | Date | He | Ne | H2 | O2 | N2 | CO | CH4 | CO2 | Vol. | δ13CTDC | N2/O2 | He/Ne | R/Ra |
|---|---|---|---|---|---|---|---|---|---|---|---|---|---|---|---|
| 1 | Edremit | 03.09.2014 | 7.8 × 10⁻⁴ | 3.0 × 10⁻⁴ | 2.5 × 10⁻⁴ | 6.0 | 18.4 | 2.7 × 10⁻⁵ | 3.0 × 10⁻² | 0.4 | 24.8 | n.a. | 3 | 2.59 | 2.60 |
| 2 | Ekşidere | 03.09.2014 | 1.3 × 10⁻⁴ | 3.0 × 10⁻⁴ | 6.0 | 18.2 | 7.0 × 10⁻⁶ | 5.1 | 29.2 | −1.45 | 3 | 0.43 | 0.43 | ||
| 3 | Ekşi. Gencli | 03.09.2014 | 8.9 × 10⁻⁵ | 2.9 × 10⁻⁴ | 4.8 × 10⁻⁴ | 4.5 | 17.3 | 4.0 × 10⁻¹ | 70.3 | 92.5 | n.a. | 4 | 0.30 | 0.30 | |
| 5 | Ilicaboğazi | 30.05.2013 | 2.9 × 10⁻⁴ | 3.3 × 10⁻⁴ | 8.4 × 10⁻⁴ | 7.0 | 19.6 | 7.3 × 10⁻⁵ | 2.5 × 10⁻³ | 73.3 | 100.0 | 1.52 | 3 | 0.87 | 0.95 |
| 04.09.2014 | 1.3 × 10⁻³ | 2.4 × 10⁻⁴ | 1.1 × 10⁻³ | 5.9 | 21.5 | 6.4 × 10⁻⁵ | 2.1 × 10⁻³ | 78.2 | 105.5 | −0.85 | 4 | 5.30 | 1.00 | ||
| 6 | Kizik | 30.05.2013 | 1.3 × 10⁻³ | 3.3 × 10⁻⁴ | 1.3 | 13.7 | 6.9 × 10⁻⁶ | 1.1 × 10⁻³ | 85.4 | 100.4 | −3.43 | 10 | 3.85 | 0.52 | |
| 10 | Ilica | 05.06.2013 | 4.3 × 10⁻⁴ | 3.6 × 10⁻⁴ | 5.3 × 10⁻⁵ | 1.4 | 6.0 | 1.4 × 10⁻⁵ | 5.9 × 10⁻² | 0.0 | 7.5 | n.a. | 4 | 1.17 | 0.63 |
| 11 | Mudurnu | 05.06.2013 | 1.0 × 10⁻⁴ | 2.1 × 10⁻⁴ | 0.3 | 4.1 | 70.3 | 74.7 | n.a. | 14 | 0.51 | 1.41 | |||
| 13 | Mudurnu NE | 05.06.2013 | 3.5 × 10⁻⁴ | 2.8 × 10⁻⁴ | 0.4 | 2.9 | 7.3 × 10⁻⁶ | 52.0 | 55.4 | n.a. | 7 | 1.25 | 1.85 | ||
| 14 | Çekirge | 30.05.2013 | 1.6 × 10⁻⁴ | 3.8 × 10⁻⁴ | 2.2 | 11.0 | 1.3 × 10⁻⁵ | 2.5 × 10⁻³ | 12.3 | 25.6 | 0.64 | 5 | 0.41 | 1.19 | |
| 04.09.2014 | 4.6 × 10⁻⁴ | 2.4 × 10⁻⁴ | 5.3 | 16.1 | 3.1 × 10⁻³ | 17.6 | 39.0 | −3.19 | 3 | 1.90 | 0.53 | ||||
| 15 | Kükürtlü Uni | 03.06.2013 | 2.6 × 10⁻⁴ | 2.8 × 10⁻⁴ | 1.5 | 45.4 | 6.6 × 10⁻⁵ | 53.1 | 100.0 | 0.04 | 31 | 0.94 | 0.67 | ||
| 08.09.2014 | 4.5 × 10⁻⁴ | 3.5 × 10⁻⁴ | 8.0 | 30.3 | 5.5 × 10⁻² | 78.2 | 116.6 | 0.48 | 4 | 1.26 | 0.57 | ||||
| 16 | Kükürtlü BK2 | 03.06.2013 | 3.0 × 10⁻³ | 1.8 × 10⁻⁴ | 0.1 | 32.7 | 1.6 × 10+0 | 65.5 | 100.0 | n.a. | 649 | 16.6 | 1.05 | ||
| 08.09.2014 | 5.2 × 10⁻³ | 2.3 × 10⁻⁴ | 5.2 | 20.6 | 2.2 × 10⁻⁵ | 6.7 × 10⁻⁴ | 4.2 | 30.0 | 2.91 | 4 | 22.3 | 0.43 | |||
| 17 | Kükürtlü BJ-3 | 03.06.2013 | 2.3 × 10⁻⁴ | 3.2 × 10⁻⁴ | 1.8 × 10⁻⁴ | 0.5 | 4.0 | 2.5 × 10⁻⁴ | 0.8 | 5.3 | n.a. | 7 | 0.72 | 0.67 | |
| 18 | Çaybaşi UMS | 05.09.2014 | 1.3 × 10⁻⁴ | 1.1 × 10⁻⁴ | 5.8 | 12.8 | 2.5 × 10⁻⁵ | 525.4 | 544 | 2.84 | 2 | 1.19 | 0.84 | ||
| 19 | Çaybaşi ÖMS | 08.09.2014 | 2.4 × 10⁻⁴ | 2.4 × 10⁻⁴ | 9.3 | 22.8 | 1.6 × 10⁻⁵ | 539.9 | 572 | 1.91 | 2 | 1.04 | 0.92 | ||
| 20 | Oylat | 10.06.2013 | 6.7 × 10⁻⁴ | 2.3 × 10⁻⁴ | 1.7 × 10⁻⁵ | 0.6 | 2.5 | 4.1 × 10⁻⁶ | 1.2 | 4.3 | n.a. | 4 | 2.93 | 0.70 | |
| 21 | Özlüce | 10.06.2013 | 1.0 × 10⁻⁴ | 2.3 × 10⁻⁴ | 1.1 × 10⁻² | 0.4 | 0.7 | 4.5 × 10⁻⁶ | 3.4 × 10⁻⁵ | 246.6 | 248 | n.a. | 2 | 0.43 | 0.95 |
| 22 | Kınık | 10.06.2013 | 1.4 × 10⁻⁴ | 2.8 × 10⁻⁴ | 1.6 × 10⁻³ | 0.5 | 2.6 | 3.7 × 10⁻⁴ | 116.0 | 119.0 | n.a. | 6 | 0.49 | 0.78 | |
| 25 | Yk. Gölüce | 02.06.2013 | 8.5 × 10⁻⁵ | 2.0 × 10⁻⁴ | n.a. | 0.42 | 0.86 | ||||||||
| 28 | Orhangazi | 02.06.2013 | 1.1 × 10⁻⁴ | 3.0 × 10⁻⁴ | 8.5 × 10⁻⁵ | 1.4 | 4.1 | 11.3 | 16.7 | n.a. | 3 | 0.38 | 0.97 | ||
| 29 | Gemlik | 03.06.2013 | 9.0 × 10⁻⁵ | 2.6 × 10⁻⁴ | 0.7 | 3.2 | 6.8 × 10⁻⁶ | 9.8 × 10⁻⁵ | 2.1 | 6.0 | n.a. | 4 | 0.35 | 0.94 | |
| 30 | Dümbüldek | 30.05.2013 | 1.0 × 10⁻⁴ | 2.3 × 10⁻⁴ | 1.3 | 3.0 | 5.2 × 10⁻⁵ | 4.2 × 10⁻³ | 221.9 | 226 | −6.47 | 2 | 0.43 | 1.12 | |
| 31 | Dümbüldek sp. | 30.05.2013 | 1.1 × 10⁻⁴ | 3.0 × 10⁻⁴ | 5.6 | 11.0 | 1.0 × 10⁻⁴ | 4.2 × 10⁻⁴ | 2742 | 2759 | 0.67 | 2 | 0.35 | 1.15 | |
| 04.09.2014 | 1.3 × 10⁻⁴ | 1.1 × 10⁻⁴ | 5.8 | 12.8 | 2.5 × 10⁻⁵ | 525.4 | 544 | n.a. | 2 | 1.19 | 0.84 | ||||
| 32 | Yalıntaş | 04.09.2014 | 5.3 × 10⁻³ | 1.1 × 10⁻⁴ | 17.5 | 42.9 | 9.2 × 10⁻³ | 936.7 | 997 | 3.52 | 2 | 49.7 | 0.90 | ||
| 33 | Kestanbol | 02.09.2014 | 5.2 × 10⁻³ | 2.8 × 10⁻⁴ | 1.3 × 10⁻³ | 8.7 | 32.2 | 5.3 × 10⁻⁴ | 2.1 × 10⁻¹ | 125.7 | 167 | −1.71 | 4 | 18.2 | 0.87 |
| 37 | Yenice Hidirlar | 03.09.2014 | 7.8 × 10⁻⁴ | 3.0 × 10⁻⁴ | 2.5 × 10⁻⁴ | 6.0 | 18.4 | 2.7 × 10⁻⁵ | 3.0 × 10⁻² | 0.4 | 24.8 | −13.86 | 3 | 2.59 | 0.47 |
| 38 | Inönü | 09.06.2013 | 1.2 × 10⁻⁴ | 3.2 × 10⁻⁴ | 1.3 × 10⁻⁴ | 0.9 | 2.5 | 4.2 × 10⁻⁶ | 1.4 | 4.9 | n.a. | 3 | 0.36 | 0.95 | |
| 39 | Eskişehir | 09.06.2013 | 1.3 × 10⁻⁴ | 2.9 × 10⁻⁴ | 9.2 × 10⁻³ | 0.8 | 3.1 | 1.7 | 5.7 | n.a. | 4 | 0.44 | 0.91 | ||
| 42 | Hamam. Çardak | 08.06.2013 | 4.3 × 10⁻⁴ | 1.2 × 10⁻³ | 3.2 × 10⁻⁴ | 0.6 | 3.2 | 2.7 × 10⁻⁶ | 6.5 | 10.2 | n.a. | 6 | 0.36 | 0.87 | |
| 43 | Tuzla Içmeler | 31.08.2014 | 1.7 × 10⁻³ | 1.5 × 10⁻⁴ | 7.7 × 10⁻⁴ | 7.3 | 19.0 | 4.0 × 10⁻⁵ | 14.6 | 40.9 | n.a. | 3 | 11.4 | 0.59 | |
| 44 | Yeniköy | 04.06.2013 | 6.3 × 10⁻³ | 3.8 × 10⁻⁴ | 1.2 × 10⁻³ | 0.2 | 4.5 | 3.3 × 10⁻⁶ | 0.0 | 4.7 | n.a. | 19 | 16.9 | 0.74 | |
| 45 | Yeniköy Jazlik | 04.06.2013 | 1.4 × 10⁻³ | 3.5 × 10⁻⁴ | 0.4 | 3.7 | 1.7 × 10⁻⁶ | 3.2 × 10⁻⁵ | 0.0 | 4.2 | n.a. | 8 | 4.12 | 0.53 | |
| 46 | Kuzuluk W | 31.08.2014 | 2.1 × 10⁻³ | 8.6 × 10⁻⁵ | n.a. | 24.3 | 0.64 | ||||||||
| 47 | Kuzuluk K-3 | 31.08.2014 | 1.6 × 10⁻⁴ | 3.0 × 10⁻⁴ | 4.2 × 10⁻³ | 6.9 | 20.0 | 3.9 × 10⁻² | 101.0 | 127.9 | n.a. | 3 | 0.52 | 0.63 | |
| 49 | Tarakli | 05.06.2013 | 1.4 × 10⁻⁴ | 2.6 × 10⁻⁴ | 0.9 | 3.4 | 3.1 × 10⁻⁶ | 1.5 × 10⁻⁵ | 21.1 | 25.4 | n.a. | 4 | 0.53 | 0.68 | |
| 50 | Hoşköy ÖMS | 01.09.2014 | 3.2 × 10⁻⁴ | 1.2 × 10⁻⁴ | 0.1 | 12.5 | 320.8 | 333 | n.a. | 228 | 2.75 | 4.43 | |||
| 51 | Yayaköy | 28.05.2013 | 7.7 × 10⁻⁵ | 1.8 × 10⁻⁴ | 8.1 | 28.2 | 4.2 × 10⁻⁵ | 5.5 × 10−0 | 63.9 | 105.6 | n.a. | 3 | 0.43 | 2.08 | |
| 52 | Gölcük | 28.05.2013 | 8.3 × 10⁻⁵ | 2.5 × 10⁻⁴ | 0.03 | 8.2 | 1.2 × 10⁻⁵ | 2.7 × 10−0 | 12.3 | 23.2 | −17.47 | 238 | 0.34 | 0.94 | |
| 01.09.2014 | 6.1 × 10⁻⁵ | 2.0 × 10⁻⁴ | 2.9 | 14.7 | 1.6 × 10⁻⁴ | 18.7 | 36.3 | n.a. | 5 | 0.31 | 0.76 | ||||
| 53 | Armutlu kapl. | 31.05.2013 | 1.2 × 10⁻⁴ | 4.1 × 10⁻⁴ | 0.6 | 1.9 | 1.0 × 10⁻⁵ | 8.7 × 10⁻² | 29.9 | 32.5 | −3.73 | 3 | 0.29 | 0.87 | |
| 55 | Armutlu spring | 01.06.2013 | 6.1 × 10⁻⁴ | 3.2 × 10⁻⁴ | 2.1 × 10⁻⁴ | 0.7 | 2.0 | 2.1 × 10⁻⁶ | 39.7 | 42.4 | n.a. | 3 | 1.91 | 0.34 | |
| 58 | Termal Göz | 31.05.2013 | 1.4 × 10⁻⁴ | 2.2 × 10⁻⁴ | 2.1 | 6.7 | 1.3 × 10⁻⁵ | 7.4 × 10⁻⁵ | 18.4 | 27.2 | n.a. | 3 | 0.65 | 0.70 | |
| 59 | Termal | 31.05.2013 | 1.3 × 10⁻³ | 3.4 × 10⁻⁴ | 1.4 | 6.1 | 3.5 × 10⁻⁶ | 0.3 | 7.8 | n.a. | 4 | 4.00 | 0.34 | ||
| ASW | 4.8 × 10⁻⁵ | 4.8 | 9.6 | 1.0 × 10⁻⁶ | 2.4 | 16.8 | 2 |
| Site | Date | He | Ne | H2 | O2 | N2 | CO | CH4 | CO2 | δ13C | He/Ne | R/Ra | 40Ar | 40/36Ar | CO2/3He |
|---|---|---|---|---|---|---|---|---|---|---|---|---|---|---|---|
| Ilica Çamur | 29.05.2013 | 6.7 × 10⁻⁴ | 1.9 × 10⁻³ | 4.4 × 10⁻⁸ | 95.3 | 2.4 × 10⁻¹ | 2.7 | −17.2 | 0.36 | 0.97 | 1.8 | 298.6 | 2.9 × 10⁹ | ||
| Çepni | 04.06.2013 | 7.0 × 10⁻⁴ | 1.9 × 10⁻³ | 1.7 | 6.6 | 2.0 × 10⁻⁵ | 3.2 × 10⁻⁴ | 91.5 | −1.8 | 0.37 | 0.95 | 0.2 | 300.5 | 9.9 × 10¹⁰ | |
| Derdin | 04.06.2013 | 4.1 × 10⁻⁴ | 4.1 × 10⁻⁴ | 0.3 | 1.6 | 4.0 × 10⁻⁵ | 3.3 × 10⁻³ | 98.1 | −4.2 | 1.00 | 0.72 | n.a. | n.a. | 2.4 × 10¹¹ | |
| Efteni | 04.06.2013 | 6.6 × 10⁻⁴ | 1.8 × 10⁻³ | 1.3 × 10⁻⁷ | 0.0 | 1.4 | 1.8 × 10⁻⁵ | 8.0 × 10⁻¹ | 97.8 | −3.3 | 0.37 | 0.98 | n.a. | n.a. | 1.1 × 10¹¹ |
| Mudurnu NW | 05.06.2013 | 1.1 × 10⁻³ | 1.5 × 10⁻³ | 9.0 × 10⁻⁸ | 13.7 | 62.1 | 1.4 × 10⁻² | 23.4 | −5.2 | 0.78 | 1.60 | 0.9 | 298.8 | 9.2 × 10⁹ | |
| Lues refer to COKükürtlü BK2 | 03.06.2013 | 6.1 × 10⁻³ | 33.5 | 4.3 × 10⁻⁴ | 1.2 × 100 | 65.2 | −5.2 | n.a. | n.a. | n.a. | n.a. | ||||
| Kınık N | 10.06.2013 | 5.9 × 10⁻³ | 1.9 × 10⁻⁴ | 0.1 | 2.4 | 2.0 × 10⁻⁵ | 1.1 × 10⁻³ | 97.4 | −3.7 | 30.8 | 0.52 | 0.1 | 296.2 | 2.3 × 10¹⁰ | |
| Çitli | 10.06.2013 | 1.1 × 10⁻² | 1.0 × 10⁻³ | 0.4 | 4.8 | 3.9 × 10⁻³ | 94.5 | −6.2 | 10.1 | 0.52 | 0.3 | 301.9 | 1.2 × 10¹⁰ | ||
| Keramet | 02.06.2013 | 2.7 × 10⁻³ | 2.1 × 10⁻³ | 2.0 | 82.3 | 3.0 × 10⁻⁵ | 3.1 × 10⁻³ | 15.7 | −9.4 | 1.28 | 0.47 | n.a. | n.a. | 8.9 × 10⁹ | |
| Çakırlı | 02.06.2013 | 6.5 × 10⁻⁴ | 2.0 × 10⁻³ | 8.9 | 9.1 × 101 | 0.1 | −14.3 | 0.32 | 0.97 | n.a. | n.a. | 1.5 × 10⁸ | |||
| Dümbüldek sp. | 30.05.2013 | 1.7 × 10⁻⁴ | 4.2 × 10⁻⁴ | 1.6 | 4.5 | 3.0 × 10⁻⁵ | 9.6 × 10⁻³ | 93.9 | −5.0 | 0.40 | 0.98 | n.a. | n.a. | 4.1 × 10¹¹ | |
| Dümbüldek sp. | 04.09.2014 | 1.0 × 10⁻³ | 6.4 × 10⁻⁵ | 1.7 | 5.3 | 1.1 × 10⁻⁴ | 2.6 × 10⁻² | 93.0 | n.a. | 15.5 | 1.18 | n.a. | n.a. | 5.7 × 10¹⁰ | |
| Tuzla | 02.09.2014 | 1.4 × 10⁻³ | 2.9 × 10⁻⁵ | 0.5 | 1.5 | 9.0 × 10⁻⁴ | 2.1 × 10⁻¹ | 97.8 | n.a. | 47.7 | 1.54 | n.a. | n.a. | 3.3 × 10¹⁰ | |
| Kirkgecit | 29.05.2013 | 3.7 × 10⁻² | 1.5 × 10⁻³ | 2.6 × 10⁻⁷ | 0.4 | 96.9 | 9.0 × 10⁻⁴ | 3.7 × 10⁻¹ | 1.1 | n.a. | 24.8 | 0.18 | 1.2 | 294.6 | 1.2 × 10⁸ |
| Bardakcilar | 29.05.2013 | 6.0 × 10⁻² | 1.5 × 10⁻³ | 1.1 × 10⁻⁶ | 1.6 | 93.8 | 2.2 × 10⁻³ | 2.9 × 10⁻¹ | 3.0 | n.a. | 40.1 | 0.20 | 1.3 | 294.9 | 1.8 × 10⁸ |
| Yenice Hidirlar | 29.05.2013 | 6.4 × 10⁻³ | 1.4 × 10⁻³ | 4.0 × 10⁻⁸ | 0.4 | 93.6 | 6.0 × 10⁻⁴ | 3.3 × 10⁻¹ | 4.1 | n.a. | 4.44 | 0.18 | 1.6 | 294.6 | 2.6 × 10⁹ |
| Yenice Hidirlar | 03.09.2014 | 4.3 × 10⁻² | 3.9 × 10⁻³ | 1.8 × 10⁻³ | 0.3 | 97.8 | 1.2 × 10⁻⁴ | 3.3 × 10⁻¹ | 1.5 | n.a. | 11.0 | 0.17 | n.a. | n.a. | 1.5 × 10⁸ |
| Uyusham. E-8 | 08.06.2013 | 1.3 × 10⁻³ | 1.7 × 10⁻³ | 0.7 | 4.7 | 3.0 × 10⁻⁵ | 1.1 × 10⁻² | 94.2 | n.a. | 0.72 | 0.72 | 0.4 | 302.9 | 7.5 × 10¹⁰ | |
| Uyushamam | 08.06.2013 | 3.3 × 10⁻² | 1.4 × 10⁻³ | 0.4 | 60.3 | 2.0 × 10⁻⁵ | 3.6 × 10⁻² | 38.3 | −2.5 | 23.6 | 0.66 | 0.9 | 299.2 | 1.2 × 10⁹ | |
| Kuzuluk W | 31.08.2014 | 1.8 × 10⁻² | 2.0 × 10⁻⁵ | 0.3 | 4.4 | 9.0 × 10⁻⁵ | 1.9 | 93.4 | n.a. | 897 | 0.65 | n.a. | n.a. | 5.8 × 10⁹ | |
| Kuzuluk K-3 | 31.08.2014 | 6.7 × 10⁻³ | 1.9 × 10⁻⁵ | 0.1 | 2.4 | 3.0 × 10⁻⁵ | 8.2 × 10⁻¹ | 96.7 | n.a. | 346 | 0.63 | n.a. | n.a. | 1.7 × 10¹⁰ | |
| Armutlu kapl. | 31.05.2013 | 6.4 × 10⁻⁴ | 2.1 × 10⁻³ | 0.0 | 37.7 | 1.3 | 61.0 | −1.6 | 0.31 | 0.93 | n.a. | n.a. | 7.4 × 10¹⁰ | ||
| Armutlu IPA2 | 01.06.2013 | 1.0 × 10⁻¹ | 1.1 × 10⁻³ | 2.5 × 10⁻⁸ | 70.0 | 1.0 × 10⁻⁵ | 5.3 | 23.7 | −2.7 | 90.3 | 0.20 | 0.9 | 294.3 | 8.5 × 10⁸ | |
| Armutlu well | 01.06.2013 | 1.7 × 10⁻² | 1.6 × 10⁻³ | 6.1 | 42.6 | 7.0 × 10⁻⁵ | 1.3 | 49.3 | −1.1 | 10.5 | 0.26 | 0.7 | 299.2 | 8.3 × 10⁹ | |
| Termal Göz | 05.06.2013 | 8.0 × 10⁻³ | 4.4 × 10⁻⁴ | 0.4 | 22.5 | 9.5 × 10⁻³ | 76.6 | −6.1 | 18.3 | 0.11 | 0.5 | 303.2 | 6.1 × 10¹⁰ |
Disclaimer/Publisher’s Note: The statements, opinions and data contained in all publications are solely those of the individual author(s) and contributor(s) and not of MDPI and/or the editor(s). MDPI and/or the editor(s) disclaim responsibility for any injury to people or property resulting from any ideas, methods, instructions or products referred to in the content. |
© 2025 by the authors. Licensee MDPI, Basel, Switzerland. This article is an open access article distributed under the terms and conditions of the Creative Commons Attribution (CC BY) license (https://creativecommons.org/licenses/by/4.0/).
Share and Cite
Italiano, F.; Woith, H.; Pizzino, L.; Sciarra, A.; Seyis, C. Geochemical and Isotopic Features of Geothermal Fluids Around the Sea of Marmara, NW Turkey. Geosciences 2025, 15, 83. https://doi.org/10.3390/geosciences15030083
Italiano F, Woith H, Pizzino L, Sciarra A, Seyis C. Geochemical and Isotopic Features of Geothermal Fluids Around the Sea of Marmara, NW Turkey. Geosciences. 2025; 15(3):83. https://doi.org/10.3390/geosciences15030083
Chicago/Turabian StyleItaliano, Francesco, Heiko Woith, Luca Pizzino, Alessandra Sciarra, and Cemil Seyis. 2025. "Geochemical and Isotopic Features of Geothermal Fluids Around the Sea of Marmara, NW Turkey" Geosciences 15, no. 3: 83. https://doi.org/10.3390/geosciences15030083
APA StyleItaliano, F., Woith, H., Pizzino, L., Sciarra, A., & Seyis, C. (2025). Geochemical and Isotopic Features of Geothermal Fluids Around the Sea of Marmara, NW Turkey. Geosciences, 15(3), 83. https://doi.org/10.3390/geosciences15030083