Abstract
This study presents a 3D seismic velocity model of the crust beneath northwestern Iran. The data include arrival times of 76,589 P-waves and 10,796 S-waves from 7245 events recorded by 233 stations. The seismic velocity model presented in this research provides a detailed understanding of the crustal structure and tectonic processes shaping northwestern Iran. The interplay between volcanism, fault activity and mantle dynamics has produced a complex velocity structure. The findings in the region offer new insights into the geodynamic evolution of this tectonically active area. Understanding these features is crucial for assessing the region’s seismic hazard and geothermal potential, particularly in light of its active tectonic faults and volcanic systems. Moreover, the crust of northwestern Iran represents a two-layered structure: a high P-velocity upper crust and low-velocity lower crust. The authors documented a similar structure on the basis of tomographic data of different collision regions, such as Eastern Anatolia, Tien Shan and Pamir–Hindu Kush. The structure concerned is supposed to be due to delamination processes in the upper mantle.
1. Interpretation
The northwestern (NW) region of Iran is part of the seismically active Alpine–Himalayan orogenic belt [1], which is affected by the convergence of the Arabia–Eurasia continental collision zone. This region is squeezed between the prominent thrust belts of the Caucasus to the north and the transpressional tectonics in the Zagros collision zone to the south, providing a complex seismotectonic pattern [1,2]. The ongoing continental convergence has formed primarily through right-lateral strike-slip faulting trending 150 km north to northwest in the region named the North Tabriz Fault (NTF) [3,4,5]. Ref. [3] proposed that the NTF has a crucial role in partial transferring of the ongoing deformation initiated by the North Anatolian and East Anatolian Fault in Turkey towards the Alborz and Zagros mountain belt in Iran. The NTF has been associated with many historical earthquakes with magnitudes larger than 6 [6]. The region is also the location of two prominent volcanic mountains named Sabalan and Sahand. These volcanoes, ranging from basaltic to rhyolitic compositions [7], are part of a vast magmatic province stretching across eastern Iran and western Anatolia. Studying the deep structure of the crust and mantle is essential for understanding the geodynamic framework of the regional collisional processes.
In the Iranian plateau, various geophysical multiscale studies have focused on the crust and Moho structure, using both seismic and non-seismic data. Ref. [8], by means of regional 3D seismic velocity tomographic method, revealed an ongoing formation of a felsic lower crustal channel by delamination in the Zagros collision zone. Mantle structures beneath the Zagros have been investigated through regional tomographic techniques that utilize both body- and surface-wave data [9,10,11,12]. Studies by [13,14] identified a thick lithosphere beneath the Zagros, interpreted as evidence of oceanic slab detachment within the Zagros collision zone. Ref. [15] studied shallow crustal structure in NW Iran using multi-frequency P-wave receiver functions. Ref. [16] presented a new 2D crustal-scale model of the northwestern Iranian plateau, on the basis of gravity-magnetic modeling. Their results indicated a highly extended continental crust for the South Caspian Basin (SCB). Ref. [17] analyzed an integration of surface waves and gravity data to the assessment of crustal and upper-mantle structure beneath NW Iran. Regional travel-time tomography conducted by [18] revealed a subducting slab beneath the Zagros, transitioning to a nearly 90-degree dip angle across the upper/lower mantle boundary. In the northwest of Iran, Ref. [19] employed the local earthquake tomographic method to investigate the 3D crustal structure of the northwest Alborz region. The results revealed high- and low-velocity anomalies at various depths, correlating with surface geological features. These anomalies pointed out a heterogeneous crust with significant variations in rock types and structural orientations. Their study highlighted the influence of the NTF on the region’s crustal structure, revealing variations in the fault geometry and its impact on seismicity. Ref. [20] utilized the ambient noise tomographic method to analyze Rayleigh wave group velocities in northwestern Iran. Their results showed a significant variation in the subsurface velocities, indicating differences in lithological features and tectonic activity. Seismic anisotropy and mantle deformation in NW Iran were addressed by [21]. The results highlighted the presence of complex structures in the crust and mantle, shaped by tectonic activities in the region. Ref. [22] performed the Hedgehog nonlinear inversion on Rayleigh wave group velocity dispersion curves to investigate lateral variation in crustal and upper mantle structures in NW Iran. Ref. [23] employed the regional 3D Pg velocity tomographic method to examine the upper crustal structure of NW Iran. They found a high correlation between the location of the majority of high-magnitude events and the location of low-velocity regions within the seismogenic layer. In recent years, there have been several studies on the attenuation of high-frequency body and coda waves in the Iranian plateau [24,25,26,27,28,29,30,31]. Ref. [32] extracted spatial variations in seismic attenuation in the NW of the Iranian plateau from coda-wave analysis. According to their results, the crust beneath NW Iran is dominated by a high attenuation pattern, which is correlated with Quaternary volcanic deposits, as well as with the Sahand–Sabalan volcanic zone and NTF.
In the presented study, we employed the local earthquake tomographic method, which uses arrival time data for stations and earthquakes located in the study area. The derived detailed information about the crustal seismic structures can help us to understand potential relationships between different lithospheric features of the region. Furthermore, our results appear to complement the previous studies conducted in this region.
2. Geological Features and Tectonic Setting of Northwestern Iran
Northwestern Iran lies within the Arabia–Eurasia continental collision zone, characterized by a complex transpressional tectonic regime and significant seismic activity. A simplified map with the main geological structures in the Iranian plateau is presented in Figure 1.
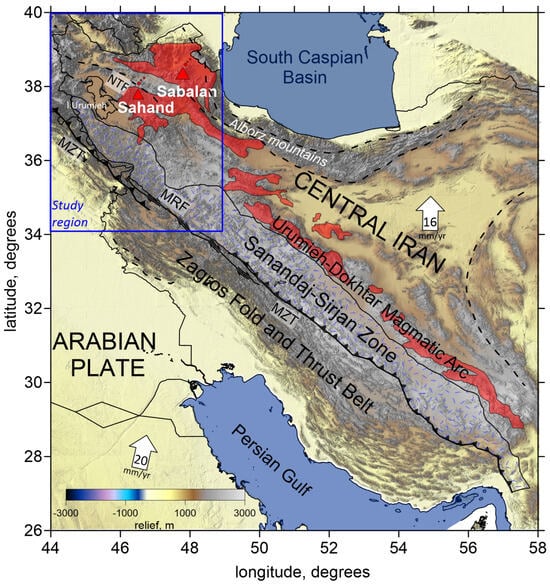
Figure 1.
Topography of the Iranian plateau with the main geological structures. The study area is shown by a blue rectangle. There are different structural elements related to the Zagros collision zone, from southwest to northeast: the Zagros Fold and Thrust Belt (ZFTB); the Sanandaj–Sirjan Metamorphic Zone (SSZ); the Urumieh–Dokhtar Magmatic Arc (UDMA). Also depicted in the map are Central Iran; the Alborz mountains; the Main Zagros Thrust Fault (MZT); the Main Recent Fault (MRF); and the North Tabriz Fault (NTF). Red triangles indicate two inactive volcanoes in the study area. Arrows indicate the direction of plate and fault motions, with indication of speed in mm per year. Plain thin black lines indicate political boundaries; other lines indicate different types of faults.
A zoom of the map with the main geological units in the study area of NW Iran is shown in Figure 2. To the north, the region is bounded by the prominent Lesser Caucasus thrust belt and its eastward continuation to the Talesh and Alborz mountains, flanking the South Caspian Basin. To the south, the study area is limited by the Zagros belt; to the west, it is bounded by Eastern Anatolia. The Zagros belt can be subdivided into three different zones: the Zagros Fold and Thrust Belt (ZFTB); the Sanandaj–Sirjan Metamorphic Zone (SSZ); and the Urumieh–Dokhtar Magmatic Arc (UDMA).

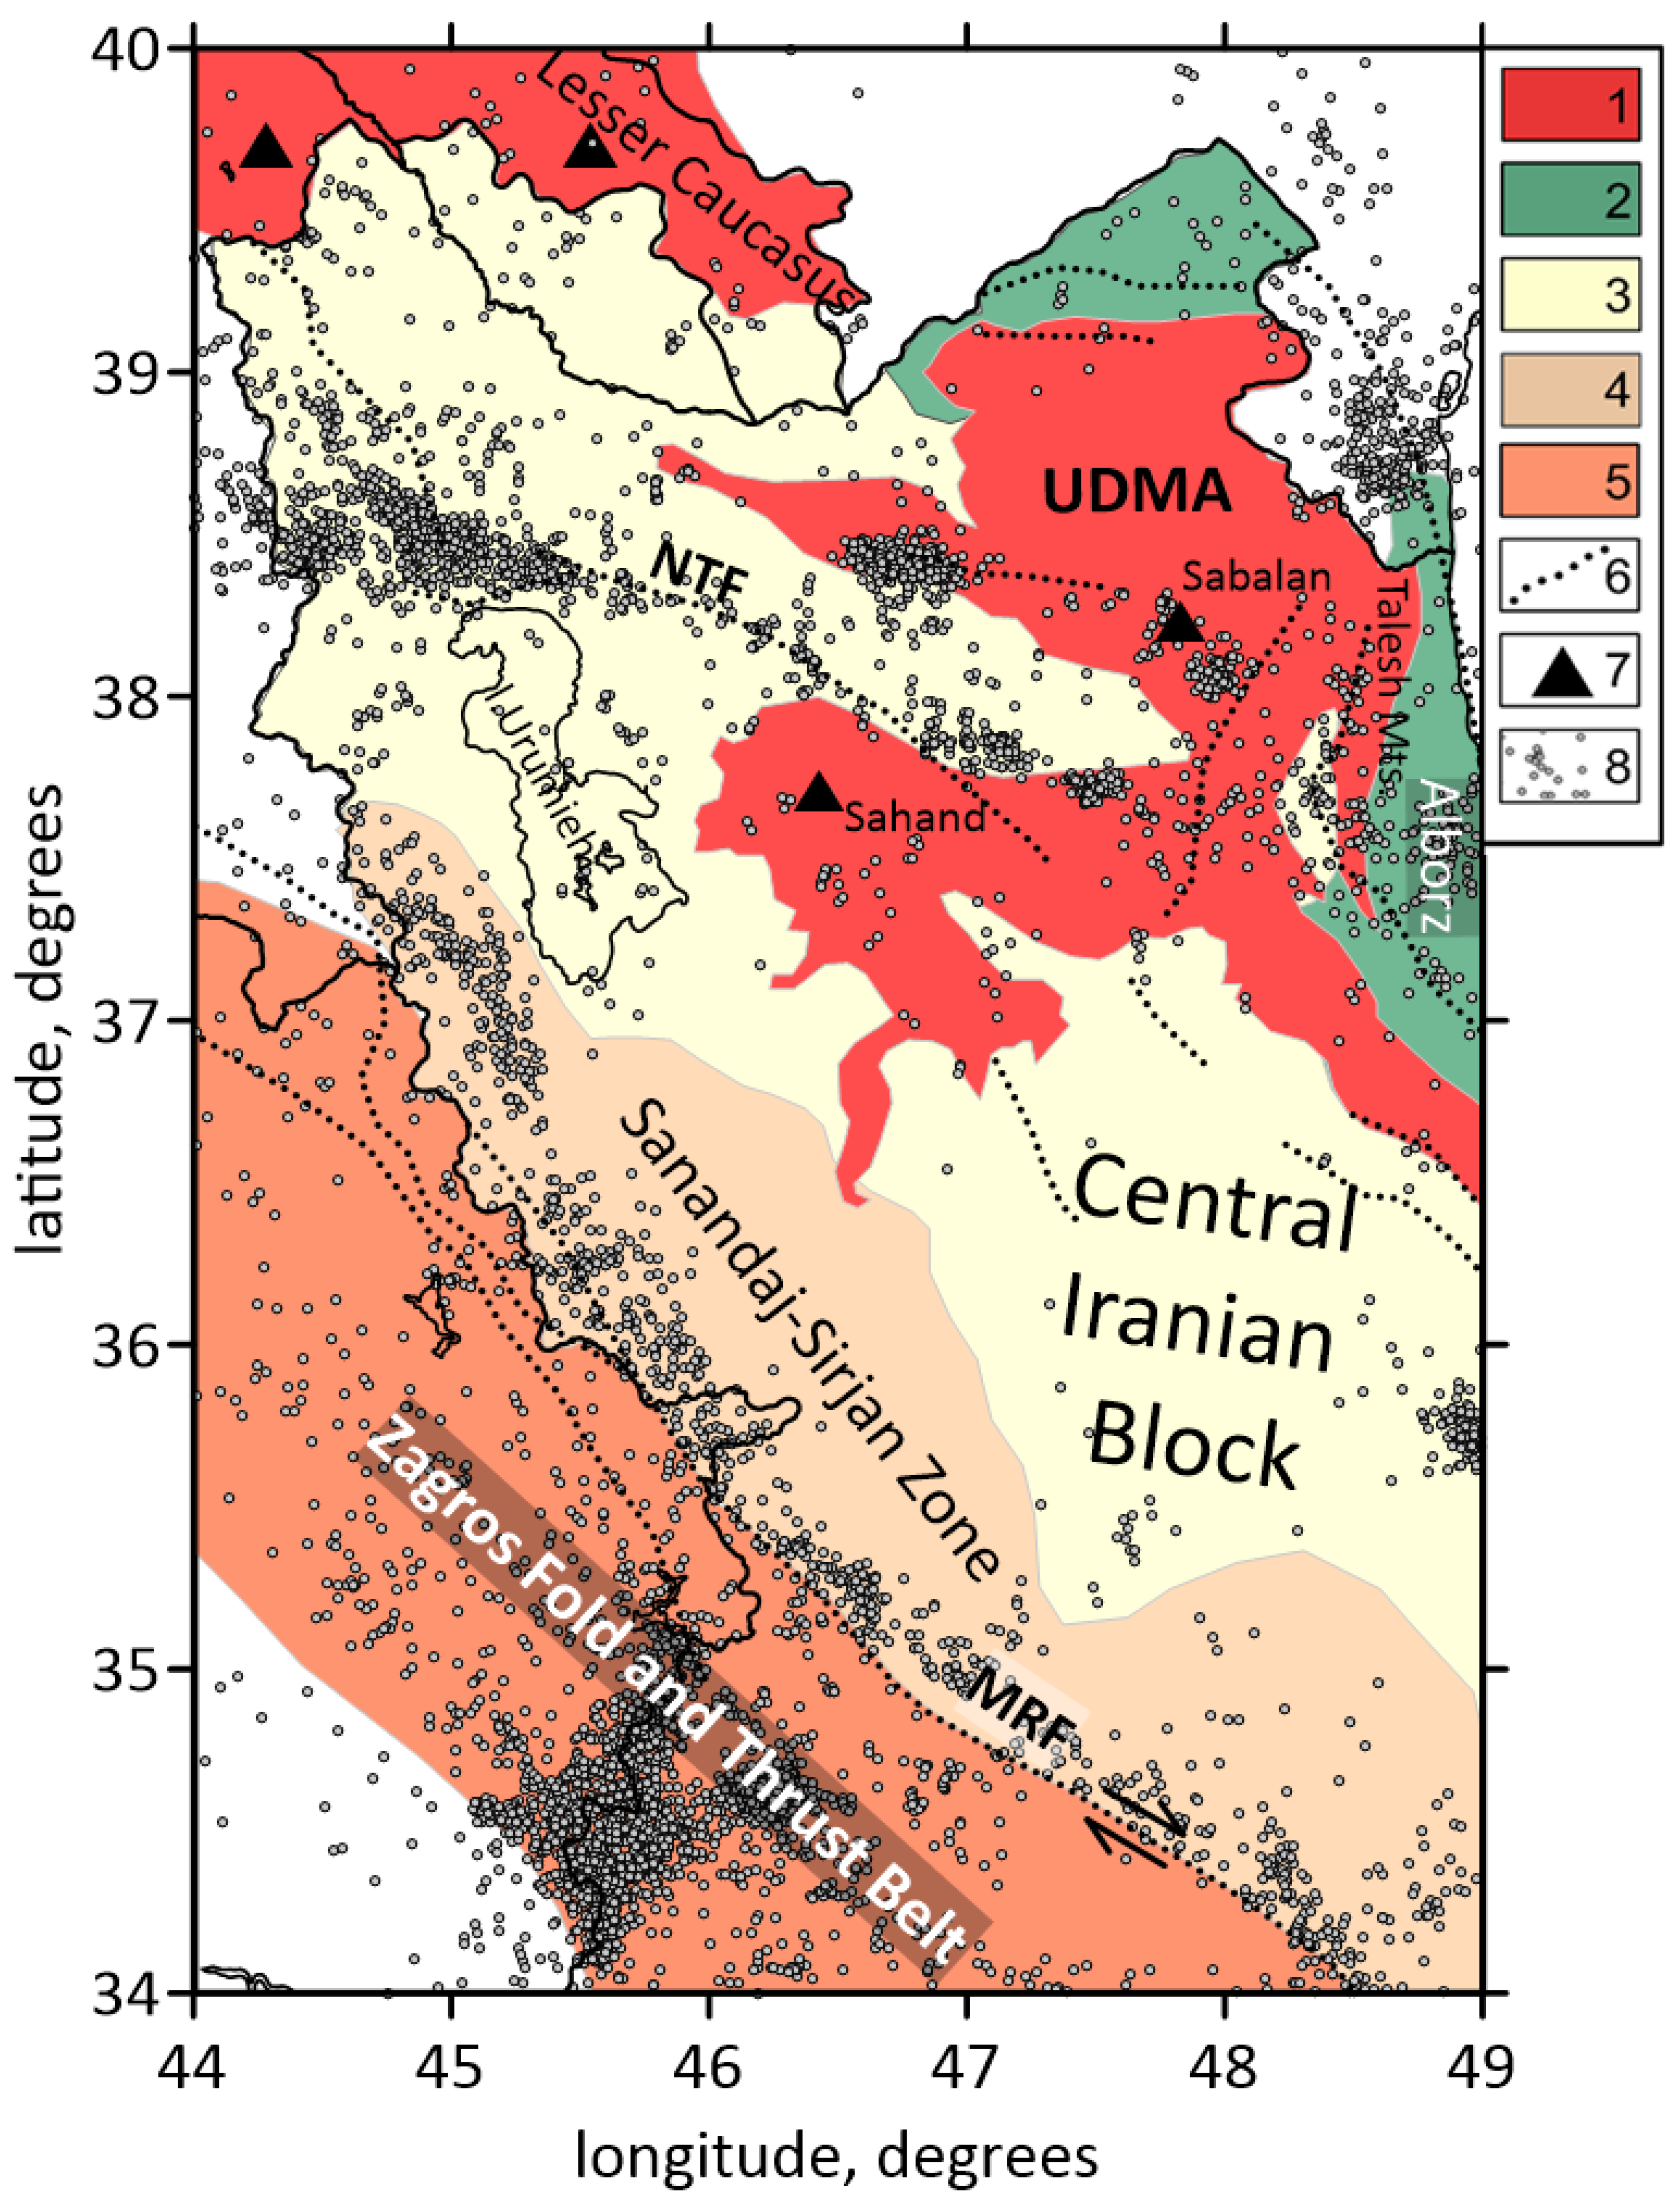
Figure 2.
Geological units and active faults of the study area by [33,34]. Abbreviations: NTF—the North Tabriz Fault; MRF—the Main Recent Fault; UDMA—the Urumieh–Dokhtar Magmatic Arc. Legend: 1—Mid-Cenozoic calc-alkaline volcanic rocks; 2—Paleo-Tethys basin; 3—Central Domain; 4—Sanandaj–Sirjan metamorphic zone; 5—Zagros Fold and Thrust Belt; 6—regional faults; 7—volcanoes; 8—seismic events. Plain thin black lines indicate political boundaries and costal lines.
The ZFTB is marked by a thick sedimentary cover of about 8 km of Permo–Triassic to Late Cretaceous/Paleocene ages [35]. The SSZ, located northeast of the Main Zagros Thrust Fault (MZT), is mainly composed of Precambrian metamorphic rocks. The UDMA, situated between the SSZ and Central Iran, is composed of intrusive magmatic rocks related to the Neotethys subduction zone [36]. The Zagros belt is also characterized by two major active faults: 1—the Main Zagros Thrust Fault; and 2—the Main Recent Fault (MRF). The MZT forms the suture between the Arabian Plate and the Central Iranian block, following the closure of the Neotethys Ocean [37]. The right-lateral fault MRF marks the tectonic boundary between the northwest Zagros belt and Central Iran (Figure 2). The convergence that is happening at the southern edge of the Eurasian Plate has profoundly shaped the crust and upper mantle structure of NW Iran [38]. Enclosed between the South Caspian Basin (SCB) to the north and Central Iran to the south, lies the Alborz mountain range. The SCB on the northern end acts as a rigid backstop to the forces of continental shortening [39]. Located beyond the Alborz and Talesh mountains, the SCB, an aseismic rigid basement block, has significantly influenced the deformation history of adjacent areas. It is considered either a relic back-arc of the Tethyan Mesozoic subduction or an unusually thick oceanic-like crust segment trapped within a continental collision zone [40,41,42]. The South Caspian Basin’s low elevation and its southwest motion relative to Central Iran suggest underthrusting beneath the Talesh and Alborz mountains on its western and southern margins [37,43]. Detailed seismicity studies along these margins indicate deep earthquakes beneath the Talesh mountains to be occurring only on its Caspian flank, suggesting limited underthrusting [44]. Northwestern Iran has experienced significant volcanic activity throughout the Cenozoic Era. Volcanic rocks in the region range in age from the Eocene to the Quaternary. The Sahand and Sabalan volcanoes are the most dominant features of the Pliocene–Quaternary magmatic activity. Eocene and Oligocene volcanic rocks are associated with arc magmatism [45], while late Miocene to Quaternary volcanic units are believed to have formed in a post-collisional setting, becoming progressively younger from west to east [46,47]. The earliest post-collisional magmatism, dated to the late Miocene (11 Ma) by [47], occurred just east of Lake Urumieh in the Sahand volcano region. It was followed by late Miocene to Pliocene eruptions (6.5–4.2 Ma), and subsequently by Quaternary eruptions at the Sabalan volcano (<0.4 Ma).
3. Method and Data
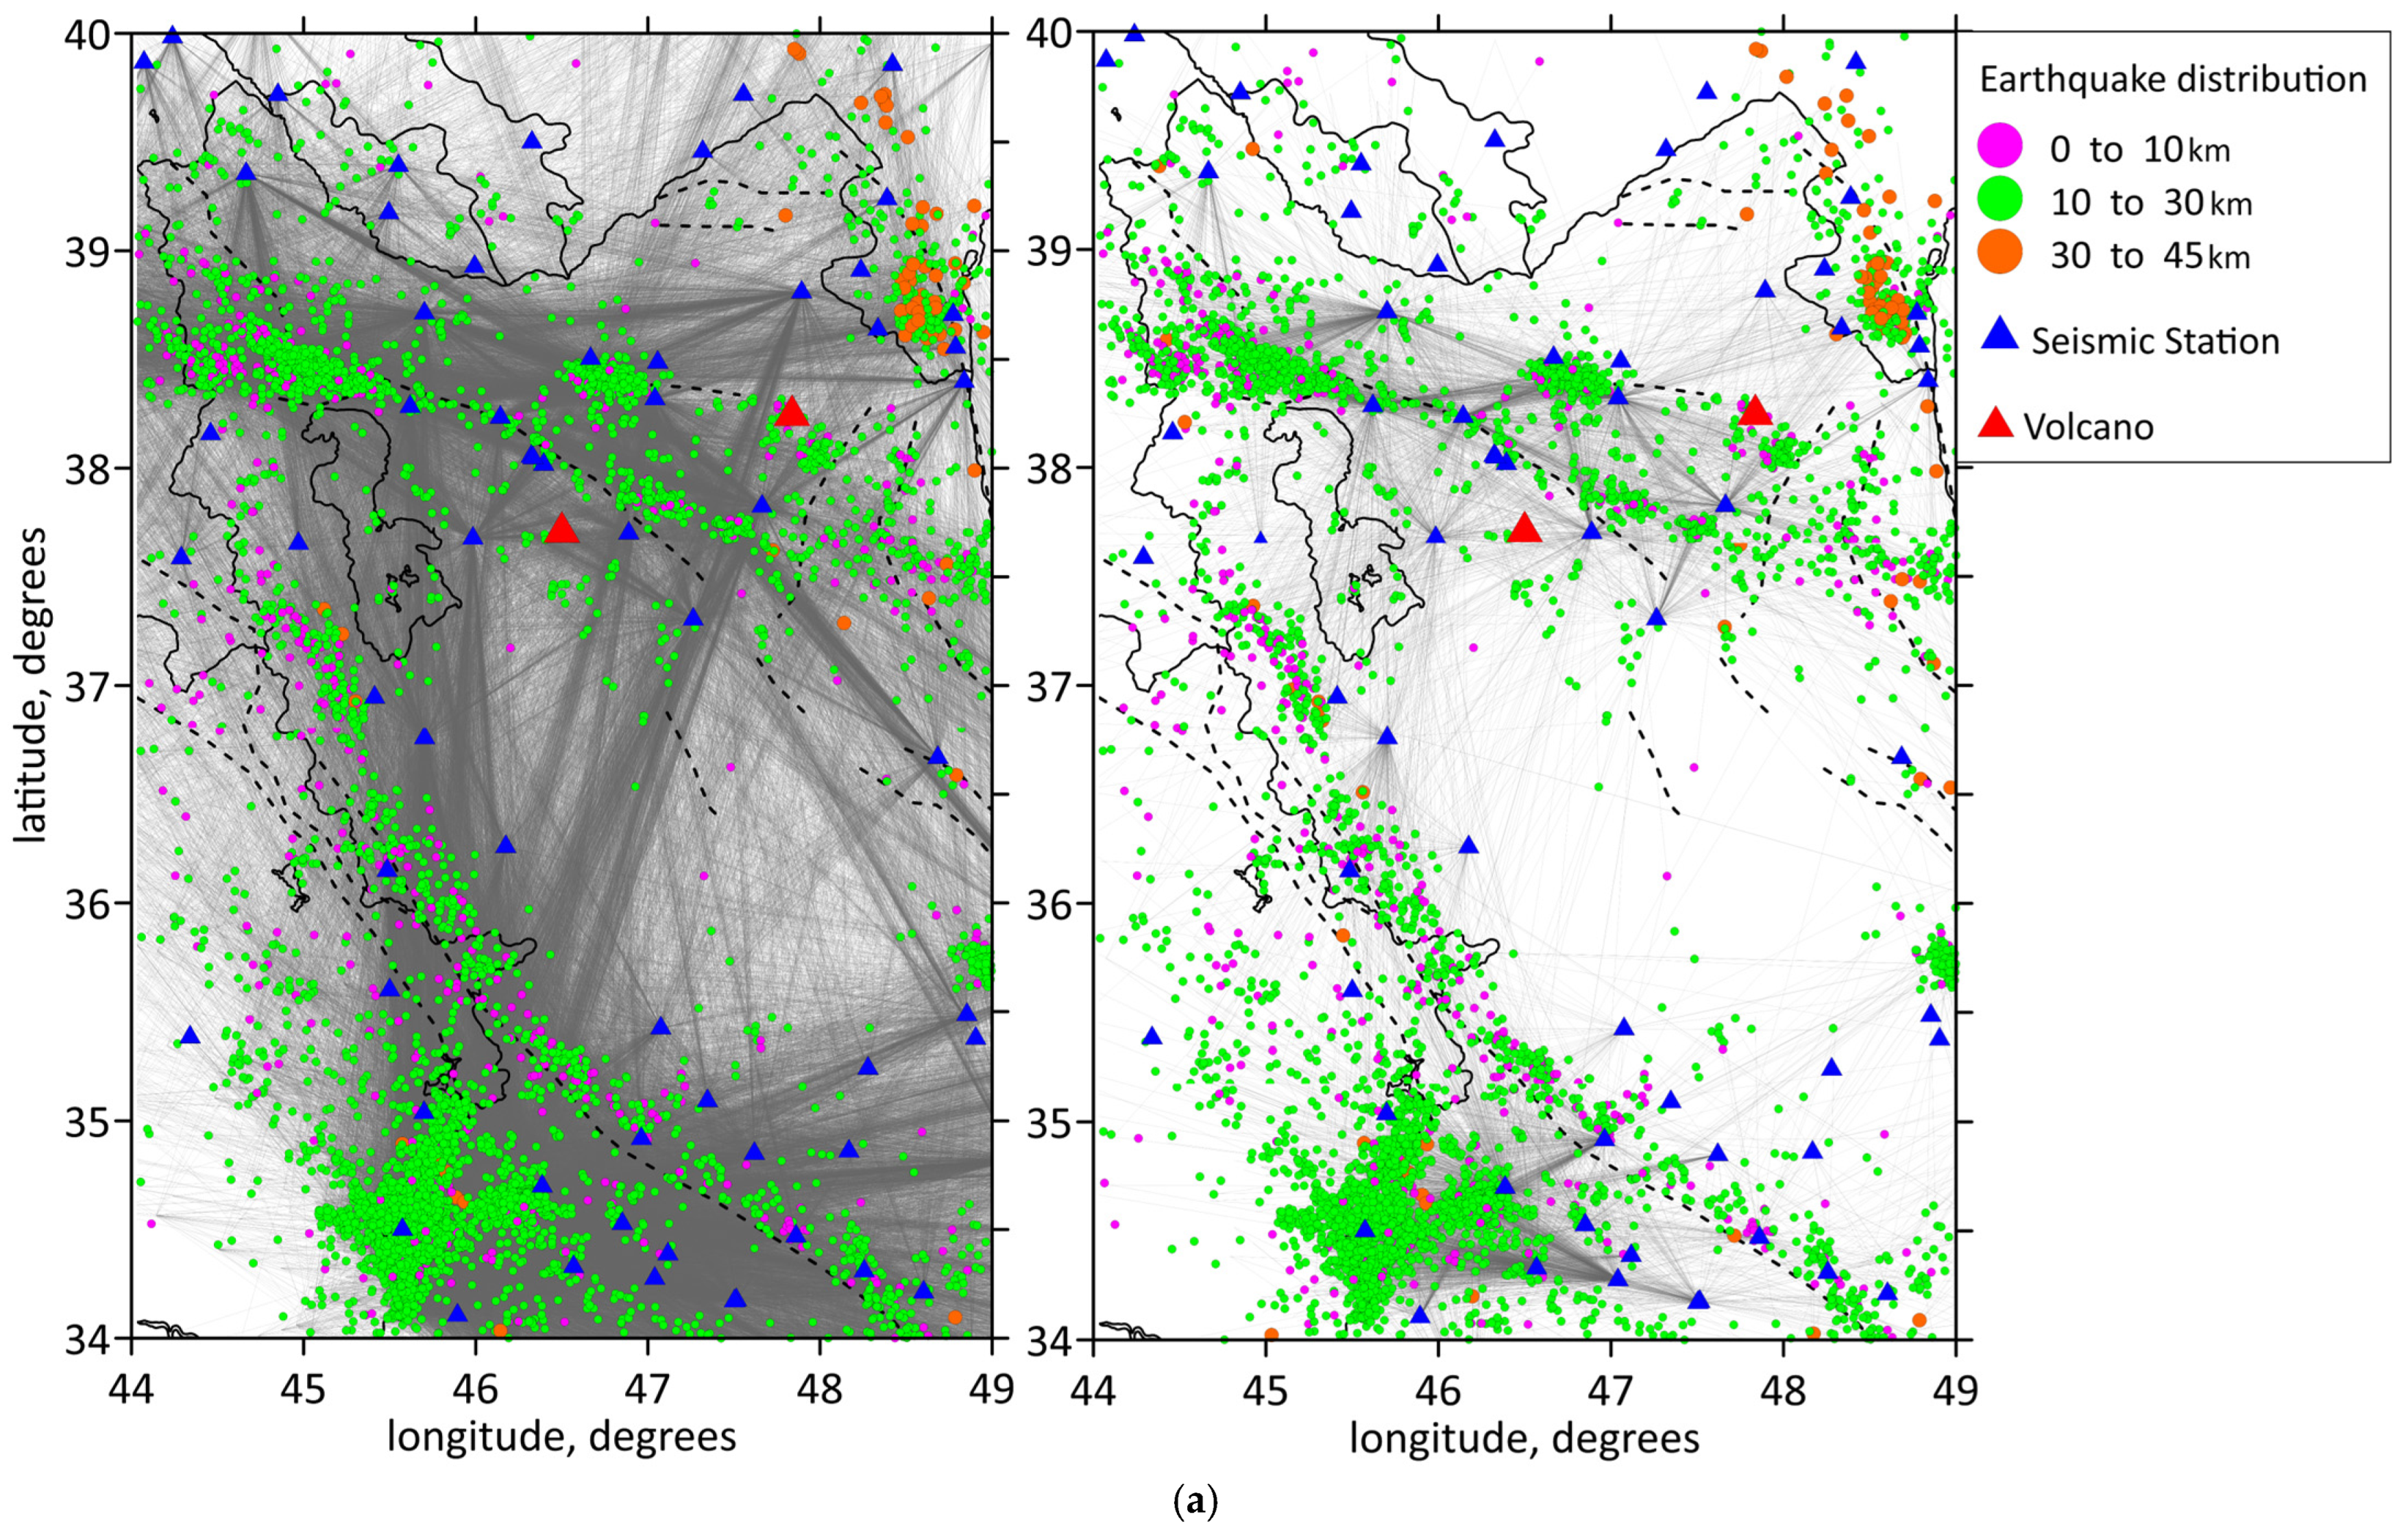
This study utilized arrival time data of P- and S-waves collected from 2006 to 2023 by the Iranian Seismological Center (IRSC). We employed the LOTOS code [48] for simultaneous inversion of 3D distributions of P- and S-wave velocity anomalies and source locations. The dataset used for the tomographic method comprises the arrival times of 110,378 P-waves and 14,485 S-waves from 10,305 events with magnitudes greater than 2.5, recorded by 233 stations. The spatial distribution of earthquakes and stations used in the analysis is illustrated in Figure 3a, where the events are represented according to their depth. The distributions of the P- and S-wave ray coverage as well as the source and station locations are presented in Figure 3a,b.

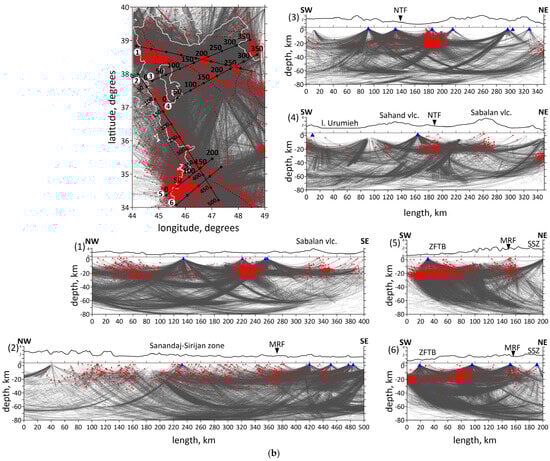
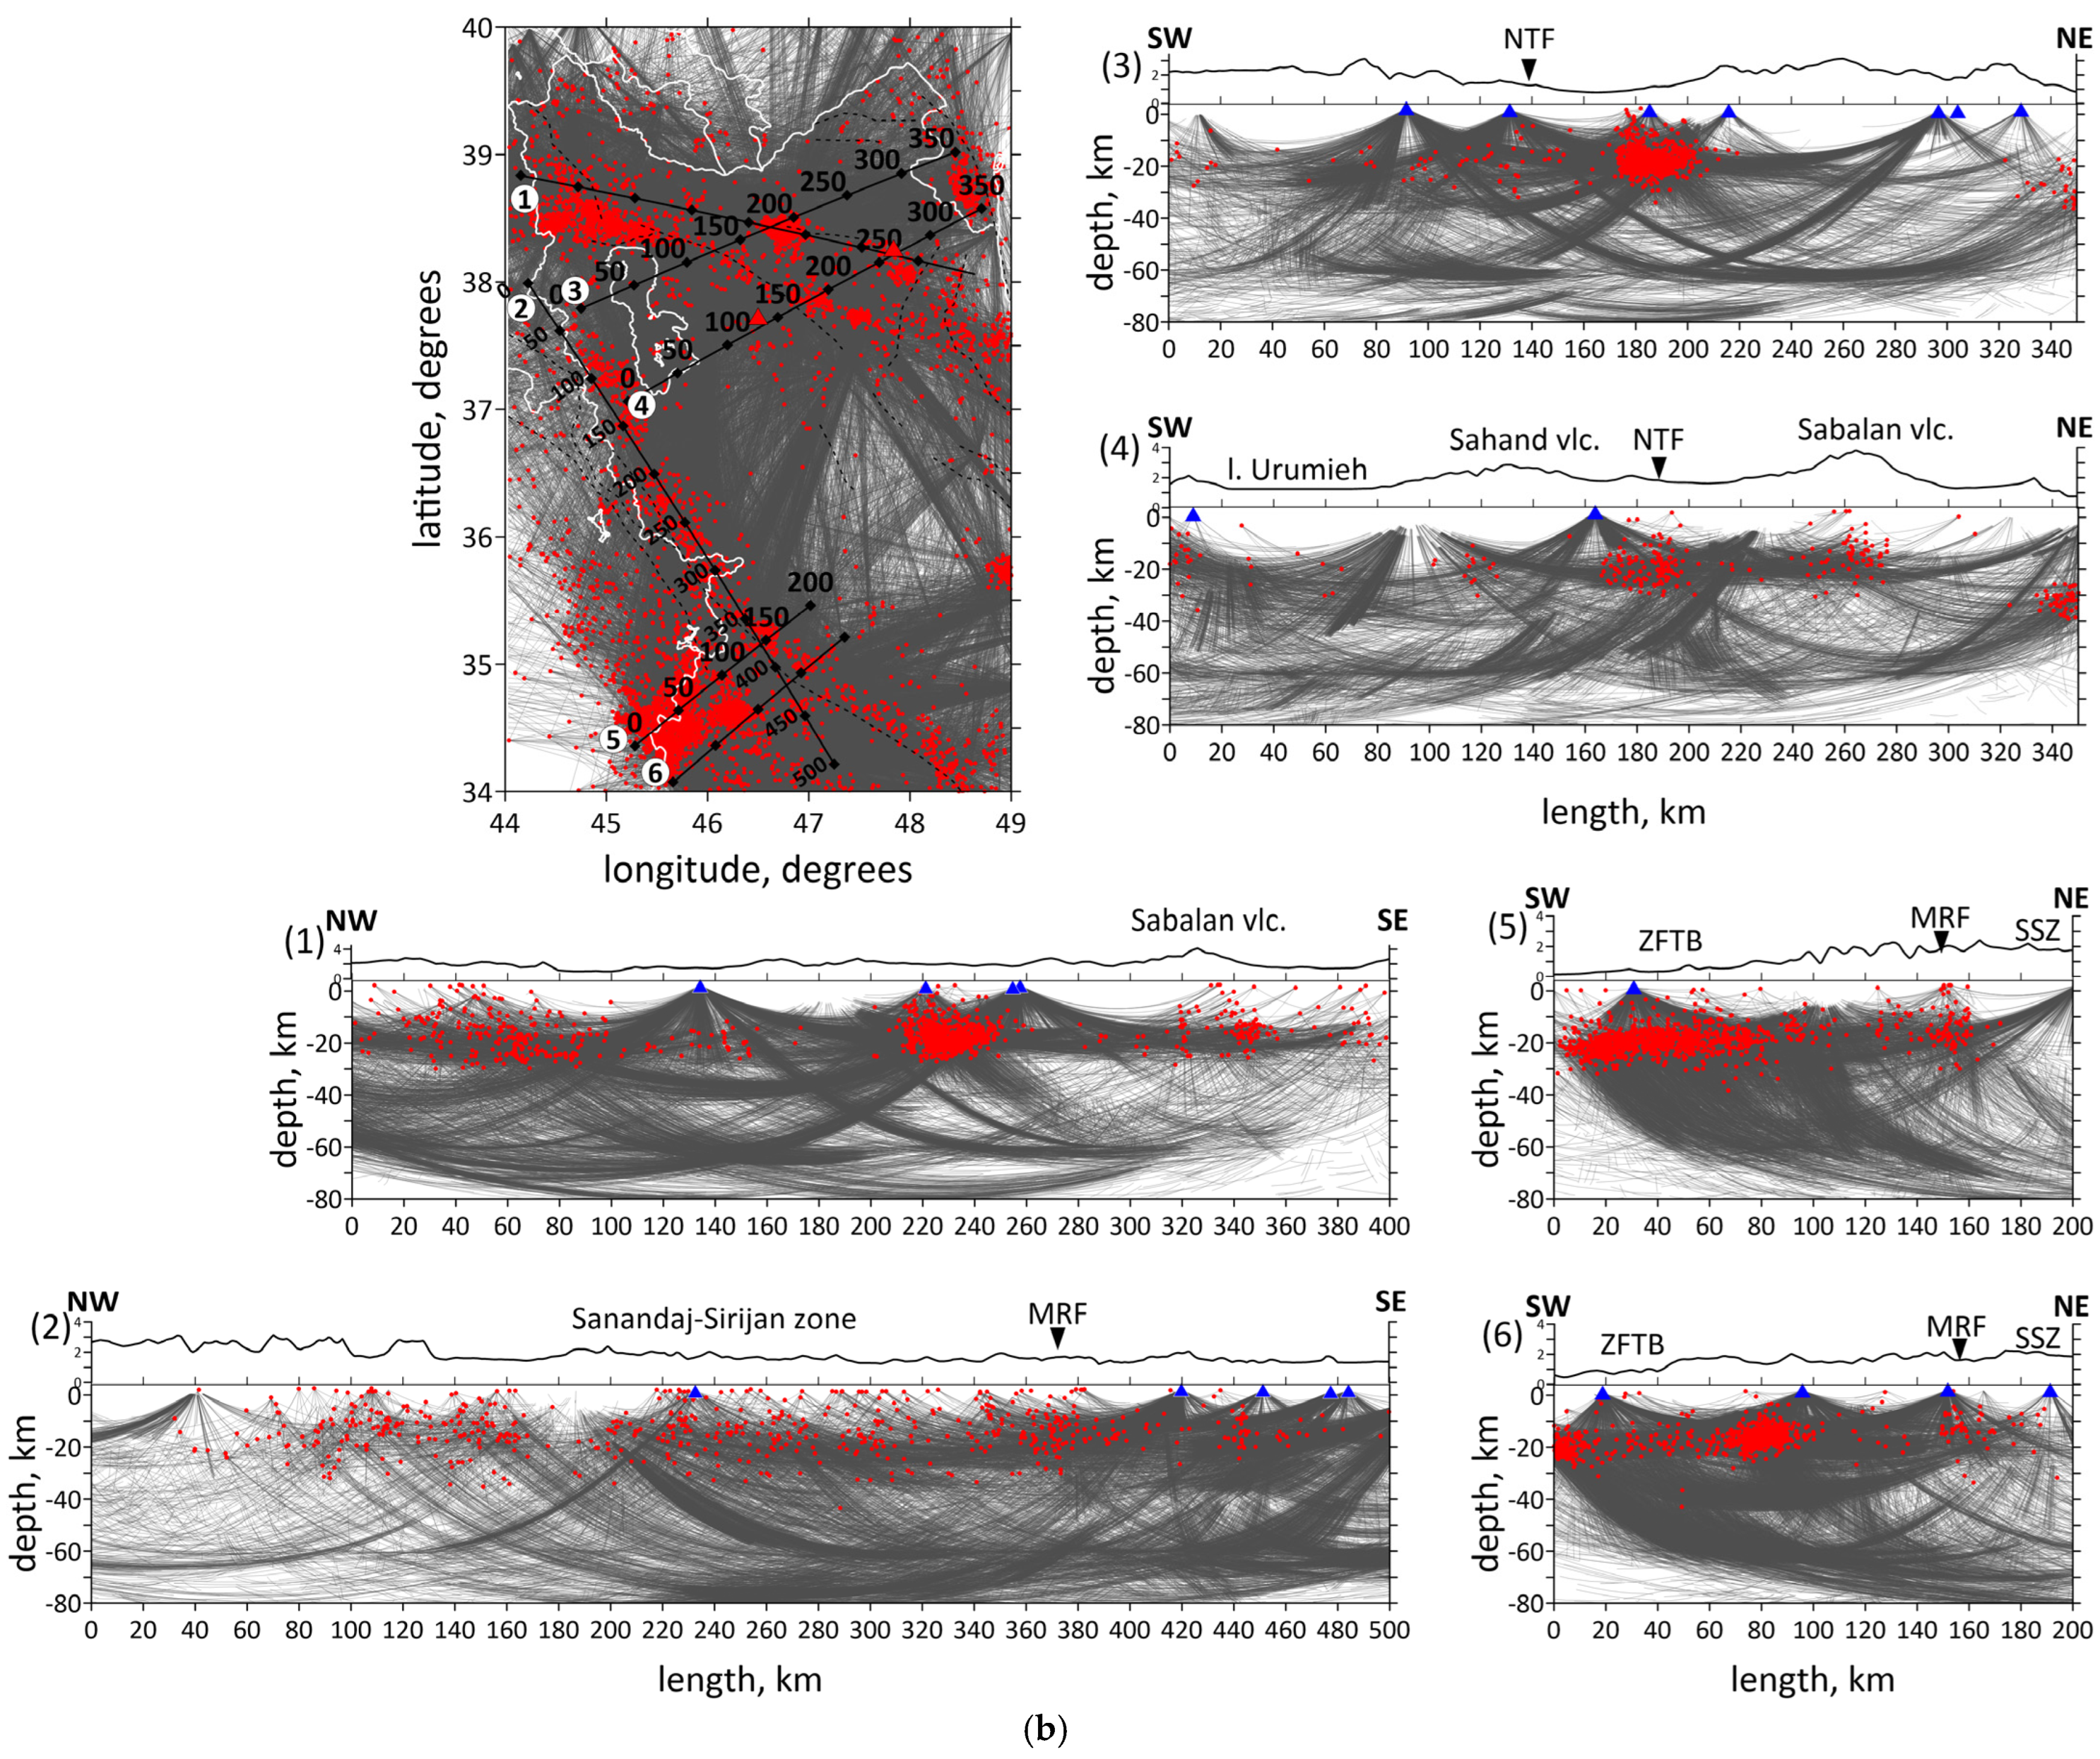
Figure 3.
(a) Data distribution. Locations of the stations and events in map view. Events are shown by different color dots according to their depth. Shown focal depths of events are after inversion. Blue triangles depict the seismic stations used in this study. Two volcanoes (Sahand and Sabalan) are shown by red triangles. Ray coverage of the study area is shown by gray lines: for P-waves in the left figure, for S-waves in the right figure. Plain thin black lines indicate political boundaries and coastal lines; dotted lines indicate the main faults of the study region. (b) Ray coverage of the initial region. Red dots are the earthquakes; blue triangles are the stations; white lines are the political borders and coastlines; black straight lines are locations of the profiles; black lines at the top of the profiles show topography. Abbreviations: MRF—the Main Recent Fault; NTF—the North Tabriz Fault; SSZ—Sanandaj–Sirjan Metamorphic Zone; ZFTB—Zagros Fold and Thrust Belt.
In this dataset, the stations and events are distributed in approximately same areas. Nevertheless, some events appear to be located outside the station perimeter. Some authors strictly remove such events because of the GAP < 180° criterion. However, as was shown in [49], removal of out-of-network events may worsen the resolution of the velocity model recovery because of the reduction in the ray paths in the study area. For out-of-network events, there is indeed a risk to obtain a larger error of source location determination, which occurs because of a larger size of an uncertainty area of the objective function. At the same time, in this case, for any source location in this uncertainty area, the time residuals would remain stable. Therefore, the tomography model, which is based on the inversion of the residuals, would also remain stable; although the sources might be mislocated. Considering these reasons, we took into consideration all events, including some located outside the station network perimeter.
According to [23,50], most of earthquakes in NW Iran have focal depths shallower than 20 km, and only some events along the Talesh mountains are deeper and may reach 40 km depth. When selecting data for tomography, we excluded events from the initial catalog with the depths of more than 25 km, except for the Talesh region. At all stages of source locations during the iterative procedure, we set the limitation of 25 km for the depths of earthquakes. In this case, fair resolution in the lower crust and uppermost mantle is mostly determined by large source–receiver distances allowing refracted rays to travel at large depths, rather than the depths of events.
The tomographic inversion consists of the following steps: 1—preliminary location of sources; 2—location of sources in the 3D velocity model; 3—simultaneous inversion for P- and S-wave velocity anomalies and earthquake source parameters (4 parameters for each source), using several parameterization grids. Steps 2 and 3 are repeated, in turn, one after another, in several iterations (5 iterations in our case). In the tomographic analysis, part of the data was rejected according to two criteria including the following: 1—using events with at least 7 picks; 2—absolute residuals at the initial location step were limited to 1.7 s, on the basis of expected seismic velocity anomaly sizes and amplitudes in the study area. After applying the criteria, the dataset used for tomographic inversion and source location contained 76,589 P-waves and 10,796 S-waves from 7245 events. The average number of picks per event was ~13.
At the first step of inversion, the user defines a 1D reference velocity model. A proper selection of the initial reference model plays a crucial role in deriving the 3D seismic velocities. We used a 1D velocity model previously obtained by [8] for the whole Zagros collision zone. Further estimates for the optimal 1D velocity perturbation in the reference model were based on iteratively performing a full cycle of the tomographic inversion. Each time the program was run, the starting 1D velocity model was updated according to the average velocity derived in the previous run. The final 1D reference model used for inversion is presented in Table 1.

Table 1.
Reference 1D distribution of P- and S-wave velocities used to calculate the main tomography model.
At the second step, the sources are localized within a 3D velocity model. To calculate the wave travel times, a ray-tracing algorithm, based on the bending method proposed by [51], was applied. The algorithm for determining the most probable source locations is based, similarly to the 1D case, on finding the target function extremum.
After that, the algorithm proceeds to the construction of a parameterization grid in order to obtain a 3D distribution of velocity anomalies. The 3D velocity distribution is parameterized by a set of nodes distributed in the study volume. In the map view, we used the regular grid spacing of 15 km for areas with sufficient ray density (0.05 of the average value). In the vertical direction, the distance between the nodes was inversely dependent on the ray density, but could not be smaller than 5 km. The total number of nodes was ~13,000 and ~4700 for the P- and S-models, respectively. To avoid an effect of the grid orientation upon the results, the inversions were performed in four grids with different basic orientations (0, 22, 45 and 67°) and then combined in a single model.
The inversion is performed simultaneously for P and S anomalies, source corrections and station corrections by the LSQR method [52]. Several iterations are executed, each including the stages of hypocenter refinement, matrix calculation and inversion. In total, we performed five iterations, which provided a compromise between computational cost and minimization of nonlinear effects. The stability of the matrix inversion is regulated by amplitude damping and smoothing, where values were selected based on the recovery results in synthetic tests.
The values of the maximum mean residuals and variance reductions after each iteration of the tomographic inversion employed to derive the main 3D velocity models are given in Table 2. Note that aside from the generally lower accuracy of S-wave picking, the reduction in the S-wave residuals is higher, and reaches 30%. The final deviations of 0.27 and 0.25 s for the P- and S-wave data, respectively, are close to the picking accuracy estimates. Histograms of P-wave travel-time residuals before and after the inversion are shown in Figure 4.
Table 2.
Values of P- and S-wave residuals and their reduction during the iterative tomographic data inversion. AMR stands for absolute mean residual in L1 norm.
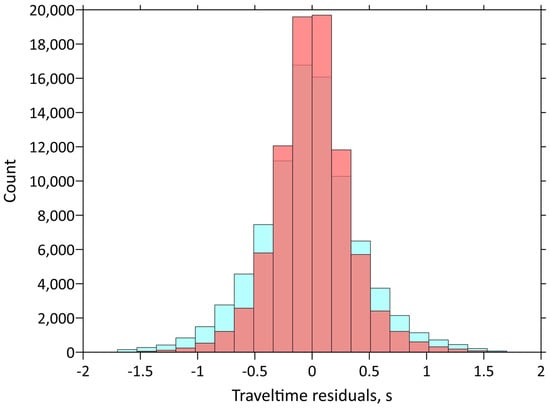
Figure 4.
Histograms of P-wave travel-time residuals before (light blue) and after (red) inversion.
Our 1D velocity model is defined to give continuous velocity anomalies, and it cannot account for sharp interfaces or strong velocity gradients. The LOTOS code has become a popular choice for 3D seismic tomographic studies to build a large number of seismic models in different parts of the world [8,53,54,55,56,57,58]. Detailed information on the structures of the method is given by [48]. The full directory of LOTOS code with data corresponding to this study is available at https://doi.org/10.5281/zenodo.13986243, accessed on 24 October 2024.
4. Results and Tests
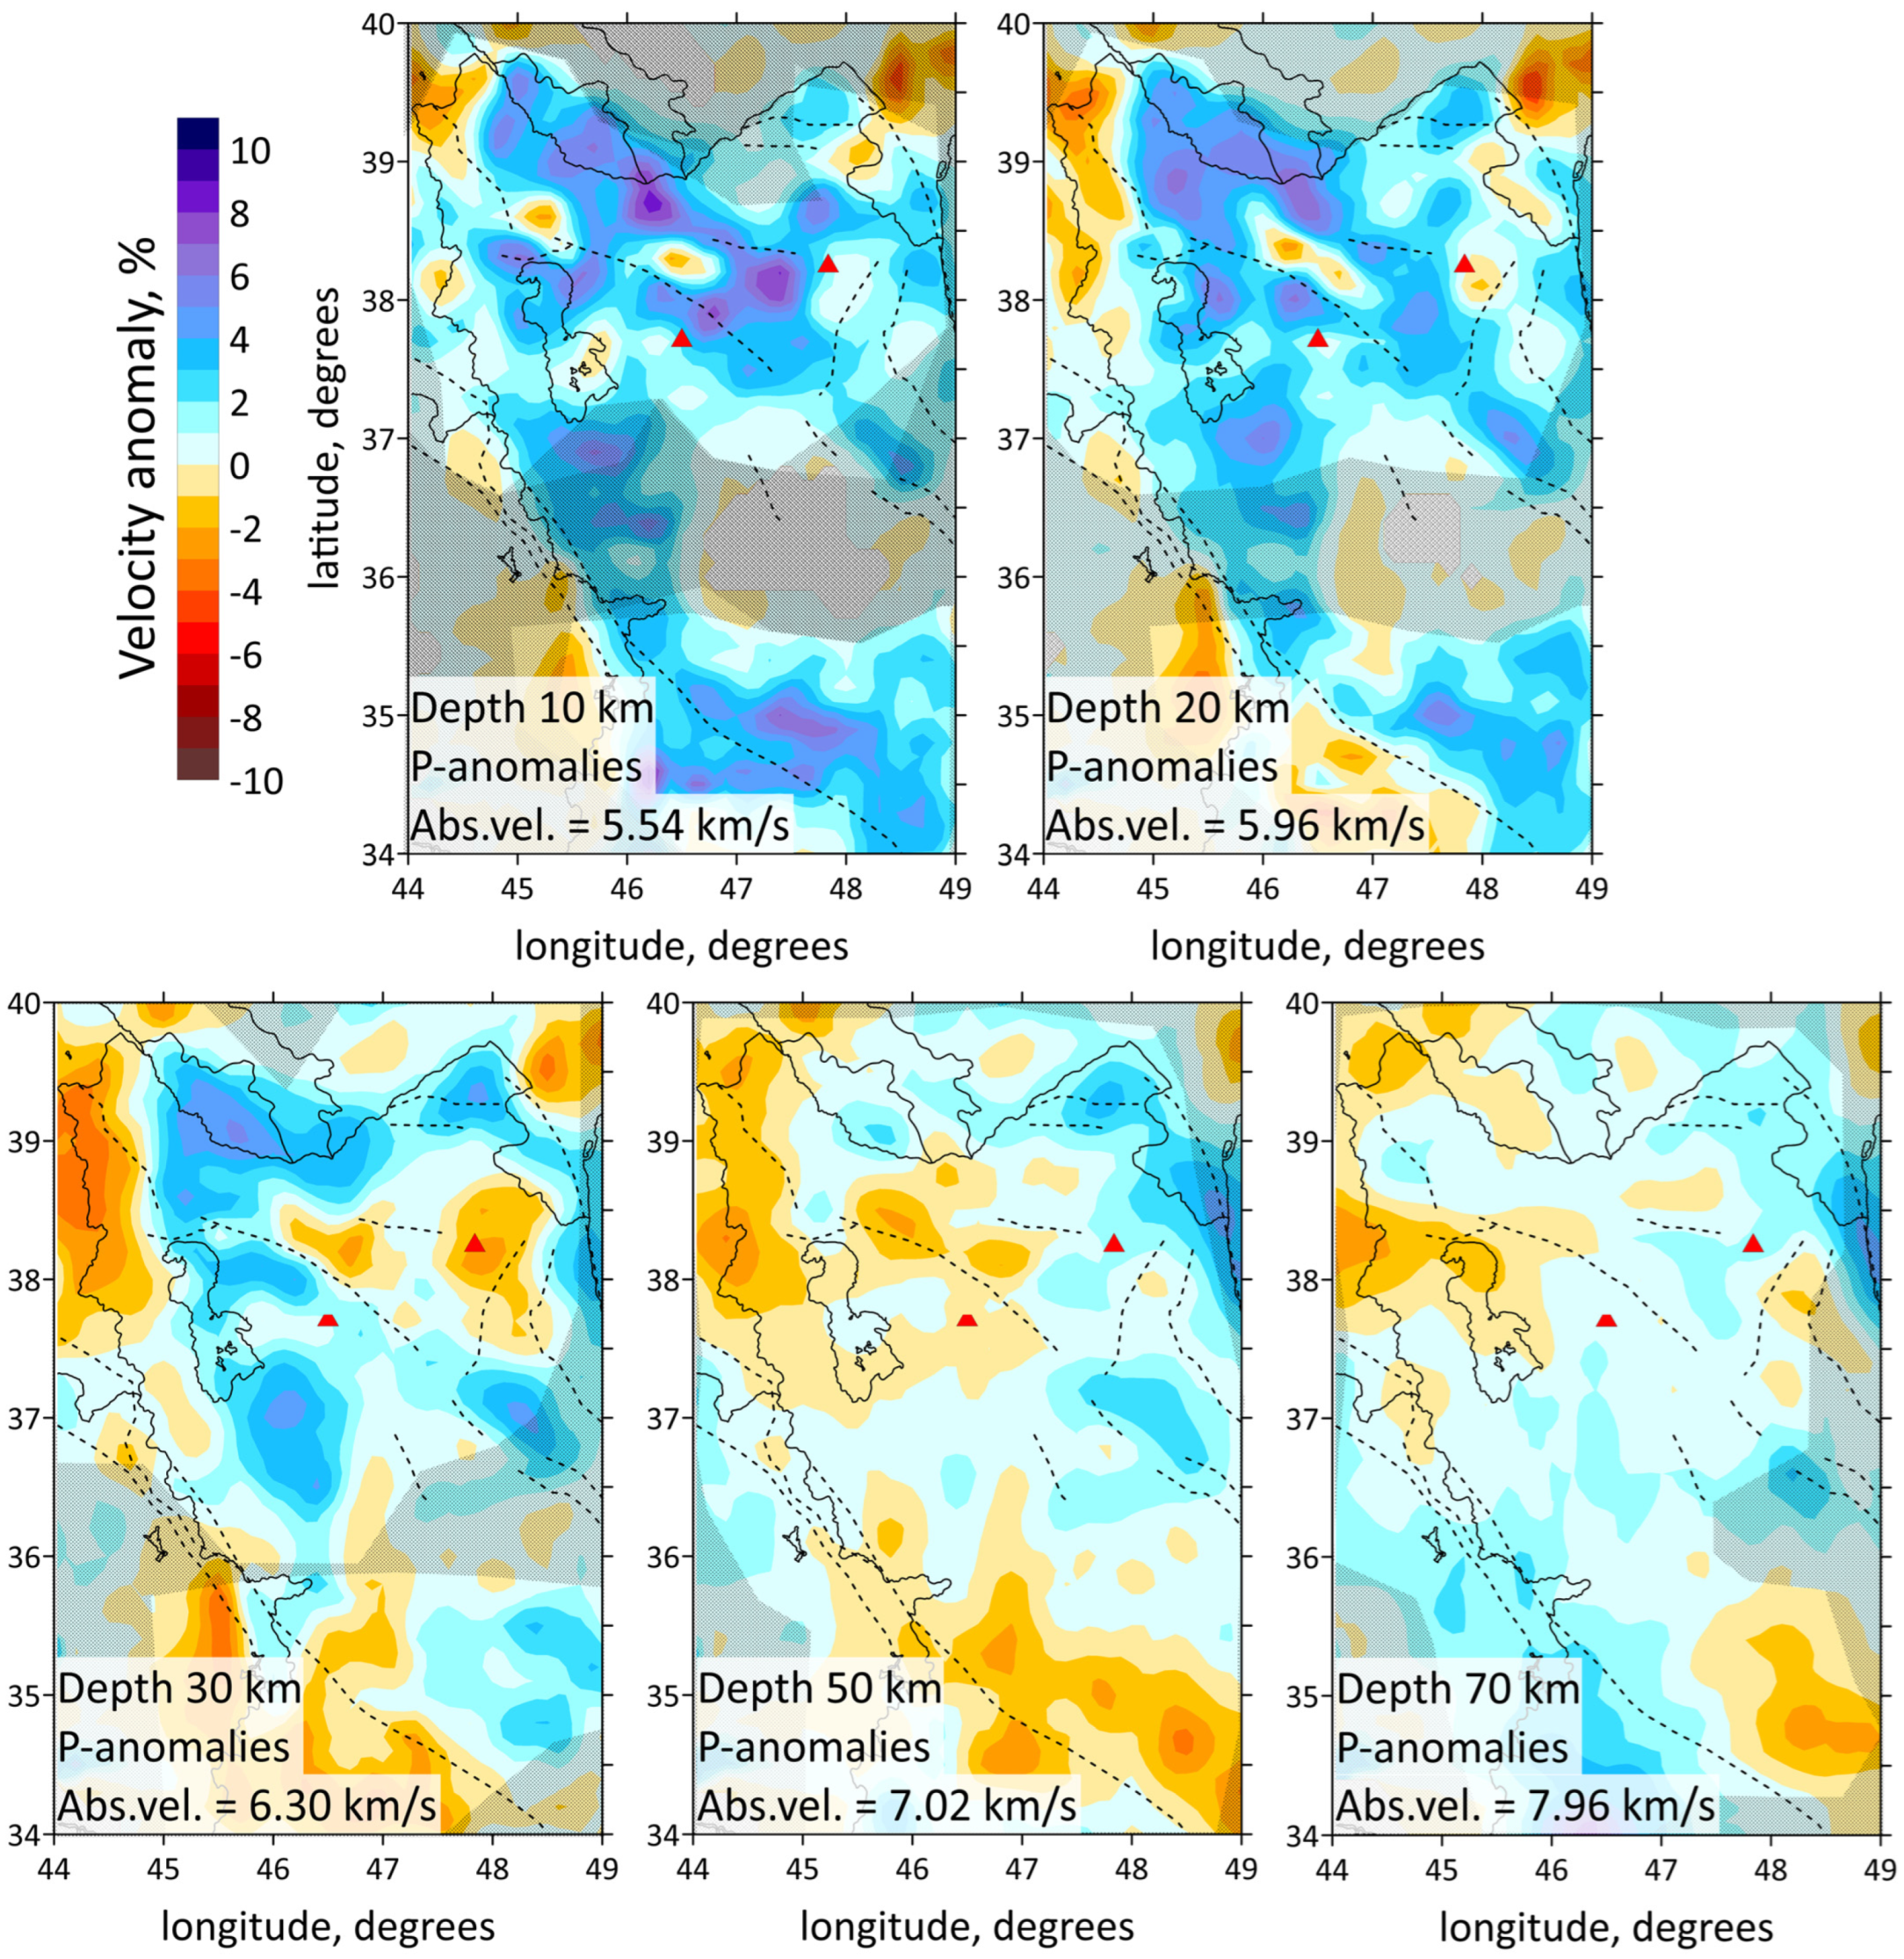
The resulting 3D velocity models are presented in horizontal and vertical velocity sections in Figure 5 and Figure 6a, respectively. The horizontal sections of the P-wave velocity anomaly models are displayed at depths of 10 km, 20 km, 30 km, 50 km and 70 km in Figure 5. The distribution of both P- and S-wave data is shown in Figure 3a. This figure demonstrates a significant difference in the density distribution of P- and S-waves. Note that the number of S-wave picks is 9 times less than P-wave picks. P-rays are distributed across almost the entire region, except for the central part, southwestern part and northern part, where seismic stations are absent. In contrast, the S-wave ray density lacks uniform coverage, with most S-rays concentrated in the northern part of the study area, east of Lake Urumieh, and in the southern section around the ZFTB earthquake cluster. It was decided not to show the result of inversion of S-waves because of bad resolution.
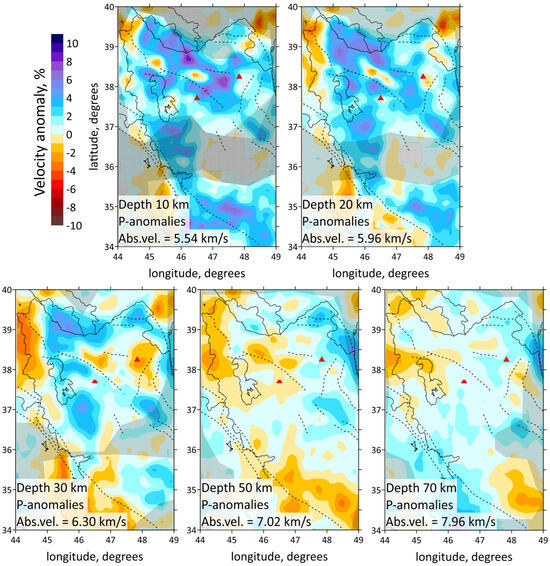
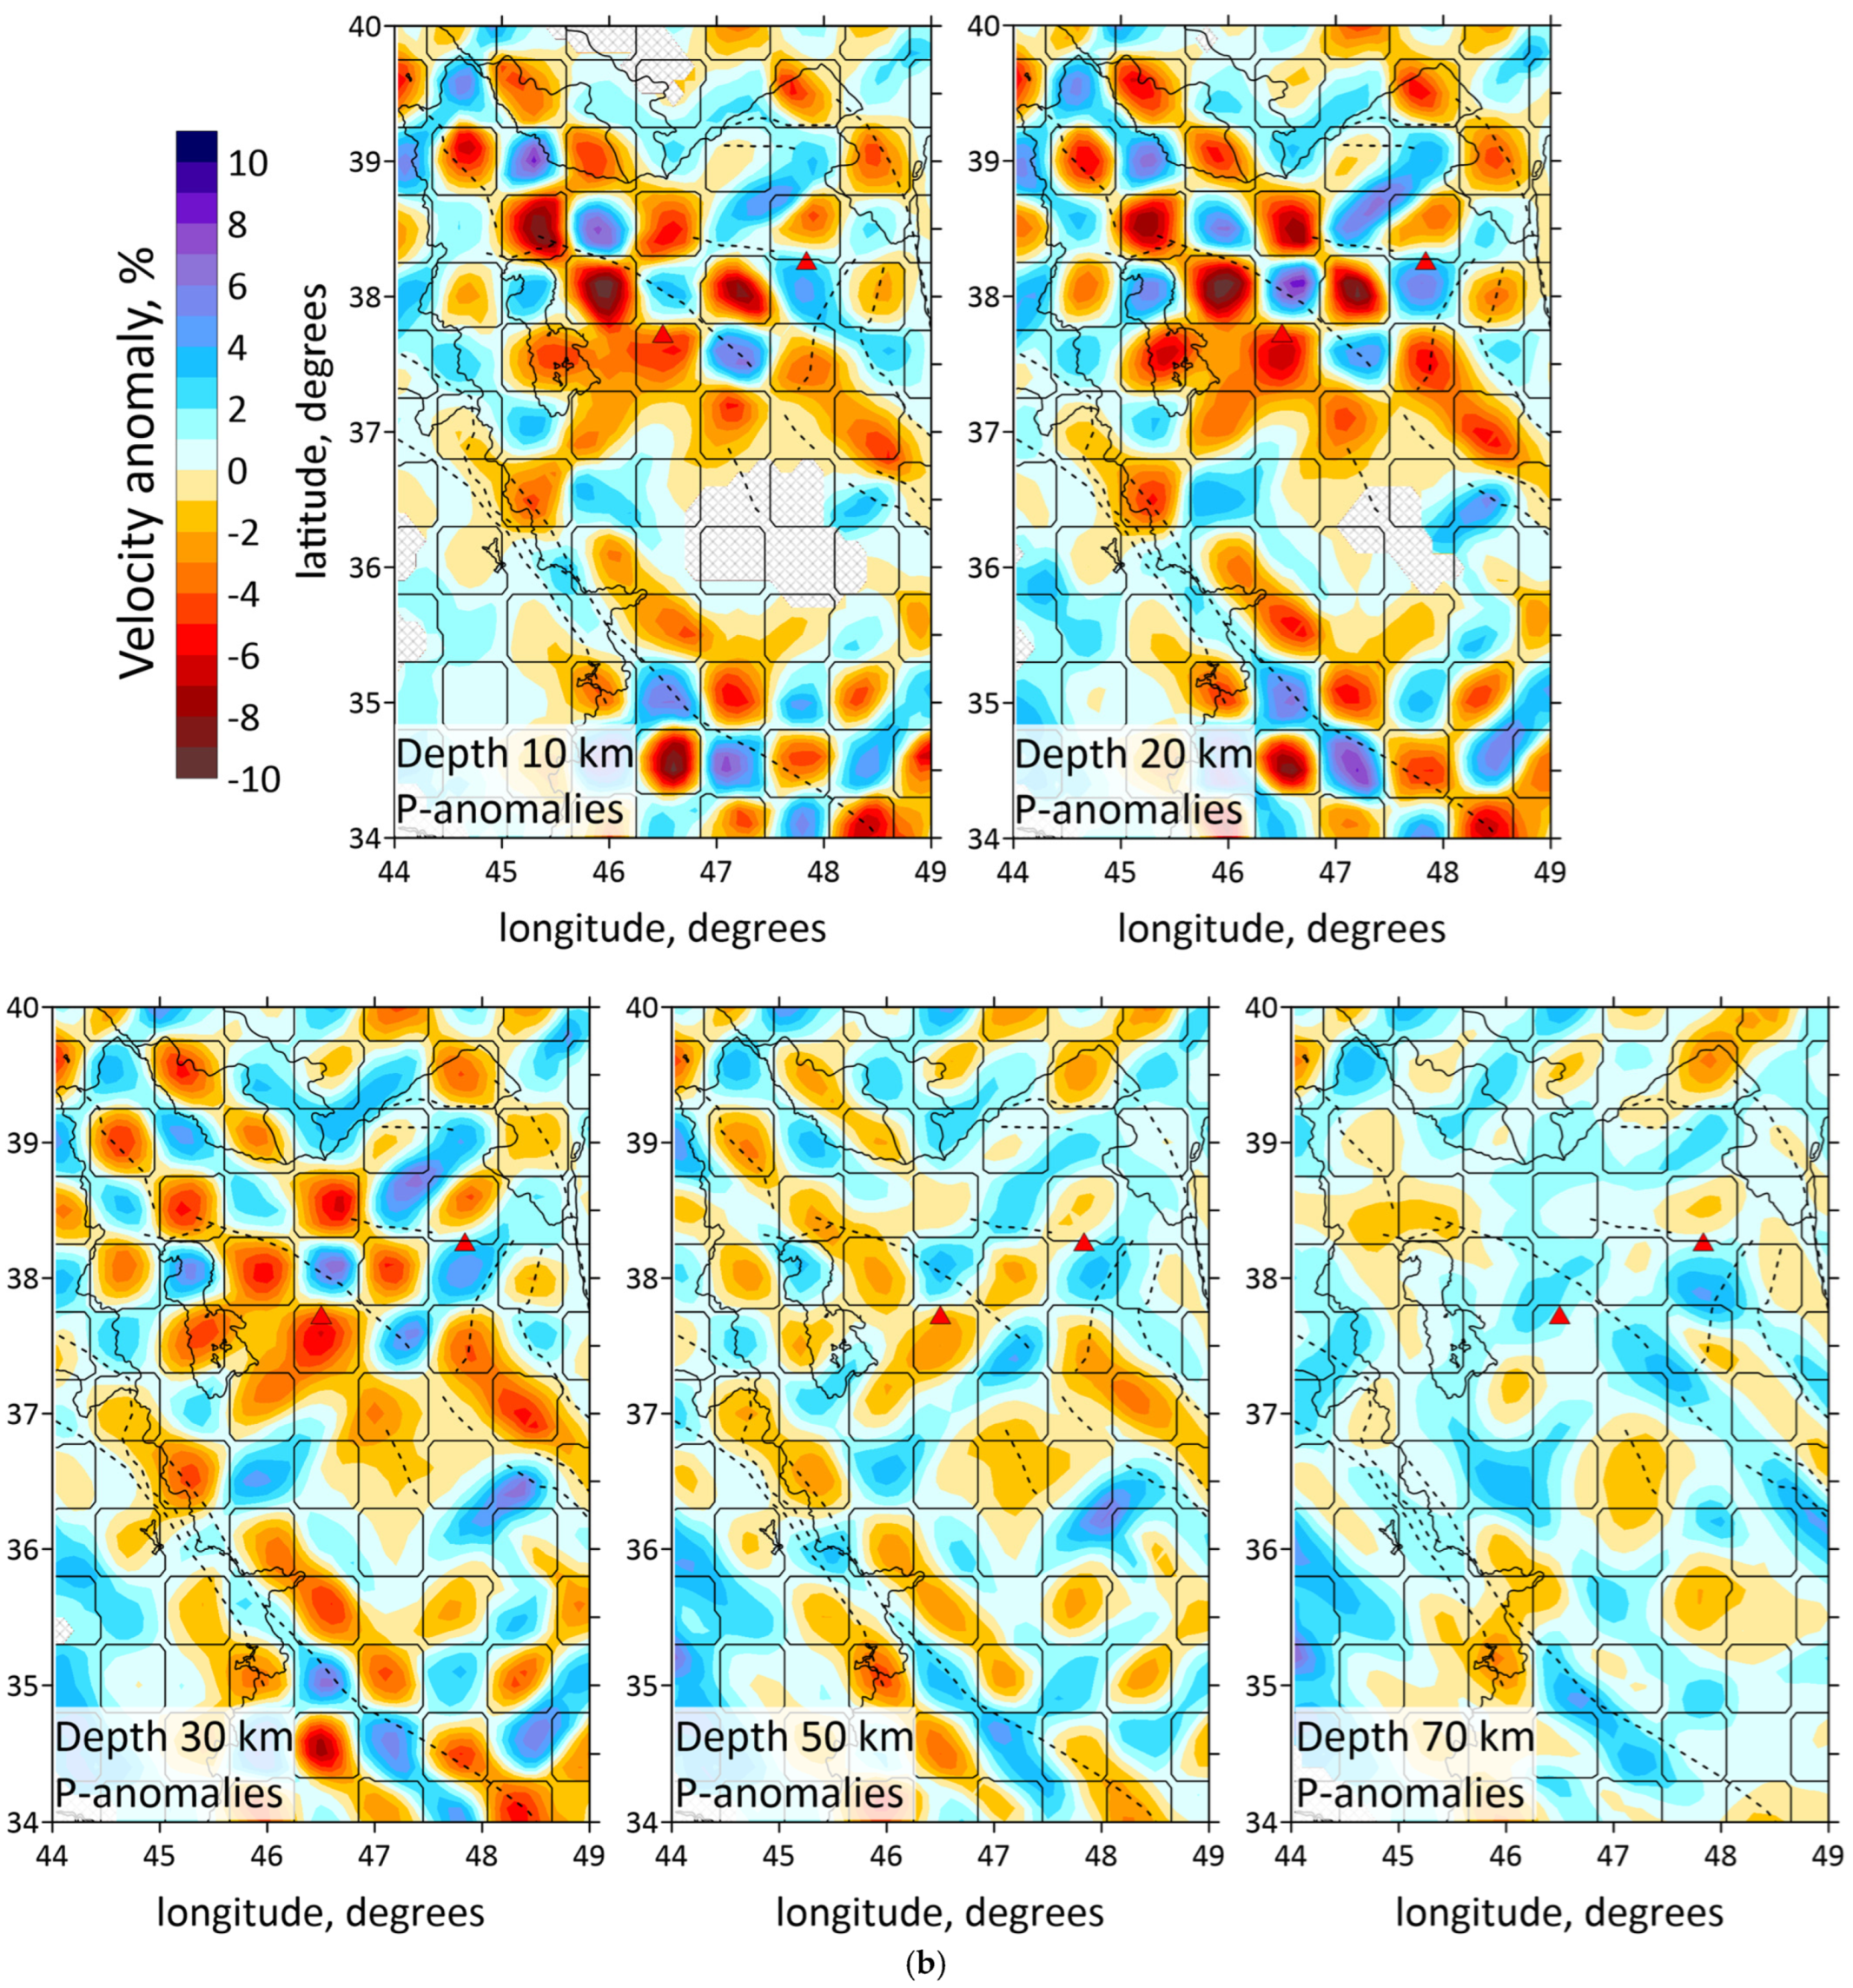
Figure 5.
Distributions of the Vp anomalies derived from the inversion of field data for horizontal sections at 10, 20, 30, 50 and 70 km depth. Abs. vel.—absolute velocities. Shaded regions depict areas with a low resolution according to checkerboard test, shown on Figure 6. Red triangles indicate two inactive volcanoes in the study area. Plain thin black lines indicate political boundaries and costal lines; dotted lines indicate the main faults of the study area.
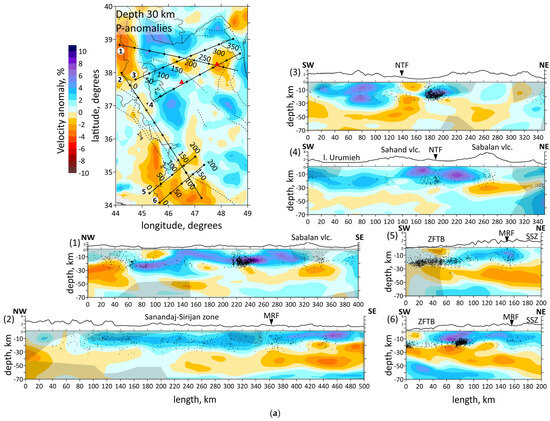
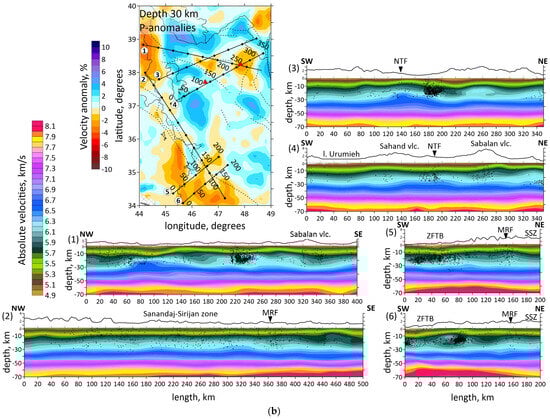
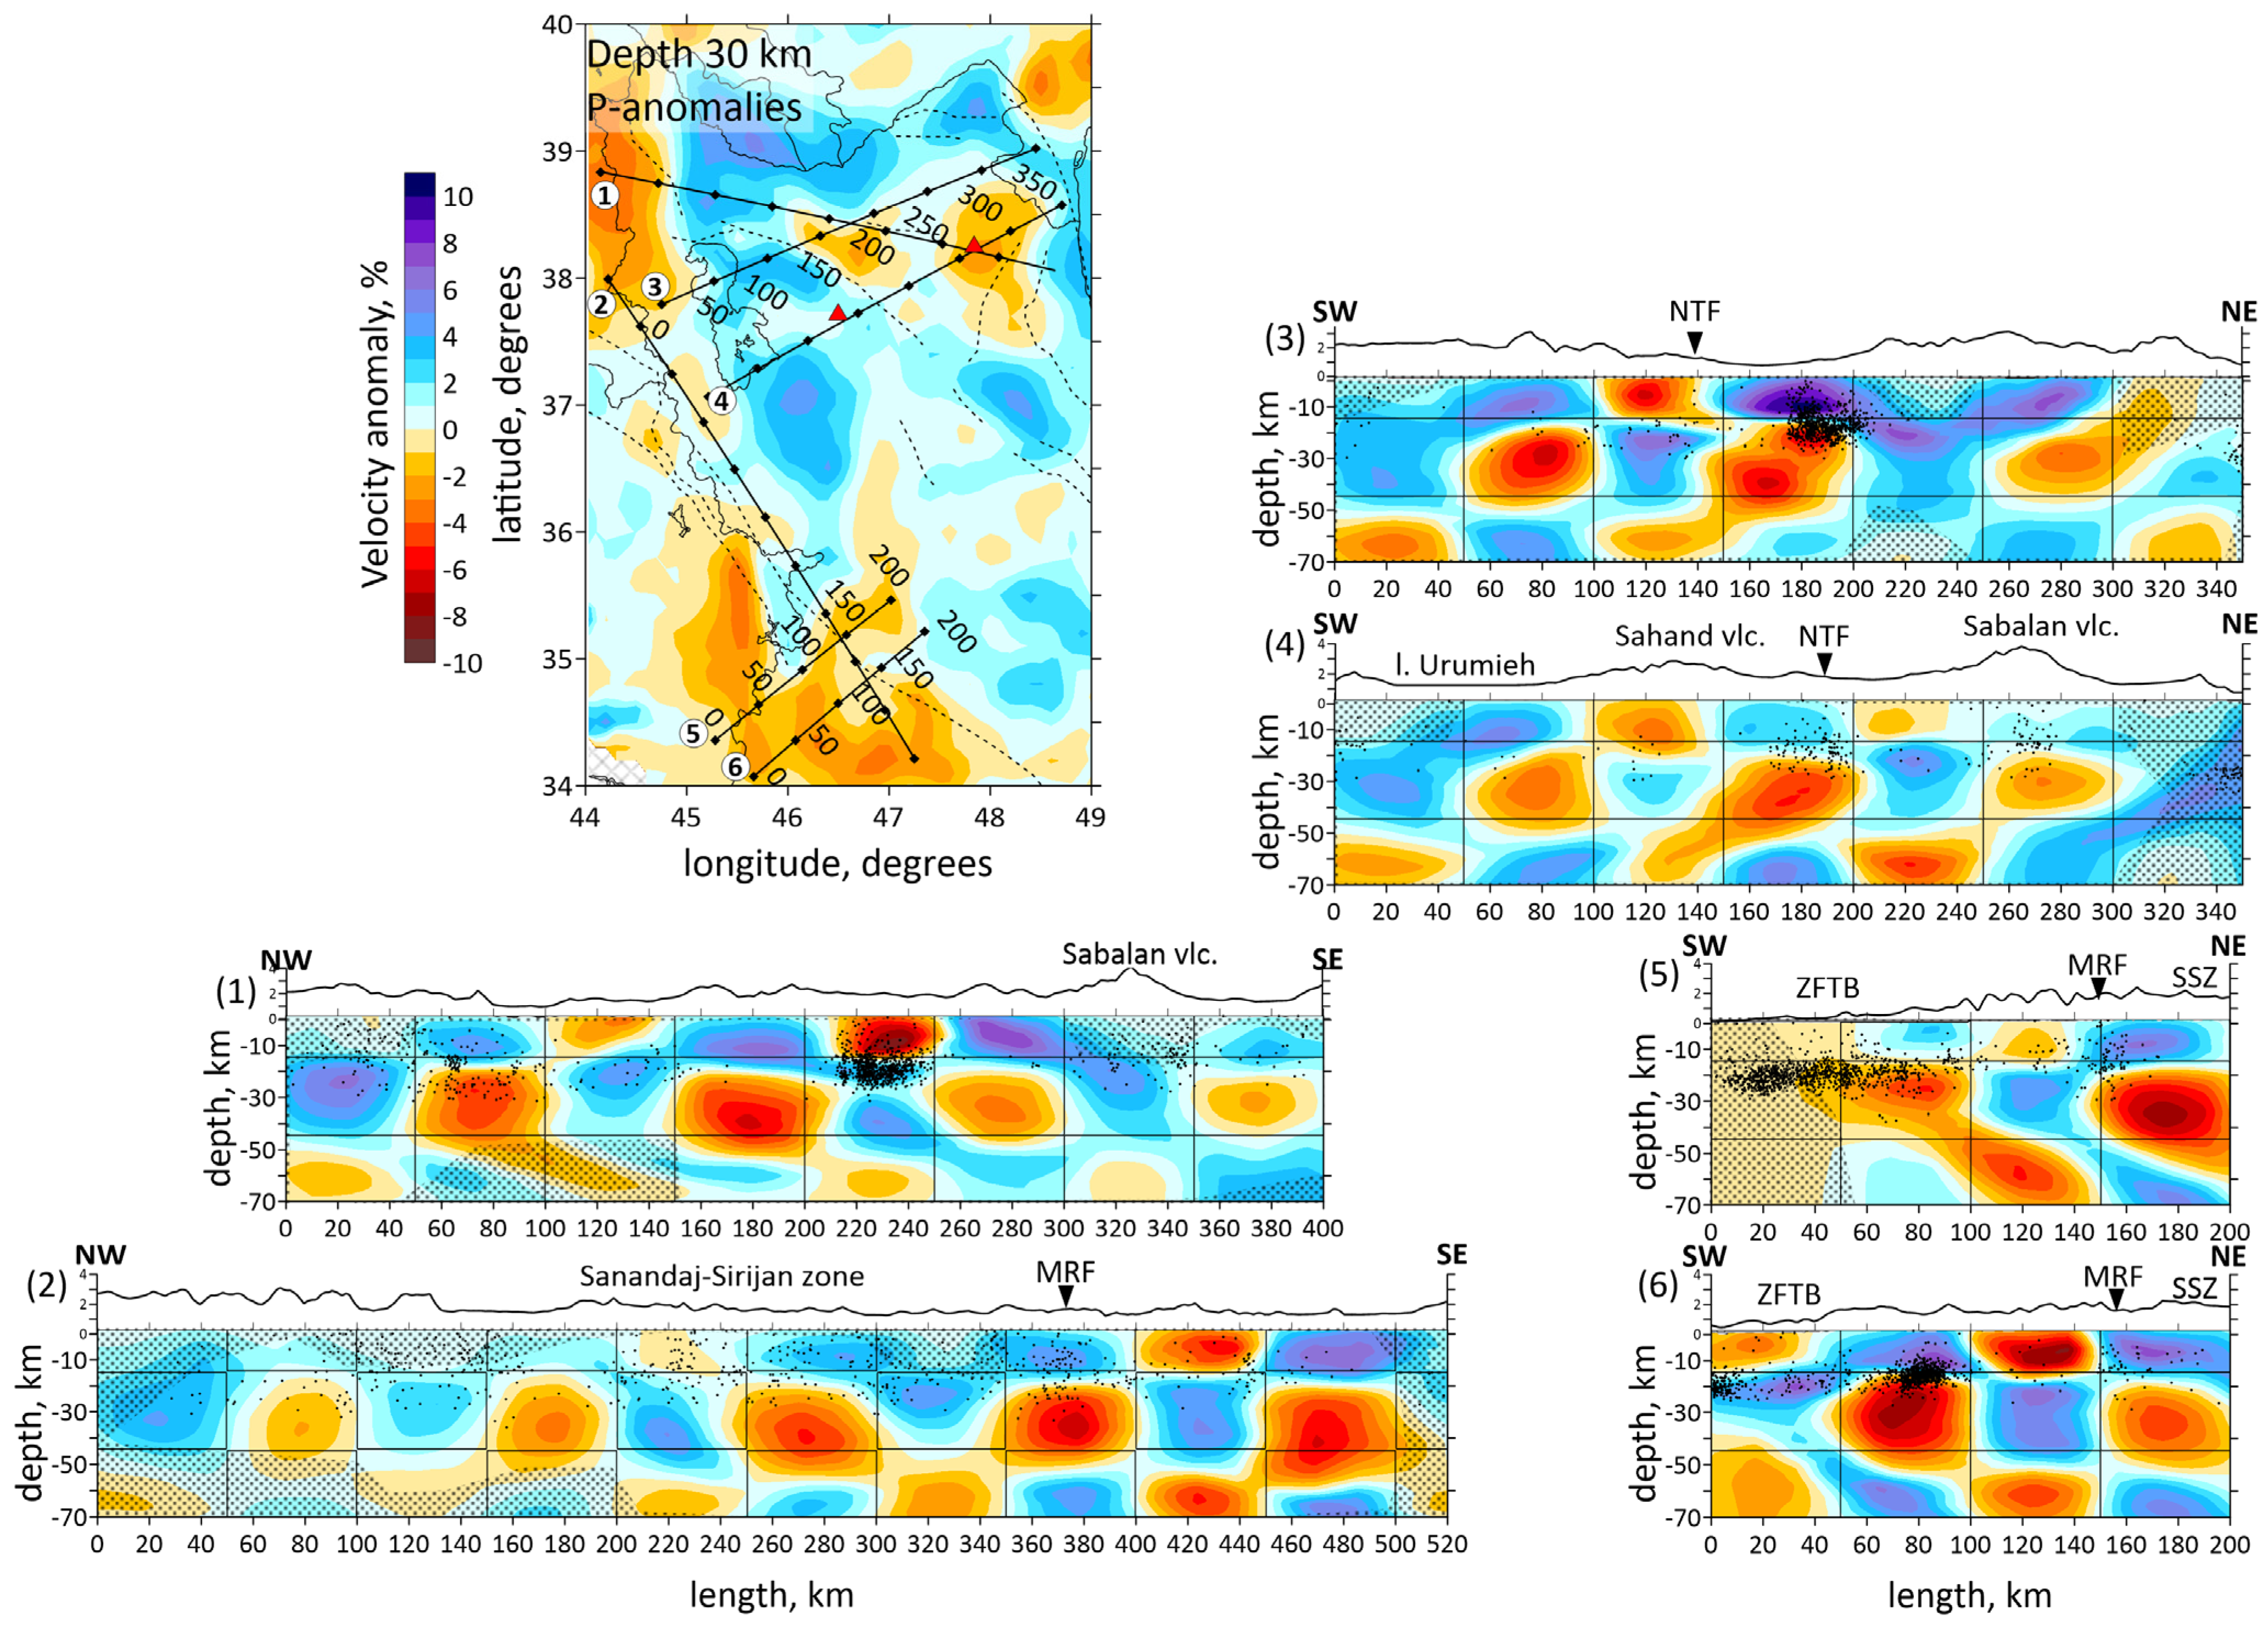
Figure 6.
(a) Distributions of the Vp anomalies derived from the inversion of field data in six vertical sections. Locations of the sections shown in horizontal section at the left side by straight black lines. The numbers of the profiles are shown to the left of each picture. Shaded regions depict areas with a low resolution according to Checkerboard test for vertical sections. Abbreviations: MRF—the Main Recent Fault; NTF—the North Tabriz Fault; SSZ—Sanandaj–Sirjan Metamorphic Zone; ZFTB—Zagros Fold and Thrust Belt. (b) Vertical sections of the absolute velocities of the P-waves. The numbers of the profiles are shown to the left of each picture. Abbreviations: MRF—the Main Recent Fault; NTF—the North Tabriz Fault; SSZ—Sanandaj–Sirjan Metamorphic Zone; ZFTB—Zagros Fold and Thrust Belt. Red triangles indicate two inactive volcanoes in the study area. Plain thin black lines indicate political boundaries and costal lines; dotted lines indicate the main faults of the study area.
Vertical sections of the P-wave velocity anomalies are given in Figure 6a. Seven vertical sections are located in the most seismically active zones. Moreover, the sections intersect main geological objects of the study region, such as the Urumieh–Dokhtar Magmatic Arc (sections 1, 3 and 4), the Sahand and Sabalan volcanoes (sections 1 and 4), the Main Recent Fault (sections 2, 5 and 6), the Zagros Fold and Thrust Belt and the Sanandaj–Sirjan Zone (sections 2, 5 and 6). The absolute velocities of the P-wave velocities are displayed in Figure 6b.
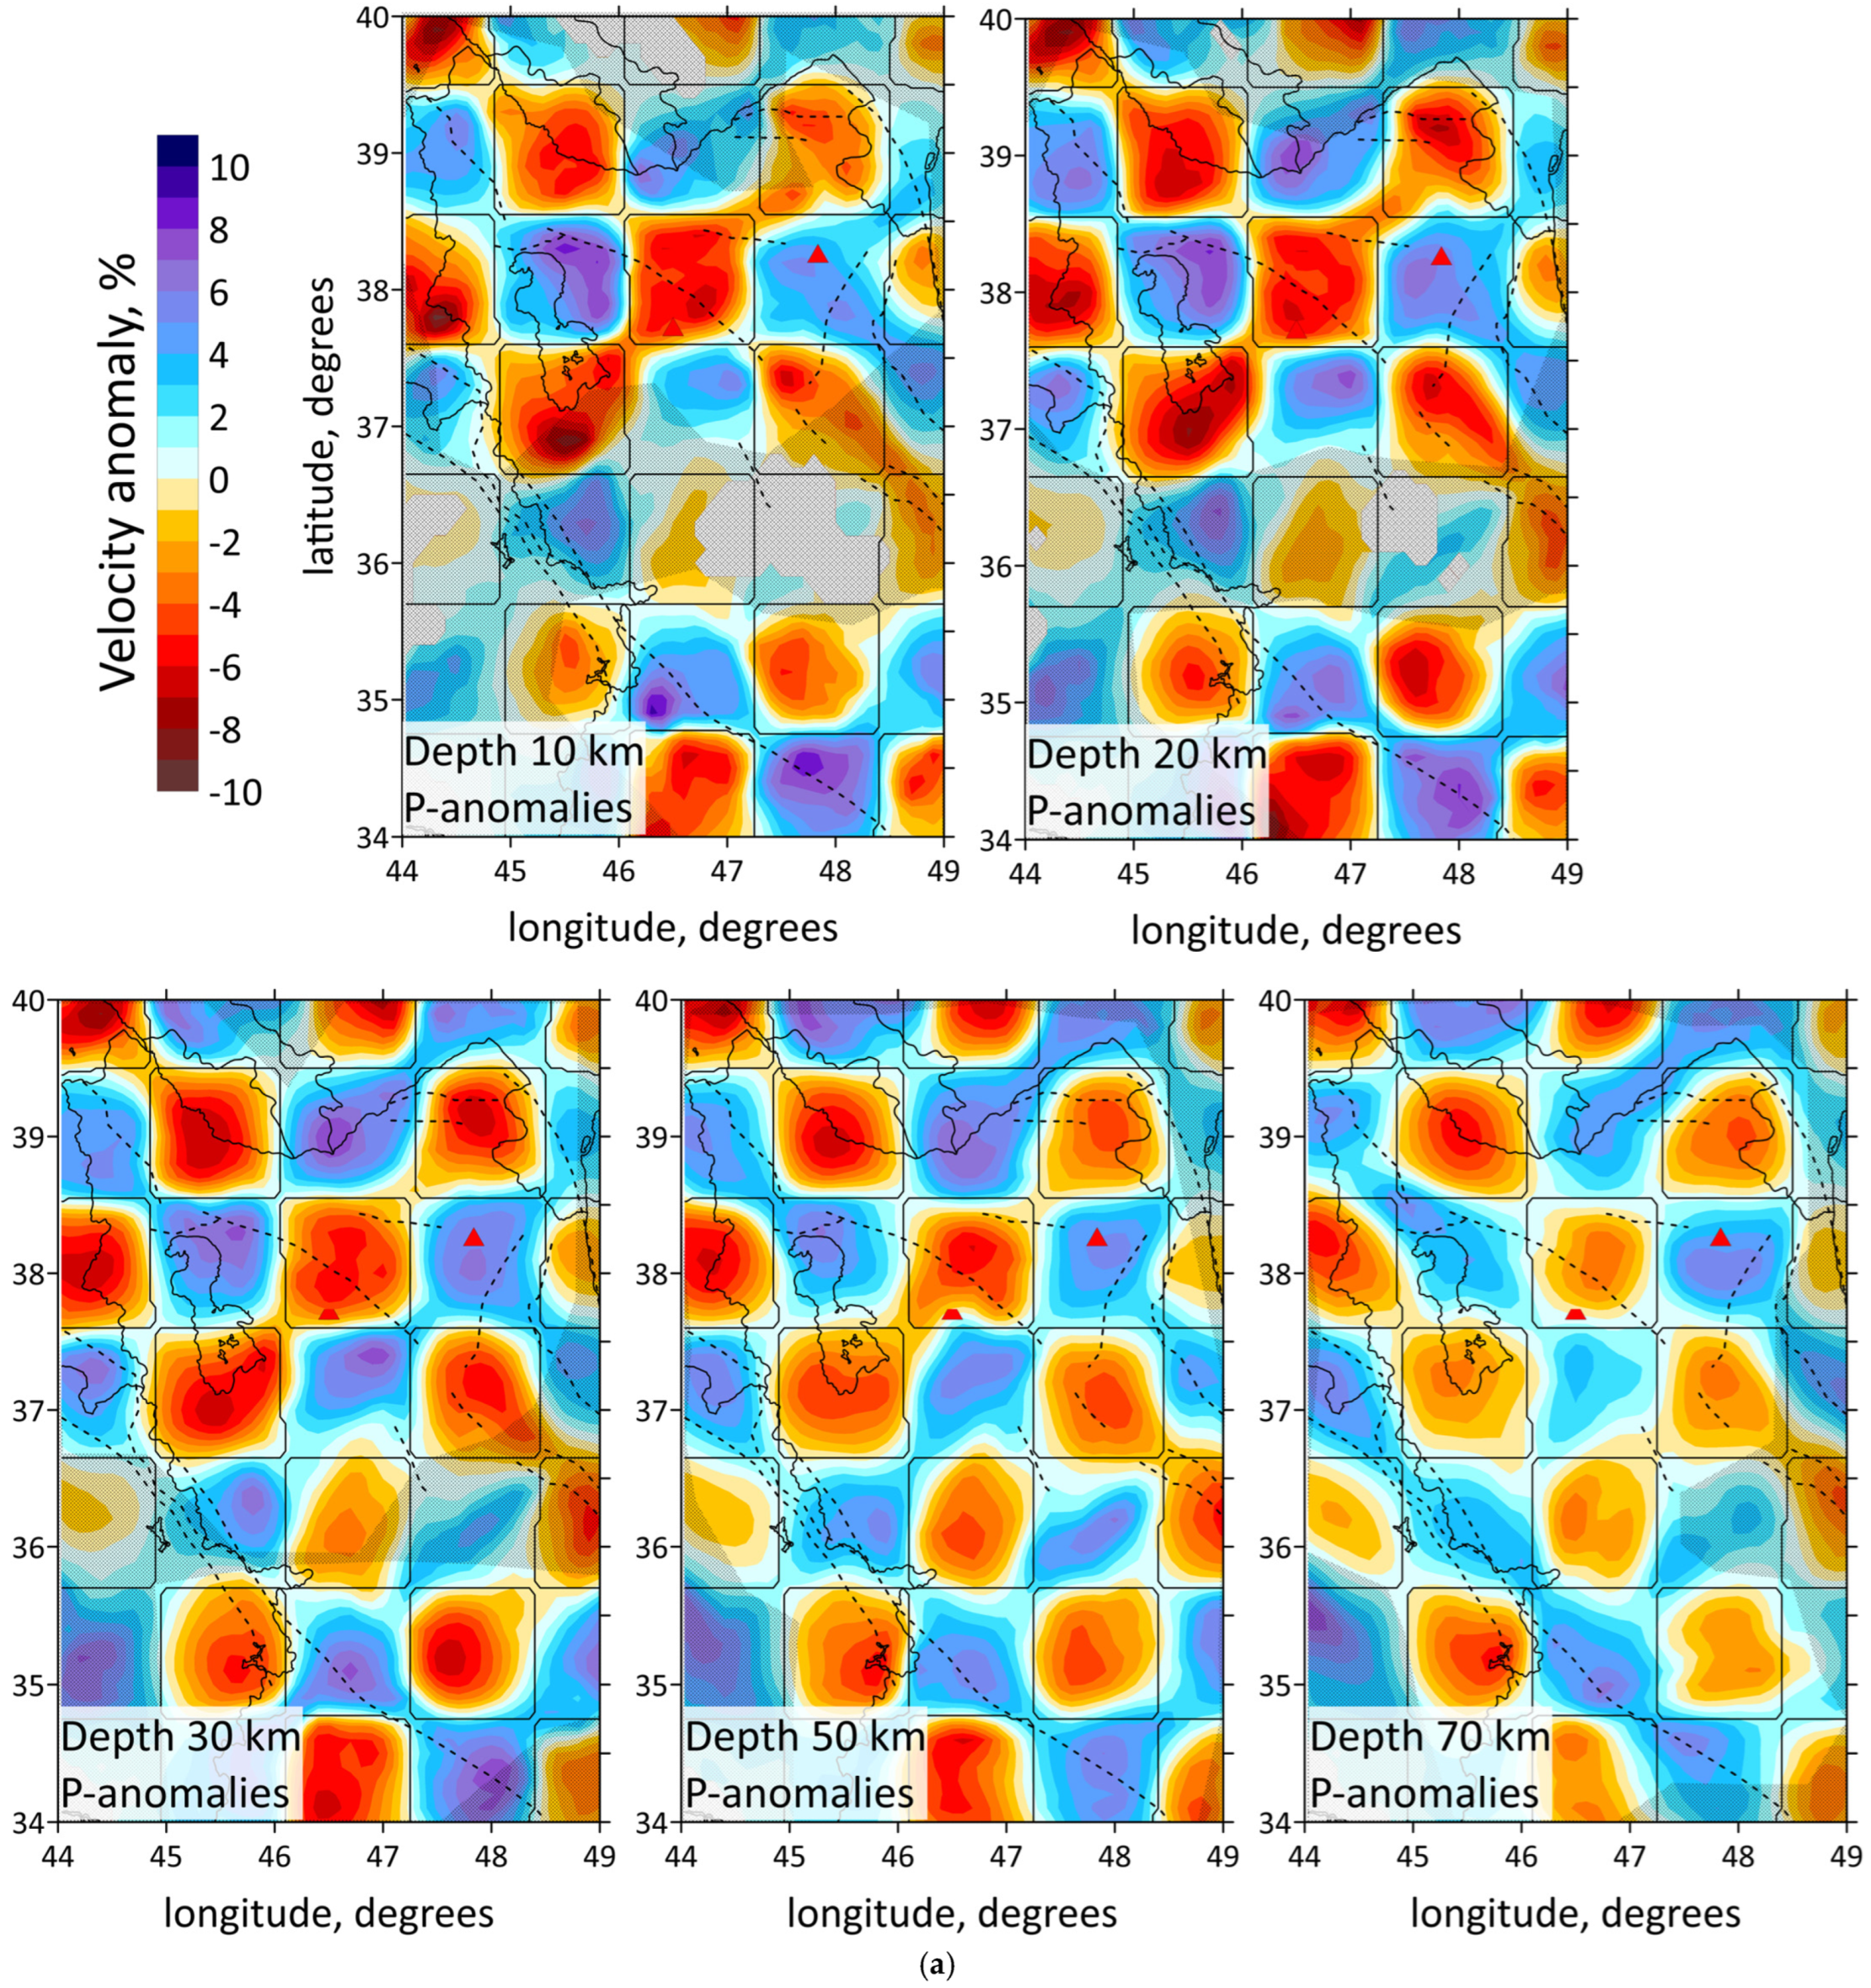
The obtained models were subjected to thorough verification and resolution testing using various tests. To assess the robustness of the solution, we conducted checkerboard simulations for both horizontal and vertical sections, as shown in Figure 7a,b and Figure 8. In the case of synthetic modeling, the same source–receiver pairs as those in the initial dataset were used. However, the three-dimensional synthetic model was defined independently of the parameterization used for inversion. The bending algorithm is also used for calculating the synthetic travel times. Before starting recovery of the synthetic model, the origin times and coordinates of the sources are “forgotten”. The recovery procedure follows the same steps and parameters as in the case of the experimental data.
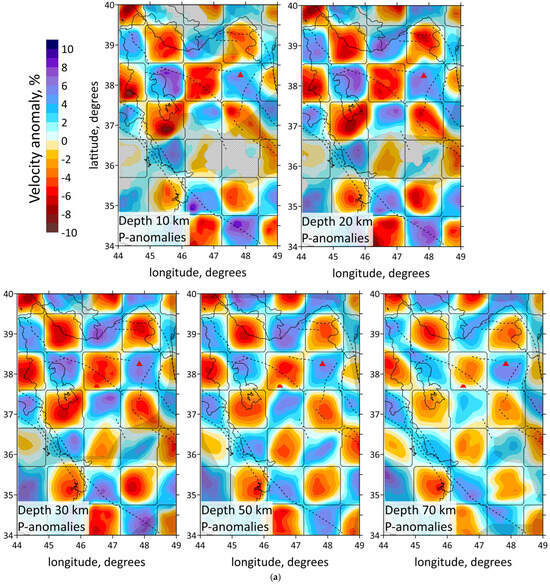
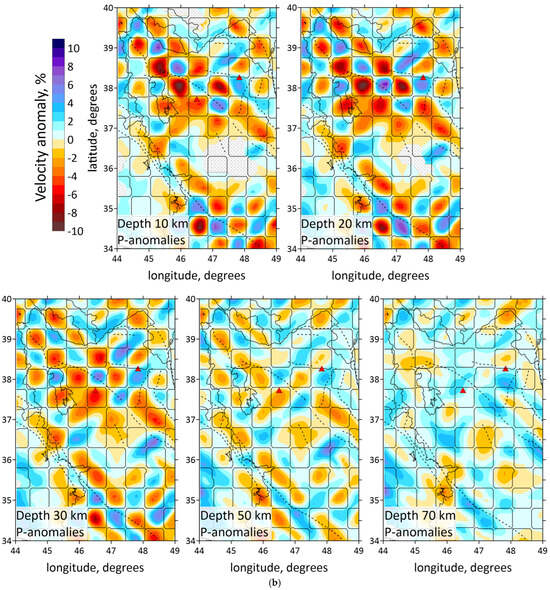
Figure 7.
(a) Results of the checkerboard test with anomalies of 100 km size. The resulting distributions of the dVp ratio are shown at five depth levels. The original shapes of the synthetic anomalies are highlighted with thin lines. Shaded regions depict areas with a low resolution. (b) Results of the checkerboard test with anomalies of 50 km size. The resulting distributions of the dVp ratio are shown at five depth levels. The original shapes of the synthetic anomalies are highlighted with thin lines. Red triangles indicate two inactive volcanoes in the study area. Plain thin black lines indicate political boundaries and costal lines; dotted lines indicate the main faults of the study area.
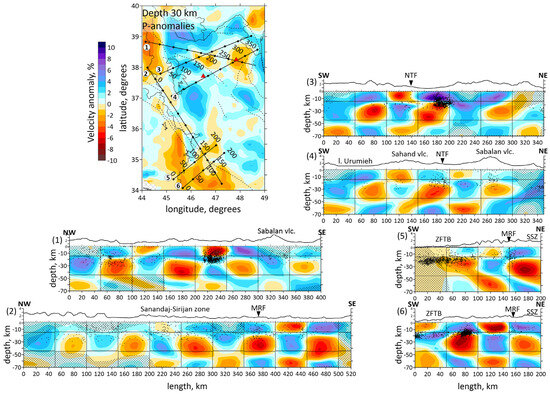
Figure 8.
Vertical sections of the P-anomalies in the checkerboard test. Locations of the vertival sections shown in horizontal section at the left side by straight black lines. Shaded regions depict areas with a low resolution. Abbreviations: MRF—the Main Recent Fault; NTF—the North Tabriz Fault; SSZ—Sanandaj–Sirjan Metamorphic Zone; ZFTB—Zagros Fold and Thrust Belt. Red triangles indicate two inactive volcanoes in the study area. Plain thin black lines indicate political boundaries and costal lines; dotted lines indicate the main faults of the study area.
The key characteristic of the checkerboard test is the presence of alternating anomalies both vertically and laterally. Before the inversion began, the anomalies of a certain size and magnitude, as well as noise level, were specified for each test. Figure 7a,b present the inversion results for anomalies with sizes of 100 × 100 km and 50 × 50 km, respectively. The amplitudes of anomalies were ±6%. The noise level was set at 0.3 s for both P- and S- wave data, which represented the existing accuracy of wave picking. Both tests revealed the central part, northern part and the southwestern corner of the study area to be poorly resolved. The P-wave data inversion result in Figure 7a indicates that the 100 × 100 km anomalies are reliably reconstructed at almost all depths. The inversion result of the checkerboard test with a cell size of 50 × 50 km (Figure 7) demonstrates a stable pattern recovery up to 40 km for P-anomalies only at the southeast of the Urumieh lake and at the southeastern part of the study area. Inversion results for the sections deeper than 50 km show deterioration of the model resolution over the entire area.
Figure 8 shows the checkerboard test for vertical sections. In this test, we defined the checkerboard anomalies with the amplitudes of ±6% and sizes of 30 × 50 km along each of the sections, same as were used to present the main results. The data were perturbed with the random noise with the mean deviation of 0.3 s. The observation network and events are distributed extremely unevenly across the study region, so it is worth considering the result for each profile separately. Some profiles demonstrate not very clear reconstruction of the given anomalies in the near-surface part of the sections up to 15 km depth. Thus, under the Sabalan volcano, profiles 1, 3 and 4, the anomalies are either not restored or smeared. Profiles 2, 3 and 4 also demonstrate low resolution of the first 10–15 km in the area west of Lake Urumieh. In both cases, the deterioration in resolution is associated with a decrease in the ray density. The blurring of the anomalies under profiles 1, 3, 4 and 5 in the NE direction is associated with the configuration of the rays.
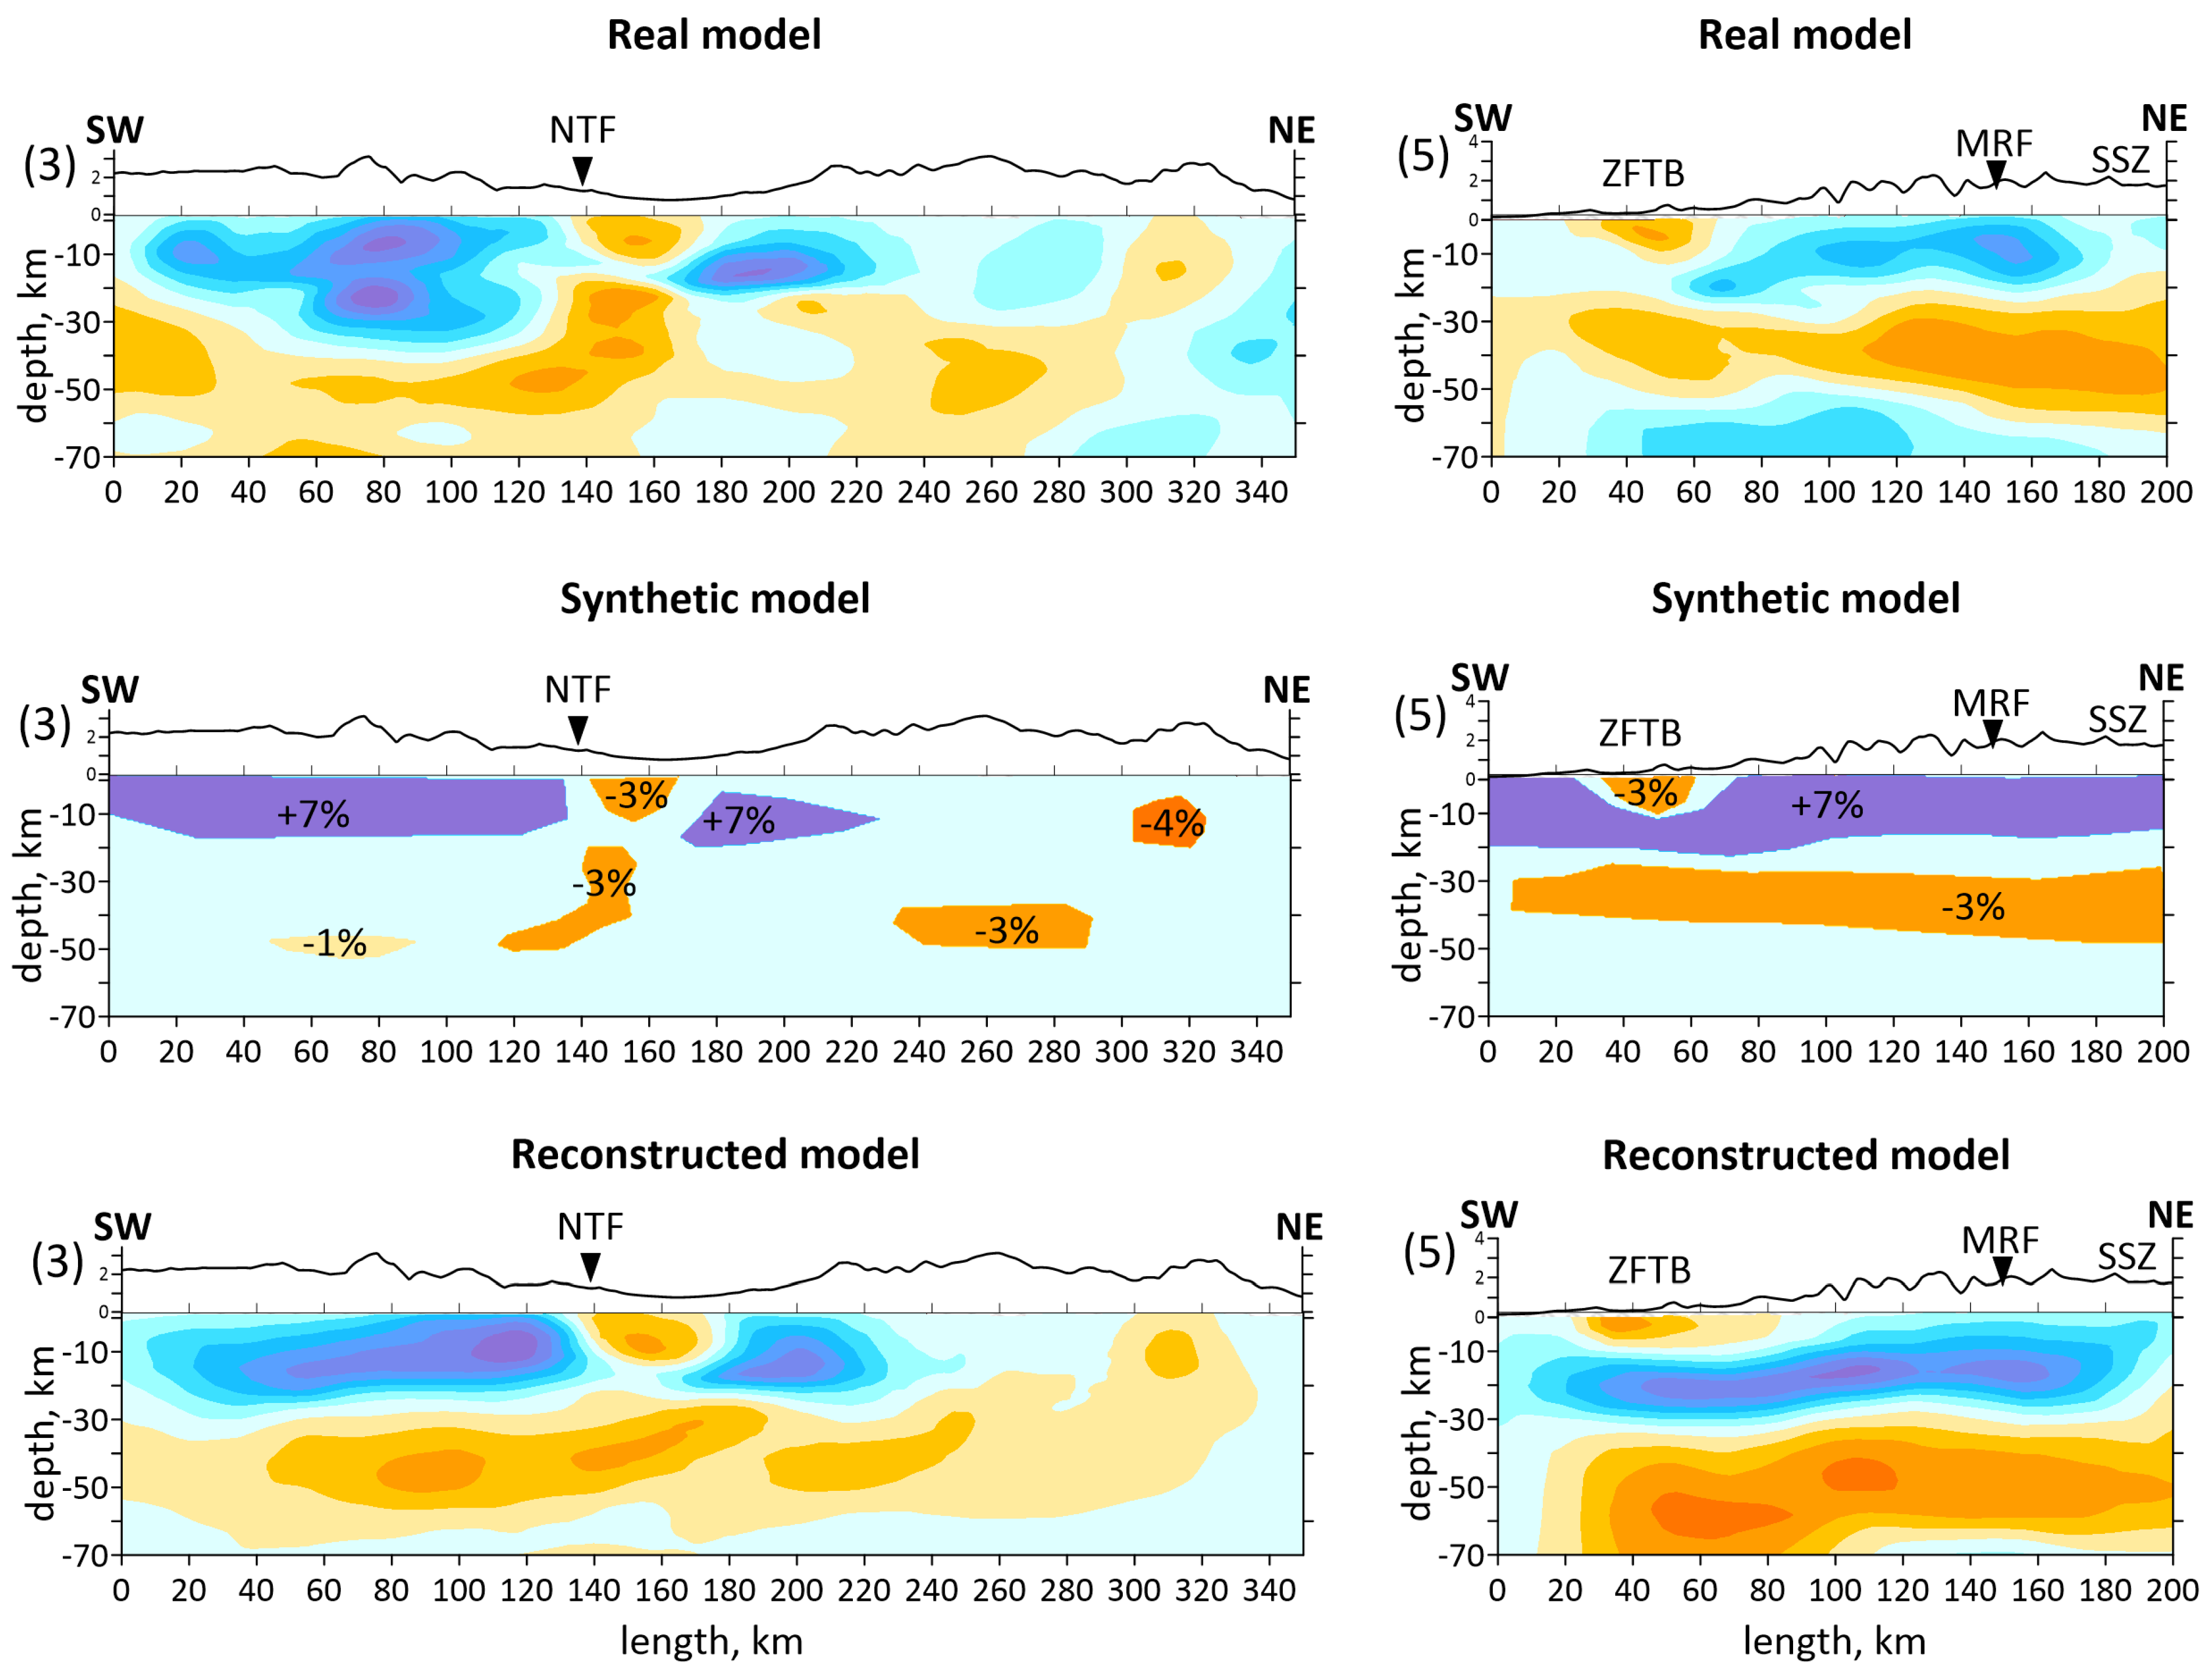
Figure 9 shows a synthetic test with realistic anomalies for vertical sections 3 and 5 to a depth of 70 km. The amplitude and shape of the synthetic anomalies were set in accordance with those observed in the real model. The main objective of the test was as follows: firstly, to assess the influence of the ray configuration on the anomalies; secondly, to understand whether relatively small anomalies in the upper crust can be reconstructed; and thirdly, to understand the general seismic structure of the region. The result of reconstructing the synthetic anomalies allows us to conclude that the ray configuration smashes the anomalies to depth. According to Figure 3b, with the distribution of earthquakes in the crust mainly up to 25–30 km, the ray paths reach up to 80 km. Despite the smashing, the general seismic structure of the studied region is resolved: the upper part of the crust is characterized by high-velocity anomalies, and the lower part by low-velocity ones. All interpreted anomalies, even the smallest ones such as the low-velocity anomaly under NTF (section 3) and under ZFTB (section 5), are reconstructed.
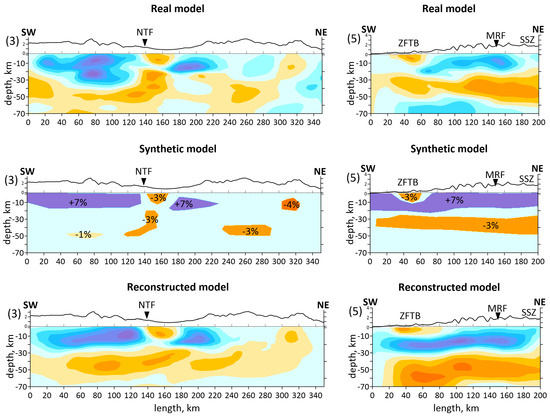
Figure 9.
Synthetic test with realistic anomalies along the vertical sections 3 and 5. The profiles’ locations are shown in Figure 6a: Top row of the anomalies shows real models obtained by the field data inversion; middle row of the models shows synthetic models and amplitudes of synthetic anomalies; bottom row of the models shows reconstructed synthetic models. The black line at the top of the vertical sections shows the topography. Abbreviations: MRF—the Main Recent Fault; NTF—the North Tabriz Fault; SSZ—Sanandaj–Sirjan Metamorphic Zone; ZFTB—Zagros Fold and Thrust Belt.
In summary, the resolution test suggests 3D tomographic models of the P-wave anomalies to be robust and reliable for interpreting the crustal structures (up to 40 km depth), particularly in regions with strong resolution recovery. At greater depths (40–70 km), larger-scale features (for example, 100 × 100 km) can still be interpreted with some confidence, but detailed information may be less accurately resolved. Due to the peculiarities of the distribution of rays, anomalies can be blurred to depth. It means that real structures can be higher than seismic anomalies caused by them.
5. Discussion
The obtained results correspond to the tectonic setting of the region. The horizontal sections at the depth of 10 and 20 km (Figure 5) demonstrate the division of the region along the MRF and MZT lines into a high-velocity anomaly in the east, characterizing the central Iran, and a low-velocity anomaly in the west, characterizing the Zagros collision belt. Horizontal sections showed a clear correlation between the low-velocity anomalies and known tectonic features, such as NTF and MRF. According to vertical sections 3, 4 and 1, 5, 6 shown in Figure 6a, there are clusters of earthquakes beneath the NTF and MRF.
The structure of the NTF is a prominent feature in the region, and has been associated with large historical earthquakes, particularly along its eastern segment. In Figure 5, on a horizontal section at 30 km, it is clearly visible that the NTF lies at the edge of a low-velocity anomaly (the boundary between a low- and high-velocity anomaly). It follows from the vertical section 3 in Figure 6a that there exists a transition from a high-velocity to low-velocity anomaly across the region at a depth of up to 30 km, whereas at 50 km depth, there is a uniform low-velocity anomaly. The NTF acts as a structural boundary between the low-velocity anomaly beneath Sahand and the high-velocity one beneath Sabalan, which is characterized by lower seismic-wave velocities in the upper part of the section. The NTF focuses strain and deformation along its path. The presence of low-velocity zones adjacent to the NTF suggests that the activity of the fault may have influenced the deformation and weakening of the crust in this area.
The obtained results also highlight major geological features, such as the Sahand and Sabalan volcanoes, clearly distinguished in the seismic structure. According to vertical sections 5 and 6 represented in Figure 6a, and horizontal sections in Figure 5, low velocities down to a depth of 10 km in the Zagros region characterize a high thickness of the sediments. This observation is consistent with the results of [35]: a thick sedimentary cover of about 8 km of Permo–Triassic to Late Cretaceous or Paleocene ages is present beneath the ZFTB. Refs. [8,23] also demonstrated low-velocity anomaly beneath the Zagros region.
We also observe a prominent N-S oriented low-velocity anomaly in the middle crust at the NW border of the study area to the west of the Urumieh Lake. Due to significant depth of the anomaly, it is unlikely that it is related to the same sedimentary formations as observed along Zagros. It is possible that it might be related to some regional extensional processes in this area. However, this anomaly is located at the limits of the resolved area in our model and therefore should be considered with prudence. To obtain more robust information about this structure, more data of seismic networks in the Caucasus states should be included in the tomography inversion.
Vertical section 4 in Figure 6a shows the Sabalan volcanic zone appearing as a low-velocity anomaly extending from the 15 km to a depth of over 40 km. Meanwhile, the first 25–30 km beneath the Sahand volcano are marked by a high-velocity anomaly, with a low-velocity one appearing at greater depths. Refs. [16,19,23] disclosed a high-velocity anomaly beneath the Sahand volcano up to depths of 11–14 km. We suggest that the differences in seismic structures beneath the Sahand and Sabalan volcanoes are related to their ages. Sahand is older (6.5–4.2 Ma) compared to Sabalan (<0.4 Ma). The high velocities observed beneath Sahand in the upper crust are likely due to dense, cold and solidified magma from earlier volcanic activity. The low-velocity seismic structure beneath Sabalan may result from a magma intrusion or partial melting present in the crust. This supports the idea that Sabalan could still be influenced by active magmatism, partially molten material and thermal weakening. Ref. [59] demonstrated low velocities in the upper crust of the Sahand and Sabalan volcanoes.
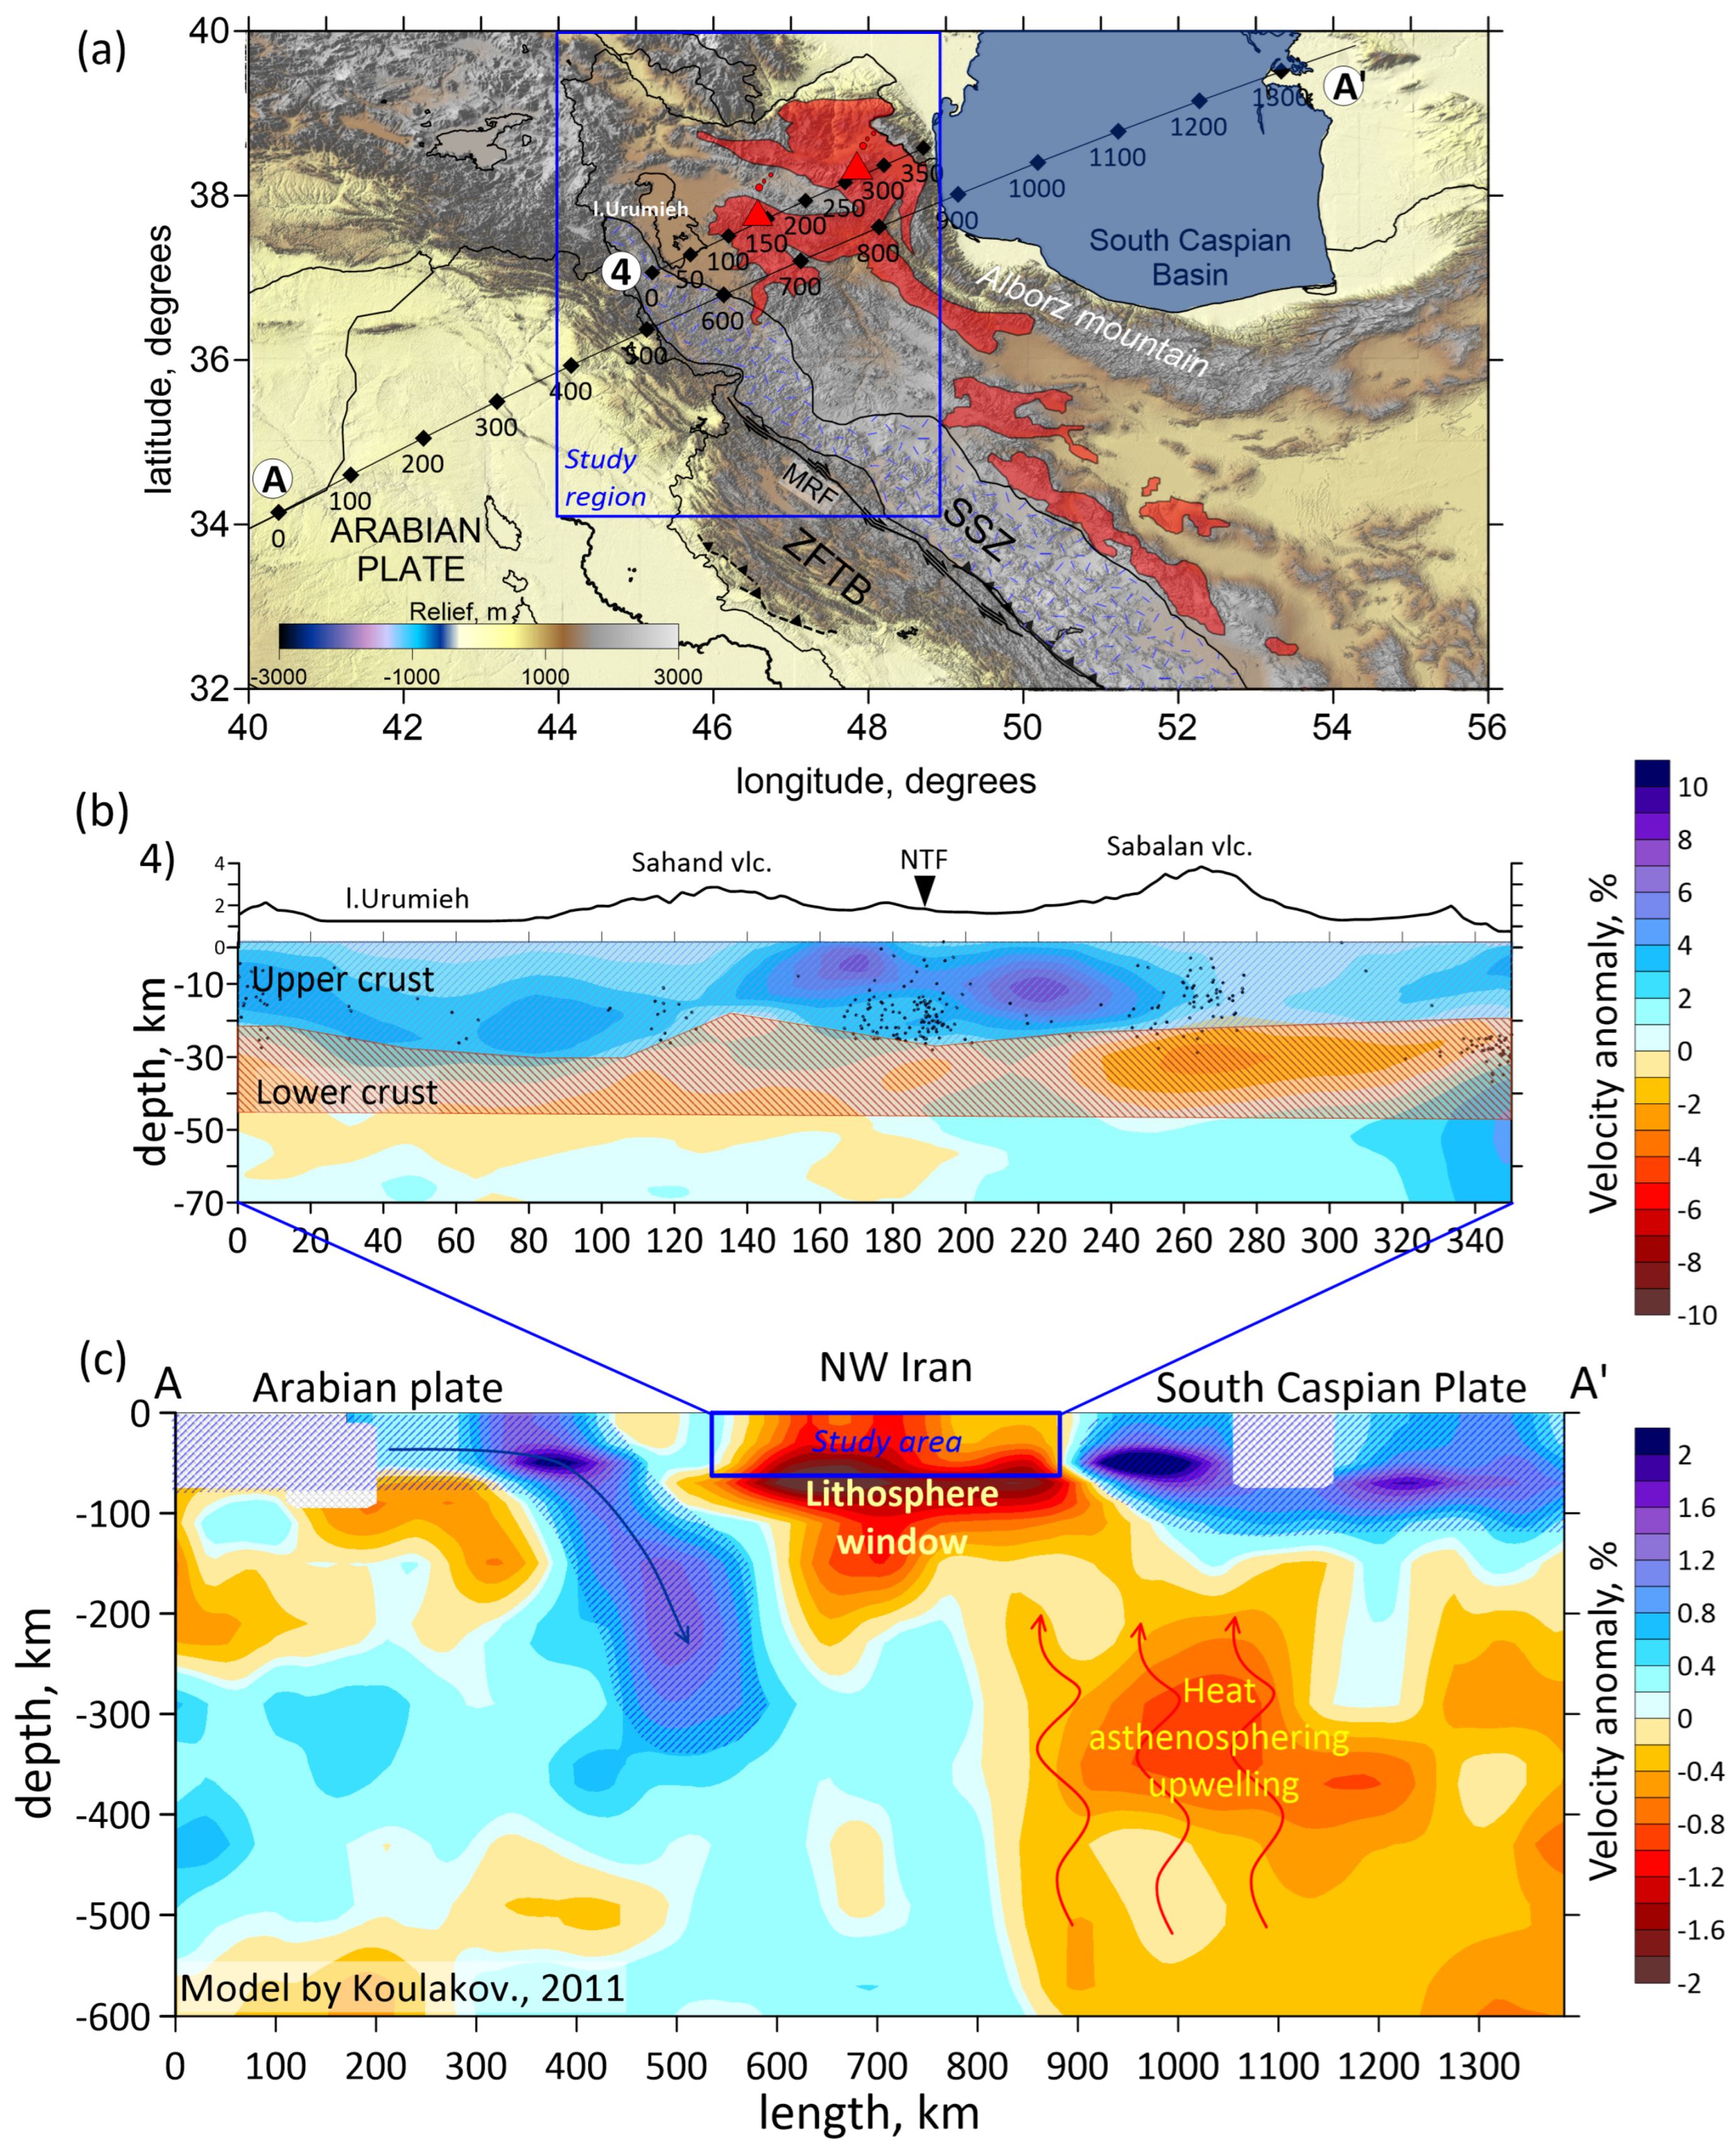
The global seismic structure of the lithosphere of the region is characterized by low seismic velocities (e.g., [18,58]). The present research uncovers the regional seismic structure of the crust of the northwestern Iran. To simplify the understanding of the processes, the interpretation model shown in Figure 10 demonstrates the fourth vertical section obtained in this study as a part of regional section AA′ [58].
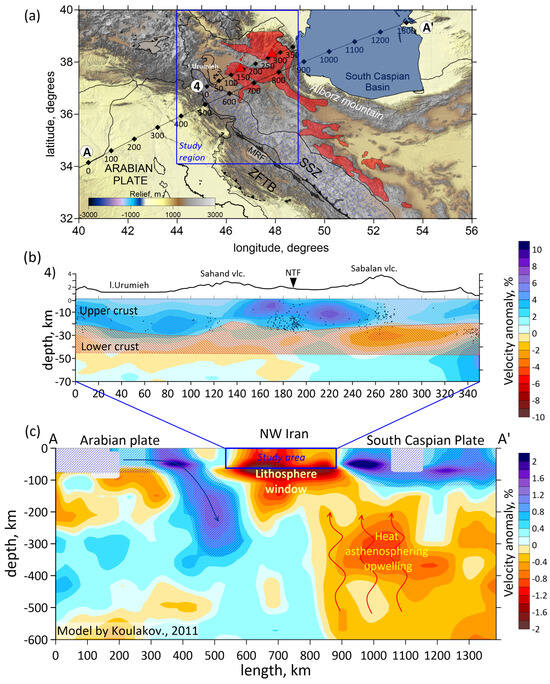
Figure 10.
Interpretation model. Top down: (a) locations of two sections: regional and global sections; (b) the fourth vertical section from the present study; (c) the vertical section AA′ obtained from [58]. Abbreviations: ZFTB—Zagros Fold and Thrust Belt; SSZ—Sanandaj–Sirjan Metamorphic Zone; MRF—the Main Recent Fault. Red areas belong to the Urumieh–Dokhtar Magmatic Arc (UDMA).
The obtained seismic structure of the whole study area represents a high-velocity upper crust (the first 25–30 km) and a low-velocity lower crust (from 25 to 45 km). A similar two-layered structure of the crust was shown in seismic tomographic models of different collision regions, such as Eastern Anatolia [60], Kyrgyz Tien Shan [61] and Pamir–Hindu Kush [62]. The evolution of these regions is characterized by the delamination process in the upper mantle. As a rule, delamination occurs after a critical thickening of the crust at a sufficiently high velocity of tectonic plates’ convergence. A mantle plume or a sunken oceanic plate after the closure of the subduction zone can be a trigger for the delamination. During the process of delamination, the mantle part of the lithosphere detaches from the crust and sinks into the mantle. After detachment of the mantle part of the lithosphere, a lithospheric window is formed, through which overheated asthenospheric material interacts with the crust. The low velocities in the deeper crust suggest the presence of mantle-derived heat or asthenospheric upwelling, leading to anomalous heating of the lower crust. The upper crust of the study region is characterized by the Central Iranian Block. Moreover, volcanic deposits and magma intrusions of the local volcanism lead to crustal strengthening in the upper crust. These factors may lead to the appearance of high-velocity anomalies in the upper crust.
Thus, some observed features such as a thickened crust, active volcanoes, and a two-layered seismic structure with high velocities in the upper crust and low velocities in the lower crust may be evidence of the delamination processes beneath the study region.
6. Conclusions
This study presents a 3D seismic velocity model for the crust of NW Iran. The velocity model of P-waves is determined in different horizontal and vertical sections. The detailed seismic velocity model obtained from our study of NW Iran provides significant insights into the crustal structure, tectonic processes, and the influence of volcanic activity in the region considered. Findings on the main seismic structures in the region are as follows:
- The obtained results correspond to the tectonic setting of the region, characterizing the Iranian plateau by high-velocity anomalies and the Zagros collision belt by a low-velocity anomaly. Main faults such as NTF, MZT and MRF are characterized by low-velocity anomalies.
- The volcanic zone of the Sabalan volcano is distinguished as a low-velocity anomaly from 10 km to a depth of more than 50 km, and the first 25–30 km beneath the Sahand volcano are characterized by a high velocity. We concluded that there is melted or/and hot magma beneath the young Sabalan volcano, and a solidified volcanic chamber present beneath the older Sahand.
- A low-velocity anomaly down to a depth of 10 km under the Zagros region characterizes a high thickness of the sediments.
- The NTF acts as a structural boundary between the low-velocity anomaly beneath Sahand and the high-velocity anomaly beneath Sabalan, focusing strain and deformation along its path. Its activity may have influenced the deformation and weakening of the crust in this area.
- The overall crustal structure observed in NW Iran has some similarities to the structure of different collision zones, such as Eastern Anatolia, Tien Shan and Pamir–Hindu Kush. The upper crust is characterized by high-velocity anomalies, while low-velocity ones are predominant in the lower crust. We propose the observed two-layered structure to be due to the delamination processes in the upper mantle.
Author Contributions
A.T.: Writing—review and editing, original draft, Supervision, Data curation, Investigation. I.M.: Funding acquisition, Writing—review and editing, original draft, Software LOTOS, Validation, Visualization, Investigation. I.K.: Writing—review and editing, Software, Conceptualization. All authors have read and agreed to the published version of the manuscript.
Funding
The work was supported by the Ministry of Education and Science of Russia. The studies were carried out within research projects of NSU and IPGG SB RAS. The work on seismic tomography of the region was supported by the state assignment according to the research project FSUS 2022-0019. The work on interpretation of the results was supported by the state assignment according to the research project FWZZ-2022-0017.
Data Availability Statement
The full version of the code with initial data and parameters used for calculating P- and S-velocity models beneath the northwestern Iran is presented in https://doi.org/10.5281/zenodo.13986243, accessed on 24 October 2024.
Conflicts of Interest
The authors declare no conflicts of interest.
References
- Copley, A.; Jackson, J. Active tectonics of the Turkish-Iranian plateau. Tectonics 2006, 25, TC6006. [Google Scholar] [CrossRef]
- Hessami, K.; Pantosti, D.; Tabassi, H.; Shabanian, E.; Abbassi, M.R.; Feghhi, K.; Solaymani, S. Paleoearthquakes and slip rates of the North Tabriz Fault, NW Iran: Preliminary results. Ann. Geophys. 2003, 46. [Google Scholar] [CrossRef]
- Moradi, A.S.; Hatzfeld, D.; Tatar, M. Microseismicity and seismotectonics of the North Tabriz fault (Iran). Tectonophysics 2011, 506, 22–30. [Google Scholar] [CrossRef]
- Djamour, Y.; Vernant, P.; Nankali, H.R.; Tavakoli, F. NW Iran-eastern Turkey present-day kinematics: Results from the Iranian permanent GPS network. J. Geophys. Res. Solid Earth 2011, 99, 19635–19646. [Google Scholar] [CrossRef]
- Rastbood, A.; Voosoghi, B. Extension and slip rate partitioning in NW Iran constrained by GPS measurements. J. Geod. Sci. 2011, 1, 286–304. [Google Scholar] [CrossRef]
- Berberian, M. Patterns of historical earthquake ruptures on the Iranian plateau. Dev. Earth Surf. Process. 2014, 17, 439–518. [Google Scholar] [CrossRef]
- Kheirkhah, M.; Allen, M.; Emami, M. Quaternary syncollision magmatism from the Iran/Turkey borderlands. J. Volcanol. Geotherm. Res. 2009, 182, 1–12. [Google Scholar] [CrossRef]
- Talebi, A.; Koulakov, I.; Moradi, A.; Rahimi, H.; Gerya, T. Ongoing formation of felsic lower crustal channel by relamination in Zagros collision zone revealed from regional tomography. Sci. Rep. 2020, 10, 8224. [Google Scholar] [CrossRef]
- Maggi, A.; Priestley, K. Surface waveform tomography of the Turkish–Iranian plateau. Geophys. J. Int. 2005, 160, 1068–1080. [Google Scholar] [CrossRef]
- Kaviani, A.; Paul, A.; Bourova, E.; Hatzfeld, D.; Pedersen, H.; Mokhtari, M. A strong seismic velocity contrast in the shallow mantle across the Zagros collision zone (Iran). Geophys. J. Int. 2007, 171, 399–410. [Google Scholar] [CrossRef]
- Shomali, Z.H.; Keshvari, F.; Hassanzadeh, J.; Mirzaei, N. Lithospheric structure beneath the Zagros collision zone resolved by non-linear teleseismic tomography. Geophys. J. Int. 2011, 187, 394–406. [Google Scholar] [CrossRef]
- Motaghi, K.; Shabanian, E.; Kalvandi, F. Underplating along the northern portion of the Zagros suture zone, Iran. Geophys. J. Int. 2017, 210, 375–389. [Google Scholar] [CrossRef]
- Hafkenscheid, E.; Wortel, M.J.R.; Spakman, W. Subduction history of the Tethyan region derived from seismic tomography and tectonic reconstructions. J. Geophys. Res. Solid Earth 2006, 111, B08401. [Google Scholar] [CrossRef]
- Mohammadi, E.; Sodoudi, F.; Kind, R.; Rezapour, M. Presence of a layered lithosphere beneath the Zagros collision zone. Tectonophysics 2013, 608, 366–375. [Google Scholar] [CrossRef]
- Wang, X.; Chen, L.; Talebian, M.; Ai, Y.; Jiang, M.; Yao, H.; He, Y.; Ghods, A.; Sobouti, F.; Wan, B.; et al. Shallow Crustal Response to Arabia-Eurasia Convergence in Northwestern Iran: Constraints From Multifrequency P-Wave Receiver Functions. J. Geophys. Res. Solid Earth 2022, 127, e2022JB024515. [Google Scholar] [CrossRef]
- Teknik, V.; Ghods, A.; Thybo, H.; Artemieva, I.M. Crustal density structure of the northwestern Iranian Plateau. Can. J. Earth Sci. 2019, 56, 1347–1365. [Google Scholar] [CrossRef]
- Shirzad, T.; VahidRavesh, S.; Mortezanejad, G.; Abdollahi, S.; Kakhki, M.K.; Naghavi, M.; Rahimi, H.; Hatami, M.R. The crustal and upper-mantle structure beneath NW Iran: An integrated analysis of surface waves and gravity data. Geophys. J. Int. 2024, 239, 982–999. [Google Scholar] [CrossRef]
- Alinaghi, A.; Koulakov, I.; Thybo, H. Seismic tomographic imaging of P-and S-waves velocity perturbations in the upper mantle beneath Iran. Geophys. J. Int. 2007, 169, 1089–1102. [Google Scholar] [CrossRef]
- Rezaeifar, M.; Kissling, E.; Shomali, Z.H.; Shahpasand-Zadeh, M. 3D crustal structure of the northwest Alborz region (Iran) from local earthquake tomography. Swiss J. Geosci. 2016, 109, 389–400. [Google Scholar] [CrossRef]
- Amiri, S.; Maggi, A.; Tatar, M.; Zigone, D.; Zaroli, C. Rayleigh wave group velocities in North-West Iran: SOLA Backus-Gilbert vs. Fast Marching tomographic methods. Seismica 2023, 2. [Google Scholar] [CrossRef]
- Arvin, S.; Sobouti, F.; Priestley, K.; Ghods, A.; Motaghi, K.; Tilmann, F.; Eken, T. Seismic anisotropy and mantle deformation in NW Iran inferred from splitting measurements of SK (K) S and direct S phases. Geophys. J. Int. 2021, 226, 1417–1431. [Google Scholar] [CrossRef]
- Mortezanejad, G.; Rahimi, H.; Romanelli, F.; Panza, G.F. Lateral variation of crust and upper mantle structures in NW Iran derived from surface wave analysis. J. Seismol. 2019, 23, 77–108. [Google Scholar] [CrossRef]
- Maheri-Peyrov, M.; Ghods, A.; Donner, S.; Akbarzadeh-Aghdam, M.; Sobouti, F.; Motaghi, K.; Hassanzadeh, M.; Mortezanejad, G.; Talebian, M.; Chen, L. Upper crustal structure of NW Iran revealed by regional 3-D Pg velocity tomography. Geophys. J. Int. 2020, 222, 1093–1108. [Google Scholar] [CrossRef]
- Rahimi, H.; Hamzehloo, H. Lapse time and frequency-dependent attenuation of coda waves in the Zagros continental collision zone in Southwestern Iran. J. Geophys. Eng. 2008, 5, 173–185. [Google Scholar] [CrossRef]
- Rahimi, H.; Hamzehloo, H.; Kamalian, N. Estimation of coda and shear wave attenuation in the volcanic area in SE Sabalan Mountain, NW Iran. Acta Geophys. 2010, 58, 244–268. [Google Scholar] [CrossRef]
- Gholamzadeh, A.; Rahimi, H.; Yaminifard, F. Spatial and temporal variation of coda-wave attenuation in the Faryab region, southeast of the Sanandaj–Sirjan zone, using aftershocks of the Tiab earthquake of 28 February 2006. Bull. Seismol. Soc. Am. 2014, 104, 529–539. [Google Scholar] [CrossRef]
- Irandoust, M.A.; Sobouti, F.; Rahimi, H. Lateral and depth variations of coda Q in the Zagros region of Iran. J. Seismol. 2015, 20, 197–211. [Google Scholar] [CrossRef]
- Amiri Fard, R.; Javan Doloei, G.; Rahimi, H.; Farrokhi, M. Attenuation of P and S waves in Western part of Iran. Geophys. J. Int. 2019, 218, 1143–1156. [Google Scholar] [CrossRef]
- Talebi, A.; Rahimi, H.; Moradi, A.; Mirzaei, M.; Koulakov, I. Qp, Qs, Qc, Qi, and Qsc Qsc Attenuation Parameters in the Zagros Region, Iran. Pure Appl. Geophys. 2022, 178, 4487–4505. [Google Scholar] [CrossRef]
- Talebi, A.; Rahimi, H.; Moradi, A. Coda wave attenuation in the Zagros collision zone in southwest of Iran and its tectonic implications. Acta Geophys. 2025, 73, 119–130. [Google Scholar] [CrossRef]
- Zarunizadeh, Z.; Motaghi, K.; Rahimi, H. Attenuation of High-Frequency Seismic Waves in NW Iran. Pure Appl. Geophys. 2024, 181, 1811–1829. [Google Scholar] [CrossRef]
- Naghavi, M.; Rahimi, H.; Moradi, A.; Mukhopadhyay, S. Spatial variations of seismic attenuation in the North West of Iranian plateau from analysis of coda waves. Tectonophysics 2017, 708, 70–80. [Google Scholar] [CrossRef]
- Richards, J.P.; Spell, T.; Rameh, E.; Razique, A.; Fletcher, T. High Sr/Y Magmas Reflect Arc Maturity, High Magmatic Water Content, and Porphyry Cu ± Mo ± Au Potential: Examples from the Tethyan arcs of Central and Eastern Iran and Western Pakistan. Econ. Geol. 2012, 107, 295–332. [Google Scholar] [CrossRef]
- Hessami, K.; Jamali, F.; Tabassi, H. Major Active Faults of Iran; International Institute of Earthquake Engineering and Seismology: Tehran, Iran, 2003. [Google Scholar]
- Vergés, J.; Saura, E.; Casciello, E.; Fernàndez, M.; Villaseñor, A.; Jiménez-Munt, I.; García Castellanos, D. Crustal-scale cross-sections across the NW Zagros belt: Implications for the Arabian margin reconstruction. Geol. Mag. 2011, 148, 739–761. [Google Scholar] [CrossRef]
- Alavi, M. Tectonics of the Zagros orogenic belt of Iran: New data and interpretations. Tectonophysics 1994, 229, 211–238. [Google Scholar] [CrossRef]
- Talebian, M.; Jackson, J. Offset on the Main Recent Fault of NW Iran and implications for the late Cenozoic tectonics of the Arabia–Eurasia collision zone. Geophys. J. Int. 2002, 150, 422–439. [Google Scholar] [CrossRef]
- Şengör, A.M.C. A new model for the late Palaeozoic—Mesozoic tectonic evolution of Iran and implications for Oman. Geol. Soc. Lond. Spec. Publ. 1990, 49, 797–831. [Google Scholar] [CrossRef]
- Ghods, A.; Shabanian, E.; Bergman, E.; Faridi, M.; Donner, S.; Mortezanejad, G.; Aziz-Zanjani, A. The Varzaghan-Ahar, Iran, earthquake doublet (M w 6.4, 6.2): Implications for the geodynamics of northwest Iran. Geophys. J. Int. 2015, 203, 522–540. [Google Scholar] [CrossRef]
- Berberian, M.; Qorashi, M.; Jackson, J.A.; Priestley, K.; Wallace, T. The Rudbar-Tarom earthquake of 20 June 1990 in NW Persia: Preliminary field and seismological observations, and its tectonic significance. Bull. Seismol. Soc. Am. 1992, 82, 1726–1755. [Google Scholar]
- Mangino, S.; Priestley, K. The crustal structure of the southern Caspian region. Geophys. J. Int. 1998, 133, 630–648. [Google Scholar] [CrossRef]
- Brunet, M.F.; Korotaev, M.V.; Ershov, A.V.; Nikishin, A.M. The South Caspian Basin: A review of its evolution from subsidence modelling. Sediment. Geol. 2003, 156, 119–148. [Google Scholar] [CrossRef]
- Allen, M.B.; Vincent, S.J.; Alsop, I.; Ismail-Zadeh, A.; Flecker, R. Late Cenozoic deformation in the South Caspian region: Effects of a rigid basement block within a collision zone. Tectonophysics 2003, 366, 223–239. [Google Scholar] [CrossRef]
- Aziz Zanjani, A.; Ghods, A.; Sobouti, F.; Bergman, E.; Mortezanejad, G.; Priestley, K.; Madanipour, S.; Rezaeian, M. Seismicity in the western coast of the South Caspian Basin and the Talesh Mountains. Geophys. J. Int. 2013, 195, 799–814. [Google Scholar] [CrossRef]
- Agard, P.; Omrani, J.; Jolivet, L.; Whitechurch, H.; Vrielynck, B.; Spakman, W.; Monie, P.; Meyer, B.; Wortel, R. Zagros orogeny: A subduction-dominated process. Geol. Mag. 2011, 148, 692–725. [Google Scholar] [CrossRef]
- Şengör, A.M.C.; Kidd, W.S.F. Post-collisional tectonics of the Turkish-Iranian plateau and a comparison with Tibet. Tectonophysics 1979, 55, 361–376. [Google Scholar] [CrossRef]
- Pang, K.N.; Chung, S.L.; Zarrinkoub, M.H.; Lin, Y.C.; Lee, H.Y.; Lo, C.H.; Khatib, M.M. Iranian ultrapotassic volcanism at~ 11 Ma signifies the initiation of post-collisional magmatism in the Arabia–Eurasia collision zone. Terra Nova 2013, 25, 405–413. [Google Scholar] [CrossRef]
- Koulakov, I. LOTOS code for local earthquake tomographic inversion: Benchmarks for testing tomographic algorithms. Bull. Seismol. Soc. Am. 2009, 99, 194–214. [Google Scholar] [CrossRef]
- Koulakov, I. Out-of-network events can be of great importance for improving results of local earthquake tomography. Bull. Seismol. Soc. Am. 2009, 99, 2556–2563. [Google Scholar] [CrossRef]
- Engdahl, E.R.; Jackson, J.A.; Myers, S.C.; Bergman, E.A.; Priestley, K. Relocation and assessment of seismicity in the Iran region. Geophys. J. Int. 2006, 167, 761–778. [Google Scholar] [CrossRef]
- Um, J.; Thurber, C. A fast algorithm for two-point seismic ray tracing. Bull. Seismol. Soc. Am. 1987, 77, 972–986. [Google Scholar] [CrossRef]
- Paige, C.C.; Saunders, M.A. LSQR: An algorithm for sparse linear equations and sparse least squares. ACM Trans. Math. Softw. 1982, 8, 43–71. [Google Scholar] [CrossRef]
- Albaric, J.; Deverchere, J.; Perrot, J.; Jakovlev, A.; Deschamps, A. Deep crustal earthquakes in North Tanzania, East Africa: Interplay between tectonic and magmatic processes in an incipient rift. Geochem. Geophys. Geosyst. 2014, 15, 374–394. [Google Scholar] [CrossRef]
- Bianchi, M.; Heit, B.; Jakovlev, A.; Yuan, X.; Kay, S.M.; Sandvol, E.; Alonso, R.N.; Coira, B.; Brown, L.; Kind, R.; et al. Teleseismic tomography of the southern Puna plateau in Argentina and adjacent regions. Tectonophysics 2013, 586, 65–83. [Google Scholar] [CrossRef]
- Foix, O.; Aiken, C.; Saurel, J.M.; Feuillet, N.; Jorry, S.J.; Rinnert, E.; Thinon, I. Offshore Mayotte volcanic plumbing revealed by local passive tomography. J. Volcanol. Geotherm. Res. 2021, 420, 107395. [Google Scholar] [CrossRef]
- Bernal-Olaya, R.; Mann, P.; Carlos, A. Vargas, Earthquake, tomographic, seismic reflection, and gravity evidence for a shallowly dipping subduction zone beneath the Caribbean Margin of Northwestern Colombia. In Petroleum Geology and Potential of the Colombian Caribbean Margin; Bartolini, C., Mann, P., Eds.; AAPG Memoir 108; AAPG: Shawnee, KS, USA, 2015; pp. 247–270. [Google Scholar]
- Popa, M.; Radulian, M.; Szakács, A.; Seghedi, I.; Zaharia, B. New seismic and tomography data in the southern part of the Harghita Mountains (Romania, Southeastern Carpathians): Connection with recent volcanic activity. Pure Appl. Geophys. 2012, 169, 1557–1573. [Google Scholar] [CrossRef]
- Koulakov, I. High-Frequency P and S Velocity Anomalies in the Upper Mantle beneath Asia from Inversion of Worldwide Traveltime Data. J. Geophys. Res. Solid Earth 2011, 116, B04301. [Google Scholar] [CrossRef]
- Lü, Y.; Chen, L. Upper crustal P-wave velocity structure beneath two volcanic areas in northern Iran. Sci. China Earth Sci. 2017, 60, 786–795. [Google Scholar] [CrossRef]
- Medved, I.; Polat, G.; Koulakov, I. Crustal Structure of the Eastern Anatolia Region (Turkey) Based on Seismic Tomography. Geosciences 2021, 11, 91. [Google Scholar] [CrossRef]
- Medved, I.; Bataleva, E.; Buslov, M. Studying the depth structure of the Kyrgyz Tien Shan by using the seismic tomography and magnetotelluric sounding methods. Geosciences 2021, 11, 122. [Google Scholar] [CrossRef]
- Aminov, J.; Koulakov, I.; Jakovlev, A.; Zhao, J.; El-Khrepy, S.; Aminov, J.; Al Arifi, N.; Aminov, J.; Mamadjanov, Y. Directions of lithosphere interactions in the Pamir–Hindu Kush junction inferred from anisotropic tomography. Can. J. Earth Sci. 2020, 57, 601–616. [Google Scholar] [CrossRef]


Disclaimer/Publisher’s Note: The statements, opinions and data contained in all publications are solely those of the individual author(s) and contributor(s) and not of MDPI and/or the editor(s). MDPI and/or the editor(s) disclaim responsibility for any injury to people or property resulting from any ideas, methods, instructions or products referred to in the content. |
© 2025 by the authors. Licensee MDPI, Basel, Switzerland. This article is an open access article distributed under the terms and conditions of the Creative Commons Attribution (CC BY) license (https://creativecommons.org/licenses/by/4.0/).