Article

Rate-Dependent Residual Strength of Unsaturated Slip-Zone Soil Under Suction-Controlled Conditions

by
Jin Yuan
1,2,
Rui Zhu
3,
Yanpian Mao
1,2,
Lanlan Xu
1,2,
Jianfan Zhao
3,
Chao Zhang
1,2 and
Shu Zhang
1,3,*
1
Hubei Technology Innovation Center for Smart Hydropower, Wuhan 430014, China
2
China Yangtze Power Co., Ltd., Wuhan 430014, China
3
Badong National Observation and Research Station of Geohazards, China University of Geosciences, Wuhan 430074, China
*
Author to whom correspondence should be addressed.
Geosciences 2025, 15(10), 397; https://doi.org/10.3390/geosciences15100397 (registering DOI)
Submission received: 28 August 2025 / Revised: 2 October 2025 / Accepted: 7 October 2025 / Published: 14 October 2025

Abstract

Reservoir landslides undergo saturated–unsaturated transitions under hydrological variations. Matric suction significantly influences slip-zone soil strength. Existing studies lack analysis of suction–rate–strength coupling, while Amontons’ model fails for cohesive soils. This study investigated Huangtupo landslide slip-zone soil in the upper reaches of the Yangtze River using pressure plate and saturated salt solution methods to determine the soil–water characteristic curve. Suction-controlled ring shear tests were conducted under three matric suction levels ( Ψ = 0, 200, and 700 kPa) across net normal stresses ( σ n e t = 100–800 kPa) and shear rates ( γ ˙ = 0.05–200 mm/min). Key findings revealed the following: (1) significant suction–rate coupling effects were shown, with 700 kPa suction yielding 30% higher residual strength than saturated conditions, validating matric suction’s role in enhancing effective stress and particle contact strength; (2) residual cohesion showed strong logarithmic correlation with shear rate, with the fastest growth below 10 mm/min, while the residual friction angle varied minimally (0.68°), contributing little to overall strength; (3) a bivariate model relating residual cohesion to γ ˙ and Ψ was established, overcoming traditional single-factor limitations. The study demonstrates that dual-parameter Coulomb modeling effectively captures multi-field coupling mechanisms in unsaturated slip-zone soils, providing theoretical foundations for landslide deformation prediction and engineering design under dynamic hydrological conditions.

1. Introduction

Slip-zone soil, as the core geo-material controlling landslide stability, directly determines the deformation patterns and failure mechanisms of landslides [1,2]. Under dynamic hydrological conditions, such as reservoir water level fluctuations and rainfall infiltration, slip-zone soil frequently undergoes periodic transitions between saturated and unsaturated states, resulting in significant spatiotemporal heterogeneity in its strength characteristics [3,4,5]. Current studies indicate that matric suction, as a key state variable of unsaturated soil, significantly influences the shear strength and deformation behavior of slip-zone soil by regulating soil water content and pore water pressure [6]. For example, monitoring data from the Huangtupo landslide in the upper reaches of the Yangtze River shows that the surface deformation rate of the landslide is closely related to reservoir water level fluctuations and rainfall intensity, while variations in matric suction of the slip-zone soil serve as the core link connecting external hydrological conditions with internal mechanical responses [7]. Notably, the slip-zone soil of reservoir landslides exhibits partially saturated characteristics due to the dry–wet cycling effect of reservoir water levels, and its matric suction plays a particularly critical role in regulating long-term creep behavior [8,9]. Therefore, a systematic study on the strength characteristics of unsaturated slip-zone soil under dynamic suction conditions is of significant importance for revealing the evolution mechanism of reservoir landslides.
Ring shear tests have been widely applied in determining the residual strength of slip-zone soil due to their ability to simulate large displacement shear processes while maintaining a constant shear surface [10,11]. Their advantage lies in their unique shear mode: torque is applied to the specimen through an annular shear box, creating continuous unidirectional shearing until a stable shear surface forms, thereby precisely capturing the mechanical response of slip-zone soil under large-deformation conditions [11,12]. Compared to traditional direct shear tests and triaxial tests, ring shear tests not only avoid the limitations of artificially designated shear surfaces but also simulate the evolution mechanism of shear zones during landslide movement through continuous shearing processes, making them particularly suitable for studying the progressive failure process of slip-zone soil transitioning from peak strength to residual strength [13,14]. Among the two main designs of ring shear apparatus, the Bishop ring shear apparatus [15] employs a rigid shear box to measure strength by incrementally increasing shear displacement, but specimens are susceptible to sidewall friction interference during shearing, potentially leading to overestimation of residual strength. In contrast, the Bromhead ring shear apparatus improves the shear box structure by designing an annular shear surface to reduce sidewall constraints, making it more suitable for residual strength testing under large-deformation conditions [16]. In recent years, the Bromhead ring shear apparatus has been further integrated with the axis translation technique, enabling suction-controlled testing of unsaturated soils [17], and has become an important tool for studying the mechanical properties of unsaturated slip-zone soil.
The rate effect on the residual strength of slip-zone soil exhibits bidirectional characteristics. A positive effect manifests as strength enhancement with increasing γ ˙ , while a negative effect corresponds to strength weakening with increasing rate [9,13,14,18]. According to Tika et al. (1996) [19], rate effects in granular materials can be negligible or neutral, whereas cohesive soils may exhibit both positive and negative effects simultaneously. This distinct rate effect in cohesive soils is related to the shear mode: turbulent shear may produce neutral or negative effects under different confining pressures; transitional mode is predominantly characterized by negative effects; and laminar shear (common in saturated clay-rich soils with smooth shear surfaces featuring striations) may exhibit both positive and negative effects [2,20,21]. Additionally, Hu et al. [22] reported fluctuating phenomena in shear resistance at higher shear rates ( γ ˙ = 0.02 − 2 × 10⁻³ m/s), confirming that this is controlled by the generation and migration of fine particles within the shear zone and changes in permeability. At even greater shear rates ( γ ˙ > 10−2 m/s), experiments consistently indicate that processes such as frictional heating and pore pressure increases lead to significant weakening [18,23]. This bidirectional effect directly influences the acceleration or deceleration behavior of landslides, making it a focal point in landslide evolution mechanism research.
However, current research has the following limitations. First, although Vithana (2012) [24] studied the drainage shear characteristics of high-plasticity clay by controlling the overconsolidation ratio, and Yang and Vanapalli (2024) [17] proposed that ring shear tests should incorporate suction control techniques such as the pressure plate method and saturated salt solution method, existing studies are mostly limited to strength testing under saturated conditions or single suction levels, lacking systematic analysis of the coupled suction–rate–strength relationship. Second, existing rate effect models are predominantly based on the single-parameter Amontons law, which characterizes rate effects through the friction coefficient ( μ = τ / σ n , where τ is the shear stress and σ n is the normal stress). However, this model fundamentally fails to capture the indispensable contribution of cohesion ( c ) in cohesive slip-zone soil, a component highly sensitive to microstructural changes and inter-particle forces. In contrast, theoretical models based on the dual-parameter Coulomb law ( τ = c + σ n t a n φ ), which analyze the coupling between cohesion ( c ) and the internal friction angle ( φ ), are more applicable. By explicitly incorporating both adhesive force ( c ) and the load-dependent term ( σ n t a n φ ), they enable independent quantification of these two contributions. For instance, the residual strength of cohesive slip-zone soil is primarily governed by adhesion under low normal stress, while frictional forces become more significant under high normal stress [25]. While the theoretical suitability of the Coulomb model for rate effect research on cohesive slip-zone soil is established [8], systematic studies quantifying the variable coupling ( τ f ( c , φ ) g ( γ ˙ , Ψ ) ) remain relatively scarce.
Addressing these limitations, this study focuses on the slip-zone soil of the Huangtupo landslide in the upper reaches of the Yangtze River, combining suction-controlled testing with ring shear technology to systematically analyze the rate effect mechanism of residual strength in unsaturated slip-zone soil. Specific research contents include the following: (1) determining the soil–water characteristic curve over a wide suction range using the pressure plate method and saturated salt solution method; (2) conducting suction-controlled ring shear tests to measure the residual shear strength of slip-zone soil under three matric suction levels ( Ψ = 0 kPa, 200 kPa, 700 kPa) at different net normal stresses ( σ n e t = 100–800 kPa) and shear rates (0.05–200 mm/min); (3) establishing a multiple regression model for residual cohesion ( c r ) with shear rate ( γ ˙ ) and matric suction ( Ψ ) based on experimental data. Through suction-controlled ring shear tests, this study reveals the rate effect of residual strength in unsaturated slip-zone soil, providing a theoretical basis for predicting long-term landslide deformation and designing prevention and control engineering measures.

2. Materials

2.1. Overview of Huangtupo Landslide

The Huangtupo landslide, one of the largest and most catastrophic reservoir landslides in the upper reaches of the Yangtze River of China [26,27], is located in Badong County, Hubei Province, approximately 69 km upstream from the Three Gorges Dam on the southern bank of the Yangtze River (Figure 1a). As shown in Figure 1b,c, the landslide comprises the Garden Spot landslide, Substation landslide, Linjiang No. 1-1 landslide, Linjiang No. 1-2 landslide, and Linjiang No. 2 landslide [28]. Its formation can be divided into three stages: (1) initial destabilization of the Linjiang No. 1 (including 1-1 and 1-2 landslides) and Linjiang No. 2 landslides, with volumes of 2255.5 × 104 m3 and 1992.0 × 104 m3, respectively; (2) subsequent sliding deformation of the Substation landslide located above the Linjiang No. 2 landslide due to traction braking, intersecting the rear edges of the Linjiang No. 1 and No. 2 landslides with a volume of 1333.5 × 104 m3; (3) final formation of the Garden Spot landslide above the Linjiang No. 1 landslide with a volume of 1352.9 × 104 m3. GNSS monitoring data from 2018 to 2024 indicate annual displacement rates ranging from 14.8 to 22.6 mm/a at the front, middle, and rear edges of the landslide, consistent with the “extremely slow” landslide classification [29].

2.2. Slip-Zone Soil Specimen Description

Slip-zone soil samples were collected from the excavation face of Branch Tunnel 3 within the Linjiang No. 1 Landslide at the Badong Field Test Site (BFTS) [32]. The exposed slip-zone soil is a clayey matrix with a 20–40% gravel content derived from argillaceous limestone, with particle sizes ranging from 0.1 to 6 cm. The soil is compact with soft to plastic consistency. The gravel particles exhibit both rounded and sub-angular shapes, with surface scratches and directional alignment features observed. Following the Standard for Geotechnical Testing Method (SGTM, GBT50123-2019) [33], the particle size distribution curve is presented in Figure 2a. The basic geotechnical properties are summarized in Table 1. In addition, a Bruker AXSD8 Focus X-ray diffractometer was employed to examine the mineral composition of the soil samples, which were sieved to 0.075 mm and are listed in Table 1. The clay minerals primarily comprise montmorillonite and illite, accounting for 52.0–53.5%, with illite being the most predominant.
Coarse particles (with a particle size greater than 2 mm) are embedded within the soil matrix of slip-zone soil, which can lead to scatter in test results for parameters like shear strength and creep failure threshold and may trigger size effects in laboratory testing, thus significantly influencing soil properties [34]. Referencing the SGTM (GB/T50123-2019) [33], for soils containing coarse particles, if the particle size exceeds 1/10 of the sample height or the allowable size of the shear surface (for a minimum thickness of 25 mm, 1/10 of this size is 2.5 mm), these particles should be removed or a large-sized sample must be used. Therefore, particles with a diameter greater than 2 mm were removed from the soil samples through sieving prior to testing.
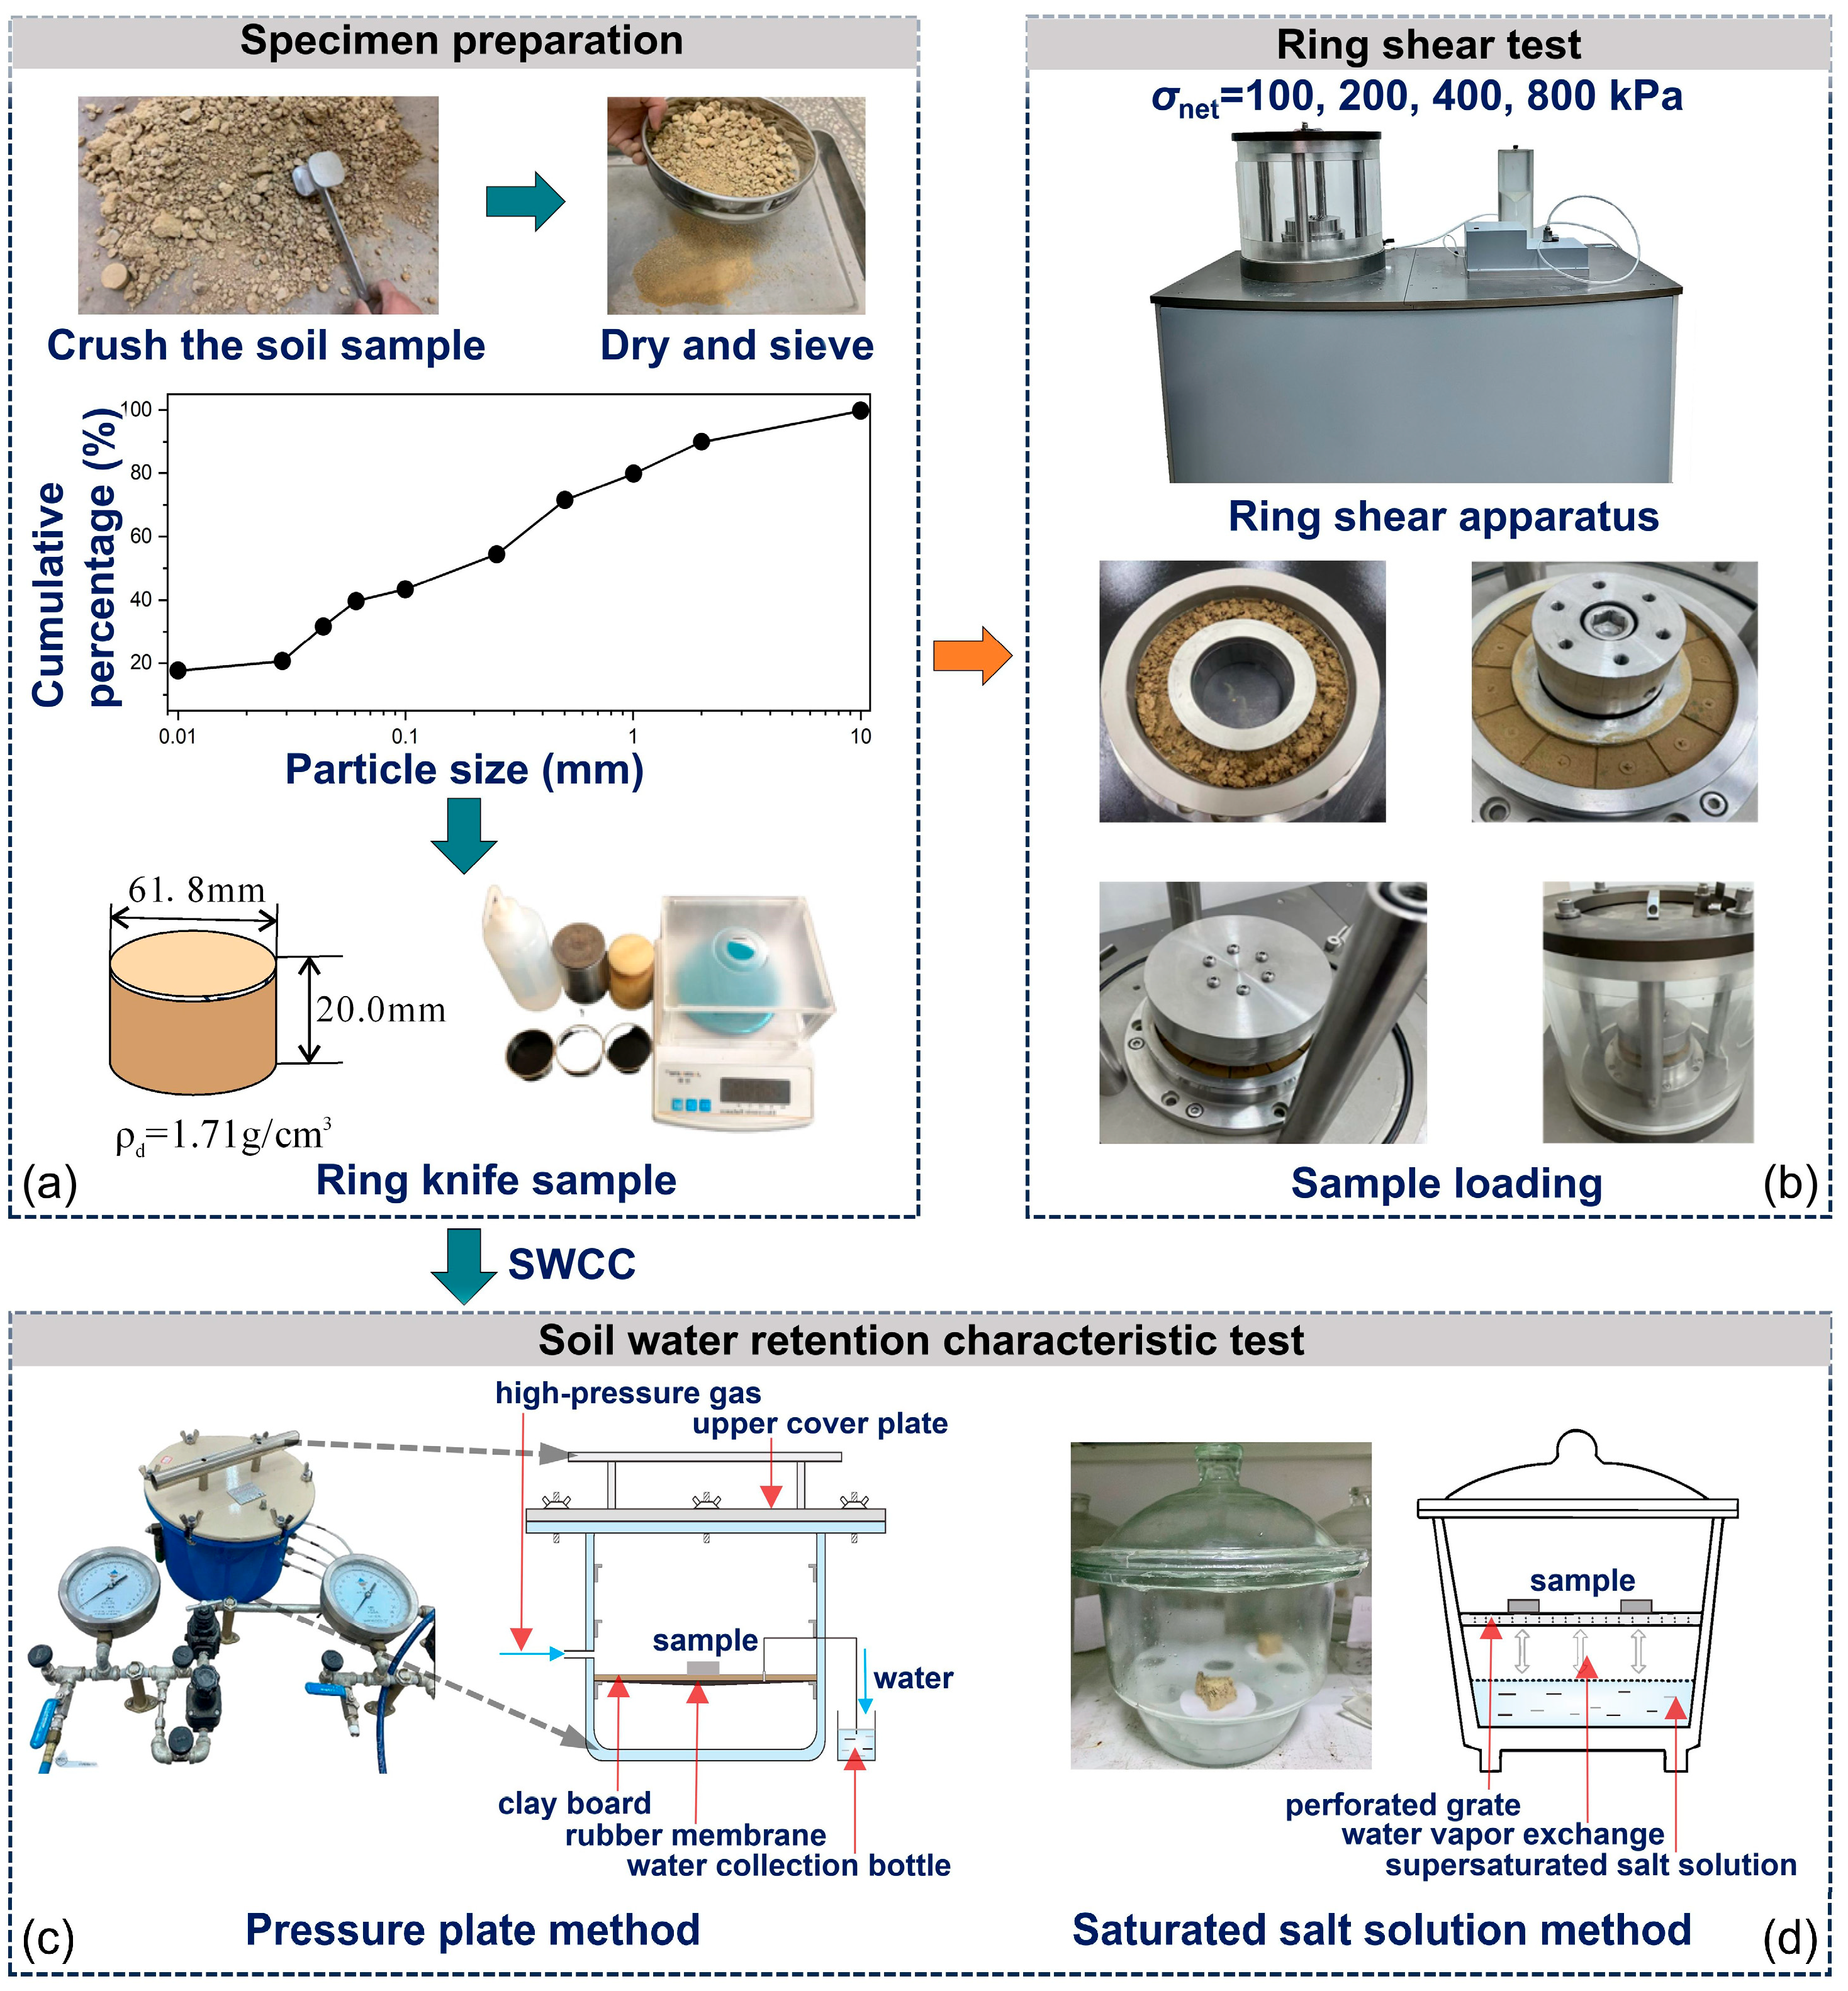
For sample preparation, soil specimens were oven-dried at 105 °C for 24 h to constant weight, crushed with a rubber hammer, and sieved through a 2 mm sieve. One portion was used for soil water characteristic testing, while the other was prepared for suction-controlled ring shear tests, with detailed procedures illustrated in Figure 2.

3. Methods

3.1. Soil Water Retention Characteristic Testing Methods

This study employed the pressure plate method (suction range: 0–700 kPa) and saturated salt solution method (suction range: 3–400 MPa) to determine the soil–water characteristic curve (SWCC). The pressure plate tests were conducted using a Soil moisture Equipment Corp Model 1600 Pressure Extractor (Figure 2c), featuring a low-permeability ceramic plate with uniform micro-pore structure. When saturated, the ceramic plate forms water menisci in its pores, enabling water–air phase separation (water-permeable but air-impermeable) when applied air pressure is below the air-entry value. Based on axis translation technique, matric suction ( Ψ = u a u w ) was controlled by adjusting the difference between pore air pressure ( u a ) and pore water pressure ( u w ). During testing, u a was maintained constant while u w was set to 0 (atmospheric pressure), making the applied air pressure equivalent to Ψ . Samples were placed in a sealed container connected to the ceramic plate at the bottom, with drainage channels open to atmosphere to maintain u w = 0. After applying air pressure, excess pore water was expelled through the ceramic plate micro-pores. When equilibrium was achieved (after 24 h or when drainage rate ≤ 0.01 cm3/2 h), the air pressure value equaled the soil suction magnitude but with opposite direction, allowing water content measurement.
According to ASTM C1699-09 [35], the pressure plate test procedure included the following: (1) Sample preparation: Soil was oven-dried at 105 °C for 8 h, crushed, and sieved through a 2 mm sieve. Target water content was achieved by mixing soil and distilled water, followed by sealing and resting for 12 h. Ring cutter samples were prepared using a sample preparation device and then vacuum-saturated. (2) Ceramic plate saturation: The plate was immersed in distilled water for 24 h, installed in the pressure chamber, and covered with distilled water. After sealing, air pressure was adjusted to 5 kPa to expel air from pores. Saturation was confirmed when continuous water flow without bubbles was observed. (3) Sample installation: Saturated samples wrapped in filter paper were placed on the ceramic plate, and the container was sealed for desaturation testing. (4) Stepwise pressurization: Air pressure was incrementally increased from 0 to 700 kPa (0→6→15→25→50→100→200→300→400→500→600→700 kPa), with equilibrium time ≥ 24 h at each stage. The test concluded after equilibrium at 700 kPa, with total duration approximately 15 days.
At constant temperature, suction has a unique relationship with relative humidity (RH) via the Kelvin equation. Maintaining constant RH enables suction control. According to ASTM E104 [36], this study used the saturated salt solution vapor equilibrium method to control high suction states, following ASTM E104 standards for maintaining constant relative humidity by means of aqueous solutions. Saturated salt solutions were placed at the bottom of sealed containers, with porous ceramic plates and samples arranged above. The stable vapor pressure generated by salt solutions maintained constant RH in the sealed environment. This method offers two advantages: (1) over-saturated salt solutions maintain constant concentration during moisture exchange, enabling long-term RH stability; (2) bidirectional water vapor migration between a sample and solution achieves suction equilibrium. As shown in Figure 2, the experimental setup included sealed containers, 10 types of saturated salt solutions, an electronic balance (precision 0.001 g), deaerated distilled water, tweezers, an industrial thermometer (±0.5 °C), an infrared thermometer, and petroleum jelly. The total suction values corresponding to each saturated salt solution (at 25 °C) were determined by consulting primary standard reference sources [36] and are listed in Table 2. Different salt solutions correspond to specific suction values at 25 °C, with typical RH uncertainties of ±0.1% to ±0.8% (propagating to suction uncertainties of approximately ±2–15 MPa, depending on the salt and preparation method). The reliance on 25 °C reference data directly ensures the RH calibration traceability for the determined suction values.
The testing procedure was as follows: (1) Saturated ring cutter samples were pre-pared following the pressure plate method and divided into 8 equal portions along the axial direction. (2) Over-saturated salt solutions were prepared in transparent glass containers (with crystals precipitated at the bottom), with perforated grids placed above. (3) Cut samples (2 per salt solution) were positioned on the grids directly above corresponding salt solutions, ensuring physical isolation between samples and solutions. (4) Containers were sealed with petroleum jelly and maintained at 25 ± 1 °C. (5) Sample mass was measured weekly; equilibrium was confirmed when mass change was <0.01 g for two consecutive weeks (typically requiring 2–3 months). (6) After equilibrium, two samples were oven-dried to determine water content, with the average value representing equilibrium water content at the specific suction level.

3.2. Suction-Controlled Ring Shear Test

3.2.1. Testing Apparatus

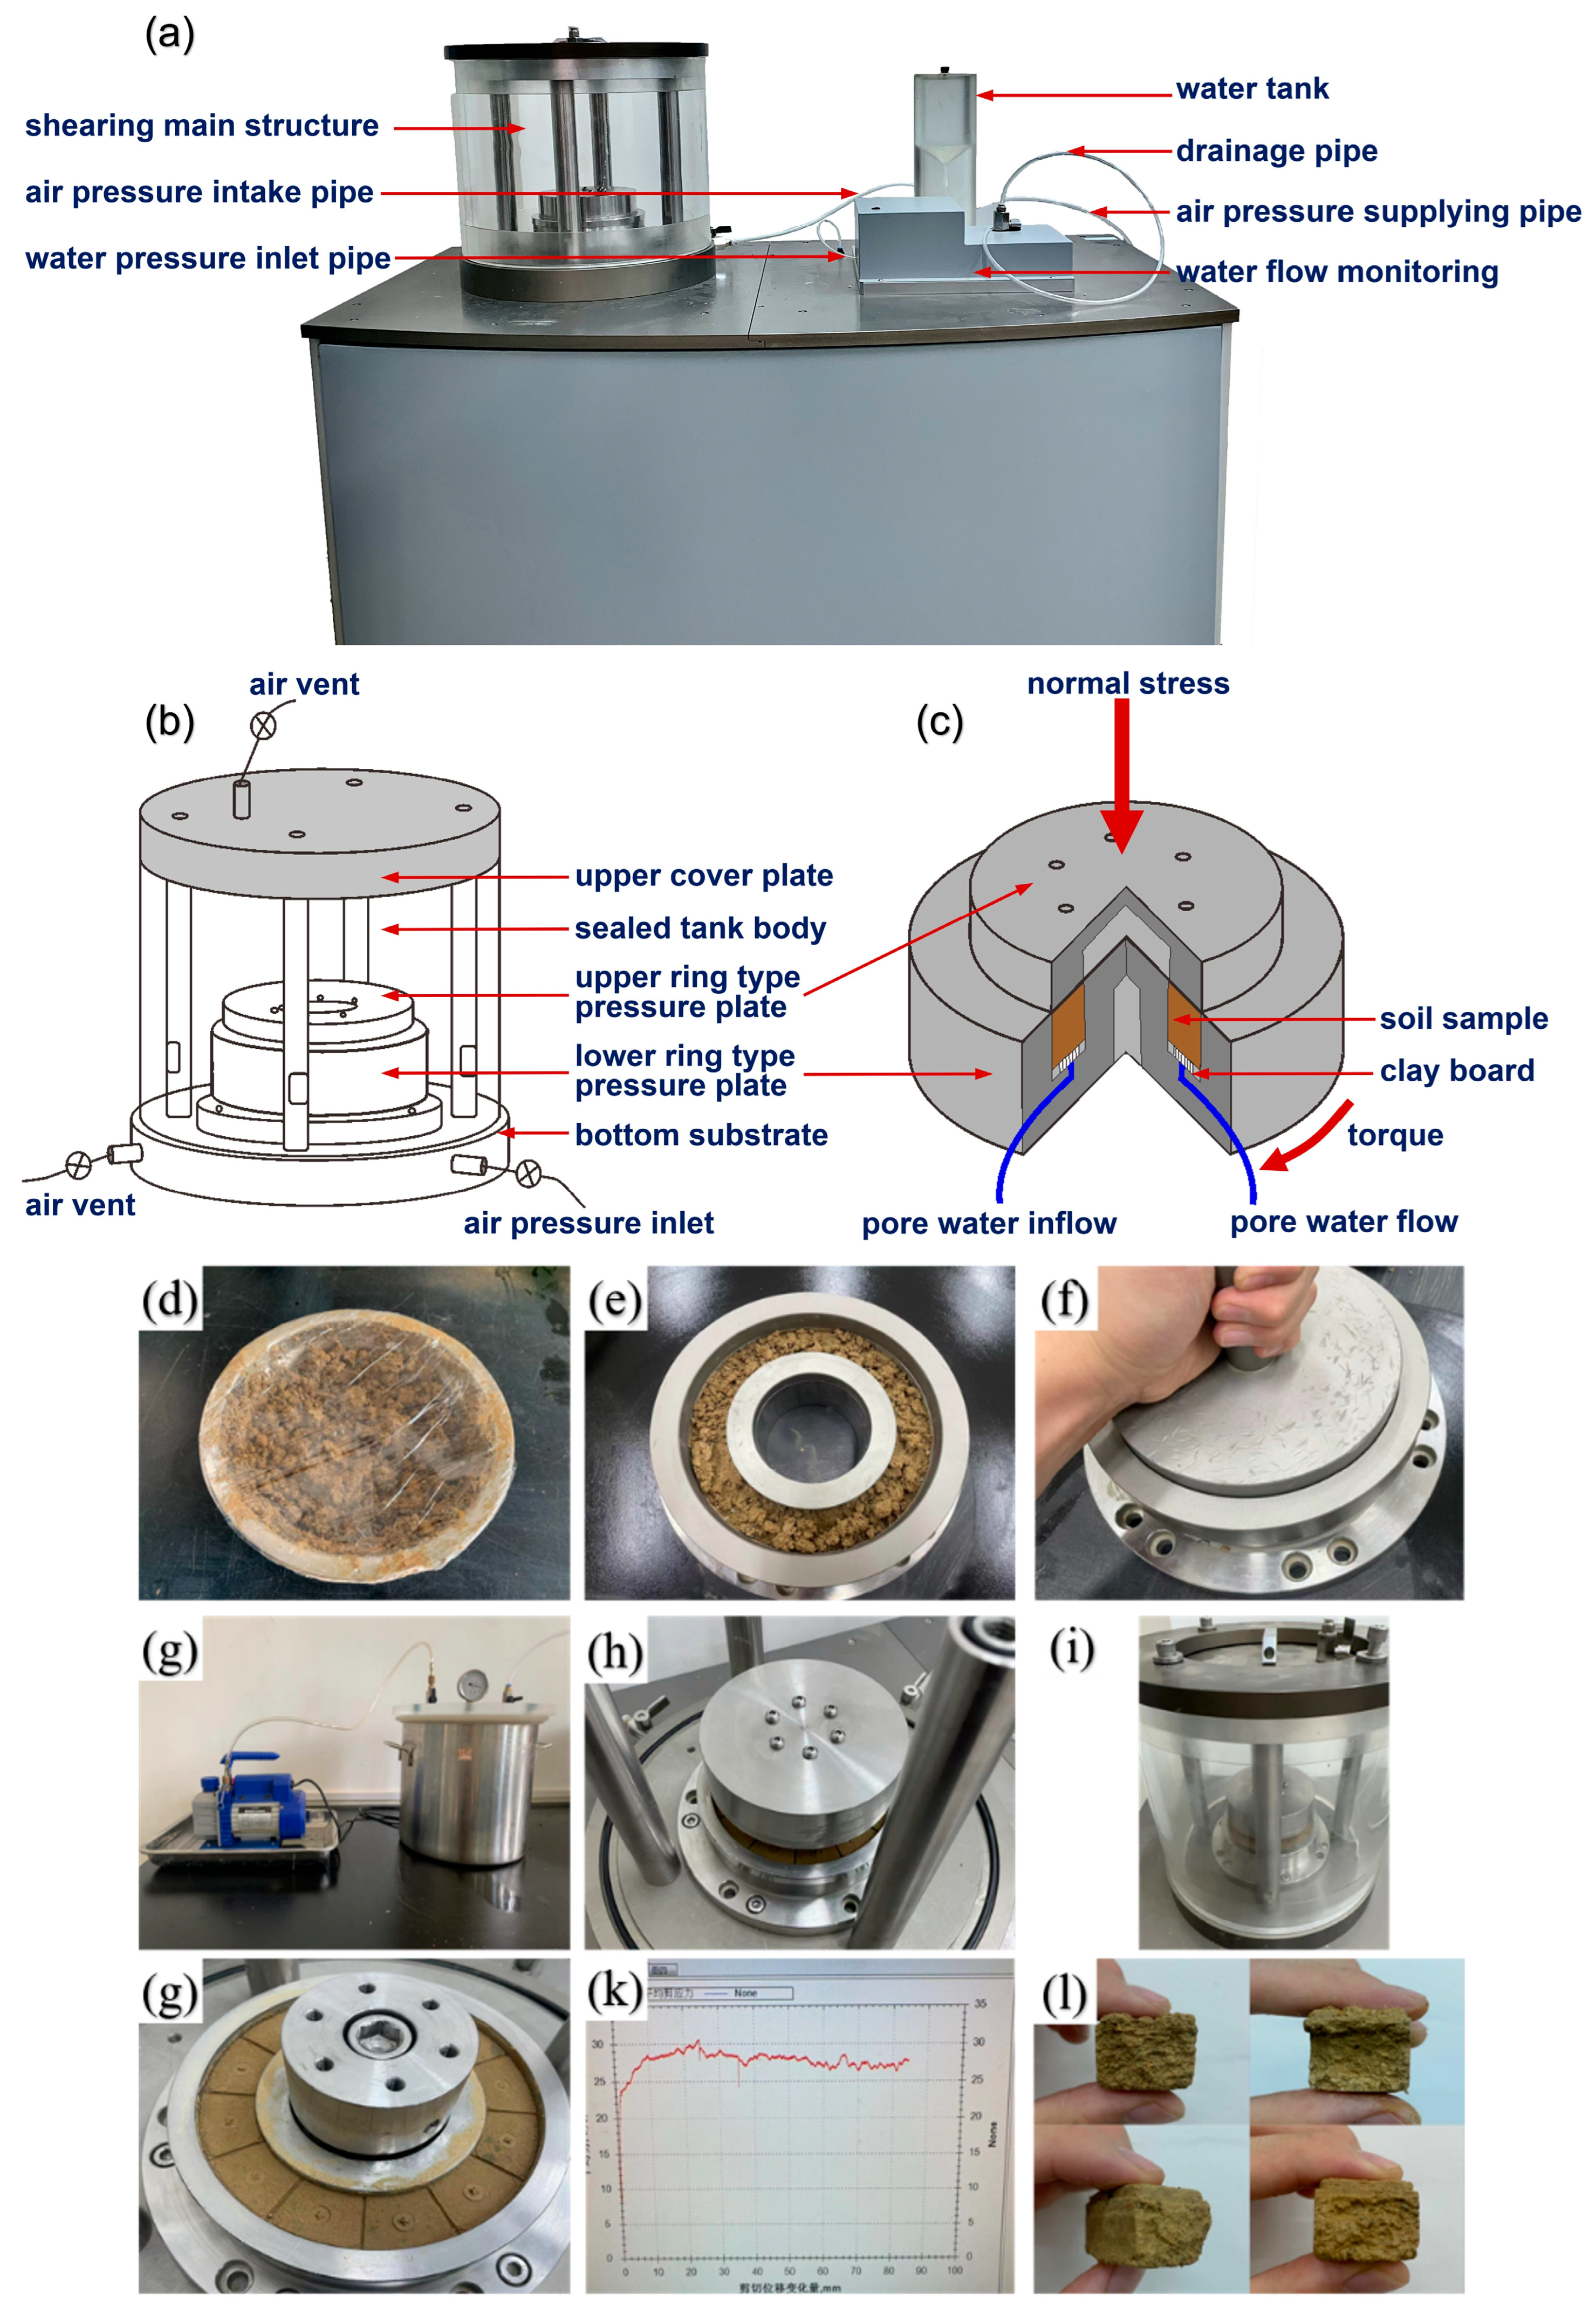
The TKA-RSA-6 fully automatic unsaturated soil ring shear apparatus (Figure 3), manufactured by TKA Technology, features three core components: a sealed chamber, air pressure control system, and mechanical loading module. The acrylic chamber is equipped with sealing rings at both ends to ensure airtightness, with air inlet/outlet ports at the top and drainage connections to a water tank at the bottom (Figure 3a). Specimens are installed within the chamber on a bottom platen containing a ceramic disk with a 15-Bar air-entry value, which separates pore water and air phases. Pore water connects to an external reservoir through the saturated ceramic disk, maintaining pore water pressure at atmospheric level, while pore air pressure is regulated by chamber air pressure. The difference between these pressures defines Ψ . An integrated air pressure sensor (accuracy: 1 kPa) monitors chamber pressure and automatically adjusts suction deviations via a pressure regulator.
The apparatus employs a pneumatic loading system capable of applying up to a 5 kN vertical load, with vertical displacement measured by a digital display (resolution: 0.01 mm). Shear motion is driven by a dynamic servo motor with step motor controller enabling continuous speed adjustment from 0.0001 to 360°/min. A torque sensor records shear torque (range: 300 N·m; accuracy: 0.1 N·m). Dedicated software synchronously controls γ ˙ , acquires mechanical parameters, and processes data. The system also incorporates a dynamic diffusion bubble flushing function to eliminate air blockage during suction-controlled tests.
Specimens (100 mm inner diameter, 150 mm outer diameter, 25 mm thickness) were installed between upper and lower annular platens (Figure 3b,c). The upper platen contained insertable ribs that created a 5 mm wide shear zone, preventing surface sliding. This apparatus supported both static and dynamic cyclic shear tests for determining peak and residual strength, with a pore air pressure control range of 0–1.5 MPa and pore water pressure range of 0–100 kPa, suitable for simulating complex stress paths in unsaturated soils.

3.2.2. Sample Preparation and Test Procedure

Soil samples were oven-dried at 105 °C for 24 h to constant weight, crushed, and sieved through a 2 mm sieve. They were then mixed with deaerated distilled water according to target water content corresponding to desired matric suction levels and sealed with plastic film for at least 24 h to prevent moisture loss.
The testing procedure consisted of three main stages:
(1)
Ceramic plate saturation: The ceramic plate was immersed in deaerated distilled water for 24 h, followed by secondary vacuum saturation for another 24 h to remove air from pores. After installation in the ring shear apparatus, deaerated distilled water was added to the water tank and 100 kPa air pressure was applied to expel free water through the ceramic plate’s micro-pores. Saturation was confirmed when water droplets appeared on the ceramic plate surface and drainage stabilized.
(2)
Sample installation and consolidation: Standard samples of a 25 mm thickness were used, a dimension selected to ensure a representative sample volume while maintaining a controllable drainage path length. To reduce friction, petroleum jelly was applied to the inner wall of the lower shear box, and wet filter paper was placed at the bottom to ensure water flow continuity. To ensure sample homogeneity, the soil was thoroughly mixed with de-aired distilled water, sealed in plastic wrap, and left to rest for at least 24 h to allow sufficient and uniform moisture diffusion. When installing the sample into the ring shear box, the soil was filled with three layers of equal mass. Each layer was compacted using a standard effort and its surface was roughened to enhance interlayer contact, thereby minimizing the possibility of stratification and density non-uniformity. Following installation, the sample was consolidated until stability was confirmed, defined as a vertical displacement rate of ≤0.005 mm/h.
(3)
Suction equilibrium: Pore air pressure was adjusted by pressurizing the main chamber to establish the desired Ψ . Suction equilibrium was achieved when the sample volume change rate was <0.035 mm/d, with each equilibrium stage taking 50–100 h.
Figure 3d–l illustrate the test procedures: d–f show sample installation into the lower shear box, g represents vacuum saturation, h–i depict equipment setup and calibration, g–k show post-test sample and data observation, and l displays the shear surface observation.

3.2.3. Testing Program and Procedures

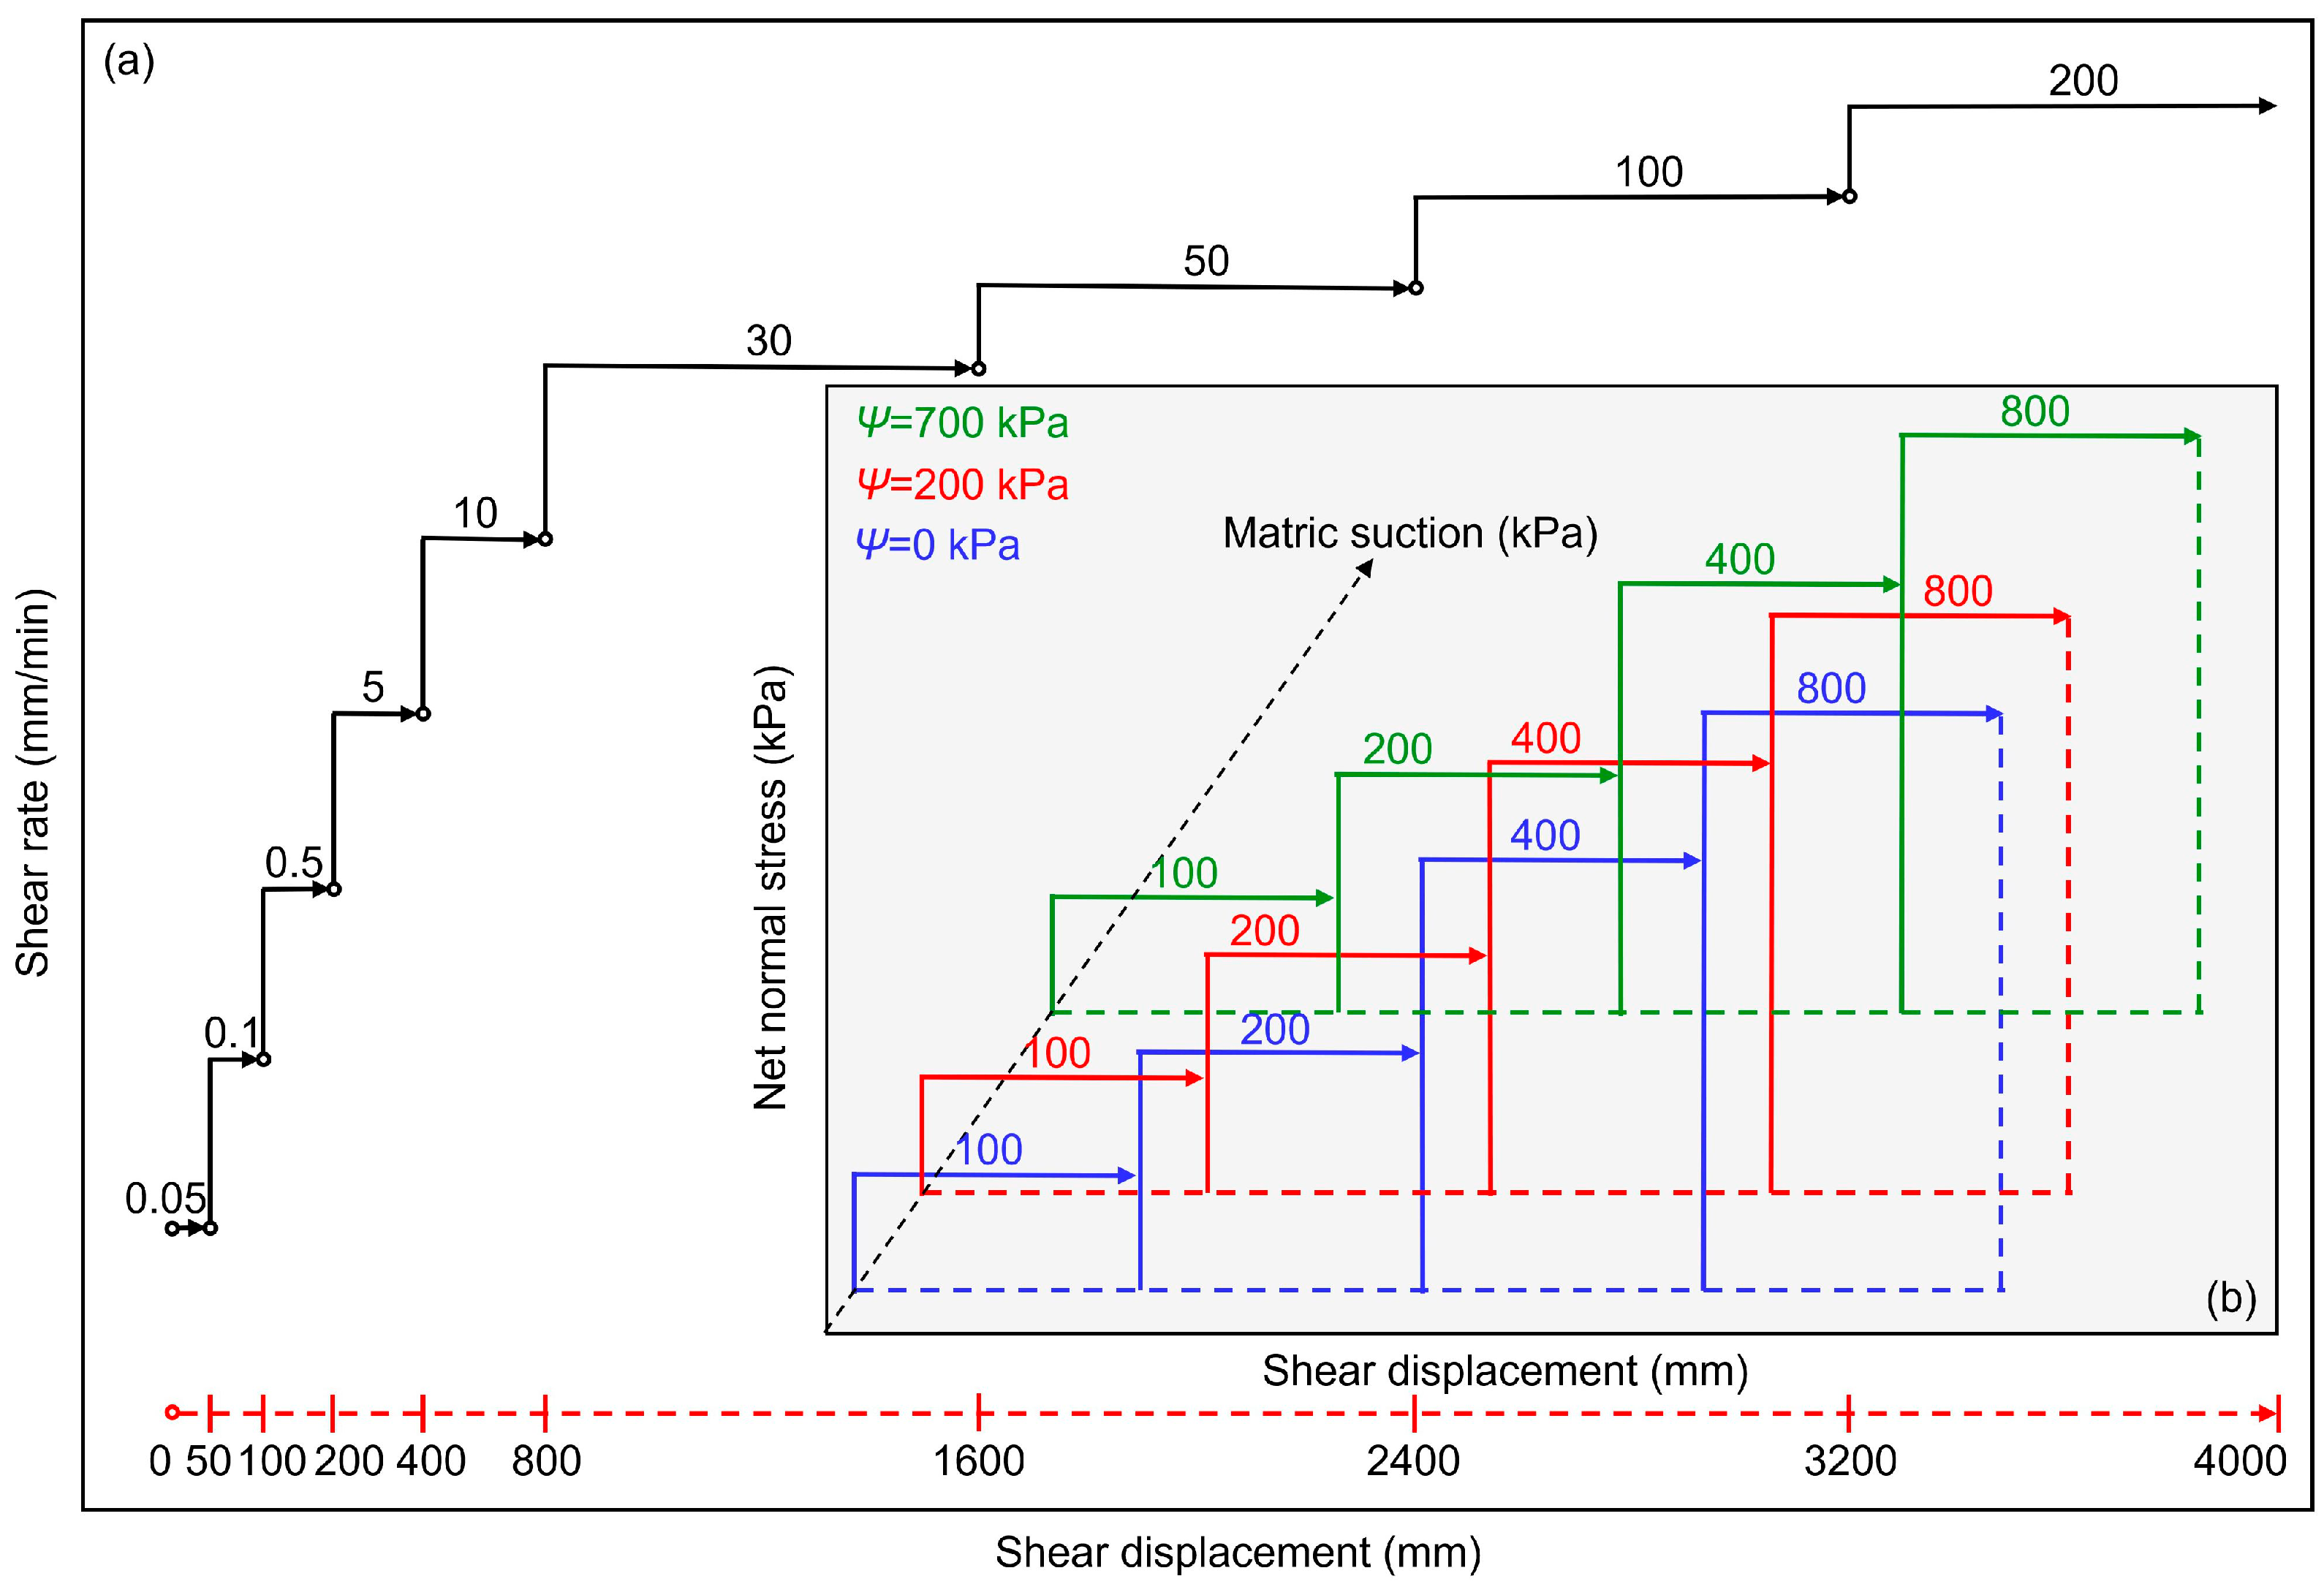
This study systematically investigated the rate effect on the residual strength of slip-zone soil by controlling two variables: Ψ and σ n e t . As shown in Figure 4, the testing program is detailed in Table 3.
The three matric suction levels (0, 200, and 700 kPa) were selected to represent the typical water content states that the loess slip-zone soil might experience during changes in reservoir hydrological conditions, aiming to reproduce its saturation-to-unsaturation transition process. According to the field investigation and data in Table 1, the natural water content of the slip-zone soil was 12%. Furthermore, water content as low as 9% was observed during the excavation of the exploratory tunnel. Utilizing the measured SWCC, the 12% water content corresponded to approximately 200 kPa of suction, while the 9% water content corresponded to approximately 700 kPa. Therefore, we established three suction levels, 0 kPa (saturated state), 200 kPa (medium suction/natural state), and 700 kPa (high suction/relatively dry state), collectively representing the typical suction range for landslide slip zones. Suction stability was achieved using pressure plate and vapor equilibrium methods [17], ensuring constant Ψ throughout testing.
The net normal stress range was determined based on the in situ stress state and relevant research. Given that the samples were extracted from the test tunnel at a depth of 52.54 m, the actual effective stress experienced by the slip-zone soil samples, based on an average density of the slide mass of 2.2 g/cm3, was calculated to be approximately 766.4 kPa [27]. The σ n e t values of 100, 200, 400, and 800 kPa were selected as a logarithmically spaced sequence to cover the practical loading conditions of slip-zone soil and ensure that the upper limit (800 kPa) fully covered the field stress level. This approach also referenced creep studies on reservoir landslides [8]. As indicated by the dashed box in Figure 4, each stress increment was applied continuously through the axis translation technique.
The shear testing combined pre-shearing with multi-stage shearing. During the pre-shearing phase, specimens were sheared at 0.1 mm/min for 100 mm displacement to establish a stable shear surface and eliminate initial disturbance effects. In the multi-stage shearing phase, γ ˙ was incrementally increased from 0.05 to 200 mm/min (0.05→0.1→0.5→5→10→30→50→100→200 mm/min) following the solid line path in Figure 4. The determination of this wide shear rate range considered instrument capability, research objectives, and the basis in the literature [8]. This comprehensive range aimed to systematically explore the evolution of residual strength throughout the entire process, from extremely slow creep (0.05 mm/min effectively captures the creep mechanical response of extremely slow landslides like loess slopes, which have annual displacements in the millimeter range) to the critical state of accelerated failure (where transient pore water pressure effects are triggered by blocked drainage at high speeds). Continuous shearing without interruption was maintained to prevent pore water pressure dissipation and specimen consolidation [37], ensuring the authenticity of dynamic sliding simulation.
The multi-stage, incremental shear rate protocol was adopted in this study to eliminate sample-to-sample variability and ensure that all rate effects were measured on a consistent, fully formed residual shear surface. Before proceeding to the next shear rate, the following stability criteria had to be met: the fluctuation in shear stress had to be less than 0.1 kPa, and the vertical displacement rate had to be negligible.

4. Results

4.1. SWCC

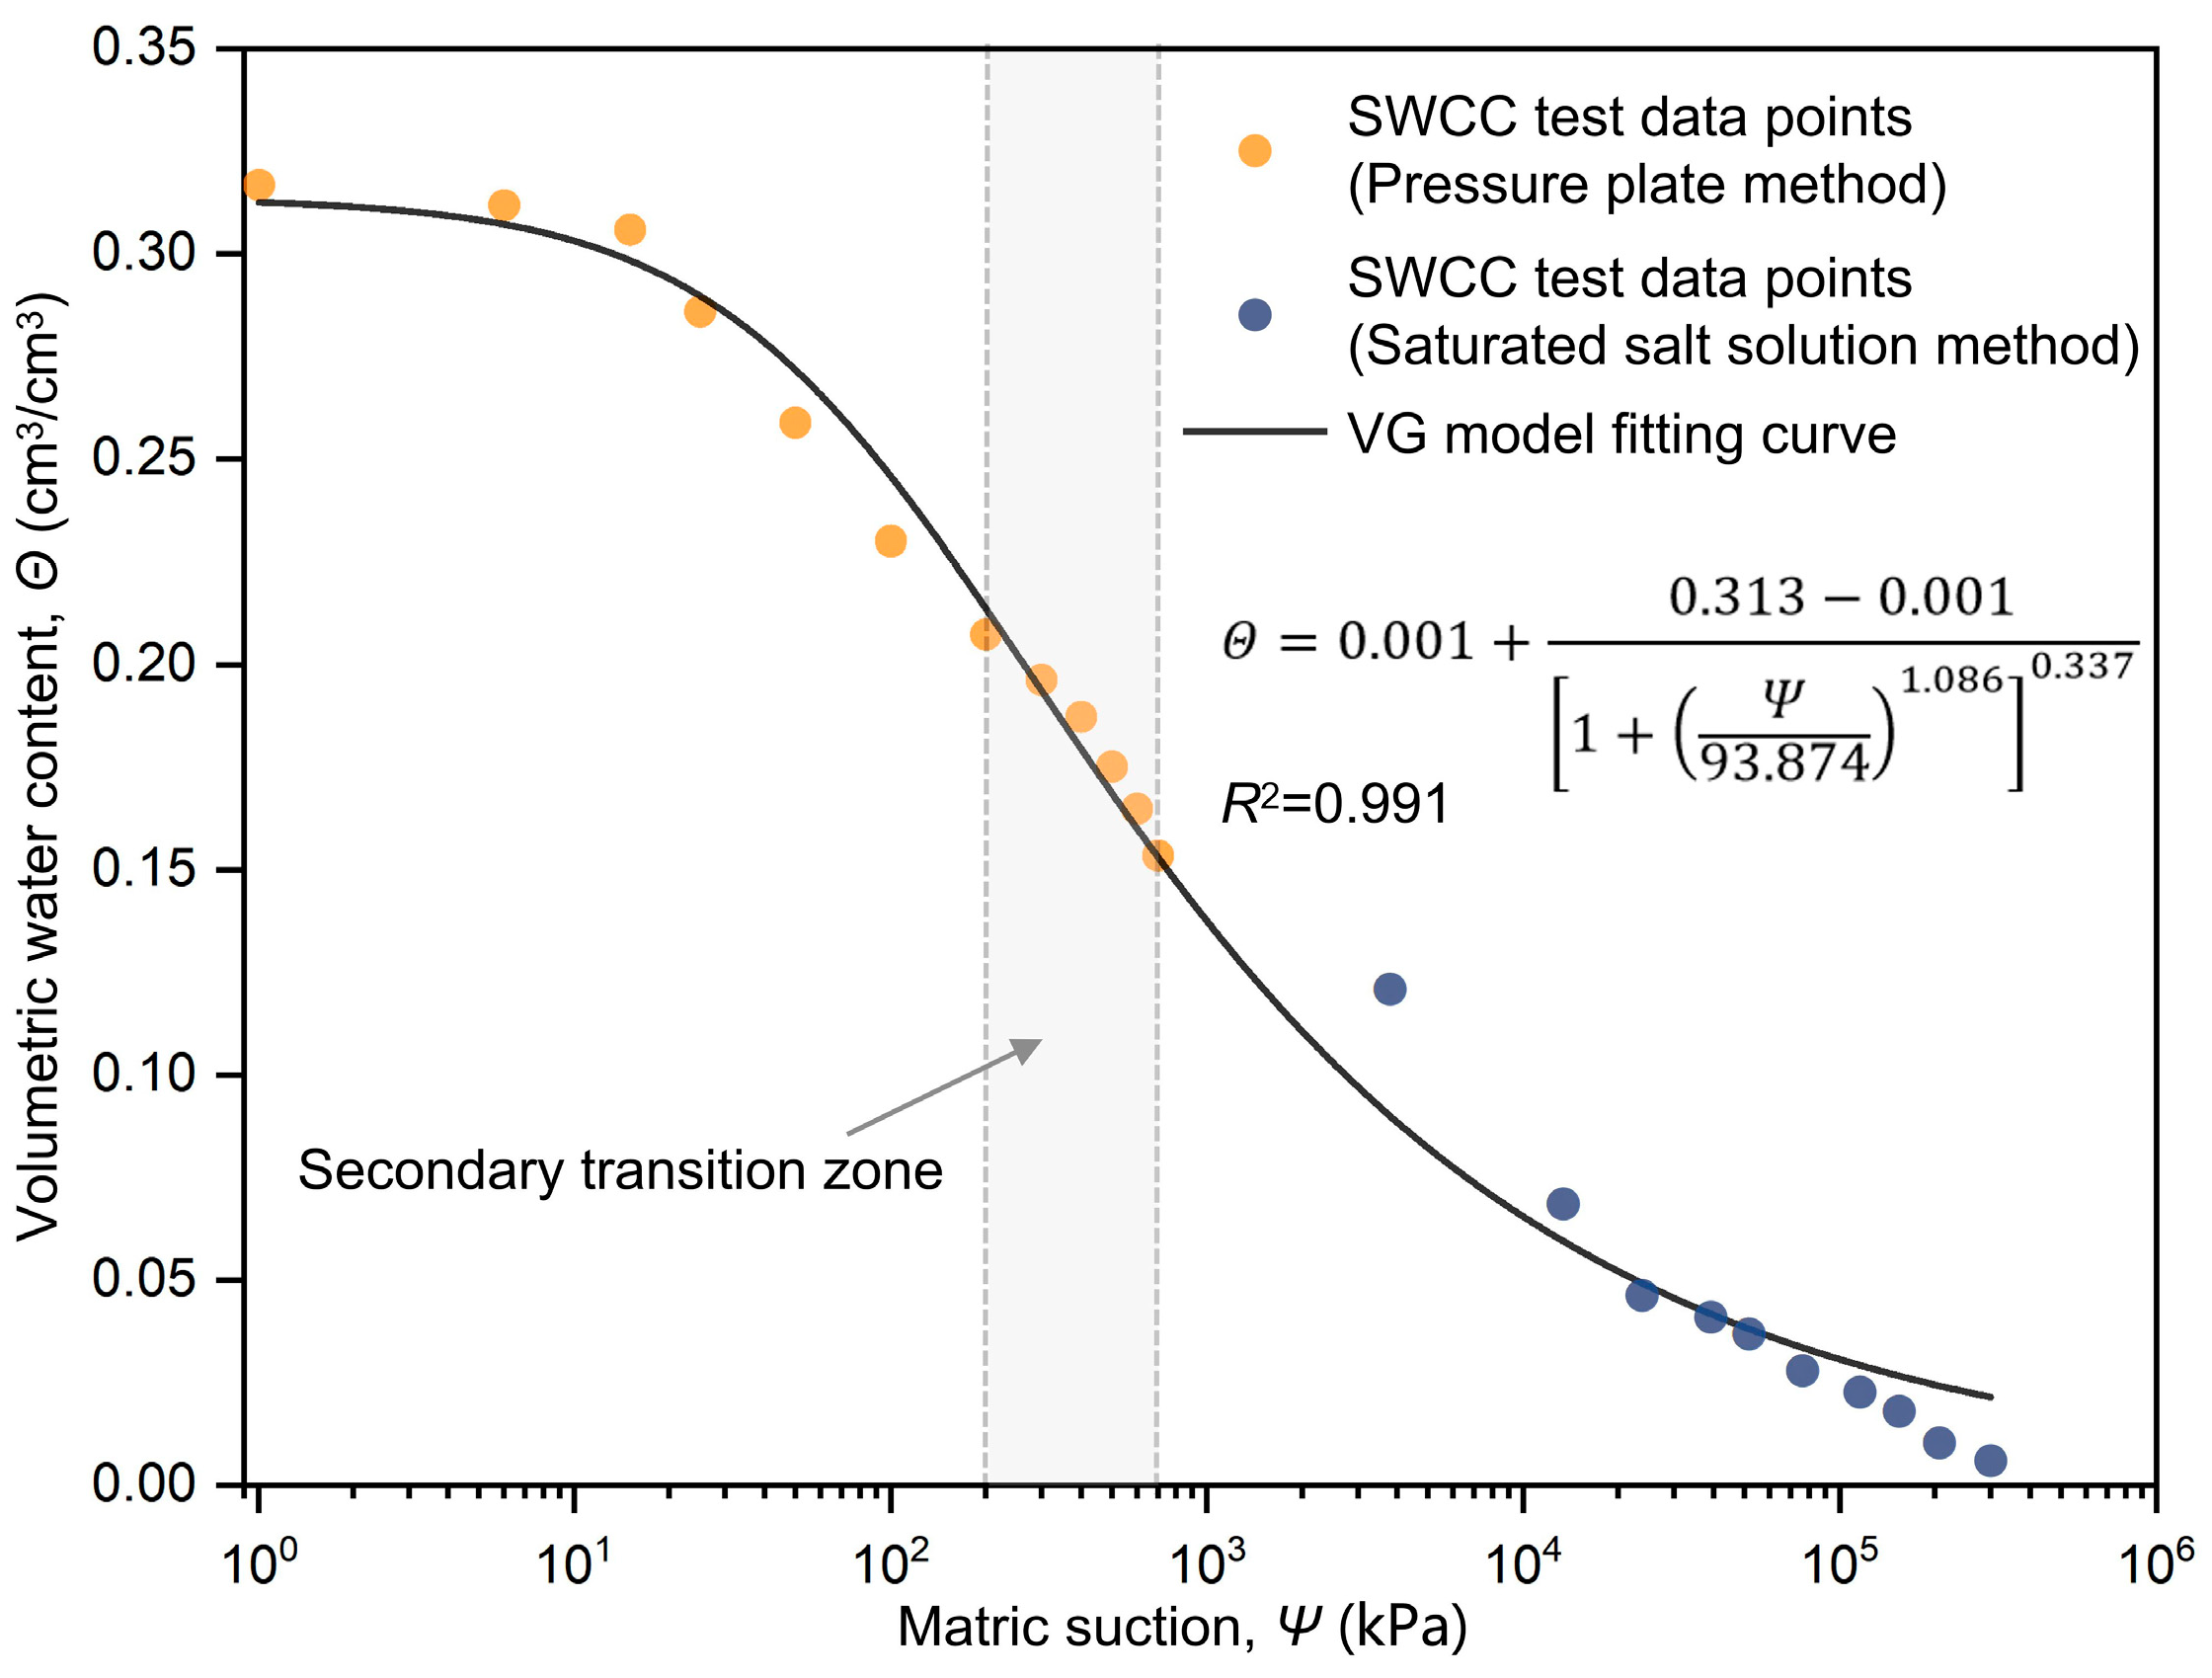
This study employed the pressure plate method (0–700 kPa) and saturated salt solution vapor equilibrium method (3–400 MPa) to obtain volumetric water content data across a wide suction range for the Huangtupo landslide slip-zone soil. As shown in Figure 5, the soil–water characteristic curve (SWCC) was established by integrating test data from both methods and fitting with the four-parameter Van Genuchten model [38]:
Θ = Θ r + Θ s Θ r 1 + Ψ a n m
where Θ is volumetric water content, Θ s is saturated water content, Θ r is residual water content, and a , m , and n are fitting parameters. The parameter a (93.874) corresponds to the suction at the inflection point, related to the air-entry value; n (1.286) describes the shape of the SWCC; and m (0.337) is associated with residual water content. The correlation coefficient of 0.991 indicates excellent model fit.
The SWCC exhibits maximum slope at approximately Ψ = 200 kPa, representing the secondary transition zone [39] where water content is most sensitive to suction changes. This behavior results from the bimodal pore structure of the slip-zone soil: large pores formed by gravel and clay aggregates drain at low suction, while small pores between clay particles dominate water retention at high suction. At moderate suction levels, the adsorbed water film thickness allows particles to maintain sufficient connection strength while permitting moderate rearrangement, creating highly predictable rate responses. In contrast, when Ψ > 3 MPa, the SWCC becomes flatter, indicating minimal water content variation. Although dry soil exhibits greater structural stiffness, microcrack development increases response randomness, reducing the predictability of rate effects.

4.2. Shear Behavior During Suction-Controlled Ring Shearing

4.2.1. Shear Stress–Displacement Curve of Unsaturated Slip-Zone Soil

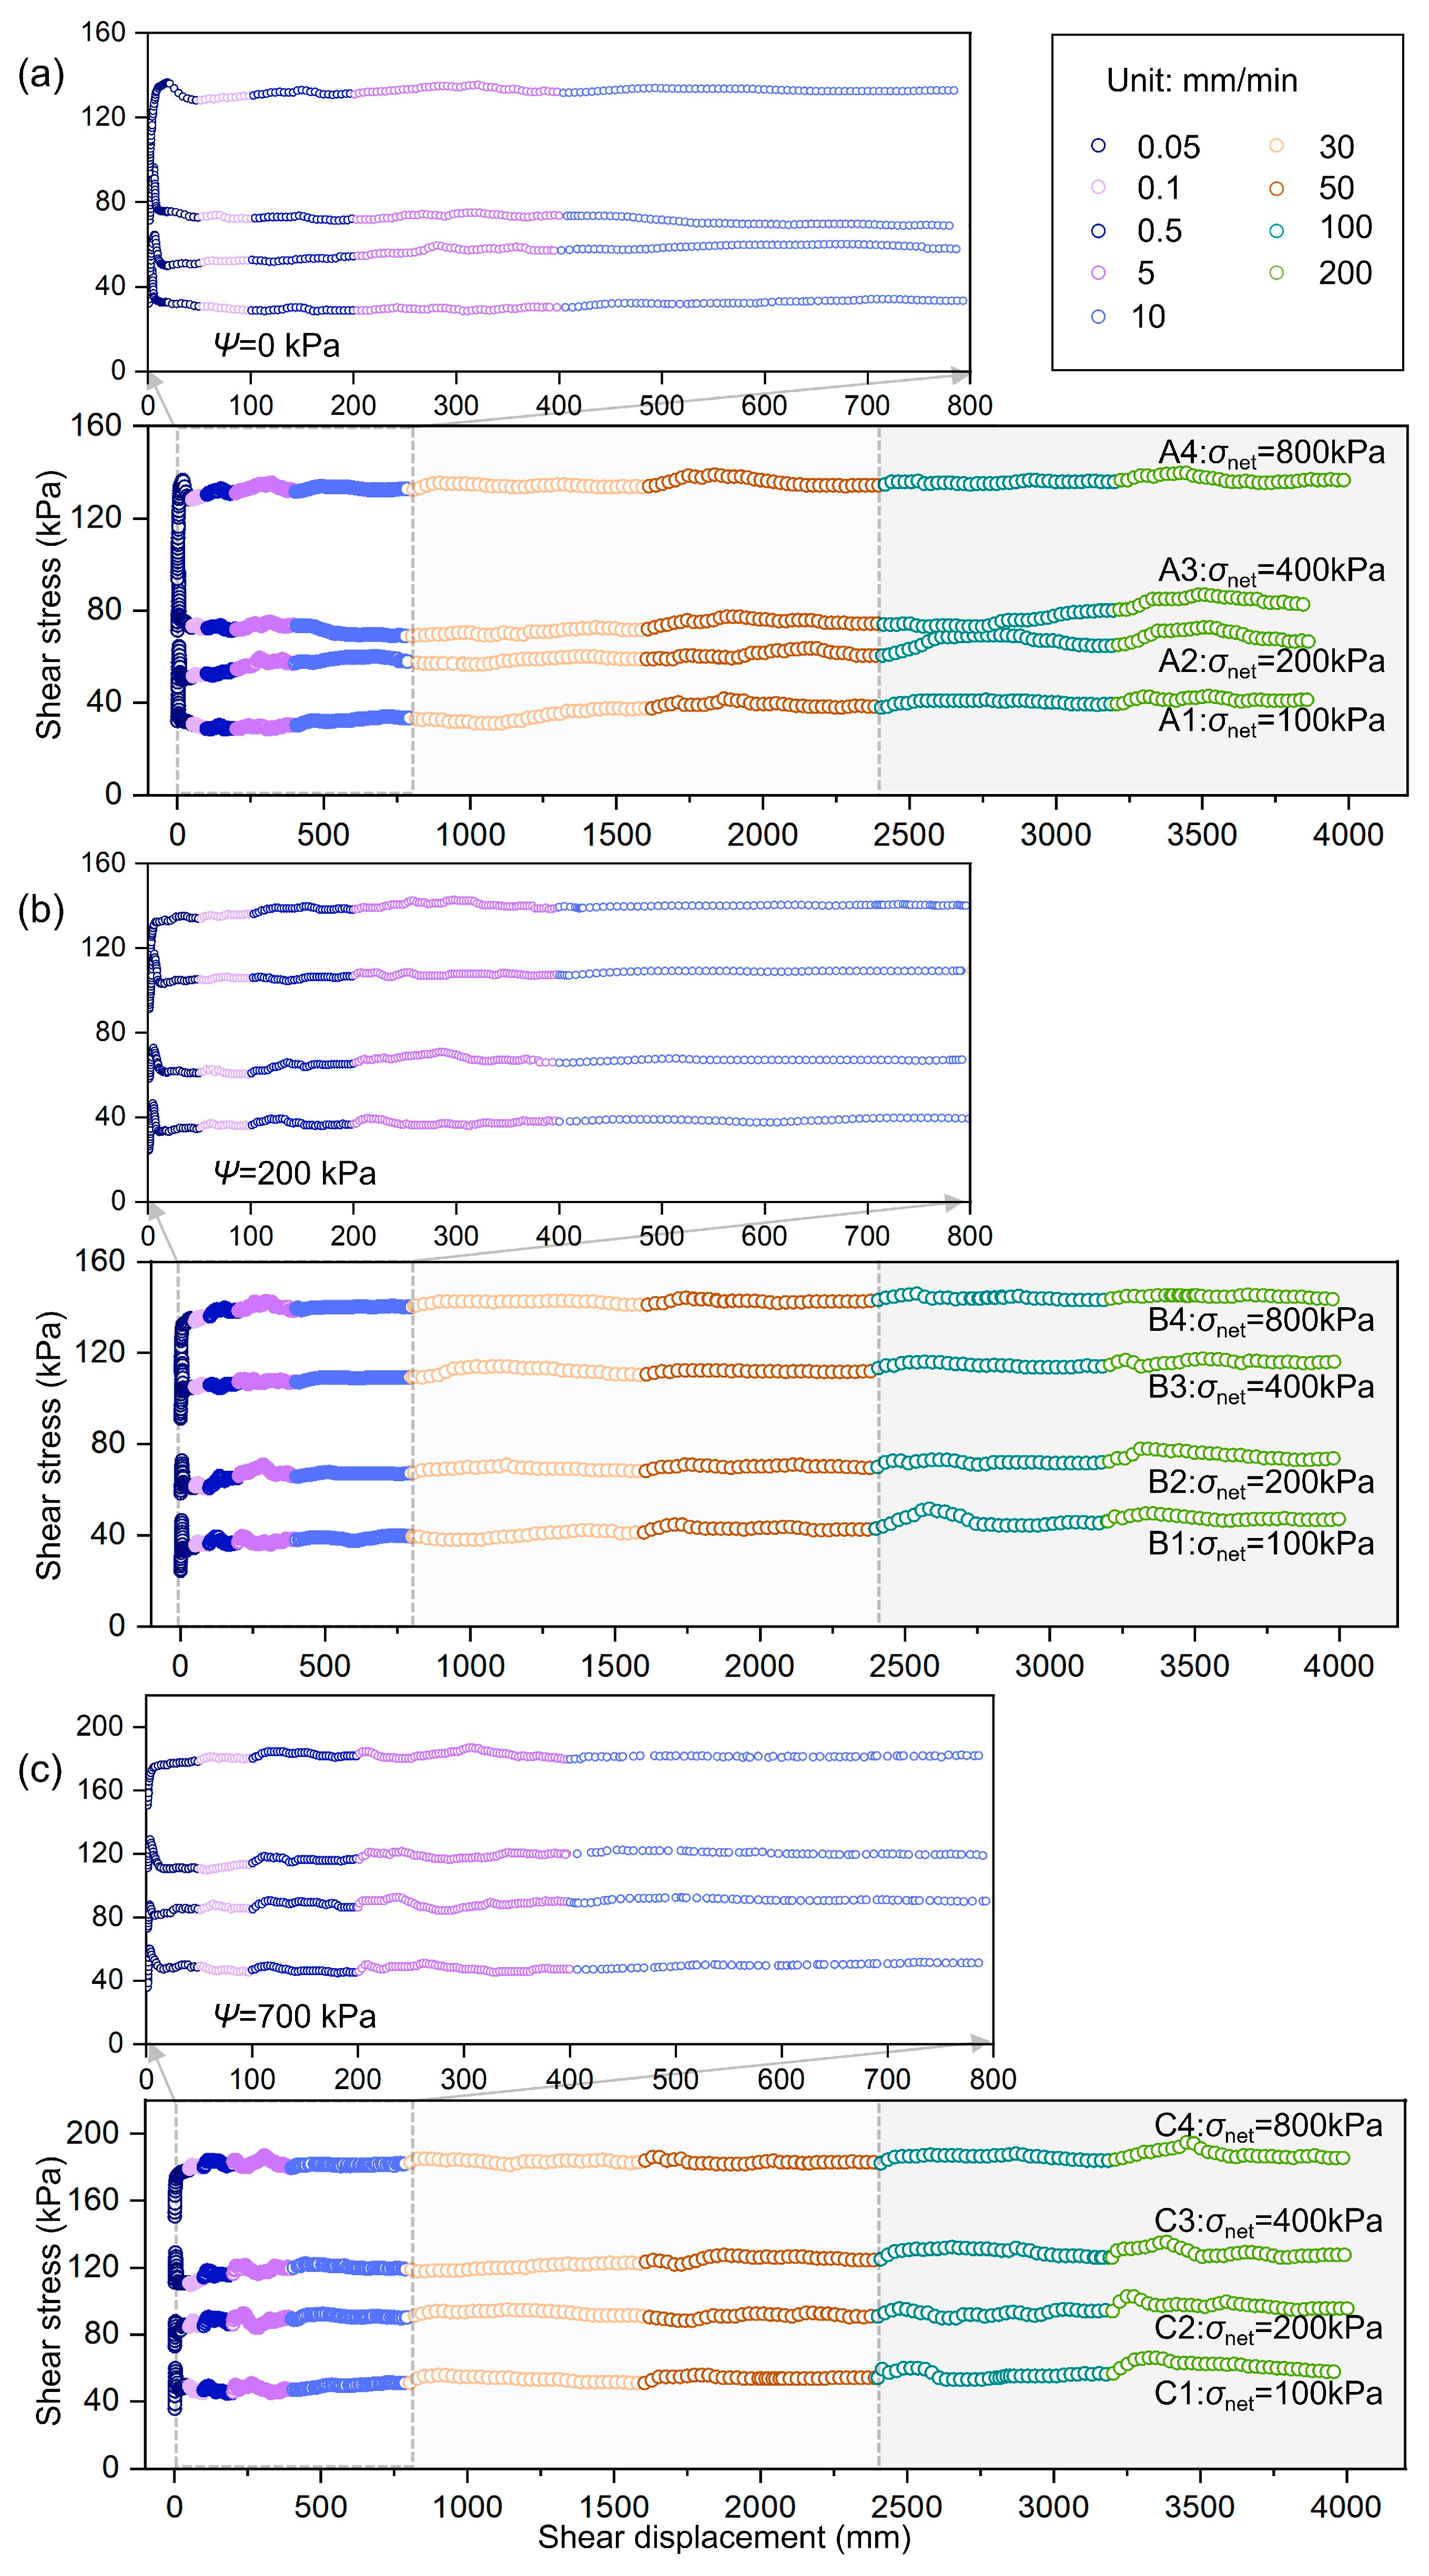
After the completion of the tests, a detailed specimen morphology observation was performed for all specimens (Figure 3i). The results showed that, after experiencing large-displacement shearing (total displacement >2400 mm), all specimens formed a continuous, single shear band. No obvious cracking, stratification, or multiple shear planes were observed. Figure 6a shows the shear stress–displacement curves of slip-zone soil under saturated conditions ( Ψ = 0 kPa). Results indicate that only the specimen under the σ n e t of 800 kPa (Group A4) exhibited strain hardening behavior, while the other three groups (A1–A3) all displayed strain softening. Both peak and residual strengths decreased with decreasing σ n e t , with the most significant reduction observed between Groups A4 and A3, reflecting enhanced strength sensitivity under low normal stress due to weaker drainage capacity and higher water content. Figure 6b presents the shear stress–displacement curves at Ψ = 200 kPa. Similarly to saturated conditions, only the specimen under the σ n e t of 800 kPa (Group B4) showed strain hardening, while the other groups (B1–B3) exhibited strain softening. Specimens rapidly entered elastic deformation, reached peak strength, and then gradually decayed to residual strength. Under high-suction conditions ( Ψ = 700 kPa), the specimen under the σ n e t of 800 kPa (Group C4) maintained strain hardening behavior, while low-stress groups (C1–C3) continued to display strain softening. Notably, Group C consistently demonstrated higher residual strength than corresponding Groups A and B at the same normal stress levels (Figure 6c), validating the strengthening effect of matric suction.
Analysis of shear stress–displacement relationships across all suction conditions reveals that all specimens underwent three distinct stages: peak strength, strain softening, and residual strength. However, the combination of high σ n e t s (800 kPa) and high suction (700 kPa) can induce strain hardening. γ ˙ significantly influences the response. In the low-speed shear stage ( γ ˙ ≤ 10 mm/min, ≤800 mm displacement), there is rapid stress decay with early formation of residual strength platforms, enhancing strain softening behavior. In the medium-speed shear stage (10–50 mm/min, 800–2400 mm displacement), larger displacement is required to reach a stable state, likely due to differences in particle reorientation and pore water pressure dissipation timing [13]. In the high-speed shear stage ( γ ˙ > 50 mm/min, >2400 mm displacement), increased curve fluctuation requires longer displacement to achieve stability. Particularly at 200 mm/min, shear strength shows a slight increase followed by gradual decay to residual strength, possibly due to the following: (1) transient pore water pressure elevation and subsequent dissipation; (2) localized particle crushing or liquefaction creating micro-crack networks, where initial destructive deformation may temporarily enhance interparticle friction resistance, which is similar to the dilation effect.

4.2.2. Vertical Displacement Characteristics

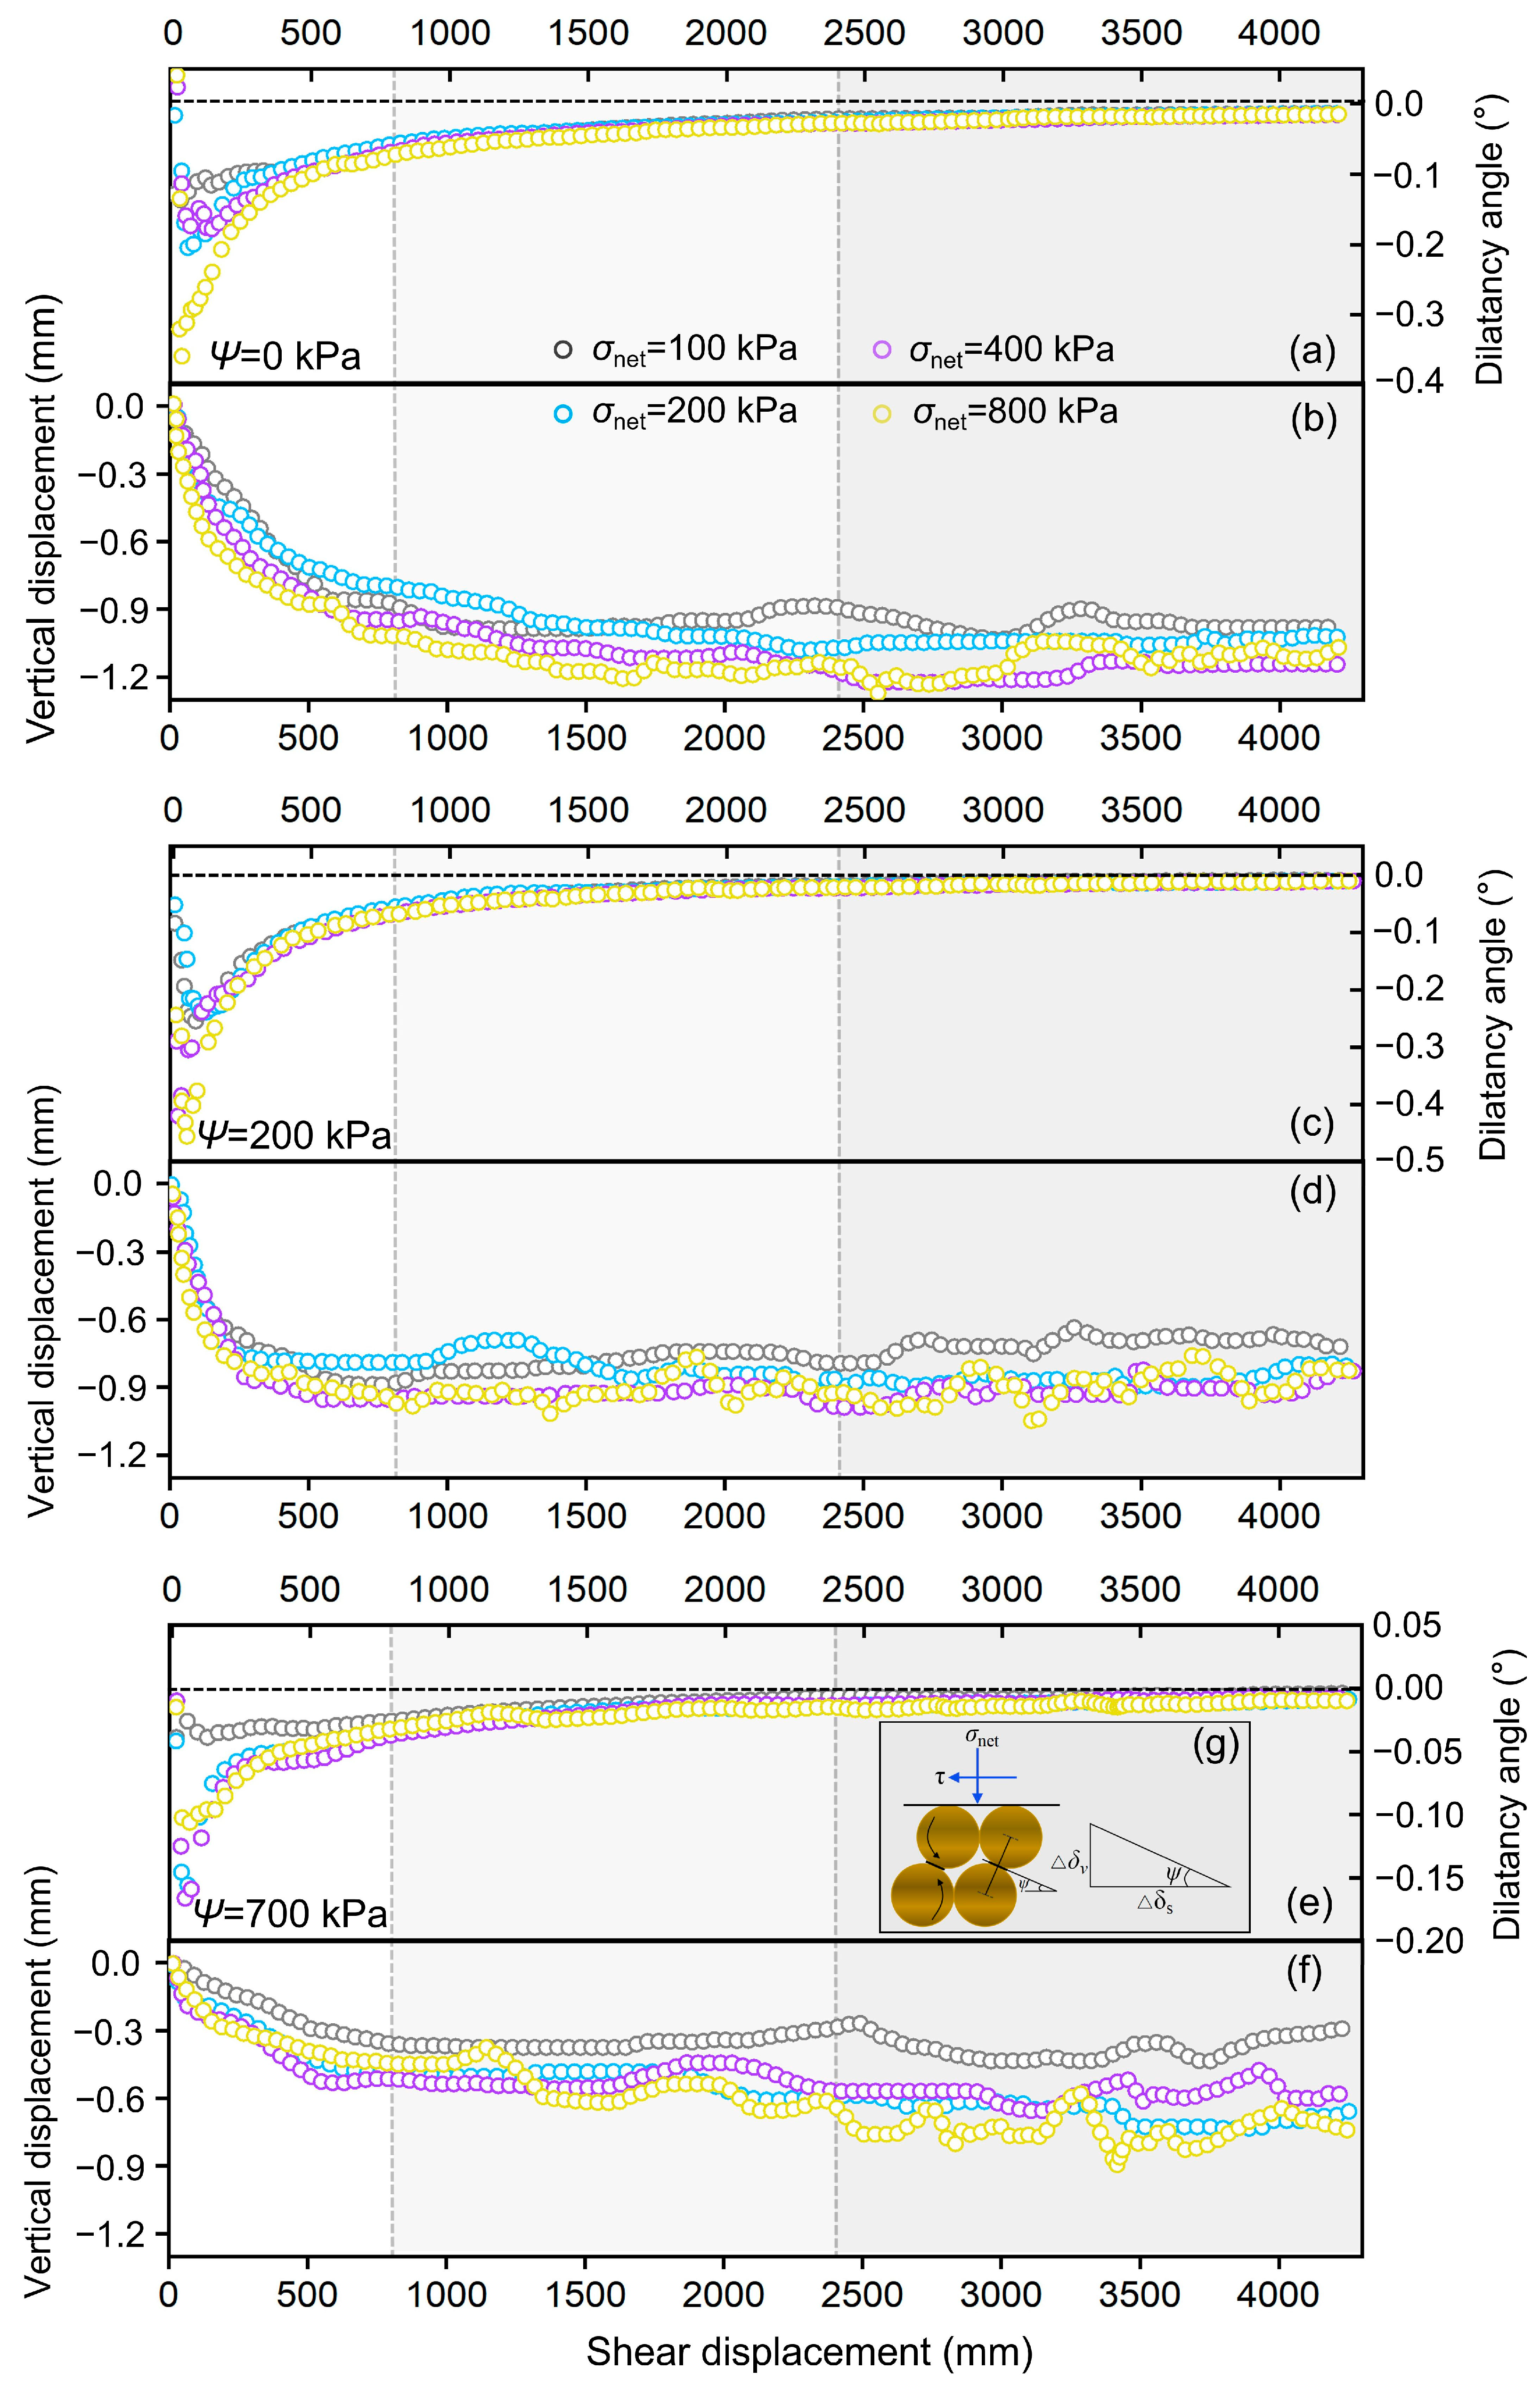
Figure 7 presents the vertical displacement–shear displacement curves of slip-zone soil under different suction conditions. All test groups exhibited continuous decay in vertical displacement with increasing shear displacement, consistently with the compression-dominated mechanical behavior during the residual strength stage [10,40,41]. Notably, the 0 kPa suction group reached a maximum vertical displacement of 1.27 mm, significantly higher than the 200 kPa (1.07 mm) and 700 kPa (0.89 mm) groups, validating the enhanced compressive resistance of soil with higher matric suction [6].
This validates that higher matric suction enhances the anti-compaction capability of soil by strengthening the soil skeleton structure. Simultaneously, it is observed that the larger σ n e t is, the greater the shear displacement required for the settlement curve to reach equilibrium is, indicating an increased difficulty in structural adjustment under high-stress states [17]. Furthermore, the dilation angle ( ψ ), defined as the ratio of volumetric strain rate to shear strain rate, is a key parameter for measuring soil’s dilation (volume expansion) and contraction (volume reduction) characteristics. It can be approximately determined by the ratio of the incremental vertical displacement ( δ v ) to the incremental tangential displacement ( δ s ) [42]. A schematic diagram of the dilation angle is shown in Figure 7g.
ψ = a r c t a n ( δ v δ s )
Figure 7a,c,e illustrate the variation in ψ with shear displacement. Except for the saturated group specimens, which exhibited a brief, small dilation (<0.1°) at the very start of the test, all samples initially showed significant contraction ( ψ < 0). As the shear displacement increased, the absolute value of ψ rapidly decreased, and after reaching the peak strength, the dilation angle gradually tended toward a stable negative or zero value.
The most critical finding is that even during the high-speed shearing stage, where the vertical displacement curve still showed continuous fluctuation and instability, the calculated ψ already tended toward a stable residual value. A stable ψ value indicates that soil’s structural rearrangement and mechanical equilibrium have been essentially achieved, whereas a continuously fluctuating settlement curve reflects that the hydraulic mechanism has not yet achieved stability.
This phenomenon strongly demonstrates that dynamic shear–PWP coupling is the dominant mechanism controlling settlement stability. To quantitatively analyze the soil’s intrinsic drainage potential, we estimated the characteristic drainage timescale for pore water pressure dissipation under ideal conditions, based on Terzaghi’s one-dimensional consolidation theory, which serves as a quantitative benchmark for the soil’s ideal drainage capacity. Specifically,
ψ = a r c t a n ( δ v δ s )
where T v is the dimensionless time factor (for an average consolidation degree U = 90% and T v = 0.848, representing a near-stable state); H d r is the drainage path length (for the specimen size and double-drainage condition used, the maximum drainage path length is half the specimen thickness; H d r = 10 mm); and C v is the coefficient of consolidation, calculated from experimental results as C v = 7.98 × 10⁻⁸ m2/s. From this, the characteristic drainage time to reach 90% consolidation is t 90 ≈ 1062.6 s (17.7 min), which can be taken as the quantitative benchmark.
This relatively short theoretical drainage time forms a significant contrast to the total experimental time required for the saturated group ( Ψ = 0 kPa) to achieve settlement equilibrium (1600 mm shear displacement, 1806 min shear time). This strong contrast indicates that the continuous, non-instantaneous loading inherent in ring shearing constantly and rapidly dynamically generates pore water pressure (PWP), where the generation rate entirely overwhelms the soil system’s ideal drainage capacity. This generation of and fluctuation in dynamic PWP is the fundamental reason for the persistent non-equilibrium of volumetric change (settlement) in the saturated group.
For the saturated group, shearing under high σ n e t generated greater PWP, requiring longer shear displacement to dissipate to equilibrium. For the unsaturated group, although larger σ n e t also increased the difficulty of structural adjustment, the matric suction reduced the reliance on the PWP dissipation process. Furthermore, the air phase connectivity in unsaturated soil enhanced the system’s apparent permeability, allowing PWP to dissipate much faster, resulting in shorter stabilization times for settlement.
During the low-speed shear stage ( γ ˙ ≤ 10 mm/min), vertical displacement decays rapidly, reflecting swift particle rearrangement and rapid dissipation of PWP, which produces steep initial settlement slopes. Low-speed shearing allows microstructural reorganization within smaller shear displacements (≤800 mm). For instance, the Huangtupo landslide slip-zone soil, with high clay content, experiences directional alignment of clay particles along the shear direction under low-speed conditions [43,44]. This rearrangement reduces pore volume, allowing sufficient time for pore water to drain through the ceramic plate, preventing volume expansion due to pressure accumulation and demonstrating that rapid drainage promotes soil densification [7]. In the medium-speed shear stage (10–50 mm/min), settlement exhibits progressive structural adjustment as pore water pressure gradually dissipates and interparticle effective stress increases, driving the soil into a dynamic equilibrium zone. During the high-speed shear stage ( γ ˙ > 50 mm/min), vertical displacement curves show pronounced fluctuations. In this stage, PWP is instantaneously generated due to rapid compression under shearing disturbance [44,45], where its generation rate exceeds the ideal dissipation rate. Water molecules are unable to drain in time, leading to the formation of localized excess PWP. This causes fluctuations in effective stress, ultimately resulting in the oscillation of the settlement curve and prolonging the time required for the soil to return to its initial hydraulic equilibrium.

4.3. Unsaturated Residual Shear Strength

4.3.1. Mohr–Coulomb Strength Envelope

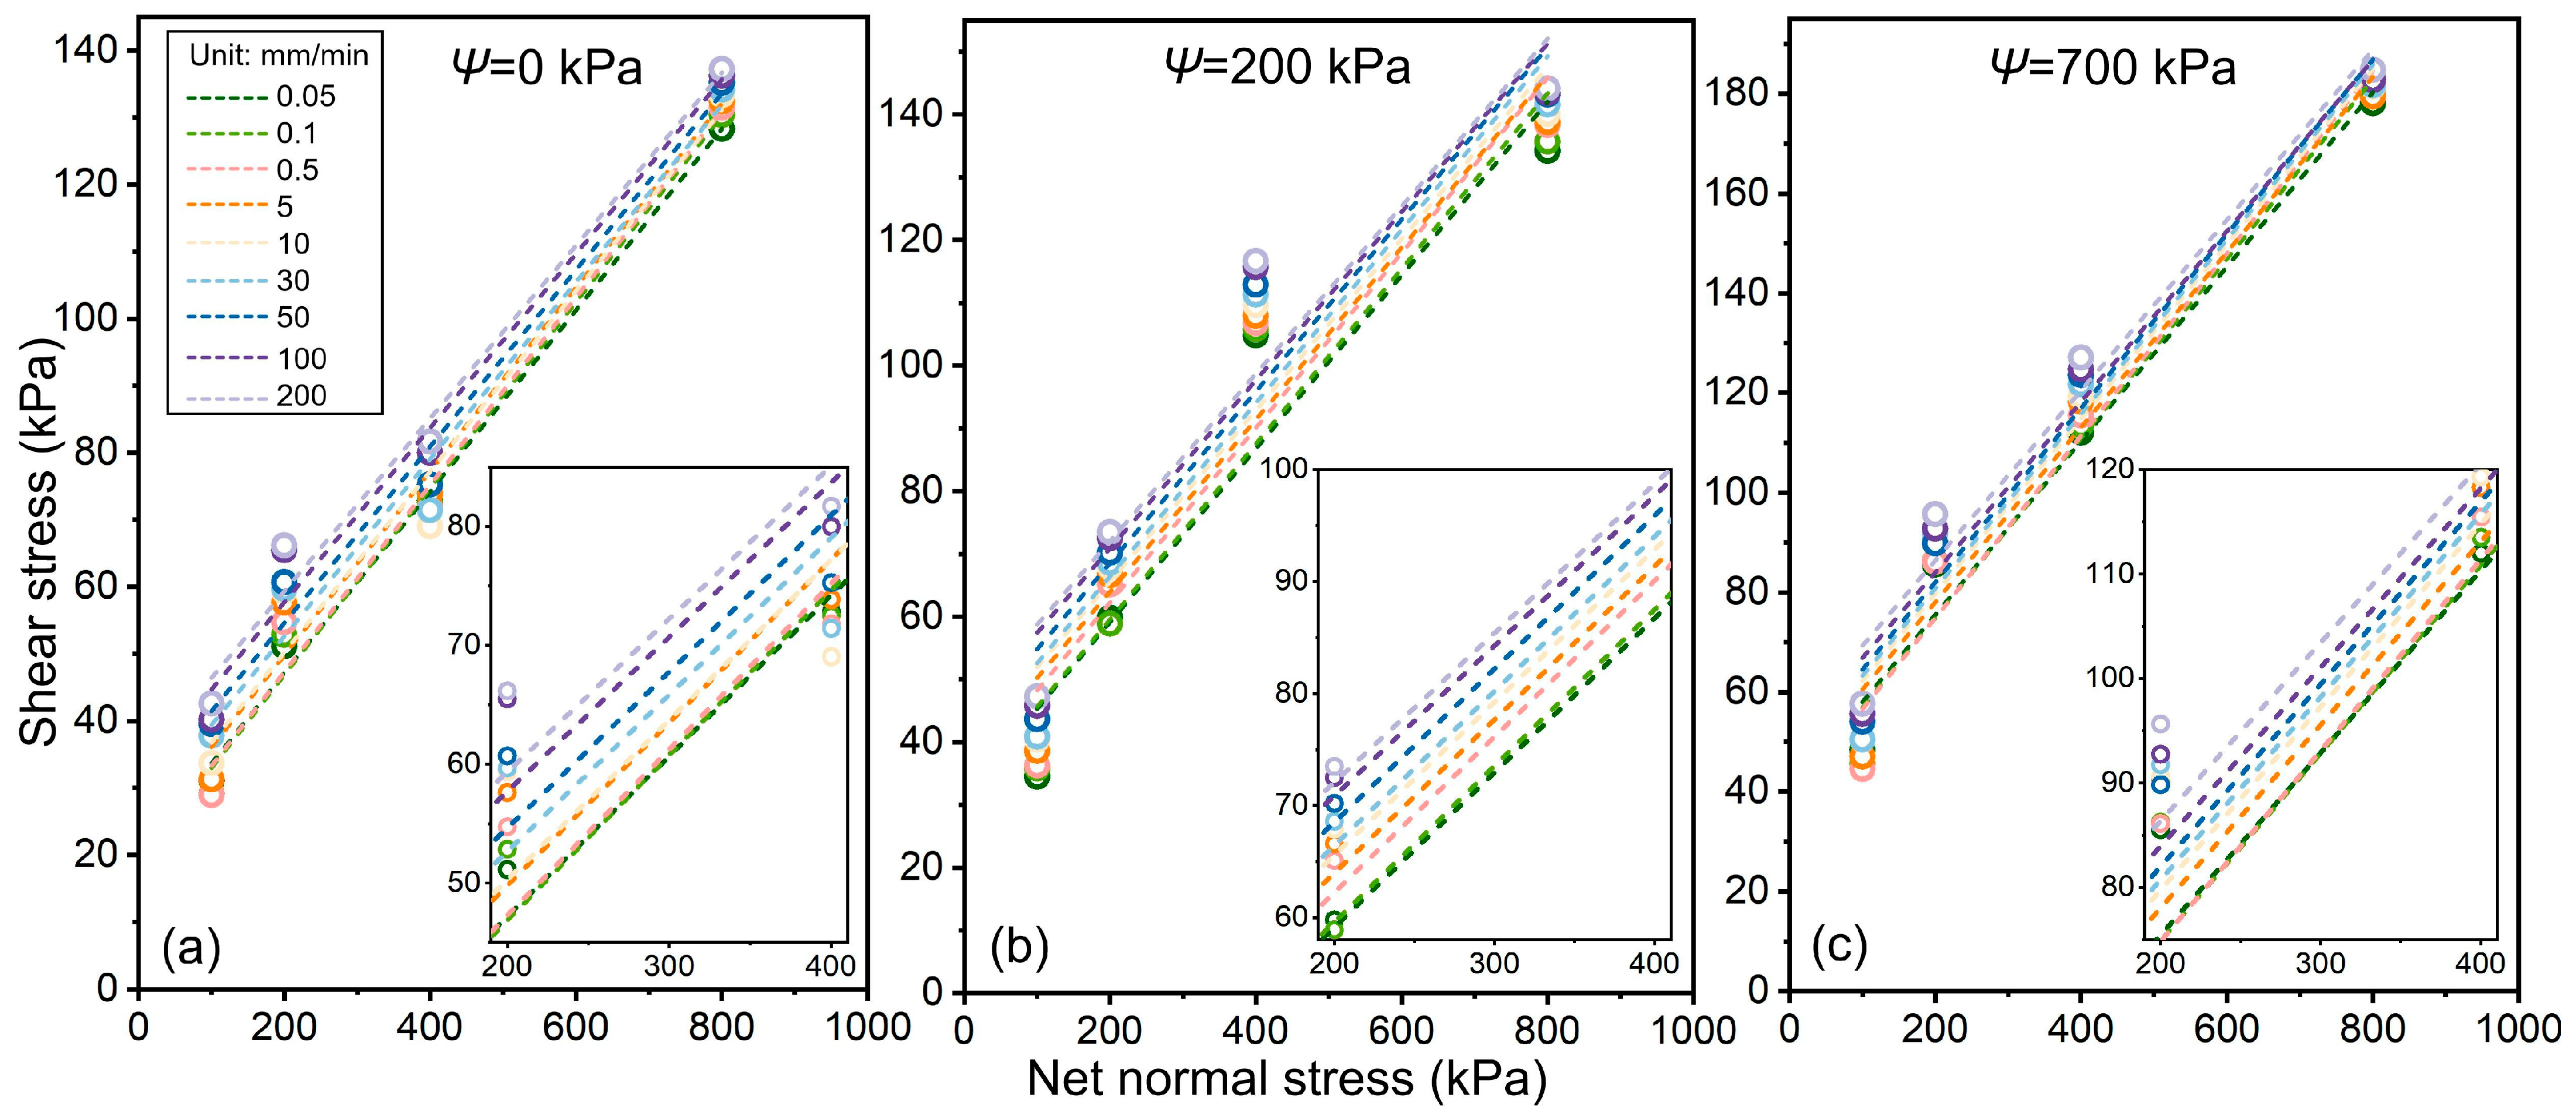
This study employed the dual-parameter Coulomb law to fit residual strength envelopes under different suction conditions using the least-squares method (Figure 8). The intercept of the strength envelope along the σ n e t axis represents the residual cohesion ( c r ), characterizing interparticle adhesion and structural connection strength, while the slope corresponds to t a n φ r , where φ r is the residual internal friction angle representing particle sliding friction resistance. Figure 8a–c present the residual strength envelopes for saturated ( Ψ = 0 kPa), medium-suction ( Ψ = 200 kPa), and high-suction ( Ψ = 700 kPa) conditions, respectively, with each group containing test results from nine shear rates ( γ ˙ = 0.05–200 mm/min). Furthermore, the residual shear strength generally shows a slight increase with increasing γ ˙ under different σ n e t conditions. However, the variation patterns of shear strength are not consistent across different σ n e t levels, which will be discussed in detail in the following section.
Table 4 presents the residual shear strengths under various γ ˙ and σ n e t combinations. The results demonstrate that the residual strength of slip-zone soil increased linearly with net normal stress ( σ n e t ), confirming the mechanism of effective stress-driven particle rearrangement [46]. Higher net normal stresses enhanced interparticle contact forces, promoting denser residual structures. Additionally, residual strength gradually increased with matric suction, with the high-suction group ( Ψ = 700 kPa) consistently exhibiting higher values than the medium-suction ( Ψ = 200 kPa) and saturated ( Ψ = 0 kPa) groups.
It is noteworthy that even during the high-speed shearing stage, although the vertical displacement (settlement) curve exhibits continuous fluctuation and instability, the calculated dilation angle tends towards stability, and the shear displacement corresponding to the residual strength is also relatively stable. The stable dilation angle indicates that the soil’s structural rearrangement was essentially complete, and the residual strength was determined; however, the continuously fluctuating settlement curve reflects that the hydraulic mechanism had not yet reached stability. This further confirms the point mentioned in Section 4.2.2: the dynamic shearing action leads to the continuous generation of and fluctuation in pore water pressure, which in turn causes volumetric (settlement) disequilibrium, rather than instability in the structural strength itself.
For unsaturated specimens, the effective stress was primarily governed by matric suction. In the residual strength stage, the soil completed large-displacement shearing and structural rearrangement, and the pore water pressure within the shear band tended towards stable dissipation. Although the water and air phase volumes were compressed during shear densification, momentarily generating transient excess pore water pressure ( Δ u w ) and excess pore air pressure ( Δ u a ), the presence of the air phase in unsaturated soil ensured that these transient pressures dissipated quickly. This rapid dissipation rendered their impact on the effective stress in the residual state negligible. Therefore, the subsequent discussion on shear strength parameters in this section primarily reflects the strength under a stable effective stress state.

4.3.2. Influence of Shear Rate on Residual Strength Parameters of Slip-Zone Soil

As shown in Figure 9 and Figure 10, the rate effects on the two residual strength parameters ( c r and φ r ) exhibited distinct suction dependency and stage characteristics with varying γ ˙ . On the normal scale (Figure 9a) and logarithmic scale (Figure 9b), φ r demonstrated different trends under varying suction conditions. Under saturated conditions ( Ψ = 0 kPa), φ r generally decreased with increasing γ ˙ , declining from 7.95° at 0.5 mm/min to 7.35° at 200 mm/min (a 0.6° reduction). Notably, this stage exhibited a critical transition of γ ˙ of 1.4 mm/min, where the rate-strengthening behavior began to weaken, consistently with findings from slow-moving landslide studies [8]. In contrast, under unsaturated conditions, φ r initially increased within the low-speed range (0.05–0.5 mm/min) before gradually decreasing with further rate increases. The magnitude of reduction differed between suction levels: 0.36° at 200 kPa suction and 0.68° at 700 kPa suction.
This overall decreasing trend primarily results from inertia-driven destructive deformation. During shearing, soil particles cannot quickly adjust their positions due to inertial forces, causing intense collisions and fragmentation [47]. The resulting fine particles fill pore spaces, reducing the effective contact area and weakening frictional resistance. The differing trends between saturated and unsaturated conditions stem from their distinct pore structures. In saturated soil, pores are completely filled with water, with stress transmitted through liquid water bridges. During shearing, significant pore water pressure buildup suppresses effective stress, causing φ r to decrease with increasing γ ˙ . In unsaturated soil, the coexistence of air and water phases enables matric suction to enhance particle connections through adsorbed water films and capillary action. At γ ˙ ≤ 0.5 mm/min, suction drives particle alignment, strengthening φ r with increasing rate. As γ ˙ increases further, inertial effects inhibit particle rearrangement, but suction maintains structural stability to varying degrees. Notably, specimens at 200 kPa suction showed smaller φ r fluctuations (0.36°) compared to those at 700 kPa suction. This is because 200 kPa corresponds to the secondary transition zone, where adsorbed water film thickness is optimal for stable capillary bridging between particles. At 700 kPa suction, the low saturation level disrupts the particle connection network, increasing φ r ’s sensitivity to γ ˙ variations.
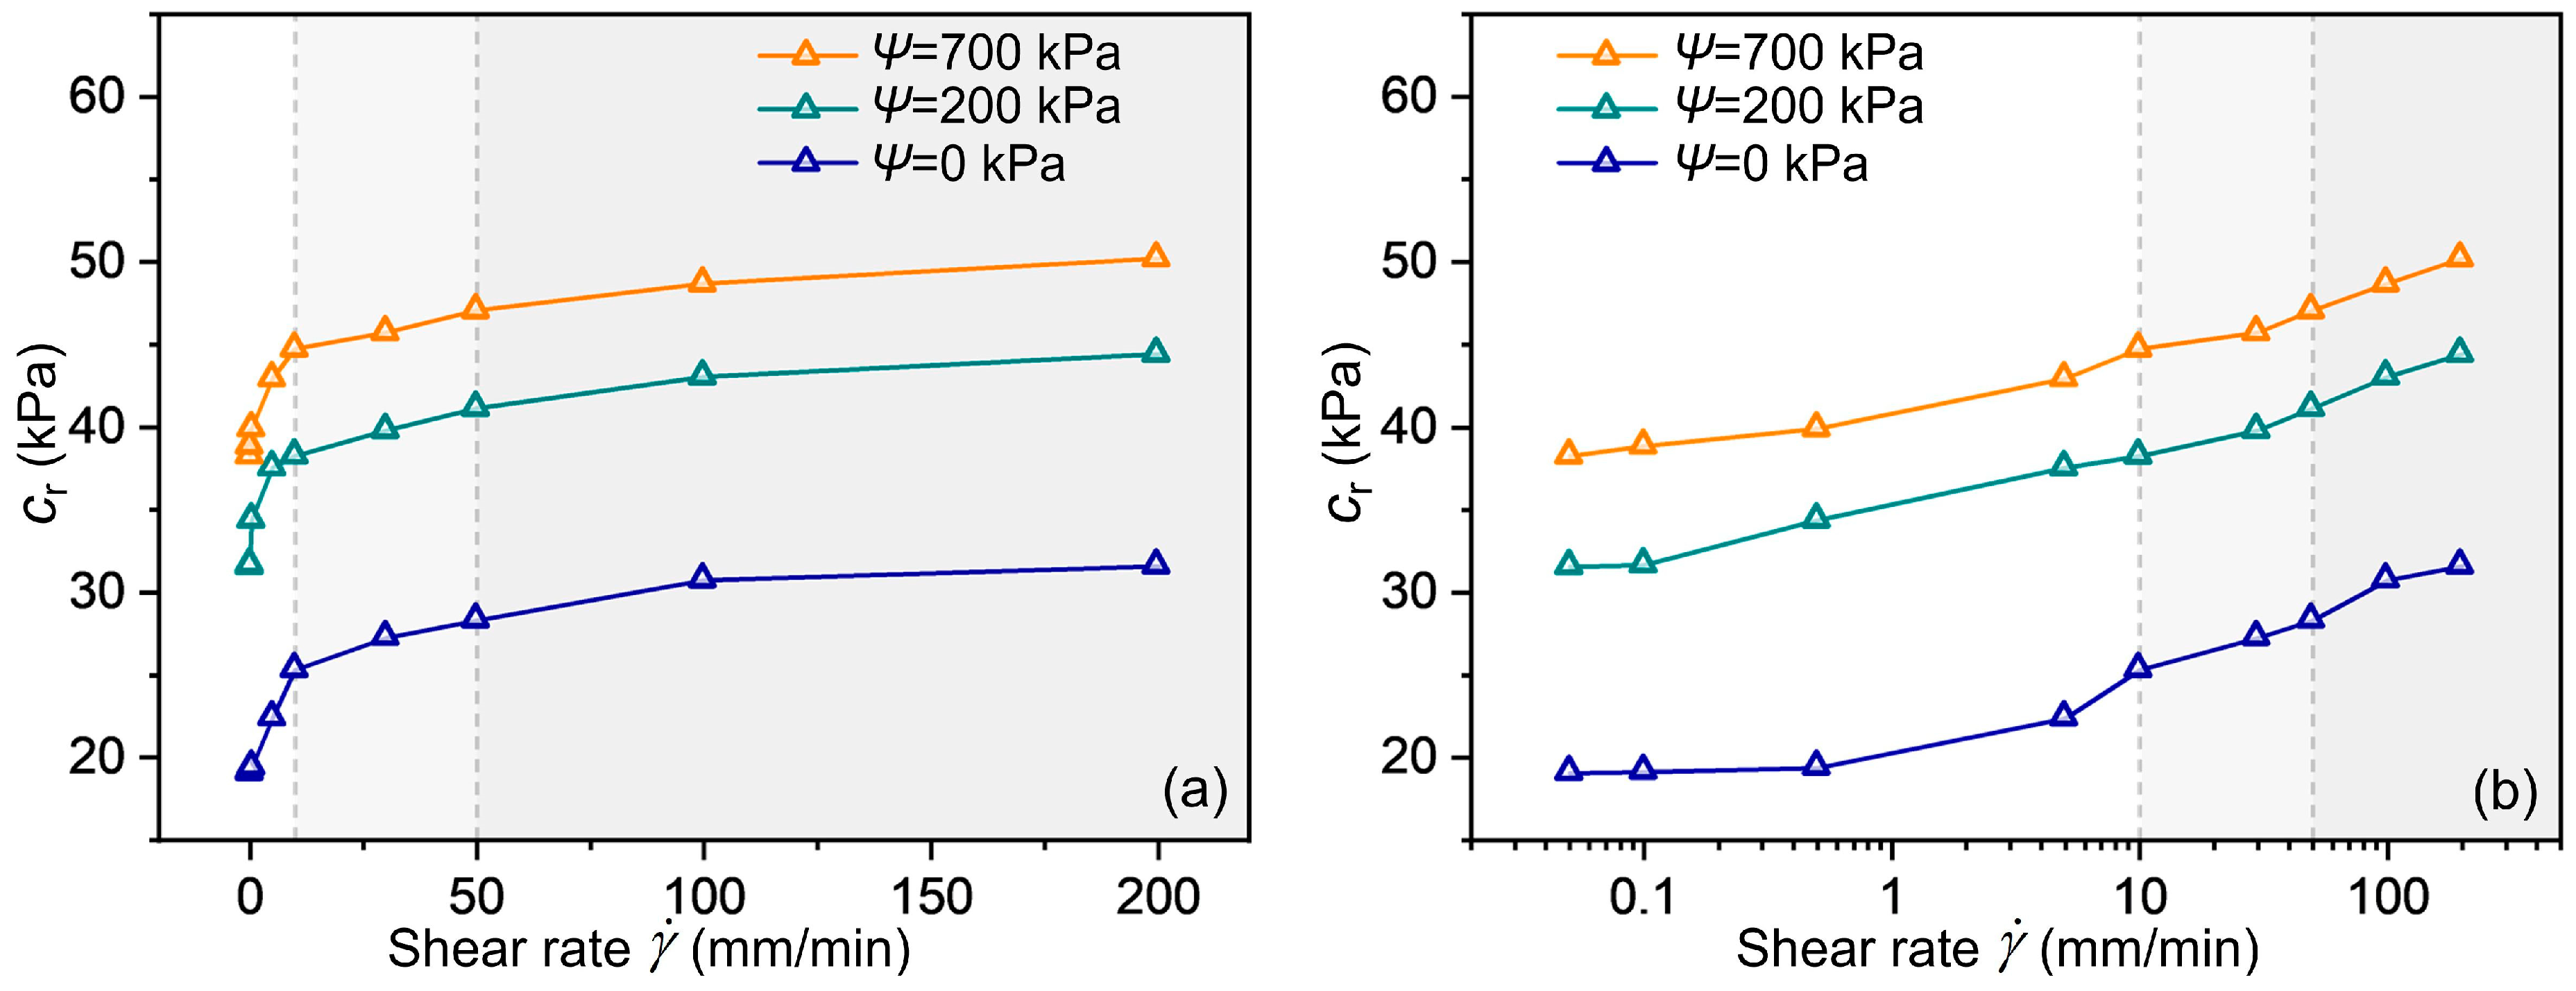
As shown in Figure 10, residual cohesion under all three matric suction conditions exhibited positive rate effects with distinct stage characteristics. In the low-speed shear stage ( γ ˙ ≤ 10 mm/min), residual cohesion increased rapidly: that of the high-suction group ( Ψ = 700 kPa) increased from 38.24 kPa to 44.73 kPa, that of the medium-suction group ( Ψ = 200 kPa) from 31.54 kPa to 38.25 kPa, and that of the low-suction group ( Ψ = 0 kPa) from 19.07 kPa to 25.32 kPa. This rapid increase occurred since low γ ˙ values provide sufficient time for pore water drainage, gradually enhancing effective stress. The increased effective stress collaborates with clay particles in the cohesive soil to achieve local rearrangement through particle sliding, rotation, and aggregate breakdown [48,49], forming a denser residual structure.
During the medium-speed shear stage ( γ ˙ of 10–50 mm/min), cohesion increased slightly with reduced growth rate: that of the high-suction group rose from 44.73 kPa to 47.07 kPa, that of the medium-suction group from 38.25 kPa to 41.13 kPa, and that of the low-suction group from 25.32 kPa to 28.31 kPa. During this stage, the dissipation rate of pore water pressure dynamically balances with its generation rate, inhibiting rapid cohesion growth [42,50]. Simultaneously, particle structure largely completes reorganization, limiting further strengthening.
In the high-speed shear stage ( γ ˙ > 50 mm/min), the cohesion of the high-suction group increased from 47.07 kPa to 50.23 kPa, that of the medium-suction group from 41.13 kPa to 44.43 kPa, and that of the low-suction group from 28.31 kPa to 31.57 kPa. During this stage, instantaneous pore water pressure elevation offsets effective stress enhancement, leading to cohesion plateauing [51]. Concurrently, particle inertia exceeds the adjustment capacity driven by effective stress, with inertia effects dominating to inhibit further densification [52].

4.3.3. Regression Model of Rate-Dependent Residual Strength Parameters

In practical landslide conditions, the strength of slip-zone soil is influenced by multiple factors, including cohesion, internal friction angle, pore water pressure, sliding rate, and water content. Given that the maximum variation in φ r is only 0.68° with γ ˙ and the corresponding change in t a n φ r is minimal, its contribution to overall strength is limited. This study therefore employs residual cohesion ( c r ) as a single indicator for efficient representation and analysis of residual strength, establishing the quantitative relationship between γ ˙ and shear strength parameters.
As shown in Figure 10, a strong linear correlation exists between c r and γ ˙ in logarithmic coordinates, indicating that c r follows a logarithmic relationship with γ ˙ :
c r = A l n γ ˙ + B
where A and B are fitting parameters.
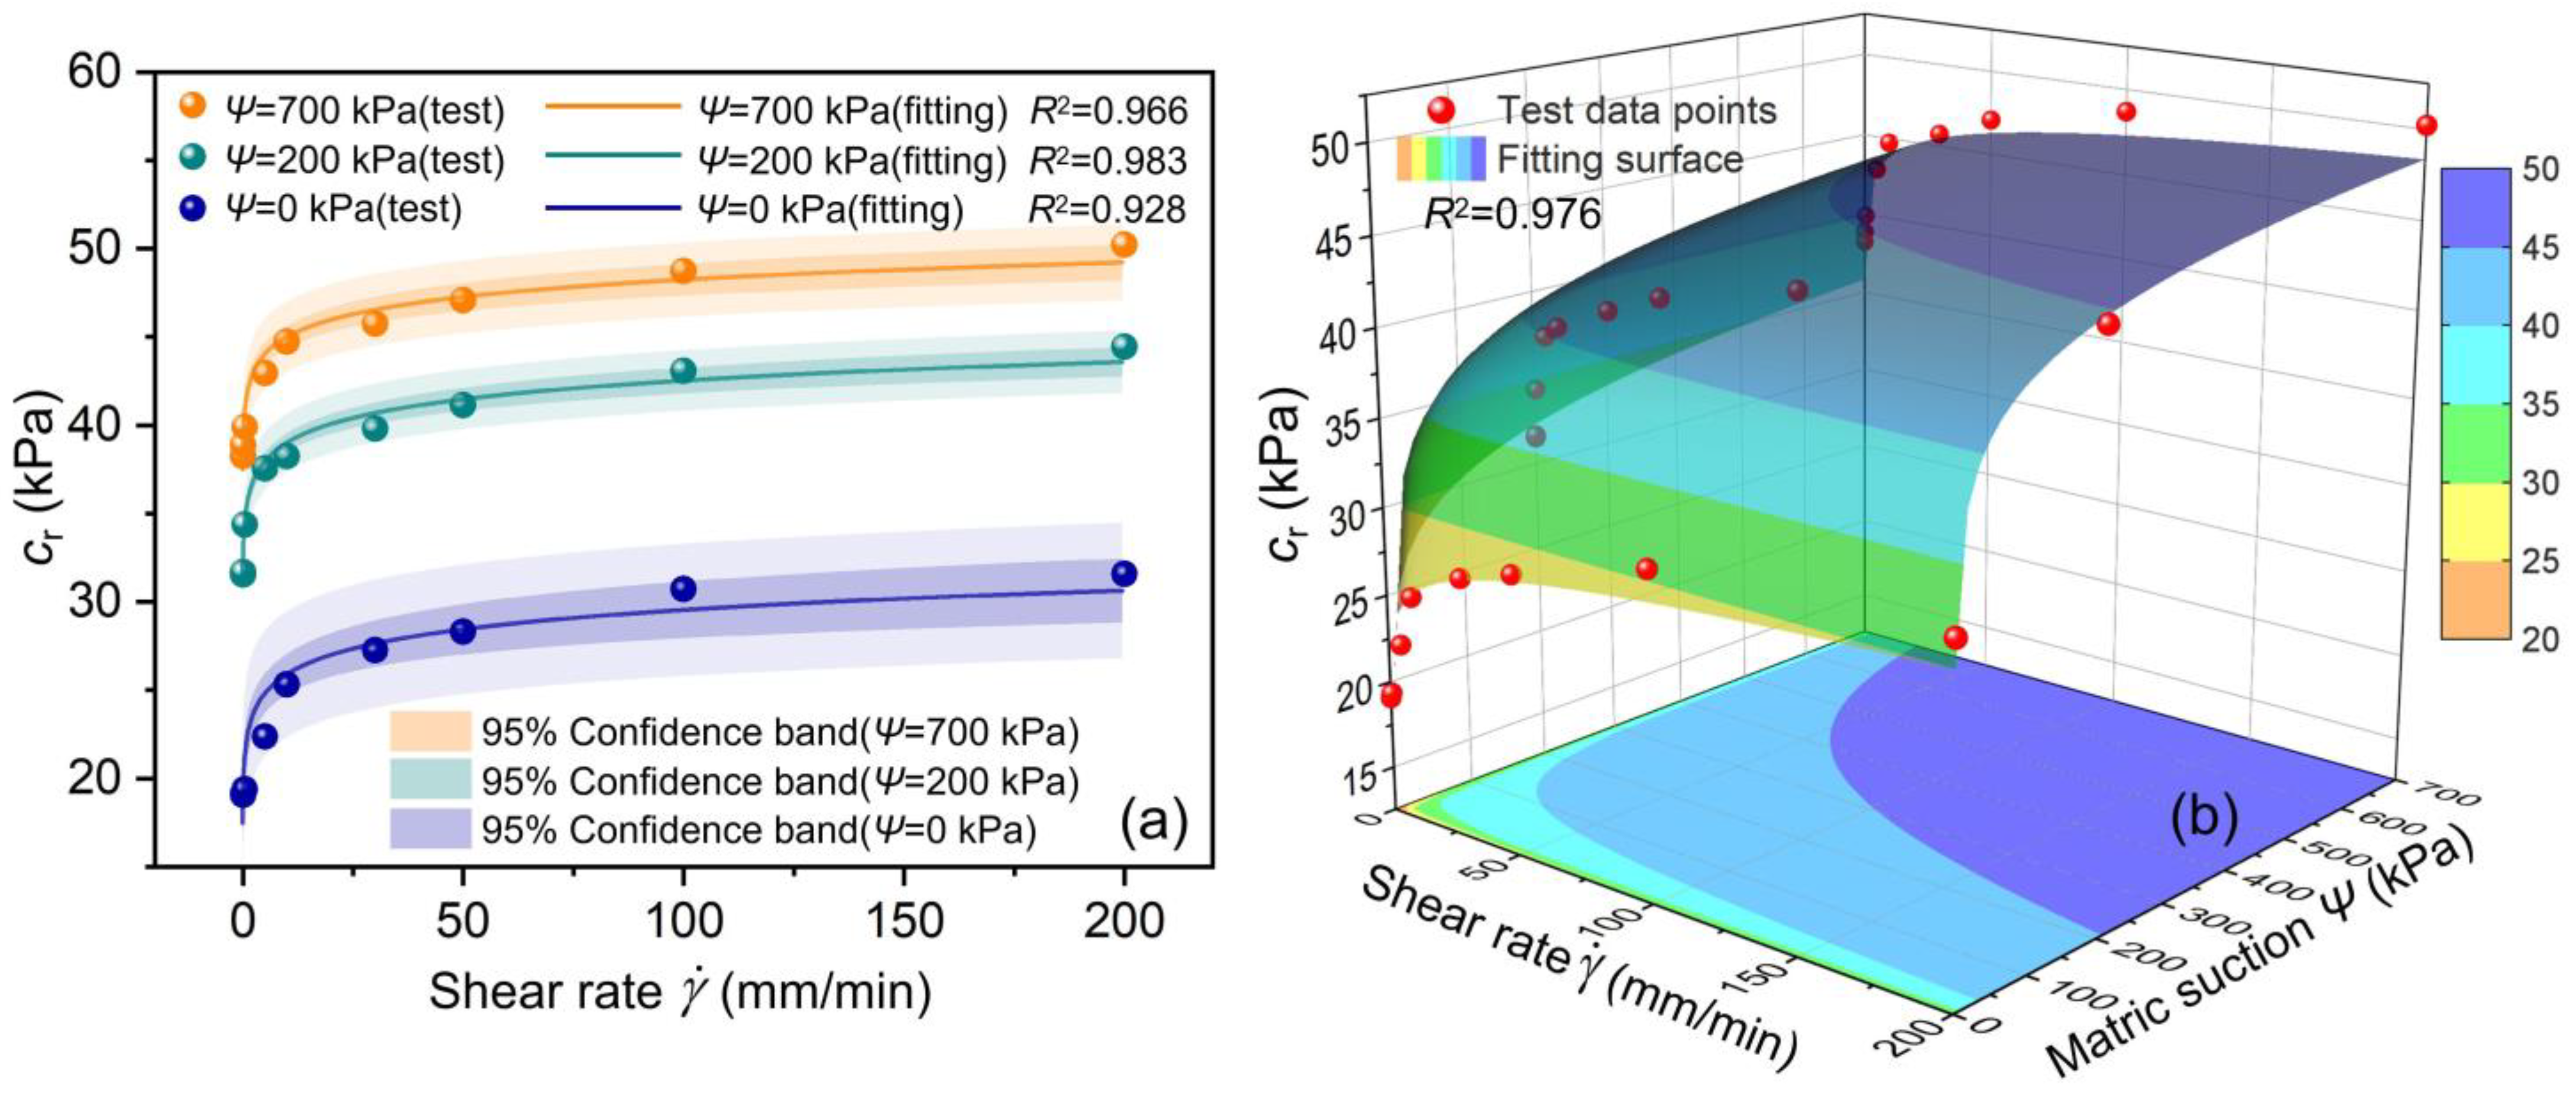
Applying Equation (2) to c r under different suction conditions yields excellent fits (Figure 11a), with fitting parameters detailed in Table 5. The coefficient of determination (R2) exceeds 0.92 for all matric suction conditions, confirming the model’s effectiveness in describing the relationship between residual cohesion and γ ˙ . This result reveals the shear-thinning behavior of slip-zone soil: as γ ˙ increases, the breakdown of adsorbed water films and particle rearrangement lead to decreased viscosity, consistent with the shear-thinning characteristics predicted by the Herschel–Bulkley model [53,54].
To systematically analyze the coupled effects of Ψ and γ ˙ on c r , a bivariate regression model was established:
c r = C l n Ψ + 1 + D l n γ ˙ + E l n Ψ + 1 + F
where C , D , E , and F are fitting parameters, and C = 9 × 10⁻⁵, D = 1.512, E = 2.805, and F = 21.976. The units of all parameters in Equations (2) and (3) are kPa ( c r and Ψ ) and mm/min ( γ ˙ ).
Figure 11b illustrates the fitted 3D surface (R2 = 0.976), demonstrating excellent agreement with experimental data and validating the model’s ability to capture multi-field coupling mechanisms in residual strength. As illustrated, the surface monotonically increases along the Ψ -axis (0–700 kPa), reflecting enhanced soil skeleton stiffness under higher suction, which strengthens c r . Along the γ ˙ -axis (0.05–200 mm/min), c r exhibits nonlinear growth. At low rates ( γ ˙ ≤ 10 mm/min), pronounced positive rate effects dominate, while at high rates ( γ ˙ > 50 mm/min), the growth rate stabilizes, consistently with experimental trends. Notably, the surface slope significantly decreases for Ψ > 200 kPa (Figure 11b’s blue region), indicating densified soil structure under dry conditions where γ ˙ ’s modulation of c r weakens. Conversely, the steepest curvature occurs at Ψ < 200 kPa and γ ˙ ≤ 10 mm/min, corresponding to the rapid response in the low-speed shear phase (Section 4.2.2). Here, minor parameter perturbations trigger significant strength changes due to plastic flow dominance.
To quantitatively validate this nonlinear change trend, a parameter sensitivity analysis of Equation (5) using the elasticity-sensitivity coefficient ( E c r , x = c r x x c r ) [55]. We selected a constant suction of Ψ = 200 kPa as the benchmark to compare performance differences between the low-speed region ( γ ˙ = 1 mm/min) and the medium-speed region ( γ ˙ = 40 mm/min).
The calculation results show that in the low-speed region ( γ ˙ = 1 mm/min), E c r , γ ˙ = 0.041 and E c r , Ψ = 0.076, while in the medium-speed region ( γ ˙ = 40 mm/min), E c r , γ ˙ = 0.036 and E c r , Ψ = 0.066. It can be observed that as γ ˙ increases from the low-speed to the medium-speed region, the elasticity coefficient with respect to shear rate ( E c r , γ ˙ ) quantitatively decreases from 0.041 to 0.036. This precisely maps the decreasing trend of the surface slope shown in Figure 11b, thus mathematically verifying the trend that the rate-increase effect weakens as γ ˙ increases. Furthermore, in both the low-speed and medium-speed regions, E c r , γ ˙ is less than E c r , Ψ , indicating that although the change in γ ˙ results in high sensitivity to c r , the sensitivity to Ψ is consistently the dominant factor.
This model elucidates dual-regime control mechanisms observed in Section 4.3.1: in the low-suction regime, γ ˙ governs c r , with marked enhancements driven by pore pressure dissipation in saturated soils, while in the high-suction regime, matric suction dominates, suppressing rate sensitivity in unsaturated soils with structurally reinforced frameworks. This integration of Ψ into the model bridges mechanistic insights across moisture states, offering a robust framework for predicting residual strength evolution under dynamic hydrological conditions.

5. Discussion

Unlike conventional studies, this study employs a dual-parameter Coulomb model instead of the single-parameter Amontons model to investigate the relationship between shear strength parameters and shear rate under varying suction conditions. The Coulomb model, by incorporating both adhesive force and load-dependent terms, enables independent quantification of adhesive and frictional contributions. For instance, under low normal stress, the residual strength of slip-zone soil is primarily governed by adhesion, while frictional forces become more significant under high normal stress [56]. This stage-dependent contribution aligns well with the dual-parameter structure of the Coulomb model.
Experimental results demonstrate that c r and φ r exhibit distinct nonlinear rate-dependent behaviors as γ ˙ increases. Crucially, matric suction significantly enhances adhesive force through increased effective stress and particle contact strength. For example, at 700 kPa suction, c r increases by approximately 30% compared to that under saturated conditions, a phenomenon unexplainable by the Amontons model [25]. Through decoupling adhesive and frictional components, the dual-parameter Coulomb model provides a more accurate description of residual strength evolution in cohesive slip-zone soils under complex stress paths, offering a theoretical basis for predicting long-term landslide deformation.
In the shear strength formula ( τ = σ n · t a n φ + c ), despite differing trends in c and φ , overall shear strength shows positive rate dependence. This phenomenon can be explained by two key observations: (1) Cohesion ( c ) increases nonlinearly with shear rate, particularly rapidly in the low-speed range ( γ ˙ ≤ 10 mm/min), due to particle rearrangement and enhanced adsorbed water films. The absolute increase in cohesion (from 38.24 kPa to 50.23 kPa, Δ c r ≈ 12 kPa) significantly outweighs the contribution from friction angle variations. (2) φ r varies by less than 1.0° across shear rates (Figure 9), with minimal changes in t a n φ r (e.g., 0.012 for Ψ = 700 kPa, corresponding to only a 9.6 kPa strength increment at 800 kPa normal stress). This confirms that cohesion’s rate sensitivity dominates overall strength behavior, supporting the feasibility of establishing relationships between φ r and shear rate/suction, as described in Section 4.3.3.
The core of the bivariate mathematical model established in this study lies in the sensitivity of the c r to both Ψ and γ ˙ . This focus stems from the characteristic that the investigated slip-zone soil is dominated by the high-plasticity clay matrix, where cohesion primarily governs residual strength. Consequently, this model offers high reference value for cohesive-dominant slip-zone soils and can be extended to other fine-grained landslide-prone areas, such as paleo-landslide regions on the eastern margin of the Qinghai–Tibet Plateau [56] and reservoir landslide areas in the lower Jinsha River [57]. However, the model’s applicability is limited for soils where φ r is the dominant factor, such as steep mountainous regions formed by glacial erosion in the European Alps [58] or silty soils in the Loess Plateau of Northwest China [59]. Further studies are required to investigate the rate- and suction-dependency of φ r in sand- or silt-dominant slip-zone soils.
The experimental apparatus employs a ceramic disk with a 15-Bar air-entry value, allowing gradual pore water drainage but limiting drainage rate due to low permeability [16,17]. During rapid shearing (50–200 mm/min), internal pore water flow becomes restricted, causing transient pore pressure increases (Figure 6c). Although the ceramic disk gradually restores equilibrium through slow drainage, the system lacks direct pore pressure measurement capability—the “water flow monitoring unit” in Figure 3a only records drainage volume without quantifying pore pressure values. Consequently, the discussions in this paper regarding transient pore water pressure are necessarily inferences drawn from the soil’s macroscopic shear behavior, settlement curves, and established theory. Future studies should incorporate miniature piezometers or modify the experimental design to directly monitor pore pressure changes during shearing.
It is noted that this study utilized reconstituted samples comprising oven-dried and sieved material (<2 mm). While this approach effectively revealed the intrinsic mechanical behavior of the clay matrix, it inherently failed to capture the influence of coarse gravel-clay interaction prevalent in natural slip-zone soils (such as particle interlocking and drainage through macro-pores) on macroscopic strength. The strength mechanism for slip-zone soils containing a high volume of coarse particles may thus differ. This constitutes another limitation of the present research.
While this research investigated the effects of suction and normal stress on shear strength across a 0.05–200 mm/min shear rate range, certain limitations exist in the experimental design. Future improvements should carry out the following: (1) It should shift focus toward integrating direct pore water pressure (PWP) sensing and the transient dilation angle ( ψ ) evolution into coupled viscoplastic models. This is crucial for accurately capturing the PWP generation rate and its influence during a landslide’s initiation and acceleration phases [60,61]. (2) It should increase the shear rate resolution in the low-speed range ( γ ˙ ≤ 10 mm/min) to better capture the specific kinetics of particle rearrangement and the transition points where c r sensitivity is highest. (3) To enhance the accuracy and reliability of landslide stability assessments, it is necessary to integrate microscopic structure characterization (e.g., SEM observations [62]) with macroscopic mechanical testing. This will help develop cross-scale models of suction–rate–stress interactions, providing a more comprehensive understanding of the governing mechanisms. Finally, the above research findings are applied to evaluate the spatiotemporal stability and risk of landslides under varying hydrological conditions [63,64].

6. Conclusions

This study investigated the rate-dependent residual strength of unsaturated cohesive slip-zone soil through suction-controlled ring shear tests, leading to three primary conclusions:
(1)
Residual strength showed a significant increase with matric suction, with the 700 kPa condition showing higher strength than saturated conditions. Concurrently, residual strength exhibited a positive rate effect and the growth slowed at high rates ( γ ˙ > 50 mm/min). Crucially, residual cohesion demonstrated a significant logarithmic correlation with γ ˙ , with most rapid growth occurring at slow rates ( γ ˙ ≤ 10 mm/min), serving as the dominant factor controlling residual strength, as the residual internal friction angle varied minimally.
(2)
The effect of shear rate exhibited three distinct stages: In the low-rate region ( γ ˙ < 10 mm/min), stress decayed rapidly with early formation of a residual strength plateau, reflecting plastic flow from rapid pore water pressure dissipation and particle rearrangement. In the moderate-rate region (10–50 mm/min), larger displacement was required to achieve stability, indicating combined effects of particle orientation and pore water pressure equilibrium. In the high-speed region ( γ ˙ > 50 mm/min), stress–strain curves showed increased fluctuations due to the excitation–recovery cycle of instantaneous pore water pressure elevation and subsequent dissipation.
(3)
A robust bivariate mathematical model for residual cohesion with respect to shear rate and matric suction was established (R2 = 0.976), overcoming limitations of single-factor analysis. This model quantitatively demonstrated that the relative sensitivity of cohesion was position-dependent, precisely validating the nonlinear slope changes observed on the 3D surface. It revealed that shear rate modulation of cohesion weakened in high-suction regions ( Ψ > 200 kPa), while low-suction regions ( Ψ < 200 kPa) were more sensitive to rate changes.
This study deepens understanding of landslide evolution mechanisms by revealing the suction–rate–strength coupling in unsaturated slip-zone soil. Future work is required to focus on integrating direct PWP sensing and transient dilatancy into coupled viscoplastic models for accurate prediction of short-term, acceleration-induced instability.

Author Contributions

Conceptualization, S.Z.; methodology, J.Y., J.Z., and S.Z.; software, R.Z.; validation, Y.M., L.X., and C.Z.; formal analysis, J.Y., R.Z., and J.Z.; investigation, R.Z. and J.Z.; resources, J.Y., Y.M., and S.Z.; data curation, R.Z. and J.Z.; writing—original draft preparation, J.Y. and J.Z.; writing—review and editing, S.Z.; visualization, R.Z.; supervision, S.Z.; project administration, Y.M., L.X., and C.Z.; funding acquisition, J.Y., and S.Z. All authors have read and agreed to the published version of the manuscript.

Funding

This work was supported by the Open Research Fund of Hubei Technology Innovation Center for Smart Hydropower (SDCXZX-JJ-2023-10) and National Natural Science Foundation of China (Nos. 42577208, U2340230, and 42377182).

Data Availability Statement

The original contributions presented in this study are included in the article. Further inquiries can be directed to the corresponding author.

Acknowledgments

During the preparation of this study, the authors used Qwen 3 and Gemini 2.5 for the purposes of polishing the English writing. The authors have reviewed and edited the output and take full responsibility for the content of this publication.

Conflicts of Interest

Authors Jin Yuan, Yanpian Mao, Lanlan Xu, and Chao Zhang were employed by China Yangtze Power Co., Ltd. The remaining authors declare that the research was conducted in the absence of any commercial or financial relationships that could be construed as a potential conflict of interest.

References

  1. Skempton, A.W. Residual Strength of Clays in Landslides, Folded Strata and the Laboratory. Géotechnique 1985, 35, 3–18. [Google Scholar] [CrossRef]
  2. Bromhead, E.N. Reflections on the Residual Strength of Clay Soils, with Special Reference to Bedding-Controlled Landslides. Q. J. Eng. Geol. Hydrogeol. 2013, 46, 132–155. [Google Scholar] [CrossRef]
  3. Wang, G.; Suemine, A.; Schulz, W.H. Shear-Rate-Dependent Strength Control on the Dynamics of Rainfall-Triggered Landslides, Tokushima Prefecture, Japan. Earth Surf. Process. Landf. 2010, 35, 407–416. [Google Scholar] [CrossRef]
  4. Huang, M.L.; Sun, D.A.; Wang, C.H.; Keleta, Y. Reliability Analysis of Unsaturated Soil Slope Stability Using Spatial Random Field-Based Bayesian Method. Landslides 2021, 18, 1177–1189. [Google Scholar] [CrossRef]
  5. Tang, H.; Li, C.; Hu, X.; Wang, L.; Criss, R.; Su, A.; Wu, Y.; Xiong, C. Deformation Response of the Huangtupo Landslide to Rainfall and the Changing Levels of the Three Gorges Reservoir. Bull. Eng. Geol. Environ. 2015, 74, 933–942. [Google Scholar] [CrossRef]
  6. Fredlund, D.G. Unsaturated Soil Mechanics in Engineering Practice. J. Geotech. Geoenviron. Eng. 2006, 132, 286–321. [Google Scholar] [CrossRef]
  7. Kang, X.; Wang, S.; Yu, Z. Effects of Soil–Water Interaction on the Mechanical Behaviors of Shear-Zone Soils. Int. J. Geomech. 2022, 22, 06022028. [Google Scholar] [CrossRef]
  8. Cueva, M.; Kang, X.; Wang, S.; Soranzo, E.; Wu, W. Unveiling the Role of Saturation and Displacement Rate in the Transition from Slow Movement to Catastrophic Failure in Landslides. Eng. Geol. 2025, 352, 108042. [Google Scholar] [CrossRef]
  9. Hu, W.; Scaringi, G.; Xu, Q.; Van Asch, T.W.J.; Huang, R.; Han, W. Suction and Rate-Dependent Behaviour of a Shear-Zone Soil from a Landslide in a Gently-Inclined Mudstone-Sandstone Sequence in the Sichuan Basin, China. Eng. Geol. 2018, 237, 1–11. [Google Scholar] [CrossRef]
  10. Wang, S.; Wu, W.; Wang, J.; Yin, Z.; Cui, D.; Xiang, W. Residual-State Creep of Clastic Soil in a Reactivated Slow-Moving Landslide in the Three Gorges Reservoir Region, China. Landslides 2018, 15, 2413–2422. [Google Scholar] [CrossRef]
  11. Kang, X.; Wang, S.; Wu, W.; Xu, G. Residual State Rate Effects of Shear-Zone Soil Regulating Slow-to-Fast Transition of Catastrophic Landslides. Eng. Geol. 2022, 304, 106692. [Google Scholar] [CrossRef]
  12. Gratchev, I.B.; Sassa, K. Shear Strength of Clay at Different Shear Rates. J. Geotech. Geoenviron. Eng. 2015, 141, 06015002. [Google Scholar] [CrossRef]
  13. Scaringi, G.; Di Maio, C. Influence of Displacement Rate on Residual Shear Strength of Clays. Procedia Earth Planet. Sci. 2016, 16, 137–145. [Google Scholar] [CrossRef]
  14. Duque, J.; Loche, M.; Scaringi, G. Rate-Dependency of Residual Shear Strength of Soils: Implications for Landslide Evolution. Géotech. Lett. 2023, 13, 1–8. [Google Scholar] [CrossRef]
  15. Bishop, A.W.; Green, G.E.; Garga, V.K.; Andresen, A.; Brown, J.D. A New Ring Shear Apparatus and Its Application to the Measurement of Residual Strength. Géotechnique 1971, 21, 273–328. [Google Scholar] [CrossRef]
  16. Stark, T.D.; Vettel, J.J. Bromhead Ring Shear Test Procedure. Geotech. Test. J. 1992, 15, 24–32. [Google Scholar] [CrossRef]
  17. Yang, X.; Vanapalli, S.K. Mechanical Behavior of Unsaturated Soils from Suction Controlled Ring Shear Tests. Eng. Geol. 2024, 107695. [Google Scholar] [CrossRef]
  18. Scaringi, G.; Hu, W.; Xu, Q.; Huang, R. Shear-Rate-Dependent Behavior of Clayey Bimaterial Interfaces at Landslide Stress Levels. Geophys. Res. Lett. 2018, 45, 766–777. [Google Scholar] [CrossRef]
  19. Tika, T.E.; Vaughan, P.R.; Lemos, L.J.L.J. Fast Shearing of Pre-Existing Shear Zones in Soil. Géotechnique 1996, 46, 197–233. [Google Scholar] [CrossRef]
  20. Miao, H.; Wang, G. Shear Rate Effect on the Residual Strength of Saturated Clayey and Granular Soils under Low- to High-Rate Continuous Shearing. Eng. Geol. 2022, 308, 106821. [Google Scholar] [CrossRef]
  21. Xin, P.; Kang, X.; Wu, W.; Scaringi, G.; Wang, X.; Wu, Q. Centrifuge Modelling of a Roto-Translational Landslide in Stiff Clay Formation. Eng. Geol. 2025, 349, 107964. [Google Scholar] [CrossRef]
  22. Hu, W.; Xu, Q.; Wang, G.; Scaringi, G.; Mcsaveney, M.; Hicher, P.-Y. Shear Resistance Variations in Experimentally Sheared Mudstone Granules: A Possible Shear-Thinning and Thixotropic Mechanism. Geophys. Res. Lett. 2017, 44, 11–40. [Google Scholar] [CrossRef]
  23. Wang, Y.F.; Dong, J.J.; Cheng, Q.G. Velocity-Dependent Frictional Weakening of Large Rock Avalanche Basal Facies: Implications for Rock Avalanche Hypermobility? J. Geophys. Res. Solid Earth 2017, 122, 1648–1676. [Google Scholar] [CrossRef]
  24. Vithana, S.B.; Nakamura, S.; Gibo, S.; Yoshinaga, A.; Kimura, S. Correlation of Large Displacement Drained Shear Strength of Landslide Soils Measured by Direct Shear and Ring Shear Devices. Landslides 2012, 9, 305–314. [Google Scholar] [CrossRef]
  25. Kalin, M.; Jan, P. Understanding the Friction Laws of Amontons and Coulomb by Evaluating the Real Contact Area. Friction 2025, 13, 9440986. [Google Scholar] [CrossRef]
  26. Tang, M.; Xu, Q.; Yang, H.; Li, S.; Iqbal, J.; Fu, X.; Huang, X.; Cheng, W. Activity Law and Hydraulics Mechanism of Landslides with Different Sliding Surface and Permeability in the Three Gorges Reservoir Area, China. Eng. Geol. 2019, 260, 105212. [Google Scholar] [CrossRef]
  27. Gong, W.; Juang, C.H.; Wasowski, J. Geohazards and Human Settlements: Lessons Learned from Multiple Relocation Events in Badong, China—Engineering Geologist’s Perspective. Eng. Geol. 2021, 285, 106051. [Google Scholar] [CrossRef]
  28. Wang, J.; Su, A.; Liu, Q.; Xiang, W.; Yeh, H.-F.; Xiong, C.; Zou, Z.; Zhong, C.; Liu, J.; Cao, S. Three-Dimensional Analyses of the Sliding Surface Distribution in the Huangtupo No. 1 Riverside Sliding Mass in the Three Gorges Reservoir Area of China. Landslides 2018, 15, 1425–1435. [Google Scholar] [CrossRef]
  29. International Union of Geological Sciences Working Group on Landslides. A Suggested Method for Describing the Rate of Movement of a Landslide. Bull. Int. Assoc. Eng. Geol. 1995, 52, 75–78. [Google Scholar] [CrossRef]
  30. Zou, Z.; Luo, T.; Tan, Q.; Yan, J.; Luo, Y.; Hu, X. Dynamic Determination of Landslide Stability and Thrust Force Considering Slip Zone Evolution. Nat. Hazards 2023, 118, 31–53. [Google Scholar] [CrossRef]
  31. Zhang, S.; Li, Q.; Tang, H.; Zou, Z.; Zhao, J.; Zhang, J.; Wu, M. Reciprocal Rate-Modulated Evolution of Slow-Moving Reservoir Landslide: Learning from Hydrological-Adapted Block Model. Landslides 2025. [CrossRef]
  32. Juang, C.H. BFTS—Engineering Geologists’ Field Station to Study Reservoir Landslides. Eng. Geol. 2021, 284, 106038. [Google Scholar] [CrossRef]
  33. GB/T 50123-2019; Standard for Geotechnical Testing Method. China Ministry of Housing and Urban-Rural Development: Beijing, China, 2019. (In Chinese)
  34. Wang, S.; Wu, W.; Cui, D. On Mechanical Behaviour of Clastic Soils: Numerical Simulations and Constitutive Modelling. Geotechnique 2022, 72, 706–721. [Google Scholar] [CrossRef]
  35. ASTM C1699-09; Standard Test Method for Moisture Retention Curves of Porous Building Materials Using Pressure. ASTM International: West Conshohocken, PA, USA, 2009.
  36. ASTM E104-02; Standard Practice for Maintaining Constant Relative Humidity by Means of Aqueous Solutions. ASTM International: West Conshohocken, PA, USA, 2012.
  37. Miao, F.; Wu, Y.; Li, L.; Tang, H.; Xiong, F. Weakening Laws of Slip Zone Soils during Wetting–Drying Cycles Based on Fractal Theory: A Case Study in the Three Gorges Reservoir (China). Acta Geotech. 2020, 15, 1909–1923. [Google Scholar] [CrossRef]
  38. Van Genuchten, M.T. A Closed-form Equation for Predicting the Hydraulic Conductivity of Unsaturated Soils. Soil. Sci. Soc. Amer J. 1980, 44, 892–898. [Google Scholar] [CrossRef]
  39. Vanapalli, S.K.; Fredlund, D.G.; Pufahl, D.E.; Clifton, A.W. Model for the Prediction of Shear Strength with Respect to Soil Suction. Can. Geotech. J. 1996, 33, 379–392. [Google Scholar] [CrossRef]
  40. Hoyos, L.R.; Velosa, C.L.; Puppala, A.J. Residual Shear Strength of Unsaturated Soils via Suction-Controlled Ring Shear Testing. Eng. Geol. 2014, 172, 1–11. [Google Scholar] [CrossRef]
  41. Bhat, D.R.; Bhandary, N.P.; Yatabe, R. Residual-State Creep Behavior of Typical Clayey Soils. Nat. Hazards 2013, 69, 2161–2178. [Google Scholar] [CrossRef]
  42. Iverson, R.M. Regulation of Landslide Motion by Dilatancy and Pore Pressure Feedback. J. Geophys. Res. Earth Surf. 2005, 110, 268. [Google Scholar] [CrossRef]
  43. Di Maio, C. Shear Strength of Clays and Clayey Soils: The Influence of Pore Fluid Composition. In Chemo-Mechanical Couplings in Porous Media Geomechanics and Biomechanics; Loret, B., Huyghe, J.M., Eds.; Springer: Vienna, Austria, 2004; pp. 45–55. ISBN 978-3-7091-2778-0. [Google Scholar]
  44. Bagheri, M.; Rezania, M.; Mousavi Nezhad, M. Rate Dependency and Stress Relaxation of Unsaturated Clays. Int. J. Geomech. 2019, 19, 04019128. [Google Scholar] [CrossRef]
  45. Gallage, C.; Uchimura, T. Direct Shear Testing on Unsaturated Silty Soils to Investigate the Effects of Drying and Wetting on Shear Strength Parameters at Low Suction. J. Geotech. Geoenviron. Eng. 2016, 142, 04015081. [Google Scholar] [CrossRef]
  46. Dong, Y.; Lu, N.; Fox, P.J. Drying-Induced Consolidation in Soil. J. Geotech. Geoenviron.Eng. 2020, 146, 04020092. [Google Scholar] [CrossRef]
  47. Kimura, S.; Nakamura, S.; Vithana, S.B.; Sakai, K. Shearing Rate Effect on Residual Strength of Landslide Soils in the Slow Rate Range. Landslides 2014, 11, 969–979. [Google Scholar] [CrossRef]
  48. Leroueil, S.; Vaughan, P.R. The General and Congruent Effects of Structure in Natural Soils and Weak Rocks. Geotechnique 1990, 40, 467–488. [Google Scholar] [CrossRef]
  49. Urciuoli, G.; Picarelli, L.; Leroueil, S. Local Soil Failure before General Slope Failure. Geotech. Geol. Eng. 2007, 25, 103–122. [Google Scholar] [CrossRef]
  50. Puzrin, A.; Randolph, M. Effects of Pore Water Pressure Dissipation on Rate Dependency of Shear Strength in Localised Failure of Soils: Effects of Pore Water Pressure Dissipation. Int. J. Numer. Anal. Methods Geomech. 2015, 39, 2348. [Google Scholar] [CrossRef]
  51. Rempe, M.; Di Toro, G.; Mitchell, T.M.; Smith, S.A.F.; Hirose, T.; Renner, J. Influence of Effective Stress and Pore Fluid Pressure on Fault Strength and Slip Localization in Carbonate Slip Zones. J. Geophys. Res. Solid Earth 2020, 125, e2020JB019805. [Google Scholar] [CrossRef]
  52. Frungieri, G.; Bäbler, M.U.; Biferale, L.; Lanotte, A.S. Heavy and Light Inertial Particle Aggregates in Homogeneous Isotropic Turbulence: A Study on Breakup and Stress Statistics. Comput. Fluids 2023, 263, 105944. [Google Scholar] [CrossRef]
  53. Grue, R.H.; Issler, D.; L’Heureux, J.-S.; Thakur, V. Viscometric Tests of Sensitive Clay from Byneset, Norway, and Fit to the Herschel–Bulkley Model. In Landslides in Sensitive Clays: From Research to Implementation; Thakur, V., L’Heureux, J.-S., Locat, A., Eds.; Springer International Publishing: Cham, Switzerland, 2017; pp. 155–166. ISBN 978-3-319-56487-6. [Google Scholar]
  54. Wen, Z.; Huang, Z.; Xu, H.; Bai, Y.; Lu, J.; Liu, J. Rheological Experiments on Dense Silty Sediments under Steady Shear Loadings. Geo-Mar. Lett. 2025, 45, 9. [Google Scholar] [CrossRef]
  55. Aschonitis, V.G.; Gaglio, M.; Castaldelli, G.; Fano, E.A. Criticism on Elasticity-Sensitivity Coefficient for Assessing the Robustness and Sensitivity of Ecosystem Services Values. Ecosyst. Serv. 2016, 20, 66–68. [Google Scholar] [CrossRef]
  56. Ren, S.; Zhang, Y.; Li, J.; Wu, R.; Hao, H. Response Mechanism of the Residual Strength to the Mesostructure of the Shear Surface in the Gravelly Slip Zone of Ancient Landslides. J. Geophys. Res. Earth Surf. 2024, 129, e2023JF007605. [Google Scholar] [CrossRef]
  57. Guo, C.; Liu, J.; Wu, R.; Yan, Y.; Yuan, H.; Qiu, Z. Deformation and Failure Mechanisms of Deep-Seated Landslides: Insights from Guili-Baige in Jinsha River Tectonic Belt. NPJ Nat. Hazards 2025, 2, 77. [Google Scholar] [CrossRef]
  58. Kohler, M.; Hottiger, S.; Puzrin, A.M. Rate, Water Pressure, and Temperature Effects in Landslide Shear Zones. J. Geophys. Res. Earth Surf. 2023, 128, e2023JF007220. [Google Scholar] [CrossRef]
  59. Xue, C.; Wang, X.; Lian, B.; Wang, D.; Liu, K.; Luo, L.; Yang, J. Formation Mechanism of Loess-Mudstone Landslides in the Weibei Tableland Fault Active Zone of Baoji, China—Taking Wolongsi Landslide as an Example. Geomorphology 2024, 460, 109284. [Google Scholar] [CrossRef]
  60. Leshchinsky, B.; Olsen, M.J.; Mohney, C.; O’Banion, M.; Bunn, M.; Allan, J.; McClung, R. Quantifying the Sensitivity of Progressive Landslide Movements to Failure Geometry, Undercutting Processes and Hydrological Changes. J. Geophys. Res. Earth Surf. 2019, 124, 616–638. [Google Scholar] [CrossRef]
  61. Zhang, T.; Ji, J.; Liao, W.; Cui, H.; Zhang, W. Seismically Progressive Motion Mechanism of Earth Slopes Considering Shear Band Porewater Pressure Feedback under Earthquake Excitations. Comput. Geotech. 2024, 165, 105909. [Google Scholar] [CrossRef]
  62. Su, X.; Wu, W.; Tang, H.; Huang, L.; Xia, D.; Lu, S. Physicochemical Effect on Soil in Sliding Zone of Reservoir Landslides. Eng. Geol. 2023, 324, 107249. [Google Scholar] [CrossRef]
  63. Wu, M.; Zhang, G.; Zhang, S.; Huang, W.; Zou, H. Spatiotemporal Decoupling of Rainfall Patterns and Shallow Landslide Stability: Lessons Learned from Calibrated Ensemble Physically-Based Models. J. Rock Mech. Geotech. Eng. 2025; in press. [Google Scholar] [CrossRef]
  64. Zhang, S.; Li, Q.; Yuan, J.; Mao, Y.; Xu, L.; Zhang, C.; Qin, L.; Chen, H. Evaluating Risk in Reservoir Accumulation Landslides: The Role of Instability Pattern Uncertainty. Q. J. Eng. Geol. Hydrogeol. 2025, 58, qjegh2024-138. [Google Scholar] [CrossRef]
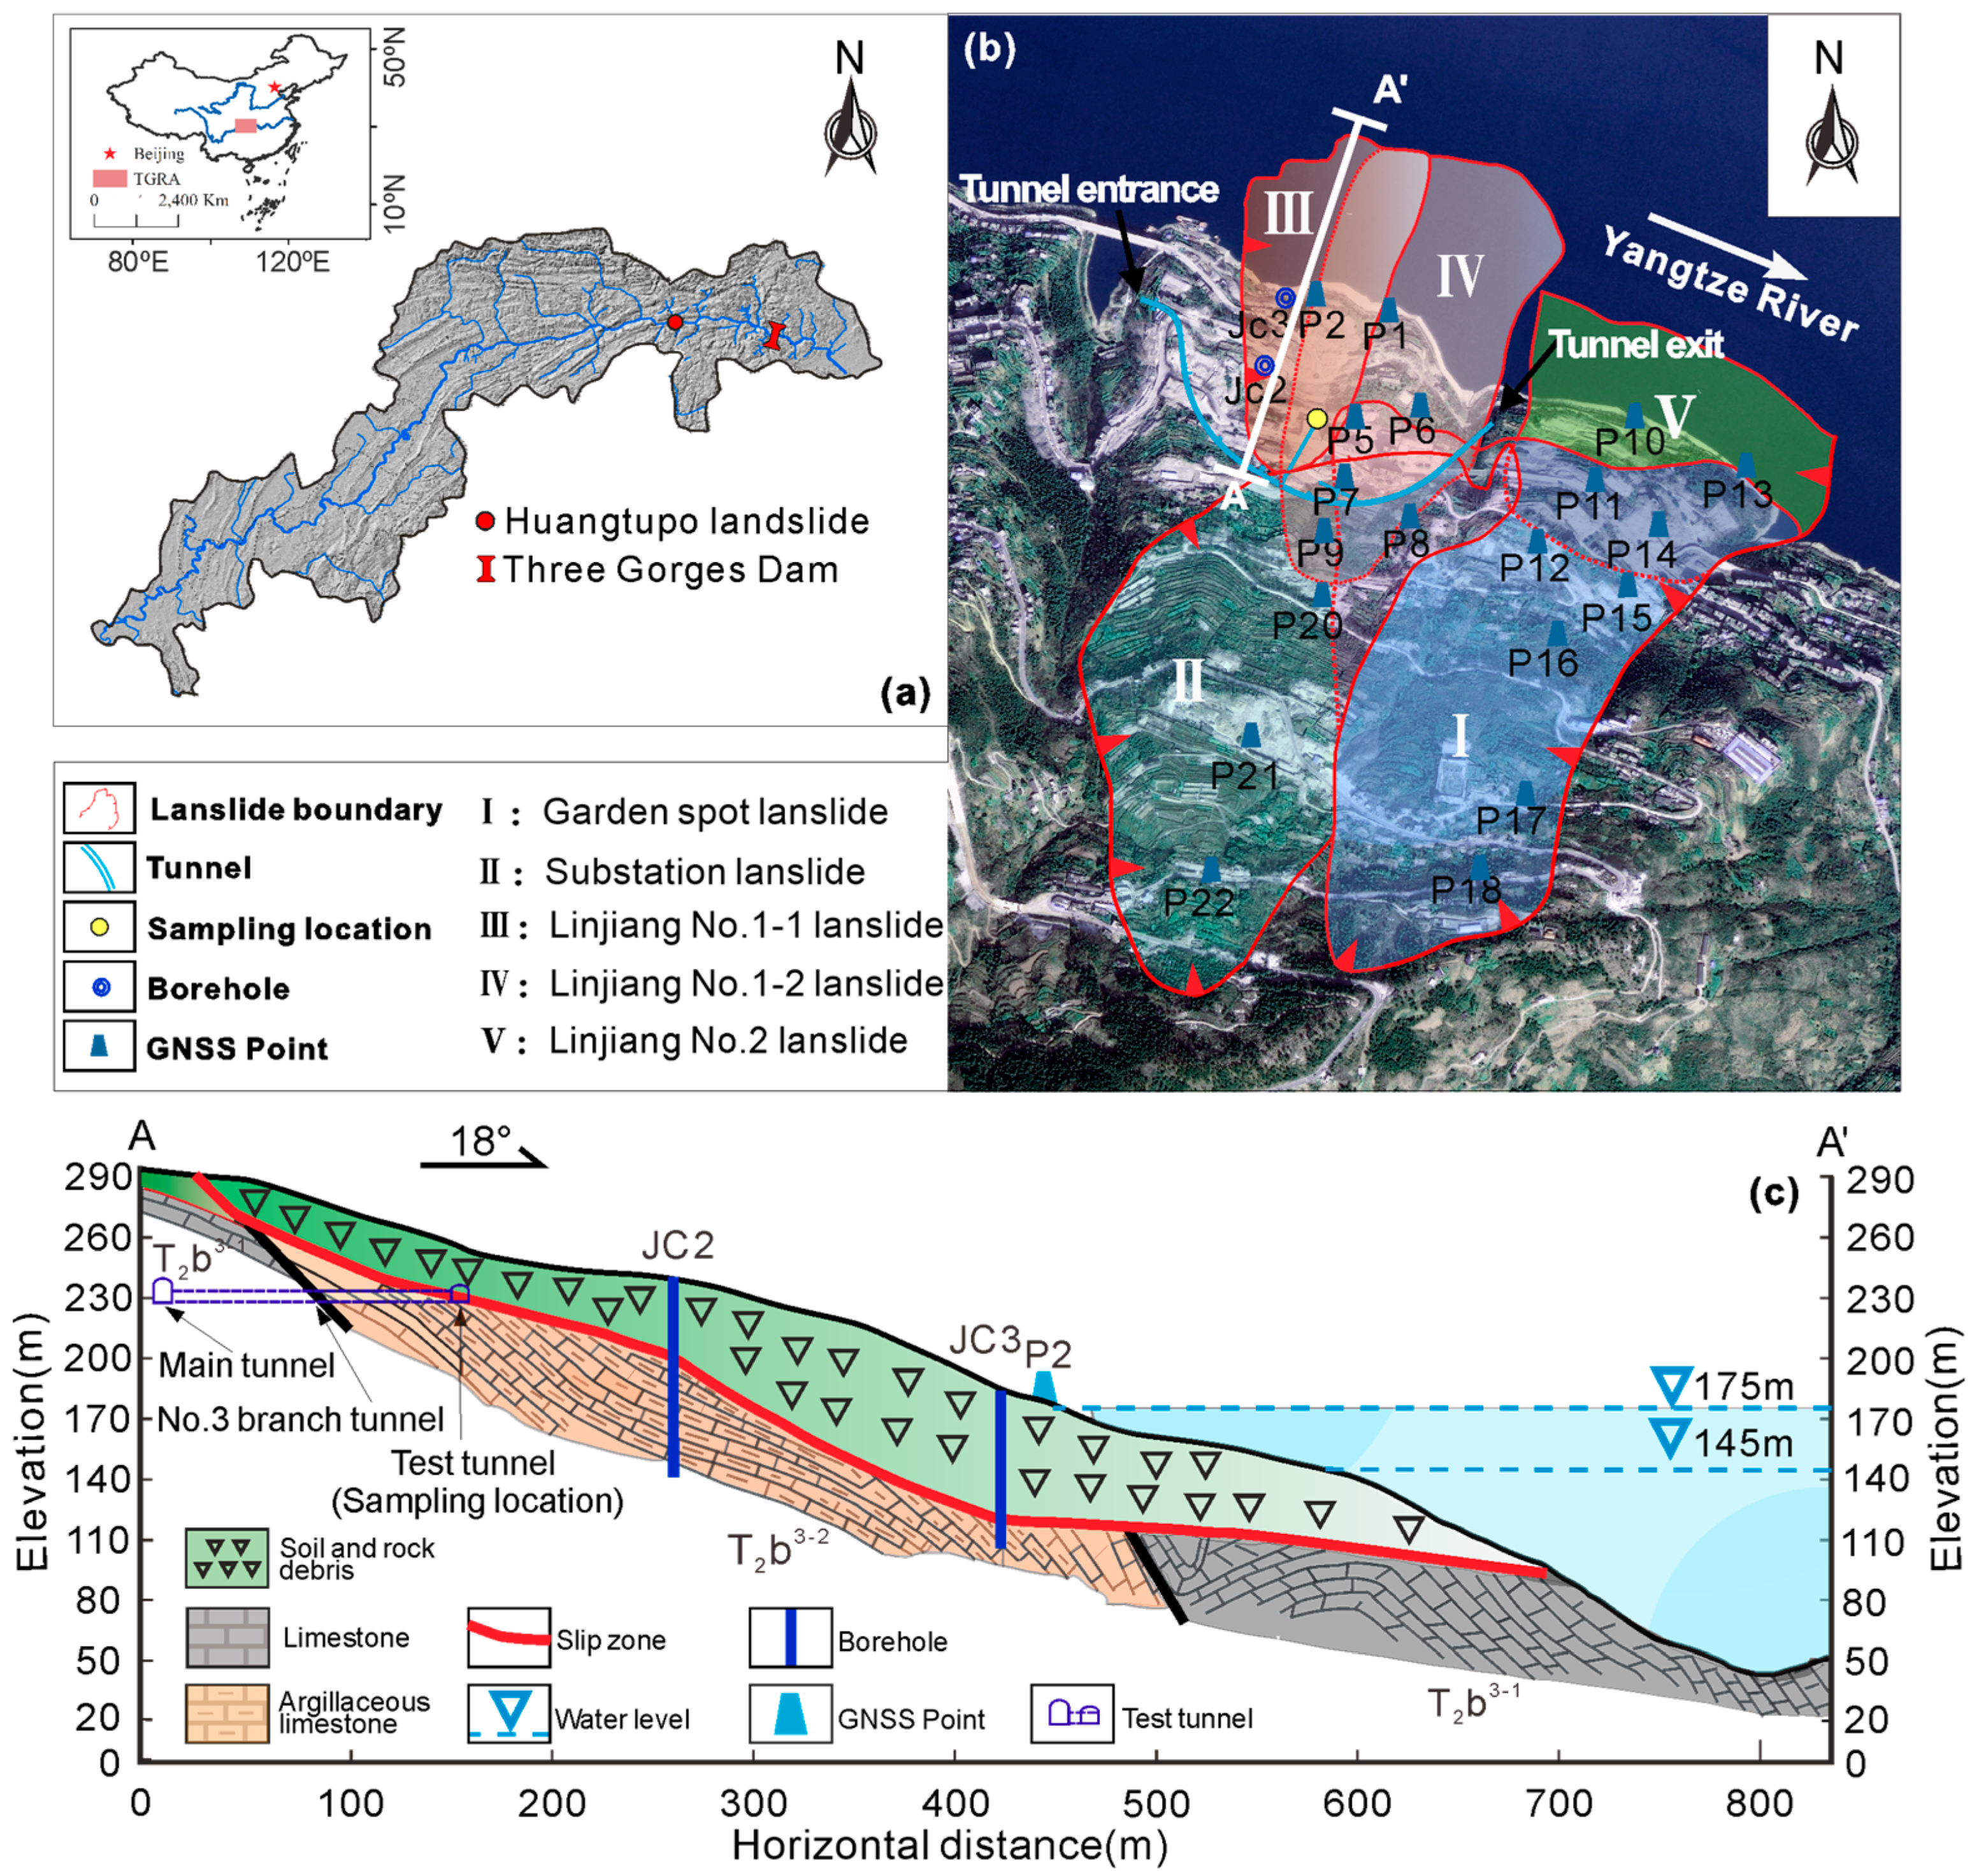
Figure 1. Comprehensive geological map of Huangtupo landslide: (a) location and aerial view of Huangtupo landslide; (b) landslide boundary of Huangtupo, GNSS monitoring points, and A–A′ profile line; (c) A–A′ landslide geologic profile of Huangtupo landslide [30,31].
Geosciences 15 00397 g001
Figure 2. Main experimental procedure: (a) sample preparation, materials, and particle size distribution; (b) ring shear apparatus; (c) pressure plate method; (d) saturated salt solution method.
Geosciences 15 00397 g002
Figure 3. Ring shear apparatus. (a) Overall structure; (b) shear body structure; (c) internal shear structure; (df) sample installation process; (gk) vacuum saturation and equipment calibration; (l) shear surface observation after testing.
Geosciences 15 00397 g003
Figure 4. Test loading path. (a) Schematic diagram of loading paths for different shear rates; (b) loading paths for σ n e t and Ψ .
Geosciences 15 00397 g004
Figure 5. Soil–water characteristic curve over a wide suction range.
Geosciences 15 00397 g005
Figure 6. Shear stress–displacement curves: (a) Group A; (b) Group B; (c) Group C.
Geosciences 15 00397 g006
Figure 7. Vertical displacement and dilatancy angle versus shear displacement under different suction conditions: (a) Dilatancy angle for Ψ = 0 kPa; (b) Vertical displacement for Ψ = 0 kPa; (c) Dilatancy angle for Ψ = 200 kPa; (d) Vertical displacement for Ψ = 200 kPa; (e) Dilatancy angle for Ψ = 700 kPa; (f) Vertical displacement for Ψ = 700 kPa; (g) Schematic illustration of the dilatancy angle calculation.
Geosciences 15 00397 g007
Figure 8. Residual strength envelopes of unsaturated slip-zone soil under different matric suction and γ ˙ values: (a) Ψ = 0 kPa; (b) Ψ = 200 kPa; (c) Ψ = 700 kPa.
Geosciences 15 00397 g008
Figure 9. Residual internal friction angle of slip-zone soil as a function of γ ˙ under different matric suction conditions: (a) normal scale; (b) logarithmic scale.
Geosciences 15 00397 g009
Figure 10. Residual cohesion of slip-zone soil as a function of γ ˙ under different matric suction conditions: (a) normal scale; (b) logarithmic scale.
Geosciences 15 00397 g010
Figure 11. Rate-dependent residual cohesion analysis. (a) Rate effect curves of residual cohesion under different matric suctions. (b) Multivariate regression model for rate-dependent residual strength of slip-zone soil.
Geosciences 15 00397 g011
Table 1. The basic physical properties and mineral composition of slip-zone soil.
PropertyIndices, Symbol (Unit)Value
Physical parameters Natural   density ,   ρ n (g·cm−3)2.01
Saturated   density ,   ρ s (g·cm−3)2.06
Natural water content, ωn (%)12.03
Saturated water content, ωs (%)20.77
Bulk   density ,   ρ b (g·cm−3)1.69
Void ratio, e0.58
Specific gravity, Gs2.68
Liquid limit, ωL (%)29.90
Plastic limit, ωP (%)12.30
Plastic index, Ip (%)17.60
Saturated hydraulic conductivity, Ks (cm/s)2.33 × 10−6
Consolidation parametersCoefficient of consolidation, Cv (m2/s)7.98 × 10−8
Mineral composition Quartz (%)20.8–24.4
K-feldspar (%)0–4.2
Dolomite (%)0~5
Calcite (%)19.5–20.8
Clay mineral (%)52.0–53.5
Montmorillonite (%)6.7–12.9
Illite (%)40.6–45.3
Note: The basic physical and mechanical properties of the slip-zone soil listed in Table 1 were all determined through laboratory tests conducted on the same batch of soil samples used in this study. All tests were strictly performed in accordance with the SGTM (GB/T50123−2019) [31].
Table 2. Saturated salt solutions and corresponding suction values (25 ± 1 °C).
Saturated Salt SolutionRelative Humidity/%RH Uncertainty (±%)Total Suction/MPaSuction Uncertainty (±MPa)
LiCl·H2O11.30.3300.0215
CH3COOK22.50.3205.1910
MgCl2·6H2O32.80.2153.477
K2CO343.20.4115.628
NaBr57.60.475.915
KI68.90.351.264
NaCl75.30.139.042
KCl84.20.323.661.5
Na2SO3·10H2O90.80.813.282
K2SO497.30.53.770.5
Table 3. Testing programs.
Test No. Net   Normal   Stress   ( σ n e t , kPa)Matric Suction
( Ψ , kPa)
Shear Rate
( γ ˙ , mm/min)
AA110000.05, 0.1, 0.5, 5, 10, 30, 50, 100, 200
A2200
A3400
A4800
BB1100200
B2200
B3400
B4800
CC1100700
C2200
C3400
C4800
Table 4. Residual shear strength under different matric suctions, net normal stresses, and shear rates.
Ψ kPa) σ n e t (kPa)Index Residual   Shear   Stress   ( τ r , kPa)
0.050.10.55103050100200
0100 τ r (kPa)31.129.128.931.333.737.839.540.242.6
20051.152.854.757.659.359.760.765.566.2
40072.972.571.873.969.071.475.380.081.7
800128.3130.4131.5132.4133.4134.1135.2136.2137.2
/ c r (kPa)19.0719.1219.3822.3725.3227.2528.3130.7231.57
φ r (°)7.697.927.957.817.677.527.497.417.35
R 2 0.990.980.980.970.950.970.980.970.98
200100 τ r (kPa)34.535.836.338.640.440.943.745.847.3
20059.858.965.166.667.968.670.272.573.5
400104.8105.8106.8107.9109.6111.3112.9115.7116.7
800134.2135.7138.3138.8140.1141.6143.2143.4144.2
/ c r (kPa)31.5431.6634.3637.5638.2539.8041.1343.0644.43
φ r (°)7.867.957.937.817.787.867.807.637.59
R 2 0.870.880.880.880.880.870.880.860.86
400100 τ r (kPa)48.445.644.647.150.450.554.055.657.7
20085.686.386.190.390.691.889.992.895.7
400112.0113.5115.5118.3119.3121.7123.6124.7127.1
800178.2180.2181.4179.4181.5181.8182.9182.8184.8
/ c r (kPa)38.2438.8739.9142.9444.7345.7447.0748.7150.23
φ r (°)9.9110.2110.379.969.949.939.919.729.69
R 2 0.970.960.960.940.950.940.960.960.95
Table 5. Fitting parameters.
Matric   Suction   Ψ /kPaABR2
01.59022.1150.928
2001.53335.3990.983
7001.41541.6710.966
Disclaimer/Publisher’s Note: The statements, opinions and data contained in all publications are solely those of the individual author(s) and contributor(s) and not of MDPI and/or the editor(s). MDPI and/or the editor(s) disclaim responsibility for any injury to people or property resulting from any ideas, methods, instructions or products referred to in the content.