Abstract
Costa Rica has experienced 45 tsunamis at both its Pacific and Caribbean coasts, with none to moderated impact. However, the coastal population has increased exponentially in the past few decades, which might lead to higher impact in future tsunamis. In 2018 and 2019, IOC/UNESCO organized Experts Meetings of Tsunami Sources, Hazards, Risks and Uncertainties associated with the Tonga–Kermadec and Colombia–Ecuador subduction zones, where experts defined maximum credible scenarios. Here we modeled the propagation of those tsunami scenarios to Costa Rica and their inundation for selected sites. We found that the Tonga–Kermadec scenarios provoked more inundation than previous modeled sources from that region. However, the large travel time for those scenarios, about 14 h, would allow for a timely evacuation. In the Colombia–Ecuador scenarios, they provoked less inundation than previously modeled sources from that region, a good outcome as their arrival time is between 75 and 150 min. These new results required the update of tsunami evacuation maps and/or plans for many communities but provided more favorable conditions for tsunami preparedness. Yet, the short arrival times of the Colombia–Ecuador scenarios still require a prompt response from the population and authorities. For this, additional to updated tsunami evacuation maps and plans, it is recommended to have tsunami exercises on a regular basis.
1. Introduction
A first estimation of tsunami hazard for the Pacific coast of Costa Rica was performed by [1] using local, regional and far-field seismic sources located all around the Pacific basin, as recommended by [2]. They found that tsunamis coming from the subduction zones of Tonga–Kermadec and Colombia–Ecuador caused the highest tsunami wave heights for Costa Rica, not only amongst regional and distant sources but also higher than local sources.
The results from this assessment were employed to elaborate tsunami evacuation maps for 54 communities in the Pacific coast of Costa Rica. Two methodologies were employed to define the inundation areas for the evacuation maps, as recommended by [3]: tsunami inundation modeling and fixed height (also known as bathtub). For eight locations at which high-resolution bathymetric data was available or surveyed, tsunami inundation was modeled using the sources employed in [1], and the inundation area was defined by the superposition of the inundation areas resulting from all the scenarios modeled. For the other communities, the fixed-height approach was employed to define the inundation area. The heights were defined using the maximum tsunami wave height obtained at a 20 m depth offshore each location. To estimate the wave shoaling up to the beach, we considered several amplification factors like those in [4,5,6]. These tsunami evacuation maps were part of a joint project between the National University Costa Rica (UNA) and the National Commission on Risk Prevention and Emergency Response (CNE). With the support of this project, Costa Rica has 10 communities recognized as Tsunami Ready by IOC/UNESCO [7] along its Pacific coast.
Costa Rica has experienced 45 tsunamis since 1746 [8,9,10,11,12,13,14]. Of the 39 recorded at the Pacific coast, 26 were caused by distant earthquakes and one was from a distant volcanic eruption. None of those tsunamis caused casualties, but in total they flooded 10 locations, causing damages in 7 of them. In another seven locations, strong currents were observed, causing damages in two of them and morphological changes were reported four times. In 14 locations witnesses reported minor sea level fluctuations caused by the tsunamis. Nonetheless, future tsunamis might have a larger impact due to the fast increase in coastal population at both shores of Costa Rica since the 1990s.
The Costa Rica Pacific Coast has registered five tsunamis originating from the Tonga–Kermadec subduction zone (TKSZ) and three originating from the Colombia–Ecuador subduction zone (CESZ) (Figure 1). Of the former, four tsunamis were originated by earthquakes and one was originated by a volcanic eruption (black squares and triangle in Figure 2, respectively); of the latter, all were caused by earthquakes (black squares in Figure 3).
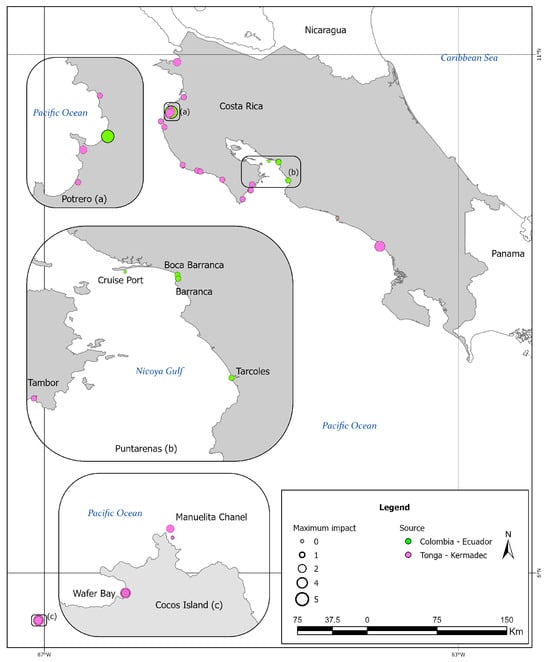
Figure 1.
Locations where tsunamis from Tonga–Kermadec (pink circles) and Colombia–Ecuador (green circles) subduction zones were recorded in Costa Rica. The number represents the maximum impact of the tsunami (0, instrumental record; 1, sea level changes; 2, strong currents; 3, flooding; 4, damages by currents; and 5, damages by flooding) according to the impact scale defined in [8].
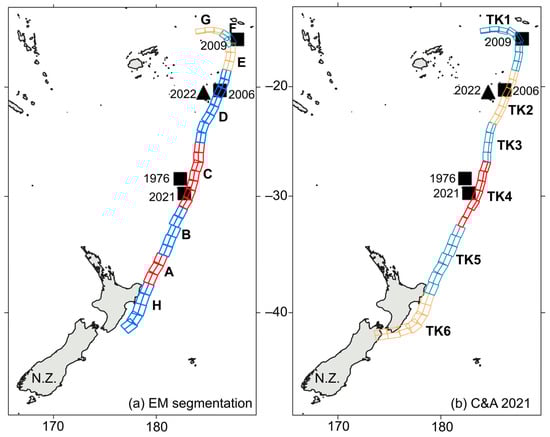
Figure 2.
Comparison of fault planes along the Tonga–Kermadec subduction zone employed for (a) the scenarios modeled in this work and (b) the scenarios modeled in [1]. Some scenarios modeled here are a combination of single scenarios in (a). The scenario with the maximum tsunami wave heights is shown in red and blue in (a) ETK21 (H + A + B + C + D) and in red in (b) TK4. Epicenters of earthquakes causing tsunamis recorded in Costa Rica are shown with black squares and Hunga Tonga–Hunga Ha’apai volcano is shown with a black triangle.
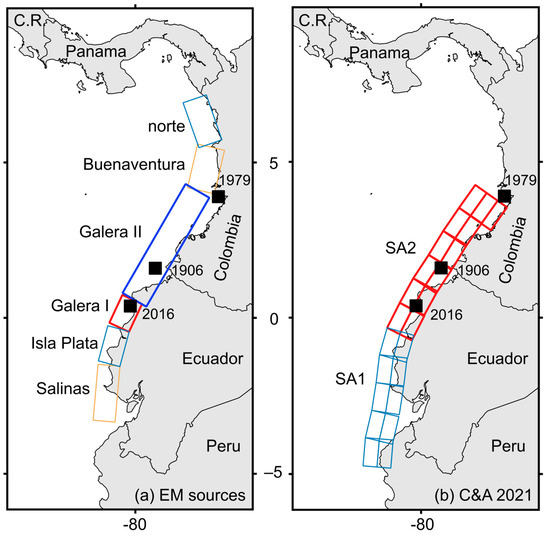
Figure 3.
Comparison of fault planes along the Colombia–Ecuador subduction zone employed for (a) the scenarios modeled in this work and (b) the scenarios modeled in [1]. The scenario with the maximum tsunami wave heights is shown in red and blue in (a) ECE28 (Galera 1 + Galera 2) and in red in (b) SA2. Epicenters of earthquakes causing tsunamis recorded in Costa Rica are shown with black squares.
Regarding the Tonga–Kermadec subduction zone (TKSZ), the tsunamis caused by the Mw = 8.0 earthquakes on 14 January 1976 and 3 May 2006 were registered in the Quepos tide gauge with maximum heights of 5.4 and 7.9 cm, arriving 15:19 and 14:19 after the earthquake, respectively [8,15] (Figure 4a). The former was discovered during the review of this manuscript and thus this is the first time this record is published. The Mw = 8.1 Samoa tsunami of 29 September 2009 was observed as minor sea level changes at Wafer Bay, Cocos Island [16]. The Mw = 8.1 Kermadec Islands tsunami of 4 March 2021 was registered at the tide gauges at Quepos and at Chattam Bay (Cocos Island) with maximum heights of 17.6 cm and 5.8 cm arriving 15:31 and 15:02 after the earthquake, respectively (Figure 4b,c) [9]. The 2022 tsunami was not tectonically induced: the eruption of the Hunga Tonga–Hunga Ha’apai (HTHH) volcano caused a meteotsunami that, due to Proudmann resonance, was amplified at the Tonga Trench, causing a tsunami that was observed in 24 locations in Costa Rica almost 13 h after the eruption [10], including the tide gauges of Quepos (Figure 4d) and Cocos Island (Figure 4e). These observation points are shown with purple circles in Figure 1. The 2022 HTHH tsunami was included here because the largest tsunami heights observed in Costa Rica originated after the Proudmann resonance at Tonga Trench, and was the reason for having noticeable effects at the Central and South American coasts.
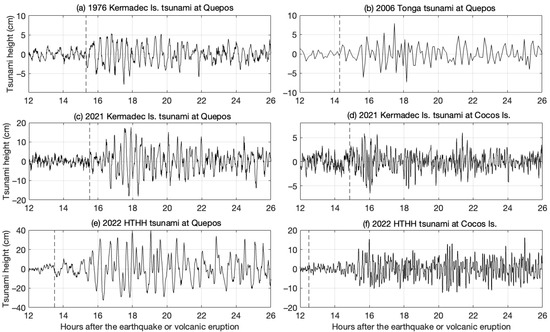
Figure 4.
Tsunami records of the (a) 1976 Kermadec Islands tsunami and the (b) 2006 Tonga tsunami at the Quepos tide gauge, and of the 2021 Kermadec Islands tsunami at (c) the Quepos tide gauge and (d) the Coco’s Island tide gauge. Also, tsunami records of the 2022 Hunga Tonga–Hunga Ha’apai (HTHH) tsunami at (e) the Quepos tide gauge and (f) the Cocos Island tide gauge. Panel (a) presents unpublished records, panel (b) was modified from [17], panels (c,d) were modified from [9], and panels (e,f) were modified from [10].
The first tsunami originating from the Colombia–Ecuador subduction zone (CESZ) registered in Costa Rica was caused by a Mw = 8.8 earthquake on the 31st of January of 1906 [8,15]. This tsunami caused sea level changes and small flooding at Tárcoles, Boca Barranca, Barranca and Potrero Bay (green circles in Figure 1). The second one was caused by a Mw = 7.9 earthquake on the 12th of December of 1979 and was recorded partially at the Puntarenas tide gauge (Figure 5a) [17]. The first two hours of the tsunami were not recorded and the rest of the marigram shows a maximum height of 13.5 cm. Based on model results, the tsunami arrived 2:20 after the earthquake, and might have had a maximum height of 43 cm. The third tsunami was caused by a Mw = 7.8 earthquake on the 16th of April of 2016 and was recorded at the Quepos tide gauge with a maximum height of 7.4 cm arriving 2:10 after the earthquake (Figure 5b). The marigram of the 2016 tsunami has not been published before.
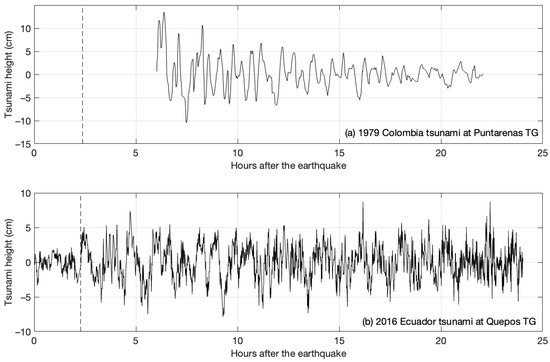
Figure 5.
Tsunami records of the (a) 1979 Colombia tsunami at the Puntarenas tide gauge, and (b) the 2016 Ecuador tsunami at the Quepos tide gauge. Panel (a) was modified from [17]. Data in panel (b) has not been published before. Dashed line in (a) shows estimated arrival time.
In their tsunami hazard study, [1] used combinations of unitary sources in ComMIT with a standard Mw = 9.3 around the Pacific basin for regional and far-field tsunamis. When that paper was under its final phases of writing, the UNESCO-IOC published the results from two Experts Meetings on tsunami sources from Tonga–Kermadec and Colombia–Ecuador subduction zones [18,19]. One of the goals of those meetings was “to provide guidance in the selection of seismic sources for the development of (tsunami) evacuation maps” [18,19]. However, these scenarios were not included in [1] due to time constraints.
The Experts Meeting on Tsunami Sources, Hazards, Risks and Uncertainties Associated with the Tonga–Kermadec subduction zone [18] was held in Wellington, New Zealand, from 29 October to 3 November 2018. At this meeting, 17 experts declared that “The rapid convergence rates at the Tonga–Kermadec trench, and the implications that such high rates of activity have for potential megathrust earthquakes, highlight this region as one of major concern for tsunami hazard in the circum-Pacific region” [18]. They “used their state-of-the-science knowledge of local tectonics” [18] to define some maximum credible scenarios for that trench [18]. Considering convergence rates in the Tonga Trench going from 7 to 25 cm/yr [20], the experts proposed 21 scenarios along the 3600 km long trench. Twenty scenarios defined rupturing sections of the trench, and one rupture was almost the entire trench length, 3100 km. Eight scenarios were considered to be of high probability with magnitudes ranging from Mw = 8.3 to Mw = 9.3, and thirteen were considered to be of intermediate probability with magnitudes ranging from Mw = 8.6 to Mw = 9.7. The probability refers to qualitative classes adopted by the experts and not probabilistic hazard estimates. The high magnitudes of these scenarios are based on GPS observations that suggest that this trench may be highly coupled with potential for a future large megathrust earthquake [18,21].
The Experts Meeting on Tsunami Sources, Hazards, Risk and Uncertainties Associated with the Colombia–Ecuador subduction zone [19] was held in Guayaquil, Ecuador, from 27 to 29 January 2019. At this meeting, 17 experts proposed seven scenarios along the 1220 km long trench, based on “coupled areas and the strength of coupling, historical earthquake patterns, and assumptions based on identification and mapping of tsunami deposits” [19]. Six scenarios ruptured sections of the trench with magnitudes ranging from Mw = 7.9 to Mw = 8.7, with high probability of occurrence. One multi-segment scenario was considered possible but less likely to occur, rupturing along 560 km with Mw = 8.9. The experts stated that the scenarios defined “are a first estimation of the inter-plate coupling along the Pacific coast of Colombia. However, for a more accurate and detailed assessment it is necessary to densify the geodetic network along the center and north of the Colombian Pacific (Sagiya Mora-Paez, 2020) with more instruments” [19].
Here, we model the sources from the mentioned Experts Meetings with the objective to update and reassess the results presented in [1]. The scenarios proposed by the experts have a stronger seismological background and either lower or higher magnitude than the scenarios employed in [1], and in the case of Colombia–Ecuador, they have more precise faulting parameters than ComMIT unit sources, which play an important role for regional and local sources. Consequently, these scenarios overrule the Tonga–Kermadec and Colombia–Ecuador scenarios previously considered, requiring the update of tsunami evacuation maps, plans and procedures, by performing tsunami numerical modeling.
2. Materials and Methods
2.1. Numerical Model Setup
The numerical simulations were performed with ComMIT (v. 1.8.3), a graphical user interface of MOST [22]. This model generates the initial condition of earthquake-generated tsunamis using the Okada analytical model [23,24], and employs spherical non-linear Shallow Water Equations with a numerical dispersion scheme for propagation [24]. The equations are solved by a splitting finite difference method, and the model uses Manning’s friction, for which we used n2 = 0.0006. MOST has been validated and verified [25] using tsunami inundation modeling benchmarks described in [26].
ComMIT has a pre-established 4 arcmin-grid covering the Pacific Ocean, over which the propagation of unit-sources has been pre-calculated and can be downloaded by the user, as we did for the Tonga–Kermadec scenarios. Also, it is possible to propagate customized sources over that same grid, as we did for the Colombia–Ecuador scenarios. The Pacific Ocean propagation grid nests one-way to a set of three telescopic inundation grids defined by the user, which have nested two-ways between them. The configuration of the three inundation grids is called a model site (MS) and allowed us to obtain inundation areas for the finest grid.
Here we used several model sites to model tsunami propagation and inundation along the Costa Rica Pacific shores using the seismic scenarios defined by the Experts Meetings in Tonga–Kermadec and Colombia–Ecuador subduction zones.
Our model site 1 is the same as that in [1] (Table 1), with the goal to assess the nearshore tsunami wave heights (NTHs) along the entire Costa Rica Pacific Coast at a 20 m depth. Although tsunami inundation modeling countrywide would be desirable, this was not possible due to the lack of high-resolution bathymetry at most of the coastal areas.

Table 1.
Parameters of model sites employed in this study: number, name, grids’ resolution, model site verification, and source of bathymetric data (SINAMOT: National Tsunami Monitoring System; CIMAR-UCR: Research Center on Marine Sciences and Limnology from the University of Costa Rica; IMARES-UCR: Research Unit on Maritime, Rivers and Estuarine Engineering from the University of Costa Rica; MOPT: Ministry of Public Works and Transportation). Verification has not been performed at most model sites due to the lack of quantitative tsunami records at those locations; however, new tide gauges located within sites with a * recorded the Kamchatka tsunami of 29 July 2025, while this manuscript was in its final review process; a new paper is under preparation to include these records and model results, which agreed well with the records.
Still, we modeled tsunami inundation at 13 locations where high-resolution coastal bathymetry was available, for which model sites 2–14 were established (details of the grids extent are available in the Supplementary Material). These places include the eight sites for which tsunami evacuation maps were elaborated through inundation modeling of the scenarios from the previous study (MS2–9) and five new sites whose bathymetries were surveyed afterwards (MS10-14) (Table 1 and Figure 6).
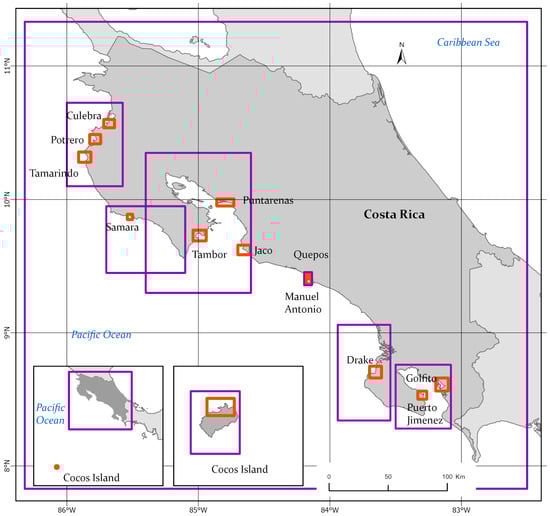
Figure 6.
Extent of the grids B (purple rectangles) and C (red rectangles) of model sites employed here for tsunami modeling. See the grids’ resolutions in Table 1.
To create the inundation grids, Lidar topography with 1 m of resolution and the Mean High Water (MHW) datum were employed. The nearshore bathymetric data for model sites 2–14 was surveyed by us and/or by the IMARES (Research Unit on Maritime, Rivers and Estuarine Engineering) from the University of Costa Rica. Some of the bathymetries surveyed by the IMARES belong to the Ministry of Public Works and Transportation (MOPT). For offshore regions with depths of less than 200 m, data from nautical charts digitized by the Research Center on Marine Sciences and Limnology (CIMAR) from the University of Costa Rica was employed. The mentioned institutions kindly shared the data required for this study. For depths over 200 m, GEBCO data was employed [27]. For model site 1, only data from nautical charts and GEBCO was employed.
The inundation models of Puntarenas, Quepos and Cocos Island were validated in previous work [9,17,28], as they host the only tide gauges in the Costa Rica Pacific Coast that recorded tsunamis in the past. During the final review of this manuscript, new tide gauges deployed at Potrero, Puntarenas and Golfito, along with the gauge in Quepos, recorded the tsunami from Kamchatka of 29 July 2025. Preliminary model results agreed very well with all the records; a paper is under preparation with these records and model results that will become a verification for Potrero and Golfito. For the other locations, there were no quantitative records of tsunamis to validate the inundation models, as there are no tide gauges within them.
The results from the inundation modeling at model sites 2 to 9 were compared with the results obtained from modeling the inundation caused by the scenarios in [1] at those sites to update their tsunami evacuation maps.
2.2. Tsunami Sources
As mentioned before, the scenarios modeled here were obtained from the Experts Meeting Reports [18,19]. The 21 scenarios at the Tonga–Kermadec trench were defined as a linear combination of pre-calculated ComMIT unit sources (see the details of the unit sources employed in the Supplementary Material). The seven scenarios at the Colombia–Ecuador trench were modeled as customized sources using the ComMIT module for custom propagation (see the details of the fault planes employed in the Supplementary Material). The scenarios from Tonga–Kermadec (ETK) had magnitudes ranging from Mw = 8.3 to Mw = 9.7 over rupture lengths between 200 and 2800 km (Table 2). The Colombia–Ecuador scenarios (ECEs) had magnitudes ranging from Mw = 7.9 to Mw = 8.9 and rupturing distances between 110 and 560 km (Table 2).
Table 2.
List of tsunami scenarios modeled here from both subduction zones, with magnitude, length, and probability. Scenarios with an * produced the highest tsunami wave heights in correspondence with the 20 m isobath and thus were also run for inundation models. † Here Probability refers to the qualitative classes adopted at the UNESCO/IOC Experts Meetings and not probabilistic hazard estimates.
3. Results
In [1], all the scenarios were based on unit sources combined for a Mw= 9.3. Six scenarios were modeled along the TKSZ and two scenarios were modeled along the CESZ (Figure 2b and Figure 3b, respectively). Of the TKSZ scenarios, one provoked much higher tsunami wave heights (TK4, in red in Figure 2b) than the others, and for CESZ, one scenario was more significant (SA2, in red in Figure 3b) than the other. Those are the scenarios used here for comparison.
3.1. Nearshore Tsunami Wave Heights and Arrival Times
From the Tonga–Kermadec intermediate probability scenarios modeled here, two had nearshore maximum tsunami wave heights (NTHs) larger than 20 m, scenario 21 and 12 with 26.1 and 24.4 m, respectively (Table 2, Figure 7a,b). Two scenarios had maximum NTHs over 10 m, scenarios 11 and 14, with 18.3 and 14.6 m, respectively (Table 2, Figure 7c,d). The maximum NTH for high probability scenarios was 5.3 m for scenario 4, and the minimum value of maximum NTH among all the TKSZ scenarios was for scenario 7 with 0.1 m (Table 2). Scenarios from the Tonga–Kermadec subduction zone affected particularly the south Pacific coast of Costa Rica (Figure 7). The travel times obtained for the largest magnitude scenario, ETK21, were 13:31 to Cocos Island and 14:07 to the mainland.
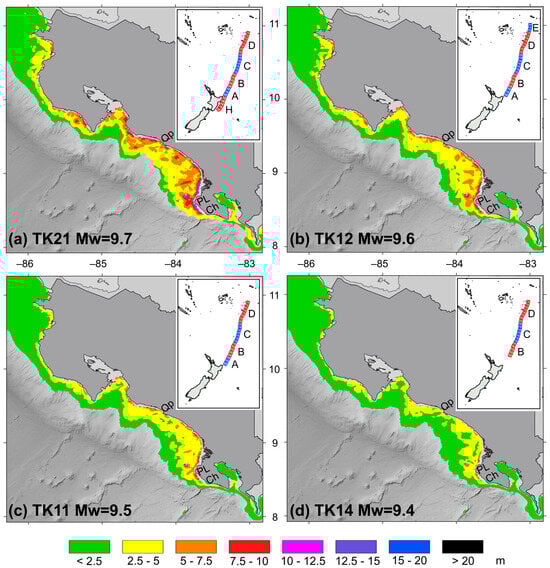
Figure 7.
Maximum nearshore tsunami wave heights caused by Tonga–Kermadec scenarios (a) 21, (b) 12, (c) 11 and (d) 14. The maximum nearshore tsunami wave heights caused by the other Tonga–Kermadec scenarios are shown in the Supplementary Materials. Places shown in the figure are as follows: Qp, Quepos; PL, Punta Llorona; Ch, Punta Chancha. The colors in the figure show maximum NTH in meters.
Of the Colombia–Ecuador scenarios, the “less likely” Mw = 8.9 Galera I and II had a maximum NTH of 4.38 m (Figure 8a, Table 2). Only one of the “more likely” scenarios caused a maximum NTH that was over 1 m: Galera II (Esmeralda) with 4.01 m (Figure 8b, Table 2). The travel times for these two scenarios were 1:21 and 1:07, respectively, to Punta Burica, the closest location to the source in Costa Rica.
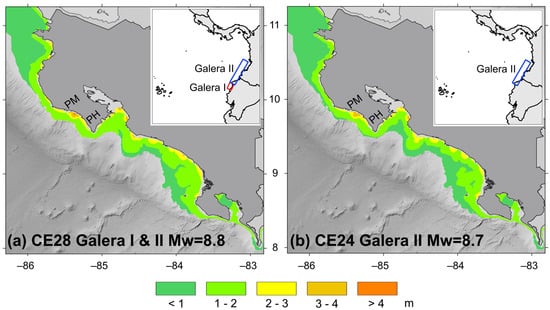
Figure 8.
Maximum nearshore tsunami wave heights caused by Colombia–Ecuador scenarios (a) Galera I and II, and (b) Galera II. The maximum nearshore tsunami wave heights caused by the other Colombia–Ecuador scenarios are shown in the Supplementary Materials. Places shown in the figure are as follows: PM, Punta Muñeco; PH, Playa Hermosa. The colors in the figure show maximum NTH in meters.
The highest NTHs for ETK scenarios were located close to Punta Llorona (PL in Figure 7) and for ECEs between Punta Muñeco and Playa Hermosa (PM and PH in Figure 8). In the Supplementary Material Figures S1–S6 are shown the NTH for the rest of the scenarios modeled here.
3.2. Tsunami Inundation
Among the sites where tsunami inundation was modeled, Puerto Jiménez resulted in the smallest inundation distance for both ETK21 and ECE28 scenarios: 0.25 and 0.1 km, respectively (Table 3). Tambor had the largest inundation distance for both scenarios: 2.4 km for ETK21 and 1.4 km for ECE28. Puntarenas was excluded from the comparison due to its complex geomorphology.
Table 3.
Maximum inundation distances, areas and flow depths for the sites where tsunami inundation was modeled. Maximum and minimum values for each scenario are highlighted with * and †, respectively.
Regarding inundated areas, Tamarindo had the largest for both scenarios: 7.4 and 3.6 km2 for ETK21 and ECE28, respectively. The smallest inundated areas were for Quepos: 0.04 km2 for ECE28 and Cocos Island; 0.15 km2 for ETK21.
The maximum flow depth obtained was in Potrero with 13.3 m for the ETK21 scenario and in Jaco with 7.3 m for the ECE28 scenario. The minimum flow depth occurred in Puerto Jiménez, with 1.84 m for the ETK21 scenario, and in Quepos, with 0.1 m for the ECE28 scenario.
4. Discussion
4.1. Wave Evolution
The lower panels of Figure 9 and Figure 10 show the time evolution of the tsunami waves for scenarios ETK21 and ECE28, respectively, for the coast sections between Cabo Velas (CV) and Punta Chancha (Ch). The coast sections and their maximum NTHs for each scenario are shown in the upper panels of Figure 9 and Figure 10, respectively, along with the incidence direction of each tsunami scenario.
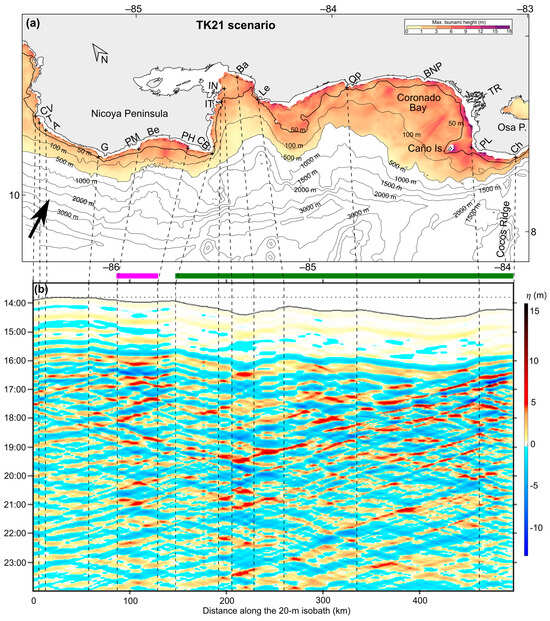
Figure 9.
(a) Maximum heights in meters caused by the ETK21 scenario. (b) Time evolution of the waves in meters for the coast section between Cabo Velas (CV) and Punta Chancha (Ch). Times are given in hours after the earthquake and horizontal axis shows the distance along the 20 m isobath. Black arrow in (a) shows approximated wave incidence direction. Places shown in the maps are as follows: CV, Cabo Velas; T, Tamarindo; A, Avellanas; G, Garza; PM, Punta Muñeco; Be, Bejuco; PH, Playa Hermosa; CB, Cabo Blanco; IT, Tortuga Island; IN, Negritos Island; Ba, Bajamar; Le, Punta Leona; Qp, Quepos; BNP, Ballena National Park; PL, Punta Llorona; Ch; Punta Chancha. Purple and green lines show the subsections for which the tsunami waves persisted for longer times compared to neighboring subsections.
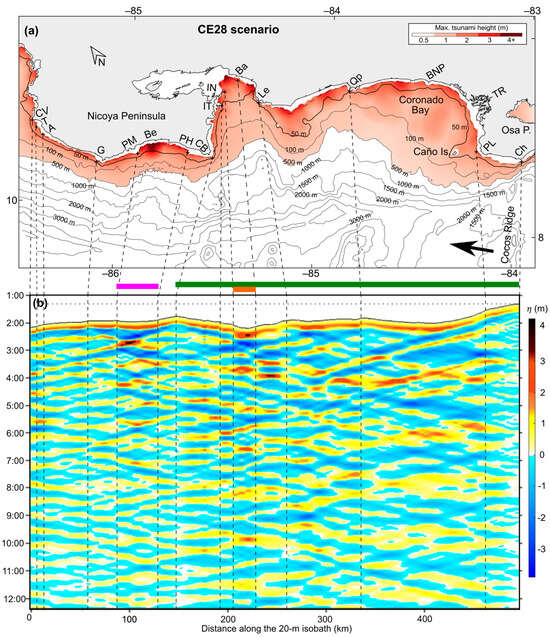
Figure 10.
(a) Maximum heights in meters caused by the ECE28 scenario (Galera I and II). (b) Time evolution of the waves in meters for the coast section between Cabo Velas (CV) and Punta Chancha (Ch). Times are given in hours after the earthquake and the horizontal axis shows the distance along the 20 m isobath. Black arrow in (a) shows approximated wave incidence direction. Places shown in the maps are as follows: CV, Cabo Velas; T, Tamarindo; A, Avellanas; G, Garza; PM, Punta Muñeco; Be, Bejuco; PH, Playa Hermosa; CB, Cabo Blanco; IT, Tortuga Island; IN, Negritos Island; Ba, Bajamar; Le, Punta Leona; Qp, Quepos; BNP, Ballena National Park; PL, Punta Llorona; Ch, Punta Chancha. Purple and green lines show the subsections for which the tsunami waves persisted for longer times compared to neighboring subsections. The orange line shows the mouth of Nicoya Gulf, where tsunami waves lasted the longest.
For the ETK21 scenario, tsunami amplitudes higher than 1 m persisted during longer timespans than for the ECE28 scenario. The much higher magnitude of the earthquake caused the ETK21 tsunami to be reflected around the Pacific basin, thus its effects persisted for longer times, as happened for the 2010 Chile and 2011 Japan tsunamis, for example [29].
For both scenarios, tsunami waves continued for longer times in the subdomains marked with a purple thick line, between Punta Muñeco (PM) and Playa Hermosa (PH), and with a green thick line, between Cabo Blanco (CB) and Punta Chancha (Ch), compared to the neighboring subdomains (Figure 9b and Figure 10b).
In the case of the ETK21 scenario, waves over 3 m continued for up to 10 h after the first arrival between Punta Muñeco and Playa Hermosa, while they lasted only about 5 h in the neighboring subsections. For the ECE28 scenario, waves over 2 m lasted about 5 h in this subsection versus 2 h in the neighboring subsections. For the ECEs, the highest NTHs were also obtained in this subsection (Figure 8a and Figure 10a). The incidence angle of ECE tsunamis with respect to the continental slope made the waves refract and arrive perpendicular to the continental platform in this section (see arrival times as a thick black line in Figure 10b), and the concave shape of the continental slope contributed to dissipating less energy for this subsection [30].
For the ETK21 scenario, tsunami edge waves over 3 m lasted 10 h along the entire subsection between Cabo Blanco (CB) and Punta Chancha (Ch) (green tick line in Figure 9b). These waves became trapped in this section due to their incidence angle (black arrow in Figure 9a, which is also parallel to Cocos ridge), their periods and the narrow continental platform at those two locations, as explained in [31]. Those edge waves are like the ones reported at Tehuantepec Gulf by [31] during the 2017 Mexico tsunami, although the geomorphology of the continental platform and coastline in Coronado Bay, Costa Rica, is more complex than that in Tehuantepec Gulf. The highest NTH for ETK scenarios was obtained near Punta Llorona (PL) and the Terraba River mouth (TR) (Figure 9a) due to the influence of Caño Island offshore of this coast subsection. Caño Island is about 3 km wide in the west–east direction and about 1.8 km wide in the north–south direction, and the slope of its shelf is much less steep to the east, contributing to trapping waves between the island and the mainland (see isobaths in Figure 9). The highest NTH around Caño Island occurred at the back side of the island, relative to the tsunami incidence, just as studied by [32].
For the ECE28 scenario, trapped tsunami waves lasted only about 4 h here (Figure 10b), due mainly to the presence of the Osa Peninsula relative to their incidence angle (black arrow in Figure 10a) and the much smaller earthquake magnitude. However, for this scenario, waves lasted longer at the entrance of Nicoya Gulf, between Negritos Island (IN) and Bajamar (Ba), marked with an orange thick line in Figure 10. This Gulf was not considered in the model due to its shallow depths, particularly at its mouth. Further studies are recommended to explore possible implications of this result within the Gulf.
The first study [1] also discussed trapped waves in the coast section between Cabo Blanco (CB) and Punta Chancha (Ch) using the SA2 scenario as an example, the largest scenario from the CESZ employed in that work. The higher magnitude of the ETK scenarios considered here made more evident the trapped waves and island effect discussed in [1] along Section 3.1 (between Terraba River, TR, and Punta Chancha). On the other hand, the refined seismic sources of the ECEs provoked much larger tsunami wave heights along Section 2.1 (between Punta Muñeco and Cabo Blanco) than in the rest of the segments, contrary to the SA2 scenario generated from ComMIT unit sources.
4.2. Arrival Times
The ETK21 scenario arrived almost perpendicular to the northwest Nicoya Peninsula (black arrow in Figure 9a); thus, the difference in arrival times between Cabo Velas and Cabo Blanco was only 2 min (Table 4 and Figure 9). This tsunami arrived first to the north of Costa Rica, despite the source being located southwest, due to the orientation of the Costa Rica Pacific Coast and wave refraction.
Table 4.
Modeled arrival times to several locations for the scenarios ETK21 and ECE28, as shown in the upper panels of Figure 9 and Figure 10. Also, arrival times from SA2 for Cabo Blanco to Punta Chancha from Figure 11 of [1] for comparison; Cabo Velas is not shown for SA2 as it was not included in that figure.
Ref. [1] mistakenly stated that tsunami waves reached Cabo Blanco (CB) and Punta Llorona almost at the same time for the SA2 scenario, but the difference was 13 min. Here, we obtained that same time difference for the ECE28 scenario (Table 4). In the case of the ETK21 scenario, that time difference was larger (21 min) due to the incidence angle (black arrow in Figure 9a and Table 4).
The short arrival times of ECEs should be considered when elaborating tsunami evacuation plans. These arrival times are slightly larger than arrival times for local tsunamis; however, these earthquakes will likely not be felt by the population, thus requiring other warning mechanisms.
4.3. Maximum Heights and Inundation
In [1], one scenario from the Tonga–Kermadec subduction zone (TK4) and one scenario from the Colombia–Ecuador subduction zone (SA2) resulted in the highest nearshore tsunami wave heights (NTHs) for Costa Rica of 12.5 and 12.3 m, respectively. The latter was particularly worrisome due to its short arrival time of about 1:15. Fortunately, the new scenarios from the Colombia–Ecuador subduction zone modeled here produced about three times smaller maximum NTHs than the SA2 scenario (Table 2).
In contrast, several of the intermediate probability scenarios from Tonga–Kermadec resulted in maximum NTHs higher than those from TK4. The maximum NTH obtained from the highest magnitude scenario (with intermediate probability) was more than double that in the previous study, 26.1 m versus 12.5 m (Table 2). However, the high probability scenarios simulated here have maximum NTHs that are much lower than those of the previous study: 5.3 m versus 12.5 m. Also, tsunamis arriving from this subduction zone have a travel time of approximately 14 h, which could support the timely evacuation of exposed areas.
The difference in maximum inundation distance, inundation area and flow depth between the modeling of experts’ scenarios and the scenarios from [1] is shown in Table 5. Manuel Antonio, Drake, Puerto Jiménez, Golfito and Cocos Island were not included as they were not modeled using the previous scenarios.
Table 5.
Differences between results from modeling ETK21 and ECE28 scenarios and scenarios TK4 and SA2 from [1]. Manuel Antonio, Drake, Puerto Jimenez, Golfito and Cocos Island were not modeled with sources from [1]. Maximum and minimum values for each scenario are highlighted with * and †, respectively.
In all cases but one, the inundation areas caused by the ETK21 scenario were larger than the inundation areas caused by the TK4 scenario (Table 5), which is consistent with the larger magnitude of the new scenario: Mw = 9.7 versus Mw = 9.3. Tambor had the largest change on tsunami inundation area between old and new scenarios: the area increased by 4.5 km2. Considering that the coastline length for the Tambor grid is 20.3 km, the inundation area increased 0.22 km2 per kilometer of coastline. Potrero and Tamarindo also had a significant increase in inundation areas: 2.0 and 2.4 km2, respectively. The only exception of this was Quepos, where the bathymetric and topographic grids were also updated as new bathymetric information became available. In Quepos, the total inundation area caused by the ETK21 scenario was 0.39 km2 smaller than the inundation area caused by the TK4 scenario. However, this reduction was only in the Boca Vieja mangrove. In the city, the inundation area increased for the ETK21 scenario by 0.2 km2.
Regarding the CESZ scenarios, in all cases, the inundation areas caused by the ECE28 scenario were smaller than those caused by the SA2 scenario from [1]. In this case, the magnitude of the new scenario was smaller: Mw = 8.9 versus Mw = 9.3. Tamarindo, Sámara and Tambor had a significant decrease in inundation areas: 4.9, 2.1 and 4.0 km2, respectively.
4.4. Implications for Coastal Communities
The results obtained here implied a revision of the tsunami evacuation maps and plans developed from the results of [1]. The difference between inundation areas caused by new versus old scenarios was diverse for each location where tsunami inundation was modeled, and for those where inundation areas were defined by fixed height. Here we analyze only the eight locations where tsunami inundation modeling was performed before.
Tsunami evacuation maps and plans are basic tools for tsunami preparedness and response at a community level. Both require a tsunami inundation area as their main input, in addition to the community infrastructure, tsunami inundation distance, and tsunami flow depths, in order of importance.
The inundation area, obtained either from tsunami inundation modeling or fixed height, was extended to nearby roads or other landmarks for easiness of interpretation. This extended area is known as the evacuation area in tsunami evacuation maps and plans. In the cases of MS2 Bahía Culebra (Figure S6), MS4 Tamarindo (Figure S7), MS5 Samara (Figure S8), MS6 Tambor (Figure S9) and MS8 Jaco (Figure S10), the new inundation areas did not require changing the old evacuation areas and did not affect assembly points nor evacuation routes.
Those communities amended their tsunami exposure with the new scenarios, even when their maps did not require an update. Their higher-amplitude scenario now is a distant tsunami instead of a regional tsunami as it was before. This means that the arrival times for their highest-amplitude scenario increased from 1–2 to 14 h, streamlining the evacuation processes. The tsunami evacuation plans of MS4 Tamarindo and MS5 Samara were updated accordingly. In the case of MS2 Bahía Culebra, it has three communities: El Coco, Playa Hermosa and Playa Panamá. The latter has no tsunami evacuation plan; and Playa Hermosa and El Coco were in the process of building their plans when these results became available, and they then used them for their plans. For MS6 Tambor and MS8 Jaco, no tsunami evacuation plan has been created yet.
The other three locations had to update their tsunami evacuation maps: MS3 Potrero, MS7 Puntarenas and MS9 Quepos. In MS3 Potrero, the inundation area was smaller for the new ECEs. On the other hand, the new ETK scenarios inundated about 500 m further inland than the previous ones (Figure 11b and Figure 11a, respectively): the maximum inundation distance went from 1.065 km to 1.568 km. This difference was constant along the entire location, requiring updating the tsunami evacuation map. Yet, it did not require updating the sectorization of the community for the evacuation procedures.
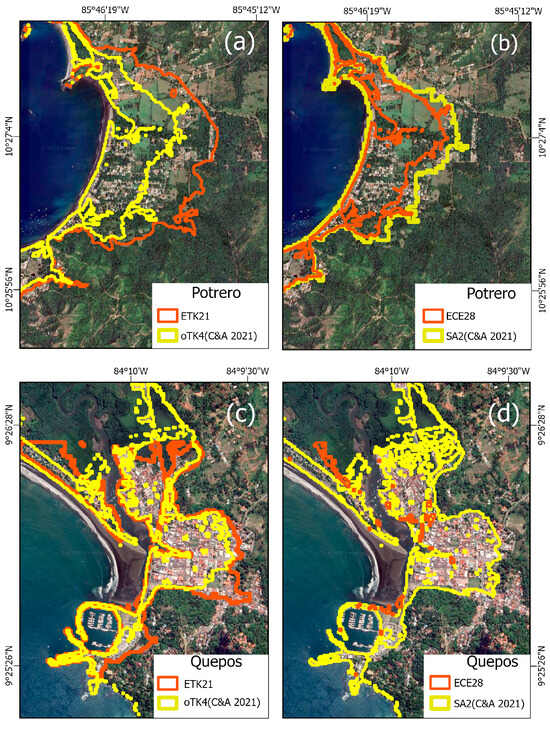
Figure 11.
Upper panels: comparison of the inundation areas at MS3 Potrero (a) caused by scenario ETK21 (orange) and scenario TK4 of [1] (yellow), and (b) caused by scenario ECE28 (orange) and scenario SA2 of [1] (yellow). Lower panels: comparison of the inundation areas at MS9 Quepos (c) caused by scenario ETK21 (orange) and scenario TK4 of [1] (yellow), and (d) caused by scenario ECE28 (orange) and scenario SA2 of [1] (yellow).
Regarding MS9 Quepos, the overall inundation area was smaller for both the Tonga and Colombia new scenarios than for previous scenarios (Figure 11c and Figure 11d, respectively). In the mangrove, the maximum inundation distance decreased by about 400 m. However, this distance increased about 200 m in the city center, leading to the update of the tsunami evacuation map and plan.
Puntarenas (MS7) is the most populated city on the Costa Rica Pacific Coast, located in a sand bar that is 7.5 km long, with a maximum width of 600 m and a minimum of 70 m. The SA2 scenario of [1] was the one with the highest amplitudes for Puntarenas, with maximum flow depths of 4.29 m. However, only 1.7% of the grid had flow depths over 3 m for that scenario (Figure 12b). The maximum flow depths and minimum arrival times were obtained along the only terrestrial access to the city. Consequently, vertical evacuation was decided for the city of Puntarenas. In the first evacuation map elaborated, three buildings were designated as vertical assembly points, together with four horizontal assembly points: locations at the ground level inside the city but outside the inundation area. Those assembly points were not enough to host the entire population and visitors within the inundation area, but as there are many two-story houses, the inhabitants can evacuate to the second floors of their houses, and the visitors can evacuate to the upper floors of their hotels.
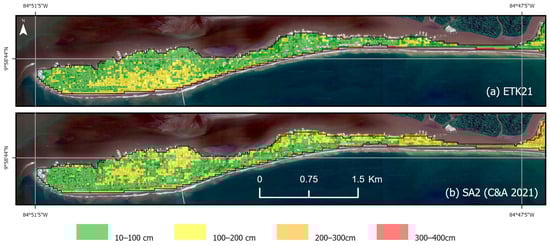
Figure 12.
Maximum joint flow depths in Puntarenas in centimeters for (a) scenarios modeled here and (b) the scenarios in [1].
In this work, the ETK21 scenario had similar maximum flow depths to the SA2 scenario. Now only 1% of the grid has flow depths over 3 m (Figure 12a), but two of the former horizontal assembly points became inundated with flow depths of 2 m, making it necessary to create new assembly points and thus a new evacuation map. Yet, evacuation at the second-floor levels of houses is still possible in most of the city.
Tsunami evacuation maps are not static tools on tsunami preparedness. They should be constantly updated as new bathymetry is surveyed, new information on tsunami sources is published and population changes are expected. The new scenarios considered here confirmed the importance of constant review and updating if needed.
4.5. Implications for Costa Rica Tsunami Warning
The results of [1] showed that the tsunami potential from local sources for the Pacific coast of Costa Rica is moderate and that the largest tsunami wave heights and inundation distances are expected to be from non-local sources. However, the regional scenarios considered in [1] were more threatening than the distant scenarios. With the scenarios considered here, that relation is reversed and distant tsunamis became the most dangerous.
This is a threat reduction relative to previous regional scenarios, considering that arrival times from the highest-amplitude regional scenario are less than 2 h for the south Pacific coast, while distant scenarios remain the dominant hazard but with longer warning times.
5. Conclusions
Here we modeled tsunami propagation and inundation from 28 seismic scenarios defined by experts on the subduction zones of Tonga–Kermadec and Colombia–Ecuador. Results from a previous tsunami hazard assessment for the Costa Rica Pacific Coast showed that those subduction zones represented a larger tsunami threat for the country, larger than the threat from local sources.
In general, the maximum nearshore tsunami wave heights and inundation areas from the regional scenarios considered here were smaller than those obtained from regional scenarios of the previous study. In contrast, the maximum nearshore tsunami wave heights and the inundation areas from the distant scenarios considered here were larger than those obtained from all the scenarios considered in the previous study. To estimate the inundation areas, tsunami inundation was modeled for 13 sites where high-resolution coastal bathymetry allowed it.
The results obtained from the modeling of those scenarios implied the necessity of updating tsunami evacuation maps, plans and procedures for many coastal communities in Costa Rica, using refined and more trustable information.
The larger inundation areas obtained from the distant scenarios modeled here did not require major changes to tsunami evacuation procedures, due to the large arrival time of more than 14 h. For regional scenarios, the reduction of the inundation area simplified evacuation procedures for most communities.
The modeling performed here was performed with the best available bathymetric and topographic data for each model site. The scenarios modeled, defined at Experts Meetings for both subduction zones, are the most trustable characterizations of tsunami scenarios from those subduction zones to date because they were developed recently by experts on those zones. Also, as the aim of both meetings was for those scenarios to be used to develop tsunami evacuation maps; they were developed as maximum credible scenarios, accounting for uncertainties. Therefore, the tsunami threat results presented here were obtained with the best available information from regional and distant seismic sources for the Costa Rica Pacific Coast currently.
Nevertheless, an updated assessment for local tsunami sources is desirable, including heterogeneous slip distribution and landslides, as they might have larger tsunami wave heights than tsunamis from seismic sources.
Supplementary Materials
The following supporting information can be downloaded at https://www.mdpi.com/article/10.3390/geosciences15100396/s1: 1. Seismic and fault parameters; 2. Maximum nearshore tsunami heights for all scenarios; 3. Maximum inundation areas for model sites MS2–14; and 4. Grid Extents. The Supplementary Materials include the following figures: Figure S1: Maximum tsunami wave heights in MS1 caused by scenarios (a) ETK10 and (b) ETK15 of the TKSZ; Figure S2: Maximum tsunami wave heights in MS1 caused by scenarios (a) ETK04, (b) ETK13, (c) ETK03, (d) ETK08 and (e) ETK02 of the TKSZ; Figure S3: Maximum tsunami wave heights in MS1 caused by scenarios (a) ETK17, (b) ETK18, (c) ETK09 and (d) ETK16 of the TKSZ; Figure S4: Maximum tsunami wave heights in MS1 caused by scenarios (a) ETK01, (b) ETK20 and (c) ETK19 of the TKSZ; Figure S5: Maximum tsunami wave heights in MS1 caused by scenarios (a) ECE25 and (b) ECE26 of the CESZ; Figure S6: Inundation areas caused in MS2 Culebra Bay by (a) ETK21 and TK4 of the TKSZ and (b) ETK28 and CE2 of the CESZ; Figure S7: Inundation areas caused in MS4 Tamarindo by (a) ETK21 and TK4 of the TKSZ and (b) ETK28 and CE2 of the CESZ; Figure S8: Inundation areas caused in MS5 Samara by (a) ETK21 and TK4 of the TKSZ and (b) ETK28 and CE2 of the CESZ; Figure S9: Inundation areas caused in MS6 Tambor by (a) ETK21 and TK4 of the TKSZ and (b) ETK28 and CE2 of the CESZ; Figure S10: Inundation areas caused in MS8 Jaco by (a) ETK21 and TK4 of the TKSZ and (b) ETK28 and CE2 of the CESZ. Table S1. List of ComMIT precalculated unit sources employed for sections of the Tonga-Kermadec scenarios. Magnitudes were calculated using an estimated shear modulus of the Earth crust μ = 4.0 × 10¹¹ dynes/cm2. Modified from UNESCO-IOC (2020). Table S2. List of seismic parameters employed in the Colombia-Ecuador rupture planes. Magnitudes were calculated using an estimated shear modulus of the Earth crust μ = 4.0 × 10¹¹ dynes/cm2. Modified from UNESCO-IOC (2021). Table S3. Grid extents for the model sites employed.
Author Contributions
Conceptualization, S.C.-B. and F.R.-C.; methodology, S.C.-B.; software, S.C.-B., F.R.-C. and A.M.-G.; validation S.C.-B., F.R.-C., K.E.-H. and A.M.-G.; formal analysis, S.C.-B.; data curation, S.C.-B. and F.R.-C.; writing—original draft preparation, S.C.-B.; writing—review and editing, S.C.-B., F.R.-C., K.E.-H. and A.M.-G.; visualization, K.E.-H. and A.M.-G.; supervision, S.C.-B.; project administration, S.C.-B.; funding acquisition, S.C.-B. All authors have read and agreed to the published version of the manuscript.
Funding
This research was funded by a Cooperation Agreement between the National University (UNA) and the National Commission for Risk Prevention and Emergency Response (CNE).
Data Availability Statement
The datasets presented in this article are not readily available because the bathymetric data has several owners and restricted use. Requests to access the datasets should be directed to the corresponding author. The grid extents for all the model sites are available in the Supplementary Materials. ComMIT setup files and inundation extent files are available to share.
Acknowledgments
The authors would like to acknowledge the support of Alejandra Acuña in digitalizing the marigram of the 1976 tsunami and in correcting Figure 11.
Conflicts of Interest
The authors declare no conflicts of interest. The funders had no role in the design of the study; in the collection, analyses, or interpretation of data; in the writing of the manuscript; or in the decision to publish the results.
Abbreviations
The following abbreviations are used in this manuscript:
| UNA | Universidad Nacional Costa Rica–National University Costa Rica |
| CNE | National Commission on Risk Prevention and Emergency Response |
| TKSZ | Tonga–Kermadec Subduction Zone |
| CESZ | Colombia–Ecuador Subduction Zone |
| ComMIT | Community Model Interface for Tsunami |
| MOST | Method of Splitting Tsunami model |
| ETK | Experts Meeting Tonga Kermadec Scenario |
| ECE | Experts Meeting Colombia Ecuador Scenario |
| MS | Model Site |
References
- Chacón-Barrantes, S.; Arozarena-Llopis, I. A First Estimation of Tsunami Hazard of the Pacific Coast of Costa Rica from Local and Distant Seismogenic Sources. Ocean. Dyn. 2021, 71, 793–810. [Google Scholar] [CrossRef]
- UNESCO-IOC Research. Development and Implementation Plan for the Ocean Decade Tsunami Programme; UNESCO-IOC: Paris, France, 2023. [Google Scholar]
- UNESCO-IOC Preparing for Community Tsunami Evacuations. Intergovernmental Oceanographic Commission; Manuals and Guides 82; UNESCO-IOC: Paris, France, 2020; 298p. [Google Scholar]
- Pujara, N.; Liu, P.L.F.; Yeh, H. The Swash of Solitary Waves on a Plane Beach: Flow Evolution, Bed Shear Stress and Run-Up. J. Fluid. Mech. 2015, 779, 556–597. [Google Scholar] [CrossRef]
- Synolakis, C.E. Green’s Law and the Evolution of Solitary Wave. Phys. Fluids A 1991, 3, 490–491. [Google Scholar] [CrossRef]
- Synolakis, C.E.; Skjelbreia, J.E. Evolution of Maximum Amplitude of Solitary Waves on Plane Beaches. J. Waterw. Port. Coast. Ocean. Engng 1993, 119, 323–342. [Google Scholar] [CrossRef]
- UNESCO/IOC. Standard Guidelines for the Tsunami Ready Recognition; Manual and Guides 74; UNESCO-IOC: Paris, France, 2022; 62p. [Google Scholar]
- Chacón-Barrantes, S.E.; Murillo-Gutiérrez, A.; Rivera-Cerdas, F. Catálogo de Tsunamis Históricos de Costa Rica Hasta El 2021, 1st ed.; EDUNA: Heredia, Costa Rica, 2021. [Google Scholar]
- Porras, H.; Chacón-Barrantes, S.E.; Murillo-Gutiérrez, A.; Rivera-Cerdas, F. Tsunami de Las Islas Kermadec Del 4 de Marzo Del 2021: Registros, Modelado Numérico y Atención del Evento Para Costa Rica. Rev. Cienc. Mar. Costeras 2022, 14, 31–49. [Google Scholar] [CrossRef]
- Chacón-Barrantes, S.E.; Rivera-Cerdas, F.; Murillo-Gutiérrez, A. Impact of the Tsunami Caused by the Hunga Tonga–Hunga Ha’apai Eruption in Costa Rica on 15 January 2022. Bull. Volcanol. 2023, 85, 36. [Google Scholar] [CrossRef]
- Fernández-Arce, M.; Havskov, J.; Atakan, K. Destructive Tsunamis and Tsunami Warning in Central America. Sci. Tsunami 1999, 17, 173–185. [Google Scholar]
- Fernández-Arce, M.; Molina, E.; Havskov, J. Tsunamis and Tsunami Hazards in Central America. Nat. Hazards 2000, 22, 91–116. [Google Scholar] [CrossRef]
- Fernández-Arce, M.; Alvarado-Delgado, G.E. Tsunamis and Tsunami Prepardness in Costa Rica, Central America. ISET J. Earthq. Technol. 2005, 42, 203–212. [Google Scholar] [CrossRef]
- Fernández-Arce, M.; Peraldo-Huertas, G.; Flores-Fallas, R.; Rojas, W. Tsunamis En Centroamerica. Tecnol. Marcha 1993, 12, 17–30. [Google Scholar]
- Yamanaka, Y.; Tanioka, Y. Study on the 1906 Colombia-Ecuador Megathrust Earthquake Based on Tsunami Waveforms Observed at Tide Gauges: Release Variation of Accumulated Slip Deficits in the Source Area. J. Geophys. Res. Solid Earth 2021, 126, e2020JB021375. [Google Scholar] [CrossRef]
- Rojas, W.; Alvarado, G.E. Marco Geológico y Tectónico de La Isla del Coco y La Región Marítima Circunvecina, Costa Rica. Rev. Biol. Trop. 2012, 60, 15–32. [Google Scholar] [CrossRef]
- Chacón-Barrantes, S.; Gutiérrez-Echeverría, A. Tsunamis Recorded in Tide Gauges at Costa Rica Pacific Coast and Their Numerical Modeling. Nat. Hazards 2017, 89, 295–311. [Google Scholar] [CrossRef]
- UNESCO-IOC. Experts Meeting on Tsunami Sources, Hazards, Risk and Uncertainties Associated with the Tonga-Kermadec Subduction Zone; Workshop Report No.289; UNESCO-IOC: Paris, France, 2020; 49p. [Google Scholar]
- UNESCO-IOC. Tsunami Sources, Hazards, Risk and Uncertainties Associated with the Colombia-Ecuador Subduction Zone; Workshop Report No.295; UNESCO-IOC: Paris, France, 2021; 37p. [Google Scholar]
- Wallace, L.M.; McCaffrey, R.; Beavan, J.; Ellis, S. Rapid Microplate Rotations and Backarc Rifting at the Transition between Collision and Subduction. Geology 2005, 33, 857. [Google Scholar] [CrossRef]
- Power, W.; Wallace, L.; Wang, X.; Reyners, M. Tsunami Hazard Posed to New Zealand by the Kermadec and Southern New Hebrides Subduction Margins: An Assessment Based on Plate Boundary Kinematics, Interseismic Coupling, and Historical Seismicity. Pure Appl. Geophys. 2012, 169, 1–36. [Google Scholar] [CrossRef]
- Titov, V.V.; Moore, C.; Greenslade, D.J.M.; Pattiaratchi, C.; Badal, R.; Synolakis, C.E.; Kanoglu, U. A New Tool for Inundation Modeling: Community Modeling Interface for Tsunamis (ComMIT). Pure Appl. Geophys. 2011, 168, 2121–2131. [Google Scholar] [CrossRef]
- Okada, Y. Surface Deformation Due to Shear and Tensile Faults in a Half-Space. Bull. Seismol. Soc. Am. 1985, 75, 1135–1154. [Google Scholar] [CrossRef]
- Titov, V.V.; González, F.I. Implementation and Testing of the Method of Splitting Tsunami (MOST) Model; No. 1927; Pacific Marine Environmental Laboratory: Seattle, WA, USA, 1997.
- NTHMP. Proceedings and Results of the 2011 Nthmp Model Benchmarking Workshop; NOAA Special Rep: Silver Spring, ML, USA, 2012.
- Synolakis, C.E.; Bernard, E.N.; Titov, V.V.; Kânoğlu, U.; González, F.I. Validation and Verification of Tsunami Numerical Models. Pure Appl. Geophys. 2008, 165, 2197–2228. [Google Scholar] [CrossRef]
- IOC; IHO; BODC. Centenary Edition of the GEBCO Digital Atlas, Published on CD-ROM on Behalf of the Intergovernmental Oceanographic Commission and the International Hydrographic Organization as part of the General Bathymetric Chart of the Oceans. World Data Center for Climate (WDCC) at DKRZ. 2003. Available online: https://hdl.handle.net/21.14106/0c6b3dbdcf0b228e372d4b716b6574d495f5887a (accessed on 1 October 2025).
- Chacón-Barrantes, S. The 2017 México Tsunami Record, Numerical Modeling and Threat Assessment in Costa Rica. Pure Appl. Geophys. 2018, 175, 1939–1950. [Google Scholar] [CrossRef]
- Borrero, J.C.; Greer, S.D. Comparison of the 2010 Chile and 2011 Japan Tsunamis in the Far Field. Pure Appl. Geophys. 2013, 170, 1249–1274. [Google Scholar] [CrossRef]
- Kim, G.H.; Jin, S.; Hyun, S.G.; Yoon, S.B. Resonance of 2011 East Japan Tsunami over Continental Shelf along Ibaraki Coast of Japan. J. Coast. Res. 2016, 75, 1137–1141. [Google Scholar] [CrossRef]
- Melgar, D.; Ruiz-Angulo, A. Long-Lived Tsunami Edge Waves and Shelf Resonance From the M8.2 Tehuantepec Earthquake. Geophys. Res. Lett. 2018, 45, 12414–12421. [Google Scholar] [CrossRef]
- Yeh, H.; Liu, P.; Briggs, M.; Synolakis, C. Propagation and Amplification of Tsunamis at Coastal Boundaries. Nature 1994, 372, 353–355. [Google Scholar] [CrossRef]
Disclaimer/Publisher’s Note: The statements, opinions and data contained in all publications are solely those of the individual author(s) and contributor(s) and not of MDPI and/or the editor(s). MDPI and/or the editor(s) disclaim responsibility for any injury to people or property resulting from any ideas, methods, instructions or products referred to in the content. |
© 2025 by the authors. Licensee MDPI, Basel, Switzerland. This article is an open access article distributed under the terms and conditions of the Creative Commons Attribution (CC BY) license (https://creativecommons.org/licenses/by/4.0/).