Article

On the Ionosphere–Atmosphere–Lithosphere Coupling During the 9 November 2022 Italian Earthquake

by
Mirko Piersanti
1,2,3,*,†,
Giulia D’Angelo
1,2,†,
Dario Recchiuti
2,4,†,
Fabio Lepreti
5,†,
Paola Cusano
6,†,
Enza De Lauro
7,†,
Vincenzo Carbone
5,†,
Pietro Ubertini
2,† and
Mariarosaria Falanga
6,7,†
1
Department of Physical and Chemical Sciences, University of L’Aquila, Via Vetoio, 67100 L’Aquila, Italy
2
National Institue of Astrophysics, IAPS, Via del Fosso del Cavaliere, 00133 Rome, Italy
3
Istituto Nazionale di Fisica Nucleare, Sezione di Roma “Tor Vergata”, Via della Ricerca Scientifica, 00100 Rome, Italy
4
Department of Physics, University of Trento, Via Sommarive, 38123 Trento, Italy
5
Physics Department, University of Calabria, Ponte Pietro Bucci, 87036 Cosenza, Italy
6
Istituto Nazionale di Geofisica e Vulcanologia, Sezione di Napoli—Osservatorio Vesuviano, Via Diocleziano, 80125 Naples, Italy
7
Department of Information and Electric Engineering and Applied Mathematics, University of Salerno, Giovanni Paolo II, 132, 84084 Salerno, Italy
*
Author to whom correspondence should be addressed.
These authors contributed equally to this work.
Geosciences 2025, 15(1), 22; https://doi.org/10.3390/geosciences15010022
Submission received: 18 November 2024 / Revised: 26 December 2024 / Accepted: 7 January 2025 / Published: 10 January 2025

Abstract

:
In the last decades, the scientific community has been focused on searching earthquake signatures in the Earth’s atmosphere, ionosphere, and magnetosphere. This work investigates an offshore Mw 5.5 earthquake that struck off the Marche region’s coast (Italy) on 9 November 2022, with a focus on the potential coupling between the Earth’s lithosphere, atmosphere, and magnetosphere triggered by the seismic event. Analysis of atmospheric temperature data from ERA5 reveals a significant increase in potential energy (Ep) at the earthquake’s epicenter, consistent with the generation of Atmospheric Gravity Waves (AGWs). This finding is further corroborated by the MILC analytical model, which accurately simulates the observed Ep trends (within 5%), supporting the theory of Lithosphere–Atmosphere–Ionosphere–Magnetosphere coupling. The study also examines the vertical Total Electron Content (vTEC) and finds notable fluctuations at the epicenter, exhibiting periodicities (7–12 min) characteristic of AGWs and traveling ionospheric disturbances. The correlation between ERA5 observations and MILC model predictions, particularly in temperature deviations and Ep distributions, strengthens the hypothesis that earthquake-generated AGWs impact atmospheric conditions at high altitudes, leading to observable ionospheric perturbations. This research contributes to a deeper understanding of Lithosphere–Atmosphere–Ionosphere–Magnetosphere coupling mechanisms and the potential for developing reliable earthquake prediction tools.

1. Introduction

In the recent years, the scientific community’s interest in predicting earthquakes (EQs) over the short term has surged. This surge is linked to the identification of certain atmospheric and ionospheric anomalies that show a statistical relationship with seismic events as a counterpart to anomalies within the Earth’s crust. Notably, changes in the density of ionospheric plasma, noted at both the lower and upper levels, hold significant potential [1,2]. As a result, numerous theories have been put forward to elucidate the interactions among the Earth’s crust, the atmosphere, and the ionosphere [3,4,5,6]. The initial theory posited that radon emissions near the earthquake’s epicenter (EE) could disrupt atmospheric conductivity. This disruption might lead to alterations in the atmospheric electric field, which would, in turn, modify the ionospheric plasma density profile [7,8,9]. The second theory suggested that oscillations near EE could produce atmospheric Acoustic Gravity Waves (AGWs). The latter have the potential to ascend and create disturbances in the ionosphere [10,11,12,13,14]. The last theory proposed that electrostatic effects originating in the Earth’s crust could permeate the lower atmosphere, influencing the ionization state of the ionosphere [15,16].
Due to the absence of comprehensive experimental evidence to test these theories, the intricacies of how the Earth’s crust, atmosphere, and ionosphere interact are still not fully understood [5,17,18]. However, models that focus on the emission of AGWs seem to hold the most promise for shedding light on this interaction, particularly in relation to seismic activities. The validity of the AGW model is bolstered by various studies that have examined changes in atmospheric pressure, magnetic field, and terrestrial movements before and during earthquakes (e.g., [1,4,6,10,12,19]). For example, the research by Korepanov et al. [20] indicated that AGWs could be a plausible mechanism for the interaction between seismic activity and the ionosphere as suggested by studies of surface atmospheric pressure and magnetic field fluctuations during weather events. In a similar vein, an analysis of the 2004 Niigata-Chuetsu earthquake using wavelet methods revealed increased fluctuations in the 10–100 min range in both surface atmospheric pressure and magnetic field data. These fluctuations fall within the AGW spectrum and were found to have disturbed the lower ionosphere [21].
Moreover, research on earthquakes such as the 2007 Niigata-Chuetsu Oki and 2008 Iwate-Miyagi events has demonstrated that when the lower ionosphere experiences disturbances, there is a noticeable increase in ground movements within the frequency ranges associated with AGWs [22]. Furthermore, detailed examinations of the Earth’s crust movements during the 2011 Tohoku earthquake, which utilized Global Positioning System (GPS) data, revealed clear synchronicity with shifts in the very-low-frequency/extreme-low-frequency bands of sub-ionospheric signals and ultra-low-frequency magnetic fields [23,24,25,26].
Building upon these prior investigations, Piersanti et al. [6] recently introduced a one-dimensional analytical model of Lithosphere–Atmosphere–Ionosphere–Magnetosphere coupling. This model aims to accurately interpret ground and satellite observations both preceding and following seismic events. Central to the model is the generation of an AGW, which, as it propagates from EE through the atmosphere [14], mechanically interacts with the ionosphere, inducing a localized instability in plasma distribution via a pressure gradient [27]. Such results were confirmed also by numerical simulation using nonlinear shallow water applied to atmospheric disturbances generated by strong seismic events in [28], which found that EQ can transmit waves toward the upper atmosphere in the form of a non-vanishing AGW able to reach the ionosphere, generating changes in the local plasma density.
The present paper aims to provide a new piece of evidence regarding the generation of AGW linked to moderate-to-strong earthquakes. The interest is focused on the 9 November 2022 (hereinafter, EQ2022) earthquake that occurred offshore in the Adriatic Sea (Italy). The seismic characterization will provide the geometric and kinematic parameters of the fault, sourcing the whole seismic sequence. The simulation of the static displacement field induced by the empirical trust fault, together with its comparison with experimental ground deformation measurements via GNSS, will be used as an initial constraint for the application of the recently developed MILC model [14]. The latter will provide an altitude map of the simulated temperature profiles to be compared with the evidenced ones. To assess the generation of AGW, the potential energy (EP) will be retrieved.
The manuscript is organized as follows: Section 2 is devoted to the characterization of the seismic event along with the simulation of the static displacement field; all the results relative to the recognized anomalies both in the atmosphere and ionosphere are contained in Section 3. A detailed discussion of the achieved results and their potential in the comprehension of the LAIC characteristics is included in Section 4.

2. The 9 November 2022 Italian Earthquake

On 9 November 2022, at 06:07 UT, an earthquake with a local magnitude (ML) of 5.7 and a moment magnitude (Mw) of 5.5 struck approximately 30 km off the coast of the Marche region in the Adriatic Sea (Figure 1a), followed by another ML 5.2 event approximately one minute later. Both events occurred along the Apennine compressional front, at a depth of approximately 5–8 km. The seismic sequence included over 400 aftershocks in the first week, 13 of which had ML 3.5 [29]. The area affected by the seismic sequence is characterized by a complex geological structure, influenced by the convergence between the Adriatic and European plates ([30] and references therein). The Apennine Mountain range represents the main tectonic structure, with buried reverse faults extending beneath the Adriatic Sea. Seismic activity in the area has long been debated due to the buried and blind nature of these faults, which makes their identification and the assessment of their activity difficult [30]. However, historical and instrumental seismicity, including the 2012 Mirandola earthquakes (Mw 5.9 and Mw 6.1) and the sequence under study, highlighted the seismogenic character of this buried fault system ([30] and references therein).
Several studies used a variety of data and methodologies to analyze the seismic sequence, including the location of hypocenters, GNSS investigations [33], and seismological data elaboration [29,30,33]. GNSS measurements have allowed us to identify and model the fault responsible for the seismic sequence. The results indicate the rupture of a reverse fault approximately 15 km long, dipping about 24° towards south-southwest [33]. Seismic data (see an example in Figure 1b) allowed the estimate of the source mechanism (Figure 1c) for this earthquake based upon the classical approach of [34]. The corresponding empirical fault geometry [31] was retrieved from the focal location leading to about 10 × 7 km2 area, dipping 35° towards south–southwest (Figure 1c), which is compatible with that individuated by GNSS measurements.
Pezzo et al. [33] performed the analysis of the magnitude distribution (Gutenberg–Richter law), revealing a relatively high b value (0.94). They interpreted that result as being due to a possible higher proportion of larger-magnitude events in that sequence. However, Spassiani et al. [35] highlighted the need for caution when interpreting this parameter as a precursor because of the high uncertainty in estimating the real-time b value.

Static Displacement Evaluation

The approach of Okada [36] can be adopted when static displacement and strain fields have to be estimated. The main assumptions regard the homogeneity and isotropy of the medium, in which both shear and tensile (both point or finite) faults produce their effects. In the context of a Poissonian half-space, the internal displacement field, caused by a dislocation across a surface, is the linear superposition of displacements due to the strain. Internal deformation field formulas are then derived for shear, tensile, and inflation/deflation sources as a function of the fault length (L), width (W), strike, dip, friction, Young’s modulus (E), and Poisson’s ratio ( σ ).
The briefly described Okada’s approach [36] has been implemented in the Coulomb software developed in the Matlab environment [37]. The software is used to estimate the static displacement generated by earthquakes as well as strains and stresses induced by fault slip, magmatic intrusion, or dike expansion/contraction. These calculations are performed at a certain depth within an isotropic elastic half-space, including the free surface. In that case, a direct comparison with ground deformation measures by GPS, GNSS, or even tiltmeters [38,39] is possible.
The geometrical dimensions of the empirical fault used to estimate the static displacement vectors are listed in Table 1. Moreover, the input conditions to the Coulomb software are reported in the same table along with the seismic moment and net slip. Given the seismic moment M 0 = 3.75 · 10 17 N·m (https://esm-db.eu/, accessed on 12 December 2024), considering the fault’s area (A), the Young modulus (E = 80 GPa), the rigidity ( μ = E / [ 2 ( 1 + σ ) ] ), and the Poisson’s ratio ( σ = 0.25 ), the net slip u = M 0 μ A is estimated to be about 0.17 m.
The simulated displacement field is reported in Figure 1d (black arrows). To validate the modeled field, we compared the values with the GNSS measures, carried out in the area (blue arrows) and reported in the supplementary information of Pezzo et al. [33].
The static displacement calculated in correspondence with the GNSS stations (Figure 1d—red arrows) fits well, in both the direction and order of magnitude, with the observed ones.
Specifically, we performed a χ 2 test, which yields good agreement within alpha = 0.05 with a null hypothesis of Gaussian distribution for the residuals (mean value around 0 mm and standard deviation of 2 mm). Moreover, the direction of the estimated displacement for all the onshore GNSS stations agrees with the observed data within 45° (see Cusano et al. [38]). For the offshore stations, the discrepancy between the modeled and observed directions is significant at about half of the stations. In other words, the onshore locations better constrain the deformation pattern than the offshore ones. Since the offshore GNSS stations are located on industrial platforms, this discrepancy is likely due to the already observed effects such as operations on the platforms, subsidence acting near the coastlines of the Adriatic Sea, together with some nonlinear local effects, etc. [40,41]. Additionally, we attribute the small observed discrepancies to local effects or lateral heterogeneity in the medium not taken into account in the model. In fact, the Okada analytic model considers a homogeneous and isotropic medium without taking into account the discontinuities due to the contact between two surficial geological units, faults, fractures, etc. [38,42]. Anyway, the obtained displacement pattern is in agreement with the compressional regional regime.

3. Co-Seismic Analysis

In the following sections, we perform the coseismic analysis of the atmospheric temperature and ionospheric vTEC to check whether EQ2022 was able to produce perturbations propagating from the lower atmosphere up to the ionosphere.

3.1. Atmospheric Temperature and Acoustic Gravity Waves Evaluation

The atmospheric temperature profiles are obtained from ERA5, which is the fifth generation atmospheric dataset generated by the European Center for Medium-Range Weather Forecasts [43]. This model provides high-resolution global temperature profiles every hour, spanning from near the surface to an altitude of ∼80 km (0.01 hPa) with 137 different pressure levels. These profiles are derived from various observational sources, including satellites, radiosondes, dropsondes, aircraft, and radars [43]. The dataset features a horizontal resolution of 0 . 25 in both longitude and latitude.
In this investigation, we use potential energy ( E P ) as a crucial measure to assess the activity of AGW. This parameter is directly influenced by the vertical temperature profiles of the atmosphere [44,45], which are extracted from ERA5 for the particular event under consideration. We assess the E P values using the methodology outlined by Piersanti et al. [6] and Yang et al. [46,47].
E P [45] is defined as
E P = 1 2 g N 2 T T ¯ 2 ¯
where g = 9.8 m/s2 is the gravitational acceleration (constant with altitude), N is the Brunt-Väisälä frequency, and T is the fluctuation with respect to the background temperature T ¯ . These three variables are functions of altitude z and are derived from the ERA5 profiles. To retrieve T ¯ , we make a 2 km moving average; T is obtained by subtracting T ¯ from the original temperature profile T.
The term T T ¯ 2 ¯ , (a variance), is evaluated within a 2 km thick layer, using the following equation:
T T ¯ 2 ¯ = 1 h m a x h m i n h m i n h m a x T T ¯ 2 d h
where h m a x and h m i n represent the top and bottom altitudes of the layer, respectively.
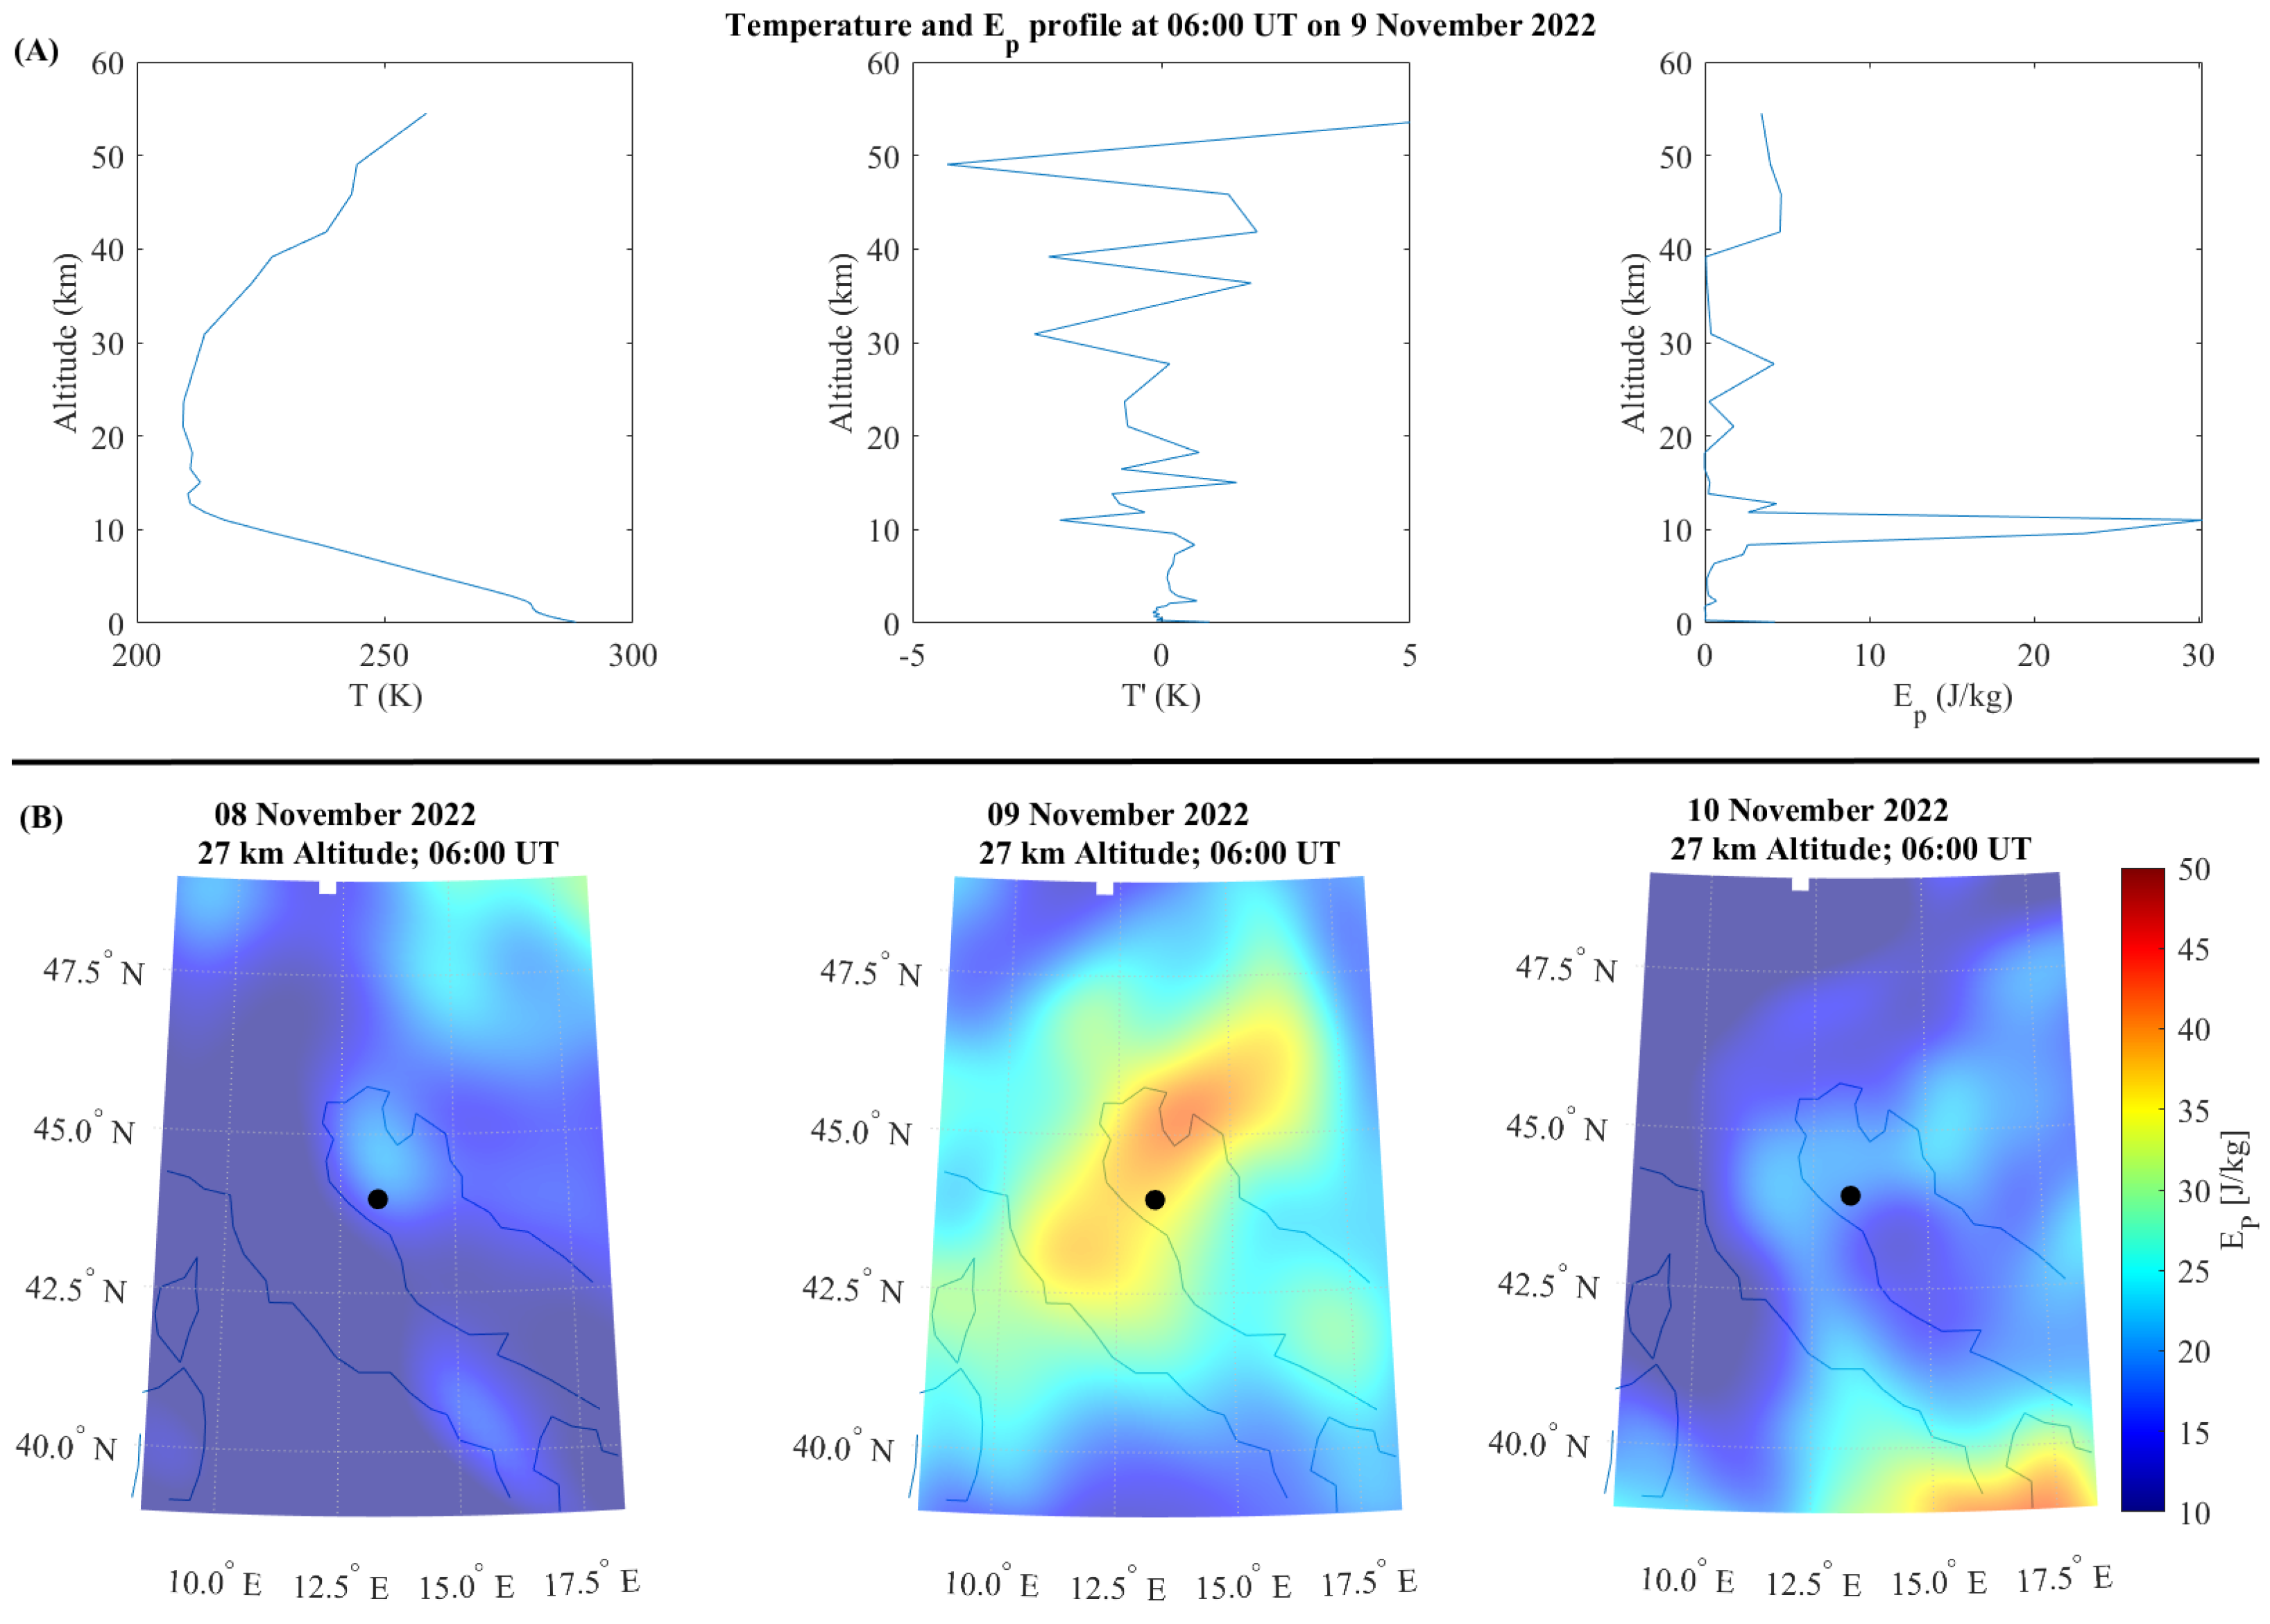
Figure 2 shows the ERA-5 observations for 9 November 2022 at 06:00 UT in a geographical zone close to EE. In particular, Box A in Figure 2 presents the atmospheric temperature T (left panel), T (middle panel) and E P (right panel) as a function of the altitude over the earthquake epicenter. It can be easily seen that an AGW develops close to the EQ occurrence. It is confirmed by several fluctuations between 10 km and 40 km. Four wave crests are distinctly observed in T (central panel) at ∼15.0 km, ∼20 km, ∼29 km, and ∼35.0 km. This pattern indicates the presence of two sinusoidal periods, with vertical wavelengths of approximately 5 km and 9 km, respectively. E P (right panel) displays several enhancements coinciding with fluctuations in the temperature deviation. However, only two peaks in the E P correspond to the smaller wavelength (∼22 km and ∼27 km), suggesting the presence of a single AGW with a wavelength of approximately 5 km. The greatest E P peak at ∼12 km is representative of the tropopause location [6,47]. Figure 2B illustrates the horizontal distribution of E P on 8, 9 and 10 November at 06:00 UT, at a constant altitude of 27 km, corresponding to the peak in the potential energy values recorded between the tropopause (∼12 km) and the stratopause (∼43 km). On 8 November, the area around the epicenter (left panel) is relatively calm. However, on 9 November, there is a noticeable increase in E P (central panel) over the epicenter (black circle) compared to the previous day, indicating wave activity around the epicenter coinciding with the earthquake. As can be easily seen, the day after the EQ occurrence (right panel), the EP behavior comes back to a relatively calm situation.
To determine a causal relationship between the earthquake and the observed disturbances in the atmospheric temperature, we compared T’ observations with predictions from the MILC model [6,14]. Using the methodology of Carbone et al. [14], we specifically analyzed the dispersion relation for wave vectors and frequencies of atmospheric pressure perturbations triggered by EQ2022, based on the parameters listed in Table 2. These parameters included Peak Ground Acceleration (PGA), fault length, strong motion duration ( Δ t ), dominant seismogram frequency ( ω s ), and phase speed of surface waves ( v s ).
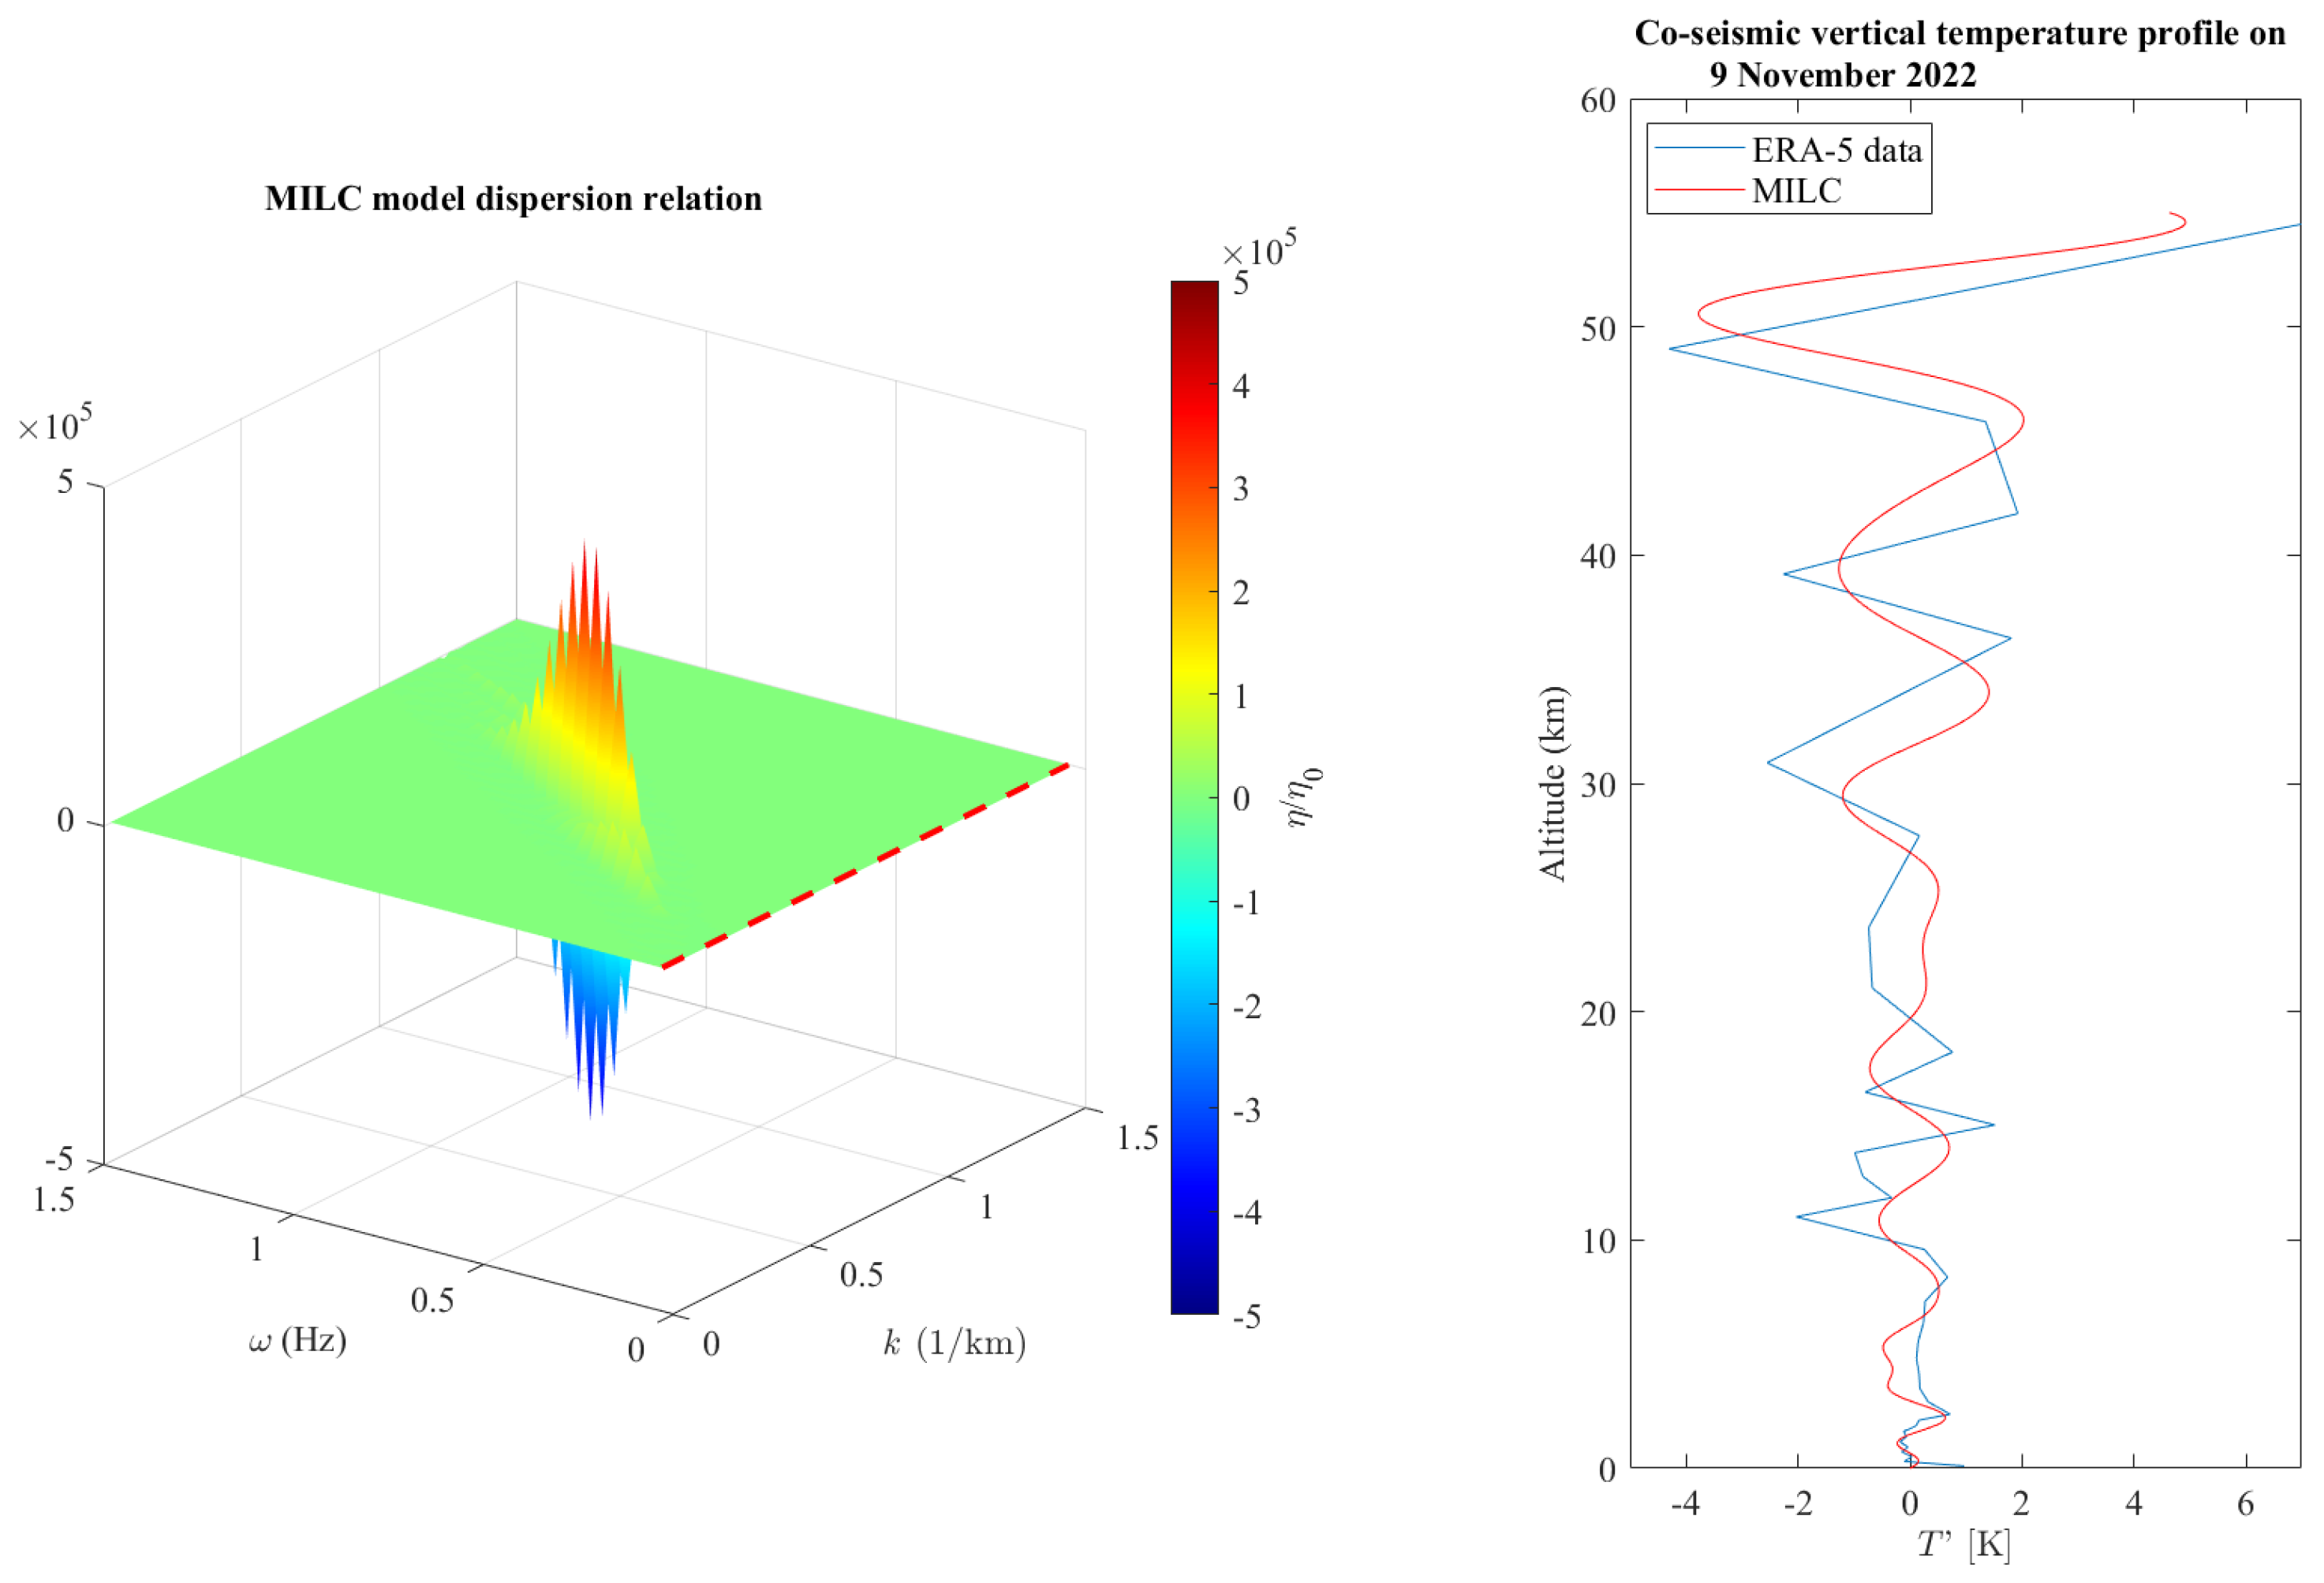
The results are reported in Figure 3. The left panel illustrates that the dispersion relation indicates excitation for wave vectors between 0.8 and 3.5 km, significantly exceeding k s = ω s / v s , and for frequencies ranging from 0.3 to 2.1 Hz, well above ω s . The red dashed line marks the threshold ( ω t = c 0 / h , where h is the temperature scale height and c 0 is the sound speed), determining whether the pressure fluctuations are evanescent or can propagate through the atmosphere up to the ionosphere as a purely vertical AGW (refer to Carbone et al. [14] for more details). The frequency ω t = 0.034 Hz is calculated using the temperature profile from ERA5, shown in Figure 2 (left upper panel). Since all excited modes are above ( ω t ), the MILC model predicts that a purely vertical AGW will propagate to the ionosphere following the earthquake.
The right panel in Figure 3 presents a direct comparison between the modeled (red line) and observed (blue line) T′ profiles. The modeled profile is derived from the estimated pressure fluctuations using the atmospheric gas equation and the three pairs corresponding to the maximum values of η / η 0 in the dispersion relation (left panel), with T′(0) = 0 as the boundary condition (refer to Carbone et al. [14] for more details). It is evident that the MILC model accurately reproduces the observed temperature fluctuations, with a root mean square error (RMSE) of 0.75 K and a correlation coefficient of 0.79. The statistical significance of the differences between the model and observations is evaluated using the χ 2 test, yielding χ 2 = 49.6 . These results suggest that our model can reproduce the observations with over 88 % probability, supporting the seismic origin of the AGW measured over the earthquake epicenter.
Using the results obtained in Figure 1d and the MILC model, we try to model an E P map over the EE. To accomplish this task, we run the MILC model for each grid point in Figure 1d (100 km × 100 km), normalizing the PGA and v s amplitude with the static displacement field estimated by using Coulomb software. Figure 4 reports the results: the left panel shows the observed E P (which is a part of Figure 2B, central panel), while the middle panel represents our modeled E P . It can be easily seen that the MILC model results are strongly consistent with the observations. In fact, as is visible from the right panel in Figure 4, the maximum error made is of the order of 5 % . Such a difference may be due to the discrepancies between the observed and modeled deformation pattern as seen in Figure 1d, which can be ascribed to the local effects or to lateral heterogeneity in the medium [38,40,42].

3.2. The Vertical Total Electron Content

Following the approach proposed by D’Angelo et al. [27], in order to check for possible ionospheric disturbances related to the earthquake occurrence, we process the GPS data from the RING (Rete Integrata Nazionale GPS, http://ring.gm.ingv.it/, accessed on 12 December 2024) network to obtain calibrated vertical Total Electron Content (vTEC) maps over the area struck by the earthquake. Specifically, we process standard daily RINEX files provided by 56 receivers located around the epicenter, whose geographic coordinates are reported in Table 3. By using the technique by Ciraolo et al. [48] and Cesaroni et al. [49], we obtain data that depend neither on the geometry of the GPS constellation nor on the receivers’ network. Furthermore, we use the Fast Iterative Filtering (FIF) technique, recently proposed by Cicone and Zhou [50], to derive the vTEC fluctuations.
The vTEC behavior in Figure 5 shows vTEC maps every 5 min between 05:56 UT and 06:36 UT on 9 November 2022. Plasma wave activity is distinctly observable here, as evidenced by the regular alternation between negative (blue) and positive (red) vTEC fluctuations over the epicenter (black dot). These fluctuations seem to occur every 5 min starting from the time of the earthquake and persist for approximately 30 min. The characteristic mean period of these fluctuations aligns with the typical properties of Acoustic Gravity Waves/Traveling Ionospheric Disturbances (TIDs) ([51], and reference therein).

4. Discussion and Conclusions

This work investigates an offshore Mw 5.5 earthquake that occurred off the Marche region’s coast on 9 November 2022, focusing on identifying potential co-seismic signals in the atmosphere and ionosphere.
The observations outlined earlier indicate that an AGW was introduced into the atmosphere coinciding with EQ2022. As illustrated in the upper panels of Figure 2, an AGW with a wavelength of approximately 5 km propagated through the atmosphere. Additional evidence of wave activity concurrent with the earthquake is provided in the lower panels of Figure 2. These panels show a notable increase in E P over the EE (central panel), in contrast to the relatively calm conditions observed on 8 November and 10 November (left and right panels) in the same region and at the same altitude.
Being that the establishing of a causal link between an AGW and an earthquake is very complex, we applied the MILC analytical model to the atmospheric temperature profile observations. The model results were able to reproduce the atmospheric temperature variation profile with an accuracy of 88% (as concluded by the χ 2 test). In addition, running the MILC model on an estimated displacement field grid induced by the specific seismic fault (Figure 1), we made a direct comparison between the geographical distribution of the map observed and modeled on 9 November 2022 E P . The results (see Figure 4, right panel) show that the MILC model was able to reproduce the E P observations with an error of about 5 % , reinforcing the hypothesis that the AGWs generated by the earthquake influenced atmospheric conditions at high altitudes. It is well known that many other factors, such as meteorological activity in the troposphere, auroral activity, the passage across the solar terminator, solar eclipses, and eruptions (refer to Šindelářová et al. [52] and related references), can also generate AGWs. So, we checked both the atmospheric weather and interplanetary space conditions. Figure 6 shows the SW parameters (Boxes A and B) and the Sym-H index (Box C). The red dashed lines represent the time of the EQ occurrence. Interplanetary magnetic field (IMF) observations are obtained from the DSCOVR satellite (Box A), while solar wind (SW) parameters are obtained from the WIND satellite (Box B). Both spacecraft are located at the first Lagrangian point (∼200 Earth Radii). We use two different satellites because DSCOVR plasma observations are not available for the period under analysis. Unfortunately, almost the same situation happens for the WIND data. Data are freely available on the NASA website (accessed on 12 December 2024). (https://cdaweb.gsfc.nasa.gov/, accessed on 12 December 2024). It can be easily seen that no SW particular structure (like interplanetary shock, coronal mass ejection, corotating interaction region, high speed stream, etc.) is present ∼45 min before the EQ occurrence. This time is the typical delay time for a SW structure when traveling from the satellite position down to the Earth’s magnetopause. In addition, the Sym-H value is stable around 40 nT representing almost quiet conditions.
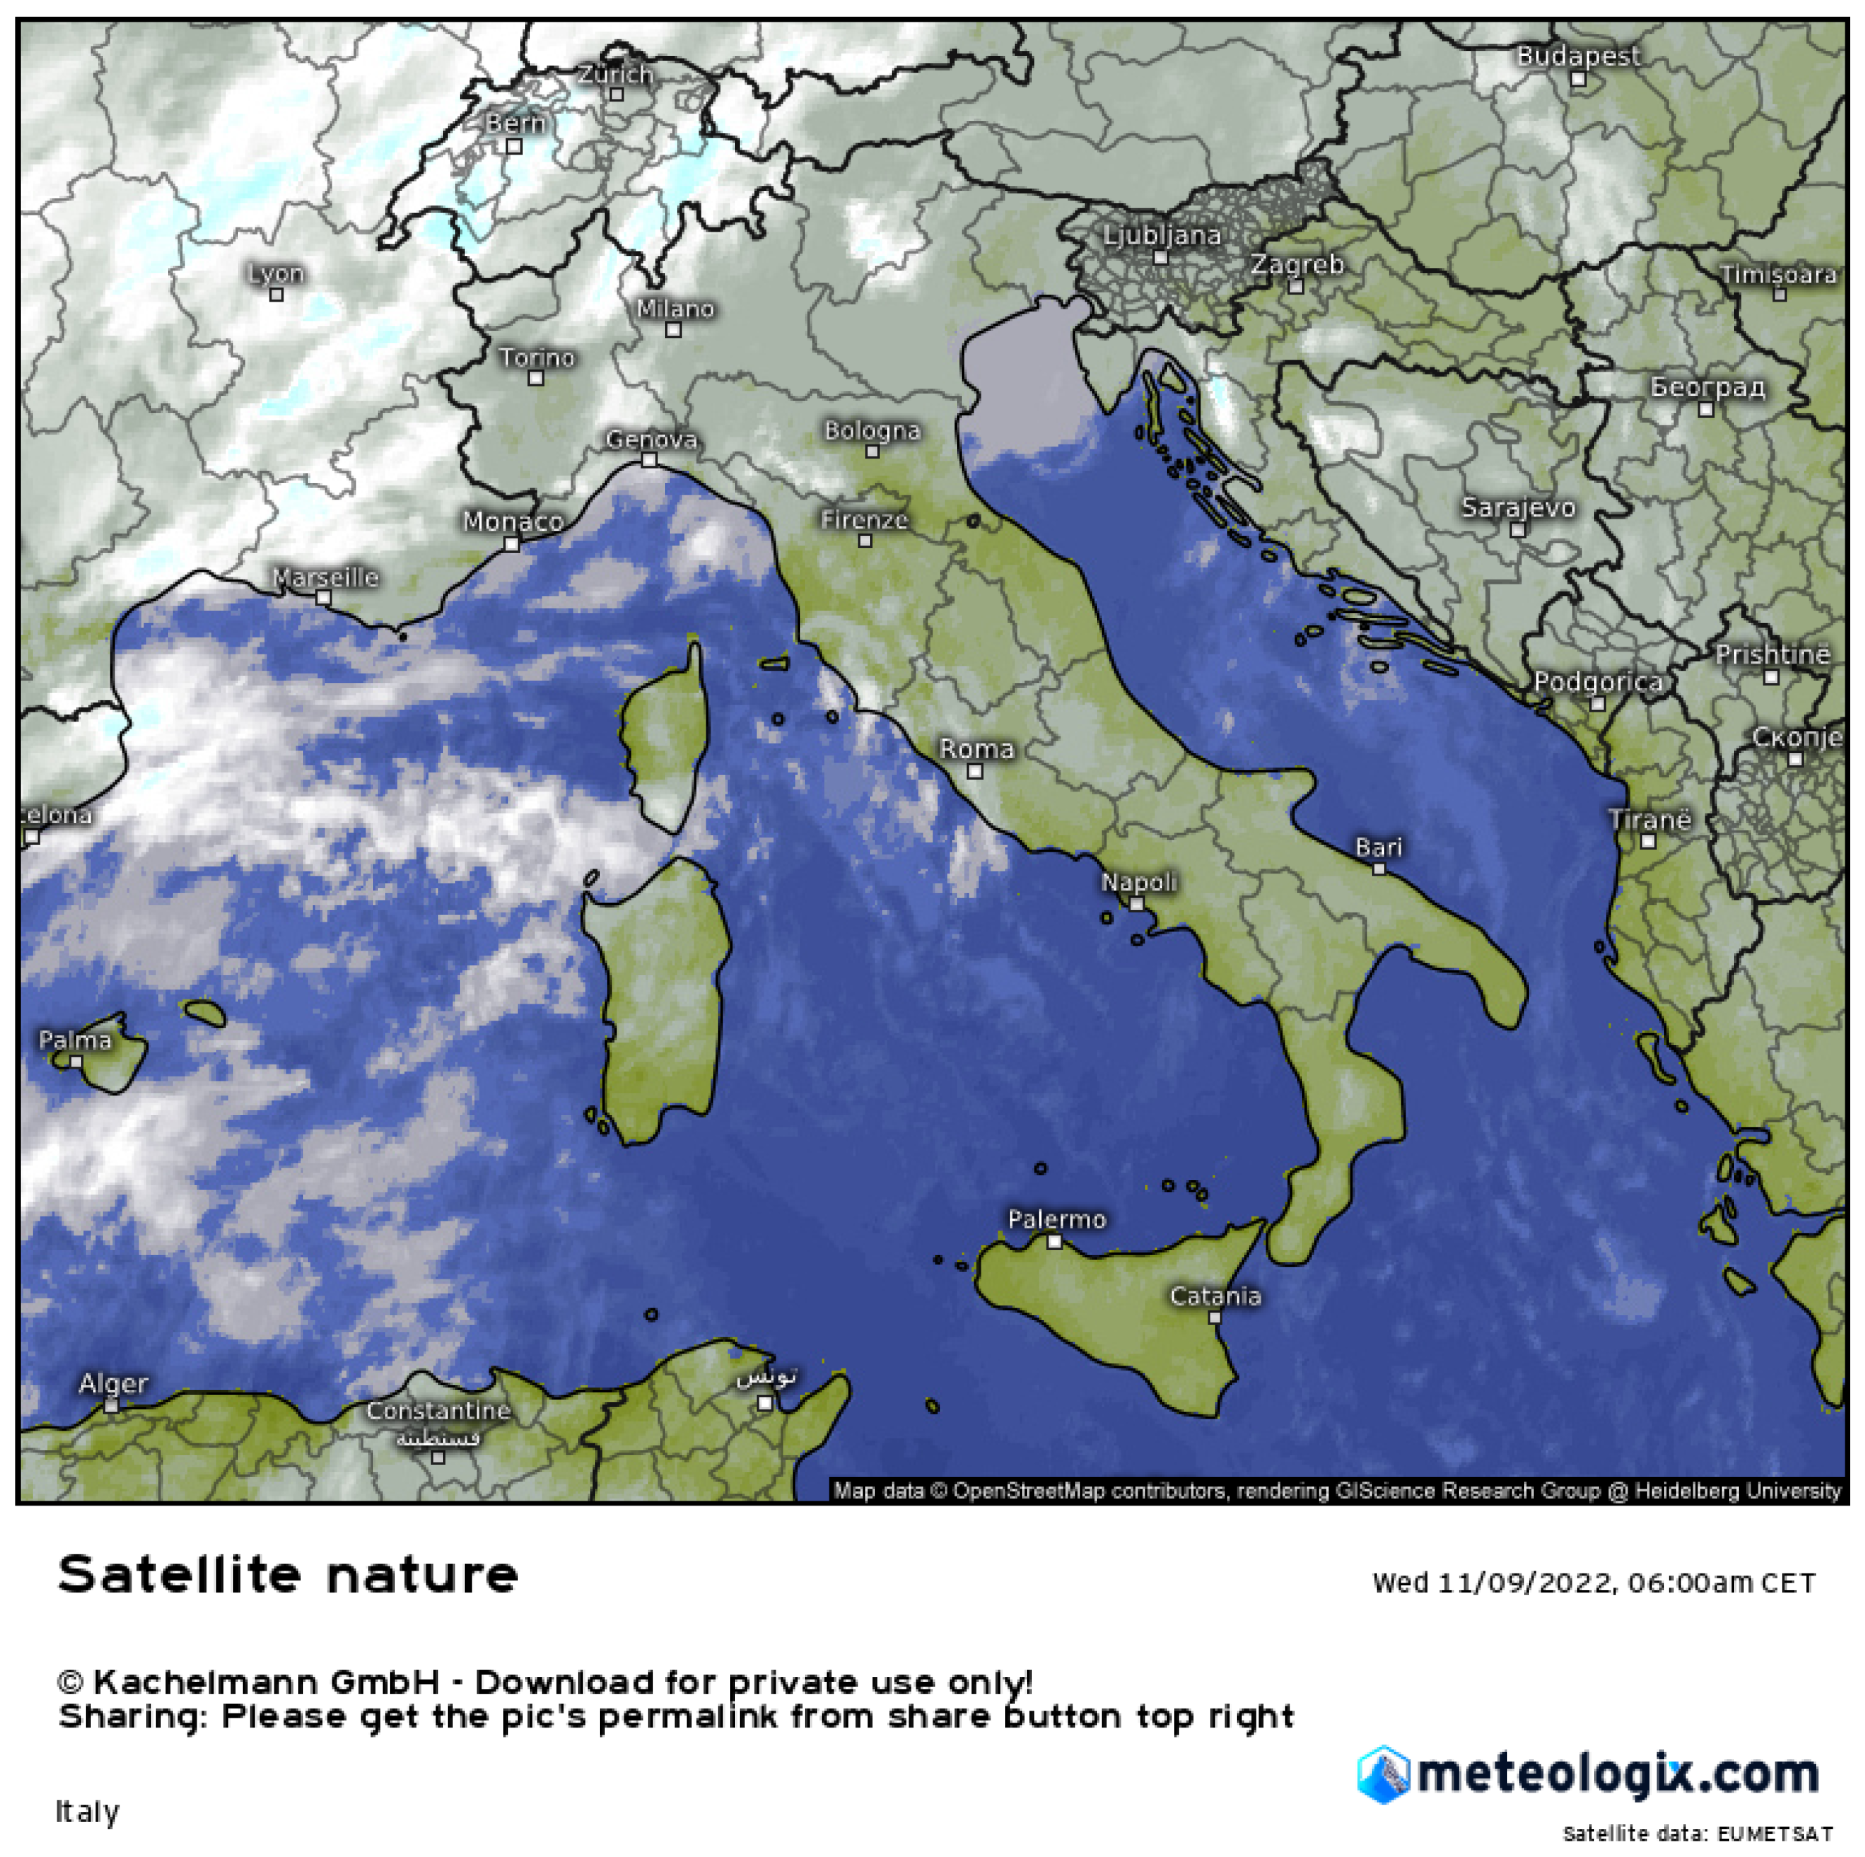
Concerning atmospheric weather conditions, the observations are reported in Figure 7.
It can be easily seen the total absence of any weather system affecting the Marche region at the time of the EQ occurrence. Hence, we are confident that the AGW observed at 06:00 UT is likely linked to the seismic event.
Additionally, the analysis of the vTEC reveals significant fluctuations at the EE with a peculiar period consistent with TIDs driven by AGW [51], suggesting the coupling between the lithosphere and ionosphere, as well.
In conclusion, the findings confirm the presence of a coupling among the lithosphere, atmosphere, and ionosphere at the time of the earthquake. Specifically, the co-seismic analysis reveals that disturbances initiated by the earthquake propagated from the lower atmosphere into the ionosphere, giving strong support to the AGW driving mechanism theory.
Further research could consolidate these results and develop a short-term earthquake prediction system based on the Lithosphere–Atmosphere–Ionosphere coupling. It is important to analyze a greater number of seismic events to verify the robustness of the MILC model, identify any recurring pattern, and integrate different data sources, such as satellite magnetic field and temperature data, to obtain a more complete view of the phenomenon. This study opens new perspectives for understanding the coupling mechanisms between the different layers of the Earth and for developing more reliable earthquake prediction tools.

Author Contributions

M.P., conceptualization, writing—original, draft preparation, formal analysis, and methodology; G.D., methodology; D.R., methodology and validation; F.L., writing—review and editing; P.C., resources and data curation, investigation; E.D.L., writing—review, editing and investigation; V.C., writing—review and editing, and investigation; P.U., writing—review and editing; M.F., conceptualization, writing—review, editing and investigation. All authors have read and agreed to the published version of the manuscript.

Funding

This research was funded by the Ministero dell’Università e della Ricerca with the project PRIN2022 n° 2022ZBBBRY, CUP E53D23004560006.

Data Availability Statement

Seismic signals and the parameters of the 2009 Italian earthquake are provided by EMS (https://esm-db.eu, accessed on 12 December 2024) and by USGS (https://earthquake.usgs.gov/earthquakes/eventpage/us7000infp/executive, accessed on 12 December 2024). The Coulumb software for the static displacement is available online: https://pubs.usgs.gov/of/2011/1060/, accessed on 12 December 2024; ERA-5 data can be retrieved from https://www.ecmwf.int/en/forecasts/datasets/reanalysis-datasets/era5, accessed on 12 December 2024; The Global GNSS Network (GGN) data can be retrieved from https://www.unavco.org/, accessed on 12 December 2024. Weather report maps can be found at (https://meteologix.com/it/satellite/italy/satellite-nature-15min-en/20221109-0500z.html (accessed on 17 December 2024)). Solar wind data, interplanetary field data and Sym-H index data can be freely downloaded at NASA cdaweb site (https://cdaweb.gsfc.nasa.gov/ (accessed on 17 December 2024)).

Acknowledgments

The authors kindly acknowledge N. Papitashvili and J. King at the National Space Science Data Center of the Goddard Space Flight Center for the use permission of solar wind and interplanetary magnetic filed data and the NASA CDAWeb team for making these data available. ERA-5 data are processed and carried out by ECMWF within the Copernicus Climate Change service (C3S), and the data can be retrieved from https://www.ecmwf.int/en/forecasts/datasets/reanalysis-datasets/era5 (accessed on 12 December 2024). The Global GNSS Network (GGN) is operated by UNAVCO, Inc. at the direction of the Jet Propulsion Laboratory (JPL) for the National Aeronautics and Space Administration (NASA) with support from NASA under NSF Cooperative Agreement No. EAR-1261833, and the data can be retrieved from (https://www.unavco.org/, accessed on 12 December 2024). M. Piersanti, G. D’Angelo and P. Ubertini thank the Italian Space Agency for the financial support under the contract ASI “LIMADOU scienza+” n° 2021-18-H1. This study was carried out within the Space It Up project funded by the Italian Space Agency, ASI, and the Ministry of University and Research, MUR, under contract n. 2024-5-E.0—CUP n. I53D24000060005.

Conflicts of Interest

The authors declare no conflicts of interest.

Abbreviations

The following abbreviations are used in this manuscript:
AGWAcoustic Gravity Wave
EEEarthquake epicenter
EQEarthquake
TIDTraveling Ionospheric Disturbance
FIFFast iterative Filtering
GNSSGlobal Navigation Satellite System
MILCMagnetospheric–Ionospheric–Lithospheric Coupling
TECTotal Electron Content
vTECVertical TEC

References

  1. Hayakawa, M.; Kasahara, Y.; Nakamura, T.; Muto, F.; Horie, T.; Maekawa, S.; Hobara, Y.; Rozhnoi, A.; Solovieva, M.; Molchanov, O. A statistical study on the correlation between lower ionospheric perturbations as seen by subionospheric VLF/LF propagation and earthquakes. J. Geophys. Res. Space Phys. 2010, 115, A09305. [Google Scholar] [CrossRef]
  2. Liu, J. Earthquake precursors observed in the ionospheric F-region. In Electromagnetic Phenomena Associated with Earthquakes; Transworld Research Network: Trivandrum, India, 2009; pp. 187–204. [Google Scholar]
  3. Hayakawa, M. Earthquake Prediction with Radio Techniques; John Wiley & Sons: Hoboken, NJ, USA, 2015. [Google Scholar] [CrossRef]
  4. Molchanov, O.; Hayakawa, M. Subionospheric VLF signal perturbations possibly related to earthquakes. J. Geophys. Res. Space Phys. 1998, 103, 17489–17504. [Google Scholar] [CrossRef]
  5. Pulinets, S.; Boyarchuk, K. Ionospheric Precursors of Earthquakes; Springer Science & Business Media: Cham, The Netherlands, 2004. [Google Scholar]
  6. Piersanti, M.; Materassi, M.; Battiston, R.; Carbone, V.; Cicone, A.; D’Angelo, G.; Diego, P.; Ubertini, P. Magnetospheric–Ionospheric–Lithospheric Coupling Model. 1: Observations During the 5 August 2018 Bayan Earthquake. Remote Sens. 2020, 12, 3299. [Google Scholar] [CrossRef]
  7. Pulinets, S.; Ouzounov, D. Lithosphere–Atmosphere–Ionosphere Coupling (LAIC) model—An unified concept for earthquake precursors validation. J. Asian Earth Sci. 2011, 41, 371–382. [Google Scholar] [CrossRef]
  8. Pulinets, S.; Ouzounov, D.; Karelin, A.; Davidenko, D. Physical bases of the generation of short-term earthquake precursors: A complex model of ionization-induced geophysical processes in the lithosphere-atmosphere-ionosphere-magnetosphere system. Geomagn. Aeron. 2015, 55, 521–538. [Google Scholar] [CrossRef]
  9. Sorokin, V.; Yaschenko, A.; Hayakawa, M. Formation mechanism of the lower-ionospheric disturbances by the atmosphere electric current over a seismic region. J. Atmos. Sol. Terr. Phys. 2006, 68, 1260–1268. [Google Scholar] [CrossRef]
  10. Hayakawa, M.; Kasahara, Y.; Nakamura, T.; Hobara, Y.; Rozhnoi, A.; Solovieva, M.; Molchanov, O.; Korepanov, V. Atmospheric gravity waves as a possible candidate for seismo-ionospheric perturbations. J. Atmos. Electr. 2011, 31, 129–140. [Google Scholar] [CrossRef]
  11. Miyaki, K.; Hayakawa, M.; Molchanov, O. The role of gravity waves in the lithosphere-ionosphere coupling, as revealed from the subionospheric LF propagation data. In Seismo Electromagnetics: Lithosphere-Atmosphere-Ionosphere Coupling; Terrapub: Tokyo, Japan, 2002; pp. 229–232. [Google Scholar]
  12. Molchanov, O.; Hayakawa, M.; Miyaki, K. VLF/LF sounding of the lower ionosphere to study the role of atmospheric oscillations in the lithosphere-ionosphere coupling. Adv. Polar Up. Atmos. Res. 2001, 15, 146–158. [Google Scholar]
  13. Muto, F.; Kasahara, Y.; Hobara, Y.; Hayakawa, M.; Rozhnoi, A.; Solovieva, M.; Molchanov, O. Further study on the role of atmospheric gravity waves on the seismo-ionospheric perturbations as detected by subionospheric VLF/LF propagation. Nat. Hazards Earth Syst. Sci. 2009, 9, 1111–1118. [Google Scholar] [CrossRef]
  14. Carbone, V.; Piersanti, M.; Materassi, M.; Battiston, R.; Lepreti, F.; Ubertini, P. A mathematical model of lithosphere–atmosphere coupling for seismic events. Sci. Rep. 2021, 11, 8682. [Google Scholar] [CrossRef]
  15. Freund, F. Time-resolved study of charge generation and propagation in igneous rocks. J. Geophys. Res. Solid Earth 2000, 105, 11001–11019. [Google Scholar] [CrossRef]
  16. Freund, F. Pre-earthquake signals: Underlying physical processes. J. Asian Earth Sci. 2011, 41, 383–400. [Google Scholar] [CrossRef]
  17. Liperovsky, V.; Pokhotelov, O.; Meister, C.V.; Liperovskaya, E. Physical models of coupling in the lithosphere-atmosphere-ionosphere system before earthquakes. Geomagn. Aeron. 2008, 48, 795–806. [Google Scholar] [CrossRef]
  18. Oyama, K.I.; Devi, M.; Ryu, K.; Chen, C.; Liu, J.; Liu, H.; Bankov, L.; Kodama, T. Modifications of the ionosphere prior to large earthquakes: Report from the Ionosphere Precursor Study Group. Geosci. Lett. 2016, 3, 6. [Google Scholar] [CrossRef]
  19. Hayakawa, M. The precursory signature effect of the Kobe earthquake on VLF subionospheric signals. J. Commun. Res. Lab. Tokyo 1996, 43, 169–180. [Google Scholar]
  20. Korepanov, V.; Hayakawa, M.; Yampolski, Y.; Lizunov, G. AGW as a seismo-ionospheric coupling responsible agent. Phys. Chem. Earth 2009, 34, 485–495. [Google Scholar] [CrossRef]
  21. Nakamura, T.; Korepanov, V.; Kasahara, Y.; Hobara, Y.; Hayakawa, M. An evidence on the lithosphere-ionosphere coupling in terms of atmospheric gravity waves on the basis of a combined analysis of surface pressure, ionospheric perturbations and ground-based ULF variations. J. Atmos. Electr. 2013, 33, 53–68. [Google Scholar] [CrossRef]
  22. Endo, T.; Kasahara, Y.; Hobara, Y.; Sue, T.; Hayakawa, M. A note on the correlation of seismo-ionospheric perturbations with ground motions as deduced from F-net seismic observations. J. Atmos. Electr. 2013, 33, 69–76. [Google Scholar] [CrossRef]
  23. Hayakawa, M.; Hobara, Y.; Rozhnoi, A.; Solovieva, M.; Ohta, K.; Izutsu, J.; Nakamura, T.; Kasahara, Y. The Ionospheric Precursor to the 2011 March 11 Earthquake Based upon Observations Obtained from the Japan-Pacific Subionospheric VLF/LF Network. Terr. Atmos. Ocean Sci. 2013, 24, 393–408. [Google Scholar] [CrossRef]
  24. Hayakawa, M.; Hobara, Y.; Yasuda, Y.; Yamaguchi, H.; Ohta, K.; Izutsu, J.; Nakamura, T. Possible precursor to the March 11, 2011, Japan earthquake: Ionospheric perturbations as seen by subionospheric very low frequency/low frequency propagation. Ann. Geophys. 2012, 55, 95–99. [Google Scholar]
  25. Hayakawa, M.; Rozhnoi, A.; Solovieva, M.; Hobara, Y.; Ohta, K.; Schekotov, A.; Fedorov, E. The lower ionospheric perturbation as a precursor to the 11 March 2011 Japan earthquake. Geomat. Nat. Hazards Risk 2013, 4, 275–287. [Google Scholar] [CrossRef]
  26. Kamiyama, M.; Sugito, M.; Kuse, M.; Schekotov, A.; Hayakawa, M. On the precursors to the 2011 Tohoku earthquake: Crustal movements and electromagnetic signatures. Geomat. Nat. Hazards Risk 2016, 7, 471–492. [Google Scholar] [CrossRef]
  27. D’Angelo, G.; Piersanti, M.; Battiston, R.; Bertello, I.; Carbone, V.; Cicone, A.; Diego, P.; Papini, E.; Parmentier, A.; Picozza, P.; et al. Haiti earthquake (mw 7.2): Magnetospheric–ionospheric–lithospheric coupling during and after the main shock on 14 august 2021. Remote Sens. 2022, 14, 5340. [Google Scholar] [CrossRef]
  28. Carbone, F.; Piersanti, M.; Lepreti, F.; Primavera, L.; Gencarelli, C.N.; Pirrone, N.; Battiston, R. Nonlinear shallow water investigation of atmospheric disturbances generated by strong seismic events. Phys. Rev. E 2023, 108, 035105. [Google Scholar] [CrossRef] [PubMed]
  29. Latorre, D.; Arcoraci, L.; Battelli, A.; Battelli, P.; Berardi, M.; Cantucci, B.; Castellano, C.; Castello, B.; Cheloni, D.; Ciaccio, M.G.; et al. What we can say (or not) about the seismic sequence of the November 9th 2022, Mw 5.5, earthquake in the Marche offshore: An analysis of the Italian Seismic Bulletin on phase interpretation, velocity models and uncertainties of earthquake locations. In Proceedings of the 41st GNGTS National Conference, Bologna, Italy, 7–9 February 2023. [Google Scholar]
  30. Maesano, F.E.; Buttinelli, M.; Maffucci, R.; Toscani, G.; Basili, R.; Bonini, L.; Burrato, P.; Fedorik, J.; Fracassi, U.; Panara, Y.; et al. Buried alive: Imaging the 9 November 2022, Mw 5.5 earthquake source on the offshore Adriatic blind thrust front of the Northern Apennines (Italy). Geophys. Res. Lett. 2023, 50, e2022GL102299. [Google Scholar] [CrossRef]
  31. Luzi, L.; Lanzano, G.; Felicetta, C.; D’Amico, M.; Russo, E.; Sgobba, S.; Pacor, F.; ORFEUS Working Group 5. Engineering Strong Motion Database (ESM) (Version 2.0); Istituto Nazionale di Geofisica e Vulcanologia (INGV): Milano, Italy, 2020; Volume 2. [Google Scholar] [CrossRef]
  32. Vackář, J.; Burjánek, J.; Gallovič, F.; Zahradník, J.; Clinton, J. Bayesian ISOLA: New tool for automated centroid moment tensor inversion. Geophys. J. Int. 2017, 210, 693–705. [Google Scholar] [CrossRef]
  33. Pezzo, G.; Billi, A.; Carminati, E.; Conti, A.; De Gori, P.; Devoti, R.; Lucente, F.P.; Palano, M.; Petracchini, L.; Serpelloni, E.; et al. Seismic source identification of the 9 November 2022 Mw 5.5 offshore Adriatic sea (Italy) earthquake from GNSS data and aftershock relocation. Sci. Rep. 2023, 13, 11474. [Google Scholar] [CrossRef]
  34. Aki, K.; Richards, P. Quantitative Seismology; University Science Books: Sausalito, CA, USA, 2002. [Google Scholar]
  35. Spassiani, I.; Taroni, M.; Murru, M.; Falcone, G. Real time Gutenberg–Richter b-value estimation for an ongoing seismic sequence: An application to the 2022 marche offshore earthquake sequence (ML 5.7 central Italy). Geophys. J. Int. 2023, 234, 1326–1331. [Google Scholar] [CrossRef]
  36. Okada, Y. Internal deformation due to shear and tensile faults in a half-space. Bull. Seismol. Soc. Am. 1992, 82, 1018–1040. [Google Scholar] [CrossRef]
  37. Toda, S.; Stein, R.S.; Sevilgen, V.; Lin, J. Coulomb 3.3 Graphic-rich deformation and stress-change software for earthquake, tectonic, and volcano research and teaching—User guide. Geol. Surv. Open File Rep. 2011, 1060, 63. [Google Scholar]
  38. Cusano, P.; Ricco, C.; Aquino, I.; Petrosino, S. A First Step towards the Definition of a Link between Ground Tilt and Earthquakes at Mt. Vesuvius (Italy). Appl. Sci. 2022, 12, 12261. [Google Scholar] [CrossRef]
  39. Falanga, M.; Aquino, I.; Cusano, P.; De Lauro, E.; Petrosino, S.; Ricco, C. Dynamics of the Neapolitan Volcanoes Inferred from Tiltmeter and Seismic Data Analysis: A Review. Pure Appl. Geophys. 2024, 1–24. [Google Scholar] [CrossRef]
  40. Palano, M.; Pezzo, G.; Serpelloni, E.; Devoti, R.; D’Agostino, N.; Gandolfi, S.; Sparacino, F.; Anderlini, L.; Poluzzi, L.; Tavasci, L.; et al. Geopositioning time series from offshore platforms in the Adriatic Sea. Sci. Data 2020, 7, 373. [Google Scholar] [CrossRef]
  41. De Lauro, E.; Falanga, M.; De Martino, S. New insights on the Venice high-water phenomenon through a maximum negentropy criterium. Prog. Oceanogr. 2023, 211, 102978. [Google Scholar] [CrossRef]
  42. Serpelloni, E.; Anderlini, L.; Belardinelli, M. Fault geometry, coseismic-slip distribution and Coulomb stress change associated with the 2009 April 6, M w 6.3, L’Aquila earthquake from inversion of GPS displacements. Geophys. J. Int. 2012, 188, 473–489. [Google Scholar] [CrossRef]
  43. Hennermann, K.; Berrisford, P. ERA5 Data Documentation. Copernicus Knowledge Base. 2017. Available online: https://confluence.ecmwf.int/display/CKB/ERA5%3A+data+documentation (accessed on 12 December 2024).
  44. De la Torre, A.; Alexander, P.; Giraldez, A. The kinetic to potential energy ratio and spectral separability from high-resolution balloon soundings near the Andes Mountains. Geophys. Res. Lett. 1999, 26, 1413–1416. [Google Scholar] [CrossRef]
  45. VanZandt, T. A model for gravity wave spectra observed by Doppler sounding systems. Radio Sci. 1985, 20, 1323–1330. [Google Scholar] [CrossRef]
  46. Yang, S.S.; Pan, C.; Das, U.; Lai, H. Analysis of synoptic scale controlling factors in the distribution of gravity wave potential energy. J. Atmos. Sol. Terr. Phys. 2015, 135, 126–135. [Google Scholar] [CrossRef]
  47. Yang, S.S.; Asano, T.; Hayakawa, M. Abnormal gravity wave activity in the stratosphere prior to the 2016 Kumamoto earthquakes. J. Geophys. Res. Space Phys. 2019, 124, 1410–1425. [Google Scholar] [CrossRef]
  48. Ciraolo, L.; Azpilicueta, F.; Brunini, C.; Meza, A.; Radicella, S.M. Calibration errors on experimental slant total electron content (TEC) determined with GPS. J. Geod. 2007, 81, 111–120. [Google Scholar] [CrossRef]
  49. Cesaroni, C.; Spogli, L.; Alfonsi, L.; De Franceschi, G.; Ciraolo, L.; Monico, J.F.G.; Scotto, C.; Romano, V.; Aquino, M.; Bougard, B. L-band scintillations and calibrated total electron content gradients over Brazil during the last solar maximum. J. Space Weather Space Clim. 2015, 5, A36. [Google Scholar] [CrossRef]
  50. Cicone, A.; Zhou, H. Numerical analysis for iterative filtering with new efficient implementations based on FFT. Numer. Math. 2021, 147, 1–28. [Google Scholar] [CrossRef]
  51. Crowley, G.; Rodrigues, F. Characteristics of traveling ionospheric disturbances observed by the TIDDBIT sounder. Radio Sci. 2012, 47, 1–12. [Google Scholar] [CrossRef]
  52. Šindelářová, T.; Burešová, D.; Chum, J. Observations of acoustic-gravity waves in the ionosphere generated by severe tropospheric weather. Stud. Geophys. Geod. 2009, 53, 403–418. [Google Scholar] [CrossRef]
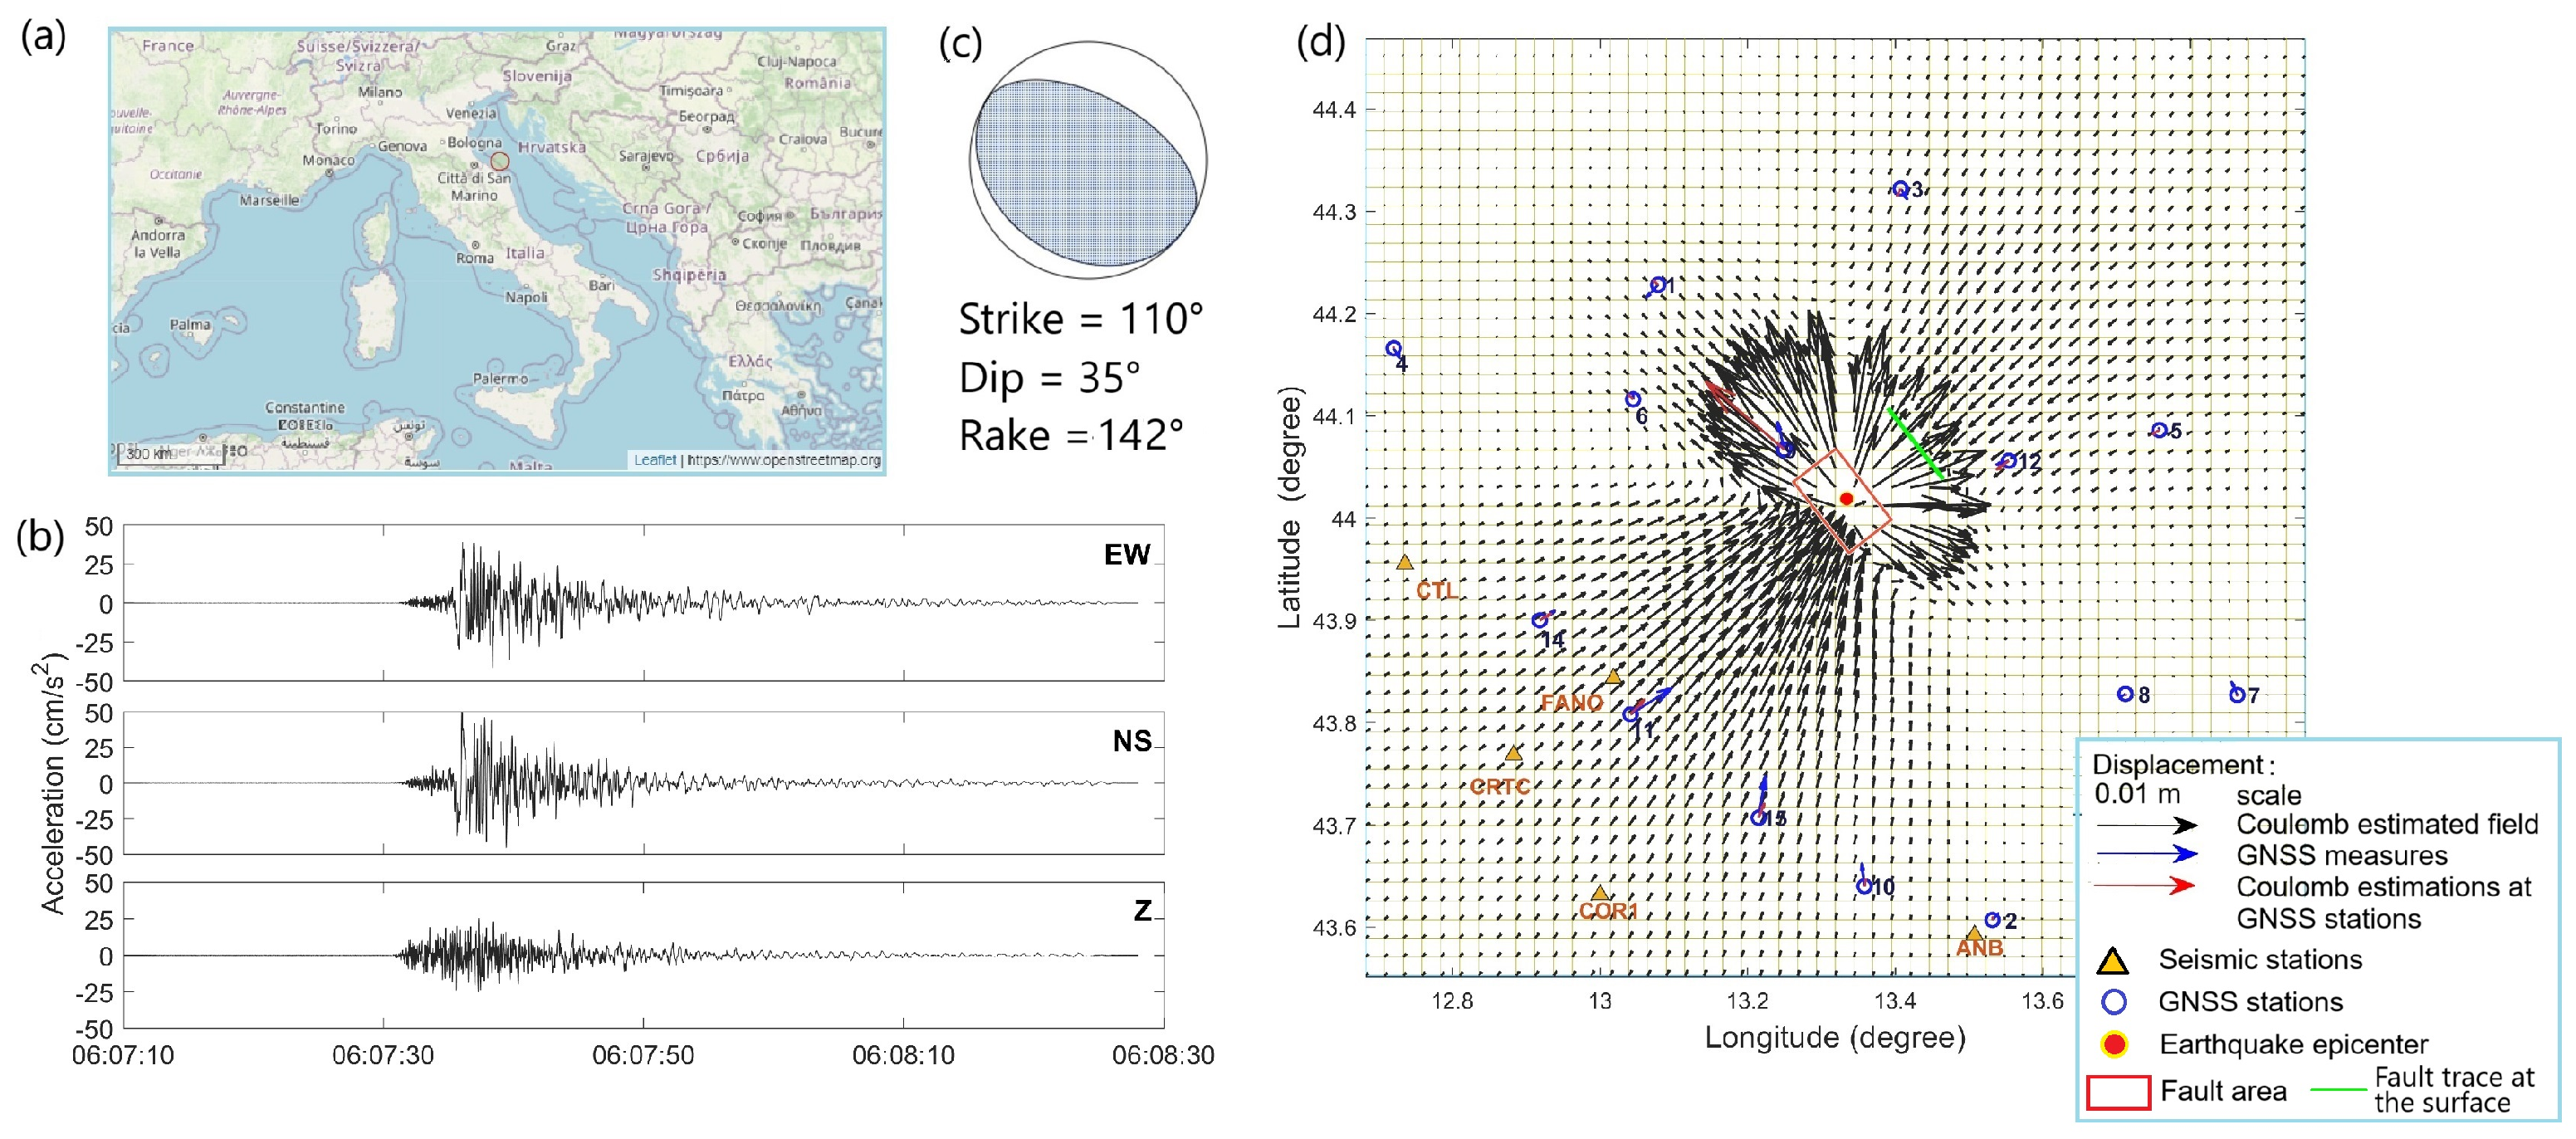
Figure 1. (a) Geographic map of Italy: the red circle indicates the epicenter of EQ2022; (b) Accelerograms acquired at FANO station (43.8434° N and 13.0183° E) along the three directions of motion: east–west (EW), north–south (NS) and vertical (Z) [31]; (c) focal mechanism indicating the nodal planes: strike = 142°, dip = 35°, rake = 110° [32]; (d) static displacement field estimated for the earthquake by using Coulomb software, over a 100 km × 100 km grid at the sea level. The horizontal displacements measured at the GNSS stations (blue circles) and the modeled ones are represented by blue and black arrows, respectively. The GNSS stations are numbered according to Pezzo et al. [33].
Geosciences 15 00022 g001
Figure 2. Co-seismic ERA-5 observations. (A) Vertical profiles of temperature (left panel), temperature deviation (middle panel), and potential energy (right panel) on 9 November 2022 at 06:00 UT. (B) Energy potential maps from 8 (left) to 10 (right) November 2022. The date and altitude are indicated in each panel. The earthquake epicenter is marked by a black dot.
Geosciences 15 00022 g002
Figure 3. Comparison between the MILC model previsions and the co-seismic ERA5 observations on 9 November 2022. (Left panel): dispersion relation of the AGW frequency and wavelength predicted by the MILC model, in which the red dashed line represents the parameter c 0 / h . (Right panel): comparison between MILC model prevision (red line) and observations (blue line) of the temperature deviation vertical profile. Here, c 0 is the sound speed and h is the temperature scale height.
Geosciences 15 00022 g003
Figure 4. Comparison between the MILC model previsions and the co-seismic ERA5 observations relative to 9 November 2022. (Left panel): observed energy potential map. (Middle panel): modeled energy potential map. (Right panel): difference between observed and modeled energy potential map. The date and altitude are indicated in each panel. The black dot represents the earthquake epicenter.
Geosciences 15 00022 g004
Figure 5. vTEC fluctuations characterized by a period between 5 and 9 min for all the satellites in the field of view of all available GNSS receivers near the EQ epicenter (black dot) recorded every 5 min between 05:56 UT and 06:36 UT on 9 November 2022.
Geosciences 15 00022 g005
Figure 6. Solar wind parameters and the Sym-H index (https://cdaweb.gsfc.nasa.gov/ (accessed on 17 December 2024)) for 9 November 2022. Box (A) shows the Interplanetary magnetic field components. Box (B) shows the solar wind parameters, namely (from the top) the three components of the solar wind speed, solar wind plasma density, and solar wind dynamic pressure. Box (C) shows the Sym-H index. Red dashed lines represent the time of the EQ occurrence.
Geosciences 15 00022 g006
Figure 7. Weather report maps over Italy (https://meteologix.com/it/satellite/italy/satellite-nature-15min-en/20221109-0500z.html (accessed on 1 January 2024)) for the 9 November 2022 at 06:00 UT.
Geosciences 15 00022 g007
Table 1. Coulomb grid parameters used to estimate static ground displacement.
Fault Vertexes
CornersLatitude (°)Longitude (°)
LL44.035613.2672
UR44.001313.3983
LR43.968613.3428
UL44.068313.3228
SL44.109113.3897
SR44.042013.4653
Coulomb Grid Parameters
Grid Parameters Value (km)
Start—x 43.6
Start—y 12.7
Finish—x 44.5
Finish—y 13.9
x—increment 2.0
y—increment 2.0
Size Parameter Value
Plot size 2.0
Shade/Color increment 1.0
Exaggeration for disp. and dist. 5,000,000.00
Cross-section default Value (km)
Start—x 43.6
Start—y 12.7
Finish—x 44.5
Finish—y 13.9
Distant—increment 1.0
Z—depth 20.0
Z—increment 1.0
Map info (°) Value
min. lon 12.6826
max. lon 13.9550
zero. lon 13.3235
min. lat 43.5523
max. lat 44.4705
zero. lat 44.0130
Table 2. The EQ2022 characteristics as provided by the USGS website https://earthquake.usgs.gov/earthquakes/eventpage/us7000infp/executive (accessed on 12 December 2024). Here, PGA is estimated at the FANO station.
EQ CharacteristicsValue
Length of Fault (km)10
ω s (Hz)0.0422
v s (m/s)1614.4
Δ t (s)42.5
PGA0.35 g
Table 3. Geographic location of the GNSS service station receivers used for the vTEC evaluation.
Site NameLatitude (°)Longitude (°)
ANCN43.6113.53
ARQT42.7513.2
ATBU43.4812.55
ATCC43.1812.64
ATFO43.3712.57
ATLO43.3212.41
ATMI43.3312.27
ATTE43.212.35
BARO42.2512.05
BARS42.3413.58
BGDR43.8911.89
BLGN44.5111.35
BRAS44.1211.11
BRIS44.2211.77
CAFI43.3311.97
CAOC42.2913.48
CASP42.7910.87
CESI4312.9
CONI42.4113.39
CRMI43.810.98
CSSB43.2112.25
CTEL42.8613.19
GNAL42.5813.52
GRZM44.2611.15
GUMA43.0613.34
INGP42.3813.32
LNSS42.613.04
LPEL42.0514.18
MAON42.4311.13
MGAB42.9112.11
MLAG43.4312.78
MODE44.6310.95
MOMA42.812.57
MONA42.913.34
MTER42.5113.21
MTRZ44.3111.42
MTTO42.4612.99
MUR143.2612.52
MVAL43.3812.41
OSSC43.5211.25
PARM44.7610.31
PIET43.4512.4
PIOB43.6112.53
PREC42.8513.04
RNSP43.6812.27
ROPI42.3313.34
RSMN43.9312.45
RSTO42.6614
SACS42.8511.91
SGIP44.6411.18
SGRE42.3413.5
SIGI43.3412.78
USSI42.9713.13
VALC43.2812.28
VALC43.2812.28
VCAH42.811.95
Disclaimer/Publisher’s Note: The statements, opinions and data contained in all publications are solely those of the individual author(s) and contributor(s) and not of MDPI and/or the editor(s). MDPI and/or the editor(s) disclaim responsibility for any injury to people or property resulting from any ideas, methods, instructions or products referred to in the content.