Article

The Estimation of Shear Wave Velocity for Shallow Underground Structures in the Central Himalaya Region of Nepal

1
Department of Civil Engineering, School of Engineering, Kathmandu University, Dhulikhel 45200, Nepal
2
Department of Civil and Environmental Engineering, University of Nevada, Reno, NV 89557, USA
3
Explorer Geophysical Consultants Pvt. Ltd., Kathmandu 44600, Nepal
*
Authors to whom correspondence should be addressed.
Geosciences 2024, 14(5), 137; https://doi.org/10.3390/geosciences14050137
Submission received: 14 April 2024 / Revised: 8 May 2024 / Accepted: 13 May 2024 / Published: 16 May 2024

Abstract

:
A subsurface investigation was conducted to assess the suitability of a site for potential tunnel construction, focusing on the determination of shear wave velocities (Vs) in subsurface materials. This study employed three distinct methods to analyze Vs in weathered soft rock: drilling mechanism, multichannel analysis of surface waves (MASW), and microtremor array measurement (MAM). Through the utilization of MASW and MAM, empirical relationships were established, enabling the determination of Vs based solely on soil type and depth, offering a practical alternative to the limitations of SPT N-Value, particularly when exceeding 50 blows. The comparison of Vs values obtained from these methods revealed a close alignment between empirical techniques and MASW/MAM, which proved to be cost-effective and an efficient alternative to drilling for comprehensive underground structure assessments. The reliability of MASW was further underscored through its comparison with existing empirical methods. Moreover, the empirical approach demonstrated its efficacy in predicting velocities in weathered soft rock within the Central Himalayan region of Nepal, thus enhancing the feasibility study of underground structures. Lastly, this study proposed a Vs-Depth correlation specifically tailored for highly weathered meta-sandstone bedrock resulting in clay and sandy soils.

1. Background

Due to the fact that Nepal stretches along the Greater Himalayas and is situated close to the collisional boundary between the Indian and Eurasian plates, there is a notable risk of a major earthquake occurring in this region [1]. Nepal is characterized by three major fault systems: the Main Central Thrust (MCT), Main Boundary Thrust (MBT), and Himalayan Frontal Thrust (HFT), alongside numerous smaller faults, totaling 92, running throughout the country’s limited width [2,3,4]. The Kathmandu Valley’s peak ground acceleration (PGA) variation was calculated to be between 0.4 and 0.55 g [5] and the PGA of the Banepa&Dhulikhel area was calculated between 0.29 and 0.35 g for bedrock and 0.46 to 0.55 g for free field [6]. The effect of local site conditions may also affect the variation of ground motion, even if probabilistic seismic hazard analysis (PSHA) displays the overall seismicity of the region while taking into account the spatial uncertainty, size uncertainty, and temporal uncertainty of the ground motion. Different amounts of shaking and destruction during the earthquake are caused by the local site conditions, diverse geology, and non-uniform soil types. The soil that supports the city of Kathmandu is primarily made up of recent, soft fluvial-lacustrine deposits. Silty-clayey soil deposits dominate the valley’s southern portion, whilst sand and fluvial gravel deposits dominate the northern portion (located around the Bagmati River) [7,8,9]. With lacustrine and fluvial soil layers down to a depth of 500 m, Kathmandu is made up of quaternary sediments that are positioned above the bedrock [7,8,10]. The rock succession of the Banepa&Dhulikhel area can be sub-divided into consolidated basement rocks and Quaternary sediments. The rocks are low-grade metasedimentary (phyllite and metasandstone), belonging to the Tistung Formation [8,11]. The Quaternary sediments consist of black carbonaceous lacustrine clay deposits and alluvial fine-to-coarse sand and gravel [8,9,11]. Geological exploration has revealed that Kathmandu Valley is an ancient lake deposit, measuring several hundred meters at the deepest point and is made up of thick layers of clay, silt, sand, and gravel in irregular layers of deposition ranging in age from the late Pliocene era to the present [12,13,14,15,16]. The soft soil deposits of Kathmandu Valley that are up to 100 m thick raise the likelihood that ground motion may be amplified and cause excessive building destruction [17,18]. The soft soils can indeed increase ground motion amplification due to their lower shear wave velocities, greater deformability, resonance effects, reflection and refraction of seismic waves, and the potential for liquefaction during earthquakes [19].
As a result, the Nepal National Building Code (NBC 105:2020) specifies that very soft soil, also known as soil type D (hereinafter referred to as NBC soft soil type D), be taken into account for the Kathmandu Valley [5]. This illustrates the potential for seismic vibrations to be amplified as they travel through soft soil layers, especially over extended periods. Due to the specific soil site circumstances, ground motion parameters such as amplitude, frequency content, and duration are changed [20]. However, depending on the specific site characteristics, the seismicity and damage during the seismic event may differ [21,22]. These situations have previously occurred during past seismic events. For instance, the 1985 Michoacan earthquake, which had a moment magnitude of Mw = 8, caused moderate damage close to its epicenter but extreme damage 350 km away in Mexico City [23]. Additionally, the Modified Mercalli Intensity(MMI) VII scale during the Loma Prieta earthquake was felt in the epicentral zone, although the intensity of MMI IX was felt almost 100 km away [24]. Additionally, during the 2001 Bhuj earthquake (Mw = 7.7), substantial destruction and seismic wave amplification were seen at positions 350 km away. It should also be noted that during seismic disasters like the Hyogo-Ken Nanbu (Kobe) earthquake in Japan in 1995, the Spitak earthquake in Armenia in 1988, and the Chi-Chi earthquake in Taiwan in 1999, among others, the response spectrum exceeded the requirements given in the code [25].
The difficulties associated with site response analysis were investigated for soft soil under high-intensity ground motion [26]. For soft soil sites, the application of equivalent linear (EQL) and non-linear (NL) studies led to the calculation of significant shear strains (between 3–10%), which ultimately produced a typical spectral shape. For strains greater than 0.1%, it was advised to change the modulus reduction and damping curves to create a realistic soil model for site response analysis. Several approaches have been developed to change the G/Gmax curve at a greater amount of shear strain to have a genuine depiction of the shear strength of the soil [24,25,26,27,28,29]. It can be changed to get G/Gmax at shear strain values higher than 1%. The work was refined for a non-linear site response analysis [30].
In the past few years, there has been a widespread acceptance of shear wave velocity (Vs) measurements in practical applications, notably expediting engineering evaluations [31,32]. These measurements are essential for establishing the right foundation design in construction endeavors, particularly in regions prone to earthquakes [33]. Scholars are increasingly driven to comprehend dynamic soil properties to improve principles of earthquake-resistant design. The existence of certain soil deposits significantly impacts ground motion characteristics during an earthquake. Engineers either carry out thorough site-specific ground response studies or employ simplified site classification methods as a means of investigating these characteristics. Vs, a key indicator of soil stiffness, plays a crucial role as it reflects the material’s resistance to deformation under stress. Stiffer soils have higher velocities, while softer soils have lower velocities. Stiffer soils can effectively transmit seismic waves with minimal distortion, reducing the amplification of ground motion at the surface. On the other hand, softer soils can amplify ground shaking, leading to greater structural damage and increased risk to buildings and infrastructure [34].
Geotechnical investigations conducted by drilling methods provide readily available data on the number of blows (N) from standard penetration tests (SPT) [35]. This data is valuable for estimating the Vs profile, which is essential for tasks like assessing soil stability, designing tunnel support systems, and evaluating potential seismic risks. However, conducting geotechnical tests at every location can be cost-prohibitive.
Typically, wave propagation tests are employed to establish the Vs profile at a site. The geotechnical characteristics of the subsurface determine the amplitude and frequency of the seismic wave propagation. Geophysical investigations using non-destructive methods like multichannel analysis of surface waves (MASW) and microtremor array measurements (MAM) provide useful data on geotechnical characteristics of subsurface [32,36,37,38].

2. Study Area

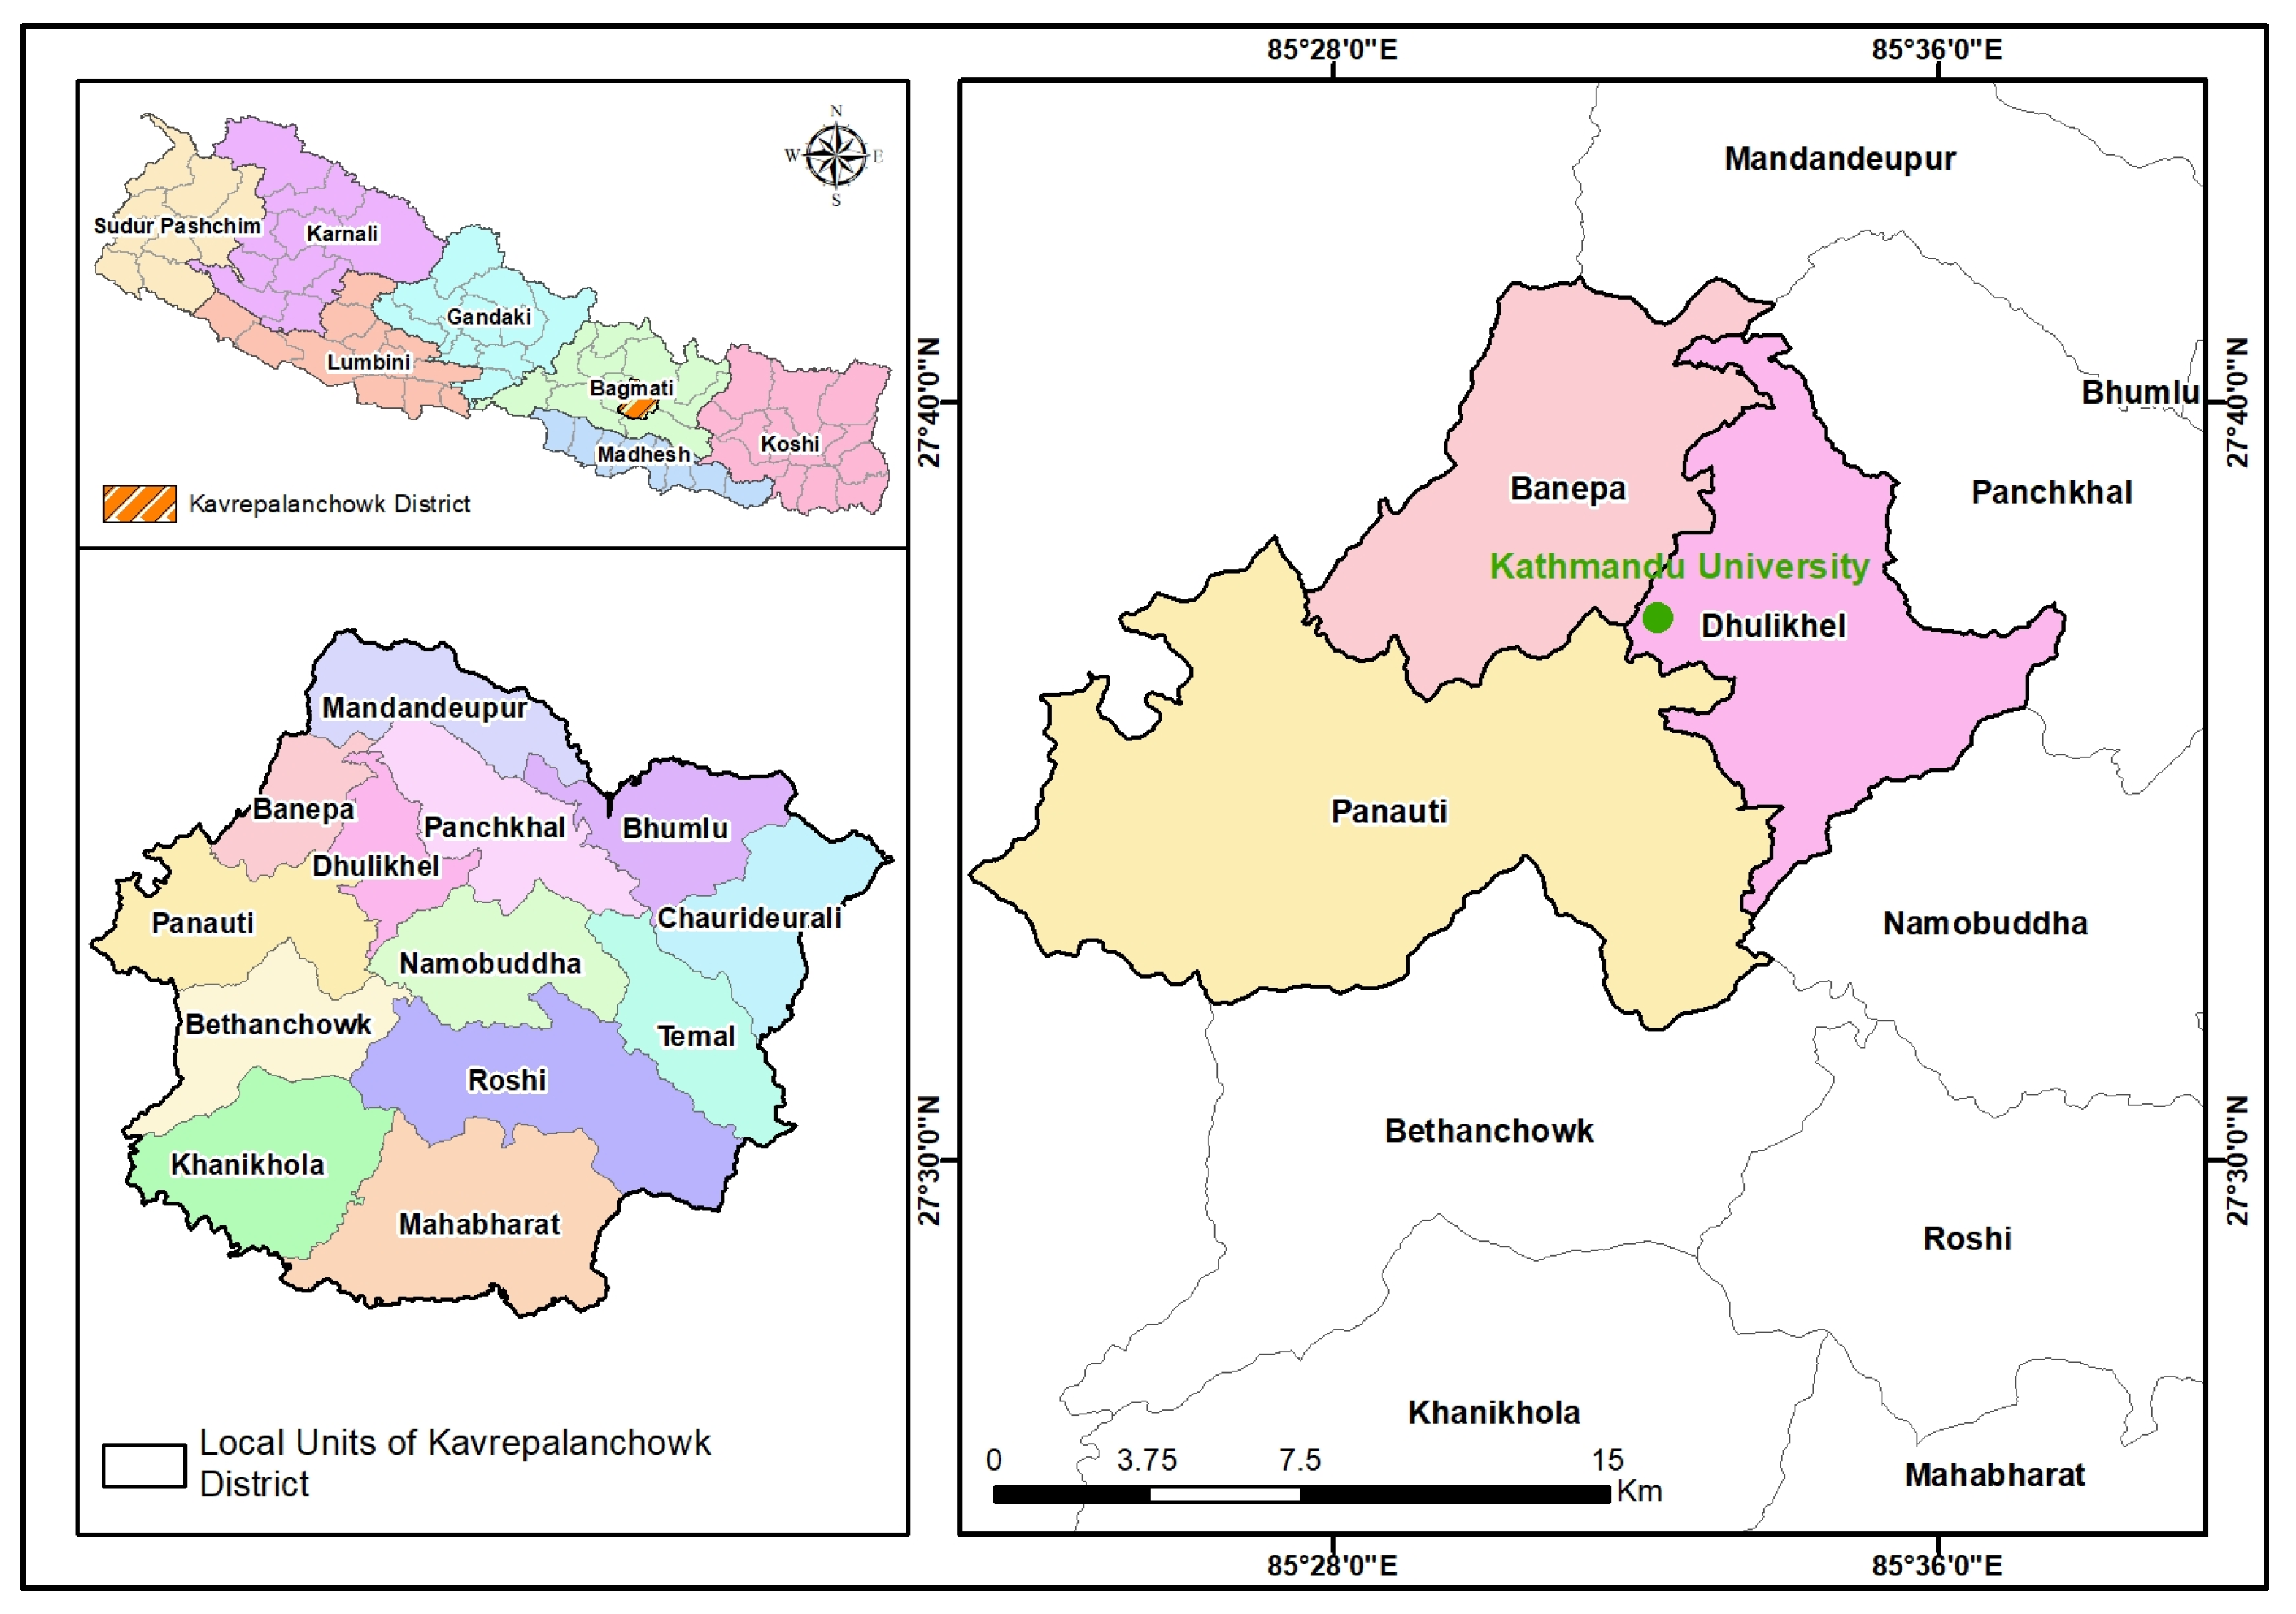
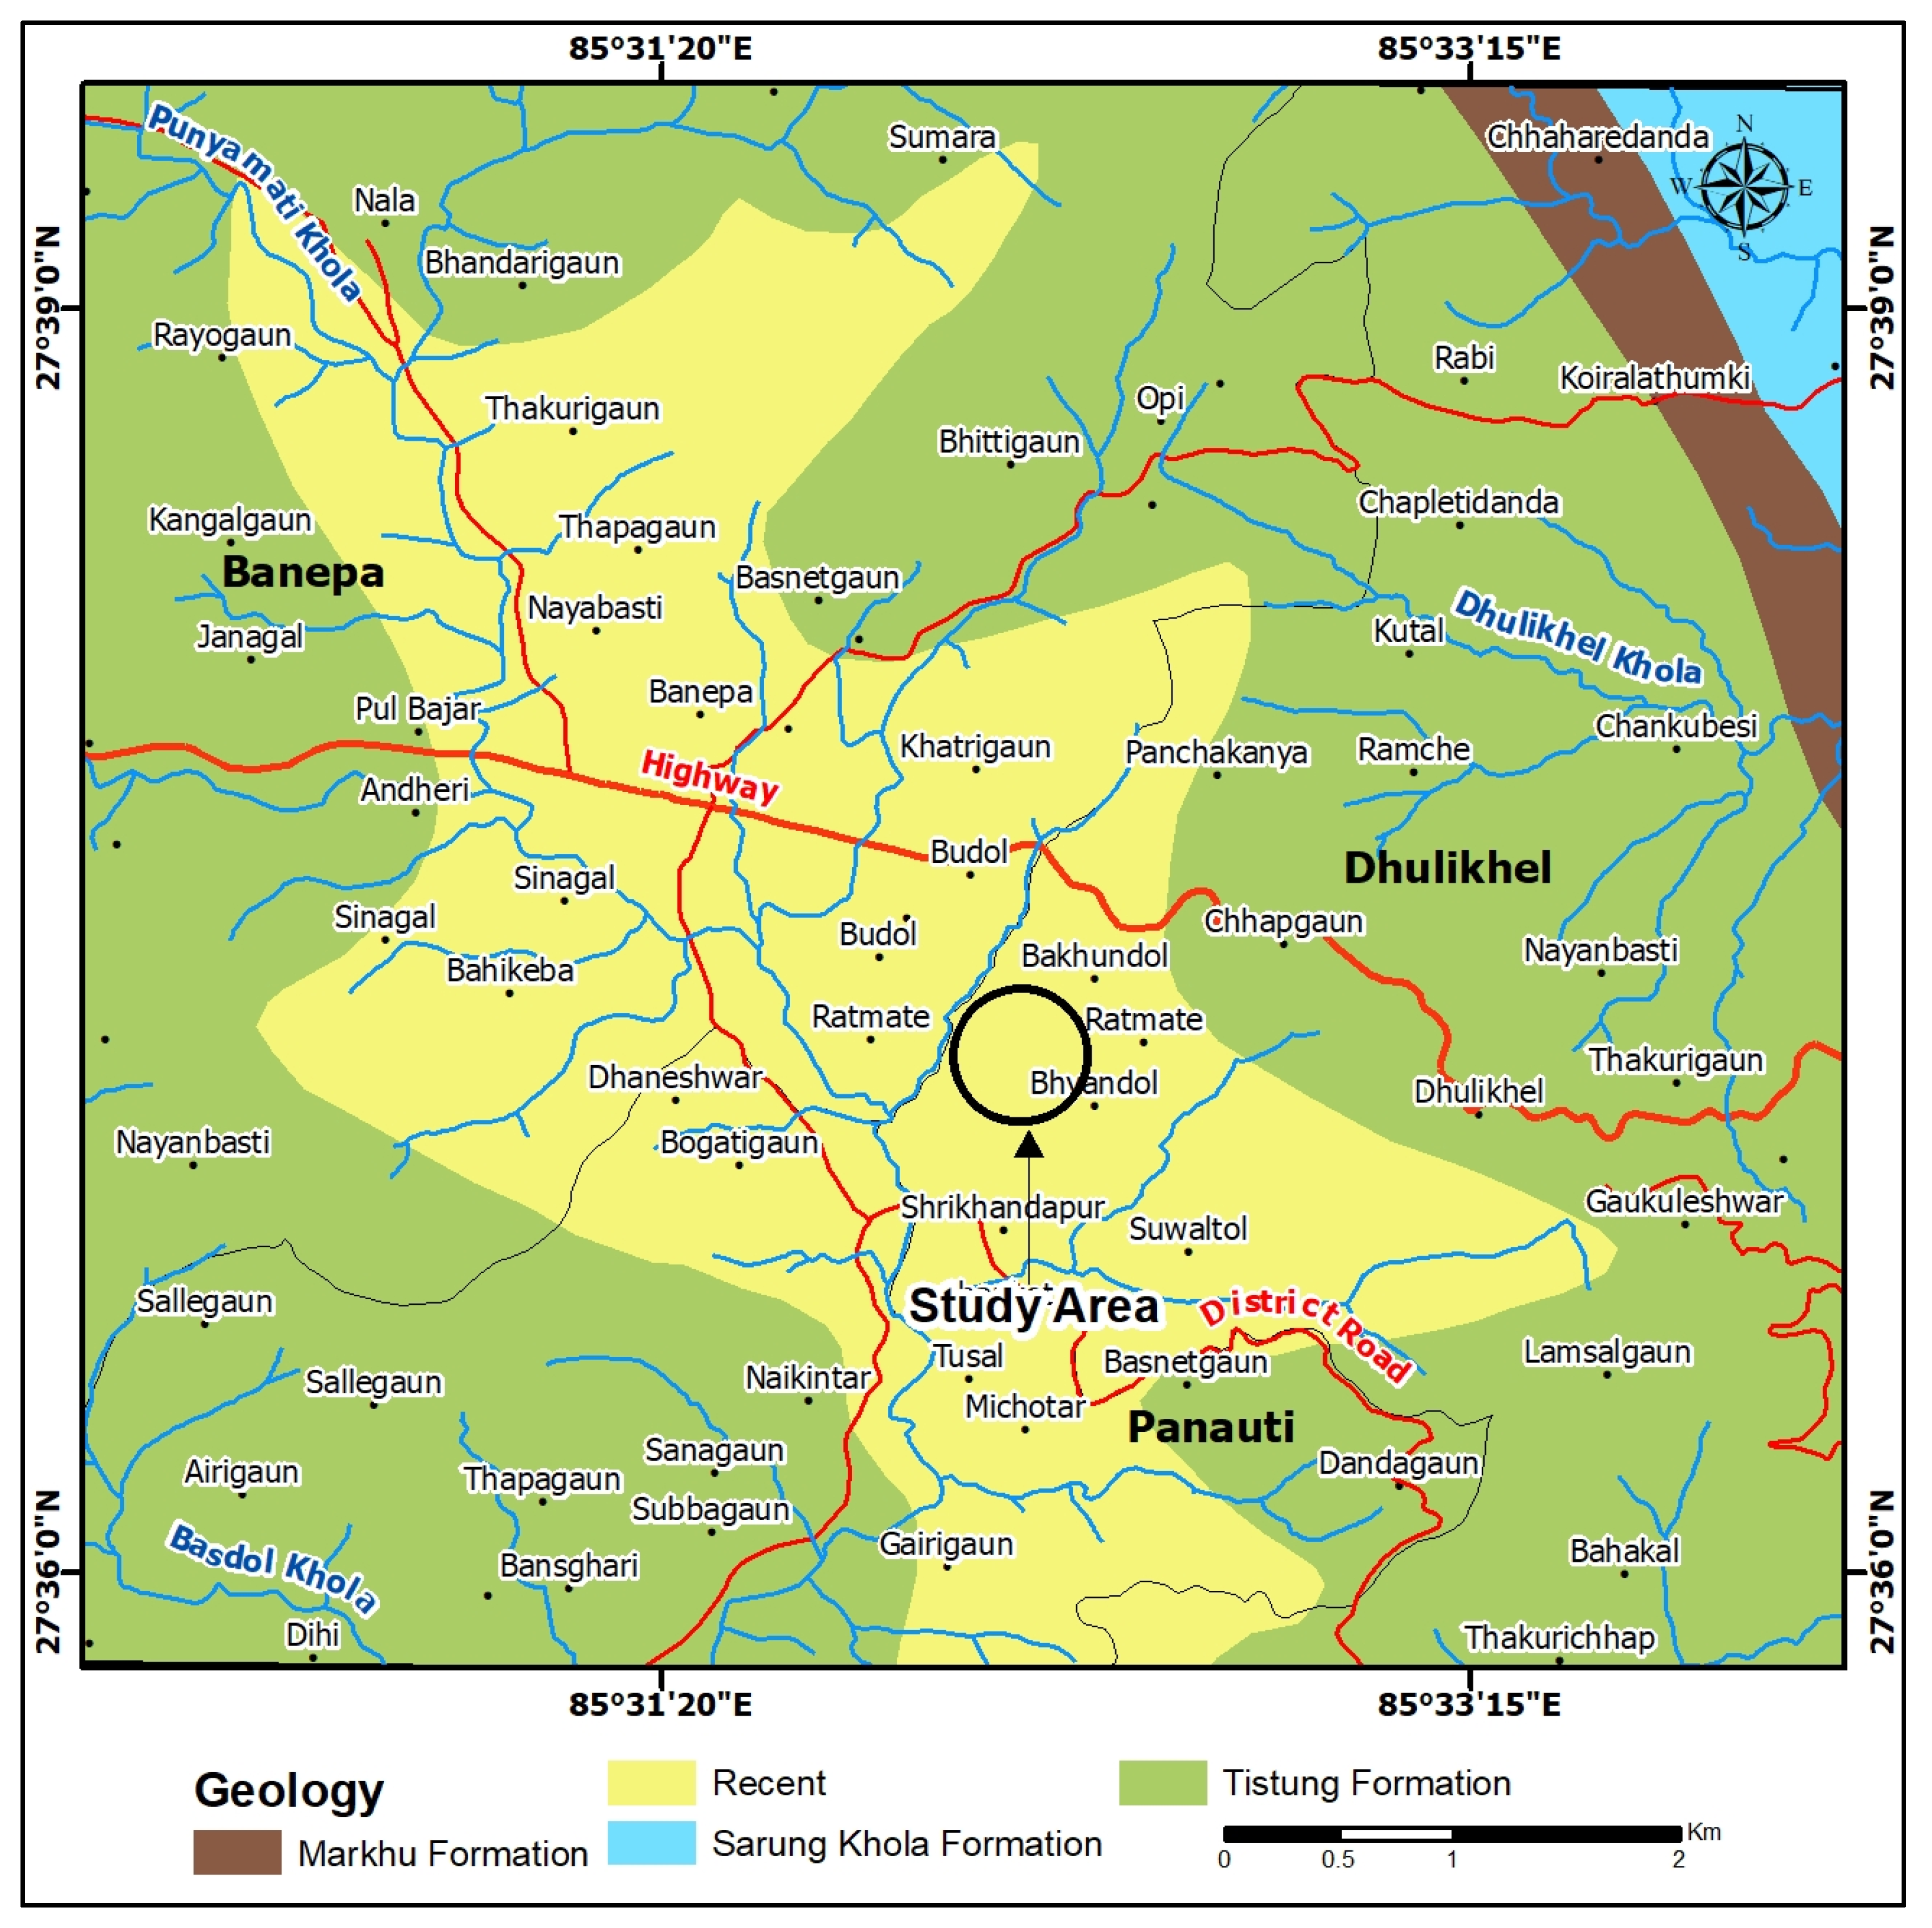
The Kathmandu University Research Tunnel (KURT) is planned for construction in the Lesser Himalayan region of Central Nepal. This region is primarily characterized by meta-sandstone rock, occasionally interspersed with layers of phyllite from the Tistung Formation within the Kathmandu complex [8,9]. Figure 1 shows the location of the KURT. The area is mostly covered with colluvial and residual soils, although there are areas where rocks are exposed (Figure 2). These exposed rocks typically exhibit weathering and high joints. The main bedrock in this region consists of fine-grained grayish micaceous meta-sandstone, along with gray phyllite layers.
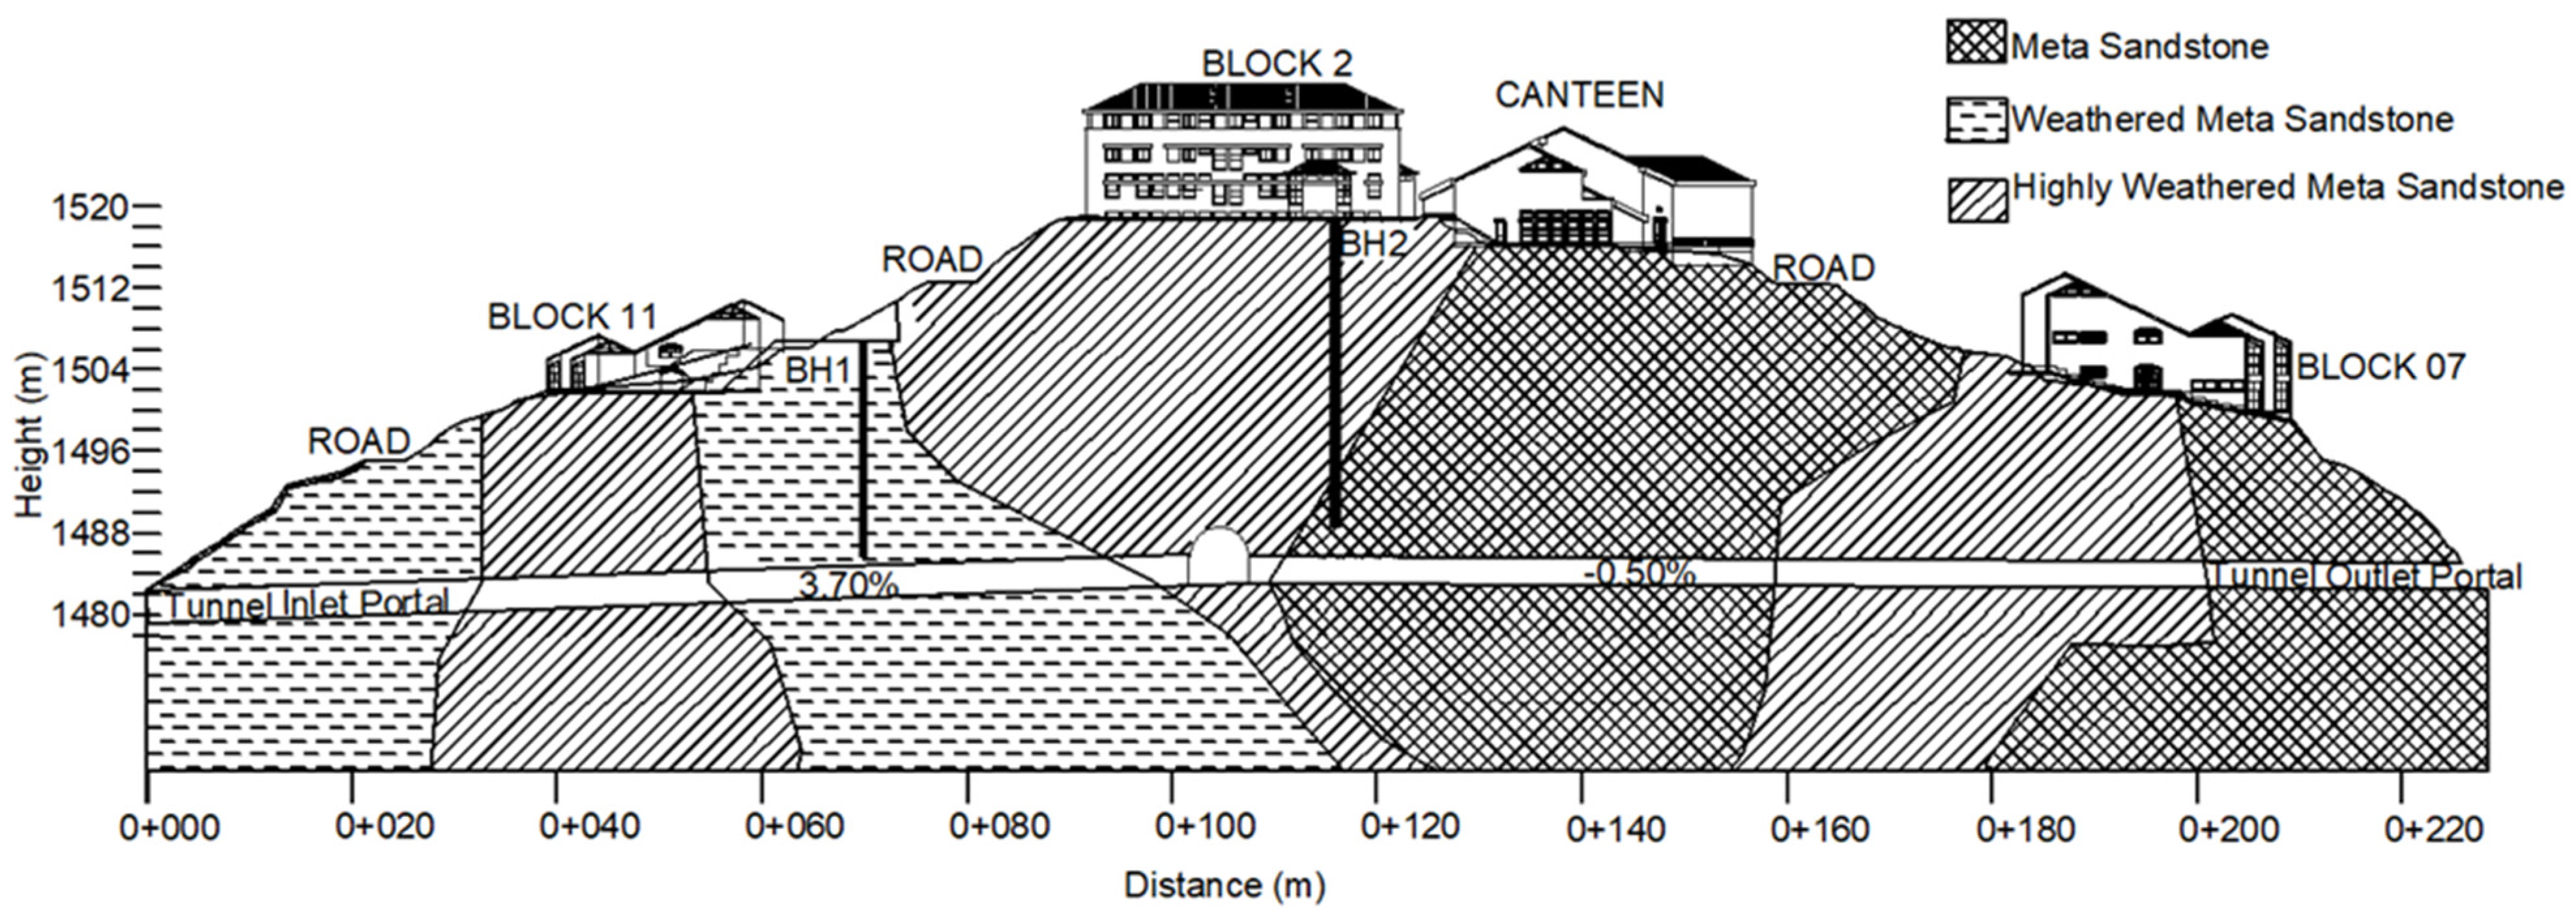
The total length of the tunnel, including the cavern is 234 m.The planned cavern measures 7 × 7 × 20 m3. The tunnel has a diameter of 3.5 m. Figure 3 depicts the cross-section profile of the KURT.

3. Insight into Calculation of Shear Wave Velocities

Accurate characterization of subsurface soil properties is crucial for site response analysis. Vs is a crucial parameter in geotechnical and earthquake engineering for site assessment and design. Several traditional invasive geophysical test methods such as downhole seismic [39], and cone penetration tests [40] are widely adopted to determine the Vs profile. However, this study uses non-invasive methods like MASW and MAM since these methods have recently gained popularity due to their quick on-site deployment [41]. The theoretical foundation for surface wave propagation dates back to the early 20th century, but their practical engineering applications emerged in the 1950s [42,43]. In the 1980s, Rayleigh wave dispersion curves were employed to assess pavement thickness, Vs, and pavement moduli [44]. As computing power advanced, MASW and MAM methods gained traction in the geotechnical and geophysics communities. MASW, an extension of the spectral analysis of surface waves, utilizes multiple channels and has demonstrated its merits and diverse applications in geotechnical and earthquake engineering, as documented in the literature. Surface wave tests like MASW and MAM provide a non-intrusive and efficient means of measuring Vs for geotechnical investigations [45,46].
MASW is an efficient technique that makes use of wavelength and propagation velocity to extract the S-wave velocity profile along the soil column. The main advantage of this method is its ability to fully consider the complicated nature of seismic waves that always contain distracting noises [47]. The MASW method permits successful identification of different seismic events (body waves backscattered and higher-modes) from the dispersion curve of phase velocity versus frequency plot [48]. Among different seismic waves, the surface waves have the strongest energy with the highest signal-to-noise ratio (S/N) [49], making it a powerful tool for the near-surface characterization. The MASW method has recently become a main tool in estimating the Vs velocities for applications of near-surface geology, the environment, and engineering [50,51]. These velocities obtained can be employed to evaluate the seismic hazard levels [52,53].

3.1. Geotechnical Investigation

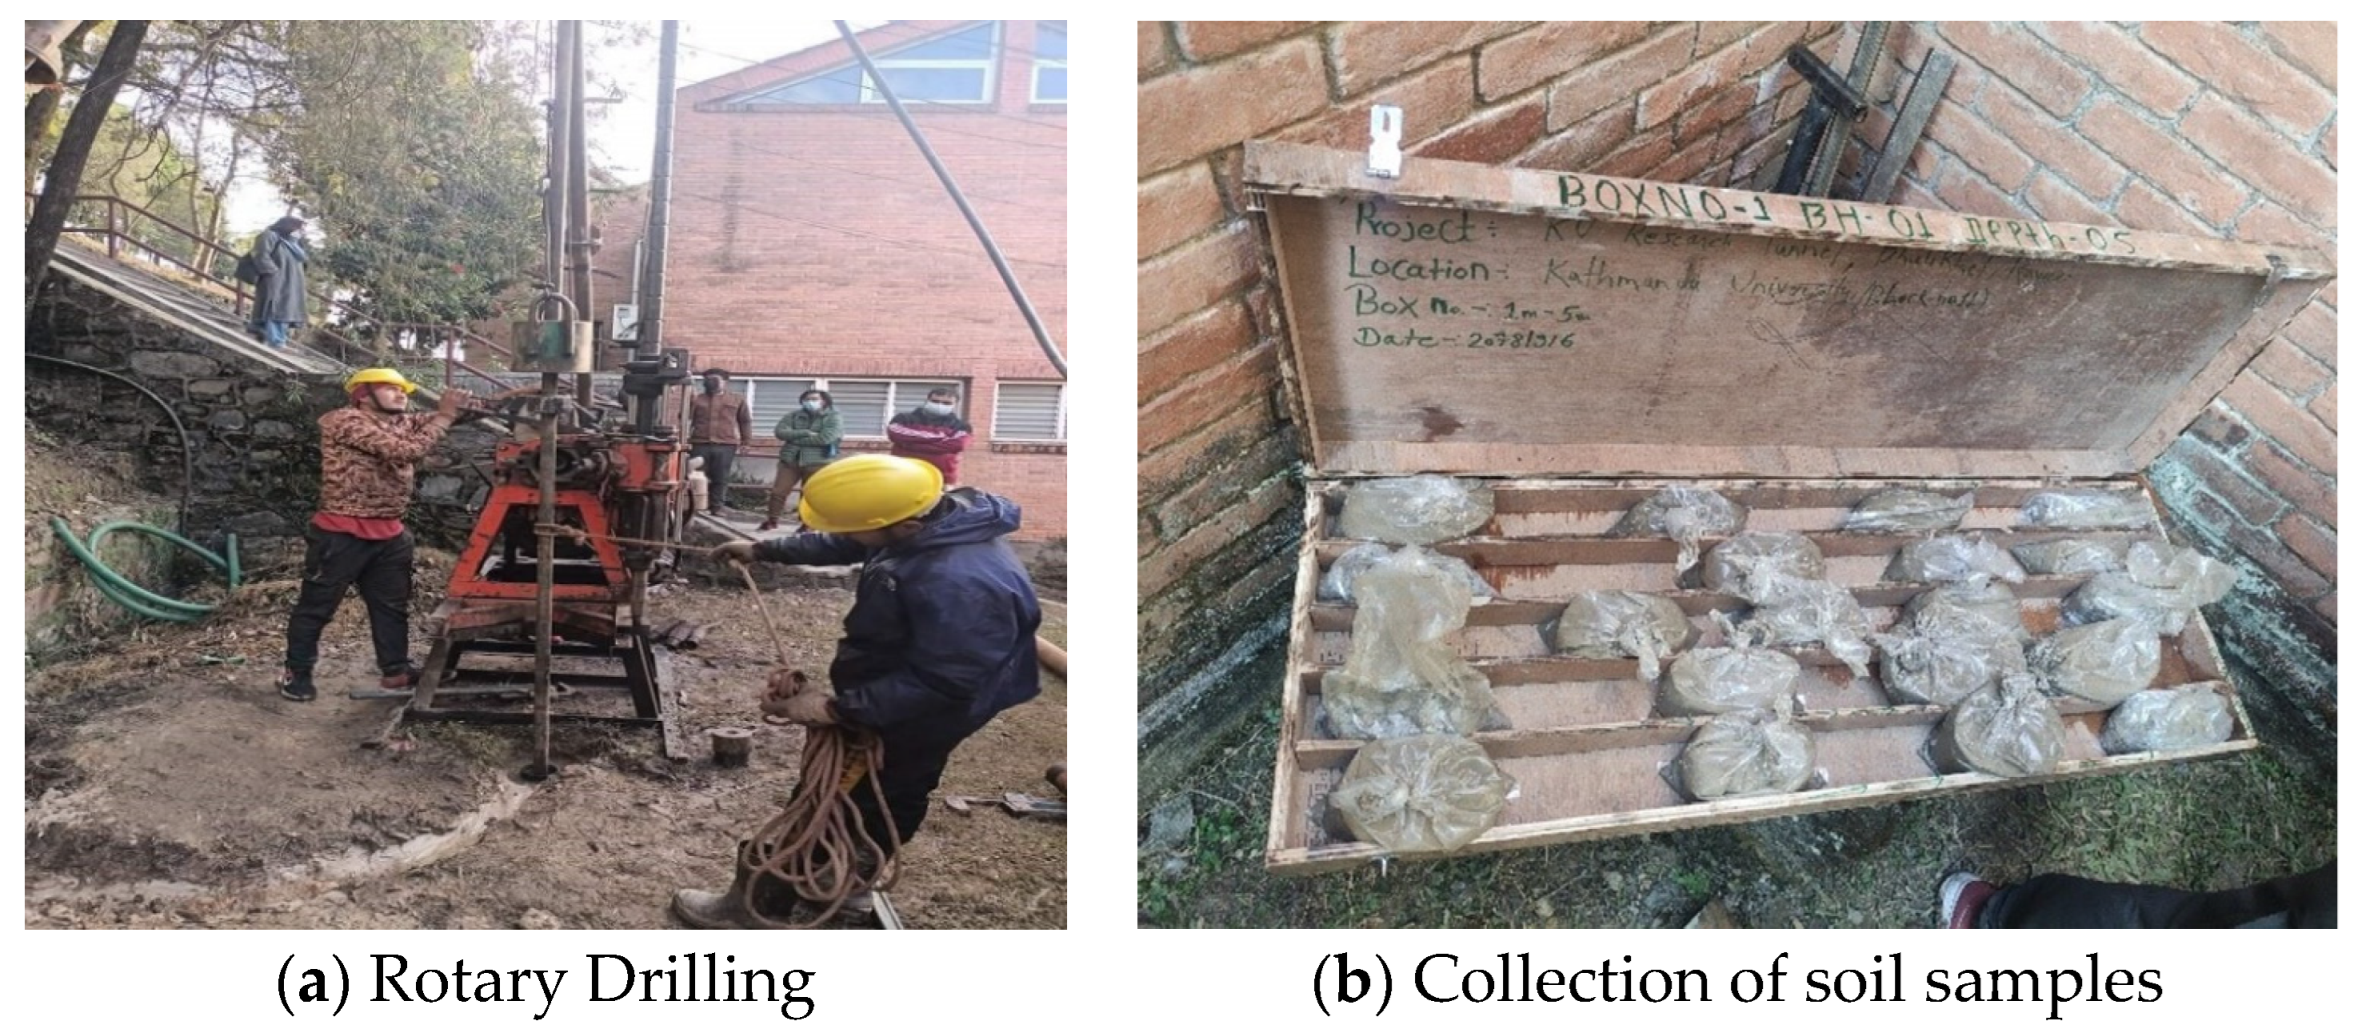
The site was deployed with drilling rotary machinery and other accessories to drill the boreholes, collect soil samples, and carry out in situ testing like the standard penetration test (SPT).
Figure 4 shows the bore hole’s placement in the site. With the use of a drill bit, the boreholes were advanced through rotation and vertical pressure. The depth noted in the drill records corresponds to the current elevation of the ground. The collected samples were taken to the laboratory for additional testing and analysis. The SPT was performed every 1.5 m. In rotary drilling with SPT testing, the rotation and vertical pressure are typically simultaneous processes. The drilling rig uses its rotary head to rotate the drill bit, which cuts into the soil or rock formation. This rotation creates the borehole and helps advance the drilling process. As the drilling progresses, the drill string (the assembly of drill pipe and other tools) applies downward pressure to the drill bit, helping the bit penetrate the soil or rock and maintain stability during drilling.
A Split Spoon Sampler with an outside diameter of 50 mm is inserted into the ground at the borehole’s bottom. The use of a Split Spoon Sampler that is 50 mm in diameter during rotary drilling facilitates standardized testing procedures, compatibility with drilling equipment, and the efficient collection of representative soil samples, contributing to accurate geotechnical assessments and engineering design [54]. A drop hammer that weighs 63.5 kg is used to drive by freely, dropping from a height of 750 mm onto the drive head. At the bottom of the borehole, a Split Spoon Sampler is first driven 150 mm into the Earth’s surface. After that, it is pushed another 300 mm, and the number of blows (or “N” values) necessary to push it that far is noted. Two borehole tests were conducted along the alignment of the tunnels.
To conduct classification tests, the samples collected in the SPT tube were kept as representative samples. The samples were then collected, sealed in airtight double plastic bags with the appropriate identification labels, and taken to the laboratory for testing. For all boreholes, the collected samples were stored in a core box. Through the use of a Shelby tube with a thin wall, an undisturbed sample was removed. The sample was physically collected after the tube had been placed into the earth. The tube was appropriately labeled after being bound with adhesive tapes, encased in impermeable polythene sheets, and waxed shut. The tube was carefully wrapped in a hardwood box to reduce commotion during delivery to the laboratory and prevent changes in the sample’s moisture content.

3.2. Geophysical Investigation

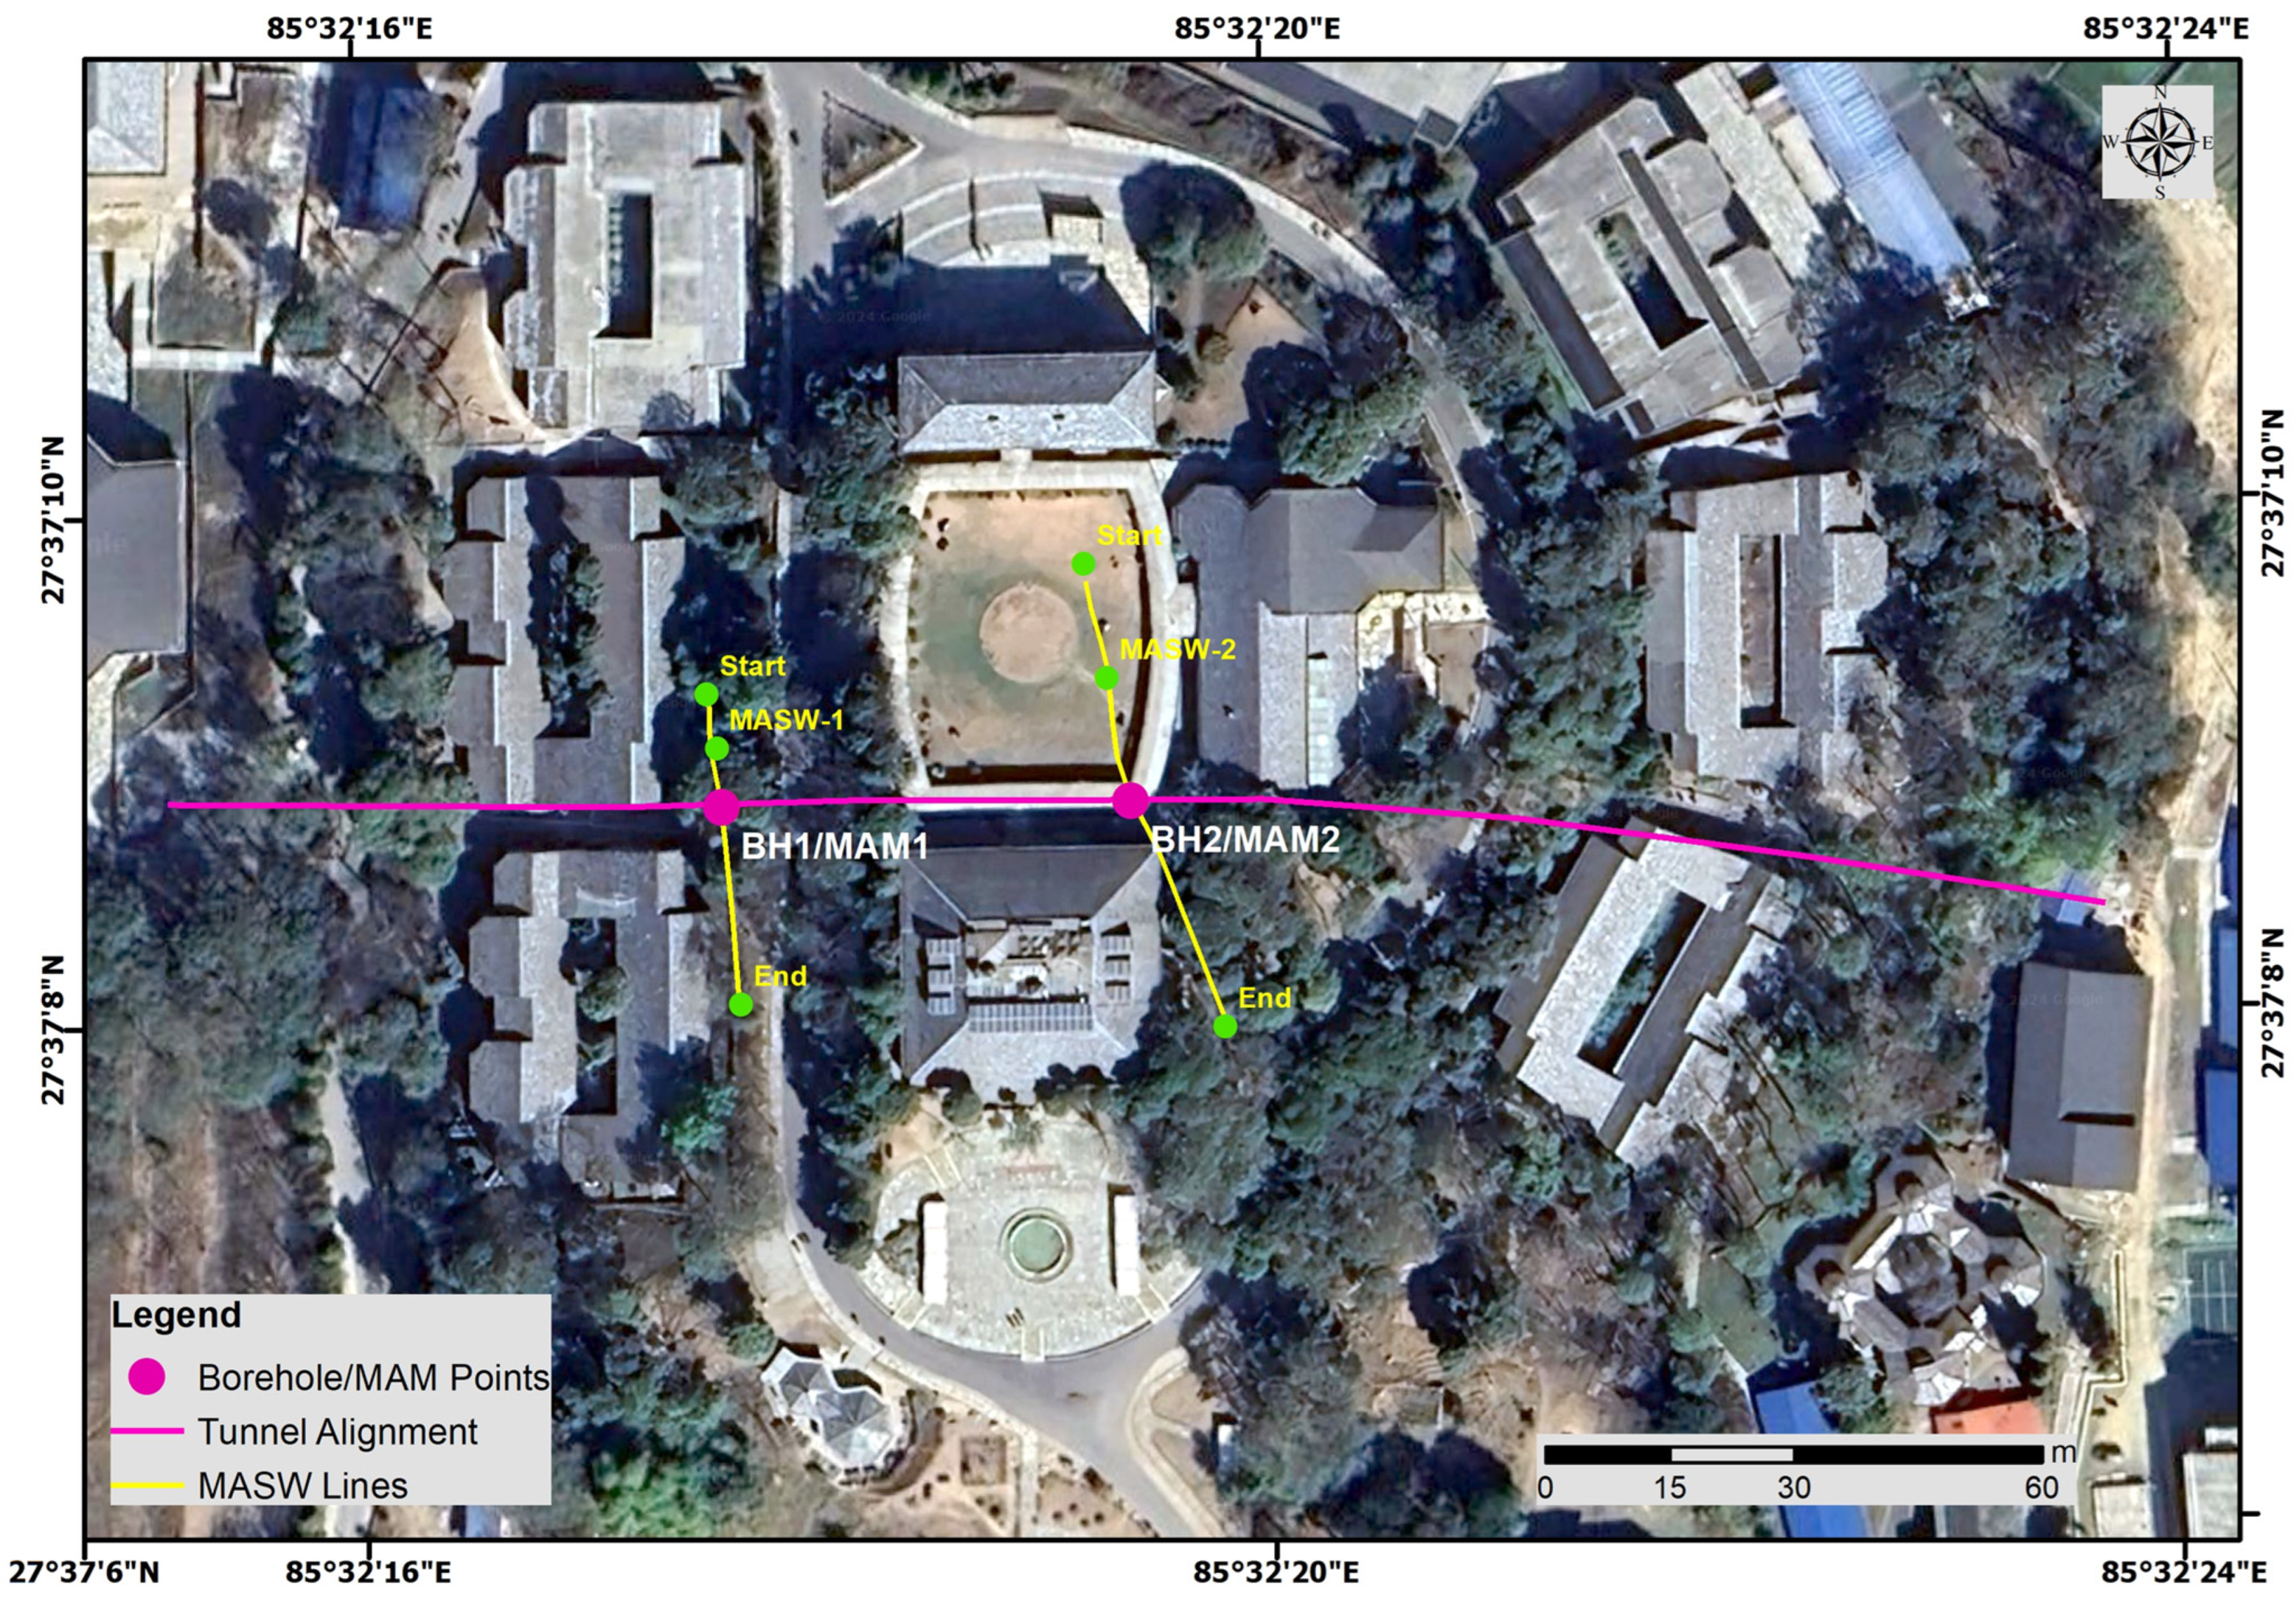
Traditionally, geotechnical engineers have relied on percussion/rotary drilling methods for soil investigations to assess soil strength. However, in urban environments where boreholes can be challenging and costly to implement, these methods may not be practical [55,56]. As an alternative, non-invasive seismic exploration has emerged as a promising solution to determine shear wave profiles and resonance frequencies, offering a quicker and more cost-effective data collection process that is well-suited for urban areas. A 1D Vs model for each site can be established using the MASW/MAM testing method [57]. By analyzing the characteristics of these surface waves, engineers can infer the subsurface Vs profile. MASW/MAM provides a convenient and efficient way to gather this crucial geotechnical information without the need for intrusive drilling or excavation, making it a valuable tool in tunnel site investigations [58]. Figure 5 shows the cable layouts for the geophysical survey in the area.

3.2.1. Multichannel Analysis of Surface Waves (MASW)

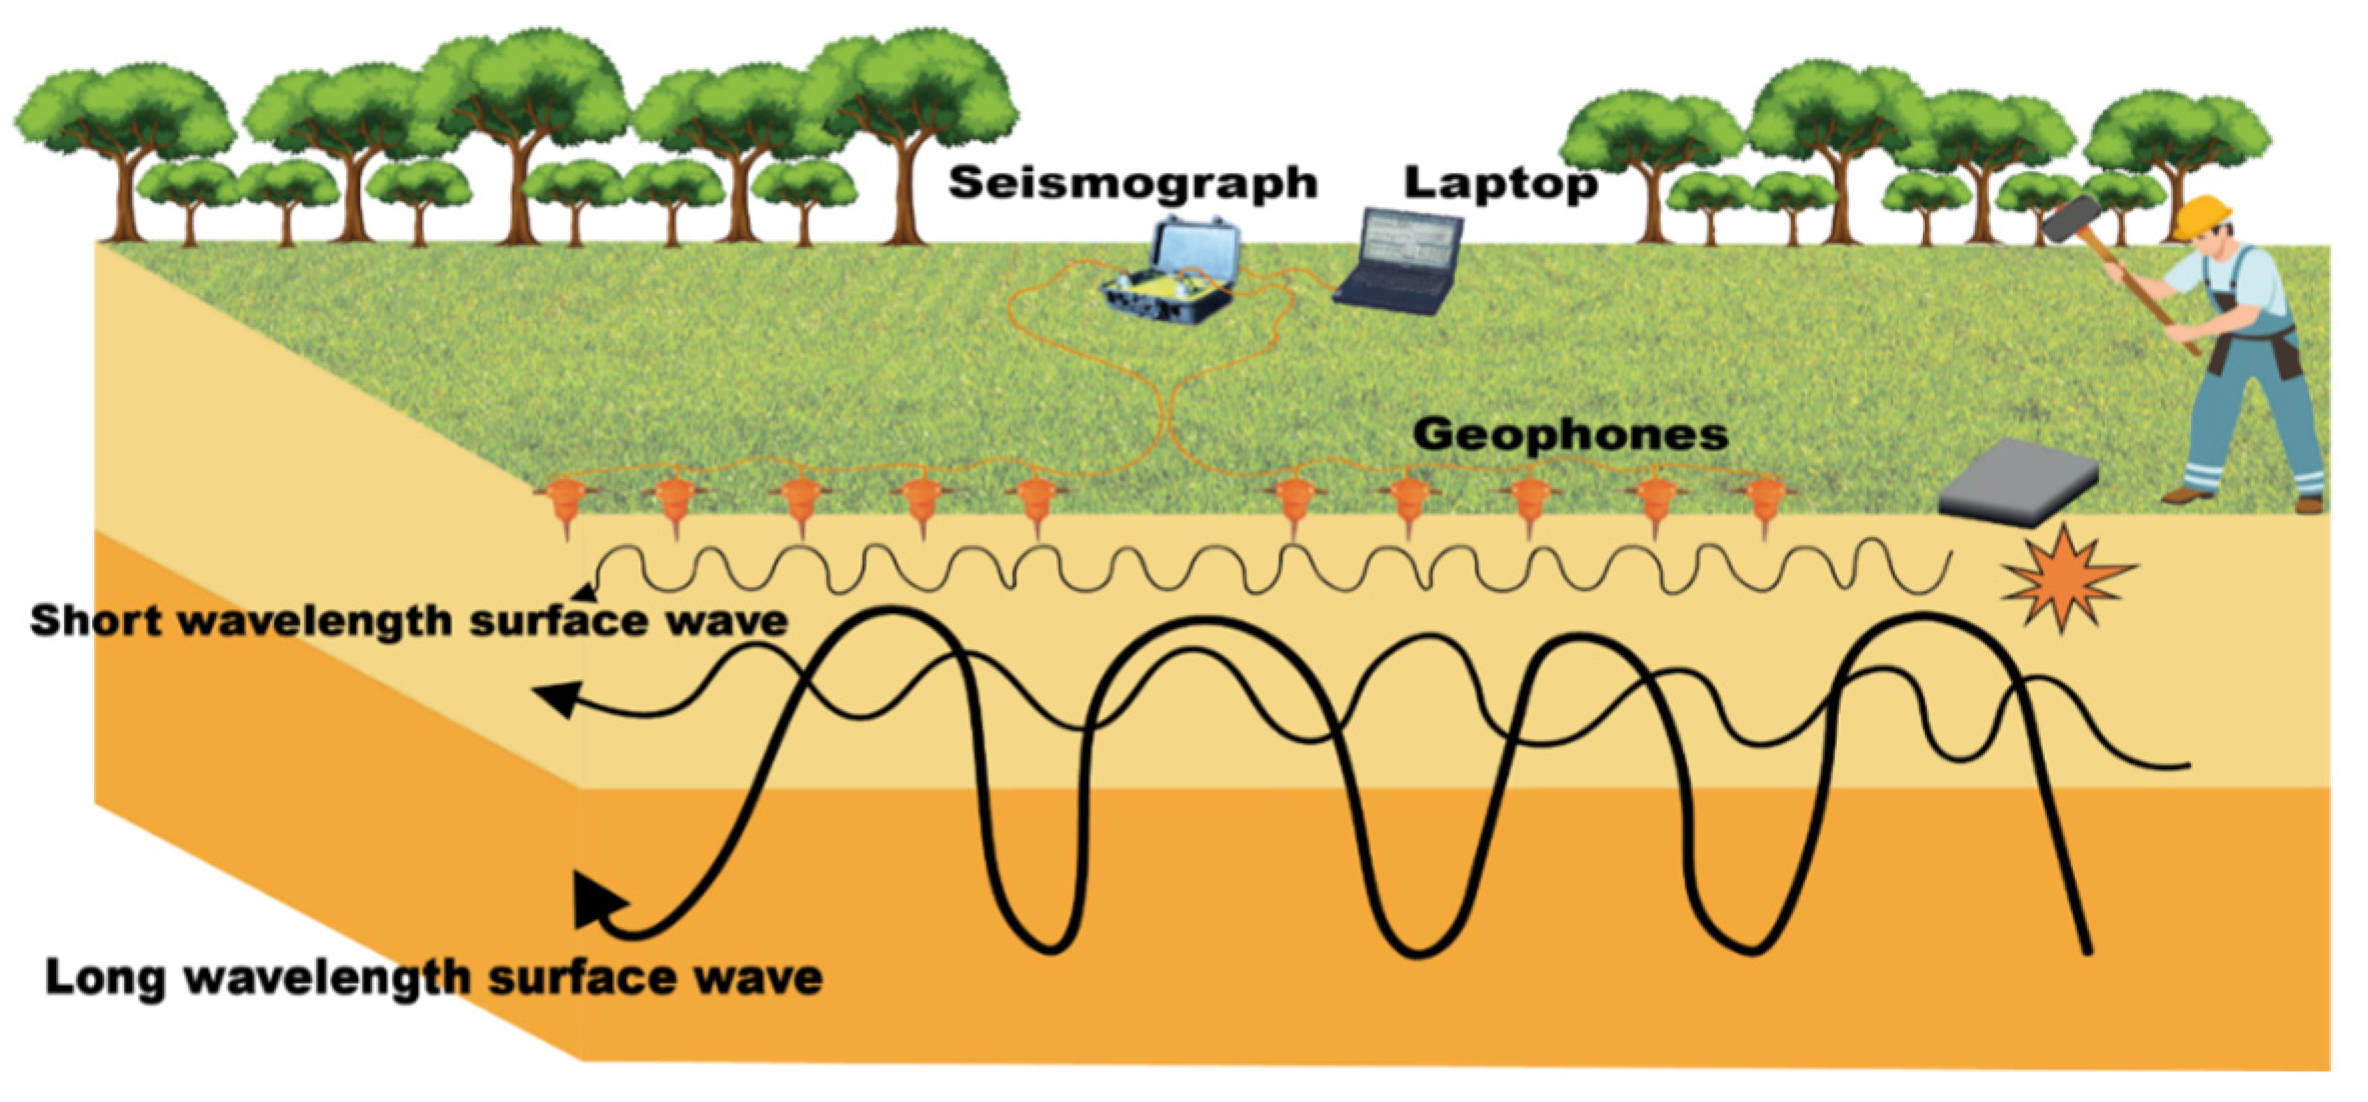
Geophysical investigation using the MASW method has been popular to obtain shear wave velocities and is useful for geotechnical characterization of subsurface [59,60,61,62,63]. To determine the Vs of a specific site, seismic surface waves produced from various types of impulsive sources like sledge hammers are recorded by sensors (geophones) laid in a linear array synchronously [53]. The synchronous recording of seismic surface waves by a linear array of geophones is a fundamental aspect of MASW surveys, enabling the accurate estimation of Vs profiles for site characterization and engineering analysis [64]. Figure 6 shows the typical diagram for the MASW survey.
The MASW survey was conducted utilizing the accepted standards of methodology and philosophy regarding geophone frequency, number, geophone spacing, generation of seismic waves, etc. The 24-channel PASI-GEA24 Digital Seismograph connected to 24 vertical geophones having a natural frequency of 4.5 Hz is used in the present research. Having 24 geophones allows for high-density data acquisition along the survey line. This means that seismic signals are recorded at more closely spaced intervals, providing better resolution of subsurface features and wave propagation characteristics. Using a 24-channel seismograph connected to 24 geophones operating at a frequency of 4.5 Hz offers improved data resolution, coverage, signal quality, and depth of investigation, making it a versatile and effective setup for MASW surveys and other geophysical investigations. Based on the site’s conditions, the MASW survey was conducted with 2 m geophone spacing, offset shot at 6 m with a total of 24 geophones laid in a linear array along the surface with the center of the array at drilling locations which were determined in order to prevent the near- and far-field effects and to ensure the planar development of the surface (Rayleigh) waves [48,65]. The seismic waves were generated using a 10 kg sledgehammer and an aluminum alloy plate for better coupling and transmission of the energy through the subsurface to the receivers with a sampling interval of 0.250 ms. A total of 5–10 stacks were employed at each shot point during the data collection work to improve the data quality ensuring minimum background noise and maximum S/N. The S/N is the ratio between the signal power and the noise power, equal to (SN+X − SN)/SN, where S indicates variance, N refers to noise, and X refers to the noise-free seismic signal. The S/N is an important factor for measurement precision where high S/N ensures that the signal is maximized in comparison to noise, with a higher S/N correlating to a better image in seismic results.
Dispersive properties of Rayleigh waves generated by a broad range of frequencies are utilized to calculate the S-wave velocity distribution through the subsurface by applying a mathematical inversion to the dispersion curve (phase velocity vs. frequency plot) in the MASW method. This dispersive property practically means that the propagation velocity (phase velocity) of Rayleigh waves depends on the various frequency components of the propagated waves [31]. Compared to Rayleigh waves with longer wavelengths (or lower frequencies), which reflect characteristics of the deeper material, the Rayleigh waves with short wavelengths (or high frequencies) are impacted by material closer to the surface [66].
The acquired seismic data were processed using the ZondST2D commercial software package, license dongle: 97020786AB082F46, provided by Zond Software Ltd., Paphos, Republic of Cyprus (EU), which has a facility to transform seismic data from time to frequency domain, calculation of dispersion curve, identification of fundamental mode, and inversion of the dispersion curves in order to obtain a 1D Vs distribution to the subsurface. The shear wave velocities at various depths (called 1D Vs profiles representing the middle of the geophone spread) are calculated by the inversion process using dispersion curves, allowing for the identification of several soil layers along the given profile [64]. Using the normal pattern recognition technique, MASW uses a multichannel record for different types of seismic waves. Due to enhanced effectiveness in data processing provided by multiple-receiver recording, one measurement from one impact and one source-receiver (SR) configuration are usually sufficient to produce a 1D Vs profile) [41].
The dispersiveness of soils is determined mainly by the vertical variation on Vs [64,67]. The calculated Vs of the subsurface will be utilized to calculate density, Poisson’s ratio, elastic moduli, and other geotechnical parameters of the material layer [68] which can be used for site classification. The calculated Vs30 geotechnical parameters will be used to calculate PGA value of the area leading to site-specific seismic hazard assessments of the area prior to any construction activities.

3.2.2. Microtremor Array Measurement (MAM)

The passive method, also known as microtremor array measurements (MAM), is growing in popularity because it does not require an artificial source and makes it simple to enhance the depth of the research [69]. The word “micro-tremor” is used differently on each continent (i.e., passive surface wave (North America), microtremor (Japan), and ambient vibration array measurements (Europe)) and is also known as passive MASW. Moreover, as a non-destructive geophysical approach, MAM can be conducted in an environmentally friendly manner in the urban area for understanding subsurface geotechnical characteristics. Various researchers [41,70,71,72,73] have developed methods for construction of dispersion images and its inversion. A dispersion image in the frequency–phase velocity domain is the most popularly used method in geotechnical engineering [74,75,76,77]. The application of MAM tests in shallow- to medium-depth soil/rock sites by using a Vs profile has also been evaluated by [41,66,67,68]. Figure 7 depicts the seismograph, accessories, and cable layout performed in MASW/MAM survey during the research.
Digital seismographs connected to geophones are an effective tool to assess sites in loud situations such as densely inhabited places. They capture ambient vibrations and waveforms caused by human activity, traffic, wind, and other factors. The best vibration sources are consistent and steady. As shown in Figure 8, the procedure entailed tracking the arrivals of seismic waves across the site using an L-type array, circular array, and linear array of geophones. The elastic waves’ vibration is picked up by the geophones (sensors), which then sent the waveforms to the seismograph to be recorded as seismograms. In these investigations, phase velocity is calculated in the frequency range of 0.2–1 Hz using L-shaped, circular, or linear arrays with sizes of several meters to kilometers.
The investigation depth directly depends on the length of the profile, and as depth increases, resolution decreases [78]. The maximum frequency of the recorded data and geophone spacing determine the thinnest layer that can be resolved. Thinner underlying layers are easier to resolve with closer-spaced geophones and higher frequencies.
In the present research, based on topography and available space, a 24-channel digital seismograph and 24 vertical geophones having a natural frequency of 4.5 Hz placed at 5 m spacing in an L-type array were used for data acquisition with a sampling interval of 4 ms and total record length of 10 min [79]. Passive waves from different types of sources were logged in/gathered for a total of 10 min for each record.
In the present research, a dispersion image (phase velocity vs. frequency) was constructed using an extended spatial autocorrelation (ESAC) method [80] derived from the original spatial autocorrelation method [81]. Frequency is kept as a constant parameter in the calculation of apparent phase velocity while using ESCA methods, which facilitates the use of an L-shaped array. A 1D S-wave velocity model of both locations has been calculated using the passive source MAM technique.

3.3. Soil Profile

The SPT N-values were recorded at 1.5 m intervals 263 down to a depth of 21 and 30 m across two boreholes. SPT values are typically recorded at specific intervals rather than at every depth interval. The depth intervals at which SPT values are recorded are determined based on engineering requirements, project specifications, and site conditions. These locations contained soil types, including sand and clay. Researchers can access existing studies in the research database to estimate Vs based on soil type and other site characteristics [82] such as Equations (1) and (2).
Vs = 97N 1/3 where N= SPT N-Value
Vs = 115N0.251 where N= SPT N-Value
The empirical relationship between Vs and N values for Kathmandu Valley (all types of soil) given by JICA and Gautam is shown in Equations (1) and (2) [83,84]. More than 50 blows are not recommended during SPT. SPT can penetrate strong soil with more than 50 hits. In this situation, it is not advised to measure the Vs using the empirical SPT relationship.
Table 1 and Table 2 shows the borehole data with SPT N value and calculation of Vs from available empirical relationship for borehole 1 and borehole 2, respectively.
Table 1 and Table 2 show that the SPT value remains constant for both boreholes after a certain depth, as SPT is not recommended above 50 blows. This recommendation is based on the understanding that excessively high SPT values (above 50 blows) may indicate that the soil is either too dense or too hard for the standard Split Spoon Sampler to penetrate effectively. When SPT values exceed 50 blows, the reliability of the test results may be compromised due to factors such as sampler refusal, ground disturbance, or the potential for damage to the equipment [85]. The correlation between SPT N-values and Vs is typically established based on empirical relationships derived from field data. These correlations are often limited to SPT values within a certain range (typically below 50 blows). When SPT values exceed this threshold, the reliability of these correlations may decrease, leading to less accurate estimates of Vs. When SPT values exceed 50 blows, it may indicate the presence of exceptionally dense or hard soil layers. Using standard correlations in such cases may result in an overestimation of Vs, as these correlations may not accurately represent the behavior of very dense or hard soils. Although several correlations are recommended for the representation of Vs-N equations by several researchers, Kathmandu and its periphery areas lack correlations based on soil types and depth. Hence, in the current study, the Vs-depth correlation was developed and proposed for the clay and sandy soil which are deposited as loose-to-densely compacted form.

4. Results

4.1. Geotechnical Investigation

In borehole 1, up to 17m of silty sand mix little clay water colour brown to white soil was found, and then a further 18 m of silty sand with boulders water colour brown to white soil was encountered to the 21 m depth of the investigation.
In borehole 2, up to 22 m of silty sand mix little clay water colour brown to white was found, and a further 23 m of silty sand with boulders water colour brown to white soil was encountered to the 30 m depth of the investigation.

4.2. Geophysical Investigation

4.2.1. MASW

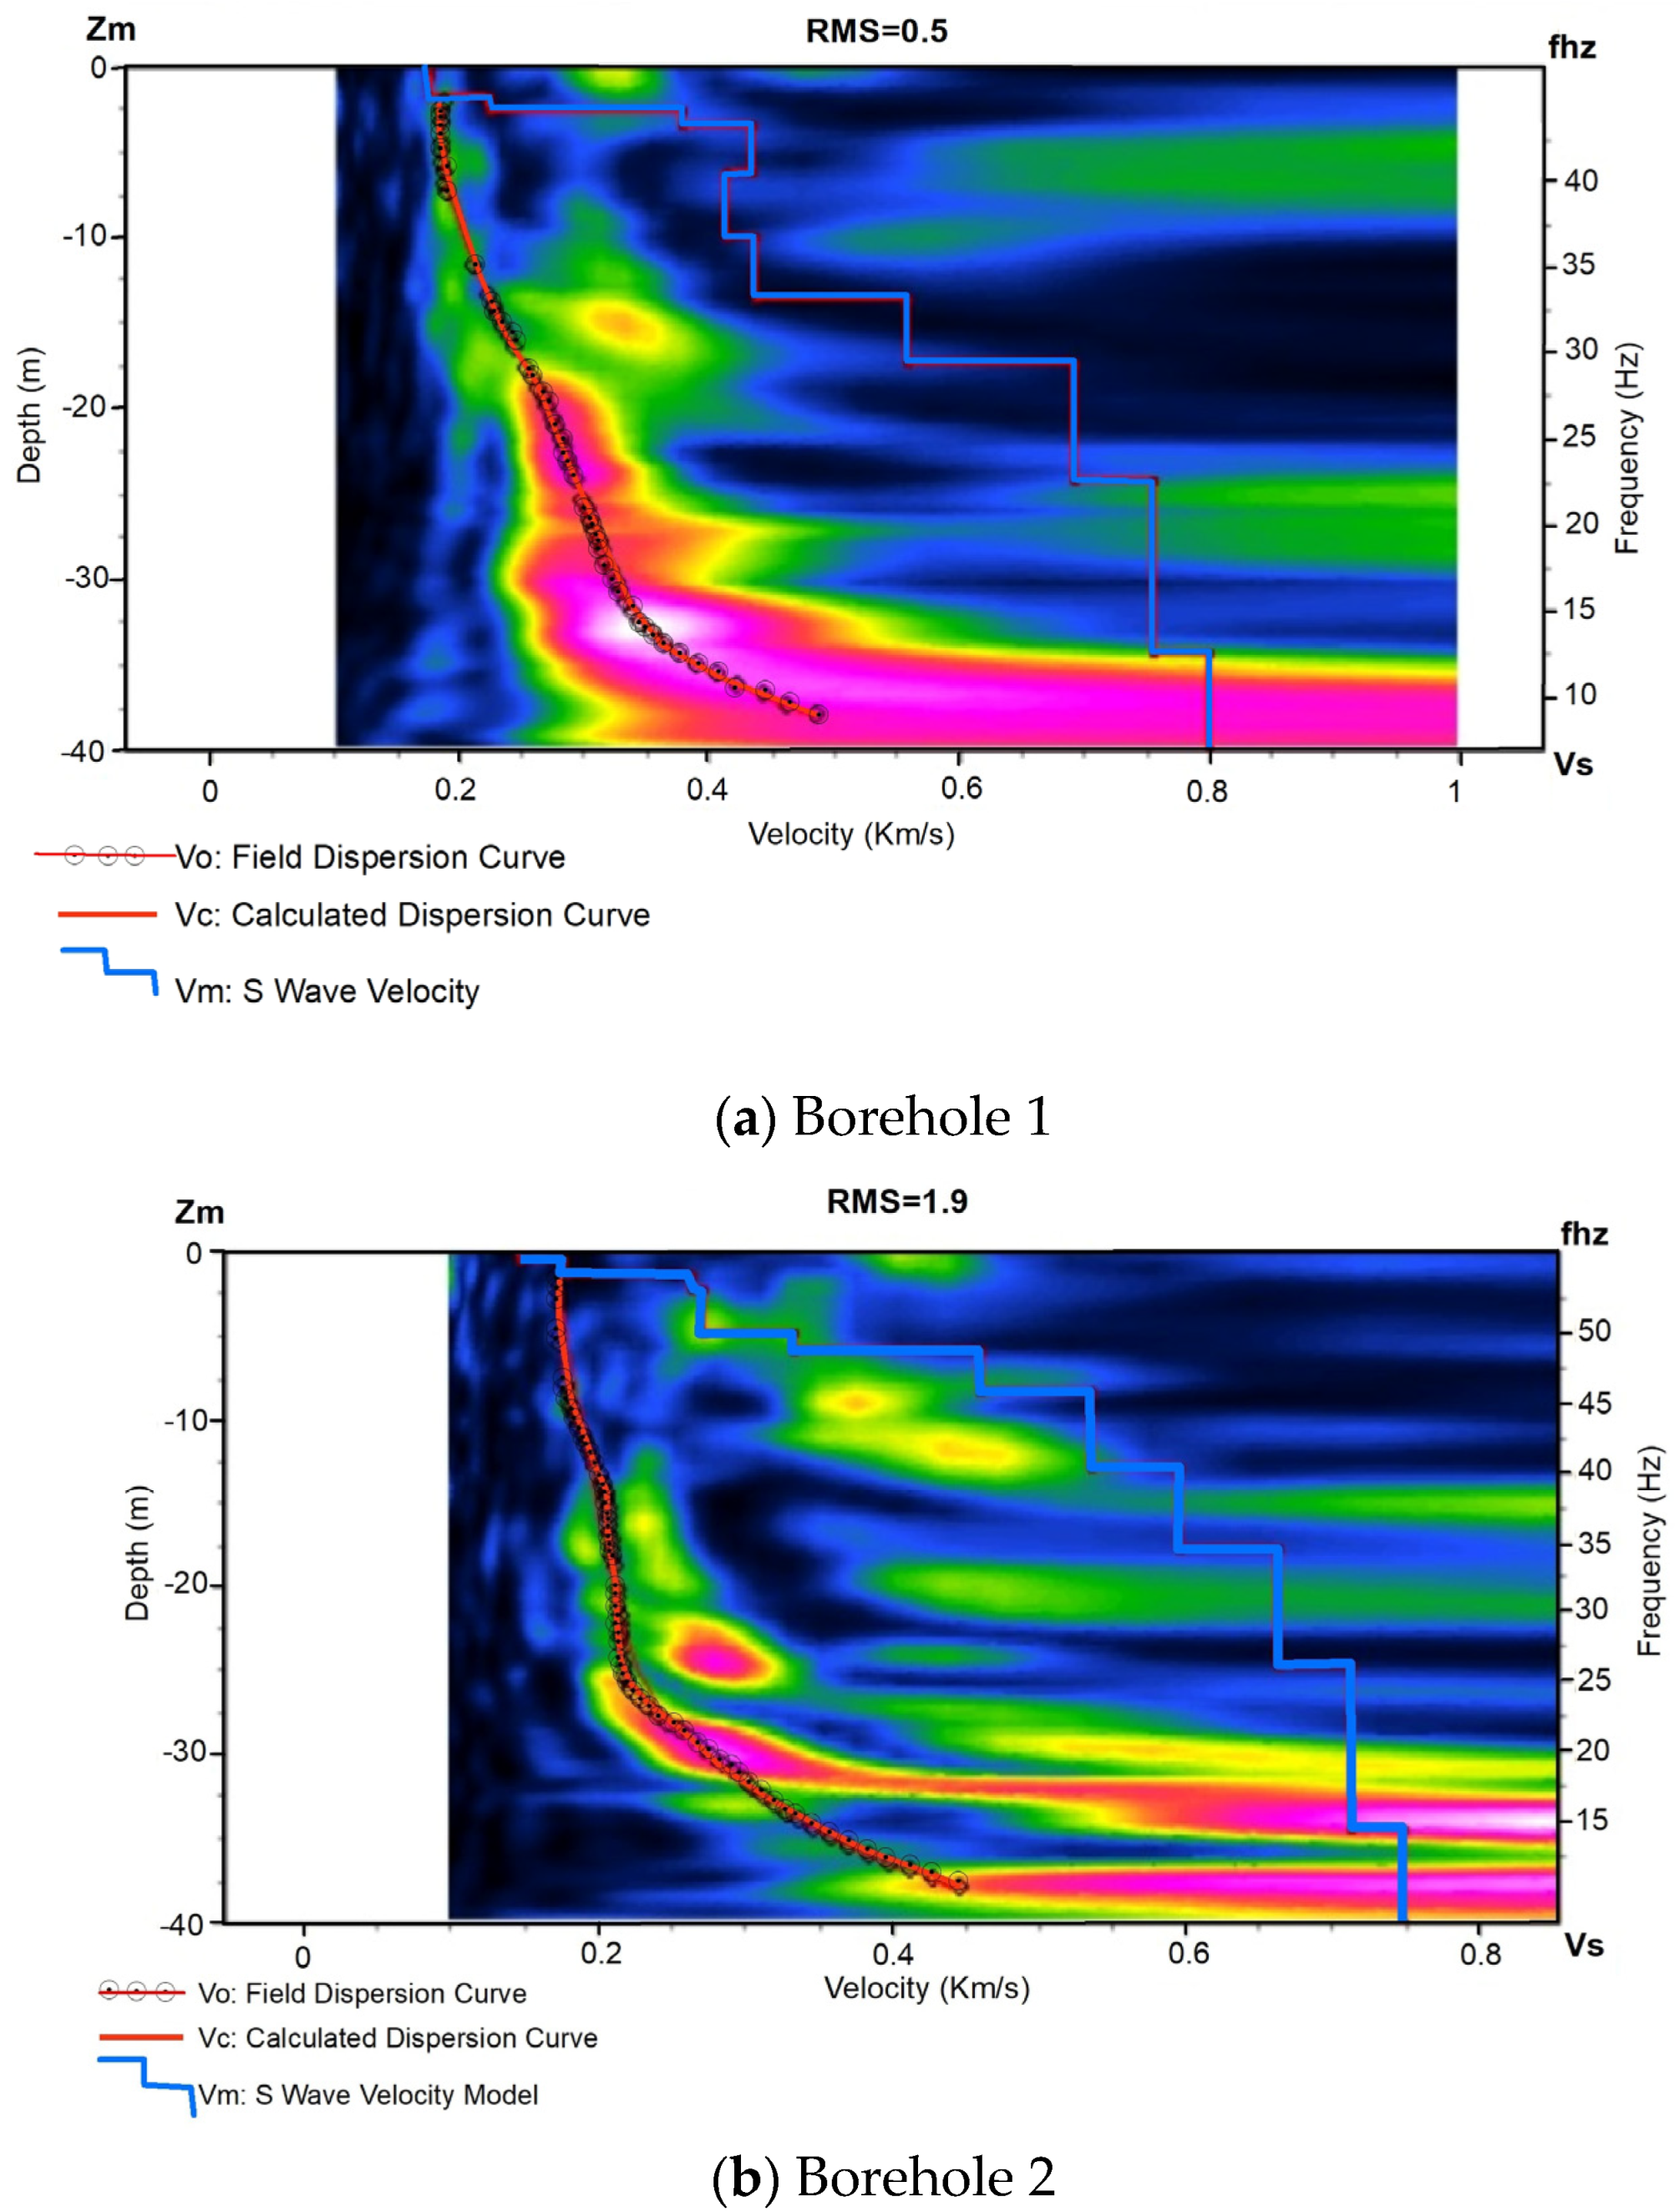
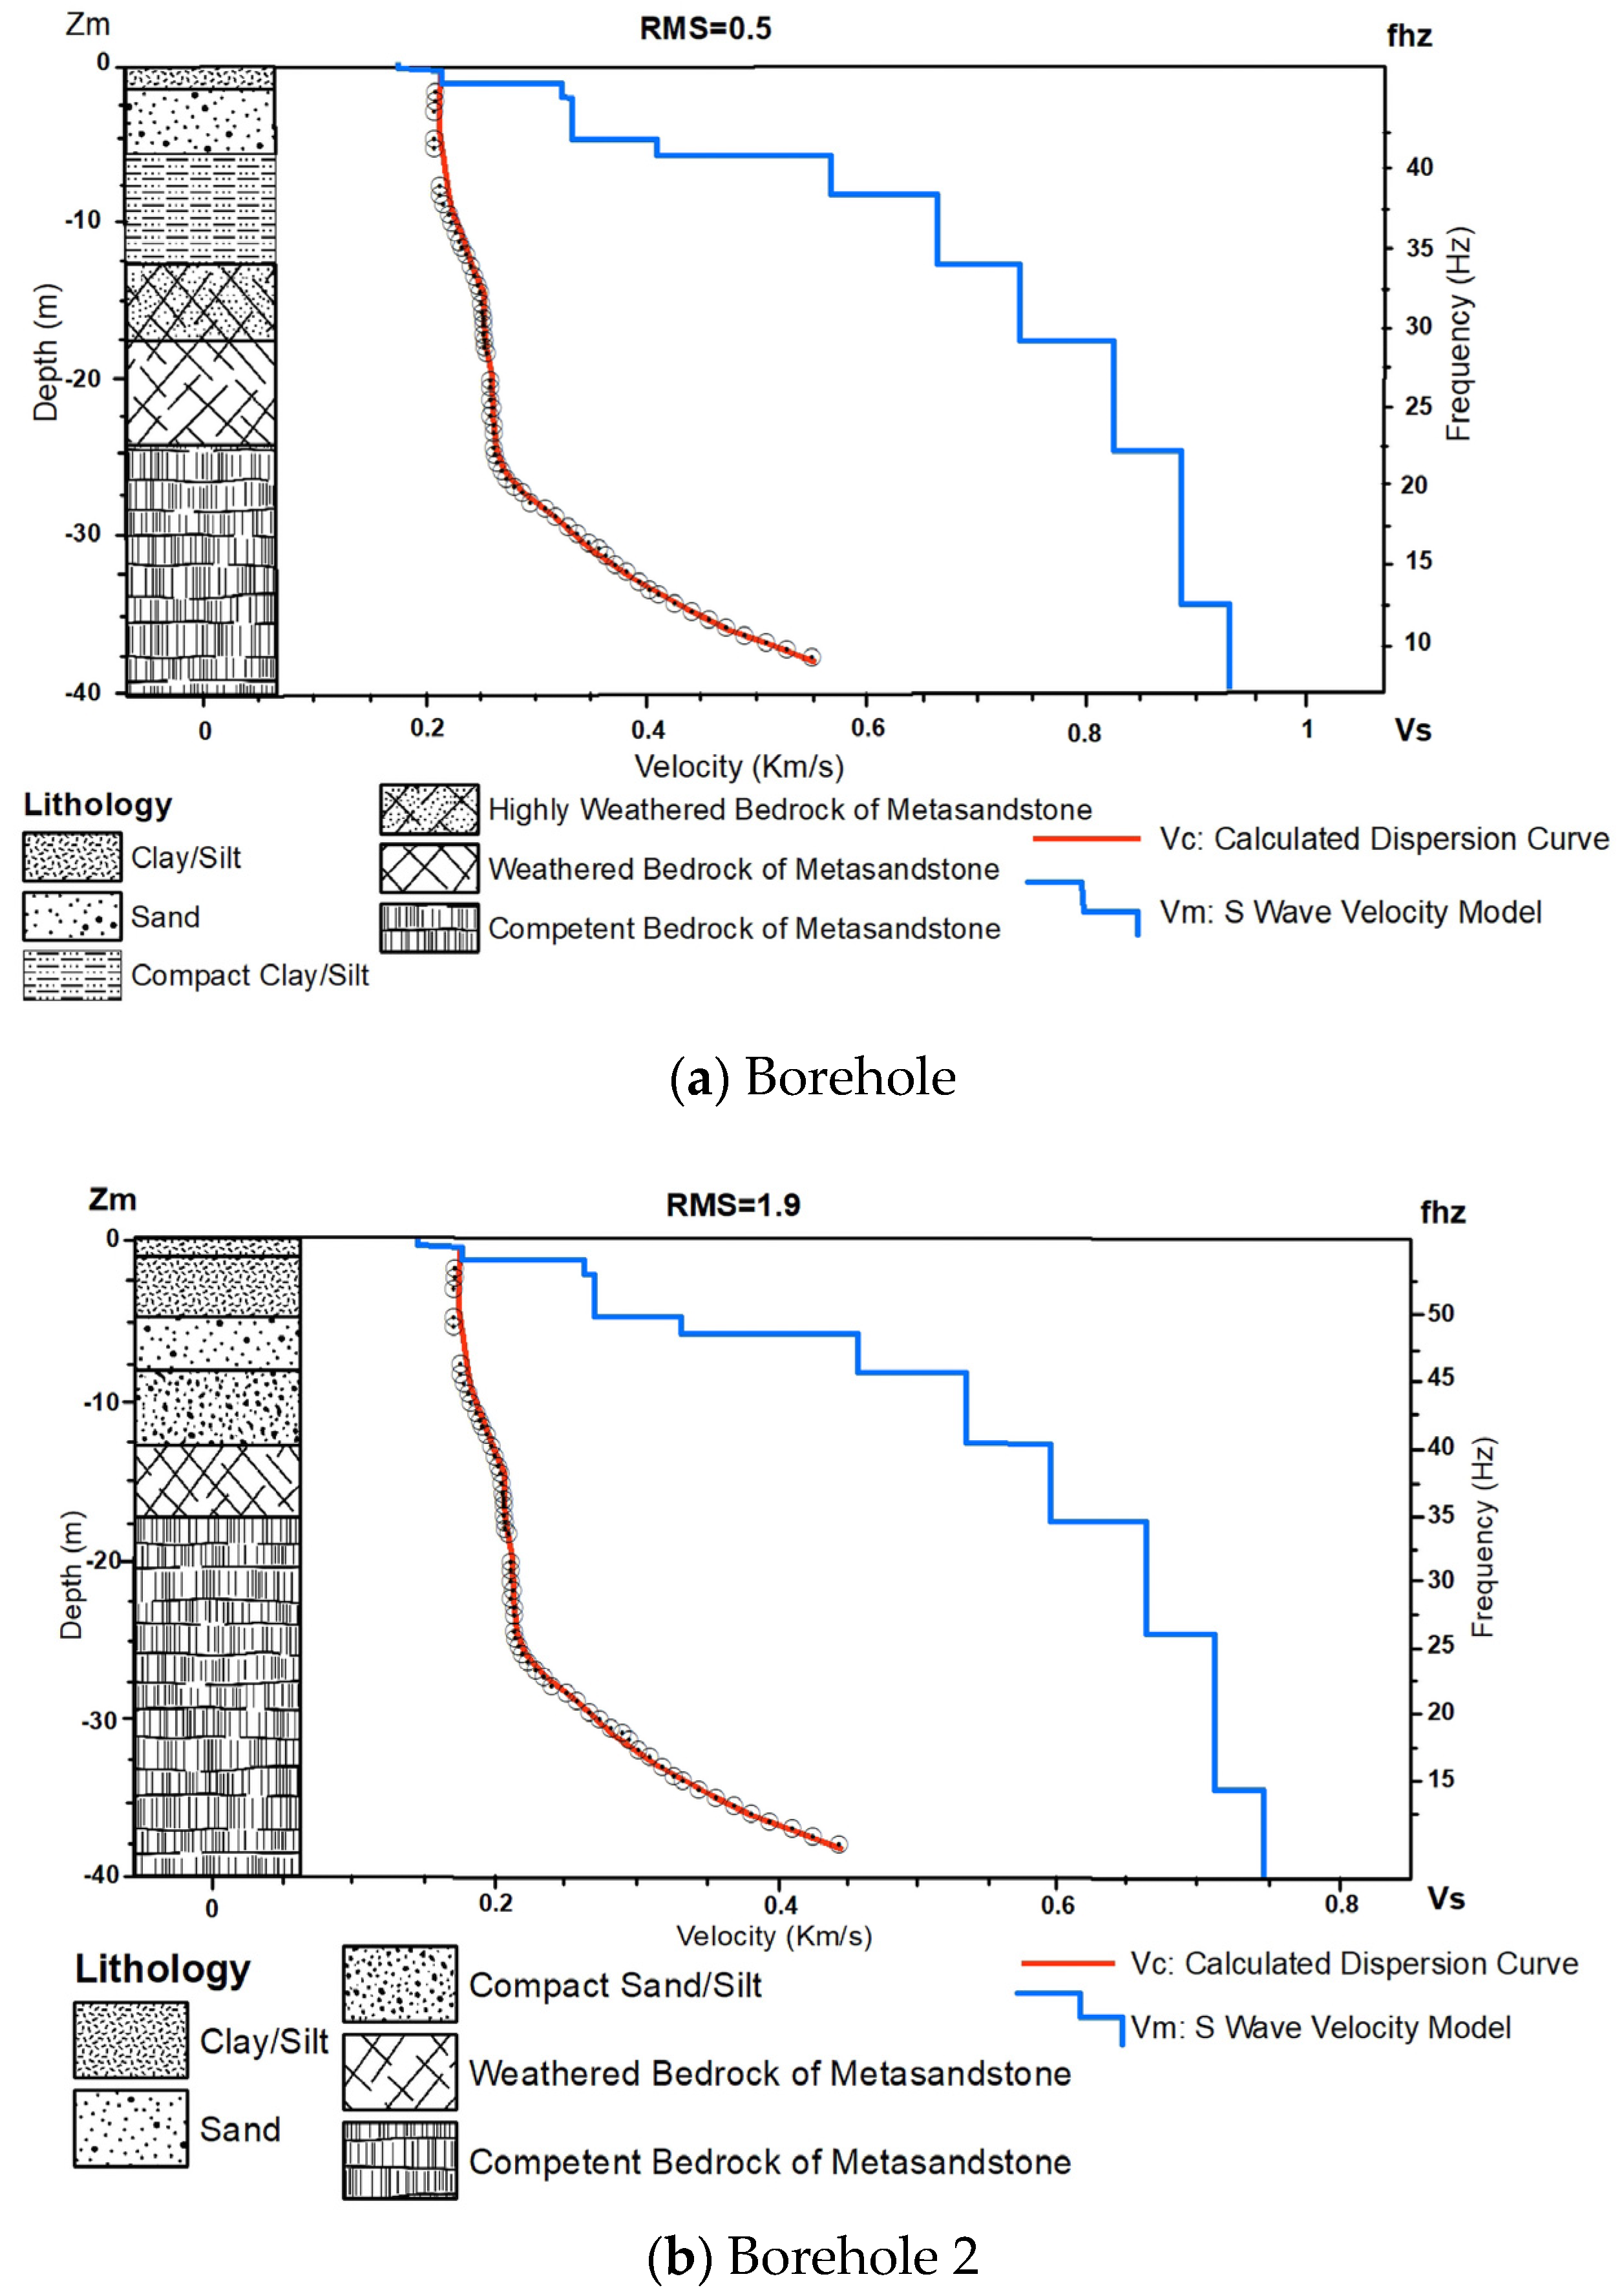
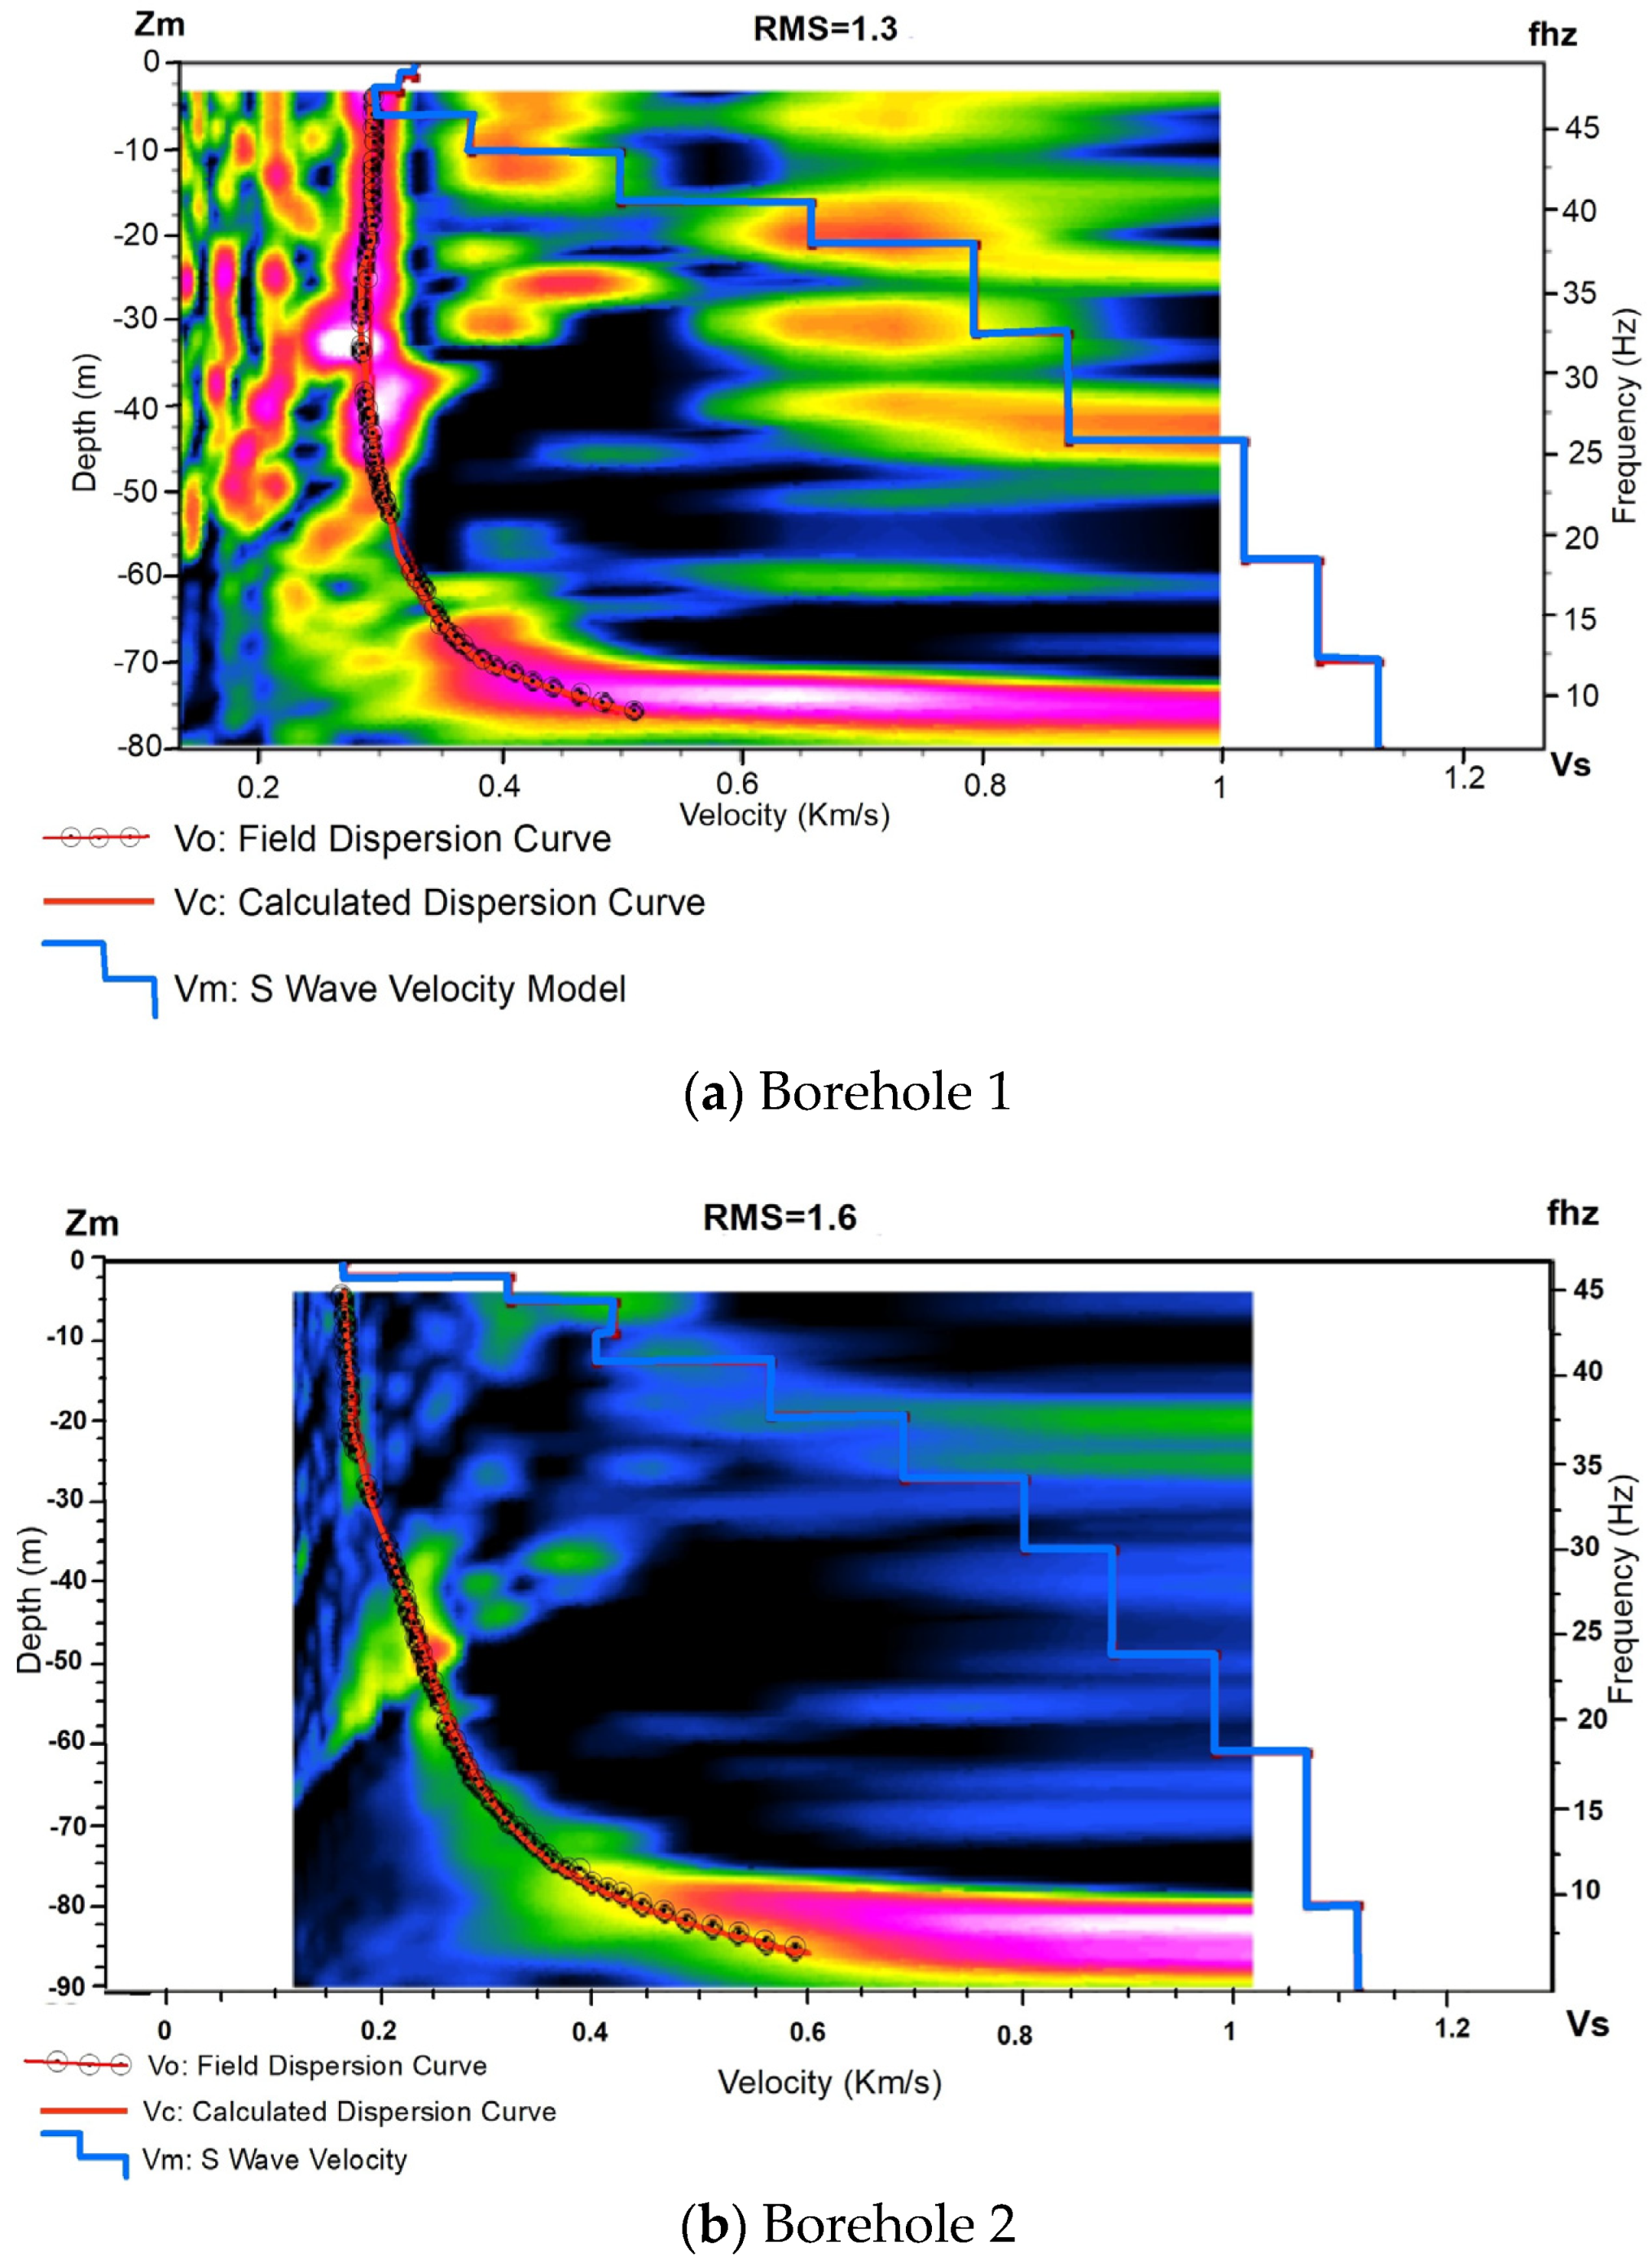
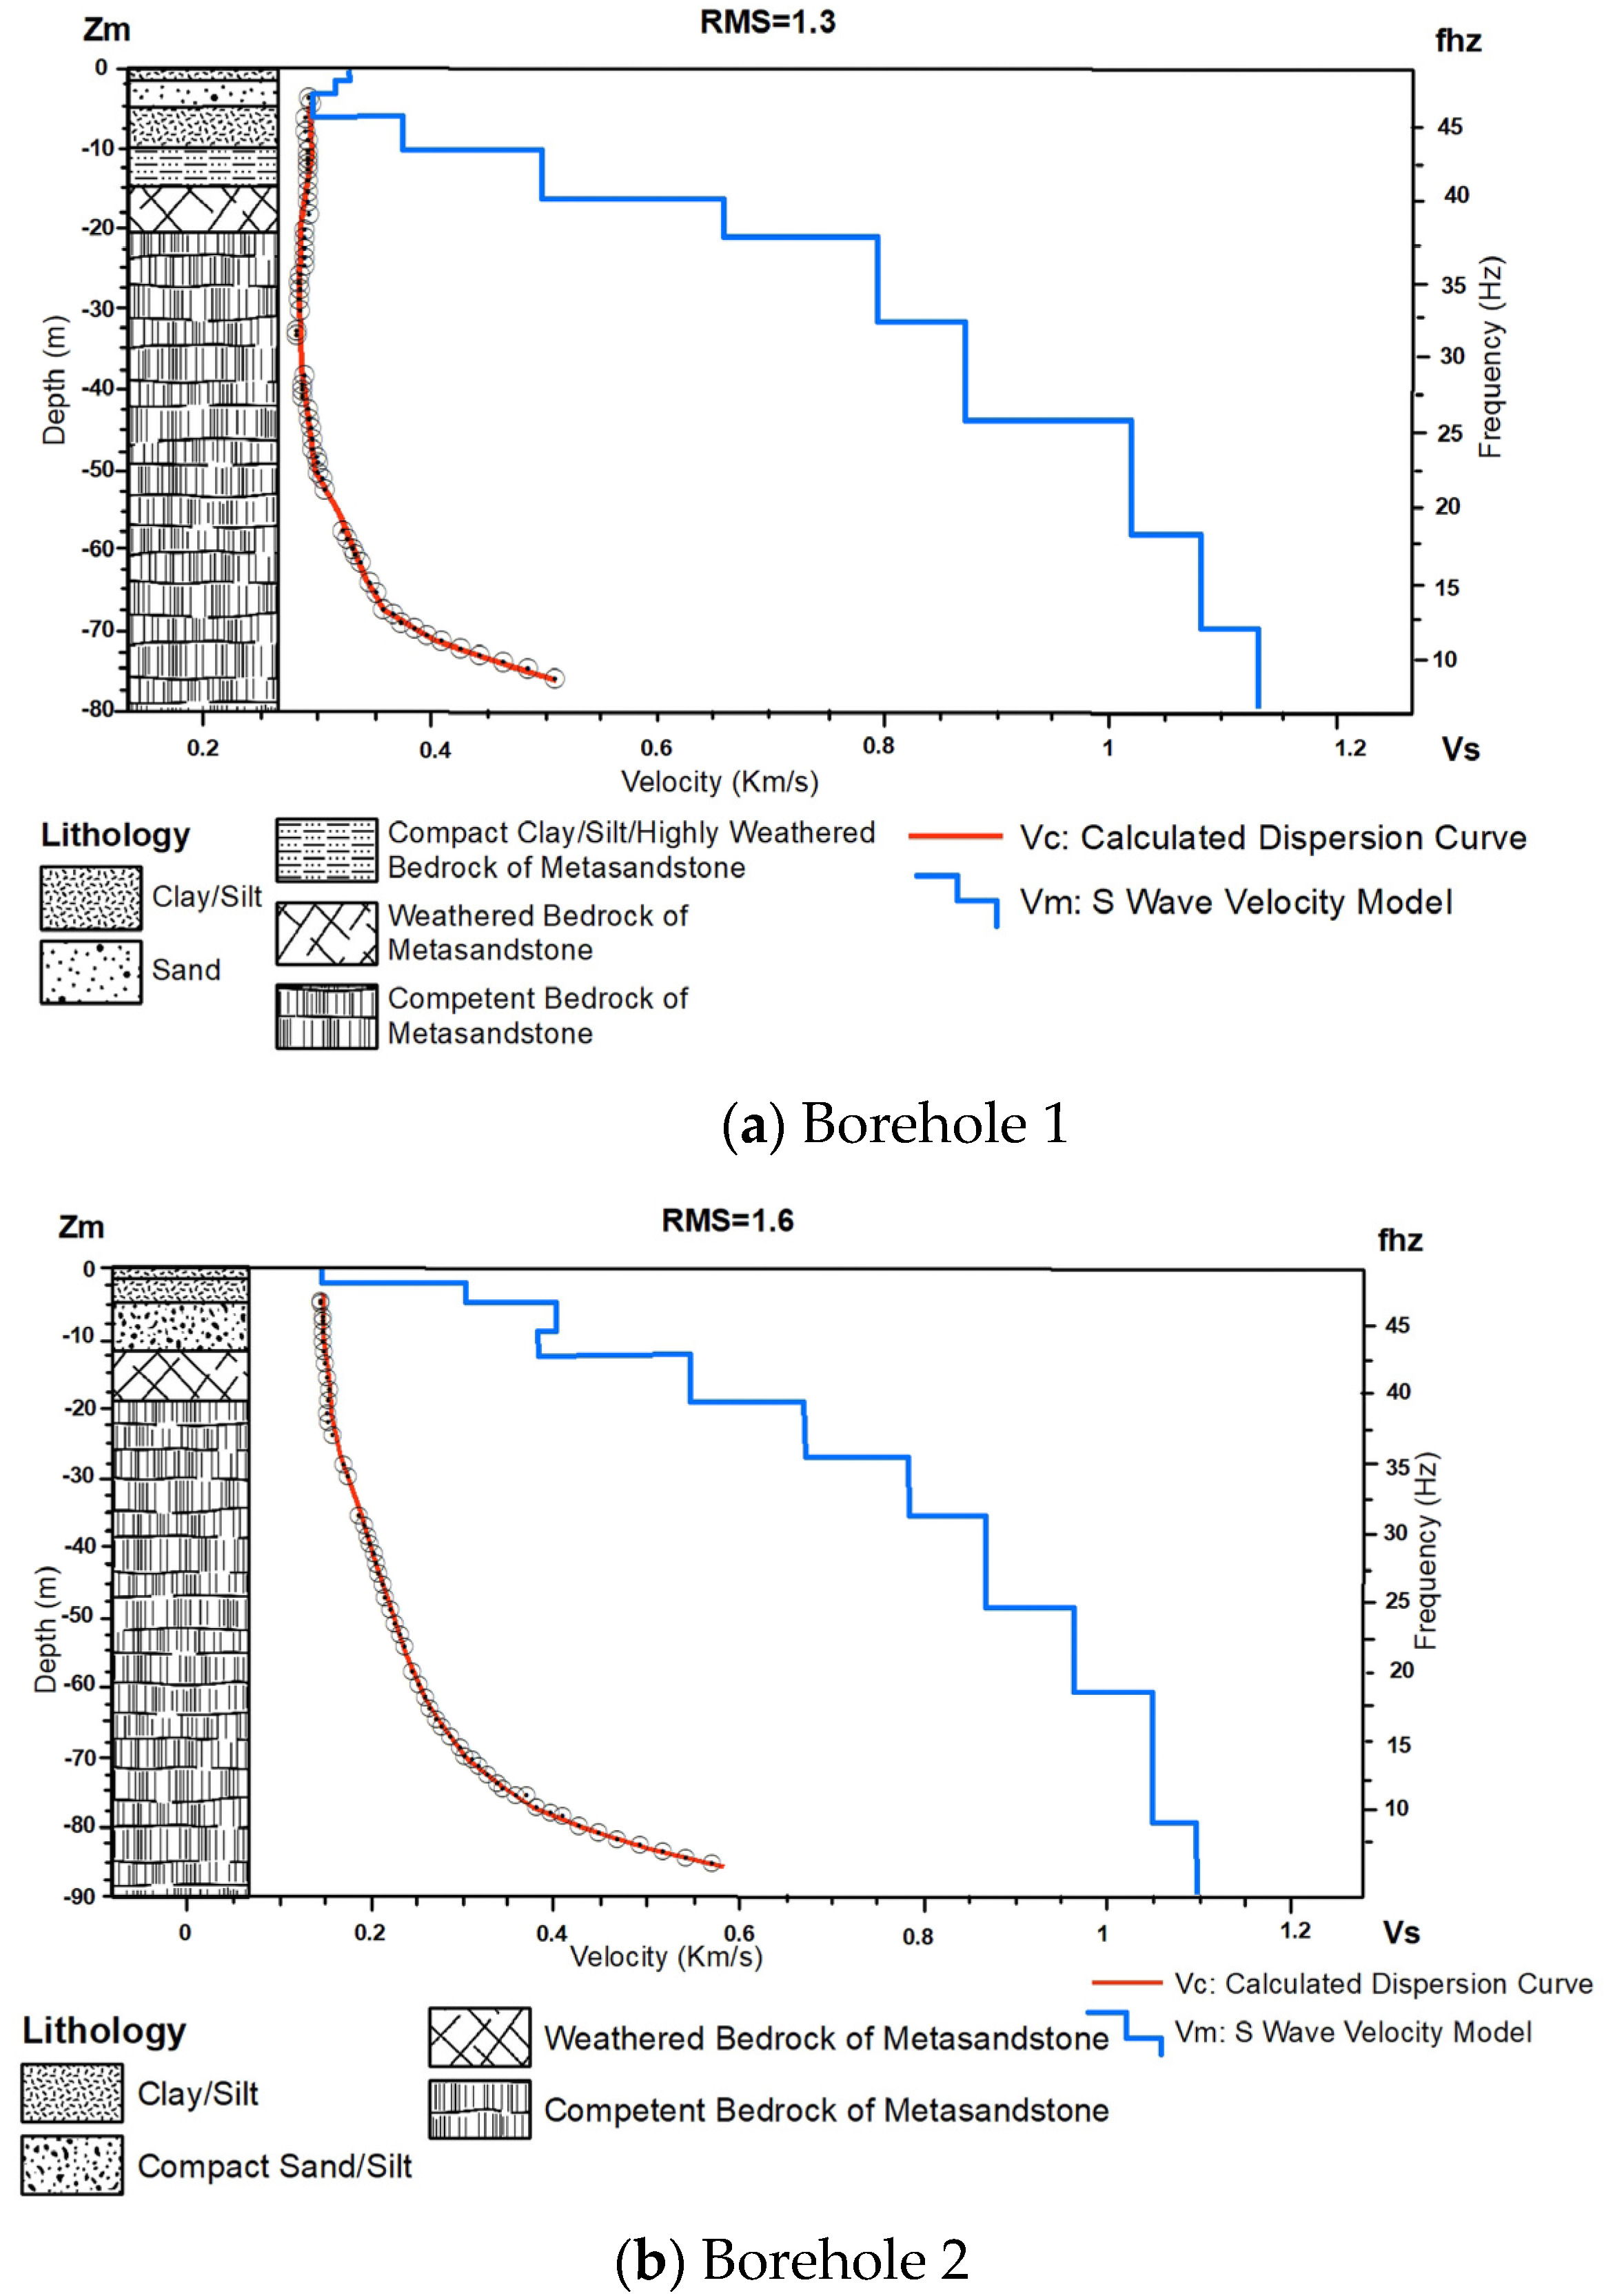
The processing steps consisting of transformation seismic data from time to frequency domain, calculation of dispersion curve, identification of fundamental mode and inversion of the dispersion curves to obtain a 1D Vs distribution to the subsurface and finally geological interpretation subsurface has been conducted at two locations (Figure 5). The depth (m) versus Vs (km/s) obtained from MASW for boreholes 1 and 2 along with their dispersion image are shown in Figure 9, respectively. Vc represents phase velocity dispersion curve, Vo represents picked dispersion, and Vm represents calculated S-wave velocity model. The depth (m) versus Vs (km/s) obtained from MASW for borehole 1 and borehole 2, along with the geological interpretation, are shown in Figure 10, respectively. Geological interpretation has been made based on the relation between soil type, Vs, allowable bearing capacity (M), and site-specific geological conditions observed during the research [86,87].
At location MASW-1 (Borehole 1), velocity depth profile indicates multiple velocity layers in the area showing different lithologies. The top layer having a Vs less than 176 m/s up to a depth of 1.67 m indicates clay/silt. The second layer with Vs 176–434 m/s up to depth 6.19 m indicates sand. The third layer with Vs 412–437 m/s up to 13.63 m indicates compact clay/silt. The fourth layer with Vs 437–558 m/s up to a depth of 17.36 m indicates the highly weathered bedrock of meta-sandstone. The fifth layer with Vs 558 m/s to 693 m/s up to 24.2 m indicates the weathered bedrock of meta-sandstone. The sixth layer with Vs 693–756 m/s below 24.2 m indicates competent bedrock of meta-sandstone in the area [86,87].
At location MASW-2 (Borehole 2), velocity depth profile indicates multiple velocity layers in the area showing different lithologies. The top layer having a Vs below 176 m/s up to a depth of 1.3 m indicates clay/silt. The second layer with Vs 176–217 m/s up to the depth of 4.8 m indicates clay/silt. The third layer with Vs between 217–461 m/s up to the depth of 8.26 m indicates sand. The fourth layer with Vs between 461–536 m/s up to the depth of 12.84 m indicates compact sand/silt. The fifth layer with a Vs between 536–595 m/s up to the depth of 17.8 m indicates weathered bedrock of meta-sandstone. The sixth layer with the Vs between 595–664 m/s below the depth of 17.8 m indicates competent bedrock of metasandstone [86,87].
The RMS error for both 1D Vs final models is less than 2%, providing a high level of confidence.

4.2.2. MAM

The acquired surface wave data from the ambient noises are processed to determine and extract a dispersion curve using the processing technique available on ZondST2D Software, license dongle: 97020786AB082F46 to obtain a 1D Vs distribution of the subsurface and its geological interpretation at two locations. The depth (m) versus Vs (km/s) obtained from MAM for boreholes 1 and 2 along with their dispersion image are shown in Figure 11, respectively. Vc represents phase velocity dispersion curve, Vo represents picked dispersion, and Vm represents calculated S-wave velocity model. The depth (m) versus Vs (km/s) obtained from MAM for borehole 1 and borehole 2 along with the geological interpretation are shown in Figure 12, respectively. Geological interpretation has been made based on the relation between soil type, Vs, allowable bearing capacity (M), and site-specific geological conditions observed during the research [86,87].
At location, MAM-1 (Borehole 1), velocity depth profile indicates multiple velocity layers in the area showing different lithologies. The top layer with Vs below 330 m/s up to the depth of 1.7 m indicates clay/silt which is compacted on surface. The second layer with Vs between 298–330 m/s up to the depth of 6.4 m indicates sand. The third layer with Vs between 298–376 m/s up to the depth of 10.6 m indicates slightly compacted clay/silt. The fourth layer with Vs between 376–500 m/s up to the depth of 16.4 m indicates compact clay/silt/highly weathered bedrock of meta-sandstone. The fifth layer with the Vs between 500–660 m/s up to the depth of 21.4 m indicates the weathered bedrock of metasandstone. The sixth layer with the Vs between 660–796 m/s below the depth of 21.4 m indicates competent bedrock of metasandstone [86,87].
At location MAM-2 (Borehole 2), velocity depth profile indicates multiple velocity layers in the area showing different lithologies. The top layer with Vs below 149 m/s up to the depth of 1.8 m indicates clay/silt. The second layer with Vs between 149–304 m/s up to the depth of 5.2 m indicates clay/silt. The third layer with Vs between 304–403 m/s up to the depth of 12.6 m indicates compact sand/silt. The fourth layer with Vs between 403–546 m/s up to the depth of 19.2 m indicates the weathered bedrock of metasandstone. The fifth layer with the Vs between 546–673 m/s below the depth of 19.2 m indicates competent bedrock of metasandstone [86,87].
The RMS error for both 1D Vs final models is less than 1.6%, providing a high level of confidence.
The geological setting of KURT study area primarily consists of meta-sandstone with intercalations of phyllite from the Tistung formation of the Kathmandu complex. Colluvial and residual soils cover most of the area, with the presence of meta-sandstone, phyllite, clay, sand, gravel, and exposed weathered rocks. Understanding these geological features aids in interpreting variations in Vs profiles, offering insights into subsurface heterogeneity and aiding seismic hazard assessment and engineering design for earthquake resilience.
Table 3 and Table 4 shows the Vs obtained from MASW/MAM Survey in borehole 1 and 2, respectively.
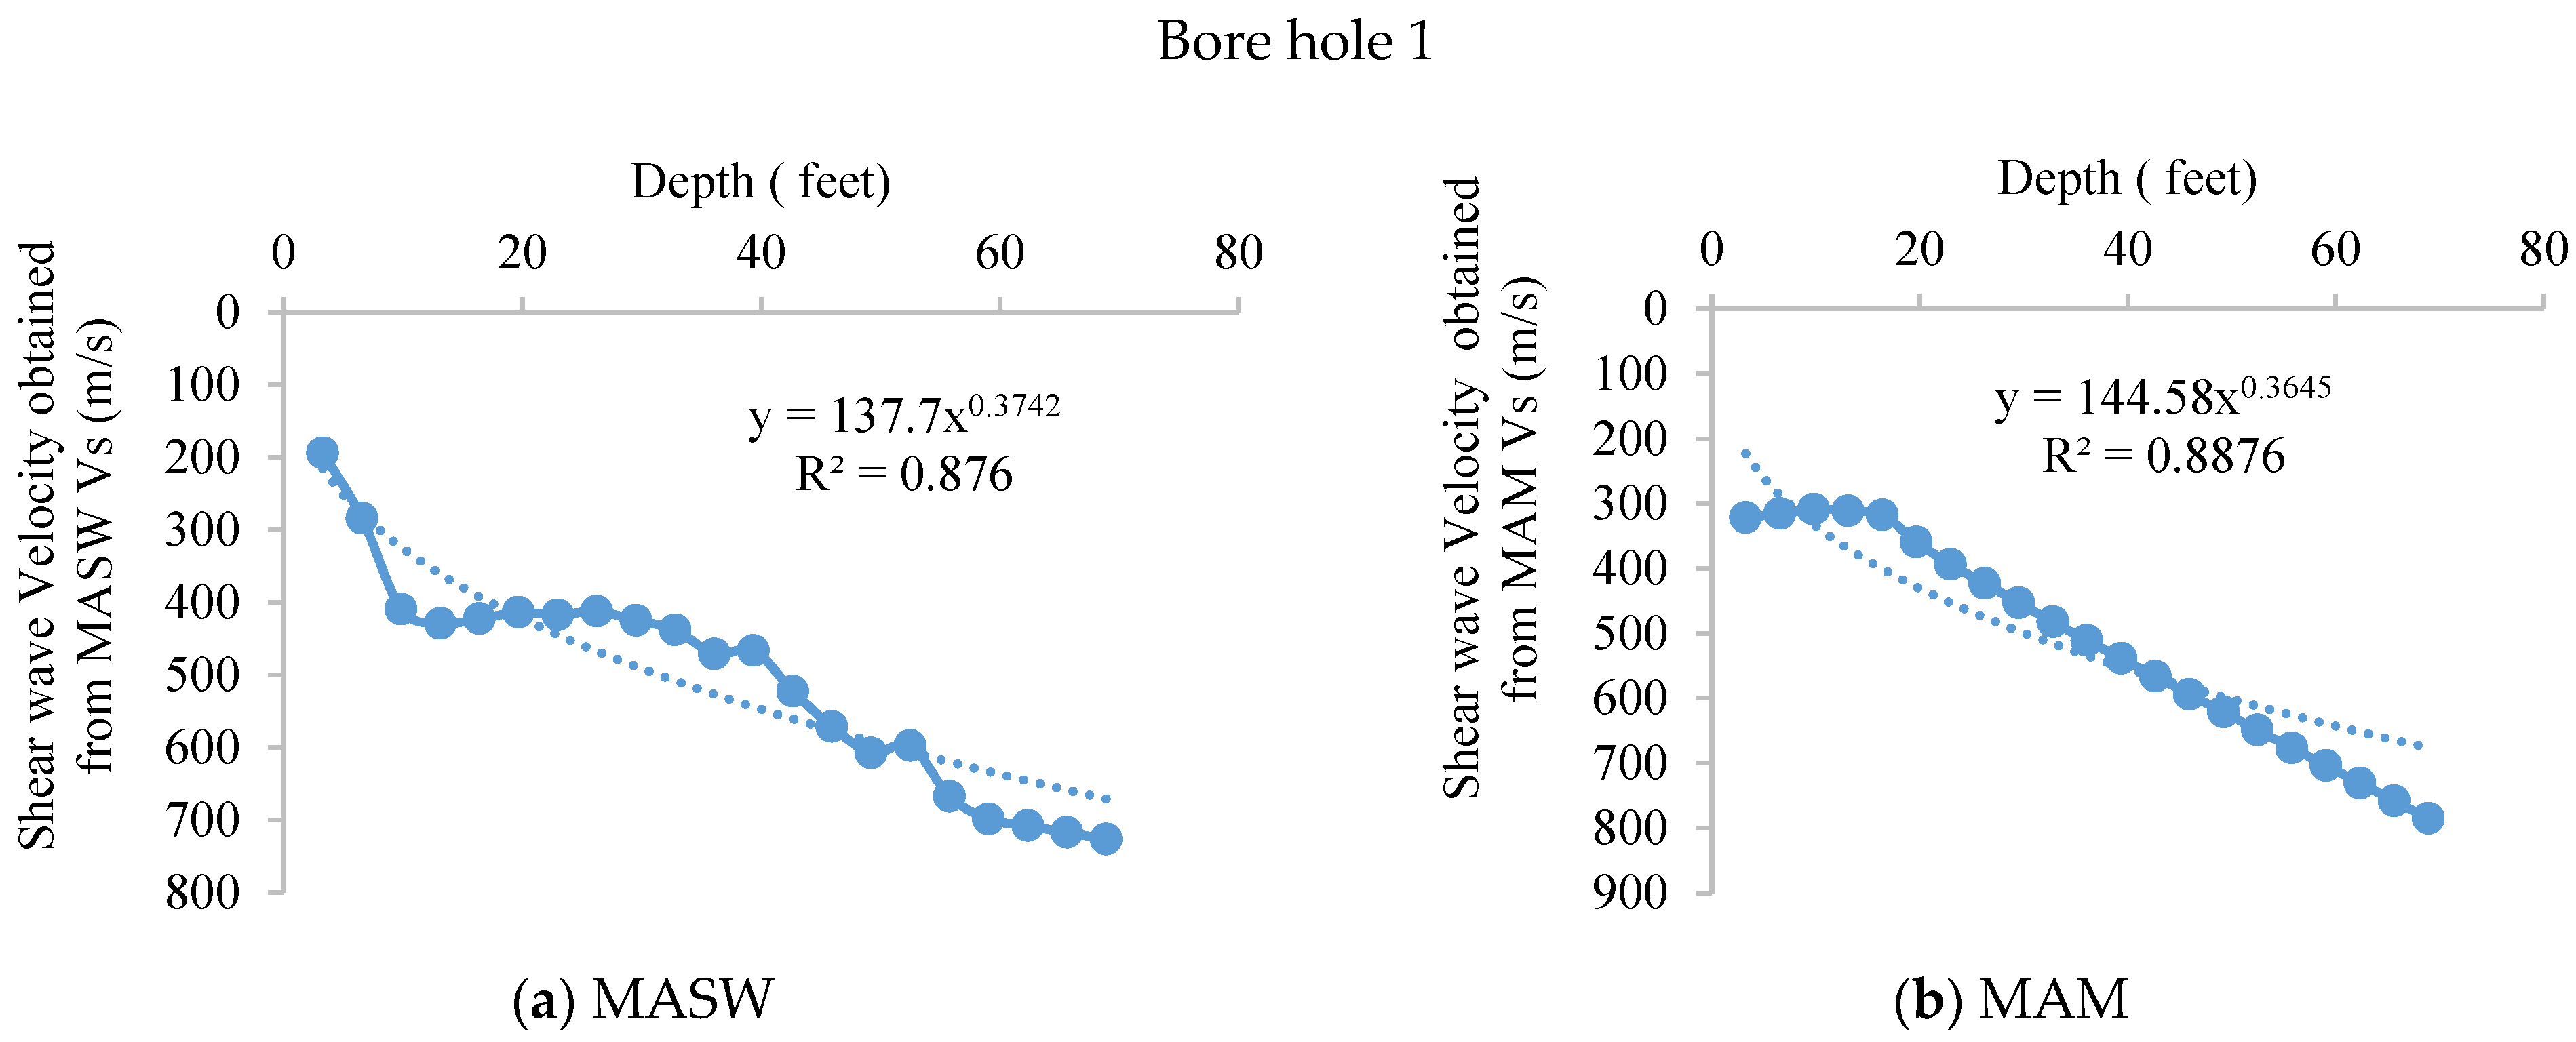
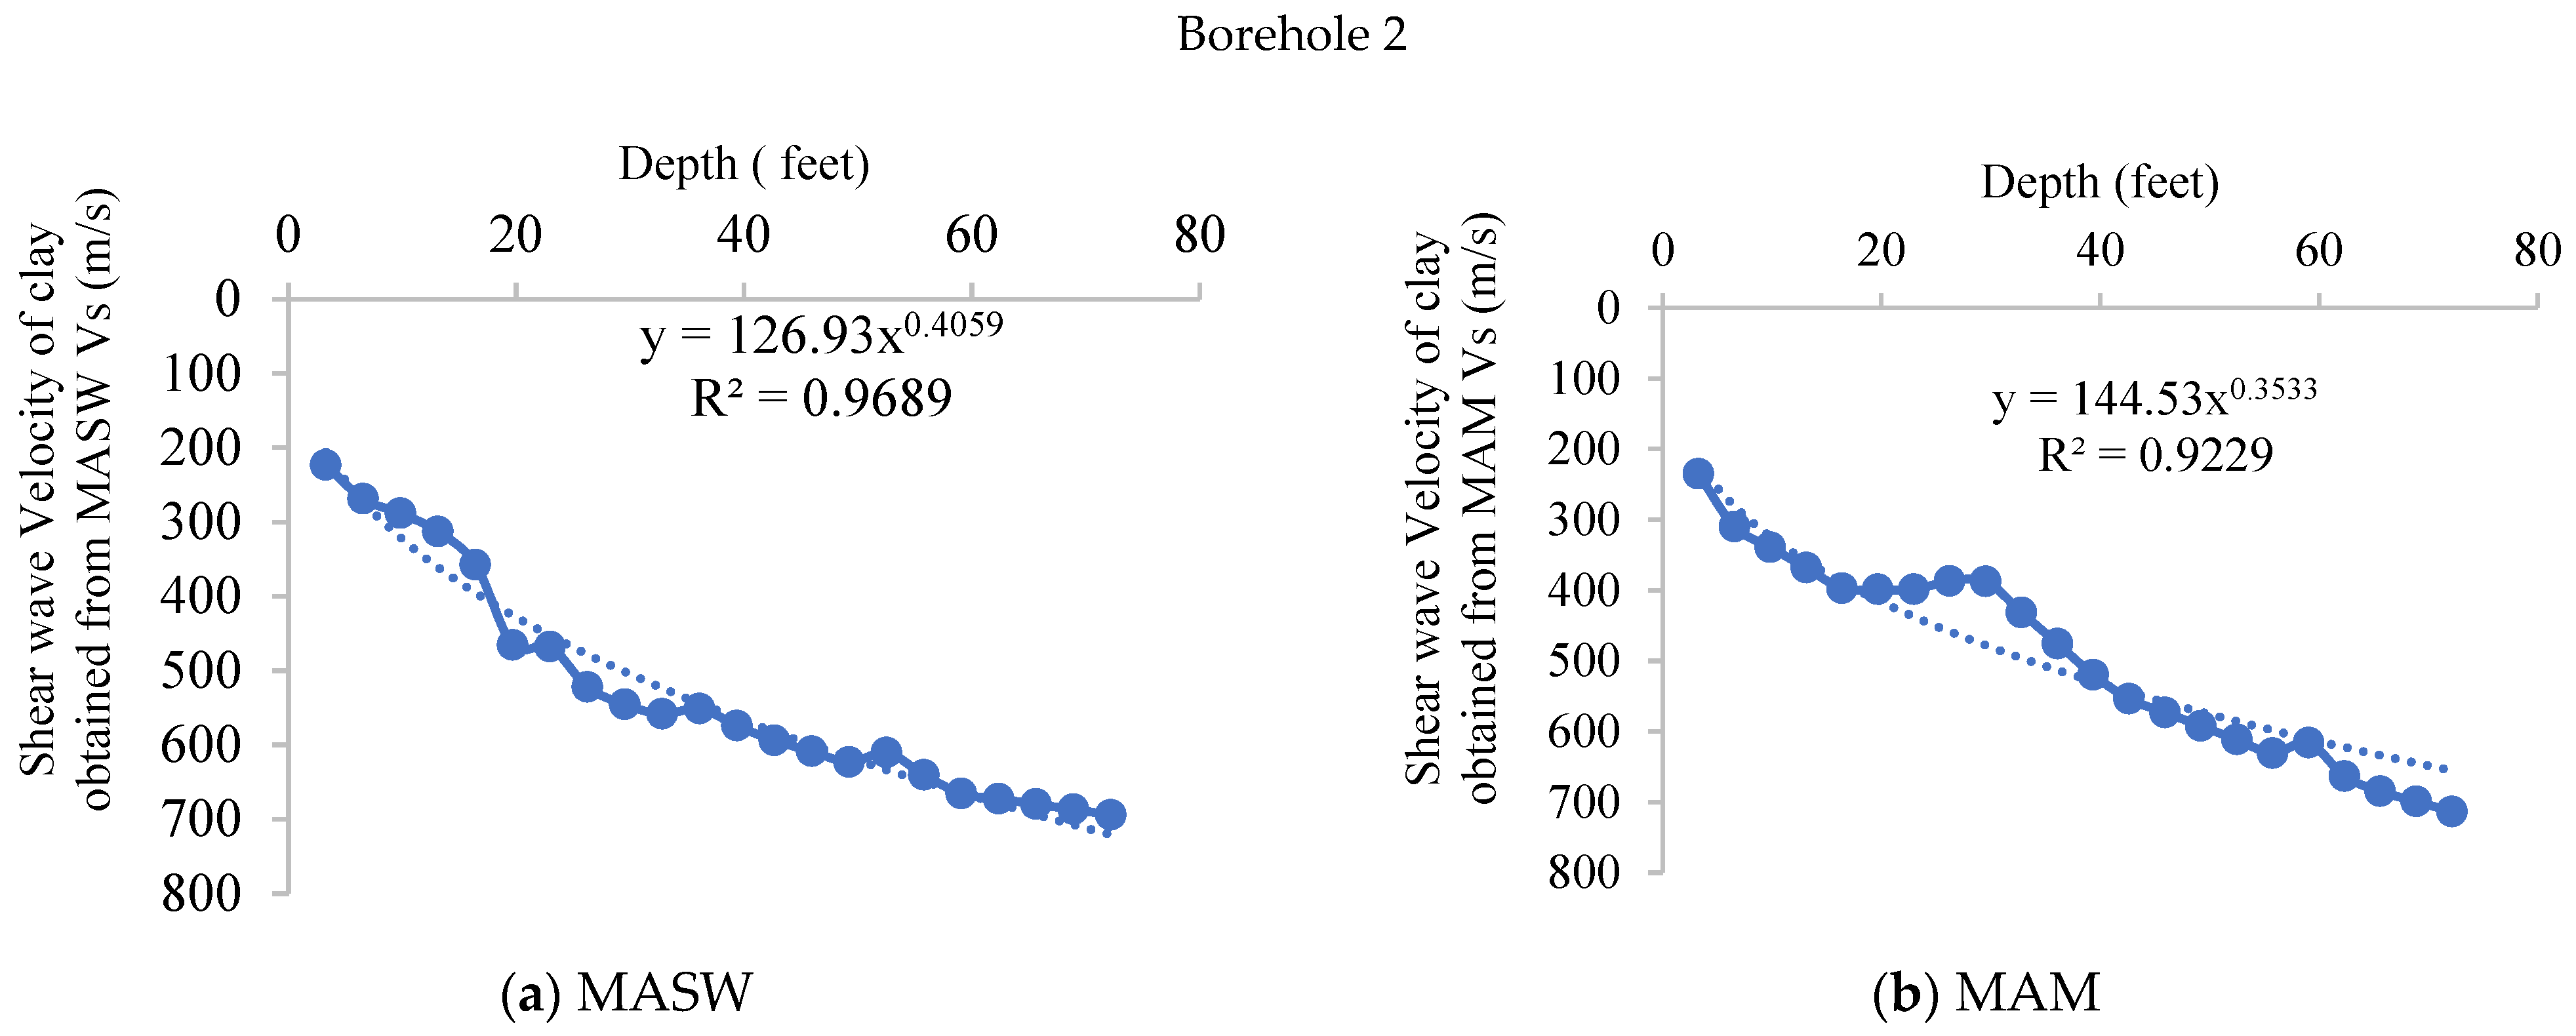
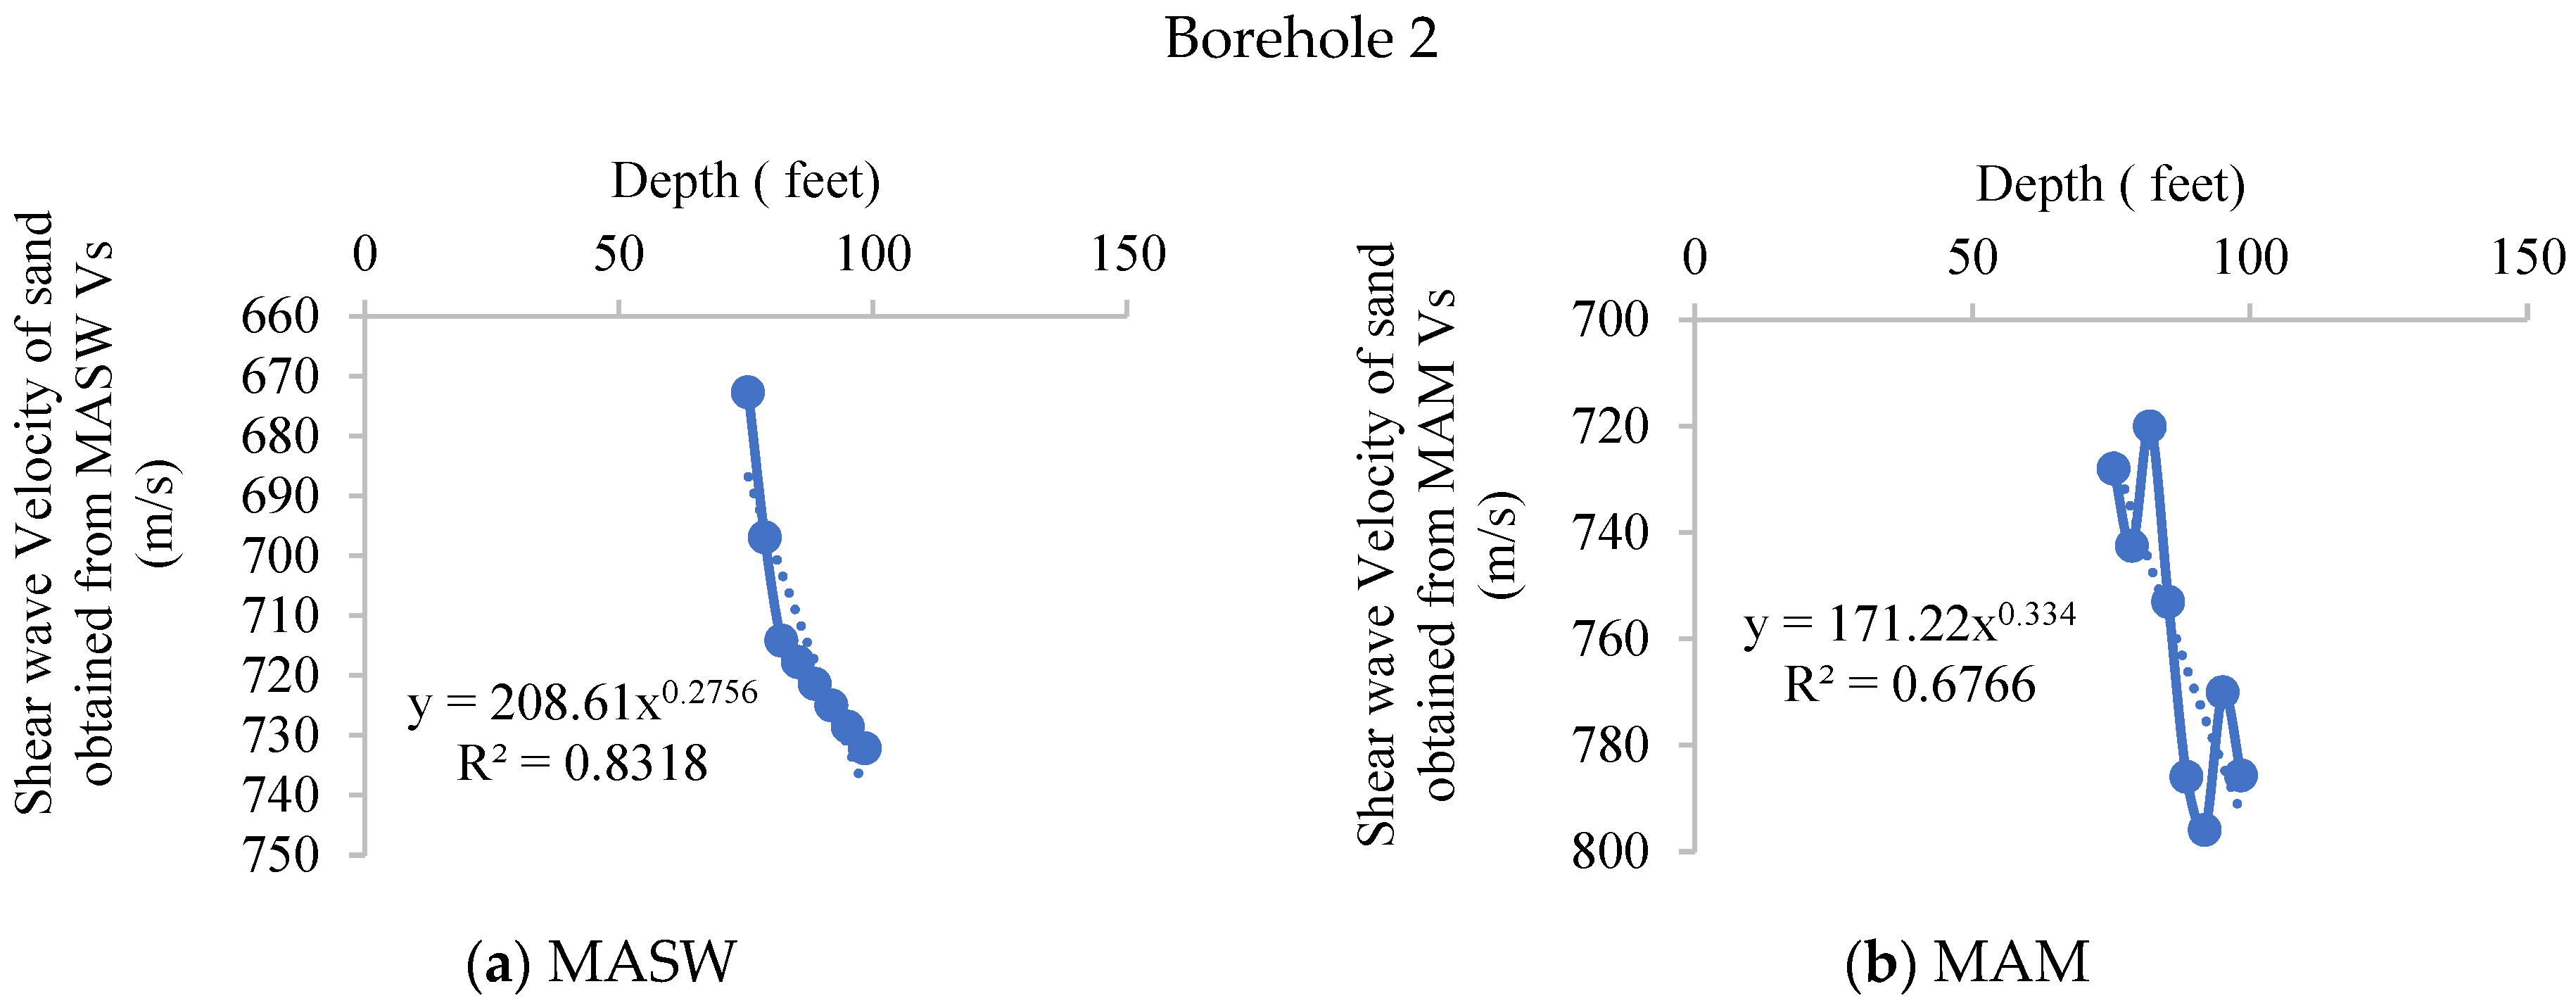
The empirical equations are obtained after the correlation analysis from the results of MASW and MAM. The selected equations were evaluated against the available field data to assess their predictive accuracy across different depths. Vs is calculated from each equation with the measured values obtained from geotechnical investigations, ensuring that the chosen empirical relations yield reliable results within the study area’s depth range. Figure 13a,b, Figure 14a,b and Figure 15a,b shows the Vs-depth correlation for borehole 1 and borehole 2 from MASW and MAM, respectively. It can be observed that the coefficient of correlation is higher for the MASW recorded data.
Hence, from Figure 13, Figure 14 and Figure 15, it can be observed that the best correlation equation is Vs = 126.93D0.4059 for clay, Vs = 208.61D0.2756 for sand with the highest coefficient of correlation equal to 0.9658 and 0.8305, respectively, and is finally recommended (proposed) where Vs is shear wave velocity and D is depth in feet. In other words, an empirical relation with higher R2 is recommended for further study.
Moreover, Ohta, Goto, Fumal, and Campbell have provided empirical relationships to calculate the Vs as shown in Equations (3)–(5), respectively [88,89,90]
Vs for Clay= 181D0.308 and Vs for Sand= 232D0.30, where D is depth in feet
Vs for Clays = 462 + 15.4 + D and Vs for sand = 471D0.20, where D is depth in feet
Vs for soft soil = 220(D + 5.33)0.385, Vs for intermediate soil = 262(D + 5.24)0.402
where D is depth in feet.
Also, Vs from the above empirical equation was calculated and the comparison was carried out with the proposed empirical equation. Table 5 and Table 6 show the Vs calculated from Ohta, Goto, Fumal, and Campbell’s equation, and the proposed empirical relationship using the data obtained from the geotechnical test.
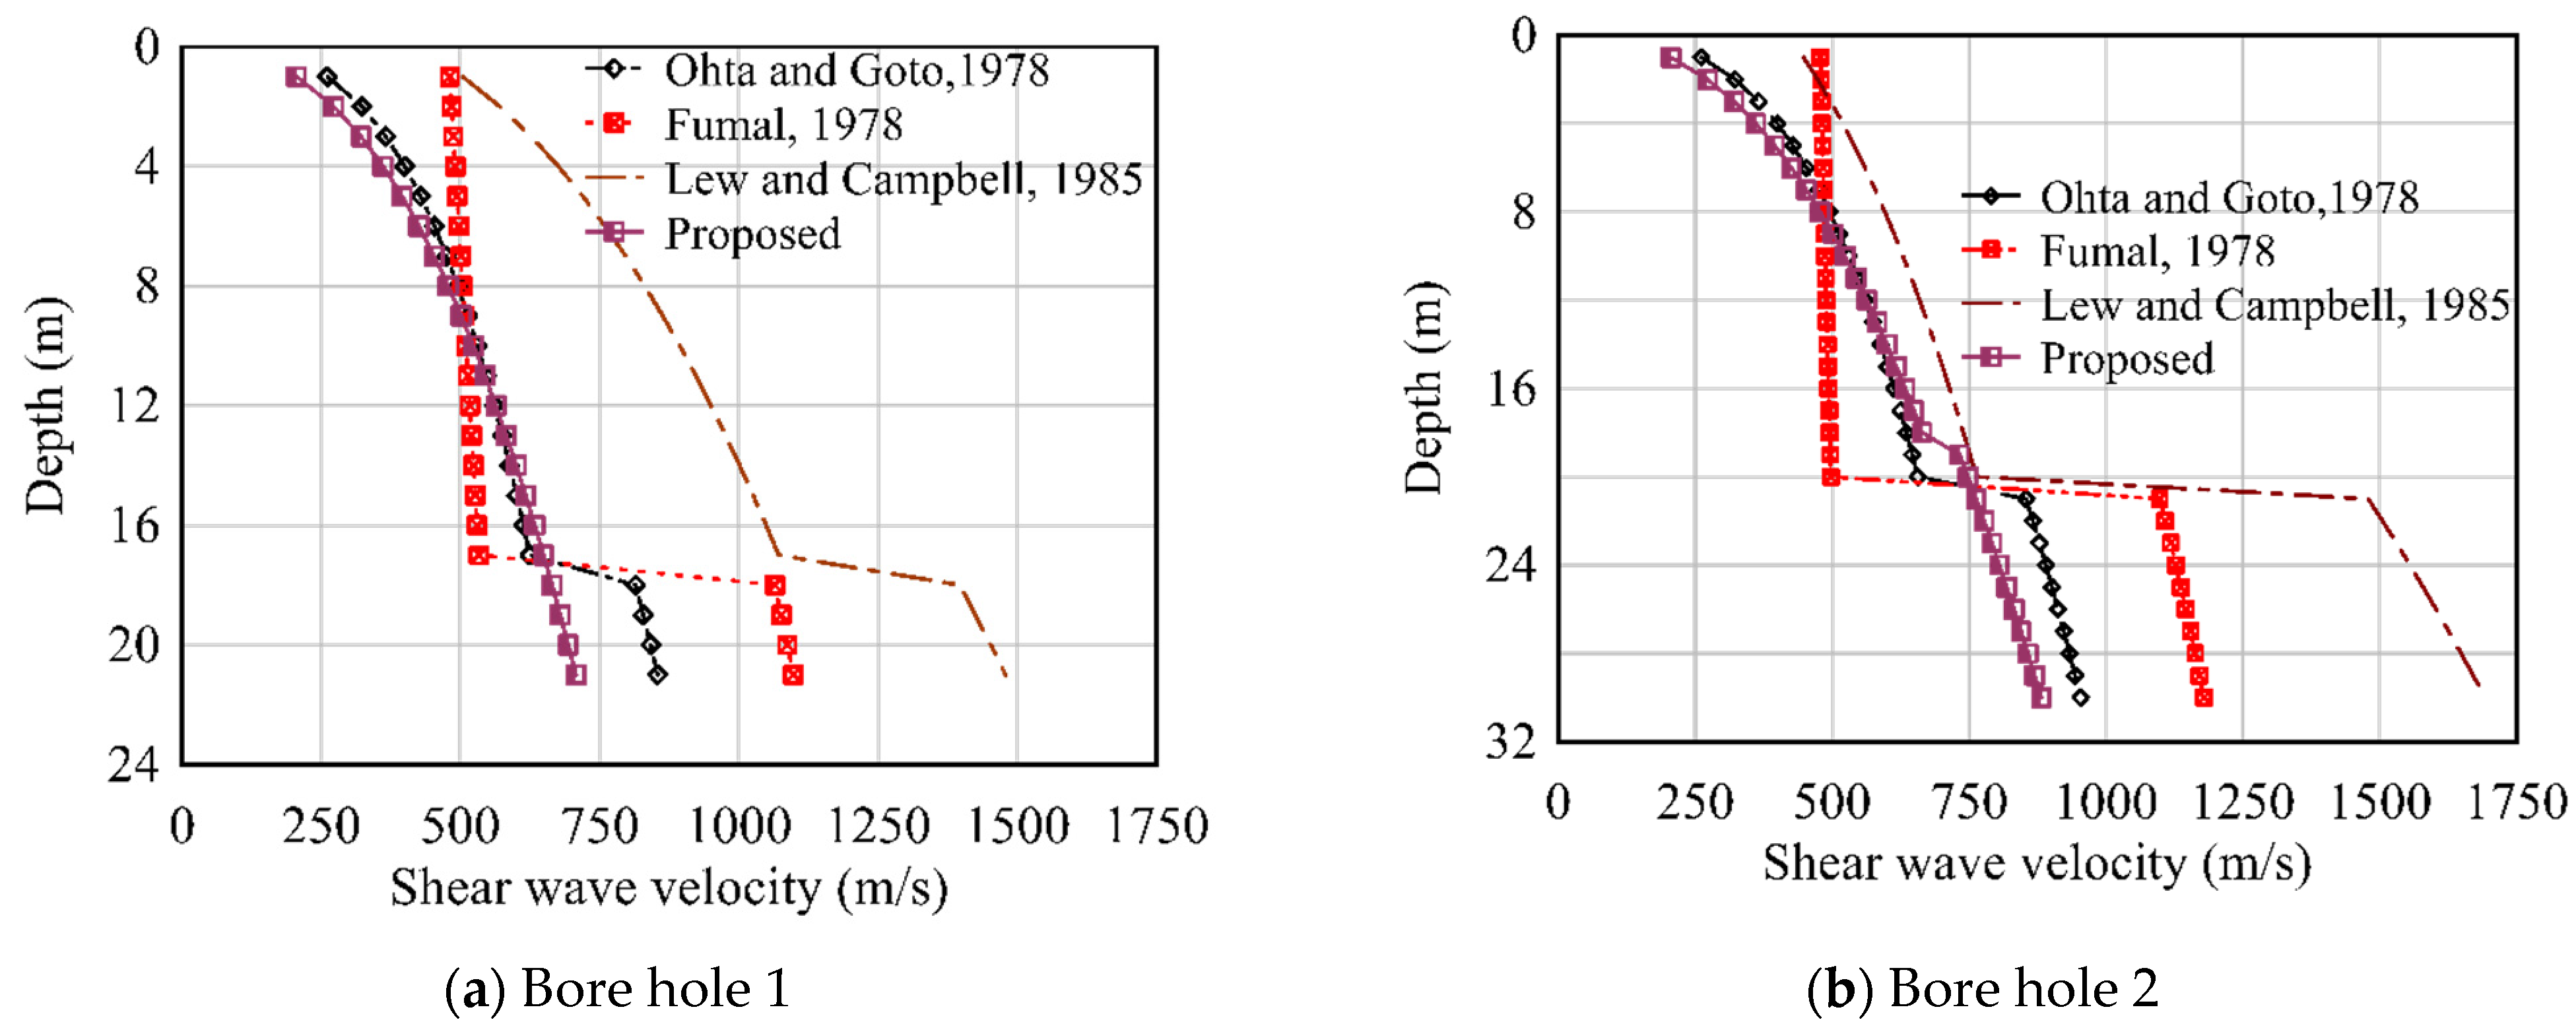
Figure 16 shows the comparative plot of Vs obtained from the correlation of Ohta and Goto (1978), Fumal (1978), and Lew and Campbell (1975) with the proposed empirical relation.
The plot compares the results from the correlations given by several researchers in predicting the Vs based on the depth of the soil with the equation proposed by the current study. It can be observed that the proposed equation fits well with the equation provided by Ohta and Goto in 1978. The data that the authors adopted was for the alluvial soil deposits of Japan. KURT, situated within the Dhulikhel, predominantly consists of meta-sandstone intercalated with phyllite of the Tistung formation. KURT geological composition differs from the alluvial soil deposits of Japan used in the development of the Ohta and Goto equation, and there are noteworthy similarities in terms of soil types. Both the Ohta and Goto equation and KURT study area encompass clay, sand, and gravel, indicating common ground in lithological characteristics despite differences in overall composition [91,92]. This parallel underscores the importance of considering both similarities and differences in geological composition when evaluating the applicability of empirical relations across diverse soil types. Given these insights, the importance of caution is recognized when comparing proposed empirical relations with equations developed for dissimilar soil types. Nevertheless, proposed empirical relations demonstrate promising alignment with other research findings despite variations in Vs ranging from 0.3% to 21.22% in clay and from 4.54% to 18.53% in sand. It is crucial to emphasize that proposed empirical relation is tailored to the specific geological context of the study area, accounting for presence of clay, sand, gravel, colluvial soils, residual soils, meta-sandstone, phyllite, and exposed weathered rocks. While the equation’s performance may vary from those developed for alluvial soils, comparative analysis highlights its applicability within our study site’s unique geological setting.

5. Conclusions

The KURT site falls under the category of medium soil based on the results of the MASW and MAM method. When comparing proposed empirical conversion values from the drilling mechanism to the soil profile of Vs obtained through MASW and MAM measurements, a moderate deviation is observed. It is not recommended to have many blows in the SPT that surpass 50 counts. SPT, however, can pierce more than 50 hits in stiff soil. It is not advised in such cases to measure Vs using the empirical relationship of SPT. Hence, the finding of this study can be adopted in those scenarios where the SPT counts is more than 50. Two empirical relations (Vs = 126.93D0.4059 for clay and Vs = 208.61D0.2756 for sand) with the highest coefficient of correlation equal to 0.9658 and 0.8305, respectively, are developed, and their mastery of the existing relationship is astounding. The findings of this study provide valuable insights into the empirical relationships for forecasting shear wave velocities in clay, silt, sand, and weathered soft rock in the central Himalayan region of Nepal, which improved the viability study of underground constructions. However, further research is warranted to fully explore the applicability of these relationships across different geological settings. Investigating their performance in varied environmental conditions could shed light on their robustness and reliability. The Vs is the most important geotechnical parameter, which is essential for tasks such as assessing soil stability, designing tunnel support systems, metro rail design, and evaluating potential seismic risks. The subsurface geology changes greatly over short distances. This study demonstrates that ground investigation can be conducted using any geotechnical or geophysical method. Given that MASW and MAM are more time- and money-efficient for longer sections, they may be a preferable choice for investigating the soil along the tunnel and metro rail line.
The empirical equation is derived from MASW and MAM data, with a higher coefficient of correlation observed for MASW recorded data. Vs is a crucial parameter for identifying site amplification in ground response analysis. The proposed empirical relationship is valuable for seismic microzonation of a particular area. Notably, the Vs obtained from MASW and MAM shows moderately different results. Considering the superior performance of MAM in busy and traffic-laden areas, this study concludes that MAM could be a preferable alternative to MASW. Moreover, future studies could delve into comparative analyses between the MASW and the MAM techniques. Assessing their efficacy in diverse environmental contexts could elucidate their respective strengths and limitations, thereby informing more nuanced decision-making in geophysical exploration and characterization.

Author Contributions

U.J.T.: Investigation, software, writing—original draft preparation, visualization, funding acquisition. S.P.: conceptualization, investigation, software, validation, writing—review and editing, supervision, funding acquisition. U.C.B.: conceptualization, writing—review and editing, supervision, funding acquisition. H.G.: conceptualization, writing—review and editing, supervision, funding acquisition S.S.K.: methodology, investigation, software, data curation, writing original draft, visualization. All authors have read and agreed to the published version of the manuscript.

Funding

This research is funded by Energize Nepal of Kathmandu University with the Project Id: ENEP-RENP-II-18-02 and the University Grants Commission of Nepal with the award no.: PhD-79/80-Engg-07.

Data Availability Statement

The data used in this research will be provided upon request.

Acknowledgments

The authors would like to acknowledge Explorer Geophysical Consultants, Kathmandu, Nepal, for carrying out the MASW and MAM Surveys. Moreover, the authors would like to acknowledge N.S. Engineering and Geo-Technical Services Pvt. Ltd., Jwagal, Lalitpur, Nepal, for carrying out a rotary drilling soil investigation survey. This research is supported by Energize Nepal of Kathmandu University and the University Grants Commission of the Nepal Government. Their support is gratefully acknowledged.

Conflicts of Interest

Author Umesh Chandra Bhusal and Hari Ghimire are employed by the company Explorer Geophysical Consultants Pvt. Ltd.. The remaining authors declare that the research was conducted in the absence of any commercial or financial relationships that could be construed as a potential conflict of interest.

References

  1. Ambraseys, N.N.; Douglas, J. Magnitude Calibration of North Indian Earthquakes. Geophys. J. Int. 2004, 159, 165–206. [Google Scholar] [CrossRef]
  2. BECA. Seismic Hazard Mapping and Risk Assessment for Nepal; UNDP/HMGN/UNCHS (Habitat) Subproject NEP/88/054/21.03; BECA World International: Auckland, New Zealand, 1993. [Google Scholar]
  3. Parajuli, H.R.; Bhusal, B.; Paudel, S. Seismic Zonation of Nepal Using Probabilistic Seismic Hazard Analysis. Arab. J. Geosci. 2021, 14, 1–14. [Google Scholar] [CrossRef]
  4. Khadka, S.S. Tunnel Closure Analysis of Hydropower Tunnels in Lesser Himalayan Region of Nepal through Case Studies. Ph.D. Thesis, Kathmandu Univeristy, Dhulikhel, Nepal, 2019. [Google Scholar]
  5. NBC. 105 Seismic Design of Buildings in Nepal; NBC: New York, NY, USA, 2020. [Google Scholar]
  6. Parajuli, H.R. Seismic Hazard Assessment of Kavre Valley Municipalities. In Proceedings of the IOE Graduate Conference; Tribhuvan University: Kathmandu, Nepal, 2015; pp. 193–201. [Google Scholar]
  7. Yoshida, M. Neogene to Quaternary Lacustrine Sediments in the Kathmandu Valley, Nepal. J. Nepal Geol. Soc. 1984, 4, 73–100. [Google Scholar]
  8. Dill, H.G.; Khadka, D.R.; Khanal, R.; Dohrmann, R.; Melcher, F.; Busch, K. Infilling of the Younger Kathmandu–Banepa Intermontane Lake Basin during the Late Quaternary (Lesser Himalaya, Nepal): A Sedimentological Study. J. Quat. Sci. Publ. Quat. Res. Assoc. 2003, 18, 41–60. [Google Scholar] [CrossRef]
  9. Stöcklin, J.; Bhattarai, K.D. Geology of Kathmandu Area and Central Mahabharat Range; Nepal Himalaya HMG/UNDP Mineral Exploration Project; Technical Report; UNDP: Kathamandu, Nepal, 1981. [Google Scholar]
  10. Gaha, T.B.; Bhusal, B.; Paudel, S.; Saru, S. Investigation of Ground Response Analysis for Kathmandu Valley: A Case Study of Gorkha Earthquake. Arab. J. Geosci. 2022, 15, 1354. [Google Scholar] [CrossRef]
  11. Chetri, M. Geomorphological Evolution of Banepa Valley. M.Sc. Dissertation, Central Department of Geology, Tribhuvan University, Kathmandu, Nepal, 1993, Volume 60, unpublished. [Google Scholar]
  12. Dongol, G. Geology of the Kathmandu Fluvial Lacustrine Sediments in the Light of New Vertebrate Fossil Occurrences. J. Nepal Geol. Soc. 1985, 3, 43–57. [Google Scholar]
  13. Sakai, H.; Fujii, R.; Kuwahara, Y. Changes in the Depositional System of the Paleo-Kathmandu Lake Caused by Uplift of the Nepal Lesser Himalayas. J. Asian Earth Sci. 2002, 20, 267–276. [Google Scholar] [CrossRef]
  14. Moribayashi, S.; Maruo, Y. Basement Topography of the Kathmandu Valley, Nepal An Application of Gravitational Method to the Survey of a Tectonic Basin in the Himalayas. J. Jpn. Soc. Eng. Geol. 1980, 21, 80–87. [Google Scholar] [CrossRef]
  15. Igarashi, Y.; Yoshida, M. History of vegetation and climate in the kathmandu valley. Proc. Indian Natn. Sci. Acad. 1988, 54, 550–563. [Google Scholar]
  16. Dahal, R.K.; Aryal, A. Geotechnical Properties of Soil at Sundhara and Jamal Area in Kathmandu, Nepal. J. Nepal Geol. Soc. 2002, 27, 77–86. [Google Scholar] [CrossRef]
  17. Kumahara, Y.; Chamlagain, D.; Upreti, B.N. Geomorphic Features of Active Faults around the Kathmandu Valley, Nepal, and No Evidence of Surface Rupture Associated with the 2015 Gorkha Earthquake along the Faults. Earth Planets Space 2016, 68, 1–8. [Google Scholar] [CrossRef]
  18. Verma, M.; Singh, R.; Bansal, B. Soft Sediments and Damage Pattern: A Few Case Studies from Large Indian Earthquakes Vis-a-Vis Seismic Risk Evaluation. Nat. Hazards 2014, 74, 1829–1851. [Google Scholar] [CrossRef]
  19. Bard, P.-Y.; Riepl-Thomas, J. Wave Propagation in Complex Geological Structures and Their Effects on Strong Ground Motion. In Wave Motion in Earthquake Engineering; Kausel, E., Manolis, G., Eds.; WIT Press: Sothampton, UK; Boston, MA, USA, 2000; pp. 37–95. [Google Scholar]
  20. Kramer, S.L. Geotechnical Earthquake Engineering; Pearson Education: Noida, India, 1996; ISBN 81-317-0718-0. [Google Scholar]
  21. Bhusal, B.; Aaqib, M.; Paudel, S.; Parajuli, H.R. Site Specific Seismic Hazard Analysis of Monumental Site Dharahara, Kathmandu, Nepal. Geomat. Nat. Hazards Risk 2022, 13, 2674–2696. [Google Scholar] [CrossRef]
  22. Thapa, U.J.; Karki, S.; Khadka, S.S. Seismic Assessment of Underground Structures in the Weak Himalayan Rock Mass for Hydropower Development; IOP Publishing: Bristol, UK, 2023; Volume 2629, p. 012014. [Google Scholar] [CrossRef]
  23. Celebi, M.; Prince, J.; Dietel, C.; Onate, M.; Chavez, G. The Culprit in Mexico City—Amplification of Motions. Earthq. Spectra 1987, 3, 315–328. [Google Scholar] [CrossRef]
  24. Seed, R.B. Preliminary Report on the Principal Geotechnical Aspects of the October 17, 1989, Loma Prieta Earthquake; Report No UCBEERC-9005; University of California, Berkeley, Earthquake Engineering Research Center: Berkeley, CA, USA, 1990. [Google Scholar]
  25. Stewart, J.P. Benchmarking of Nonlinear Geotechnical Ground Response Analysis Procedures; Pacific Earthquake Engineering Research Center: Berkeley, CA, USA, 2008. [Google Scholar]
  26. Griffiths, S.C.; Cox, B.R.; Rathje, E.M. Challenges Associated with Site Response Analyses for Soft Soils Subjected to High-Intensity Input Ground Motions. Soil Dyn. Earthq. Eng. 2016, 85, 1–10. [Google Scholar] [CrossRef]
  27. Stewart, J.P.; Kwok, A.O. Nonlinear Seismic Ground Response Analysis: Code Usage Protocols and Verification against Vertical Array Data. In Geotechnical Earthquake Engineering and Soil Dynamics IV; American Society of Civil Engineers: Reston, VA, USA, 2008; pp. 1–24. [Google Scholar]
  28. Yee, E.; Stewart, J.P.; Tokimatsu, K. Elastic and Large-Strain Nonlinear Seismic Site Response from Analysis of Vertical Array Recordings. J. Geotech. Geoenvironmental Eng. 2013, 139, 1789–1801. [Google Scholar] [CrossRef]
  29. Kwok, A.O.; Stewart, J.P.; Hashash, Y.M. Nonlinear Ground-Response Analysis of Turkey Flat Shallow Stiff-Soil Site to Strong Ground Motion. Bull. Seismol. Soc. Am. 2008, 98, 331–343. [Google Scholar] [CrossRef]
  30. Hashash, Y.M.; Phillips, C.; Groholski, D.R. Recent Advances in Non-Linear Site Response Analysis. In Proceedings of the 5th International Conference on Recent Advances in Geotechnical Earthquake Engineering and Soil Dynamics, San Diego, CA, USA, 28 May 2010. [Google Scholar]
  31. Alexopoulos, J.D.; Voulgaris, N.; Dilalos, S.; Gkosios, V.; Giannopoulos, I.-K.; Mitsika, G.S.; Vassilakis, E.; Sakkas, V.; Kaviris, G. Near-Surface Geophysical Characterization of Lithologies in Corfu and Lefkada Towns (Ionian Islands, Greece). Geosciences 2022, 12, 446. [Google Scholar] [CrossRef]
  32. Mohammed, M.; Abudeif, A.; Abd El-aal, A. Engineering Geotechnical Evaluation of Soil for Foundation Purposes Using Shallow Seismic Refraction and MASW in 15th Mayo, Egypt. J. Afr. Earth Sci. 2020, 162, 103721. [Google Scholar] [CrossRef]
  33. Hutchinson, P.J.; Beird, M.H. A Comparison of Surface-and Standard Penetration Test-Derived Shear-Wave Velocity. Environ. Eng. Geosci. 2016, 22, 27–36. [Google Scholar] [CrossRef]
  34. Bullen, K.E. An Introduction to the Theory of Seismology, 3rd ed.; Cambridge University Press: London, UK, 1963; p. 381. [Google Scholar]
  35. Kirar, B.; Maheshwari, B.K.; Muley, P. Correlation between Shear Wave Velocity (Vs) and SPT Resistance (N) for Roorkee Region. Int. J. Geosynth. Ground Eng. 2016, 2, 1–11. [Google Scholar] [CrossRef]
  36. Al-Heety, A.J.; Hassouneh, M.; Abdullah, F.M. Application of MASW and ERT Methods for Geotechnical Site Characterization: A Case Study for Roads Construction and Infrastructure Assessment in Abu Dhabi, UAE. J. Appl. Geophys. 2021, 193, 104408. [Google Scholar] [CrossRef]
  37. Cardarelli, E.; Cercato, M.; De Donno, G. Characterization of an Earth-Filled Dam through the Combined Use of Electrical Resistivity Tomography, P-and SH-Wave Seismic Tomography and Surface Wave Data. J. Appl. Geophys. 2014, 106, 87–95. [Google Scholar] [CrossRef]
  38. Rezaei, S.; Choobbasti, A.J. Evaluation of Local Site Effect from Microtremor Measurements in Babol City, Iran. J. Seismol. 2018, 22, 471–486. [Google Scholar] [CrossRef]
  39. Dobrin, M.B.; Savit, C.H. Introduction to Geophysical Prospecting; McGraw-Hill, Inc.: New York, NY, USA, 1988; p. 867. [Google Scholar]
  40. Lunne, T. Cone Penetration Testing in Geotechnical Practice; Blackie Academic & Professional; Hall Publisher: London, UK, 1997; p. 312. [Google Scholar]
  41. Park, C.B.; Miller, R.D.; Xia, J. Multichannel Analysis of Surface Waves. Geophysics 1999, 64, 800–808. [Google Scholar] [CrossRef]
  42. Horike, M. Inversion of Phase Velocity of Long-Period Microtremors to the S-Wave-Velocity Structure down to the Basement in Urbanized Areas. J. Phys. Earth 1985, 33, 59–96. [Google Scholar] [CrossRef]
  43. Jones, R. In-Situ Measurement of the Dynamic Properties of Soil by Vibration Methods. Geotechnique 1958, 8, 1–21. [Google Scholar] [CrossRef]
  44. Asten, M.W.; Henstridge, J.D. Array Estimators and the Use of Microseisms for Reconnaissance of Sedimentary Basins. Geophysics 1984, 49, 1828–1837. [Google Scholar] [CrossRef]
  45. Miller, R.D.; Xia., J.; Ivanov, J. Multichannel Analysis of Surface Waves to Map Bedrock. In The Leading Edge; Society of Exploration Geophysicists: Houston, TX, USA, 1999; Volume 18. [Google Scholar]
  46. Stokoe, K.H.; Wright, S.; Bay, J.; Roesset, J. Characterization of Geotechnical Sites by SASW Method. In Geophysical Characterization of Sites; International Science Publisher: New York, NY, USA, 1994; pp. 15–25. [Google Scholar]
  47. Penumadu, D.; Park, C.B. Multichannel Analysis of Surface Wave (MASW) Method for Geotechnical Site Characterization. In Earthquake Engineering and Soil Dynamics; American Society of Civil Engineers: Reston, VA, USA, 2005; pp. 1–10. [Google Scholar]
  48. Park, C.B.; Miller, R.D.; Xia, J. Imaging Dispersion Curves of Surface Waves on Multi-Channel Record. In SEG Technical Program Expanded Abstracts 1998; Society of Exploration Geophysicists: Houston, TA, USA, 1998; pp. 1377–1380. ISBN 1052-3812. [Google Scholar]
  49. Park, C.B.; Miller, R.D.; Xia, J.; Ivanov, J. Seismic Characterization of Geotechnical Sites by Multichannel Analysis of Surface Waves (MASW) Method. In Proceedings of the Tenth International Conference on Soil Dynamics and Earthquake Engineering (SDEE), Philadelphia, PA, USA, 7–10 October 2001. [Google Scholar]
  50. Xia, J.; Miller, R.D.; Xu, Y.; Luo, Y.; Chen, C.; Liu, J.; Ivanov, J.; Zeng, C. High-Frequency Rayleigh-Wave Method. J. Earth Sci. 2009, 20, 563–579. [Google Scholar] [CrossRef]
  51. Lin, C.-P.; Chang, C.-C.; Chang, T.-S. The Use of MASW Method in the Assessment of Soil Liquefaction Potential. Soil Dyn. Earthq. Eng. 2004, 24, 689–698. [Google Scholar] [CrossRef]
  52. Pegah, E.; Liu, H. Application of Near-Surface Seismic Refraction Tomography and Multichannel Analysis of Surface Waves for Geotechnical Site Characterizations: A Case Study. Eng. Geol. 2016, 208, 100–113. [Google Scholar] [CrossRef]
  53. Mohamed, A.M.; El Ata, A.A.; Azim, F.A.; Taha, M. Site-Specific Shear Wave Velocity Investigation for Geotechnical Engineering Applications Using Seismic Refraction and 2D Multi-Channel Analysis of Surface Waves. NRIAG J. Astron. Geophys. 2013, 2, 88–101. [Google Scholar] [CrossRef]
  54. Landon, M.M.; DeGroot, D.J.; Sheahan, T.C. Nondestructive Sample Quality Assessment of a Soft Clay Using Shear Wave Velocity. J. Geotech. Geoenvironmental Eng. 2007, 133, 424–432. [Google Scholar] [CrossRef]
  55. Rix, G.J.; Lai, C.G.; Orozco, M.C.; Hebeler, G.L.; Roma, V. Recent Advances in Surface Wave Methods for Geotechnical Site Characterization. In Proceedings of the International Conference on Soil Mechanics and Geotechnical Engineering; AA Balkema Publishers: Amsterdam, Noord-Holland, Netherlands, 2001; Volume 1, pp. 499–502. [Google Scholar]
  56. Hunter, J.A.; Benjumea, B.; Harris, J.B.; Miller, R.D.; Pullan, S.E.; Burns, R.A.; Good, R.L. Surface and Downhole Shear Wave Seismic Methods for Thick Soil Site Investigations. Soil Dyn. Earthq. Eng. 2002, 22, 931–941. [Google Scholar] [CrossRef]
  57. Park, C.B.; Miller, R.D.; Xia, J.; Ivanov, J. Multichannel Analysis of Surface Waves (MASW)—Active and Passive Methods. Lead. Edge 2007, 26, 60–64. [Google Scholar] [CrossRef]
  58. Yunhuo, Z. Seismic Geophysical Surveys for Geotechnical Site Investigation. Ph.D. Thesis, National University of Singapore, Singapore, 2020. [Google Scholar]
  59. Eker, A.M.; Akgün, H.; Koçkar, M.K. Local Site Characterization and Seismic Zonation Study by Utilizing Active and Passive Surface Wave Methods: A Case Study for the Northern Side of Ankara, Turkey. Eng. Geol. 2012, 151, 64–81. [Google Scholar] [CrossRef]
  60. Foti, S.; Parolai, S.; Albarello, D.; Picozzi, M. Application of Surface-Wave Methods for Seismic Site Characterization. Surv. Geophys. 2011, 32, 777–825. [Google Scholar] [CrossRef]
  61. Kanlı, A.I.; Tildy, P.; Prónay, Z.; Pınar, A.; Hermann, L. VS 30 Mapping and Soil Classification for Seismic Site Effect Evaluation in Dinar Region, SW Turkey. Geophys. J. Int. 2006, 165, 223–235. [Google Scholar] [CrossRef]
  62. Karabulut, S. Soil Classification for Seismic Site Effect Using MASW and ReMi Methods: A Case Study from Western Anatolia (Dikili-İzmir). J. Appl. Geophys. 2018, 150, 254–266. [Google Scholar] [CrossRef]
  63. Socco, L.; Strobbia, C. Surface-wave Method for Near-surface Characterization: A Tutorial. Surf. Geophys. 2004, 2, 165–185. [Google Scholar] [CrossRef]
  64. Park, C.B.; Miller, R.D. MASW to Map Shear-Wave Velocity of Soil. Kans. Geol. Surv. Open File Rep. 2004, 30, 2004. [Google Scholar]
  65. Park, C.B.; Miller, R.D.; Xia, J. Offset and Resolution of Dispersion Curve in Multichannel Analysis of Surface Waves (MASW); Society of Exploration Geophysicists: Houston, TX, USA, 2001; p. SSM4. [Google Scholar]
  66. Xia, J.; Miller, R.D.; Park, C.B.; Tian, G. Inversion of High Frequency Surface Waves with Fundamental and Higher Modes. J. Appl. Geophys. 2003, 52, 45–57. [Google Scholar] [CrossRef]
  67. Matthews, M.C.; Hope, V.S.; Clayton, C.R.L.; Rayleigh. The Use of Surface Waves in the Determination of Ground Stiffness Profiles. Proc. Inst. Civ. Eng.-Geotech. Eng. 1996, 119, 84–95. [Google Scholar] [CrossRef]
  68. Sarkar, R.; Kolathayar, S.; Drukpa, D.; Choki, K.; Rai, S.; Tshering, S.T.; Yuden, K. Near-Surface Seismic Refraction Tomography and MASW for Site Characterization in Phuentsholing, Bhutan Himalaya. SN Appl. Sci. 2021, 3, 394. [Google Scholar] [CrossRef]
  69. Hayashi, K.; Underwood, D. Microtremor Array Measurements and Three-Component Microtremor Measurements in San Francisco Bay Area. In Proceedings of the 15th World Conference on Earthquake Engineering, Lisbon, Portugal, 24–28 September 2012; Volume 1634. [Google Scholar]
  70. Nazarian, S.; Stokoe, K.H. Nondestructive Testing of Pavements Using Surface Waves. Transp. Res. Rec. 1984, 993, 67–79. [Google Scholar]
  71. Tokimatsu, K.; Shinzawa, K.; Kuwayama, S. Use of Short-Period Microtremors for V s Profiling. J. Geotech. Eng. 1992, 118, 1544–1558. [Google Scholar] [CrossRef]
  72. Zhang, Y.; Li, Y.E.; Ku, T. Geotechnical Site Investigation for Tunneling and Underground Works by Advanced Passive Surface Wave Survey. Tunn. Undergr. Space Technol. 2019, 90, 319–329. [Google Scholar] [CrossRef]
  73. Zhang, Y.; Li, Y.E.; Zhang, H.; Ku, T. Near-Surface Site Investigation by Seismic Interferometry Using Urban Traffic Noise in Singapore. Geophysics 2019, 84, B169–B180. [Google Scholar] [CrossRef]
  74. Hayashi, K. Development of Surface-Wave Methods and Its Application to Site Investigations. Ph.D. Thesis, Kyoto University, Kyoto, Japan, 2008. [Google Scholar]
  75. Moon, S.-W.; Hayashi, K.; Ku, T. Estimating Spatial Variations in Bedrock Depth and Weathering Degree in Decomposed Granite from Surface Waves. J. Geotech. Geoenvironmental Eng. 2017, 143, 04017020. [Google Scholar] [CrossRef]
  76. Moon, S.-W.; Ku, T. Estimation of Bedrock Locations and Weathering Degree Using Shear Wave Velocity-Based Approach. In Proceedings of the 19th International Conference on Soil Mechanics and Geotechnical Engineering, Seoul, Republic of Korea; 2017. [Google Scholar]
  77. Moon, S.-W.; Subramaniam, P.; Zhang, Y.; Vinoth, G.; Ku, T. Bedrock Depth Evaluation Using Microtremor Measurement: Empirical Guidelines at Weathered Granite Formation in Singapore. J. Appl. Geophys. 2019, 171, 103866. [Google Scholar] [CrossRef]
  78. Foti, S.; Hollender, F.; Garofalo, F.; Albarello, D.; Asten, M.; Bard, P.-Y.; Comina, C.; Cornou, C.; Cox, B.; Di Giulio, G.; et al. Guidelines for the Good Practice of Surface Wave Analysis: A Product of the InterPACIFIC Project. Bull. Earthq. Eng. 2018, 16, 2367–2420. [Google Scholar] [CrossRef]
  79. Ku, T.; Palanidoss, S.; Zhang, Y.; Moon, S.-W.; Wei, X.; Huang, E.S.; Kumarasamy, J.; Goh, K.H. Practical Configured Microtremor Array Measurements (MAMs) for the Geological Investigation of Underground Space. Undergr. Space 2021, 6, 240–251. [Google Scholar] [CrossRef]
  80. Ling, S. An Extended Use of the Spatial Autocorrelation Method for the Estimation of Geological Structure Using Microtremors. In Proceedings of the 89th SEGJ Conference; Society of Exploration Geophysicists of Japan: Nagoya, Japan, 1993; pp. 44–48. [Google Scholar]
  81. Aki, K. Space and Time Spectra of Stationary Stochastic Waves, with Special Reference to Microtremors. Bull. Earthq. Res. Inst. 1957, 35, 415–456. [Google Scholar]
  82. Sykora, D.W. Examination of Existing Shear Wave Velocity and Shear Modulus Correlations in Soils; US Army Engineer Waterways Experiment Station: Vicksburg, MS, USA, 1987. [Google Scholar]
  83. Japan International Cooperation Agency (JICA); Ministry of Home Affairs, His Majesty’s Government of Nepal. The Study on Earthquake Disaster Mitigation in the Kathmandu Valley, Kingdom of Nepal; Japan International Cooperation Agency (JICA): Tokyo, Japan; Ministry of Home Affairs, His Majesty’s Government of Nepal: Kathmandu, Nepal, 2002.
  84. Gautam, D. Empirical Correlation between Uncorrected Standard Penetration Resistance (N) and Shear Wave Velocity (VS) for Kathmandu Valley, Nepal. Geomat. Nat. Hazards Risk 2017, 8, 496–508. [Google Scholar] [CrossRef]
  85. Yusof, N.; Zabidi, H. Reliability of Using Standard Penetration Test (SPT) in Predicting Properties of Soil; IOP Publishing: Bristol, UK, 2018; Volume 1082, p. 012094. [Google Scholar]
  86. Safety, I.S. Nehrp Recommended Provisions for Seismic Regulations for New Buildings and Other Structures (Fema 450); Building Seismic Safety Council, National Institute of Building Sciences: Washington, DC, USA, 2004. [Google Scholar]
  87. Tezcan, S.S.; Keceli, A.; Ozdemir, Z. Allowable Bearing Capacity of Shallow Foundations Based on Shear Wave Velocity. Geotech. Geol. Eng. 2006, 24, 203–218. [Google Scholar] [CrossRef]
  88. Ohta, Y.; Goto, N. Empirical Shear Wave Velocity Equations in Terms of Characteristic Soil Indexes. Earthq. Eng. Struct. Dyn. 1978, 6, 167–187. [Google Scholar] [CrossRef]
  89. Fumal, T.E. Correlations between Seismic Wave Velocities and Physical Properties of Near-Surface Geologic Materials in the Southern San Francisco Bay Region, California; US Geological Survey: Reston, VA, USA, 1978.
  90. Lew, M.; Campbell, K.W. Relationships between Shear Wave Velocity and Depth of Overburden. In Proceedings of the Measurement and Use of Shear Wave Velocity for Evaluating Dynamic Soil Properties; ASCE: Reston, VA, USA, 1985; pp. 63–76. [Google Scholar]
  91. Kumar, A.; Satyannarayana, R.; Rajesh, B.G. Correlation between SPT-N and Shear Wave Velocity (VS) and Seismic Site Classification for Amaravati City, India. J. Appl. Geophys. 2022, 205, 104757. [Google Scholar] [CrossRef]
  92. Thabet, M.; Nemoto, H.; Nakagawa, K. Reliability of Shear Wave Velocity Models Inferred from Linear. J. Geosci. Osaka City Univ. 2007, 50, 107–123. [Google Scholar]
Disclaimer/Publisher’s Note: The statements, opinions, and data contained in all publications are solely those of the individual author(s) and contributor(s) and not of MDPI and/or the editor(s). MDPI and/or the editor(s) disclaim responsibility for any injury to people or property resulting from any ideas, methods, instructions, or products referred to in the content.
Figure 1. Location of KURT, Dhulikhel.
Geosciences 14 00137 g001
Figure 2. Geological map around KURT, Dhulikhel (Modified from DMG, 1980).
Geosciences 14 00137 g002
Figure 3. Cross-section profile of KURT.
Geosciences 14 00137 g003
Figure 4. Soil investigation works by drilling method. (a) Rotary drilling, (b) collection of soil samples.
Geosciences 14 00137 g004
Figure 5. Tunnel alignment and geophysical survey layout shown in Google Earth Image.
Geosciences 14 00137 g005
Figure 6. Schematic Diagram of MASW/MAM Survey.
Geosciences 14 00137 g006
Figure 7. Accessories for MASW/MAM survey.
Geosciences 14 00137 g007
Figure 8. Different MAM survey layouts. (a) L-type array, (b) circular array, and (c) linear array.
Geosciences 14 00137 g008
Figure 9. MASW modelled S−wave velocity profile generated from inversion of picked dispersion image in 1D.
Geosciences 14 00137 g009
Figure 10. MASW modelled S−wave velocity profile generated from inversion of picked dispersion curve in 1D along with lithological interpretation.
Geosciences 14 00137 g010
Figure 11. MAM modelled S−wave Velocity profile generated from inversion of the picked dispersion image in 1D.
Geosciences 14 00137 g011
Figure 12. MAM modelled S−wave velocity profile generated from inversion of picked dispersion curve in 1D along with lithological interpretation.
Geosciences 14 00137 g012
Figure 13. Vs−depth correlation for clay.
Geosciences 14 00137 g013
Figure 14. Vs−depth correlation for clay.
Geosciences 14 00137 g014
Figure 15. Vs−depth correlation for sand.
Geosciences 14 00137 g015
Figure 16. Comparative plot of proposed empirical relation with existing correlations [88,89,90].
Geosciences 14 00137 g016
Table 1. Shear wave Velocity calculation from available Vs-N value correlation for borehole 1.
Depth (m)Depth (Ft.)Soil TypeN-ValueSVs m/s
JICA 2002 = 97N1/3Gautam 2017 = 115N0.251
13.28Clay21267.62239.42
26.56Clay28294.55257.34
39.84Clay33311.13268.18
413.12Clay38326.11277.84
516.40Clay39328.95279.66
619.69Clay50357.35297.66
722.97Clay50357.35297.66
826.25Clay36320.29274.10
929.53Clay42337.17284.91
1032.81Clay45345.02289.89
1136.09Clay50357.35297.66
1239.37Clay˃50357.35297.66
1342.65Clay˃50357.35297.66
1445.93Clay˃50357.35297.66
1549.21Clay˃50357.35297.66
1652.49Clay˃50357.35297.66
1755.77Clay˃50357.35297.66
1859.06Sand˃50357.35297.66
1962.34Sand˃50357.35297.66
2065.62Sand˃50357.35297.66
2168.90Sand˃50357.35297.66
Table 2. Vs calculation from available Vs-N value correlation for borehole 2.
Depth (m)Depth (Ft.)Soil TypeN-ValueSVs m/s
JICA 2002 = 97N1/3Gautam 2017 = 115N0.251
13.28Clay19258.83233.48
26.56Clay21267.62239.42
39.84Clay25283.63250.13
413.12Clay27291.00255.00
516.40Clay29298.01259.62
619.69Clay35317.29272.17
722.97Clay35317.29272.17
826.25Clay23275.86244.94
929.53Clay25283.63250.13
1032.81Clay26287.36252.60
1136.09Clay35317.29272.17
1239.37Clay48352.52294.62
1342.65Clay46347.56291.49
1445.93Clay37323.23275.99
1549.21Clay˃50357.35297.66
1652.49Clay˃50357.35297.66
1755.77Clay˃50357.35297.66
1859.06Sand˃50357.35297.66
1962.34Sand˃50357.35297.66
2065.62Sand˃50357.35297.66
2168.90Sand˃50357.35297.66
2272.18Sand˃50357.35297.66
2375.46Sand˃50357.35297.66
2478.74Sand˃50357.35297.66
2582.02Sand˃50357.35297.66
2685.30Sand˃50357.35297.66
2788.58Sand˃50357.35297.66
2891.86Sand˃50357.35297.66
2995.14Sand˃50357.35297.66
3098.43Sand˃50357.35297.66
Table 3. Vs calculation from MASW and MAM for borehole1.
Depth
(m)
Depth
(Ft.)
Soil TypeSVs (m/s)
MASWMAM
13.28Clay193.97321.76
26.56Clay284.18315.41
39.84Clay409.38308.43
413.12Clay429.20311.45
516.40Clay422.42317.53
619.69Clay413.66359.30
722.97Clay417.36393.71
826.25Clay412.33423.24
929.53Clay424.85452.76
1032.81Clay437.99482.29
1136.09Clay471.05511.03
1239.37Clay466.43538.62
1342.65Clay522.61566.21
1445.93Clay571.39593.79
1549.21Clay607.58621.38
1652.49Clay597.50648.97
1755.77Clay667.72676.32
1859.06Sand698.89703.52
1962.34Sand708.11730.72
2065.62Sand717.32757.92
2168.90Sand726.53785.12
Table 4. Vs calculation from MASW and MAM for borehole 2.
Depth
(m)
Depth
(Ft.)
Soil TypeSVs (m/s)
MASWMAM
13.28Clay223.24235.11
26.56Clay268.71309.82
39.84Clay288.00338.94
413.12Clay313.00368.06
516.40Clay357.15397.18
619.69Clay465.38398.68
722.97Clay467.93398.68
826.25Clay521.95386.75
929.53Clay545.43387.41
1032.81Clay558.17431.46
1136.09Clay551.03475.51
1239.37Clay574.29519.57
1342.65Clay594.01553.70
1445.93Clay608.59572.94
1549.21Clay623.17592.18
1652.49Clay610.47611.42
1755.77Clay640.21630.67
1859.06Clay665.43615.87
1962.34Clay672.57663.48
2065.62Clay679.71684.59
2168.90Clay686.86699.08
2272.18Clay694.00713.56
2375.46Sand672.77728.05
2478.74Sand697.01742.54
2582.02Sand714.22720.15
2685.30Sand717.82753.07
2788.58Sand721.42786.00
2891.86Sand725.01796.00
2995.14Sand728.61770.09
3098.43Sand732.21785.70
Table 5. Comparison of Vs for borehole 1.
Depth
(m)
Depth
(Ft.)
Soil TypeVs (m/s)
Ohta and Goto (1978)Fumal 1978Lew and Campbell 1985Proposed Equation
13.28Clay260.98480.78503.98205.59
26.56Clay323.09484.06570.68272.39
39.84Clay366.06487.34626.80321.12
413.12Clay399.98490.62675.87360.89
516.40Clay428.43493.90719.82395.11
619.69Clay453.18497.19759.85425.46
722.97Clay475.22500.47796.78452.93
826.25Clay495.17503.75831.15478.15
929.53Clay513.46507.03863.39501.57
1032.81Clay530.40510.31893.81523.48
1136.09Clay546.20513.59922.67544.13
1239.37Clay561.03516.87950.15563.69
1342.65Clay575.04520.15976.41582.31
1445.93Clay588.31523.431001.60600.09
1549.21Clay600.95526.711025.81617.13
1652.49Clay613.01529.991049.14633.51
1755.77Clay624.57533.271071.67649.29
1859.06Sand814.771064.811396.98664.53
1962.34Sand828.451076.391425.21679.28
2065.62Sand841.641087.491452.63693.57
2168.90Sand854.391098.151479.30707.44
Table 6. Comparison of Vs for borehole 2.
Depth
(m)
Depth
(Ft.)
Soil TypeVs (m/s)
Ohta and Goto (1978)Fumal 1978Lew and Campbell 1985Proposed Equation
13.28Clay260.98478.50447.68205.59
26.56Clay323.09479.50473.68272.39
39.84Clay366.06480.50497.59321.12
413.12Clay399.98481.50519.79360.89
516.40Clay428.43482.50540.57395.11
619.69Clay453.18483.50560.15425.46
722.97Clay475.22484.50578.69452.93
826.25Clay495.17485.50596.32478.15
929.53Clay513.46486.50613.17501.57
1032.81Clay530.40487.50629.30523.48
1136.09Clay546.20488.50644.80544.13
1239.37Clay561.03489.50659.72563.69
1342.65Clay575.04490.50674.12582.31
1445.93Clay588.31491.50688.05600.09
1549.21Clay600.95492.50701.55617.13
1652.49Clay613.01493.50714.63633.51
1755.77Clay624.57494.50727.35649.29
1859.06Sand635.66495.50739.72664.53
1962.34Sand646.34496.50751.77732.80
2065.62Sand656.63497.50763.52748.21
2168.90Sand854.391098.151479.30763.18
2272.18Sand866.721108.421505.28777.73
2375.46Sand878.671118.311530.60791.89
2478.74Sand890.261127.871555.32805.68
2582.02Sand901.521137.121579.47819.15
2685.30Sand912.481146.071603.08832.29
2788.58Sand923.151154.761626.18845.14
2891.86Sand933.551163.191648.81857.71
2995.14Sand943.691171.381670.98870.01
3098.43Sand953.601179.351692.72882.06
Disclaimer/Publisher’s Note: The statements, opinions and data contained in all publications are solely those of the individual author(s) and contributor(s) and not of MDPI and/or the editor(s). MDPI and/or the editor(s) disclaim responsibility for any injury to people or property resulting from any ideas, methods, instructions or products referred to in the content.