

Carbonate Stable Isotope Data Suggest Freshwater Environment for the McMurray Formation (Aptian), Alberta, Canada


Abstract
1. Introduction
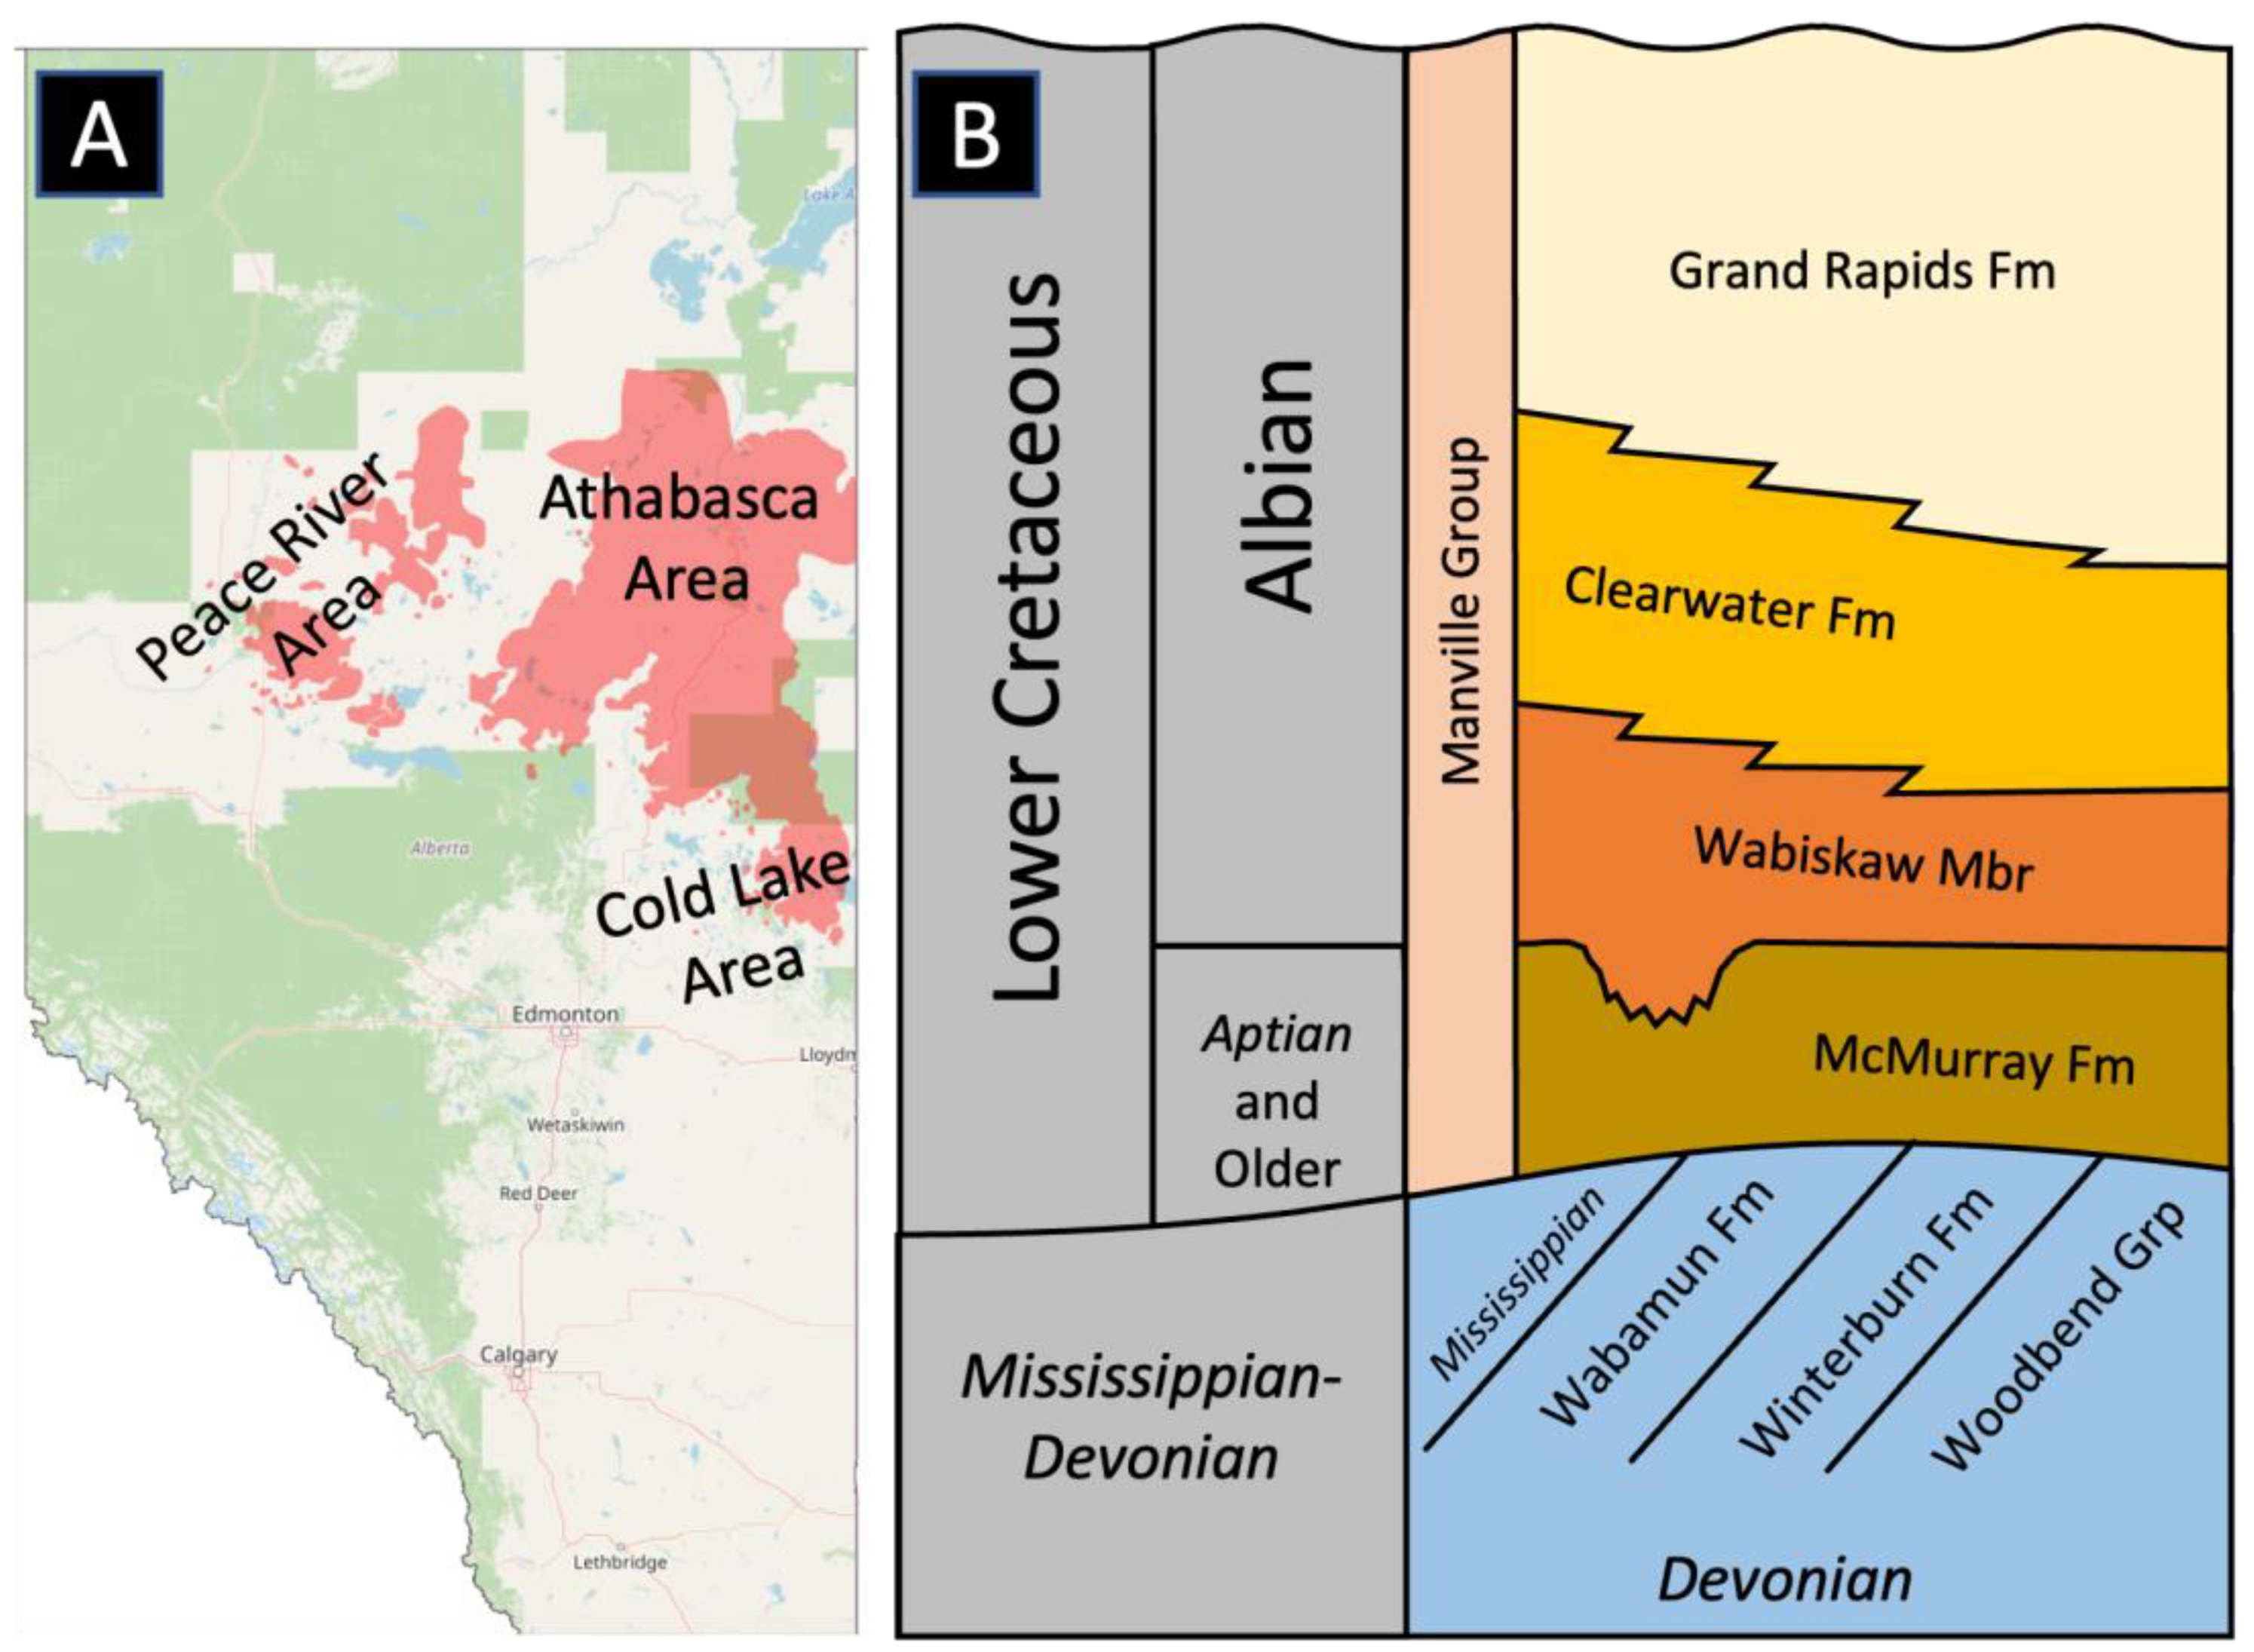
Geologic Setting
2. Methods
2.1. Sample Preparation
2.2. Cathodoluminescence Imaging
2.3. Elemental Analysis
2.4. Isotope Sampling
2.5. Isotope Analysis
3. Results
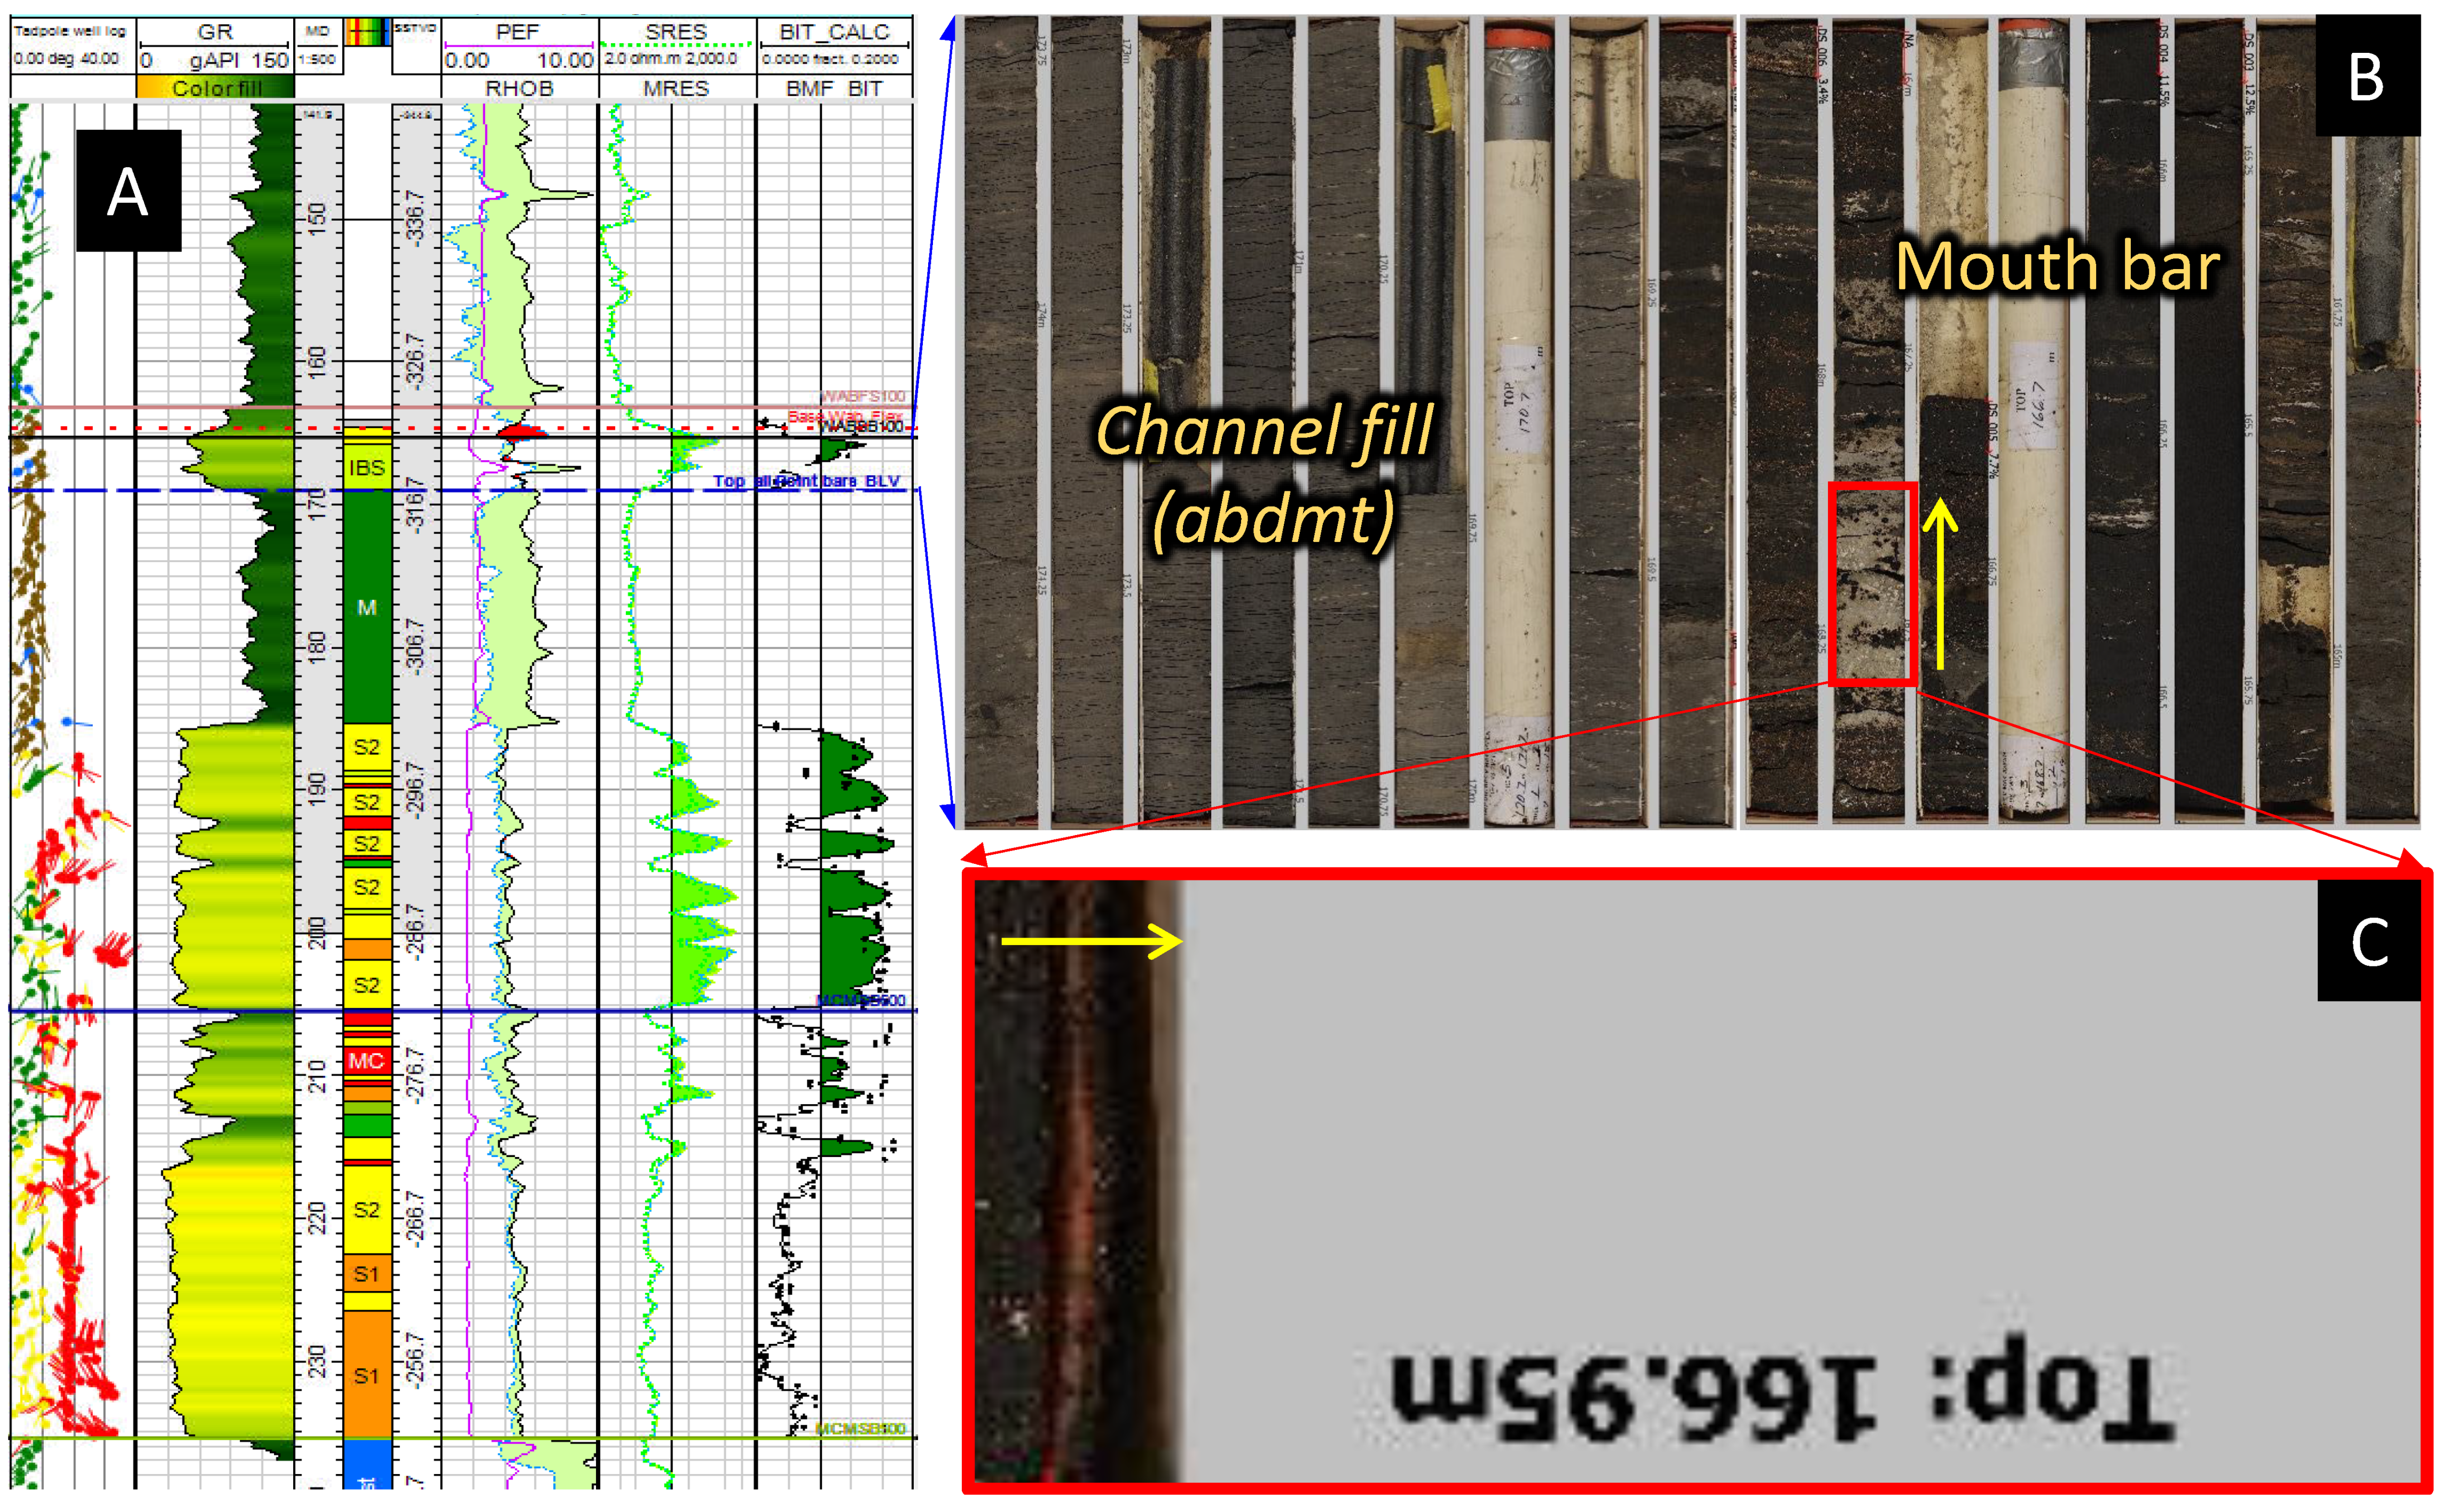
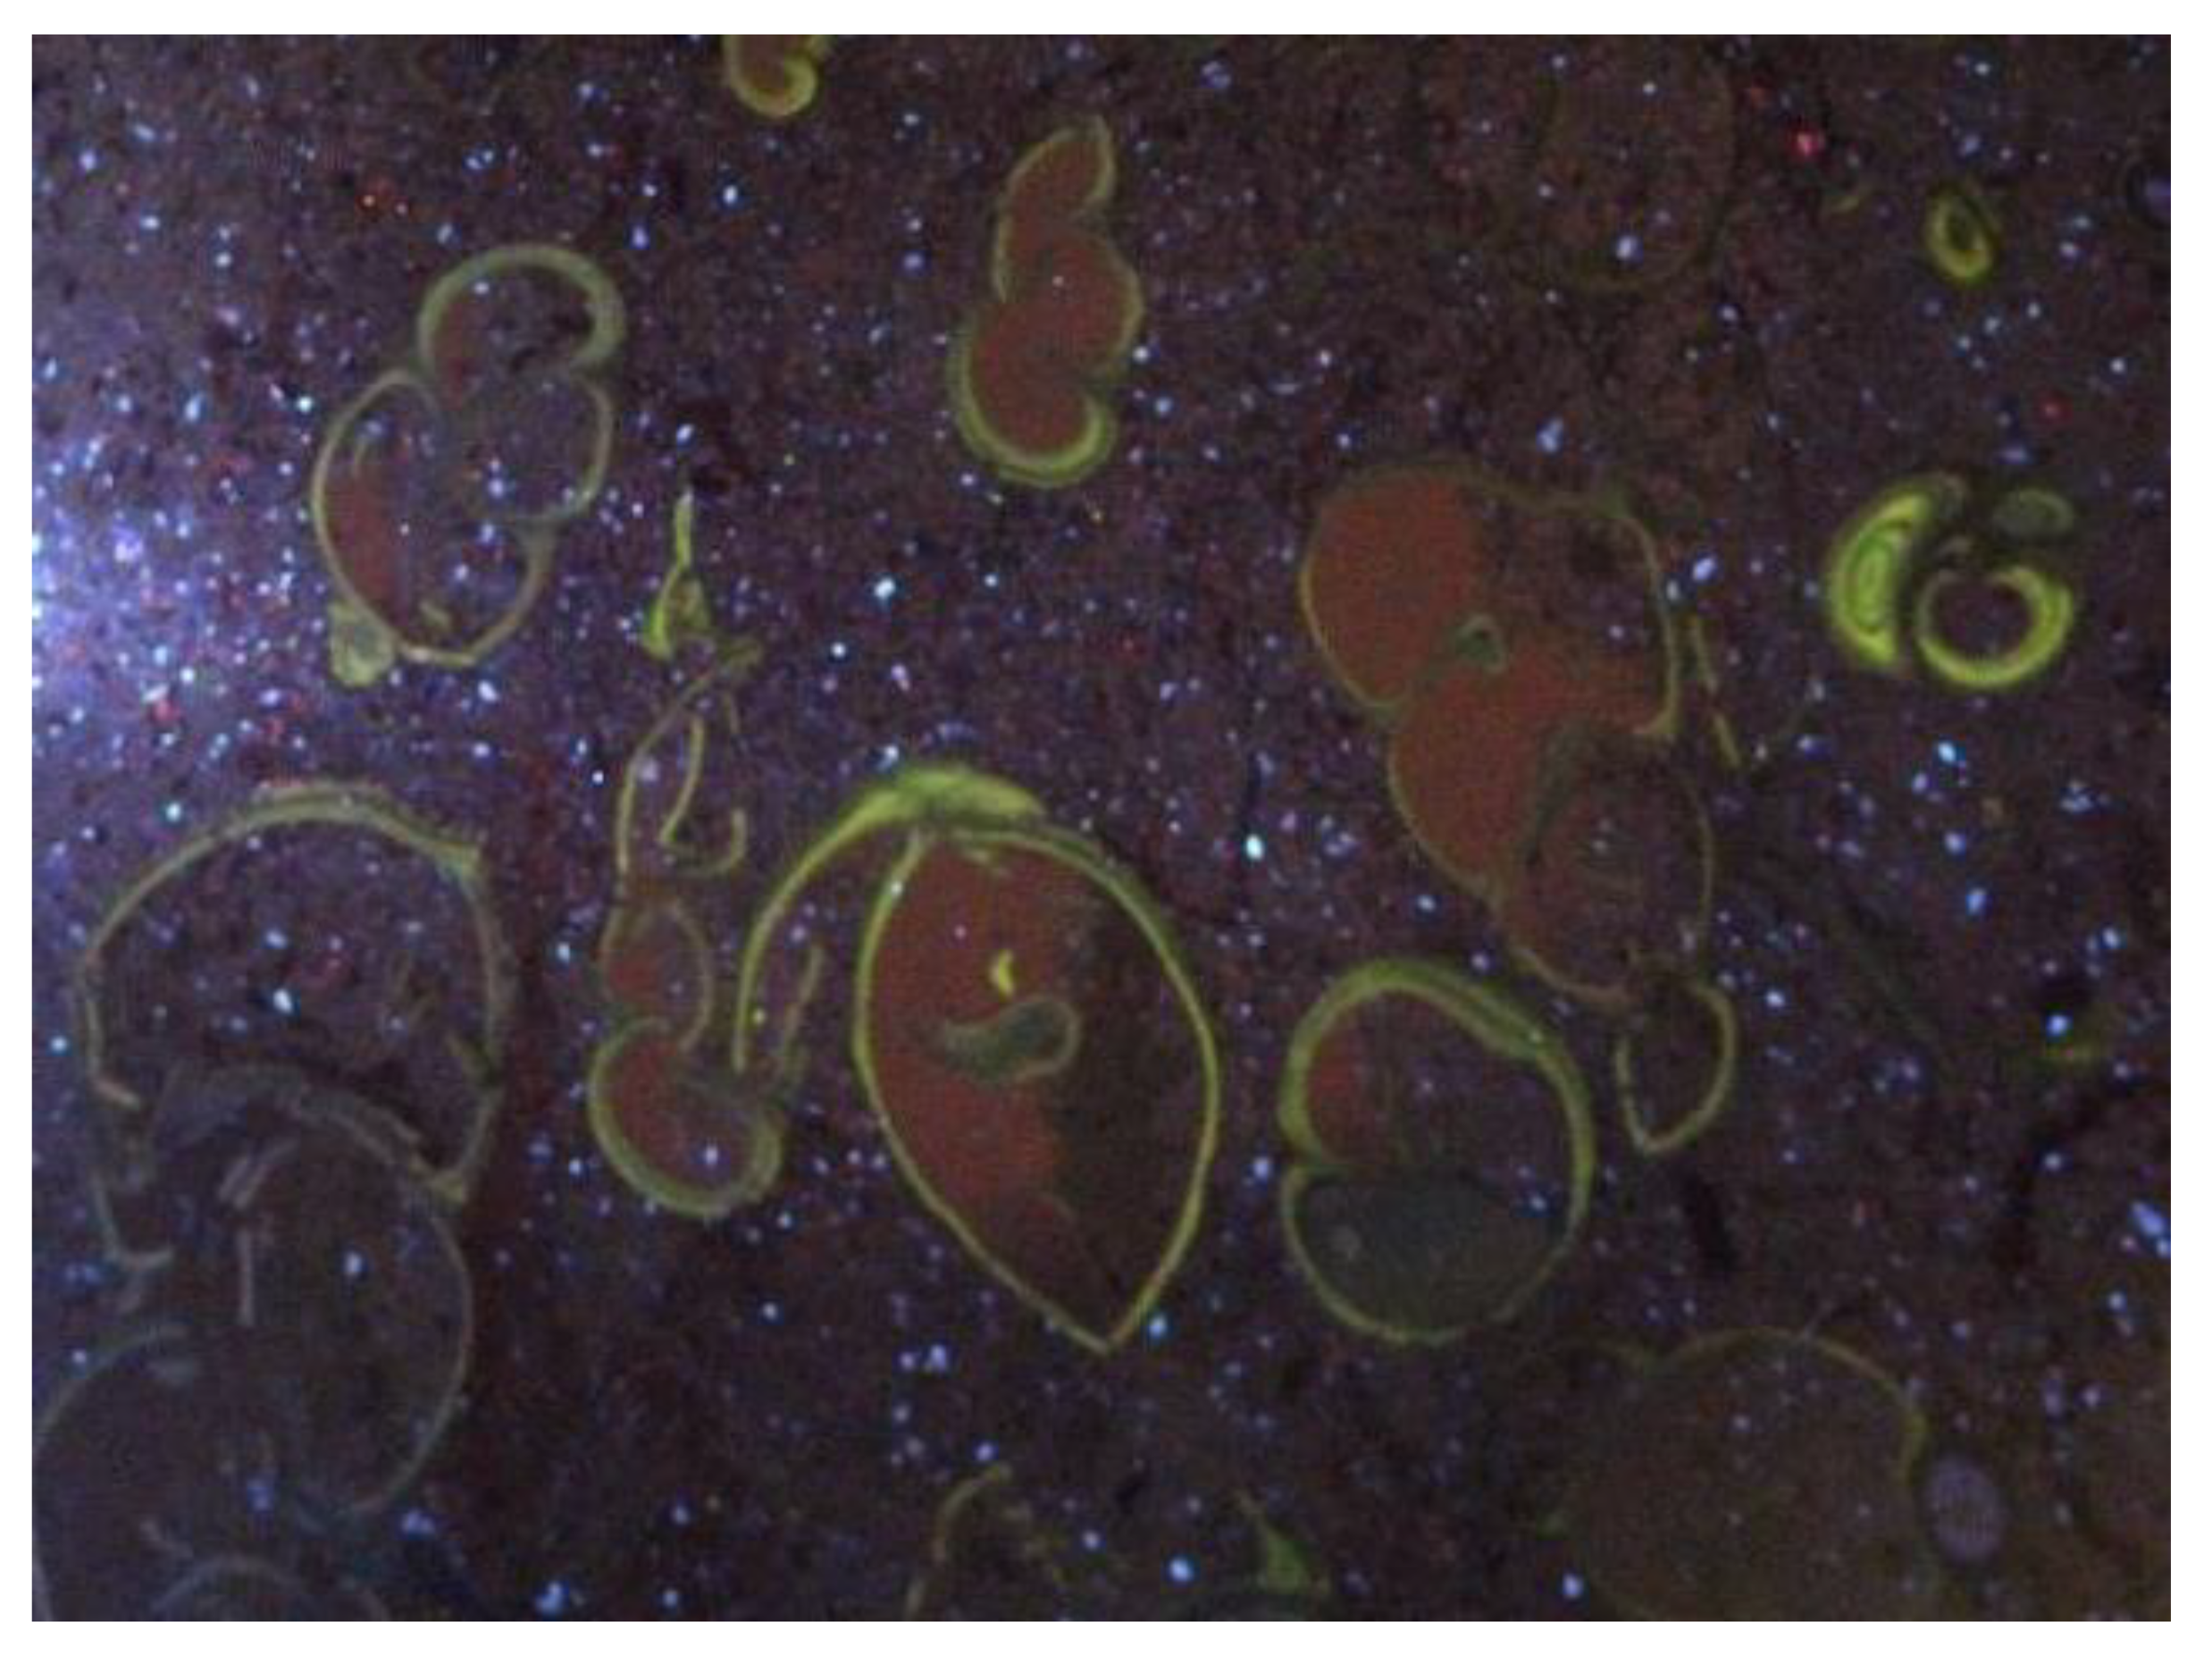
3.1. Petrographic and Cathodoluminescence Imaging

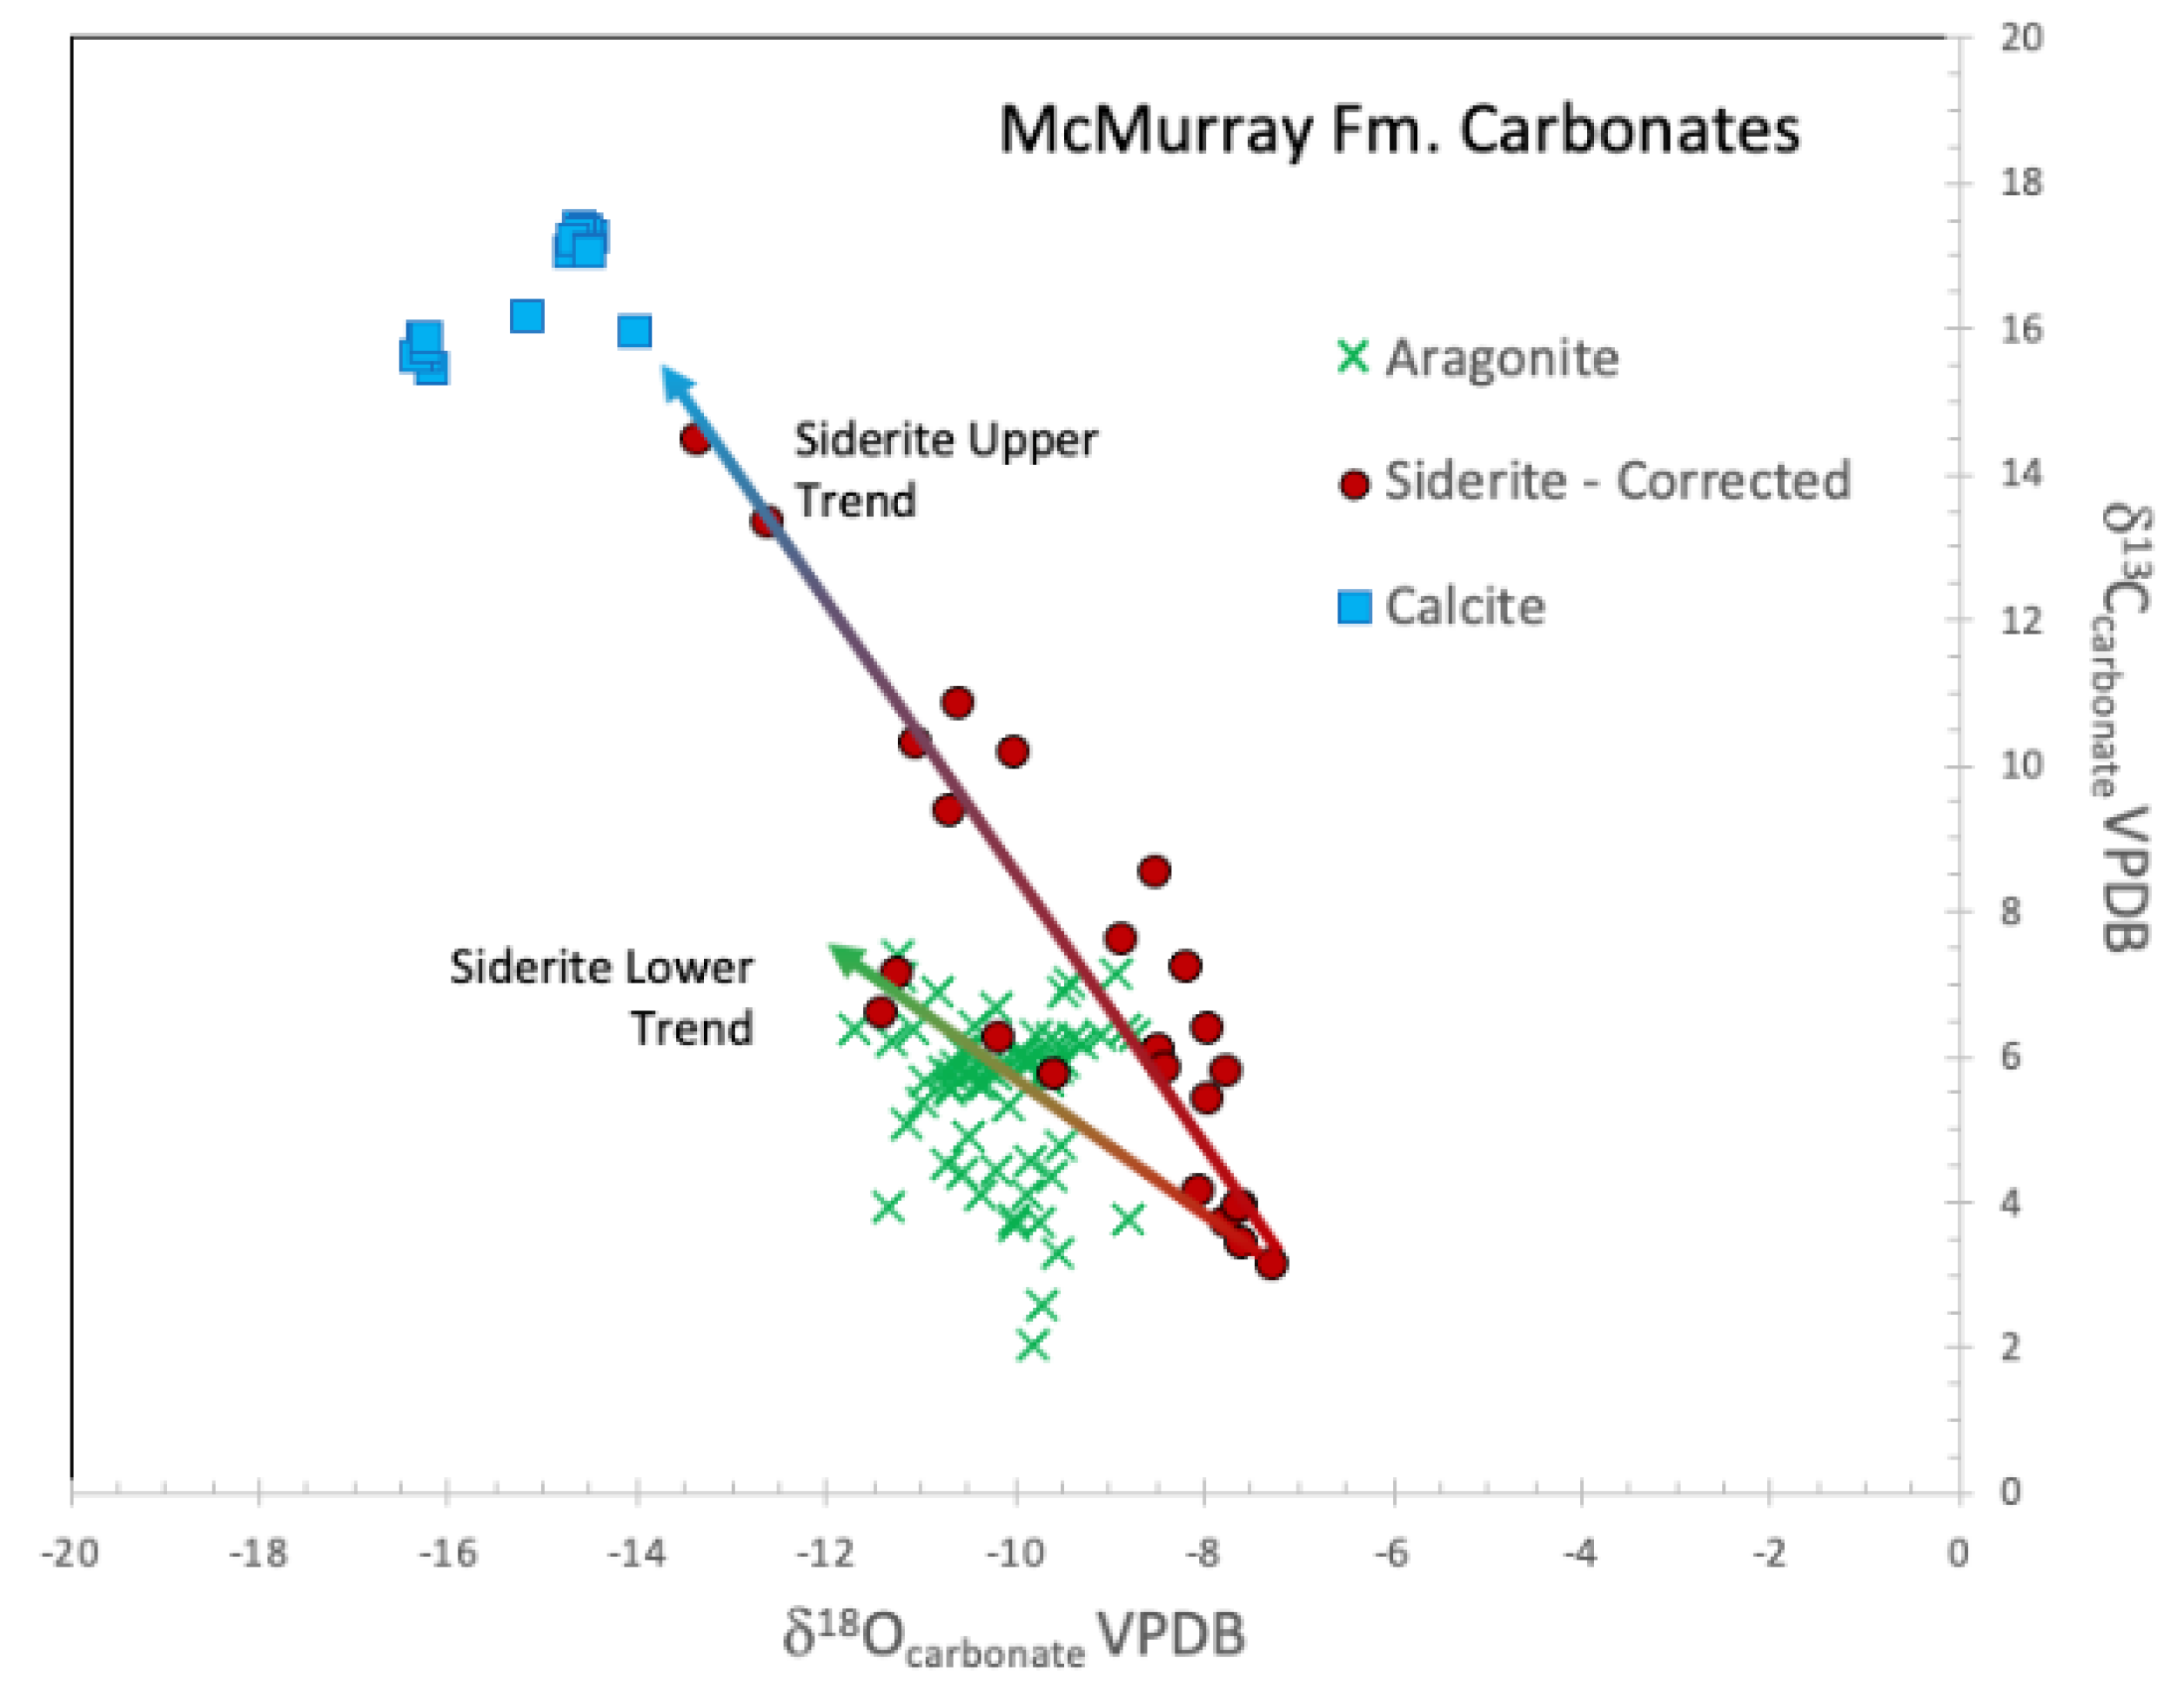
3.2. Isotopic Data
4. Discussion
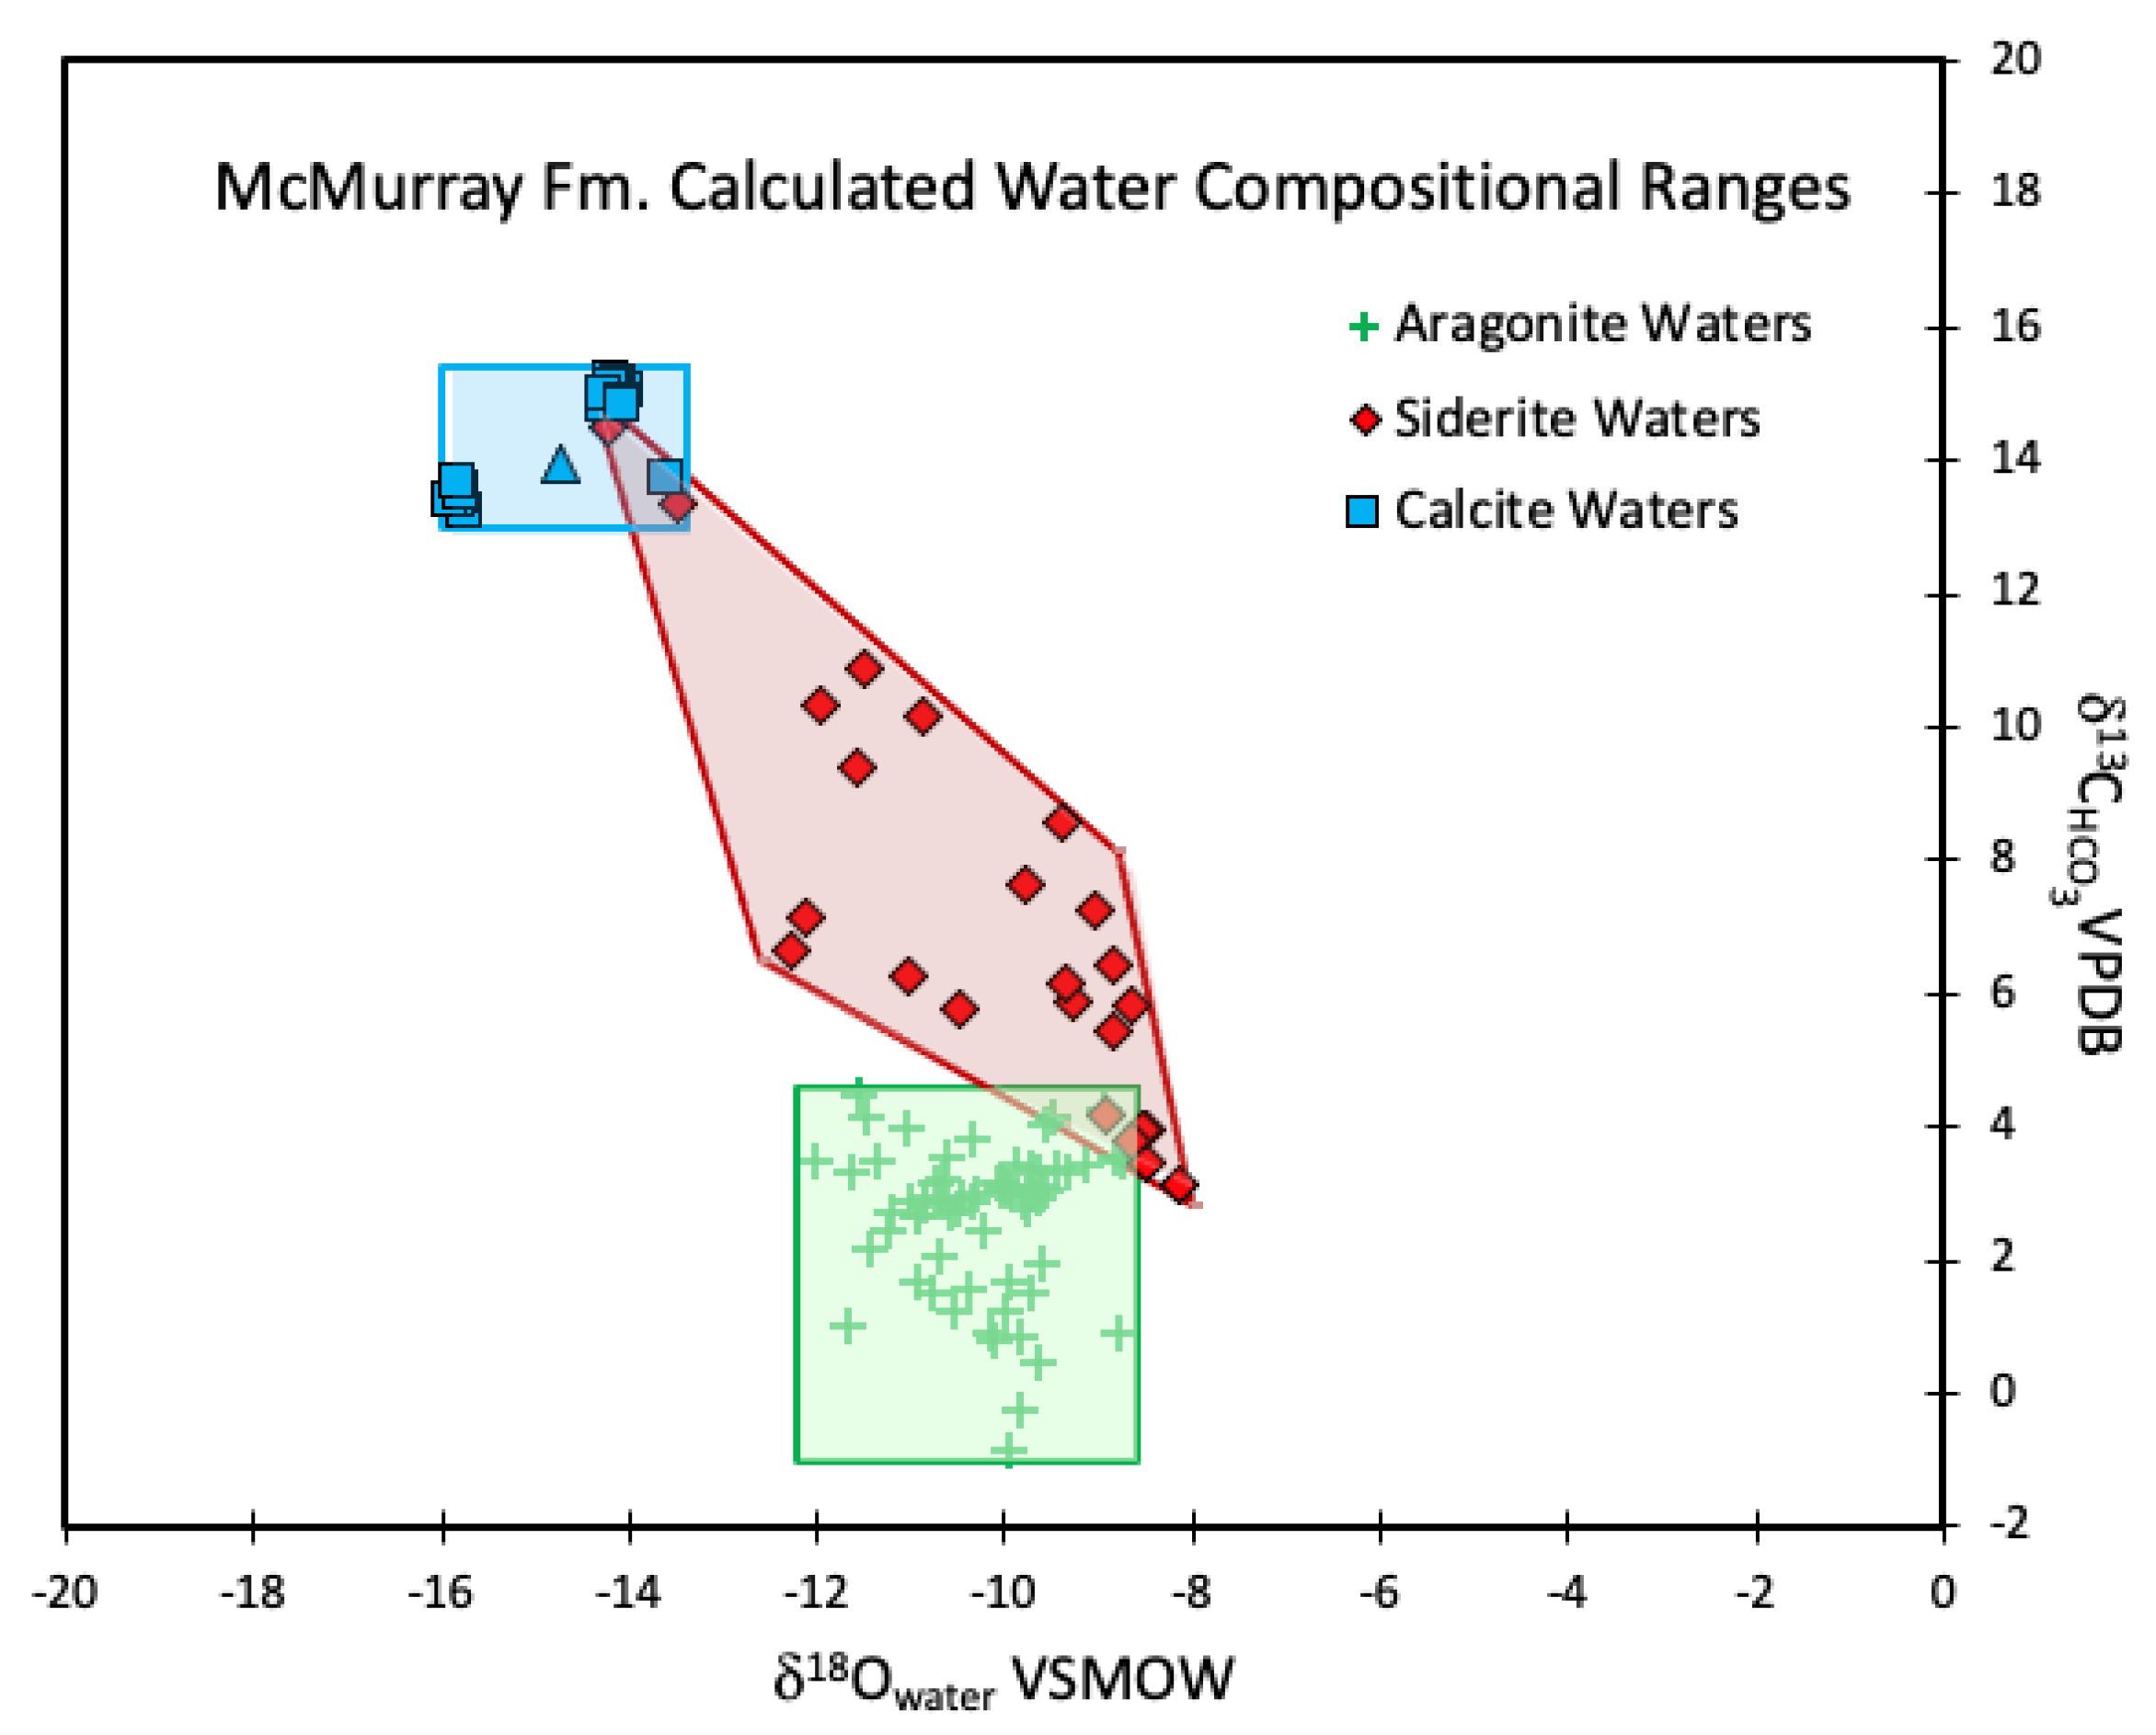
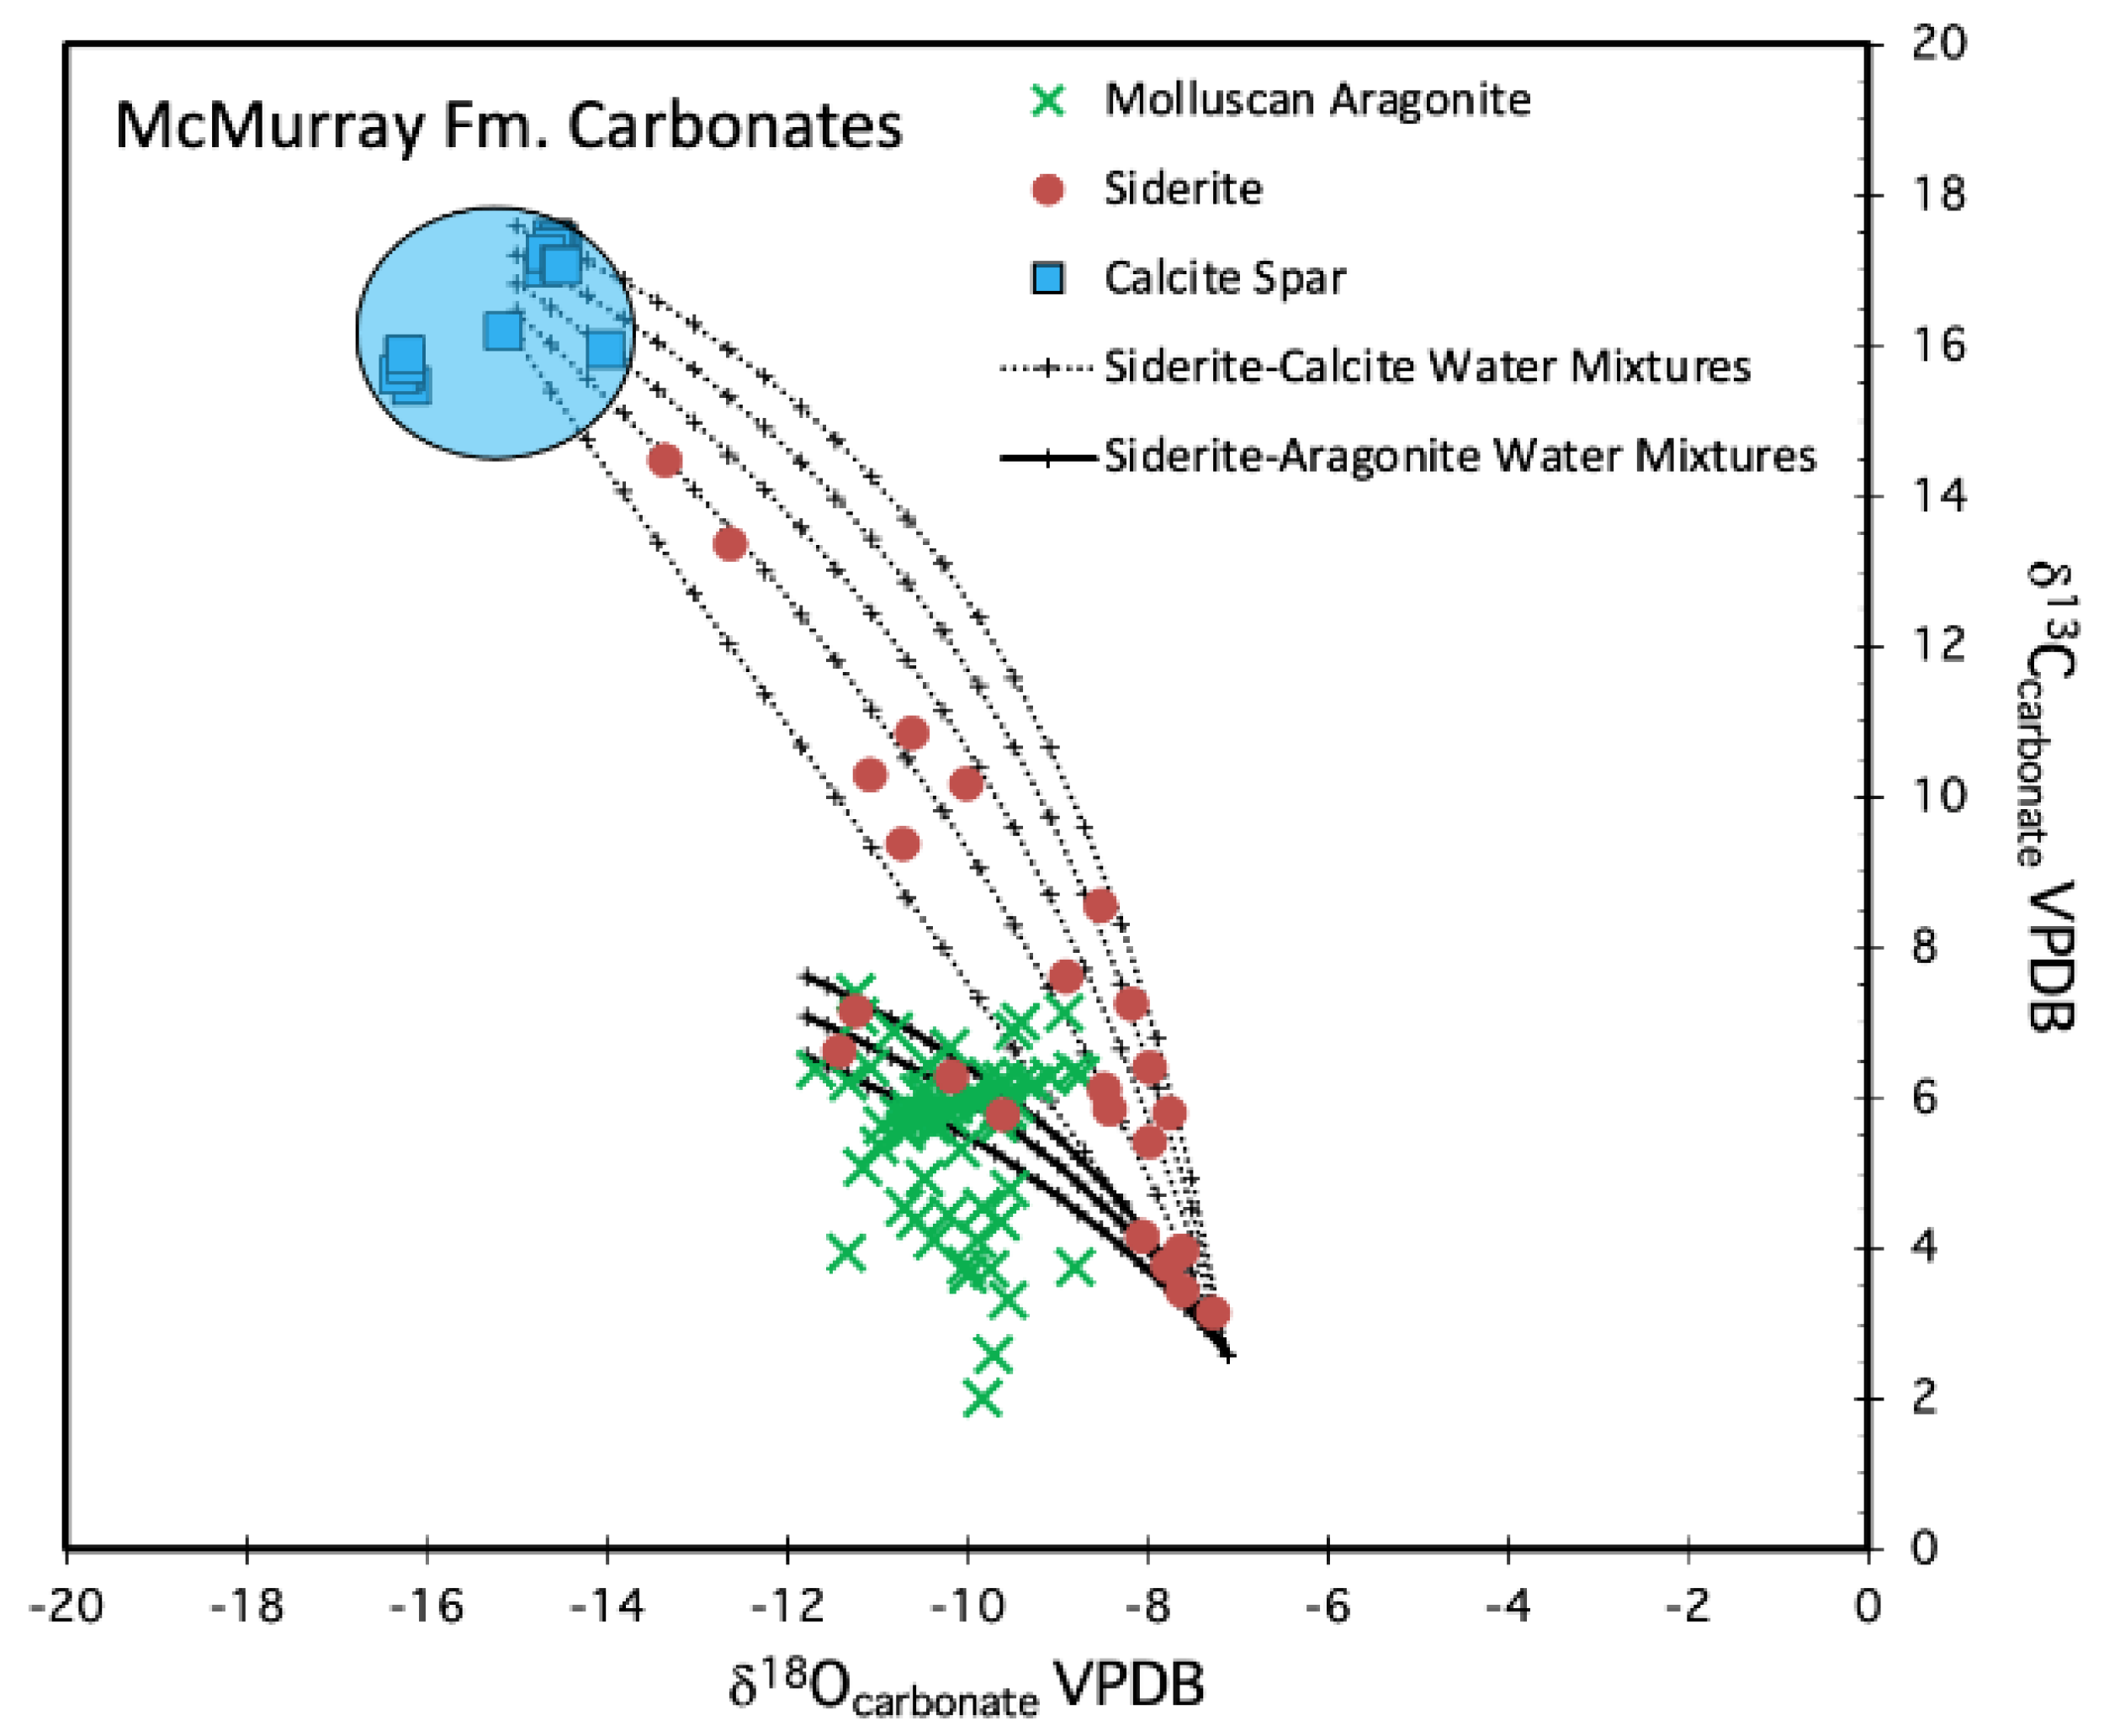
4.1. Stable Isotopic Paleohydrologic Calculations
4.2. Fluid Mixing Processes
4.3. Geochemcial Support for Freshwater in the Literature
4.4. Local Paleogeographic Effects
5. Conclusions
- Calculated paleo-water δ18O is consistent with terrestrial ecosystems rather than marine-influenced waters.
- The range of δ18O values from gastropod shells and authigenic carbonate cement reported herein suggests that the Upper McMurray Formation was deposited by a continental-scale river system, producing so-called “catchment effects” on stable isotopic variability.
Author Contributions
Funding
Data Availability Statement
Acknowledgments
Conflicts of Interest
References
- Dusseault, M.B. Comparing Venezuelan and Canadian heavy oil and tar sands. In Proceedings of the Canadian International Petroleum Conference, Calgary, AB, Canada, 12–14 June 2001. PAPER 2001-061. [Google Scholar]
- Alberta Energy Regulator, 2024, Maps, Map Viewers, and Shapefiles. Available online: https://www.aer.ca/providing-information/data-and-reports/maps-mapviewers-and-shapefiles (accessed on 26 February 2024).
- Wightman, D.M.; Pemberton, S.G. The Lower Cretaceous (Aptian) McMurray Formation: An Overview of the Fort McMurray Area, Northeastern, Alberta; Pemberton, S.G., James, D.P., Eds.; Petroleum Geology of the Previous Cretaceous Mannville Group, Western Canada; Canadian Society of Petroleum Geologists Memoir 18; Canadian Society of Petroleum Geology: Calgary, AB, Canada, 1997; pp. 312–344. [Google Scholar]
- Hubbard, S.M.; Smith, D.G.; Nielsen, H.; Leckie, D.A.; Fustic, M.; Spencer, R.J.; Bloom, L. Seismic geomorphology and sedimentology of a tidally influenced river deposit, Lower Cretaceous Athabasca oil sands, Alberta, Canada. AAPG Bull. 2011, 95, 1123–1145. [Google Scholar] [CrossRef]
- Labrecque, P.A.; Jensen, J.L.; Hubbard, S.M.; Nielsen, H. Sedimentology and stratigraphic architecture of a point bar deposit, Lower Cretaceous McMurray Formation, Alberta, Canada. Bull. Can. Pet. Geol. 2011, 59, 147–171. [Google Scholar] [CrossRef]
- Fustic, M.; Hubbard, S.M.; Spencer, R.; Smith, D.G.; Leckie, D.A.; Bennett, B.; Larter, S. Recognition of down-valley translation in tidally influenced meandering fluvial deposits, Athabasca Oil Sands (Cretaceous), Alberta, Canada. Mar. Pet. Geol. 2012, 29, 219–232. [Google Scholar]
- Moreton, D.J.; Carter, B.J. Characterizing alluvial architecture of point bars within the McMurray Formation, Alberta, Canada, for improved bitumen resource prediction and recovery. In Developments in Sedimentology; Elsevier: Amsterdam, The Netherlands, 2015; Volume 68, pp. 529–559. [Google Scholar]
- Durkin, P.R.; Boyd, R.L.; Hubbard, S.M.; Shultz, A.W.; Blum, M.D. Three-dimensional reconstruction of mean-der-belt evolution, Cretaceous McMurray Formation, Alberta foreland basin, Canada. J. Sediment. Res. 2017, 87, 1075–1099. [Google Scholar] [CrossRef]
- Blum, M.; Pecha, M. Mid-Cretaceous to Paleocene North American drainage reorganization from detrital zircons. Geology 2014, 42, 607–610. [Google Scholar] [CrossRef]
- Benyon, C.; Leier, A.; Leckie, D.A.; Webb, A.; Hubbard, S.M.; Gehrels, G. Provenance of the Cretaceous Athabasca Oil Sands, Canada: Implications for Continental-Scale Sediment Transport. J. Sediment. Res. 2014, 84, 136–143. [Google Scholar] [CrossRef]
- Benyon, C.; Leier, A.L.; Leckie, D.A.; Hubbard, S.M.; Gehrels, G.E. Sandstone provenance and insights into the paleogeography of the McMurray Formation from detrital zircon geochronology, Athabasca Oil Sands, Canada. AAPG Bull. 2016, 100, 269–287. [Google Scholar] [CrossRef]
- Wahbi, A.M.; Blum, M.D.; Doerger, C.N. Early Cretaceous continental-scale sediment routing, the McMurray Formation, Western Canada Sedimentary Basin, Alberta, Canada. GSA Bull. 2022, 135, 2088–2106. [Google Scholar] [CrossRef]
- Blum, M. The McMurray conundrum. Reservoir 2017, 2, 25–29. [Google Scholar]
- Gingras, M.K.; Leckie, D.A. The argument for tidal and brackish water influence in the McMurray Formation reservoirs. Reservoir 2017, 2, 21–24. [Google Scholar]
- Blum, M.; Martin, J.; Milliken, K.; Garvin, M. Paleovalley systems: Insights from Quaternary analogs and experiments. Earth-Sci. Rev. 2013, 116, 128–169. [Google Scholar] [CrossRef]
- Fernandes, A.M.; Törnqvist, T.E.; Straub, K.M.; Mohrig, D. Connecting the backwater hydraulics of coastal rivers to fluvio-deltaic sedimentology and stratigraphy. Geology 2016, 44, 979–982. [Google Scholar] [CrossRef]
- Allan, J.R.; Matthews, R.K. Carbon and oxygen isotopes as diagenetic and stratigraphic tools: Surface and subsurface data, Barbados, West Indies. Geology 1977, 5, 16–20. [Google Scholar] [CrossRef]
- Meyers, W.J.; Lohmann, K.C. Isotope Geochemistry of Regionally Extensive Calcite Cement Zones and Marine Com-Ponents in Mississippian Limestones, New Mexico; Carbonate Cements SEPM Special Publication 36; SEPM (Society for Sedimentary Geology): Tulsa, OK, USA, 1985. [Google Scholar]
- Lohmann, K.C. Geochemical patterns of meteoric diagenetic systems and their application to studies of paleokarst. In Paleokarst; Springer: New York, NY, USA, 1988; pp. 58–80. [Google Scholar]
- Holmden, C.; Creaser, R.; Muehlenbachs, K. Paleosalinities in ancient brackish water systems determined by 87Sr/86Sr ratios in carbonate fossils: A case study from the Western Canada sedimentary basin. Geochim. Cosmochim. Acta 1997, 61, 2105–2118. [Google Scholar] [CrossRef]
- Holmden, C.; Muehlenbachs, K.; Creaser, R.A. Depositional Environment of the Early Cretaceous Ostracode Zone: Paleohydrologic Constraints from O, C and Sr Isotopes. Petroleum Geology of the Cretaceous Mannville Group, Western Canada; Pemberton, S.G., James, D.P., Eds.; Memoir 18; Canadian Society of Petroleum Geologists: Calgary, AB, Canada, 1997; pp. 77–92. [Google Scholar]
- Ufnar, D.F.; Gonzalez, L.A.; Ludvigson, G.A.; Brenner, R.L.; Witzke, B.J. Stratigraphic implications of meteoric sphaerosiderite δ18O values in paleosols of the Cretaceous (Albian) Boulder Creek Formation, NE British Columbia foothills, Canada. J. Sediment. Res. 2001, 71, 1017–1028. [Google Scholar] [CrossRef]
- Ufnar, D.F.; González, L.A.; Ludvigson, G.A.; Brenner, R.L.; Witzke, B.J. The mid-Cretaceous water bearer: Isotope mass balance quantification of the Albian hydrologic cycle. Palaeogeogr. Palaeoclim. Palaeoecol. 2002, 188, 51–71. [Google Scholar] [CrossRef]
- Suarez, M.B.; González, L.A.; Ludvigson, G.A. Quantification of a greenhouse hydrologic cycle from equatorial to polar latitudes: The mid-Cretaceous water bearer revisited. Palaeogeogr. Palaeoclim. Palaeoecol. 2011, 307, 301–312. [Google Scholar] [CrossRef]
- Ross, J.B.; Ludvigson, G.A.; Schröder-Adams, C.J.; Suarez, M.B. High latitude meteoric δ18O compositions from the Cenomanian Bastion Ridge Formation, Axel Heiberg Island, Canadian Arctic Archipelago: A palaeoclimate proxy from the Sverdrup Basin. Geol. Soc. Lond. Spec. Publ. 2020, 498, 57–74. [Google Scholar] [CrossRef]
- DeCelles, P.G. Late Jurassic to Eocene evolution of the Cordilleran thrust belt and foreland basin system, western USA. Am. J. Sci. 2004, 304, 105–168. [Google Scholar] [CrossRef]
- Miall, A.D.; Catuneanu, O.; Vakarelov, B.K.; Post, R. The Western interior basin. Sediment. Basins World 2008, 5, 329–362. [Google Scholar]
- Wellner, R.W.; Varban, B.L.; Roca, X.; Flaum, J.A.; Stewart, E.K.; Blum, M.D. Simple is better when it comes to sequence stratigraphy: The Clearwater Formation of the Mannville Group reinterpreted using a genetic body approach. AAPG Bull. 2018, 102, 447–482. [Google Scholar] [CrossRef]
- Alberta Energy and Utilities Board. Athabasca Wabiskaw-McMurray Regional Geological Study; Report 2003-A; Alberta Energy and Utilities Board: Calgary, AB, Canada, 2003. [Google Scholar]
- Rinke-Hardekopf, L.; Dashtgard, S.; MacEachern, J. Earliest Cretaceous Transgression of North America Recorded in Thick Coals: McMurray Sub-Basin, Canada. Int. J. Coal Geol. 2019, 204, 18–33. [Google Scholar] [CrossRef]
- Rinke-Hardekopf, L.; Dashtgard, S.E.; MacEachern, J.A.; Gingras, M.K. Resolving stratigraphic architecture and constraining ages of paralic strata in a low-accommodation setting, Firebag Tributary, McMurray Formation, Canada. Depos. Rec. 2022, 8, 754–785. [Google Scholar] [CrossRef]
- Selby, D.; Creaser, R.A. Direct Radiometric Dating of Hydrocarbon Deposits Using Rhenium-Osmium Isotopes. Science 2005, 308, 1293–1295. [Google Scholar] [CrossRef] [PubMed]
- Hein, F.J.; Dolby, G.; Fairgrieve, B. A Regional Geologic Framework for the Athabasca Oil Sands, Northeastern Alberta, Canada. In Heavy-Oil and Oil-Sand Petroleum Systems in Alberta and Beyond; Hein, F.J., Leckie, D., Larter, S., Suter, J.R., Eds.; AAPG Studies in Geology 64; American Association of Petroleum Geologists: Tulsa, OK, USA, 2012; pp. 207–250. [Google Scholar]
- Barton; Porter, I.; O’byrne, C.; Mahood, R.; Cotterill, D. Impact of the Prairie Evaporite dissolution collapse on McMurray stratigraphy and depositional patterns, Shell Albian Sands Lease 13, northeast Alberta. Bull. Can. Pet. Geol. 2017, 65, 175–199. [Google Scholar] [CrossRef]
- Broughton, P.L. Alignment of fluvio-tidal point bars in the middle McMurray Formation: Implications for structural architecture of the Lower Cretaceous Athabasca Oil Sands Deposit, northern Alberta. Can. J. Earth Sci. 2016, 53, 896–930. [Google Scholar] [CrossRef]
- Sloss, L.L.; Merriam, D.F. Tectonic cycles of the North American craton. Kans. Geol. Surv. Bull. 1964, 169, 449–460. [Google Scholar]
- Carrigy, M.A. Geology of the McMurray Formation: Part III General Geology of the McMurray Area; Memoir 1; Research Council of Alberta, Geological Division: Edmonton, AB, Canada, 1959; 130p. [Google Scholar]
- Flach, P.D.; Mossop, G.D. Depositional environments of Lower Cretaceous McMurray Formation, Athabasca Oil Sands, Alberta. AAPG Bull. 1985, 69, 1195–1207. [Google Scholar]
- Carrigy, M.A. Deltaic Sedimentation in Athabasca Tar Sands. AAPG Bull. 1971, 55, 1155–1169. [Google Scholar]
- Nelson, H.W.; Glaister, R.P. Subsurface environmental facies and reservoir relationships of the McMurray oil sands, northeastern Alberta. Bull. Can. Pet. Geol. 1978, 26, 177–207. [Google Scholar]
- Horner, S.C.; Hubbard, S.M.; Martin, H.K.; Hagstrom, C.A. Reconstructing basin-scale drainage dynamics with regional subsurface mapping and channel-bar scaling, Aptian, Western Canada Foreland Basin. Sediment. Geol. 2019, 385, 26–44. [Google Scholar] [CrossRef]
- Smith, D.G. Tidal bundles and mud couplets in the McMurray Formation, northeastern Alberta, Canada. Bull. Can. Pet. Geol. 1988, 36, 216–219. [Google Scholar]
- Russell, L.S. Mollusca from the McMurray Formation of northern Alberta. Trans. R. Soc. Can. Sect. 1932, 4, 37–43. [Google Scholar]
- Mellon, G.B.; Wall, J.H. Foraminifera of the upper McMurray and basal Clearwater formations. Alta. Res. Counc. Rep. 1956, 72, 1–29. [Google Scholar]
- Pemberton, S.G.; Flach, P.D.; Mossop, G.D. Trace Fossils from the Athabasca Oil Sands, Alberta, Canada. Science 1982, 217, 825–827. [Google Scholar] [CrossRef] [PubMed]
- Suarez, C.A.; Frucci, M.N.; Tompkins, T.B.; Suarez, M.B. Quantification of a North American greenhouse hydrological cycle: Using oxygen isotopic composition of phosphate from Early Cretaceous (Aptian–Albian) turtles. Geol. Soc. Lond. Spec. Publ. 2021, 507, 335–345. [Google Scholar] [CrossRef]
- Friedman, I.; O’Neil, J.R. Compilation of Stable Isotope Fractionation Factors of Geochemical Interest; US Government Printing Office: Washington, DC, USA, 1977; Volume 440.
- van Dijk, J.; Fernandez, A.; Müller, I.A.; Lever, M.; Bernasconi, S.M. Oxygen isotope fractionation in the sider-ite-water system between 8.5 and 62 °C. Geochim. Cosmochim. Acta 2018, 220, 535–551. [Google Scholar] [CrossRef]
- Kohn, M.J.; Dettman, D.L. Paleoaltimetry from Stable Isotope Compositions of Fossils. Rev. Miner. Geochem. 2007, 66, 119–154. [Google Scholar] [CrossRef]
- Dettman, D.L.; Reische, A.K.; Lohmann, K.C. Controls on the stable isotope composition of seasonal growth bands in aragonitic fresh-water bivalves (unionidae). Geochim. Cosmochim. Acta 1999, 63, 1049–1057. [Google Scholar] [CrossRef]
- Grossman, E.L.; Ku, T.L. Oxygen and carbon isotope fractionation in biogenic aragonite: Temperature effects. Chem. Geol. Isot. Geosci. Sect. 1986, 59, 59–74. [Google Scholar] [CrossRef]
- Deines, P.; Langmuir, D.; Harmon, R.S. Stable carbon isotope ratios and the existence of a gas phase in the evolution of carbonate ground waters. Geochim. Cosmochim. Acta 1974, 38, 1147–1164. [Google Scholar] [CrossRef]
- Carothers, W.W.; Adami, L.H.; Rosenbauer, R.J. Experimental oxygen isotope fractionation between siderite-water and phosphoric acid liberated CO2-siderite. Geochim. Cosmochim. Acta 1988, 52, 2445–2450. [Google Scholar] [CrossRef]
- Scholle, P.A.; Ulmer-Scholle, D.S. A Color Guide to the Petrography of Carbonate Rocks: Grains, Textures, Porosity, Diagenesis; Memoir 77; American Association of Petroleum Geologists: Tulsa, OK, USA, 2003; 474p, ISBN 0-89181-358-6. [Google Scholar]
- Götte, T.; Richter, D.K. Quantitative aspects of Mn-activated cathodoluminescence of natural and synthetic aragonite. Sedimentology 2009, 56, 483–492. [Google Scholar] [CrossRef]
- Barbin, V. Application of cathodoluminescence microscopy to recent and past biological materials: A decade of progress. Miner. Pet. 2013, 107, 353–362. [Google Scholar] [CrossRef]
- Janiszewska, K.; Mazur, M.; Machalski, M.; Stolarski, J. From pristine aragonite to blocky calcite: Exceptional preservation and diagenesis of cephalopod nacre in porous Cretaceous limestones. PLoS ONE 2018, 13, e0208598. [Google Scholar] [CrossRef]
- Mozley, P.S.; Carothers, W.W. Elemental and isotopic composition of siderite in the Kuparuk Formation, Alaska: Effect of microbial activity and water/sediment interaction on early pore-water chemistry. J. Sediment. Petrol. 1992, 62, 681–692. [Google Scholar]
- Kozłowska, A.; Feldman-Olszewska, A.; Kuberska, M.; Maliszewska, A. Diagenesis and the Conditions of Deposition of the Middle Jurassic Siderite Rocks from the Northern Margin of the Holy Cross Mountains (Poland). Minerals 2021, 11, 1353. [Google Scholar] [CrossRef]
- Paxton, S.T.; Szabo, J.O.; Ajdukiewicz, J.M.; Klimentidis, R.E. Construction of an intergranular volume compaction curve for evaluating and predicting compaction and porosity loss in rigid-grain sandstone reservoirs. AAPG Bull. 2002, 86, 2047–2067. [Google Scholar]
- Boggs, S.; Krinsley, D. Application of Cathodoluminescence Imaging to the Study of Sedimentary Rocks; Cambridge University Press: New York, NY, USA, 2006. [Google Scholar]
- Ufnar, D.F.; Ludvigson, G.A.; González, L.A.; Brenner, R.L.; Witzke, B.J. High latitude meteoric δ18O compositions: Paleosol siderite in the middle Cretaceous Nanushuk Formation, North Slope, Alaska. Geol. Soc. Am. Bull. 2004, 116, 463–473. [Google Scholar] [CrossRef]
- Suarez, C.A.; Ludvigson, G.A.; Gonzalez, L.A.; Fiorillo, A.R.; Flaig, P.P.; McCarthy, P.J. Use of multiple oxygen isotope proxies for elucidating Arctic Cretaceous palaeo-hydrology. Geol. Soc. Lond. Spec. Publ. 2013, 382, 185–202. [Google Scholar] [CrossRef]
- González, L.A.; Lohmann, K.C. Carbon and oxygen isotopic composition of Holocene reefal carbonates. Geology 1985, 13, 811–814. [Google Scholar] [CrossRef]
- Lohmann, K.C.; Walker, J.C. The δ18O record of Phanerozoic abiotic marine calcite cements. Geophys. Res. Lett. 1989, 16, 319–322. [Google Scholar] [CrossRef]
- Choquette, P.W.; James, N.P. Marine Diagenesis; McIlreath, I., Morrow, D., Eds.; Geoscience Canada: Ottawa, Canada, 1990; Volume 10. [Google Scholar]
- Dutton, A.; Wilkinson, B.H.; Welker, J.M.; Bowen, G.J.; Lohmann, K.C. Spatial distribution and seasonal variation in 18O/16O of modern precipitation and river water across the conterminous USA. Hydrol. Process. 2005, 19, 4121–4146. [Google Scholar] [CrossRef]
- Martens, C.S.; Albert, D.B.; Alperin, M.J. Stable isotope tracing of anaerobic methane oxidation in the gassy sediments of Eckernfoerde Bay, German Baltic Sea. Am. J. Sci. 1999, 299, 589. [Google Scholar] [CrossRef]
- Aravena, R.; Harrison, S.; Barker, J.; Abercrombie, H.; Rudolph, D. Origin of methane in the Elk Valley coalfield, southeastern British Columbia, Canada. Chem. Geol. 2003, 195, 219–227. [Google Scholar] [CrossRef]
- Thomas, M.A. Chemical and Isotopic Characteristics of Methane in Groundwater of Ohio, 2016; US Geological Survey Scientific Investigations Report 2018-5097; US Geological Survey Scientific Investigations: Reston, VA, USA, 2018; 52p.
- Ufnar, D.F.; Gonzalez, L.A.; Ludvigson, G.A.; Brenner, R.L.; Witzke, B.J.; Leckie, D. Reconstructing a Mid-Cretaceous Landscape from Paleosols in Western Canada. J. Sediment. Res. 2005, 75, 984–996. [Google Scholar] [CrossRef]
- Ludvigson, G.A.; González, L.A.; Fowle, D.A.; Roberts, J.A.; Driese, S.G.; Villarreal, M.A.; Smith, J.J.; Suarez, M.B.; Nordt, L.C. Paleoclimatic Applications and Modern Process Studies of Pedogenic Siderite; New Frontiers in Paleopedology and Terrestrial Paleoclimatology; SEPM (Society for Sedimentary Geology): Tulsa, OK, USA, 2013. [Google Scholar]
- Ludvigson, G.A.; González, L.A.; Metzger, R.A.; Witzke, B.J.; Brenner, R.L.; Murillo, A.P.; White, T.S. Meteoric sphaerosiderite lines and their use for paleohydrology and paleoclimatology. Geology 1998, 26, 1039–1042. [Google Scholar] [CrossRef]
- Pickering, M.D.; Ghislandi, S.; Usai, M.R.; Wilson, C.; Connelly, P.; Brothwell, D.R.; Keely, B.J. Signatures of degraded body tissues and environmental conditions in grave soils from a Roman and an Anglo-Scandinavian age burial from Hungate, York. J. Archaeol. Sci. 2018, 99, 87–98. [Google Scholar] [CrossRef]
- Bojanowski, M.J.; Goryl, M.; Kremer, B.; Marciniak-Maliszewska, B.; Marynowski, L.; Środoń, J. Pedogenic siderites fossilizing Ediacaran soil microorganisms on the Baltica paleocontinent. Geology 2020, 48, 62–66. [Google Scholar] [CrossRef]
- Sengupta, R.; Robinson, S.A.; Tosca, N.J. Sphaerosiderites as sensitive recorders of non-marine depositional and diagenetic history: Insights from the Lower Cretaceous Wealden Supergroup. Depos. Rec. 2021, 7, 520–540. [Google Scholar] [CrossRef]


| Mass (mg) | ID1 | Material | Note | Mineralogy | δ18O (‰VPDB) | δ18O (±1SD) | δ13C (‰VPDB) | δ13C (±1SD) |
|---|---|---|---|---|---|---|---|---|
| 0.3857 | MB-S1-26A | SAND | DARK | S | −6.39 | 0.01 | 3.76 | 0.01 |
| 0.3786 | MB-S1-12B | SAND | DARK | S | −6.23 | 0.02 | 3.45 | 0.01 |
| 0.3943 | MB-S1-24A | SAND | DARK | S | −5.89 | 0.02 | 3.14 | 0.01 |
| 0.3965 | MB-S1-20C | SAND | DARK | S | −6.24 | 0.01 | 3.97 | 0.00 |
| 0.3977 | MB-S1-27A | SAND | DARK | S | −6.26 | 0.02 | 3.98 | 0.01 |
| 0.3597 | MB-S1-14A | SAND | DARK-CL | S | −6.68 | 0.02 | 4.17 | 0.01 |
| 0.3659 | MB-S1-25A | SAND | LIGHT | S | −7.15 | 0.02 | 8.55 | 0.01 |
| 0.3799 | MB-S1-17A | SAND | LIGHT | S | −6.60 | 0.02 | 5.41 | 0.01 |
| 0.3387 | MB-S1-16B | SAND | LIGHT | S | −9.24 | 0.02 | 10.86 | 0.01 |
| 0.4097 | MB-S1-11D | SAND | LIGHT | S | −6.80 | 0.01 | 7.26 | 0.00 |
| 0.3055 | MB-S1-07B | SAND | LIGHT | S | −9.34 | 0.02 | 9.38 | 0.01 |
| 0.4228 | MB-S1-09B | SAND | LIGHT | S | −8.79 | 0.03 | 6.28 | 0.00 |
| 0.3961 | MB-S1-10C | SAND | LIGHT | S | −9.87 | 0.02 | 7.16 | 0.02 |
| 0.3192 | MB-S1-31A | SAND | LIGHT | S | −7.51 | 0.03 | 7.61 | 0.01 |
| 0.5132 | MB-S1-01E | SAND | SPAR | S | −6.41 | 0.01 | 7.26 | 0.01 |
| 0.4737 | MB-S1-04E | SAND | SPAR | S | −10.04 | 0.03 | 6.63 | 0.01 |
| 0.354 | MB-S1-13B | SAND | SPAR | S | −8.23 | 0.03 | 5.77 | 0.00 |
| 0.3711 | MB-S1-14C | SAND | SPAR | S | −6.60 | 0.01 | 6.40 | 0.01 |
| 0.2047 | MB-S1-05A | SAND | - | S | −6.38 | 0.02 | 5.80 | 0.01 |
| 0.24 | MB-S1-15C | SAND | - | S | −8.63 | 0.01 | 10.19 | 0.01 |
| 0.2747 | MB-S1-18B | SAND | - | S | −11.99 | 0.02 | 14.48 | 0.01 |
| 0.2034 | MB-S1-03B | SAND | - | S | −11.25 | 0.02 | 13.36 | 0.01 |
| 0.2385 | MB-S1-19D | SAND | - | S | −9.70 | 0.02 | 10.31 | 0.01 |
| 0.2141 | MB-S1-06A | SAND | - | S | −7.09 | 0.01 | 6.12 | 0.01 |
| 0.3953 | MB-S1-08A | SAND | - | S | −7.04 | 0.01 | 5.85 | 0.01 |
| 0.0588 | MB-S1-7A | SHELL | BROWN | A | −10.38 | 0.01 | 4.11 | 0.01 |
| 0.1076 | MB-S1-14b | SHELL | BROWN-EPOXY | A | −10.94 | 0.01 | 5.65 | 0.01 |
| 0.0923 | MB-S1-13A | SHELL | DIRTY | A | −11.25 | 0.02 | 7.39 | 0.00 |
| 0.0587 | MB-S1-11B | SHELL | WHITE | A | −8.80 | 0.01 | 3.76 | 0.02 |
| 0.0992 | MB-S1-11C | SHELL | WHITE | A | −10.81 | 0.01 | 6.89 | 0.01 |
| 0.0856 | MB-S1-18A | SHELL | WHITE | A | −11.16 | 0.02 | 5.07 | 0.01 |
| 0.0652 | MB-S1-03C | SHELL | WHITE | A | −10.57 | 0.02 | 4.39 | 0.01 |
| 0.1003 | MB-S1-03d | SHELL | WHITE | A | −10.64 | 0.02 | 5.86 | 0.02 |
| 0.2757 | MB-S1-03e | SHELL | WHITE | A | - | - | - | - |
| 0.0941 | MB-S1-28a | SHELL | WHITE | A | −11.35 | 0.01 | 3.95 | 0.01 |
| 0.0789 | MB-S1-05b | SHELL | WHITE | A | −12.27 | 0.02 | 9.73 | 0.02 |
| 0.0667 | MB-S1-15d | SHELL | WHITE | A | −9.99 | 0.03 | 3.66 | 0.01 |
| 0.0876 | MB-S1-11E | SHELL | WHITE | A | −10.21 | 0.03 | 4.44 | 0.01 |
| 0.0916 | MB-S1-04C | SHELL | WHITE | A | −10.43 | 0.01 | 6.42 | 0.01 |
| 0.0909 | MB-S1-23B | SHELL | WHITE | A | −11.69 | 0.01 | 6.39 | 0.01 |
| 0.0672 | MB-S1-29A | SHELL | WHITE | A | −11.20 | 0.03 | 7.09 | 0.01 |
| 0.0817 | MB-S1-15E | SHELL | WHITE | A | −9.89 | 0.02 | 4.11 | 0.01 |
| 0.0863 | MB-S1-11F | SHELL | WHITE | A | −9.75 | 0.01 | 3.72 | 0.01 |
| 0.0698 | MB-S1-11G | SHELL | WHITE | A | −9.72 | 0.01 | 2.60 | 0.01 |
| 0.0732 | MB-S1-04D | SHELL | WHITE | A | −11.32 | 0.02 | 6.22 | 0.01 |
| 0.4848 | MB-S1-15A | SHELL | - | A | −10.15 | 0.01 | 4.78 | 0.01 |
| 0.1085 | MB-S1-15B | SHELL | - | A | −16.36 | 0.02 | 1.11 | 0.01 |
| 0.0554 | MB-S1-01A | SHELL | - | A | −10.02 | 0.01 | 3.78 | 0.00 |
| 0.0701 | MB-S1-01B | SHELL | - | A | −9.56 | 0.01 | 3.31 | 0.01 |
| 0.0684 | MB-S1-01C | SHELL | - | A | −9.53 | 0.01 | 4.79 | 0.01 |
| 0.094 | MB-S1-03A | SHELL | - | A | −10.07 | 0.01 | 5.32 | 0.01 |
| 0.0571 | MB-S1-09A | SHELL | - | A | −9.63 | 0.01 | 4.35 | 0.01 |
| 0.0971 | MB-S1-04B | SHELL | - | A | −10.76 | 0.01 | 5.79 | 0.01 |
| 0.0794 | MB-S1-12A | SHELL | - | A | −10.65 | 0.01 | 5.73 | 0.01 |
| 0.0659 | MB-S1-16A | SHELL | - | A | −10.20 | 0.02 | 5.76 | 0.01 |
| 0.0547 | MB-S1-21A | SHELL | - | A | −11.07 | 0.01 | 6.40 | 0.00 |
| 0.0833 | MB-S1-22A | SHELL | - | A | −9.83 | 0.01 | 2.02 | 0.01 |
| 0.0892 | MB-S1-23A | SHELL | - | A | −9.83 | 0.01 | 4.55 | 0.01 |
| 0.0791 | MB-S1-02A | SPAR | CL | C | −14.48 | 0.01 | 17.27 | 0.01 |
| 0.1094 | MB-S1-10B | SPAR | CL | C | −14.67 | 0.01 | 17.11 | 0.01 |
| 0.0877 | MB-S1-02B | SPAR | CL | C | −14.61 | 0.01 | 17.42 | 0.01 |
| 0.0861 | MB-S1-02C | SPAR | CL | C | −14.56 | 0.02 | 17.37 | 0.02 |
| 0.1712 | MB-S1-19C | SPAR | DIRTY | C | −12.31 | 0.02 | 12.96 | 0.00 |
| 0.0705 | MB-S1-01D | SPAR | NL | C | −14.56 | 0.01 | 17.31 | 0.01 |
| 0.0714 | MB-S1-20A | SPAR | NL | C | −16.23 | 0.02 | 15.78 | 0.01 |
| 0.0715 | MB-S1-20B | SPAR | NL | C | −16.18 | 0.02 | 15.48 | 0.01 |
| 0.0768 | MB-S1-10A | SPAR | NL | C | −14.70 | 0.02 | 17.05 | 0.02 |
| 0.0934 | MB-S1-19A | SPAR | NL | C | −16.24 | 0.01 | 15.67 | 0.01 |
| 0.1034 | MB-S1-19B | SPAR | NL | C | −16.26 | 0.02 | 15.63 | 0.02 |
| 0.0542 | MB-S1-04A | SPAR | NL | C | −14.61 | 0.02 | 17.30 | 0.01 |
| 0.0721 | MB-S1-10D | SPAR | NL | C | −14.69 | 0.01 | 17.22 | 0.01 |
| 0.0835 | MB-S1-20D | SPAR | NL | C | −16.26 | 0.01 | 15.89 | 0.01 |
| 0.0579 | MB-S1-20E | SPAR | NL | C | −16.33 | 0.05 | 15.62 | 0.01 |
| 0.0795 | MB-S1-17B | SPAR | NL | C | −15.16 | 0.01 | 16.19 | 0.01 |
| 0.0618 | MB-S1-19E | SPAR | NL | C | −16.23 | 0.01 | 15.75 | 0.01 |
| 0.0733 | MB-S1-02D | SPAR | NL | C | −14.52 | 0.01 | 17.10 | 0.00 |
| 0.0862 | MB-S1-20F | SPAR | NL | C | −16.24 | 0.01 | 15.89 | 0.01 |
| 0.0961 | MB-S1-03F | SPAR | NL | C | −14.02 | 0.02 | 15.95 | 0.01 |
| 0.0716 | MB-S1-11A | SPAR | - | C | −14.51 | 0.03 | 17.07 | 0.00 |
| 0.0022 | MB-S1-30A | SPAR | - | C | −12.32 | 0.03 | 8.57 | 0.00 |
| 0.0888 | MB-S3-1 | SHELL | NONPOROUS | A | −10.28 | 0.01 | 5.85 | 0.01 |
| 0.0531 | MB-S3-2 | SHELL | NONPOROUS | A | −10.42 | 0.04 | 5.77 | 0.01 |
| 0.0558 | MB-S3-3 | SHELL | NONPOROUS | A | −10.49 | 0.01 | 4.92 | 0.01 |
| 0.0645 | MB-S3-4 | SHELL | NONPOROUS | A | −9.48 | 0.02 | 5.92 | 0.01 |
| 0.0845 | MB-S3-5 | SHELL | NONPOROUS | A | −10.41 | 0.02 | 5.63 | 0.02 |
| 0.0723 | MB-S3-6 | SHELL | NONPOROUS | A | −9.92 | 0.02 | 6.03 | 0.01 |
| 0.0646 | MB-S3-7 | SHELL | NONPOROUS | A | −9.85 | 0.01 | 5.92 | 0.00 |
| 0.0755 | MB-S3-8 | SHELL | NONPOROUS | A | −9.95 | 0.02 | 6.03 | 0.01 |
| 0.092 | MB-S3-9 | SHELL | NONPOROUS | A | −9.83 | 0.01 | 5.96 | 0.01 |
| 0.0686 | MB-S3-10 | SHELL | NONPOROUS | A | −10.20 | 0.01 | 6.68 | 0.01 |
| 0.0559 | MB-S3-11 | SHELL | NONPOROUS | A | −10.71 | 0.01 | 4.54 | 0.01 |
| 0.0565 | MB-S3-12 | SHELL | NONPOROUS | A | −10.46 | 0.03 | 6.11 | 0.01 |
| 0.0909 | MB-S3-13 | SHELL | NONPOROUS | A | −8.83 | 0.01 | 6.37 | 0.01 |
| 0.0723 | MB-S3-14 | SHELL | NONPOROUS | A | −10.98 | 0.01 | 5.36 | 0.02 |
| 0.0874 | MB-S3-15 | SHELL | NONPOROUS | A | −9.62 | 0.01 | 6.24 | 0.01 |
| 0.0588 | MB-S3-16 | SHELL | NONPOROUS | A | −9.66 | 0.01 | 5.65 | 0.02 |
| 0.0576 | MB-S3-17 | SHELL | NONPOROUS | A | −8.92 | 0.01 | 7.13 | 0.01 |
| 0.0874 | MB-S3-18 | SHELL | NONPOROUS | A | −10.70 | 0.02 | 5.58 | 0.01 |
| 0.0874 | MB-S3-19 | SHELL | NONPOROUS | A | −6.02 | 0.03 | 1.24 | 0.01 |
| 0.0699 | MB-S3-20 | SHELL | NONPOROUS | A | −9.52 | 0.02 | 5.97 | 0.01 |
| 0.0629 | MB-S3-21 | SHELL | NONPOROUS | A | −9.56 | 0.04 | 5.83 | 0.04 |
| 0.0834 | MB-S3-32 | SHELL | NONPOROUS | A | −9.64 | 0.02 | 5.85 | 0.01 |
| 0.0632 | MB-S3-34 | SHELL | NONPOROUS | A | −10.15 | 0.02 | 5.89 | 0.01 |
| 0.0745 | MB-S3-39 | SHELL | NONPOROUS | A | −10.49 | 0.01 | 5.78 | 0.01 |
| 0.0622 | MB-S3-40 | SHELL | NONPOROUS | A | −10.34 | 0.02 | 5.64 | 0.01 |
| 0.0815 | MB-S3-22 | SHELL | POROUS | A | −9.57 | 0.01 | 6.18 | 0.00 |
| 0.1614 | MB-S3-23 | SHELL | POROUS | A | −9.48 | 0.01 | 6.90 | 0.01 |
| 0.1365 | MB-S3-24 | SHELL | POROUS | A | −8.75 | 0.01 | 6.31 | 0.00 |
| 0.1196 | MB-S3-25 | SHELL | POROUS | A | −9.66 | 0.01 | 5.86 | 0.01 |
| 0.1139 | MB-S3-26 | SHELL | POROUS | A | −9.92 | 0.01 | 5.93 | 0.01 |
| 0.1607 | MB-S3-27 | SHELL | POROUS | A | −9.42 | 0.02 | 7.00 | 0.01 |
| 0.125 | MB-S3-28 | SHELL | POROUS | A | −9.88 | 0.01 | 5.97 | 0.01 |
| 0.1548 | MB-S3-29 | SHELL | POROUS | A | −9.27 | 0.01 | 6.19 | 0.01 |
| 0.1429 | MB-S3-30 | SHELL | POROUS | A | −9.77 | 0.01 | 6.29 | 0.00 |
| 0.1125 | MB-S3-31 | SHELL | POROUS | A | −9.69 | 0.01 | 5.75 | 0.01 |
| 0.1755 | MB-S3-33 | SHELL | POROUS | A | −9.10 | 0.02 | 6.29 | 0.00 |
| 0.1877 | MB-S3-35 | SHELL | POROUS | A | −9.40 | 0.01 | 6.24 | 0.01 |
| 0.1373 | MB-S3-36 | SHELL | POROUS | A | −9.64 | 0.01 | 5.86 | 0.01 |
| 0.0647 | MB-S3-37 | SHELL | POROUS | A | −10.55 | 0.02 | 6.07 | 0.01 |
| 0.1211 | MB-S3-38 | SHELL | POROUS | A | −10.69 | 0.02 | 5.54 | 0.01 |
| Aragonite (River Water) | Calcite (Groundwater) | Siderite (Groundwater) | |||||
|---|---|---|---|---|---|---|---|
| t °C | |||||||
| Max | −8.73 | 20.35 | 4.41 | −13.59 | 15.20 | −8.15 | 14.48 |
| Min | −12.03 | 18.55 | −0.94 | −15.89 | 13.26 | −14.22 | 3.14 |
| Mean | −10.24 | 19.52 | 2.56 | −14.82 | 14.29 | −10.16 | 7.08 |
| Std Dev | 0.74 | 0.41 | 1.08 | 0.85 | 0.75 | 1.74 | 3.05 |
| Range | 3.30 | 1.80 | 5.35 | 2.30 | 1.94 | 6.07 | 11.34 |
| +2 s | −8.38 | 20.54 | 5.26 | −12.68 | 16.17 | −5.82 | 14.70 |
| −2 s | −12.10 | 18.51 | −0.13 | −16.96 | 12.40 | −14.51 | −0.54 |
| Endmember | t °C | DIC (mmol) | ||
|---|---|---|---|---|
| Siderite GW | 17.57 | −8.00 | 0.05 | 6.00 |
| Calcite GW 1 | 17.57 | −15.89 | 15.00 | 21.00 |
| Calcite GW 2 | 17.57 | −15.89 | 14.63 | 17.25 |
| Calcite GW 3 | 17.57 | −15.89 | 114.25 | 13.50 |
| Calcite GW 4 | 17.57 | −15.89 | 13.38 | 9.75 |
| Calcite GW 5 | 17.57 | −15.89 | 13.50 | 6.00 |
| River water 1 * | 20.35 | −12.03 | 5.00 | 12.00 |
| River water 2 * | 20.35 | −12.03 | 4.47 | 11.40 |
| River water 3 * | 20.35 | −12.03 | 3.94 | 10.20 |
| River water 4 | 20.35 | −12.03 | 3.41 | 9.60 |
| River water 5 | 20.35 | −12.03 | 2.00 | 4.43 |
Disclaimer/Publisher’s Note: The statements, opinions and data contained in all publications are solely those of the individual author(s) and contributor(s) and not of MDPI and/or the editor(s). MDPI and/or the editor(s) disclaim responsibility for any injury to people or property resulting from any ideas, methods, instructions or products referred to in the content. |
© 2024 by the authors. Licensee MDPI, Basel, Switzerland. This article is an open access article distributed under the terms and conditions of the Creative Commons Attribution (CC BY) license (https://creativecommons.org/licenses/by/4.0/).
Share and Cite
Hasiuk, F.; Wahbi, A.; González, L.; Blum, M.; Ludvigson, G. Carbonate Stable Isotope Data Suggest Freshwater Environment for the McMurray Formation (Aptian), Alberta, Canada. Geosciences 2024, 14, 120. https://doi.org/10.3390/geosciences14050120
Hasiuk F, Wahbi A, González L, Blum M, Ludvigson G. Carbonate Stable Isotope Data Suggest Freshwater Environment for the McMurray Formation (Aptian), Alberta, Canada. Geosciences. 2024; 14(5):120. https://doi.org/10.3390/geosciences14050120
Chicago/Turabian StyleHasiuk, Franek, Abdullah Wahbi, Luis González, Mike Blum, and Greg Ludvigson. 2024. "Carbonate Stable Isotope Data Suggest Freshwater Environment for the McMurray Formation (Aptian), Alberta, Canada" Geosciences 14, no. 5: 120. https://doi.org/10.3390/geosciences14050120
APA StyleHasiuk, F., Wahbi, A., González, L., Blum, M., & Ludvigson, G. (2024). Carbonate Stable Isotope Data Suggest Freshwater Environment for the McMurray Formation (Aptian), Alberta, Canada. Geosciences, 14(5), 120. https://doi.org/10.3390/geosciences14050120