
Rainfall Infiltration through Stratified Colluvial Deposits: Analytical Approach vs. Numerical Modelling


Abstract
1. Introduction
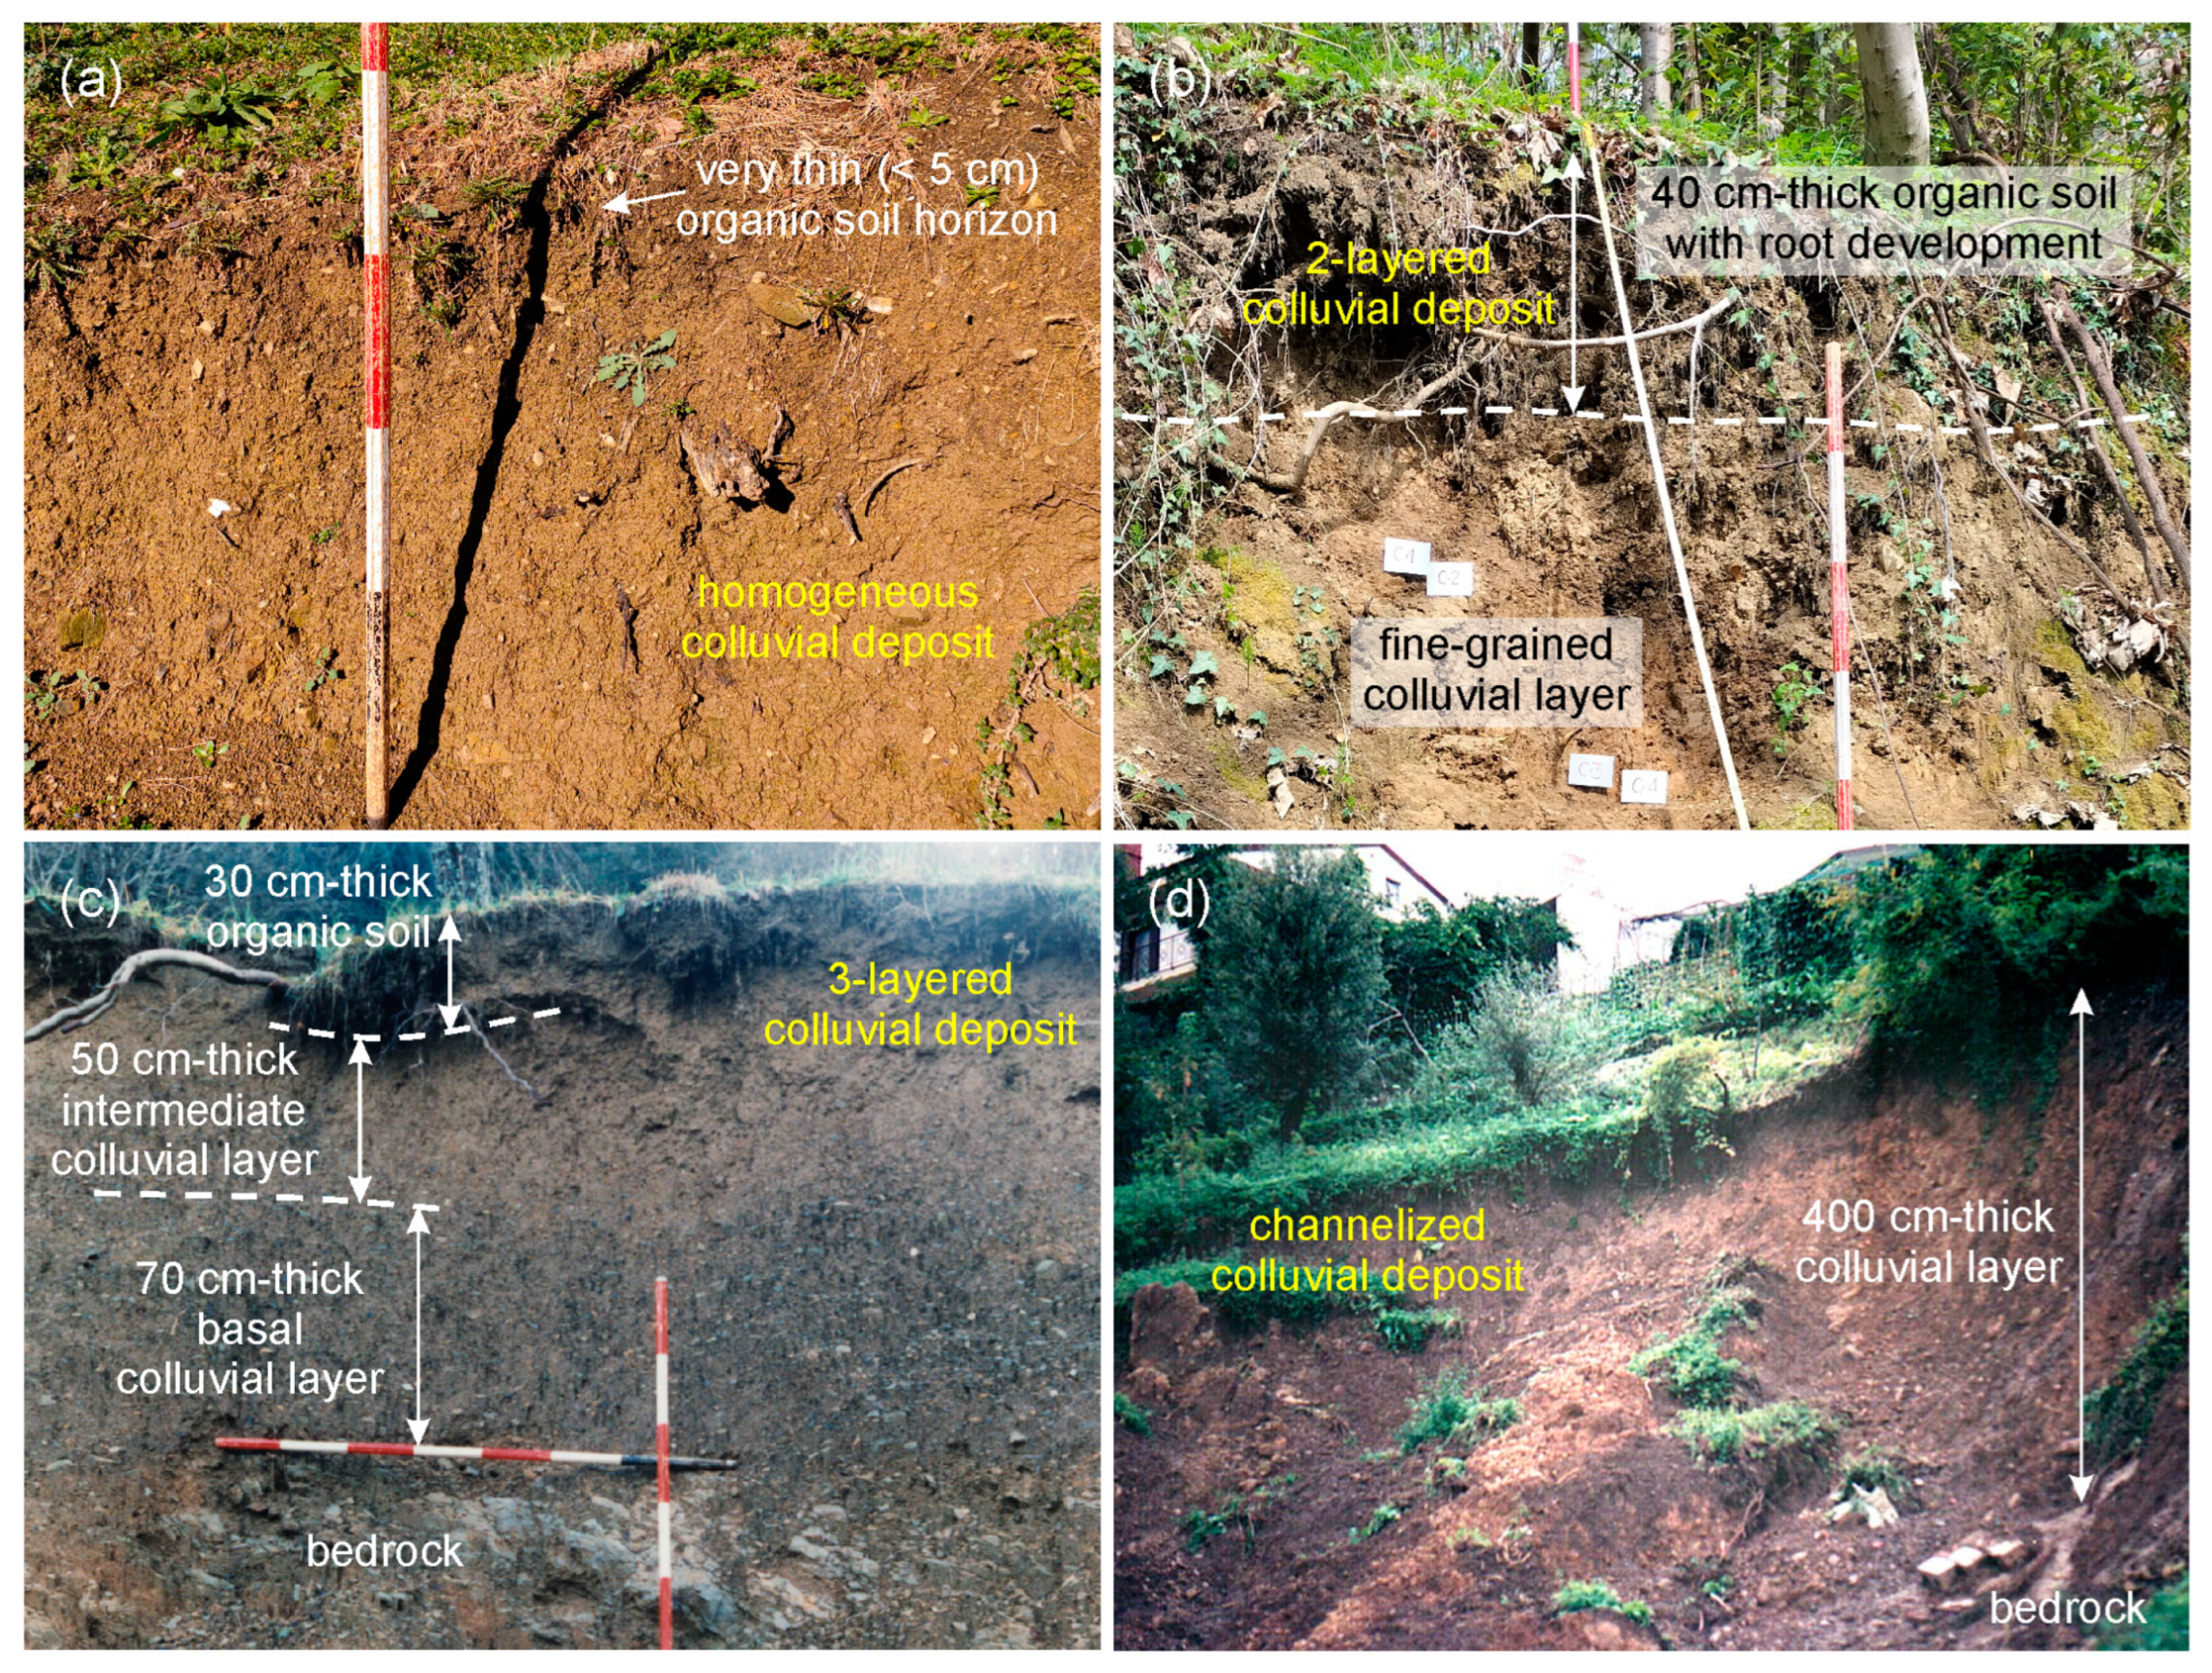
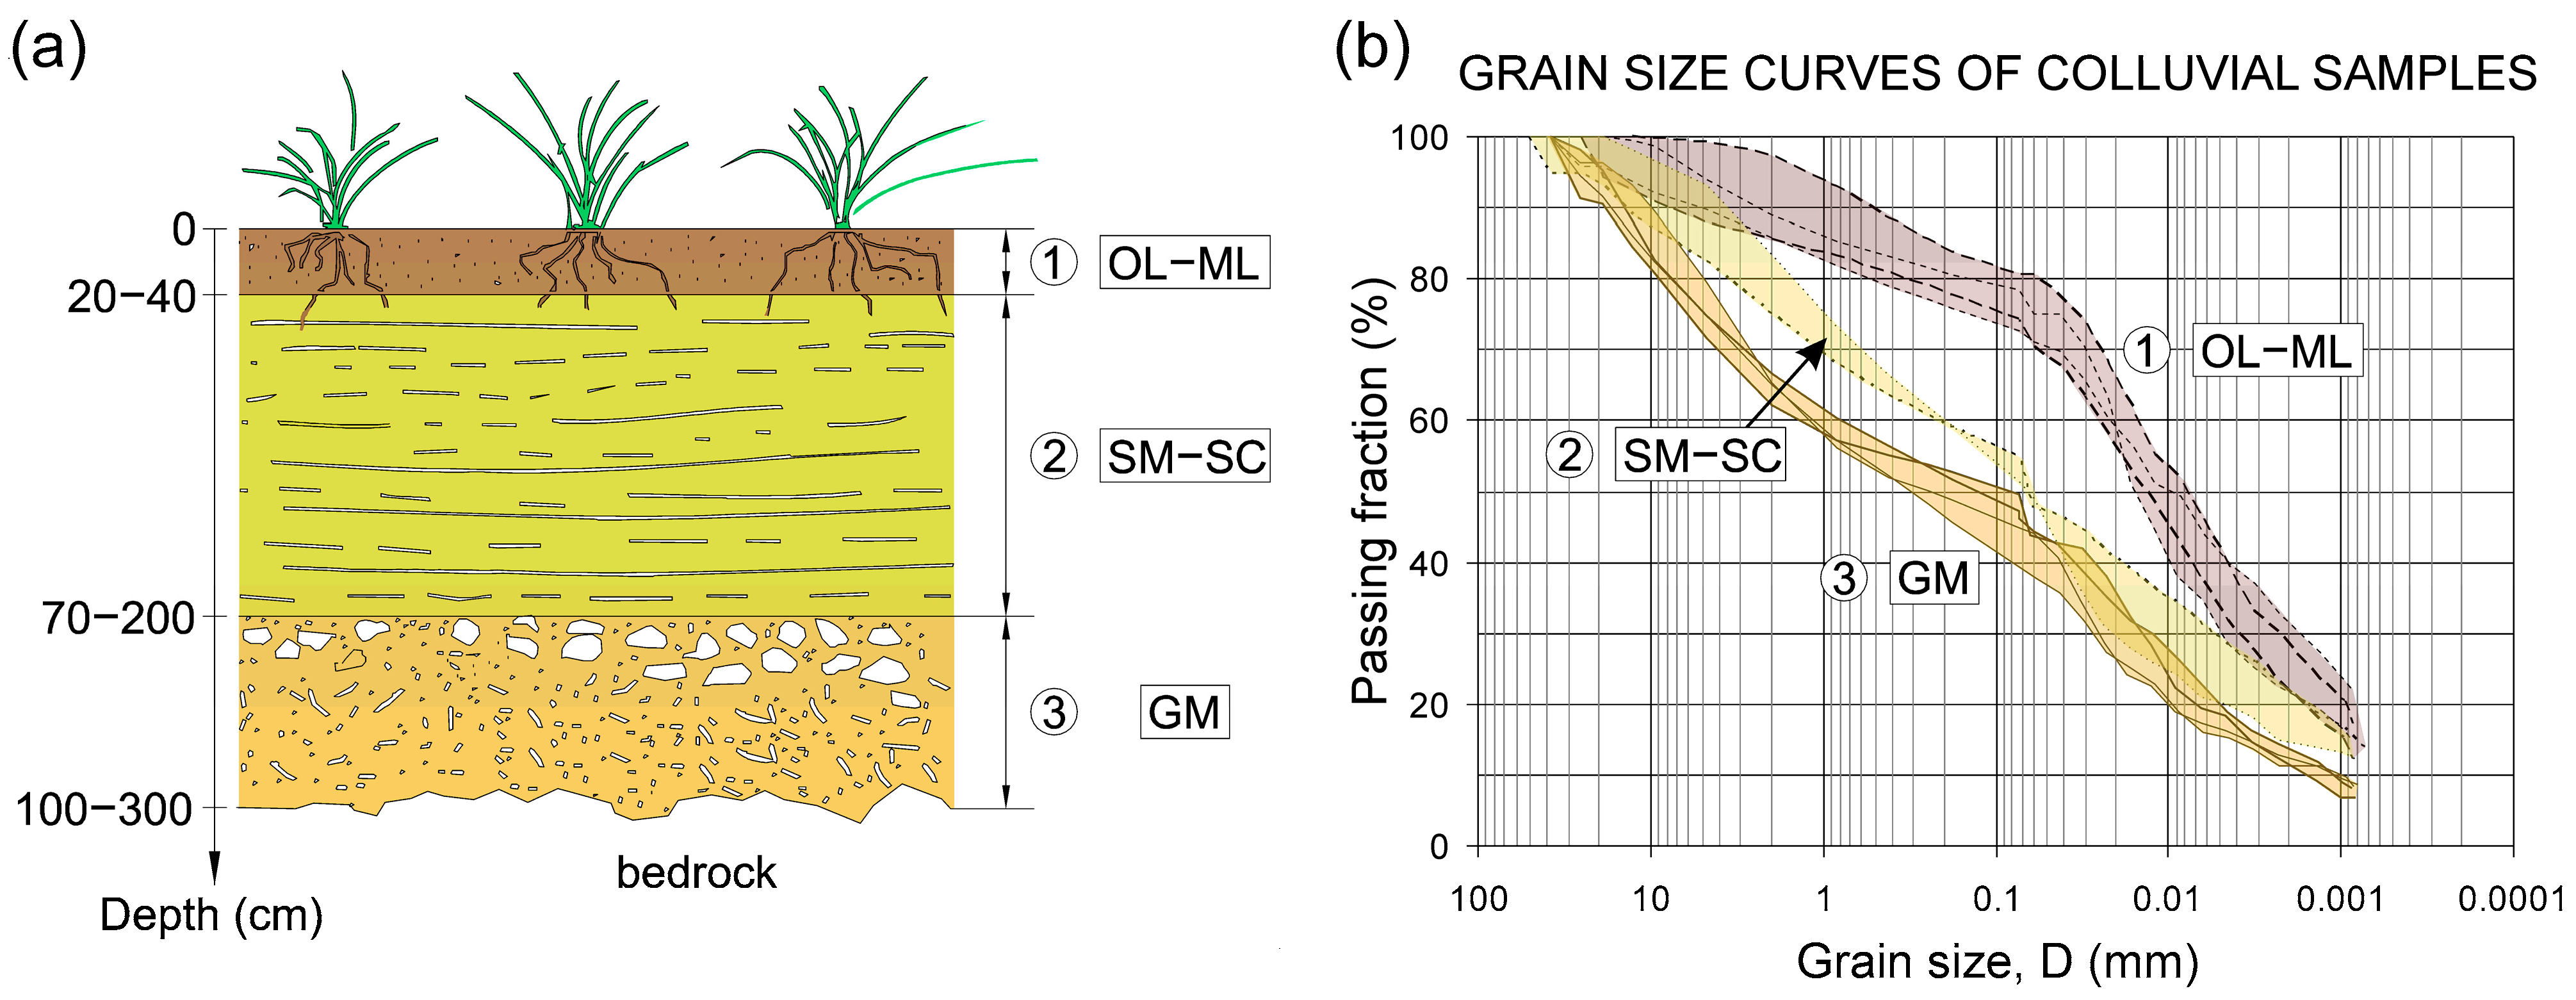
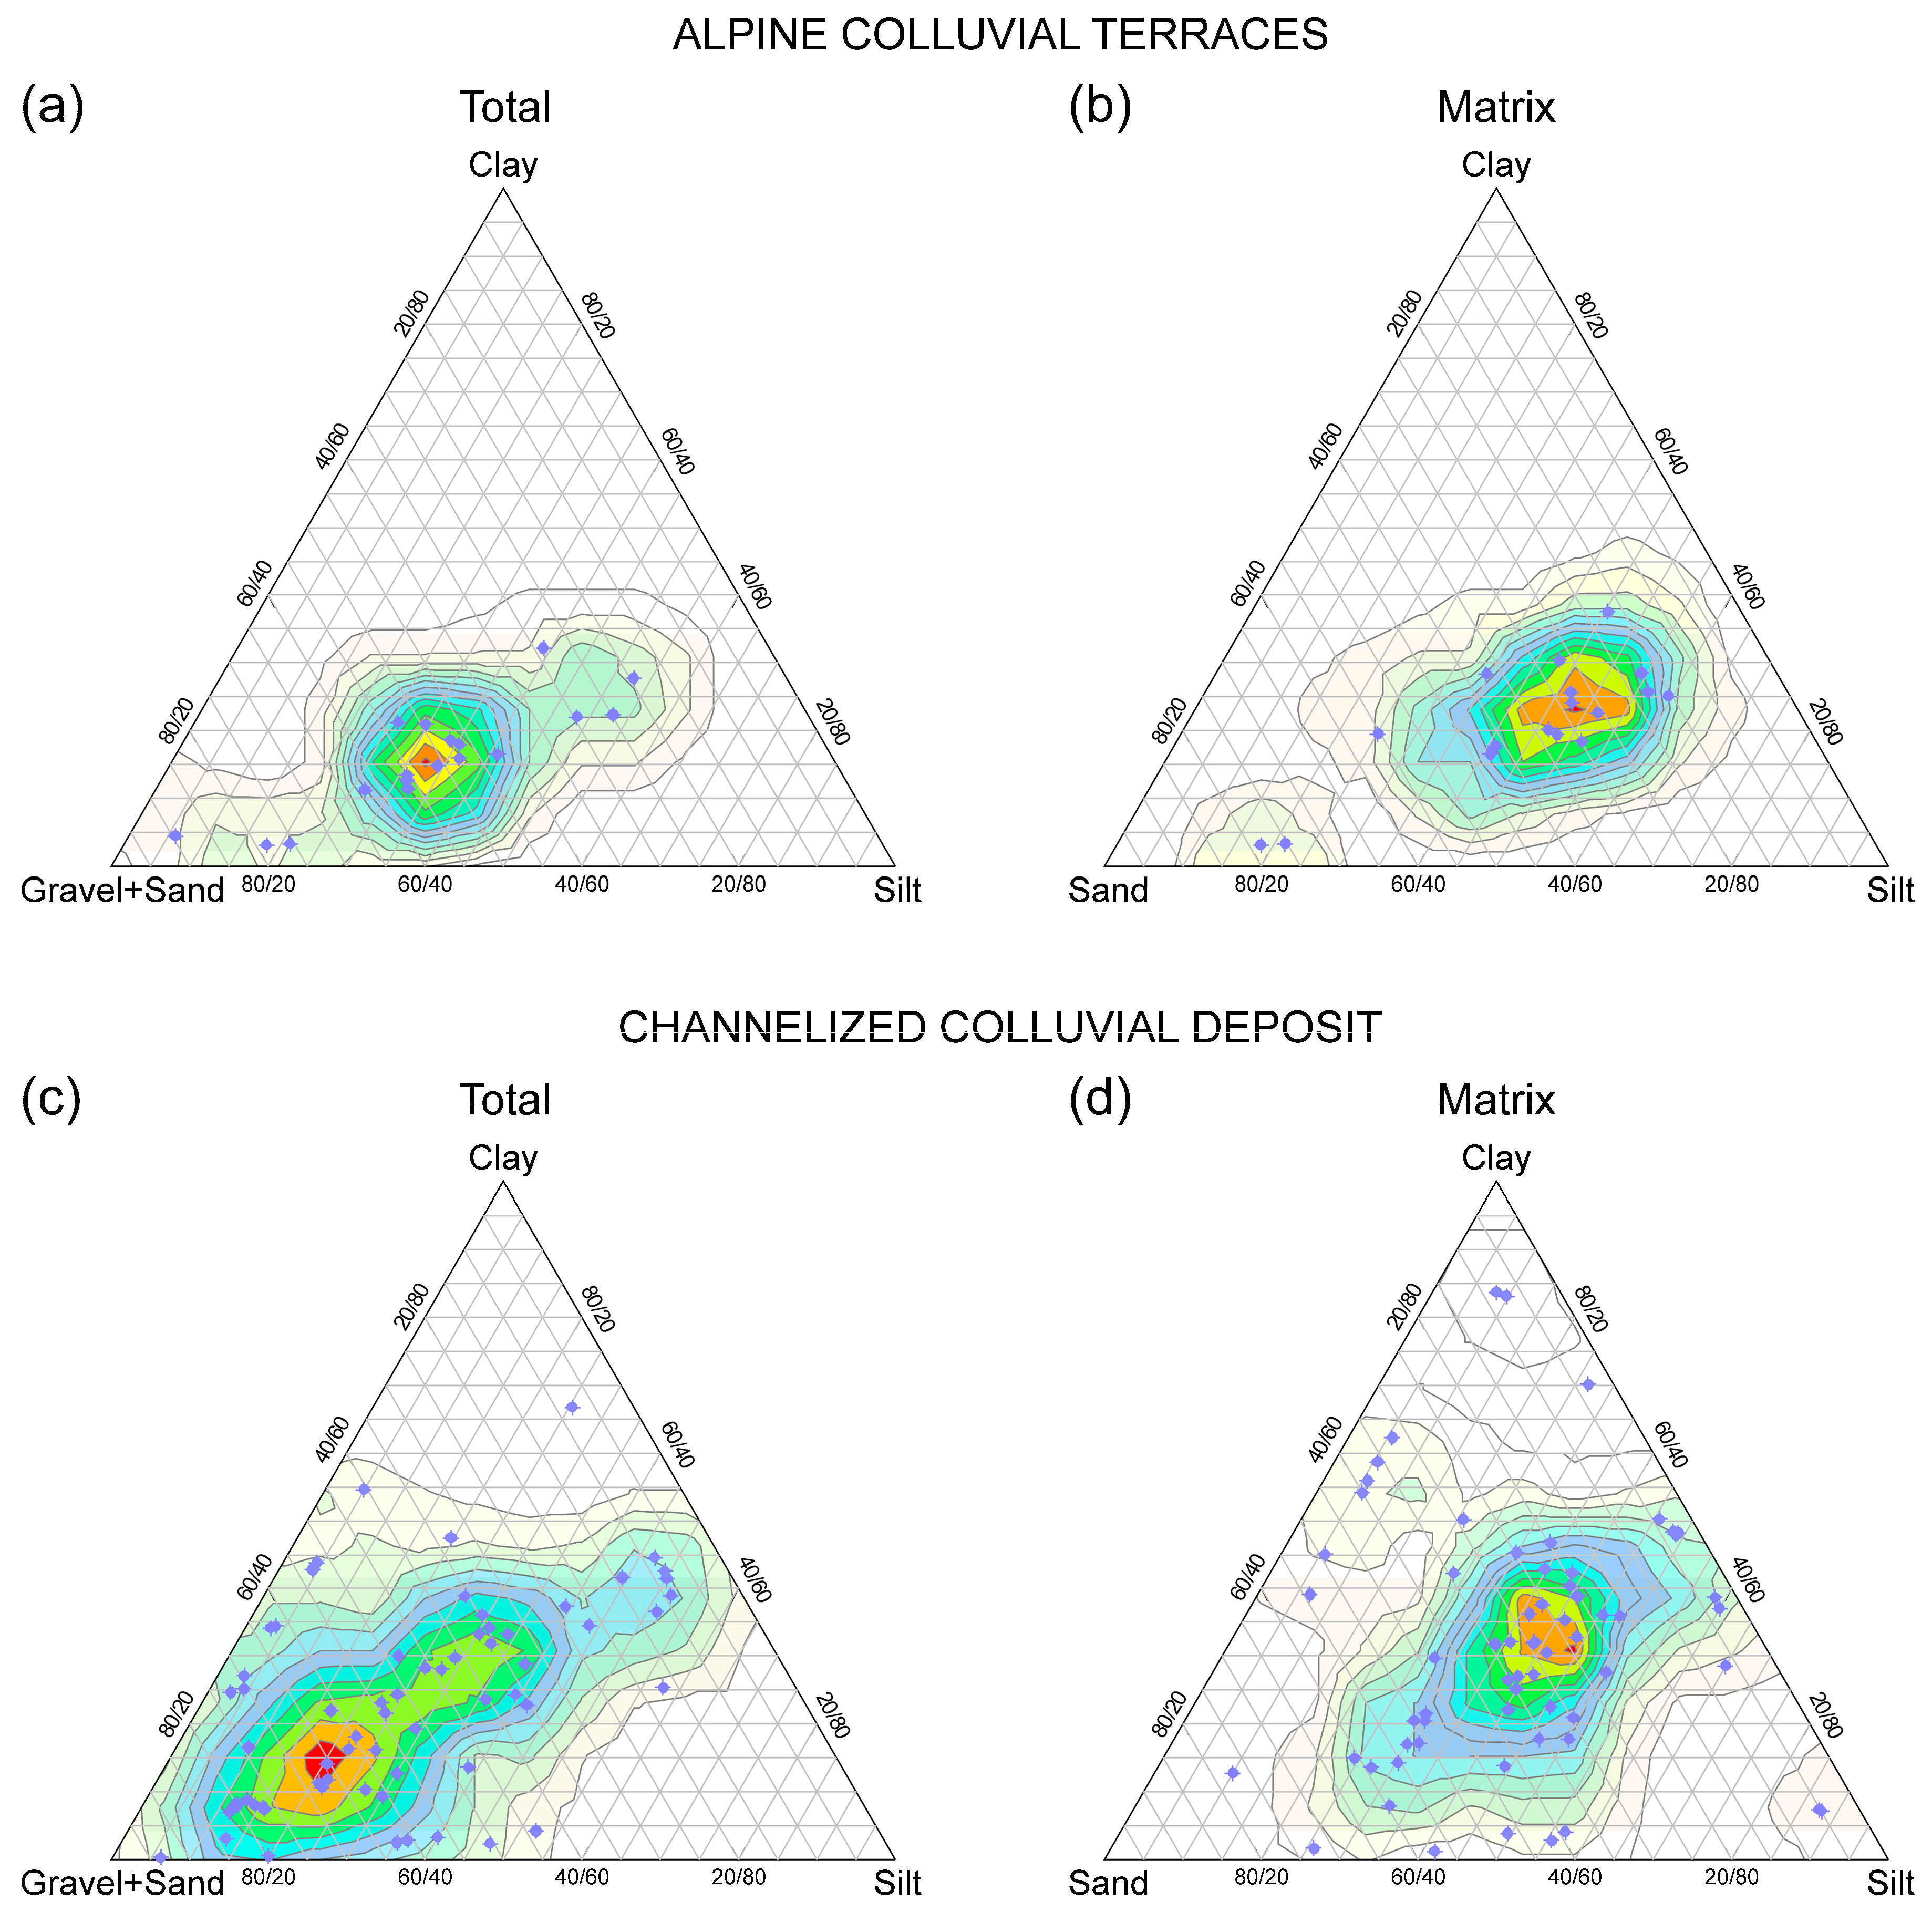
2. Colluvial Deposits
- A top 20–40 cm thick organic soil with roots and macro-voids;
- An intermediate 50–150 cm thick colluvial layer;
- A basal 30–150 cm thick colluvial layer mixed with abundant angular rock fragments derived from the local bedrock.
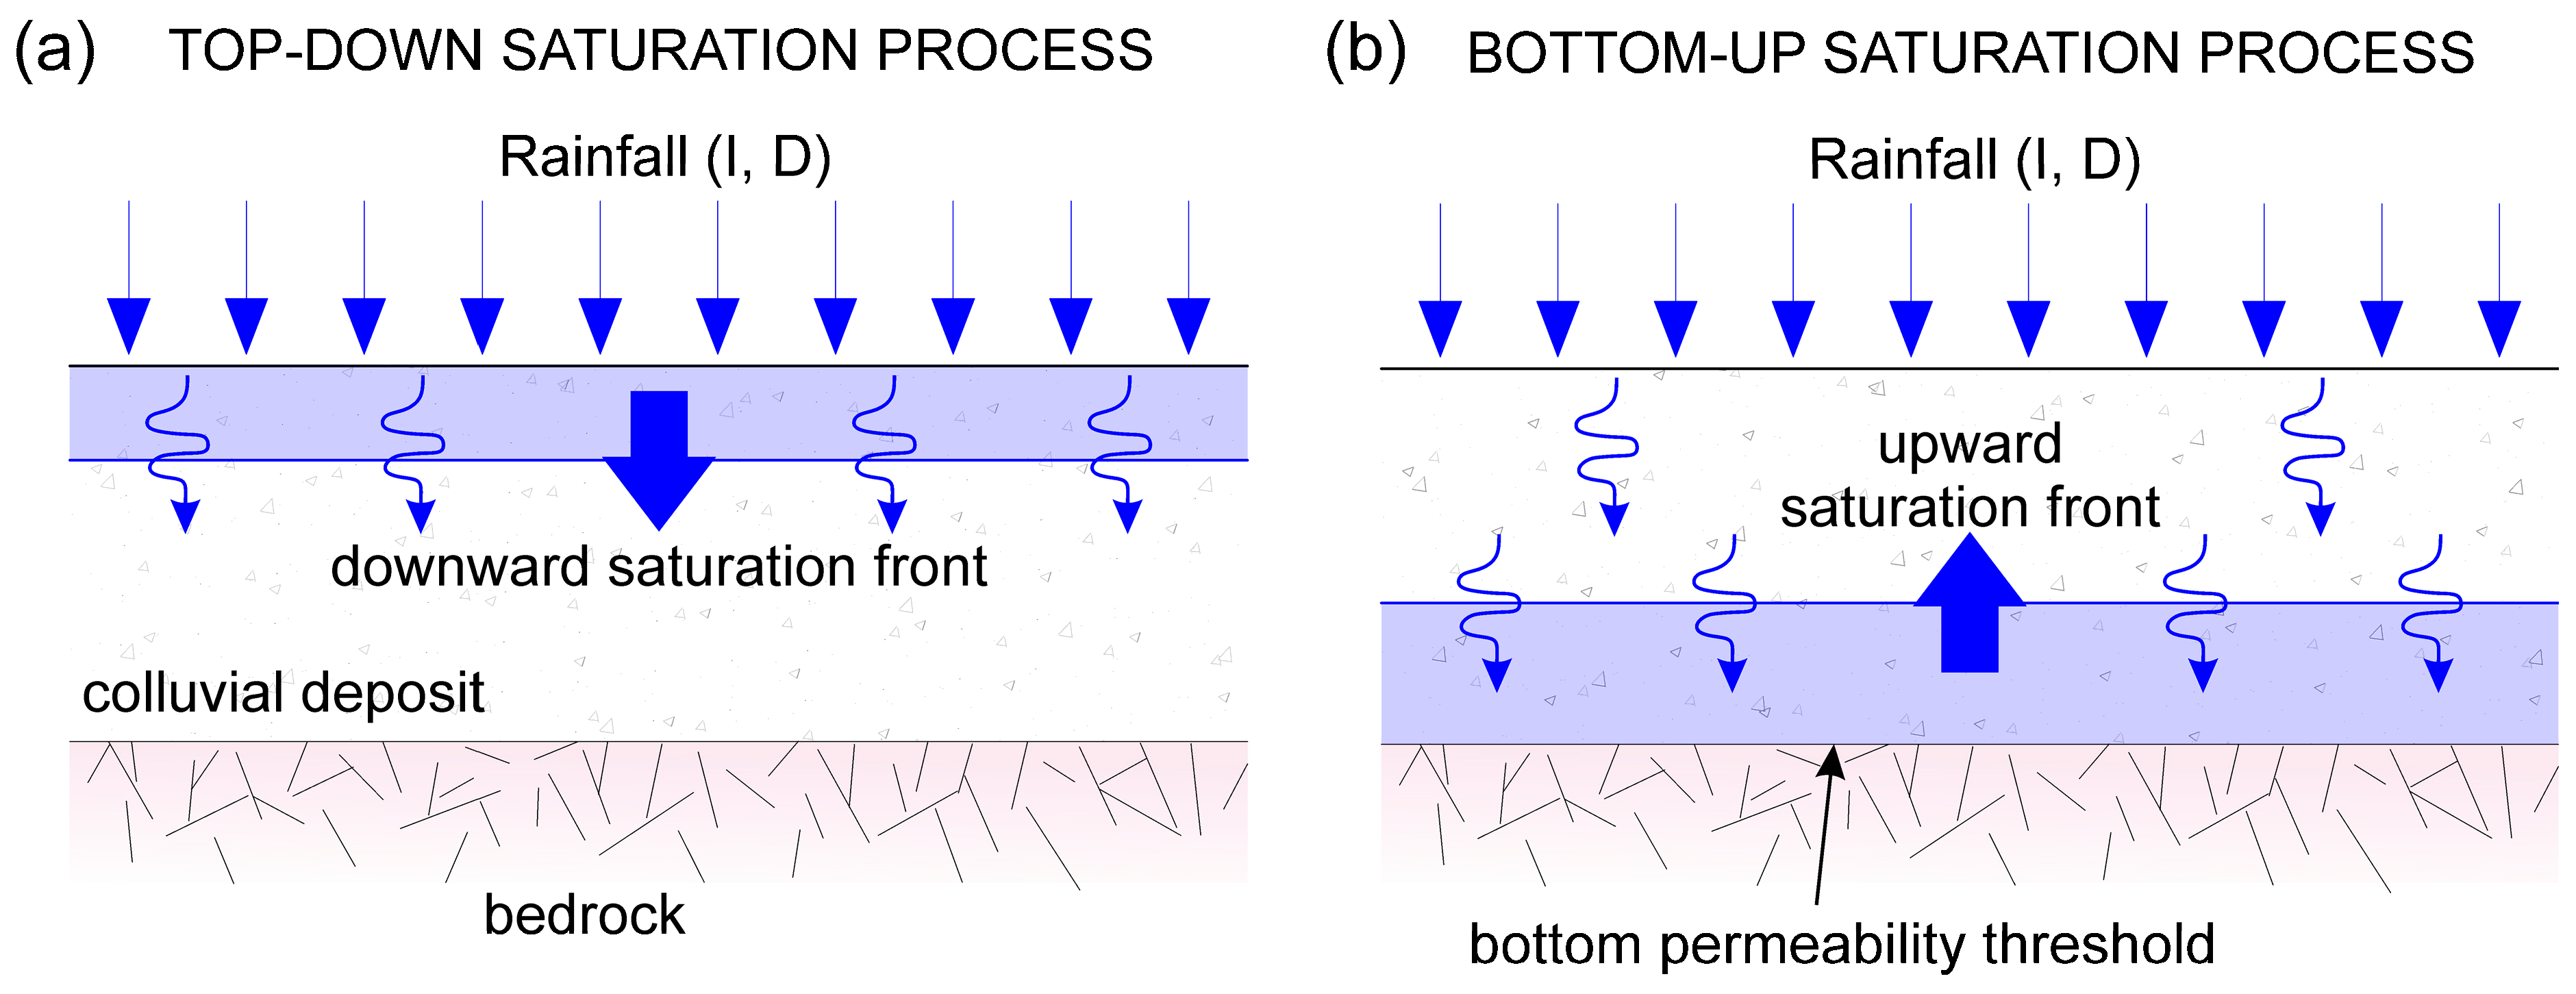
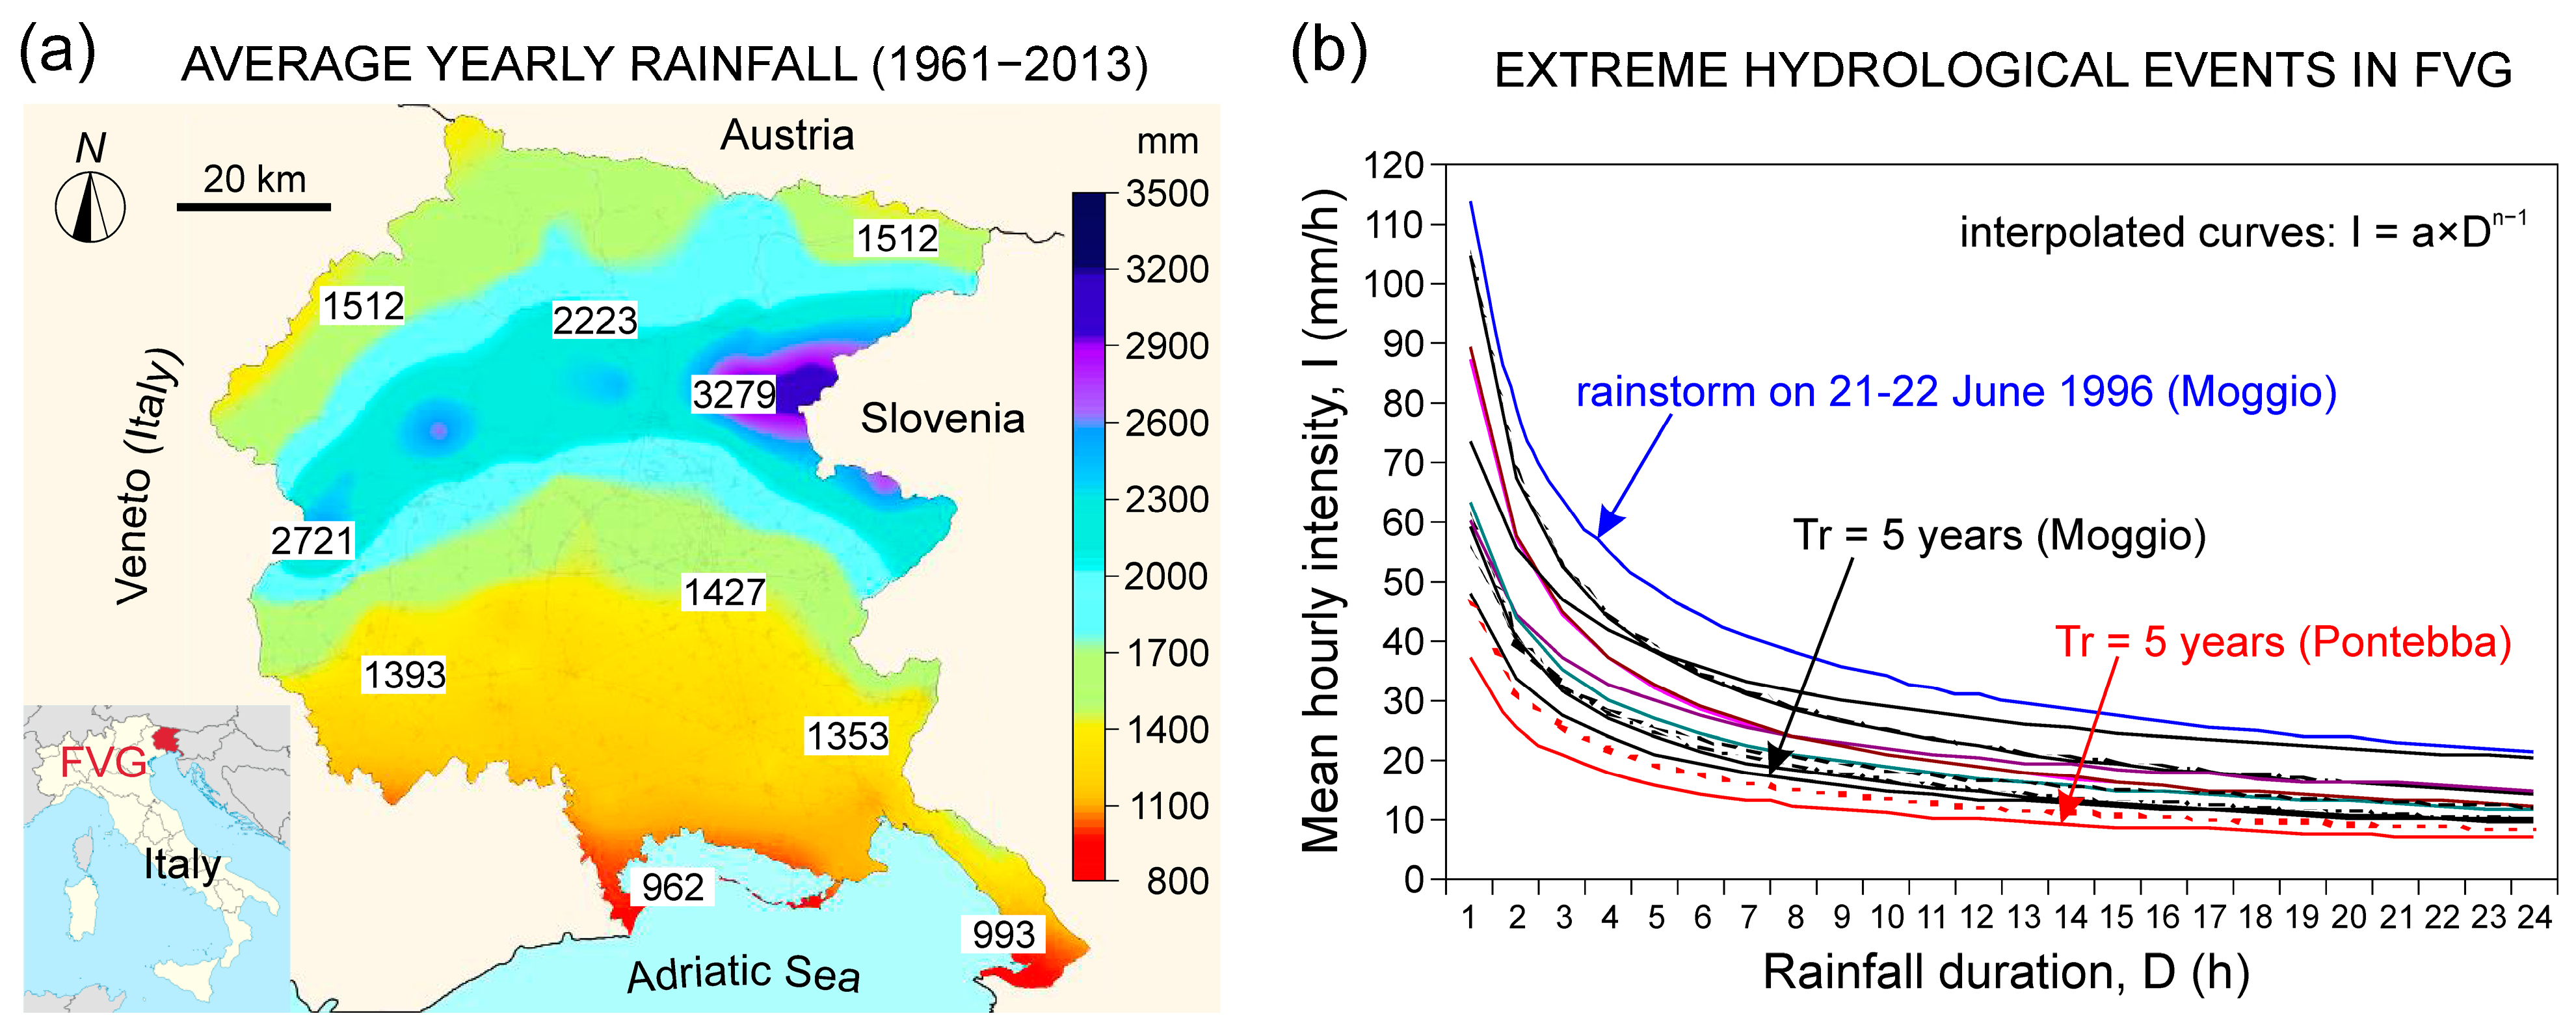
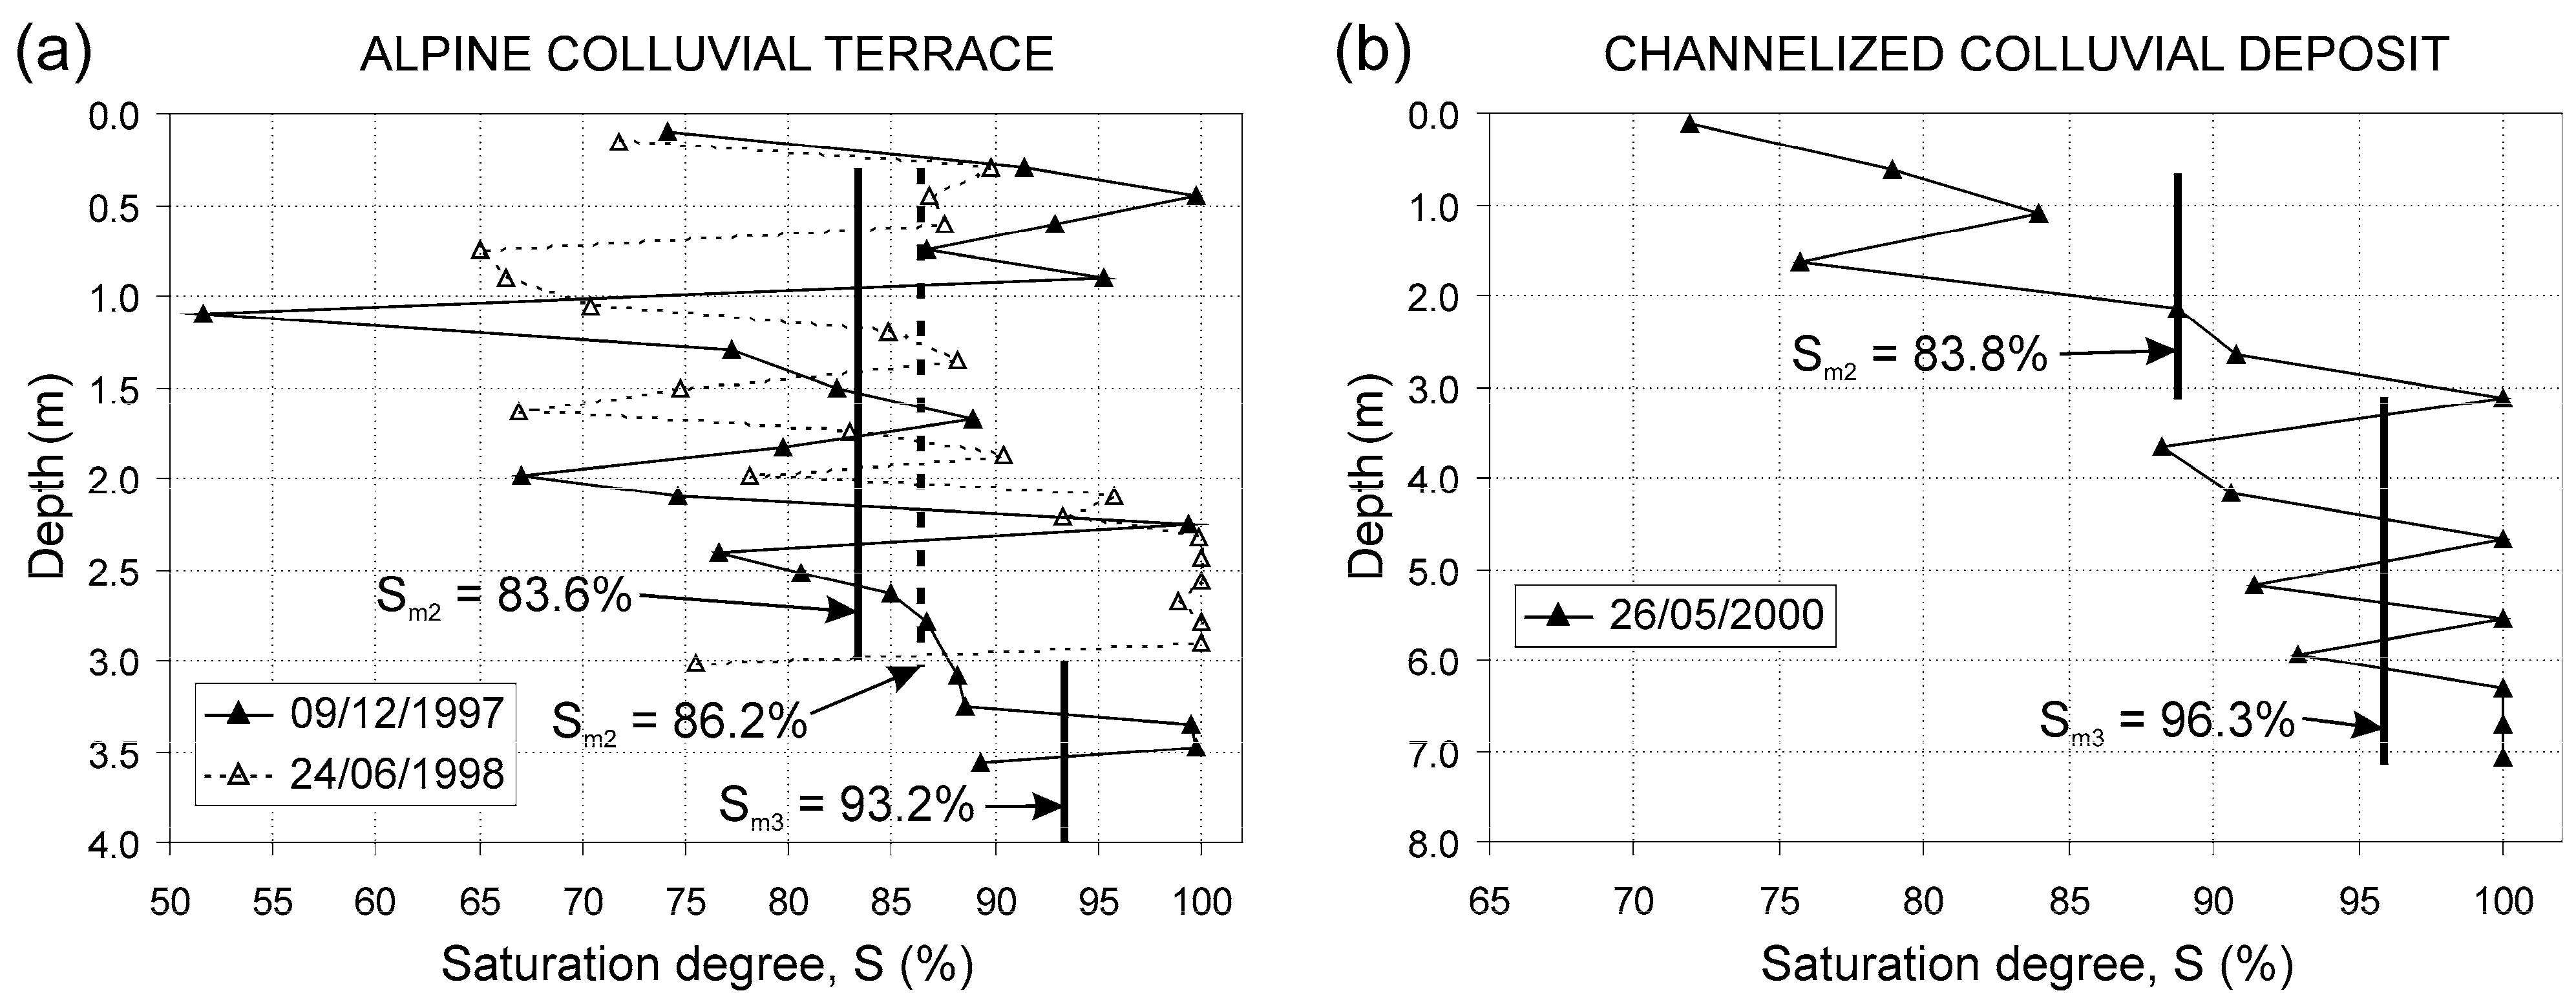
3. Rainfall Characteristics and Soil Saturation
4. Analytical Infiltration Models
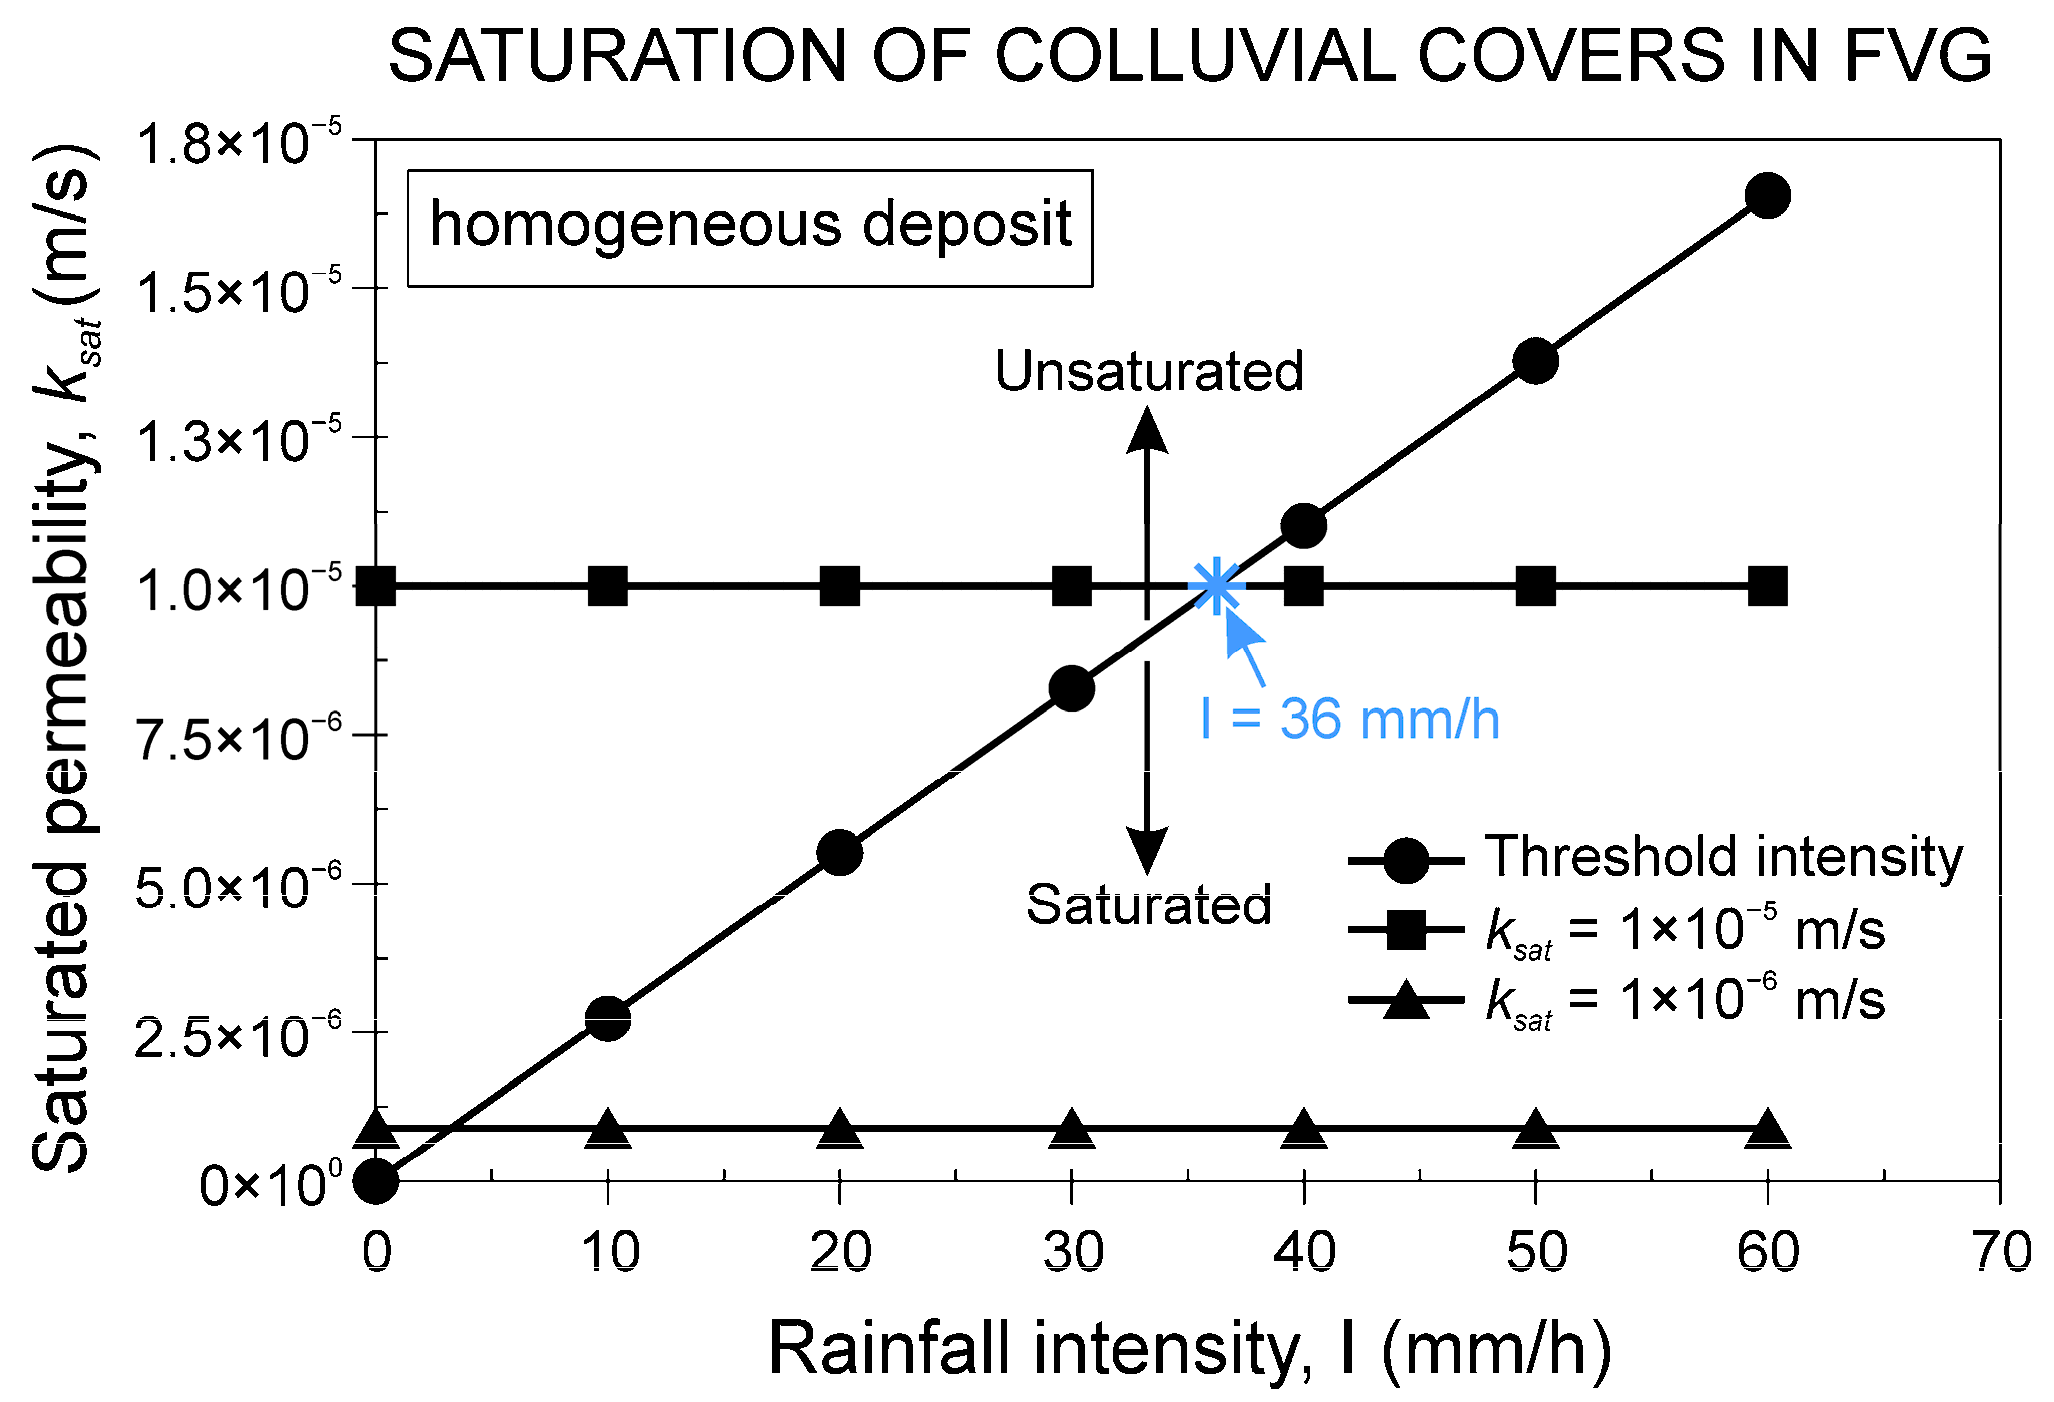
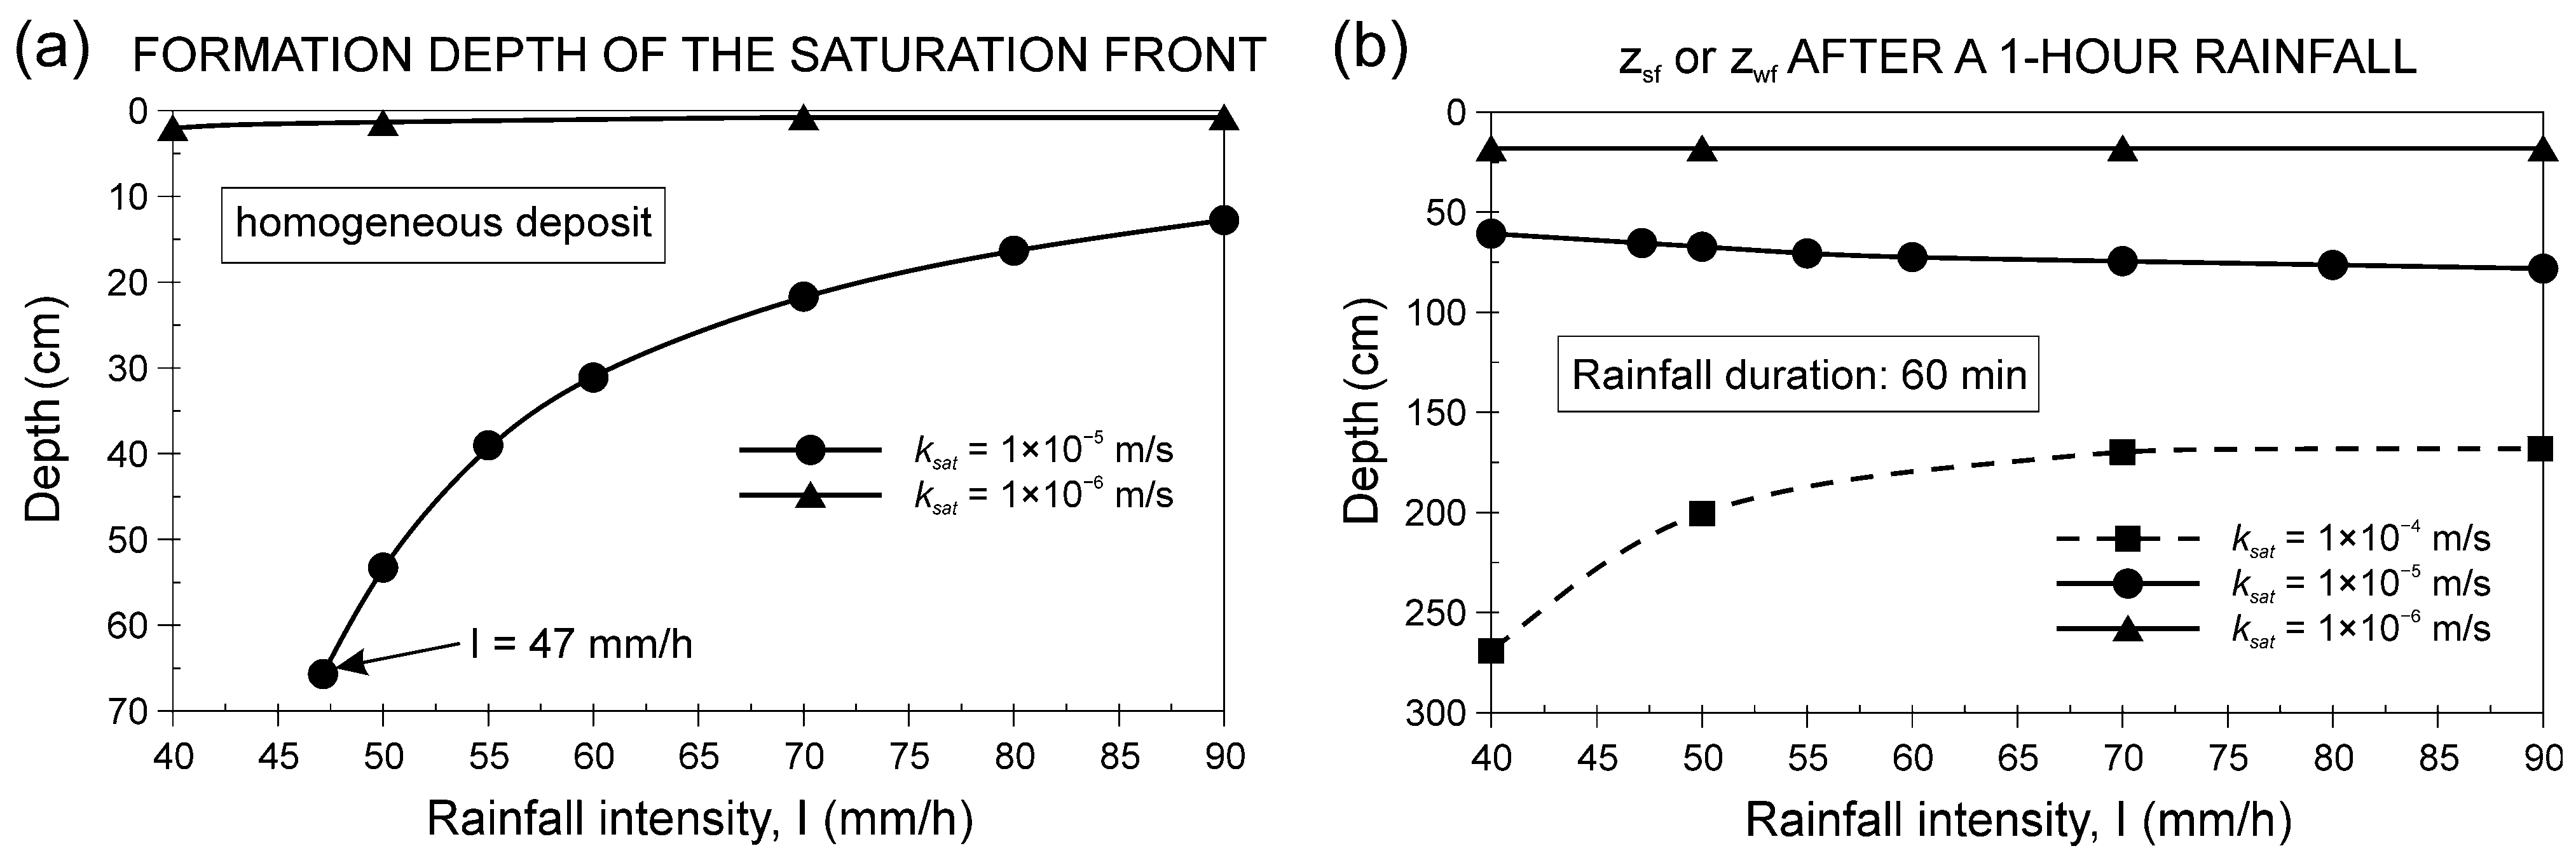
4.1. Homogeneous Cover
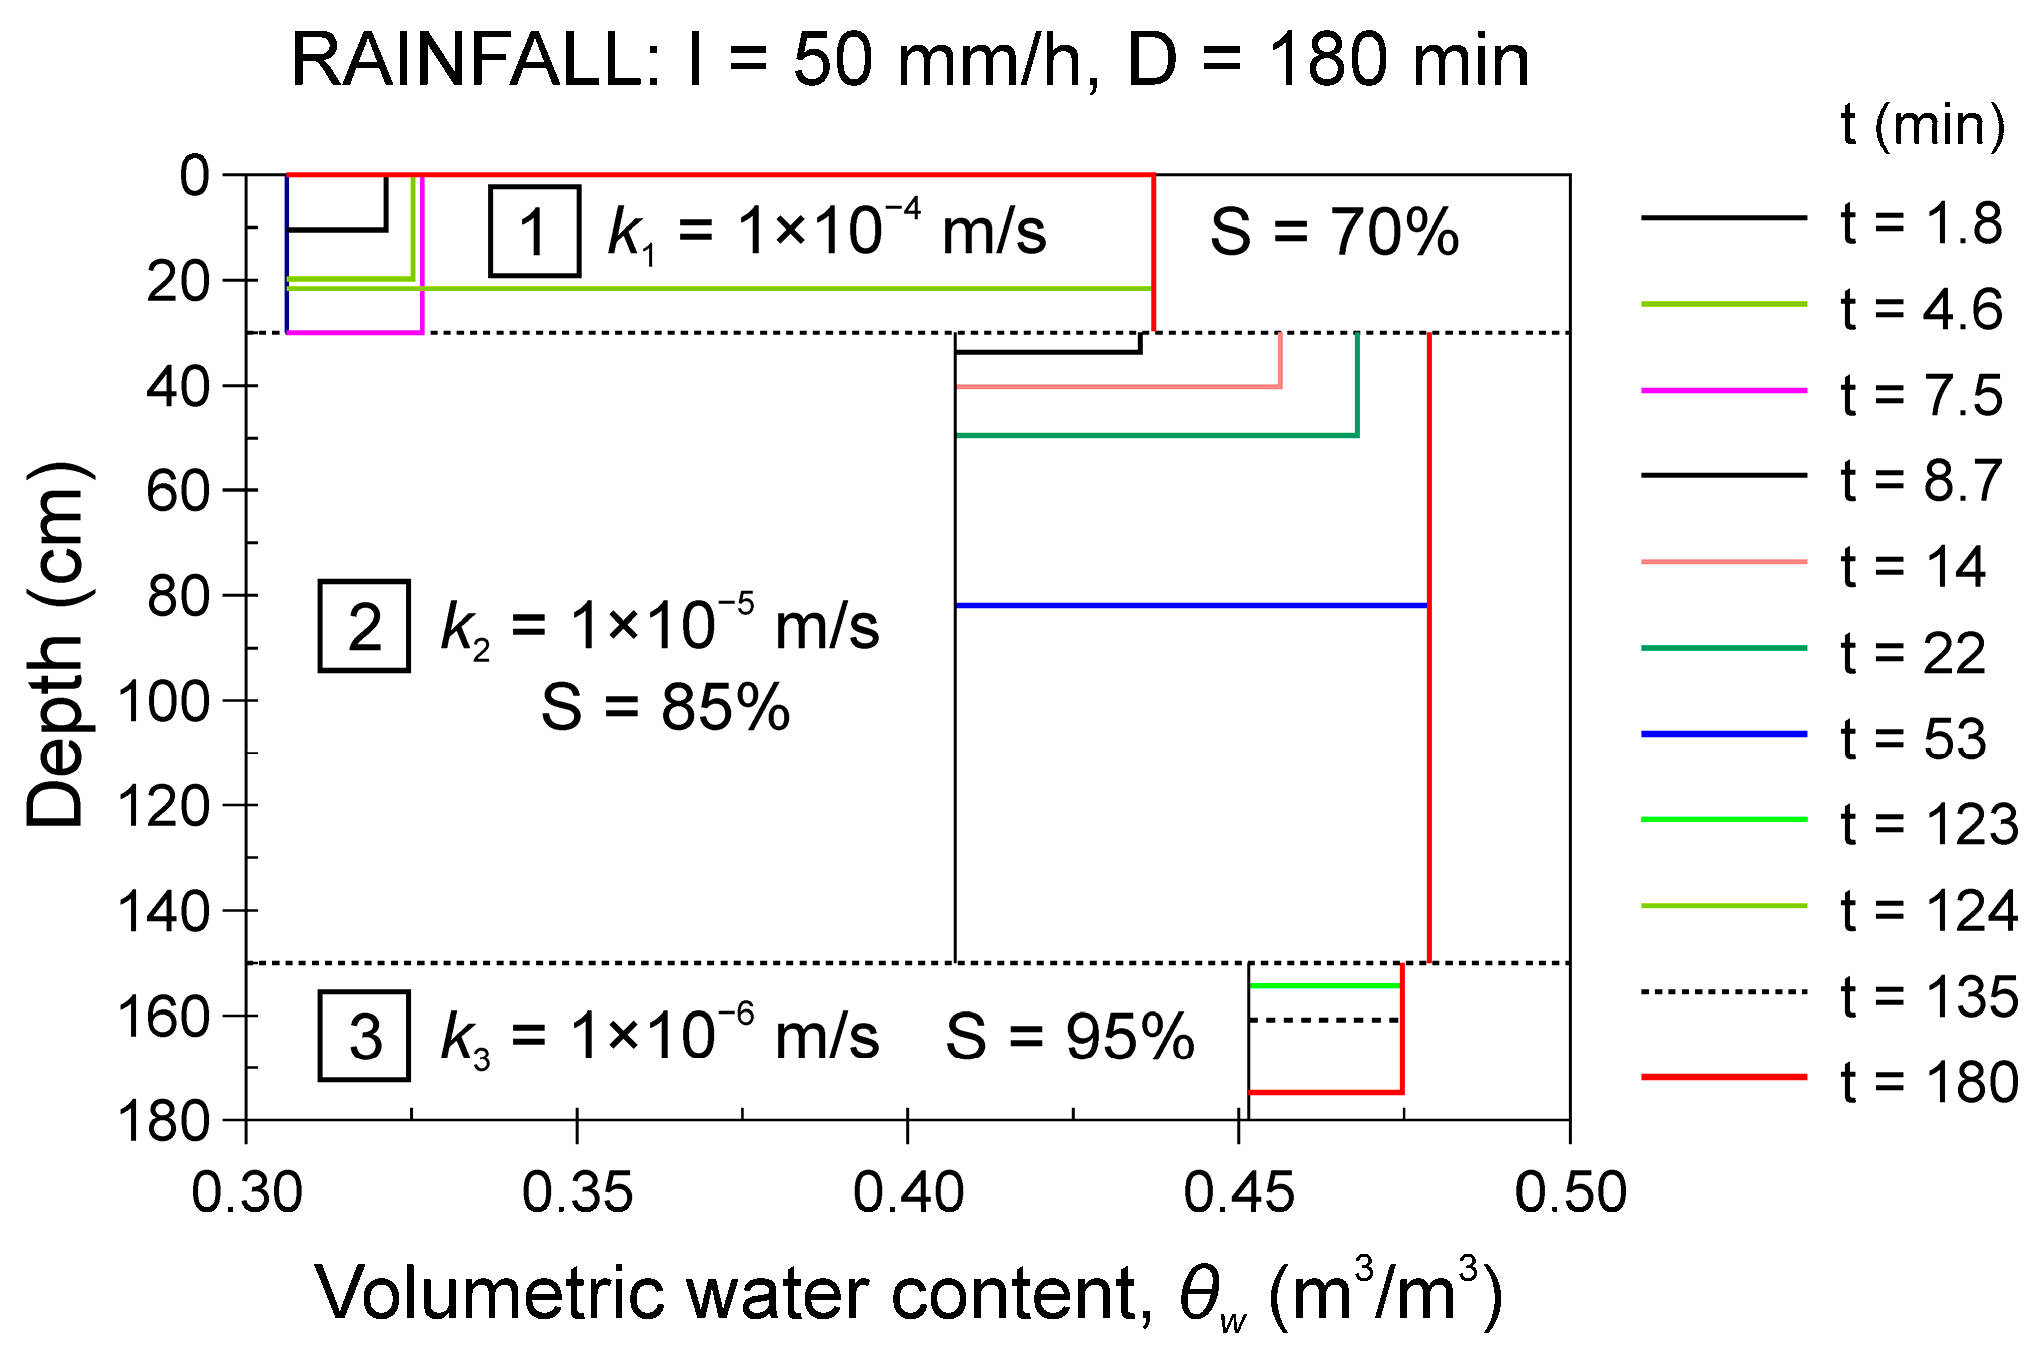
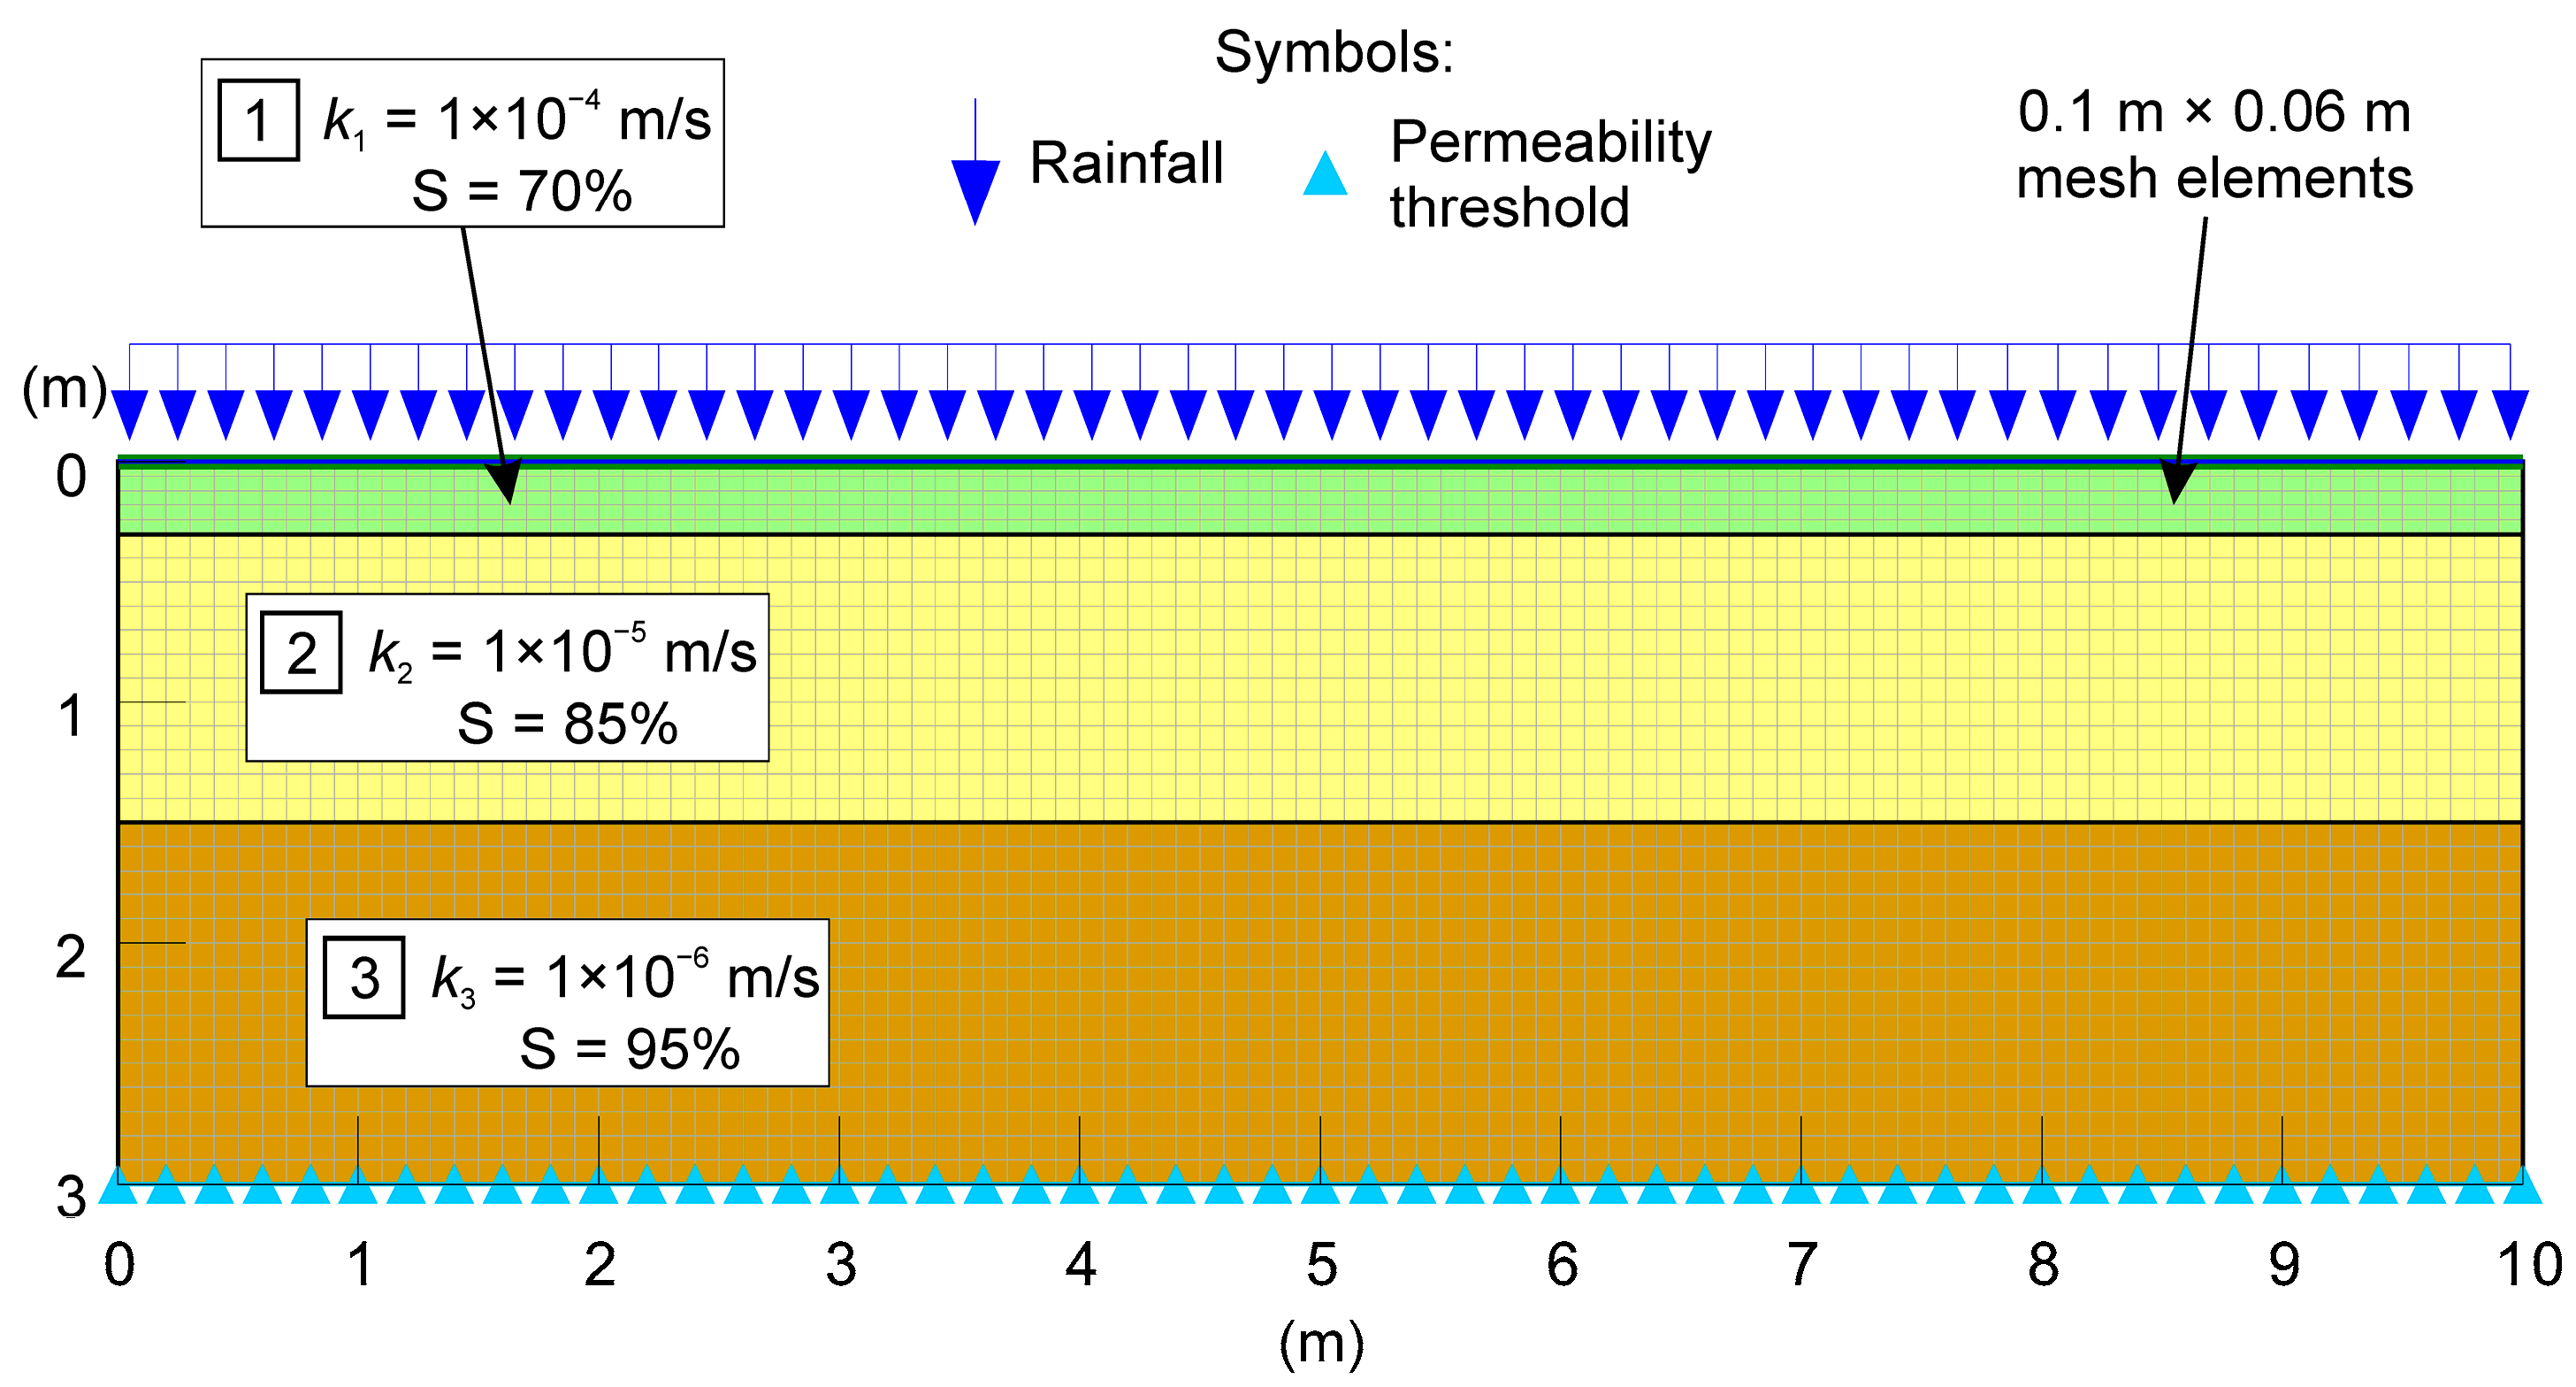
4.2. Stratified Deposit
- A top 30 cm thick organic soil layer;
- A 120 cm thick intermediate colluvial layer;
- A 150 cm thick basal colluvial layer.
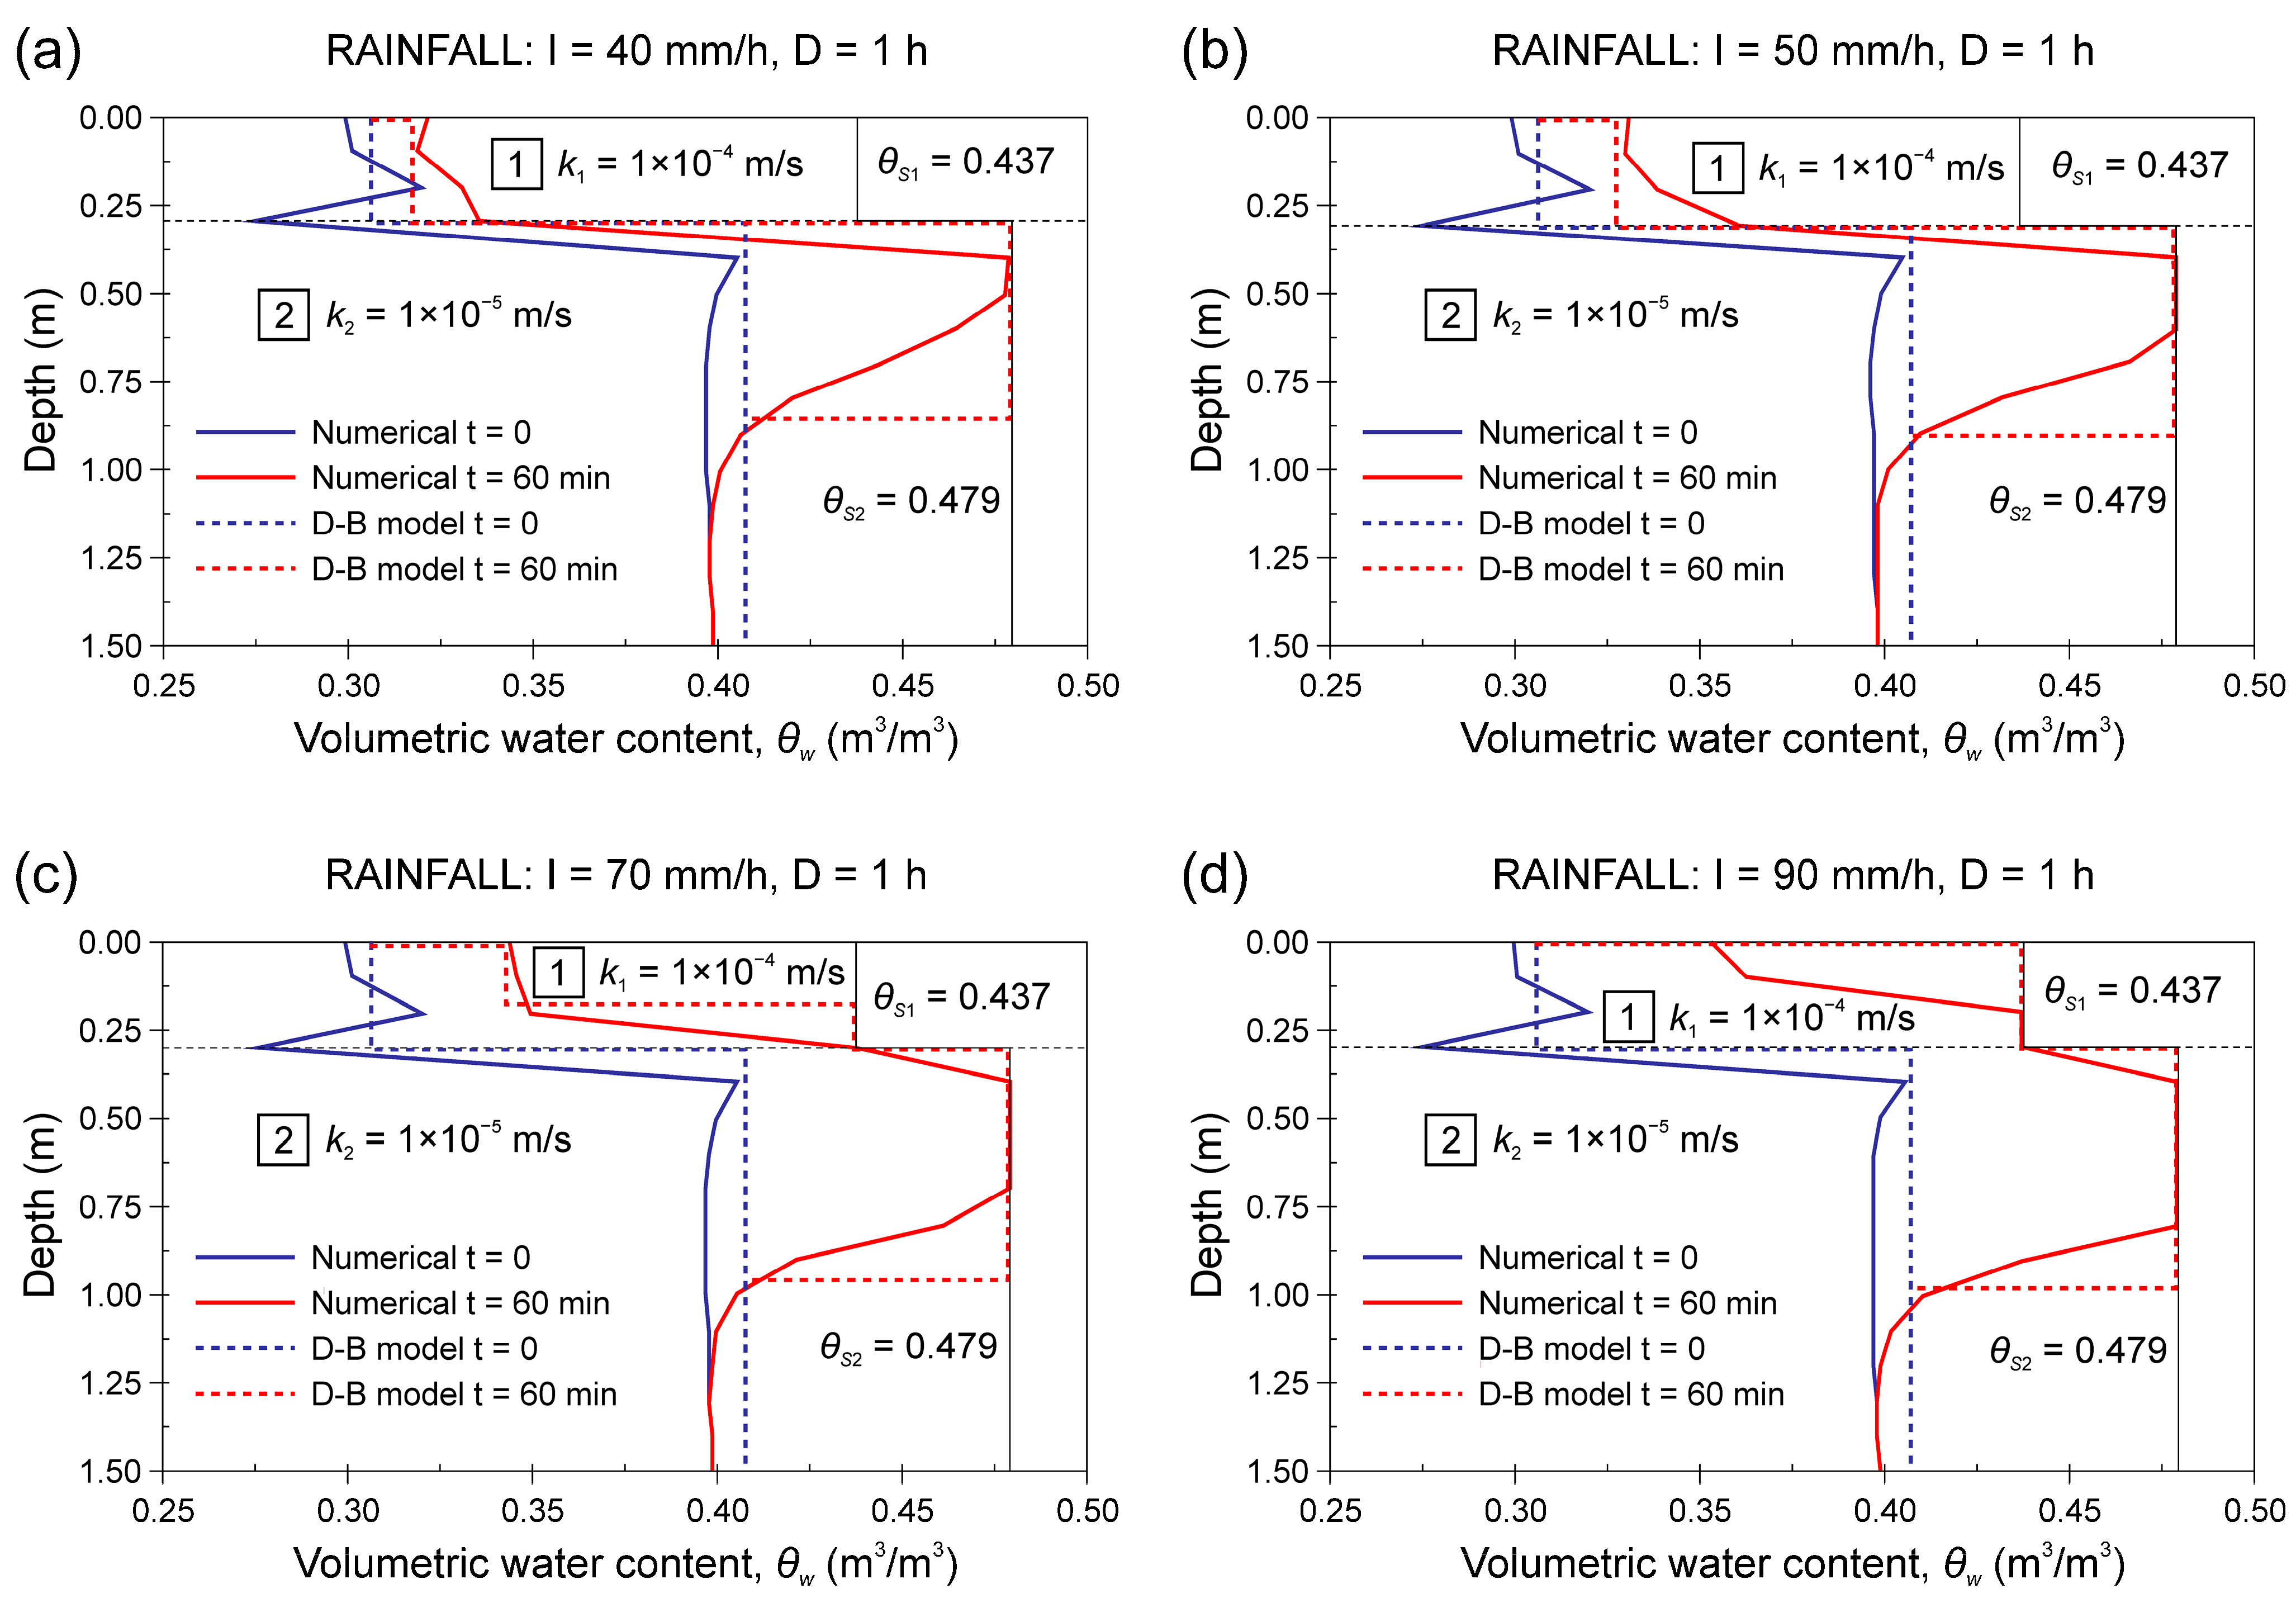
5. Numerical Simulations
6. Conclusions
- The inability to simulate the formation of a wetting front, which results in its inapplicability in the case of precipitation with intensity lower than the saturated permeability of the soil (I < ksat);
- The inability to simulate the infiltration process within a stratified deposit is characterised by soil layers with different hydraulic conductivity.
Author Contributions
Funding
Data Availability Statement
Conflicts of Interest
References
- Turner, A.K. Colluvium and talus. In Landslides: Investigation and Mitigation; Transportation Research Board Special Report 247; Turner, A.K., Schuster, R.L., Eds.; National Research Council: Washington, DC, USA, 1996; pp. 525–554. [Google Scholar]
- Goudie, A. Colluvium. In Encyclopedia of Geomorphology; International Association of Geomorphologists; Routledge: New York, NY, USA, 2004; 568p. [Google Scholar]
- Parry, S. The application of geomorphological mapping in the assessment of landslide hazard in Hong Kong. In Developments in Earth Surface Processes—Geomorphological Mapping, Mehods and Applications; Smith, M.J., Paron, P., Griffiths, J.S., Eds.; Elsevier: Amsterdam, The Netherlands, 2011; pp. 413–441. [Google Scholar]
- Borradaile, G. Geological maps and some basic terminology. In Understanding Geology through Maps; Borradaile, G., Ed.; Elsevier: Amsterdam, The Netherlands, 2014; pp. 1–14. [Google Scholar]
- Surian, N.; Pellegrini, G.B. Paraglacial sedimentation in the Piave Valley (Eastern Alps, Italy): An example of fluvial processes conditioned by glaciation. Geogr. Fis. Dinam. Quat. 2000, 23, 87–92. [Google Scholar]
- Colucci, R.R.; Monegato, G.; Žebre, M. Glacial and proglacial deposits of the Resia Valley (NE Italy): New insights on the onset and decay of the Last Alpine Glacial Maximum in the Julian Alps. Alp. Mediterr. Quat. 2014, 27, 85–104. [Google Scholar]
- Millar, S.W.S. Colluvial deposit. In Encyclopedia of Planetary Landforms; Springer: New York, NY, USA, 2014. [Google Scholar] [CrossRef]
- Cremaschi, M.; Trombino, L.; Zerboni, A. Palaeosoils and relict soils: A systematic review. In Interpretation of Micromorphological Features of Soils and Regoliths; Stoops, G., Marcelino, V., Mees, F., Eds.; Elsevier: Amsterdam, The Netherlands, 2018; pp. 863–894. [Google Scholar]
- Mücher, H.; van Steijn, H.; Kwaad, F. Colluvial and mass wasting deposits. In Interpretation of Micromorphological Features of Soils and Regoliths; Stoops, G., Marcelino, V., Mees, F., Eds.; Elsevier: Amsterdam, The Netherlands, 2018; pp. 21–36. [Google Scholar]
- Assouline, S. Infiltration into soils: Conceptual approaches and solutions. Water Resour. Res. 2013, 49, 1755–1772. [Google Scholar] [CrossRef]
- Brutsaert, W. Hydrology: An introduction, 2nd ed.; Cambridge University Press: Cambridge, UK, 2023; 609p. [Google Scholar] [CrossRef]
- Johnson, K.A.; Sitar, N. Hydrologic conditions leading to debris flow initiation. Can. Geotech. J. 1990, 27, 789–801. [Google Scholar] [CrossRef]
- Cai, F.; Ugai, K. Numerical analysis of rainfall effects on slope stability. Int. J. Geomech. 2004, 4, 69–78. [Google Scholar] [CrossRef]
- Rahardjo, H.; Ong, T.H.; Rezaur, R.B.; Leong, E.C.; Fredlund, D.G. Response parameters for characterization of infiltration. Environ. Earth Sci. 2010, 60, 1369–1380. [Google Scholar] [CrossRef]
- Bittelli, M.; Valentino, R.; Salvatorelli, F.; Rossi Pisa, P. Monitoring soil-water and displacement conditions leading to landslide occurrence in partially saturated clays. Geomorphology 2012, 173–174, 161–173. [Google Scholar] [CrossRef]
- Nilsen, T.H.; Wright, R.H.; Vlasic, T.C.; Spangle, W.E. Relative Slope Stability and Land-Use Planning in the San Francisco Bay Region, California; Geological Survey Professional Paper 944; US Government Printing Office: Washington, DC, USA, 1979; 105p.
- Fleming, R.W.; Johnson, A.M. Landslides in Colluvium; US Geological Survey Bulletin 2059-B; US Government Printing Office: Washington, DC, USA, 1994; 28p.
- Froude, M.J.; Petley, D.N. Global fatal landslide occurrence from 2004 to 2016. Nat. Hazards Earth Syst. Sci. 2018, 18, 2161–2181. [Google Scholar] [CrossRef]
- Siva Subramanian, S.; Ishikawa, T.; Tokoro, T. Stability assessment approach for soil slopes in seasonal cold regions. Eng. Geol. 2017, 221, 154–169. [Google Scholar] [CrossRef]
- Hinds, E.S.; Lu, N.; Mirus, B.B.; Godt, J.W.; Wayllace, A. Evaluation of techniques for mitigating snowmelt infiltration-induced landsliding in a highway embankment. Eng. Geol. 2021, 291, 106240. [Google Scholar] [CrossRef]
- Haque, U.; da Silva, P.F.; Devoli, G.; Pilz, G.; Zhao, B.; Khaloua, A.; Wilipo, W.; Andersen, P.; Lu, P.; Lee, J.; et al. The human cost of global warming: Deadly landslides and their triggers (1995–2014). Sci. Total Environ. 2019, 682, 673–684. [Google Scholar] [CrossRef]
- Li, P.; Li, T.; Vanapalli, S.K. Influence of environmental factors on the wetting front depth: A case study in the Loess Plateau. Eng. Geol. 2016, 214, 1–10. [Google Scholar] [CrossRef]
- Yang, K.-H.; Uzuoka, R.; Thuo, J.N.; Lin, G.-L.; Nakai, Y. Coupled hydro-mechanical analysis of two unstable unsaturated slopes subject to rainfall infiltration. Eng. Geol. 2017, 216, 13–30. [Google Scholar] [CrossRef]
- Zhang, J.; Zhu, D.; Zhang, S. Shallow slope instability evolution during rainwater infiltration considering soil cracking state. Comput. Geotech. 2020, 117, 103285. [Google Scholar] [CrossRef]
- Baum, R.L.; Godt, J.W.; Savage, W.Z. Estimating the timing and location of shallow rainfall-induced landslides using a model for transient, unsaturated infiltration. J. Geophys. Res. 2010, 115, F03013. [Google Scholar] [CrossRef]
- Bordoni, M.; Meisina, C.; Valentino, R.; Lu, N.; Bittelli, M.; Chersich, S. Hydrological factors affecting rainfall-induced shallow landslides: From the field monitoring to a simplified slope stability analysis. Eng. Geol. 2015, 193, 19–37. [Google Scholar] [CrossRef]
- Smith, R.E. Infiltration Theory for Hydrologic Applications; Water Resources Monograph, American Geophysical Union: Washington, DC, USA, 2002; 212p. [Google Scholar]
- Paronuzzi, P.; Bolla, A. Rainfall infiltration and slope stability of alpine colluvial terraces subject to storms (NE Italy). Eng. Geol. 2023, 323, 107199. [Google Scholar] [CrossRef]
- Richards, L.A. Capillary conduction of liquids through porous mediums. Physics 1931, 1, 318–333. [Google Scholar] [CrossRef]
- Tsaparas, I.; Rahardjo, H.; Toll, D.G.; Leong, E.C. Controlling parameters for rainfall-induced landslides. Comput. Geotech. 2002, 29, 1–27. [Google Scholar] [CrossRef]
- Yang, C.; Sheng, D.; Carter, J.P. Effect of hydraulic hysteresis on seepage analysis for unsaturated soils. Comput. Geotech. 2012, 41, 36–56. [Google Scholar] [CrossRef]
- Cuomo, S.; Della Sala, M. Rainfall-induced infiltration, runoff and failure in steep unsaturated shallow soil deposits. Eng. Geol. 2013, 162, 118–127. [Google Scholar] [CrossRef]
- Liang, W.-L.; Uchida, T. Effects of topography and soil depth on saturated-zone dynamics in steep hillslopes explored using the three-dimensional Richards’ equation. J. Hydrol. 2014, 510, 124–136. [Google Scholar] [CrossRef]
- Damiano, E.; Greco, R.; Guida, A.; Olivares, L.; Picarelli, L. Investigation on rainwater infiltration into layered shallow covers in pyroclastic soils and its effect on slope stability. Eng. Geol. 2017, 220, 208–218. [Google Scholar] [CrossRef]
- Peranić, J.; Mihalić Arbanas, S.; Arbanas, Ž. Importance of the unsaturated zone in landslide reactivation on flysch slopes: Observations from Valići Landslide, Croatia. Landslides 2021, 18, 3737–3751. [Google Scholar] [CrossRef]
- Sun, P.; Wang, H.; Wang, G.; Li, R.; Zhang, Z.; Huo, X. Field model experiments and numerical analysis of rainfall-induced shallow loess landslides. Eng. Geol. 2021, 295, 106411. [Google Scholar] [CrossRef]
- Li, X.; Handwerger, A.L.; Buscarnera, G. Viscoplastic modelling of rainfall-driven slow-moving landslides: Application to California Coast Ranges. Landslides 2023, 20, 1101–1113. [Google Scholar] [CrossRef]
- Morbidelli, R.; Corradini, C.; Saltalippi, C.; Flammini, A.; Dari, J.; Govindaraju, R.S. Rainfall infiltration modeling: A review. Water 2018, 10, 1873. [Google Scholar] [CrossRef]
- Green, W.H.; Ampt, G.A. Studies on soil physics: 1. The flow of air and water through soils. J. Agric. Sci. 1911, 4, 1–24. [Google Scholar]
- Dai, F.C.; Lee, C.F.; Wang, S. Analysis of rainstorm-induced slide-debris flows on natural terrain of Lantau Island, Hong Kong. Eng. Geol. 1999, 51, 279–290. [Google Scholar]
- Fourie, A.B.; Rowe, D.; Blight, G.E. The effect of infiltration on the stability of the slopes of a dry ash dump. Géotechnique 1999, 49, 1–13. [Google Scholar] [CrossRef]
- Cho, S.E. Prediction of shallow landslide by surficial stability analysis considering rainfall infiltration. Eng. Geol. 2017, 231, 126–138. [Google Scholar] [CrossRef]
- Tozato, K.; Dolojan, N.L.J.; Touge, Y.; Kure, S.; Moriguchi, S.; Kawagoe, S.; Kazama, S.; Terada, K. Limit equilibrium method-based 3D slope stability analysis for wide area considering influence of rainfall. Eng. Geol. 2022, 308, 106808. [Google Scholar] [CrossRef]
- Govindaraju, R.S.; Or, D.; Kavvas, M.L.; Rolston, D.E.; Biggar, J. Error analyses of simplified unsaturated flow models under large uncertainty in hydraulic properties. Water Resour. Res. 1992, 28, 2913–2924. [Google Scholar] [CrossRef]
- Govindaraju, R.S.; Kavvas, M.L.; Jones, S.E.; Rolston, D.E. Use of Green-Ampt model for analyzing one-dimensional convective transport in unsaturated soils. J. Hydrol. 1996, 178, 337–350. [Google Scholar] [CrossRef]
- Chen, L.; Young, M.H. Green-Ampt infiltration model for sloping surfaces. Water Resour. Res. 2006, 42, W07420. [Google Scholar] [CrossRef]
- Kale, R.V.; Sahoo, B. Green-Ampt infiltration models for varied field conditions: A revisit. Water Resour. Manag. 2011, 25, 3505–3536. [Google Scholar] [CrossRef]
- Beven, K. Infiltration into a class of vertically non-uniform soils. Hydrol. Sci. J. 1984, 29, 425–434. [Google Scholar] [CrossRef]
- Selker, J.S.; Duan, J.; Parlange, J.-Y. Green and Ampt infiltration into soils of variable pore size with depth. Water Resour. Res. 1999, 35, 1685–1688. [Google Scholar] [CrossRef]
- Chu, X.; Mariño, M.A. Determination of ponding condition and infiltration into layered soils under unsteady rainfall. J. Hydrol. 2005, 313, 195–207. [Google Scholar] [CrossRef]
- Liu, J.; Zhang, J.; Feng, J. Green–Ampt model for layered soils with nonuniform initial water content under unsteady infiltration. Soil Sci. Soc. Am. J. 2008, 72, 1041–1047. [Google Scholar] [CrossRef]
- Dagan, G.; Bresler, E. Unsaturated flow in spatially variable fields. 1. Derivation of models of infiltration and redistribution. Water Resour. Res. 1983, 19, 413–420. [Google Scholar] [CrossRef]
- Dagan, G.; Bresler, E. Unsaturated flow in spatially variable fields. 2. Application of water flows models to various fields. Water Resour. Res. 1983, 19, 421–428. [Google Scholar] [CrossRef]
- Cho, S.E. Infiltration analysis to evaluate the surficial stability of two-layered slopes considering rainfall characteristics. Eng. Geol. 2009, 105, 32–43. [Google Scholar] [CrossRef]
- Corradini, C.; Melone, F.; Smith, R.E. A unified model for infiltration and redistribution during complex rainfall patterns. J. Hydrol. 1997, 192, 104–124. [Google Scholar] [CrossRef]
- Segalini, A.; Giani, G.P.; Ferrero, A.M. Geomechanical studies on slow slope movements in Parma Apennine. Eng. Geol. 2009, 109, 31–44. [Google Scholar] [CrossRef]
- García-Ruiz, J.M.; Beguería, S.; Alatorre, L.C.; Puigdefábregas, J. Land cover changes and shallow landsliding in the flysch sector of the Spanish Pyrenees. Geomorphology 2010, 124, 250–259. [Google Scholar] [CrossRef]
- Kamiński, M.; Zientara, P.; Krawczyk, M. Electrical resistivity tomography and digital aerial photogrammetry in the research of the “Bachledzki Hill” active landslide—In Podhale (Poland). Eng. Geol. 2021, 285, 106004. [Google Scholar] [CrossRef]
- Zádarová, T.; Penížek, V.; Koubová, M.; Lisá, L.; Pavlů, L.; Tejnecký, V.; Žižala, D.; Drábek, O.; Němeček, K.; Vaněk, A.; et al. Formation of Colluvisols in different soil regions and slope positions (Czechia): Post-sedimentary pedogenesis in colluvial material. Catena 2023, 229, 107233. [Google Scholar] [CrossRef]
- Zanini, E.; Petrella, F.; Ajmone Marsan, F.; Arduino, E. The soils on the flysch area of Western Liguria (Italy). Catena 1988, 15, 381–392. [Google Scholar] [CrossRef]
- Azañón, J.M.; Azor, A.; Yesares, J.; Tsige, M.; Mateos, R.M.; Nieto, F.; Delgado, J.; López-Chicano, M.; Martín, W.; Rodríguez-Fernández, J. Regional-scale high-plasticity clay-bearing formation as controlling factor on landslides in Southeast Spain. Geomorphology 2010, 120, 26–37. [Google Scholar] [CrossRef]
- Anis, Z.; Wissem, G.; Riheb, H.; Biswajeet, P.; Essghaier, G.M. Effects of clay properties in the landslides genesis in flysch massif: Case study of Aïn Draham, North Western Tunisia. J. Afr. Earth Sci. 2019, 151, 146–152. [Google Scholar] [CrossRef]
- Musielok, L.; Buczek, K.; Karcz, T. Relief-induced feedback mechanisms controlling local podsolization occurrence on flysch slopes—Examples from Outer Western Carpathians (southern Poland). Catena 2022, 213, 106124. [Google Scholar] [CrossRef]
- Stumvoll, M.J.; Schmaltz, E.M.; Kanta, R.; Roth, H.; Grall, B.; Luhn, J.; Flores-Orozco, A.; Glade, T. Exploring the dynamics of a complex, slow-moving landslide in the Austrian Flysch Zone with 4D surface and subsurface information. Catena 2022, 214, 106203. [Google Scholar] [CrossRef]
- Önalp, A.; Bol, E.; Özocak, A.; Sert, S.; Ural, N.; Arel, E. Influence of index properties on the cyclic failure of fine-grained soils. Eng. Geol. 2023, 317, 107056. [Google Scholar] [CrossRef]
- Paronuzzi, P.; Del Fabbro, M.; Bolla, A. Soil moisture profiles of unsaturated colluvial slopes susceptible to rainfall-induced landslides. Geosciences 2022, 12, 12010006. [Google Scholar] [CrossRef]
- Paronuzzi, P.; Vanon, R. Eventi pluviometrici critici e dissesti: Studio della franosità del Comune di Paularo (Friuli—Alpi Carniche). Geoing. Ambient. Mineraria 1995, 85, 21–31. [Google Scholar]
- Paronuzzi, P.; Coccolo, A.; Garlatti, G. Eventi meteorici critici e debris flows nei bacini montani del Friuli. L’Acqua, Riv. It. Idrologia Tecnica 1998, 6, 39–50. [Google Scholar]
- Pradel, D.; Raad, G. Effect of permeability on surficial stability of homogenous slopes. J. Geotech. Eng. ASCE 1993, 119, 315–332. [Google Scholar] [CrossRef]
- Li, W.C.; Lee, L.M.; Cai, H.; Li, H.L.; Dai, F.C.; Wang, M.L. Combined roles of saturated permeability and rainfall characteristics on surficial failure of homogeneous soil slope. Eng. Geol. 2013, 153, 105–113. [Google Scholar] [CrossRef]
- Rahardjo, H.; Satyanaga, A.; Leong, E.-C. Effects of flux boundary conditions on pre-water pressure distribution in slope. Eng. Geol. 2013, 165, 133–142. [Google Scholar] [CrossRef]
- Lim, T.T.; Rahardjo, H.; Chang, M.F.; Fredlund, D.G. Effects of rainfall on matric suctions in a residual soil slope. Can. Geotech. J. 1996, 33, 618–628. [Google Scholar] [CrossRef]
- Dapporto, S.; Aleotti, P.; Casagli, N.; Polloni, G. Analysis of shallow failures triggered by the 14–16 November 2022 event in the Albaredo valley, Valtellina (Northern Italy). Adv. Geosci. 2005, 2, 305–308. [Google Scholar] [CrossRef]
- Jeong, S.; Lee, K.; Kim, J.; Kim, Y. Analysis of rainfall-induced landslide on unsaturated soil slopes. Sustainability 2017, 9, 1280. [Google Scholar] [CrossRef]
- Ng, C.W.W.; Shi, Q. A numerical investigation of the stability of unsaturated soil slopes subjected to transient seepage. Comput. Geotech. 1998, 22, 1–28. [Google Scholar] [CrossRef]
- Gasmo, J.M.; Rahardjo, H.; Leong, E.C. Infiltration effects on stability of a residual soil slope. Comput. Geotech. 2000, 26, 145–165. [Google Scholar] [CrossRef]
- Rahimi, A.; Rahardjo, H.; Leong, E.-C. Effect of antecedent rainfall patterns on rainfall-induced slope failure. J. Geotech. Geoenviron. Eng. 2011, 137, 483–491. [Google Scholar] [CrossRef]
- Balzano, B.; Tarantino, A.; Ridley, A. Preliminary analysis on the impacts of the rhizosphere on occurrence of rainfall-induced shallow landslides. Landslides 2019, 16, 1885–1901. [Google Scholar] [CrossRef]
- Rice, R.M.; Corbett, E.S.; Bailey, R.G. Soil slips related to vegetation, topography, and soil in Southern California. Water Resour. Res. 1969, 5, 647–659. [Google Scholar] [CrossRef]
- Shakoor, A.; Smithmyer, A.J. An analysis of storm-induced landsides in colluvial soils overlying mudrock sequences, southestern Ohio, USA. Eng. Geol. 2005, 78, 257–274. [Google Scholar] [CrossRef]
- Li, X.; Lizárraga, J.J.; Buscarnera, G. Regional-scale simulation of flowslide triggering in stratified deposits. Eng. Geol. 2021, 292, 106248. [Google Scholar] [CrossRef]
- Qin, M.; Cui, P.; Jiang, Y.; Guo, J.; Zhang, G.; Ramzan, M. Occurrence of shallow landslides triggered by increased hydraulic conductivity due to tree roots. Landslides 2022, 19, 2593–2604. [Google Scholar] [CrossRef]
- Reid, M.E.; Nielsen, H.P.; Dreiss, S.J. Hydrologic factors triggering a shallow hillslope failure. Bull. Assoc. Eng. Geol. 1988, 25, 349–361. [Google Scholar] [CrossRef]
- Wieczorek, G.F. Landslide triggering mechanisms. In Landslides: Investigation and Mitigation; Transportation Research Board Special Report 247; Turner, A.K., Schuster, R.L., Eds.; National Research Council: Washington, DC, USA, 1996; pp. 76–79. [Google Scholar]
- Khan, M.S.; Hossain, S.; Ahmed, A.; Faysal, M. Investigation of a shallow slope failure on expansive clay in Texas. Eng. Geol. 2017, 219, 118–129. [Google Scholar] [CrossRef]
- Dey, N.; Sengupta, A. Effect of rainfall on the triggering of the devastating slope failure at Malin, India. Nat. Hazards 2018, 94, 1391–1413. [Google Scholar] [CrossRef]
- Brand, E.W.; Premchitt, J.; Phillipson, H.B. Relationship between rainfall and landslides in Honk Hong. In Proceedings of the 4th International Symposium on Landslides, Toronto, ON, Canada, 16–21 September 1984; pp. 377–384. [Google Scholar]
- Geo-Slope International Ltd. Seepage and Stability Modeling with SEEP/W and SLOPE/W; Users Manuals; Geo-Slope International Ltd.: Calgary, AB, Canada, 2016. [Google Scholar]
- Burton, A.; Arkell, T.J.; Bathurst, J.C. Field variability of landslide model parameters. Environ. Geol. 1998, 35, 100–114. [Google Scholar] [CrossRef]
- Tofani, V.; Bicocchi, G.; Rossi, G.; Segoni, S.; D’Ambrosio, M.; Casagli, N.; Catani, F. Soil characterization for shallow landslides modeling: A case study in the Northern Apennines (Central Italy). Landslides 2017, 14, 755–770. [Google Scholar] [CrossRef]


| Rainfall | Colluvial Soil Properties | Green–Ampt Model | Dagan–Bresler Model | |||||||||
|---|---|---|---|---|---|---|---|---|---|---|---|---|
| I | D | S | λ | ksat | Sm | Tp | zsf | zwf | Si | Tp | zsf | zwf |
| (mm/h) | (min) | (%) | (–) | (m/s) | (cm) | (min) | (cm) | (cm) | (cm) | (min) | (cm) | (cm) |
| 40 | 60 | 70 | 0.53 | 1 × 10⁻⁴ | – | n.d. | n.d. | n.d. | 15 | n.d. | D < Tp | 270 |
| 50 | 60 | 70 | 0.53 | 1 × 10⁻⁴ | – | n.d. | n.d. | n.d. | 15 | n.d. | D < Tp | 200 |
| 70 | 60 | 70 | 0.53 | 1 × 10⁻⁴ | – | n.d. | n.d. | n.d. | 15 | n.d. | D < Tp | 170 |
| 90 | 60 | 70 | 0.53 | 1 × 10⁻⁴ | – | n.d. | n.d. | n.d. | 15 | n.d. | D < Tp | 170 |
| 40 | 180 | 70 | 0.53 | 1 × 10⁻⁴ | – | n.d. | n.d. | n.d. | 15 | n.d. | D < Tp | 780 |
| 50 | 180 | 70 | 0.53 | 1 × 10⁻⁴ | – | n.d. | n.d. | n.d. | 15 | n.d. | D < Tp | 590 |
| 70 | 120 | 70 | 0.53 | 1 × 10⁻⁴ | – | n.d. | n.d. | n.d. | 15 | n.d. | D < Tp | 340 |
| 40 | 60 | 85 | 0.15 | 1 × 10⁻⁵ | 45 | n.d. | n.d. | n.d. | 120 | 199 | D < Tp | 60 |
| 50 | 60 | 85 | 0.15 | 1 × 10⁻⁵ | 45 | 100 | D < Tp | 70 | 120 | 45 | 52 | 68 |
| 70 | 60 | 85 | 0.15 | 1 × 10⁻⁵ | 45 | 29 | 47 | 90 | 120 | 13 | 21 | 76 |
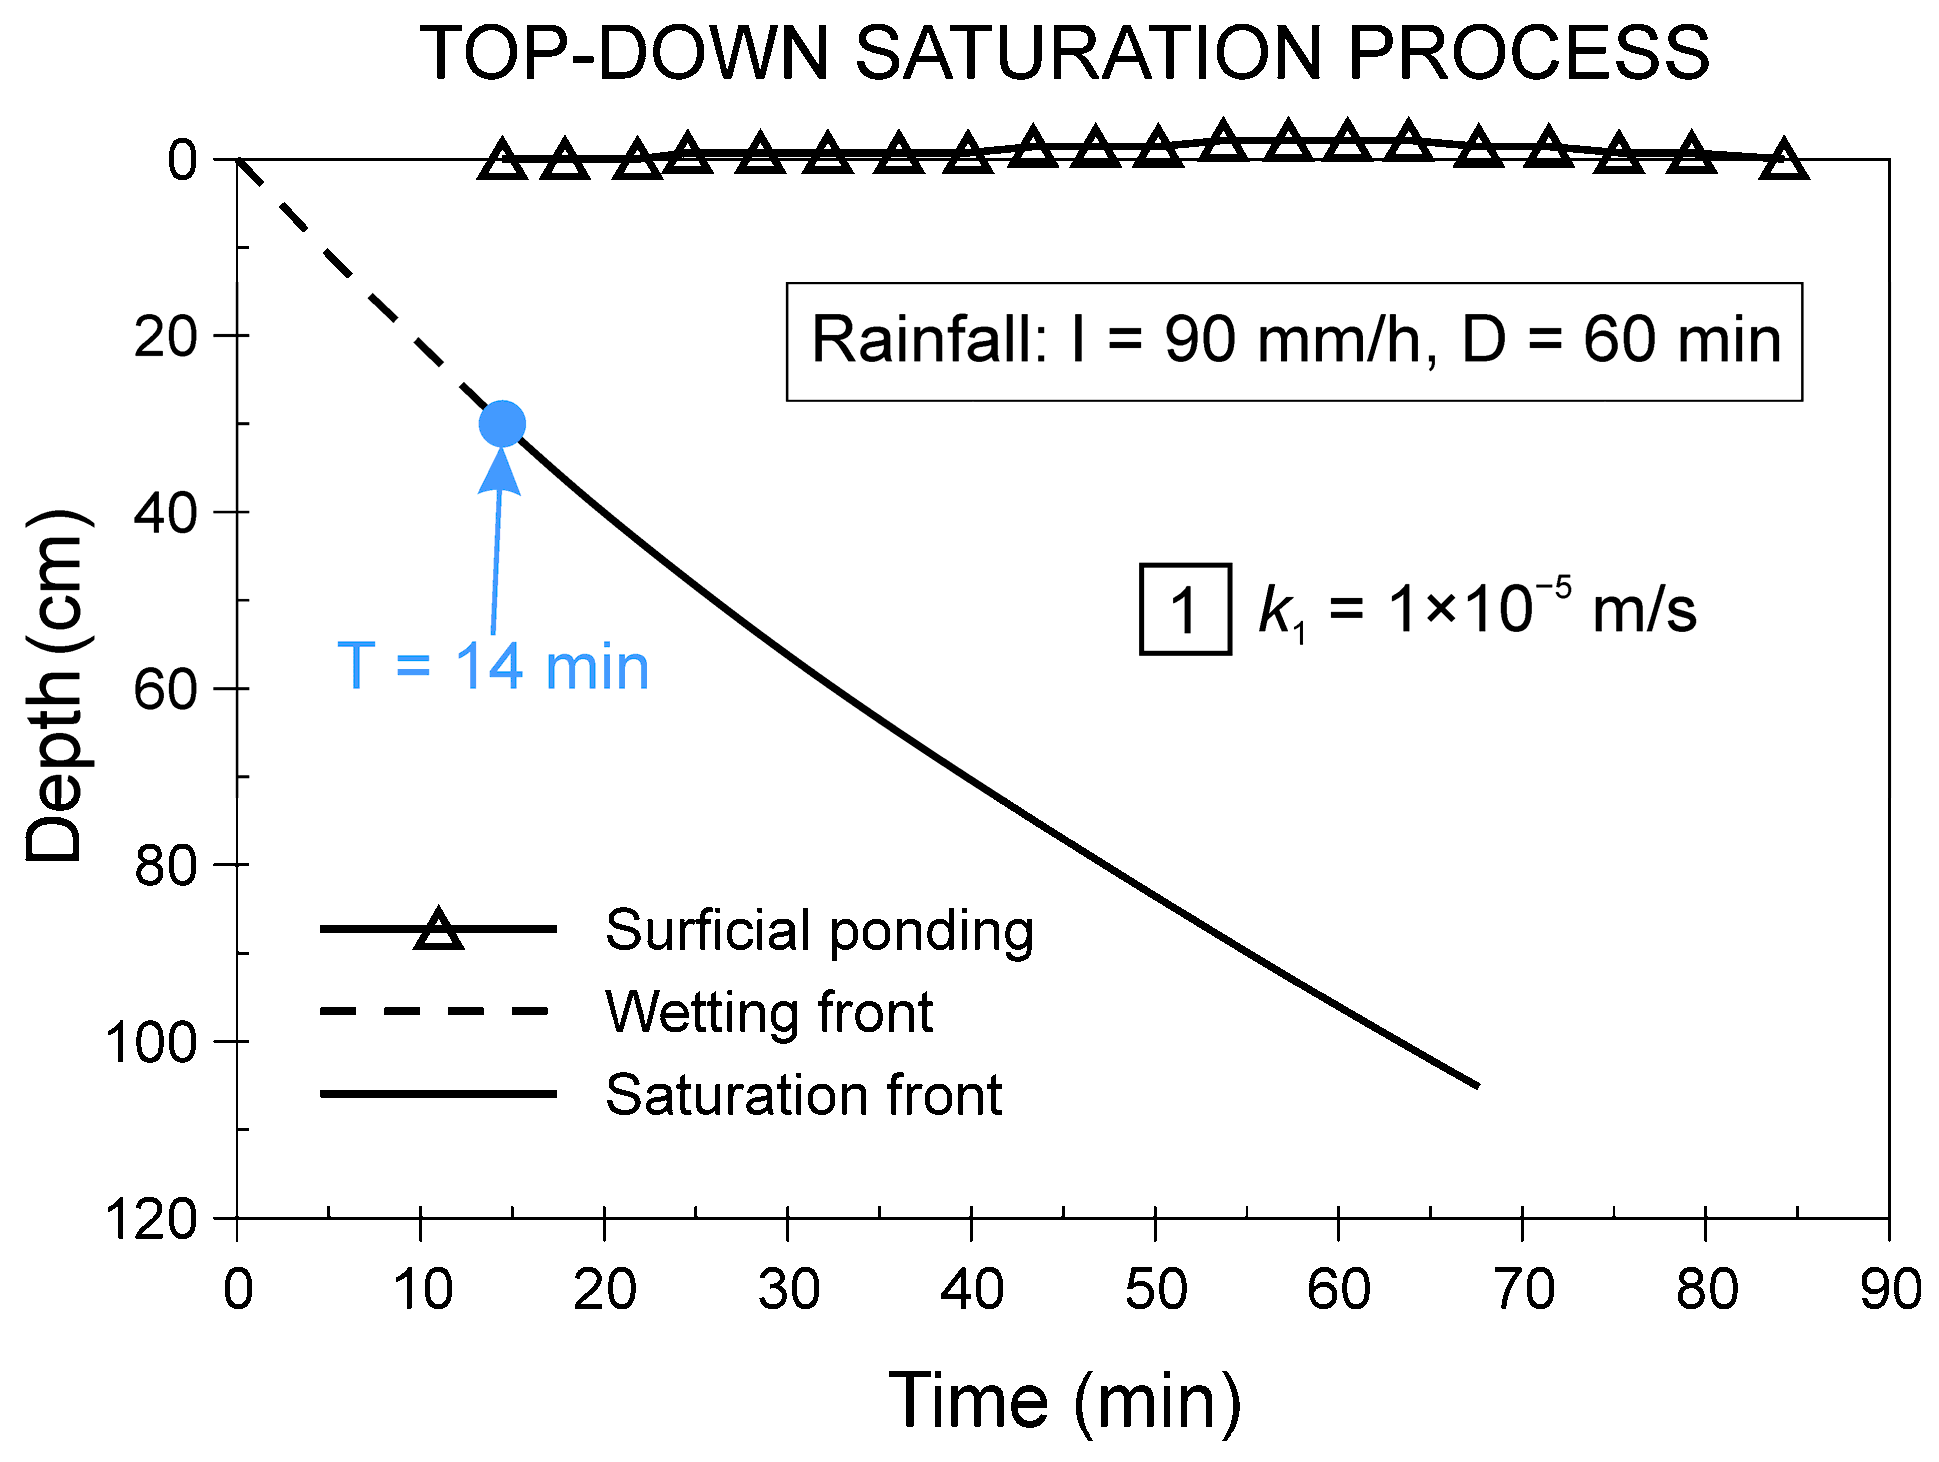
| 90 | 60 | 85 | 0.15 | 1 × 10⁻⁵ | 45 | 14 | 30 | 97 | 120 | 6 | 13 | 78 |
| 40 | 180 | 85 | 0.15 | 1 × 10⁻⁵ | 45 | n.d. | n.d. | n.d. | 120 | 199 | D < Tp | 167 |
| 50 | 180 | 85 | 0.15 | 1 × 10⁻⁵ | 45 | 100 | 116 | 202 | 120 | 45 | 52 | 180 |
| 70 | 120 | 85 | 0.15 | 1 × 10⁻⁵ | 45 | 29 | 47 | 160 | 120 | 13 | 21 | 133 |
| 40 | 60 | 85 | 0.17 | 1 × 10⁻⁶ | 50 | 5.3 | 4.9 | 25 | 130 | 2.2 | 2.1 | 18 |
| 50 | 60 | 85 | 0.17 | 1 × 10⁻⁶ | 50 | 3.3 | 3.9 | 26 | 130 | 1.4 | 1.6 | 18 |
| 70 | 60 | 85 | 0.17 | 1 × 10⁻⁶ | 50 | 1.7 | 2.7 | 26 | 130 | 0.7 | 1.1 | 18 |
| 90 | 60 | 85 | 0.17 | 1 × 10⁻⁶ | 50 | 1.0 | 2.1 | 26 | 130 | 0.4 | 0.9 | 18 |
| 40 | 180 | 85 | 0.17 | 1 × 10⁻⁶ | 50 | 5.3 | 4.9 | 49 | 130 | 2.2 | 2.1 | 35 |
| 50 | 180 | 85 | 0.17 | 1 × 10⁻⁶ | 50 | 3.3 | 3.9 | 49 | 130 | 1.4 | 1.6 | 36 |
| 70 | 120 | 85 | 0.17 | 1 × 10⁻⁶ | 50 | 1.7 | 2.7 | 39 | 130 | 0.7 | 1.1 | 28 |
| Rainfall | Layer 1 | Layer 2 | Layer 3 | Dagan–Bresler Model | ||||||
|---|---|---|---|---|---|---|---|---|---|---|
| I | D | S | ksat | S | ksat | S | ksat | Tpf | zws | zwf |
| (mm/h) | (min) | (%) | (m/s) | (%) | (m/s) | (%) | (m/s) | (min) | (cm) | (cm) |
| 50 | 60 | 70 | 1 × 10⁻⁴ | 85 | 1 × 10⁻⁵ | 95 | 1 × 10⁻⁶ | 52 | 82 | 90 |
| 70 | 60 | 70 | 1 × 10⁻⁴ | 85 | 1 × 10⁻⁵ | 95 | 1 × 10⁻⁶ | 22 | 51 | 96 |
| 90 | 60 | 70 | 1 × 10⁻⁴ | 85 | 1 × 10⁻⁵ | 95 | 1 × 10⁻⁶ | 16 | 43 | 98 |
| 40 | 180 | 70 | 1 × 10⁻⁴ | 85 | 1 × 10⁻⁵ | 95 | 1 × 10⁻⁶ | D < Tp | – | 172 |
| 50 | 180 | 70 | 1 × 10⁻⁴ | 85 | 1 × 10⁻⁵ | 95 | 1 × 10⁻⁶ | 52 | 82 | 175 |
| 70 | 120 | 70 | 1 × 10⁻⁴ | 85 | 1 × 10⁻⁵ | 95 | 1 × 10⁻⁶ | 22 | 51 | 156 |
Disclaimer/Publisher’s Note: The statements, opinions and data contained in all publications are solely those of the individual author(s) and contributor(s) and not of MDPI and/or the editor(s). MDPI and/or the editor(s) disclaim responsibility for any injury to people or property resulting from any ideas, methods, instructions or products referred to in the content. |
© 2024 by the authors. Licensee MDPI, Basel, Switzerland. This article is an open access article distributed under the terms and conditions of the Creative Commons Attribution (CC BY) license (https://creativecommons.org/licenses/by/4.0/).
Share and Cite
Paronuzzi, P.; Fedrigo, D.; Bolla, A. Rainfall Infiltration through Stratified Colluvial Deposits: Analytical Approach vs. Numerical Modelling. Geosciences 2024, 14, 53. https://doi.org/10.3390/geosciences14020053
Paronuzzi P, Fedrigo D, Bolla A. Rainfall Infiltration through Stratified Colluvial Deposits: Analytical Approach vs. Numerical Modelling. Geosciences. 2024; 14(2):53. https://doi.org/10.3390/geosciences14020053
Chicago/Turabian StyleParonuzzi, Paolo, Dario Fedrigo, and Alberto Bolla. 2024. "Rainfall Infiltration through Stratified Colluvial Deposits: Analytical Approach vs. Numerical Modelling" Geosciences 14, no. 2: 53. https://doi.org/10.3390/geosciences14020053
APA StyleParonuzzi, P., Fedrigo, D., & Bolla, A. (2024). Rainfall Infiltration through Stratified Colluvial Deposits: Analytical Approach vs. Numerical Modelling. Geosciences, 14(2), 53. https://doi.org/10.3390/geosciences14020053