Abstract
Hydraulic fracturing (HF) is the primary choice for stimulating petroleum reservoirs. Rock tensile strength and brittleness are crucial parameters required for screening candidate reservoirs and in designing successful HF operations. However, in situ and laboratory determinations of the hydraulic tensile strength (HTS) of rock can prove problematic. Alternatively, the HTS could be estimated from the rock brittleness once a reliable relationship has been established between them. Accordingly, this paper investigates the correlations between the HTS, as measured using laboratory hydraulic fracture tests, and ten strength-based brittleness indices (BIs) selected from the research literature. The primary inputs for computing these BIs are uniaxial compressive strength (UCS) and the Brazilian tensile strength (BTS), which are typically measured for most projects using standard laboratory rock mechanics tests or obtained from log data. For the purposes of this experimental investigation, intact rock core samples were obtained from a carbonate–dolomite formation in Iran, comprising eight distinct geomechanical units, with measured values of UCS, BTS, and HTS ranging 29.7–162.2, 1.93–12.23, and 7.20–20.63 MPa, respectively. The measured HTS was found to directly correlate with the UCS, BTS, and Young’s modulus, and inversely correlated with the rock porosity. Seven of the ten investigated BIs correlated with the measured HTS over 69% (R2 ≥ 0.69). In particular, the BI expressions developed by Yagiz and Gokceoglu, Ghadernejad et al., and Khandelwal et al. exhibited relatively strong correlations with the measured HTS (producing R2 values of 0.94, 0.87, and 0.86, respectively), suggesting that these three HTS–BI correlations could be used to provide preliminary HTS estimates for the investigated carbonate–dolomite formation in Iran. This work adds to a database that can be expanded to include other geographical regions for providing useful information about the selection of a suitable site or reserve for conducting HF operations.
1. Introduction
Hydraulic fracturing (HF) is a widely used well stimulation technique employed in petroleum reservoirs to enhance near-wellbore permeability, encourage the flows of oil and gas, and enhance the production rate by means of internal pressurization resulting from the injection of a fluid or gas (CO2). For instance, taking North America as an example, in the second half of the 20th century the use of HF has resulted in delivery enhancements of up to 70% and 50% for gas and oil wells, respectively [1]. Besides reservoir stimulation, HF is used in some other activities, such as geothermal [2] and CO2 sequestration [3]. Several significant factors control the HF operations, including the mechanical properties of the reservoir rocks, in situ stresses, the wellbore pressure inducing HF (i.e., the breakdown pressure), the injection fluid properties, and the pumping rate. Numerical modeling and laboratory hydraulic fracture experiments are commonly used to assess the impacts of the above factors on the HF operations [4,5].
Knowledge of the mechanical properties of the reservoir rock formations, especially the rock brittleness, is vital in designing successful field HF operations [6,7]. The rock brittleness and rupture properties are closely related, i.e., a rock formation generally fractures easily and sharply when brittle, or previously existing fractures reopen more easily via fluid injection during the HF operation. Accordingly, the rock brittleness is a significant parameter in the selection process for identifying suitable candidate reservoirs for performing HF operations [8]. In other words, knowledge of the rock brittleness can provide valuable information for optimizing the gaps created in the reservoir during the HF treatment [9,10]. High values of rock brittleness are indicators of: (i) effective initiation and propagation of hydraulic fractures in reservoir stimulation; (ii) increasing fracture complexity; and (iii) resistance to proppant embedment [11,12,13]. However, there is no general standard test method available concerning rock brittleness measurements. Nonetheless, the rock brittleness can be related to other parameters, such as rock lithology, texture, effective stress, and strength [10,14]. Some researchers indicated that stiffer rocks (i.e., of high Young’s modulus, E) are more suitable in low permeability zones to heighten the productivity of multistage HF operations [15,16]; high stiffness and rock brittleness are broadly related to one another [17]. As elaborated below, obtaining observations of the fracture initiation and propagation process from field HF monitoring or laboratory HF experimentation is not an easy task. From reviewing the pertinent literature, the more favored approach involves the indirect determination of the rock brittleness properties via correlations with other mechanical properties [18,19,20,21].
In other words, while field HF testing may provide reliable results towards understanding the hydraulic fracture initiation and propagation processes/behaviors, it often proves impractical to perform due to complexities affecting the field HF tests, including the strict coupling between the fluid flow, opening of the fractures, tip fracturing, and fracture growth, in addition to geometry monitoring issues [22,23,24]. In order to deal with these coupling and monitoring issues, laboratory hydraulic fracture experiments are commonly employed as an alternative for obtaining insights into the rock fracturing processes [25,26,27]. In other words, as well as providing an opportunity to better understand the physical HF mechanisms, the laboratory testing approach provides more detailed and practical engineering design parameters for modeling the hydraulic fracture initiation and propagation. Previous laboratory studies have mostly focused on the parameters significantly impacting on the hydraulic fracture behavior/properties, such as the stress magnitude and orientation [28], confinement pressure, borehole size and orientation [29,30,31], intact rock characteristics and discontinuities [32], fluid injection types/properties [33], and the proppant features [28,29,34]. In the design phase, to avoid the risks of not having adequate HF treatment and to reduce uncertainties, it is recommended to investigate the relevant parameters using laboratory hydraulic fracture experiments. However, these experiments invariably encounter upscaling issues, such that the obtained results may not directly reduce uncertainties or fully replace in situ HF testing.
Among the typical rock mechanics tests, tensile strength testing on different scales (i.e., ranging from laboratory to field) is employed to determine the critical input parameters for planning/designing the HF operations [31]. For instance, the rock’s tensile strength influences the predicted values of fracture length/thickness, apertures for proppant sizing, and fluid flow [35]. Laboratory testing methods include the splitting tensile strength (i.e., Brazilian) test [36], the modified tension test [37], and the hydraulic tensile strength (HTS) obtained using the hydraulic fracture test [35]. Various researchers typically employ the latter approach, i.e., via hydraulic fracture testing [38,39]. Molenda et al. [31] compared the tensile strength measurements obtained from the Brazilian, modified tension, and laboratory hydraulic fracture testing approaches for the different rock types investigated, with the mobilized HTS greater than the strengths measured for the other two test methods, although broadly comparable with the Brazilian tensile strength (BTS) results. Note that some literature reports the rock tensile strength in fracture toughness (FT) form.
Measuring the HTS of the rock core samples in the laboratory requires special hydraulic fracture equipment and testing of at least three rock test specimens. Rock cores can be difficult and expensive to obtain, e.g., due to the rock formation depth. Given these constraints, an economical and expedient alternative would be to find a way of indirectly estimating the HTS. Considering various rock parameters and from reviewing the pertinent literature, the brittleness index (BI) seems to be a good option, since, as described above, brittleness plays a central role in determining the rock’s mechanical behavior and failure traits. Since the mid-1960s, approximately 80 different BI expressions have been reported in the literature for discerning rock brittleness properties. They can be broadly classified into groups based on (i) the rock strength properties, (ii) the shape of the stress–strain curves, (iii) the elastic variables, (iv) the mineralogical composition, (v) traditional well-logging, (vi) the internal friction angle, (vii) the force–penetration graphs, (viii) indentation experiments, (ix) fines content after impact, (x) over-consolidation properties, and (xi) other indices [40]. An in-depth discussion on the reliability of almost all previously reported BIs is presented in the article by Meng et al. [40]. From reviewing the pertinent literature, to the best of the authors’ knowledge, the relationship between the brittleness (BI) and HTS of rock formations has not been studied much in past research. Neither has a well-proportioned model been proposed for carbonate rocks linking the brittleness (BI) or fracability and HTS. Since the rock strength properties for most projects are typically measured using laboratory experiments or obtained from log data, it would appear to the authors that the strength-based BIs (i.e., as primary inputs, they have uniaxial compressive strength (UCS), BTS, and/or E) are the obvious choice for developing various BI–HTS correlations, should they exist.
For the present research, laboratory testing and statistical analysis were performed to investigate the efficacy of employing ten previously proposed strength-based BI correlations in predicting the HTS of carbonate rock formations. For this purpose, original HTS results were obtained using laboratory hydraulic fracture experiments performed on intact core samples obtained from a carbonate–dolomite rock formation composed of eight distinct geomechanical units (GUs). For each GU, a series of standard rock mechanics tests were performed to measure the rock’s porosity (n), UCS, E, Poisson’s ratio (ν), and BTS properties. Additionally, triaxial compression testing was performed to determine the values of the rock’s apparent cohesion (C) and internal friction angle (φ). The authors then chose ten existing strength-based rock BIs (see Table 1) from the published literature for investigation of their BI–HTS correlations. That is, using the newly assembled database for the investigated carbonate–dolomite rock formation, the ten correlations between the deduced BIs and the measured HTS were critically examined, identifying those BIs that produced strong correlations with the HTS.

Table 1.
Brittleness index (BI) correlations based on rock strength properties.
2. Materials and Methods
The rock cores investigated in this research were obtained from a single carbonate–dolomite formation in Iran. It dates back to the Triassic period, and is composed of a 178 m depth of limestone intercalated with dolomites, containing vast reserves of natural gas [49,50]. Using the information available from geological reports, macroscopic and microscopic (e.g., thin section) feature studies, and core analysis, this carbonate–dolomite formation was sub-categorized into eight distinct GUs. The identified lithology of each GU is presented in Section 3, along with the physicomechanical properties of the intact samples. One core from each of the eight GUs was selected for detailed investigation in this research. Before performing the UCS, BTS, and HTS testing, all test specimens were proven intact, as determined from X-ray computed tomography image analysis (see Figure 1). Their petrophysical characteristics and mechanical properties were determined using standard laboratory rock mechanics tests. The specific gravity (rock matrix density) was measured using the gas pycnometer method according to ASTM D5550 [51], quantifying the amount of empty spaces inside the rock samples, thereby allowing for the specific gravity calculation based on the mass and volume of the solid constituents. The rock porosity was measured using mercury intrusion porosimetry in accordance with ASTM D4404 [52], with the bulk density measured in accordance with ASTM D1188 [53]. The velocities of compressional (P-wave) and shear (S-wave) waves (i.e., VP and VS, respectively) were measured using ultrasonic testing performed in accordance with the ISRM standard. Following the guidelines set by ISRM, numerous rock test specimens were created for performing the UCS, BTS, and FT testing. For the UCS determination, cylindrical test specimens were subjected to axial compression loading using uniaxial testing equipment, with the UCS value calculated as the highest mobilized axial load (at failure) divided by the test specimen’s original cross-sectional area. The value of Young’s modulus (E) was determined via analyzing the initial (linear) portion of the obtained axial stress–strain curve, while the value of Poisson’s ratio (v) was obtained via evaluating the ratio of the measured lateral to axial specimen strains. The BTS and FT measurements were also obtained in accordance with the ISRM testing standard. For the FT, test specimens prepared with predetermined notches experienced crack propagation as the loading was increased. Related data, including applied load and crack length, were carefully recorded, and used to calculate the critical stress intensity factor, providing a numerical representation of the rock’s resistance to crack propagation (i.e., its FT). The values of apparent cohesion (C) and internal friction angle (φ) were determined from the results of a series of triaxial compression tests performed on cylindrical rock specimens.
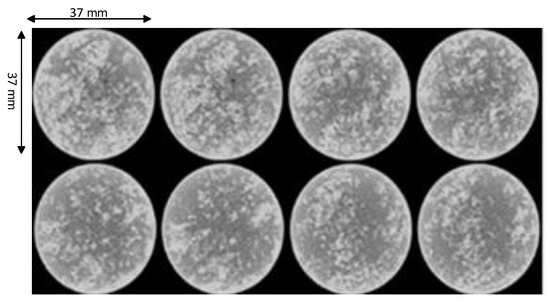
Figure 1.
Typical macroscopic images of 37 mm diameter UCS test specimens obtained from X-ray computed tomography scanning.
Using the apparatus shown in Figure 2, hydraulic fracture testing was performed on 37 mm diameter × 70 mm long test specimens, each including a central pre-bored 4 mm diameter × 60 mm deep cavity (borehole). The apparatus (manufactured by Wille Geotechnik, Germany) can apply a specimen confinement pressure, stress- or stain-rate-controlled axial loading, and an injection pressure to the specimen cavity, with measurement of its volume change response in the range of 0.0001–58 mL/min.
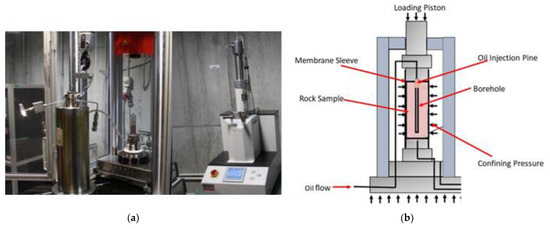
Figure 2.
Laboratory test apparatus for performing the hydraulic fracture experiments: (a) apparatus photograph; (b) schematic view of the test specimen set up in the triaxial cell.
For performing the hydraulic fracture tests, each meticulously prepared specimen was mounted on the base pedestal of the triaxial cell and enclosed by a special membrane sleeve, with the inlet connection to the specimen cavity (borehole) linked to an oil injection pump. Once the triaxial cell had been fully assembled, a small axial load (e.g., of 1.0 MPa stress) was applied via the loading piston to act along the specimen length, serving as a setting force to justify the specimen and apparatus. The cell chamber was then filled with oil for the application of the confinement pressure. Next, the axial stress and confinement pressure were simultaneously increased, typically by 20, 30, or 40 MPa, after which they remained constant for the rest of the test. Note, because of the test setting and apparatus configuration, the applied axial stress and confinement pressure values were not exactly equal. However, relative to the typical 20–40 MPa stress range investigated, their small difference (of ~1 MPa) may be considered negligible, such that the hydrostatic (isotropic confinement) condition can be assumed. For the next stage of the test, the borehole fluid (oil) was injected by means of a pump into the specimen cavity at a constant rate of typically 1–2 mL/min (depending on the rock porosity), with the resulting increase in the injection (bore) pressure simultaneously measured. The oil injection was continued until tensile fracturing of the specimen wall thickness occurred for the peak injection (breakdown) pressure. The oil injection was stopped, the axial stress and confinement pressure were relaxed to unload the test specimen, the oil in the cell chamber was allowed to drain away, and finally the triaxial cell was disassembled to allow the failed test specimen to be removed.
For each GU, laboratory hydraulic fracture testing was performed at three different confinement pressures (i.e., in total, 24 separate tests were performed). As an example, Figure 3 shows one of the test specimens, pre and post testing. Figure 4 presents the injection pressure mobilized by introducing oil into the specimen’s bore cavity at a flow rate of 1.2 mL/min for an applied 40 MPa confinement pressure. The injection pressure progressively increased with the test duration (showing a slight concave upward curvature in Figure 4) until tensile fracturing of the cylinder wall occurred, at which point the injection pressure is seen to suddenly reduce to the magnitude of the confinement pressure (40 MPa). Note, as the oil was injected via the top end of the test specimen and with the pre-bored hole sealed at its lower end, while every care was taken it was not possible to fully guarantee that all air was bled from the pore fluid system at the start of each test. It is possible that the compressibility of trapped air had an impact on the testing procedure.
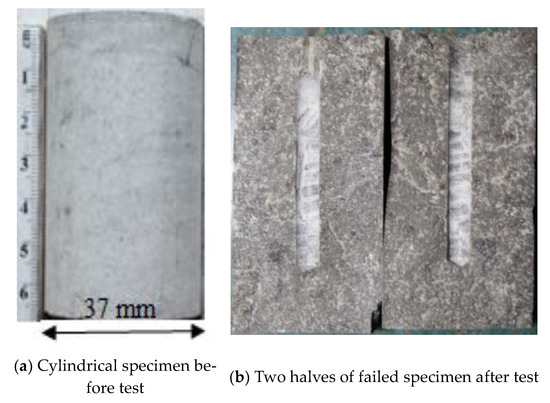
Figure 3.
Representative laboratory hydraulic fracture test specimen.
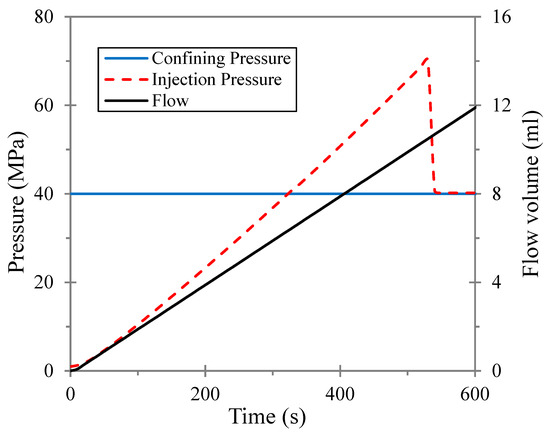
Figure 4.
Injection pressure mobilization during hydraulic fracture test for 40 MPa confinement pressure and an oil injection rate of 1.2 mL/min to the specimen’s bore cavity.
3. Experimental Results
Table 2 and Table 3 list the respective petrophysical characteristics and mechanical properties of the eight GUs comprising the carbonate–dolomite rock formation. Note, the experimental values of UCS and BTS measured for the eight GUs ranged from 29.7 to 162.2 and from 1.93 to 12.23 MPa, respectively. Table 4 presents the hydraulic fracture test results, with the HTS values determined as follows. For each GU, the measured breakdown pressures for the three tested specimens (A–C) were plotted against their corresponding applied confinement pressures, from which the best fitting linear correlation was obtained, with the y-axis intercept value defined as the HTS [29,31]. As an example, Figure 5 presents the best fitting breakdown pressure–confinement pressure correlation, deduced from the data obtained for the geomechanical unit GU5, with the associated value of HTS determined as 17.75 MPa. Note, the experimental values of HTS measured for the eight GUs ranged from 7.20 to 20.63 MPa.
Table 2.
Petrophysical characteristics of the tested specimens for each geomechanical unit (GU).
Table 3.
Some mechanical properties of the tested specimens for each geomechanical unit (GU).
Table 4.
Laboratory hydraulic fracture test results for each geomechanical unit (GU).
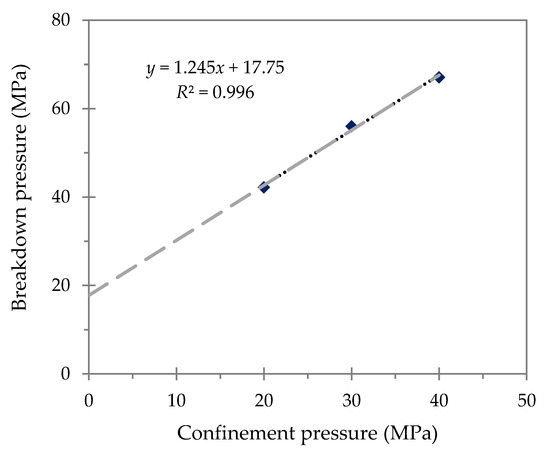
Figure 5.
Correlation between specimen breakdown and confinement pressures obtained for geomechanical unit GU5.
4. Analysis
4.1. HTS Correlation with Other Rock Parameters
Figure 6 presents various correlations deduced between the measured HTS and the UCS, BTS, Young’s modulus, and FT parameters for the eight carbonate GUs investigated. Furthermore, Figure 7 presents the correlations deduced between the HTS and the rocks’ physical properties of porosity, bulk density, VP, and VS.
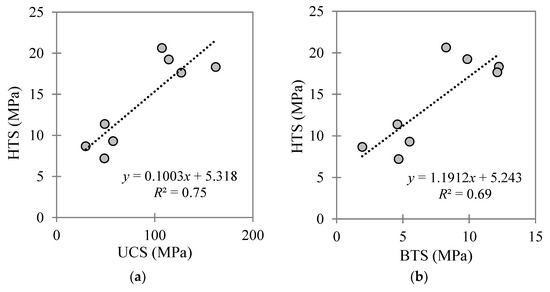
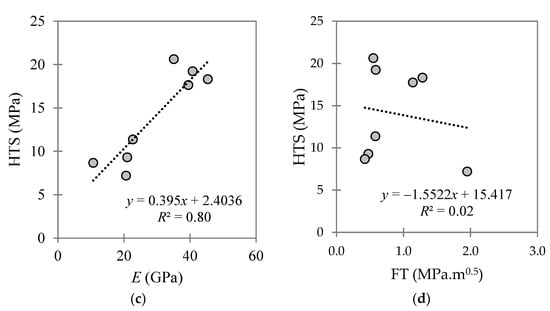
Figure 6.
Correlations between the HTS and (a) UCS, (b) BTS, (c) Young’s modulus, and (d) FT for the investigated carbonate–dolomite formation, comprising eight distinct GUs.
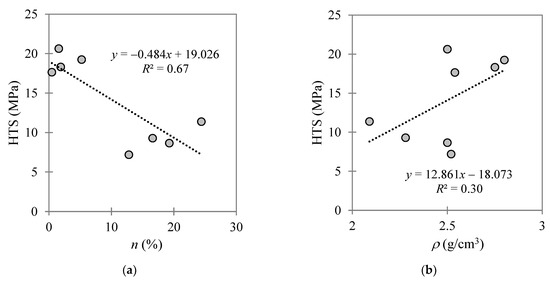
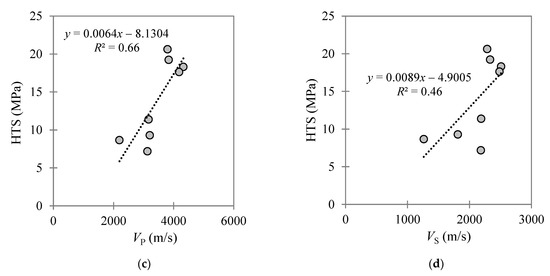
Figure 7.
Correlations between the HTS and (a) porosity, (b) bulk density, (c) VP, and (d) VS for the investigated carbonate–dolomite formation, comprising eight distinct GUs.
Clear trends are evident between the HTS and the UCS, BTS, Young’s modulus, VP, and porosity. In other words, the HTS tends to increase proportionally with increasing UCS, BTS, Young’s modulus, and VP, with the opposite occurring for the HTS—porosity correlation. Among the various parameters linked to the HTS in this study, the correlations between the HTS and the UCS, BTS, and E parameters were found to produce coefficient of determination (R2) values closer to unity (i.e., correlations between the HTS and the rock porosity, bulk density, VP, and VS produced lower R2 values). As seen in Figure 6d, no correlation was found between the HTS and FT, with an R2 value of 0.02. These outcomes support the authors’ original decision to choose the strength-based BIs for assessing the possible correlations with the HTS. Moreover, rocks with high UCS, BTS, and Young’s modulus can generally be categorized as brittle. Hence, based on the obtained correlations in Figure 6 and Figure 7, with a summary list presented in Table 5, it can be concluded that brittle rocks mobilize high HTS values. Whereas the HTS value declined severely in the case of high porosity rock (i.e., for n > 10% considering the eight GUs investigated), as reported previously for other rock formations in [17,28,29,31,34].
Table 5.
Various deduced correlations with HTS calculation error comparison.
4.2. HTS Correlation with BIs
This section investigates the strength of the correlations between the ten existing strength-based BIs listed in Table 1 and the measured HTS for each of the eight GUs. Using the measured UCS, BTS, bulk density, unit weight, and/or Young’s modulus values as inputs, the values of the ten BI parameters were calculated for each GU using Equations (1)–(10), as listed in Table 6.
Table 6.
Values of ten strength-based BIs calculated for the eight GUs using Equations (1)–(10).
Linear, logarithmic, exponential, and power curve fitting models were investigated for the eight HTS–BI datasets (i.e., one for each GU) to identify the best HTS–BI correlations. The power curve fitting model was generally found to produce better results (in terms of obtaining R2 values closer to unity), i.e., , where a, b, and c are the model coefficients. Figure 8 and Figure 9 present the power curve fitting applied for each HTS–BI dataset, with the obtained correlations and associated R2 values listed in Table 7. According to Table 7, a general trend of increasing HTS for increasing BI exists, with eight out of the ten BI correlations investigated producing reasonable or strong correlations with the HTS based on their R2 values (see Table 7).
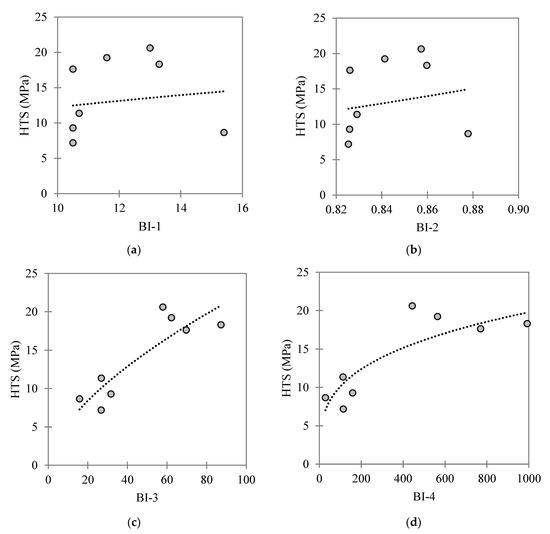
Figure 8.
Best fit HTS–BI correlations for the investigated carbonate–dolomite formation comprising eight distinct GUs, with (a–d) presenting the values of the BIs deduced using Equations (1)–(4), respectively.
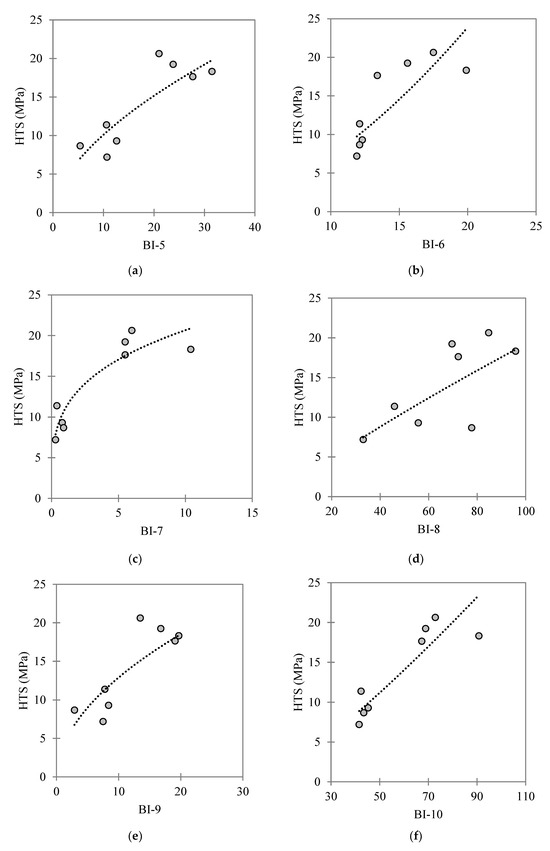
Figure 9.
Best fit HTS–BI correlations for the investigated carbonate–dolomite formation comprising eight distinct GUs, with (a–f) presenting the values of the BIs deduced using Equations (5)–(10), respectively.
Table 7.
Power equations relating the measured HTS with each BI deduced using Equations (1)–(10).
5. Discussion
This section discusses the relative performances of the ten BIs as predictors of the measured HTS for the investigated carbonate–dolomite formation that was comprised of eight distinct GUs. The first two indices, i.e., BI-1 and BI-2, were early attempts reported in the literature [41] for estimating rock brittleness; however, as shown for their BI–HTS correlations reported in Table 7, they were found to produce weak and no correlations, respectively for the investigated carbonate–dolomite formation. Possible reasons might be the simple assumptions adopted in [41] for developing Equations (1) and (2), their physical meanings not representing the rock fracturing process according to [45], such that these two indices are not satisfactory BI indicators. For instance, index BI-1 more properly characterizes the rock’s strength than its brittleness, since (referring to Equation (1)) both tensile strength and BI-1 increase with UCS. Furthermore, the experimental values of BI-1 and especially of BI-2 have narrow ranges. Despite sharing similar limitations to BI-1 and BI-2, the indices BI-3 and BI-4 positively correlate with the rock drillability, specific energy, and FT [44,54]. Accordingly, BI-3 and BI-4 were found to produce good correlations with the HTS, giving R2 values of 0.69 and 0.74, respectively (refer to Table 7). Apart from BI-8 (R2 = 0.50), indices BI-5 to BI-10 produced good to strong correlations with the HTS according to their calculated R2 values. The strongest correlations were obtained for indices BI-6, BI-10, and BI-7 (i.e., Equations (6), (7) and (10), with R2 values of 0.94, 0.87, and 0.86, respectively. Hence, the authors concluded that these three equations may be appropriate for obtaining preliminary approximations of the HTS parameter for the investigated carbonate–dolomite formation. It should be noted that HTS–BI correlations deduced from experimental data obtained for one specific rock type, or established using a small database, may not be applicable to other more general conditions (e.g., for other rock types and stress states). Hence, it is recommended that further experimental laboratory studies be performed on other carbonate formations, as well as for other rock types, to investigate the wider application of the three identified HTS–BI correlations.
6. Summary and Conclusions
As one of the critical parameters in designing reliable HF operations, the determination of the rock tensile strength via laboratory hydraulic fracture testing (like the HTS tests performed in the present investigation) is an expensive and time-consuming exercise. To reduce such costs and save time, the rock brittleness, assessed in terms of various proposed BI metrics, may be a useful parameter for estimating the HTS. For the present research, ten strength-based BIs were selected from the existing literature for evaluation in identifying possible strong correlations among them and the laboratory HTS measured for a carbonate–dolomite formation in Iran. The major findings of this research work are summarized, as follows:
- UCS, BTS, E, ρ, VP, and VS directly correlated with the HTS, whereas the rock porosity was found to inversely correlate with the HTS. The correlations between the HTS and the UCS, BTS, and E produced the best agreements.
- Seven of the ten investigated BIs correlated with the HTS over 69% (R2 ≥ 0.69). Whereas the indices BI-1 and BI-2 were found to produce weak or no correlations with the HTS, since they are considered as not satisfactory indicators of rock brittleness.
- The best agreements with the HTS among the ten investigated BIs occurred for indices BI-6, BI-10, and BI-7 (developed by [45], [48], and [46], respectively), producing R2 values of 0.94, 0.87, and 0.86, respectively.
While other parameters (e.g., in situ stresses) have an impact on the HF process, the authors concluded that the three correlations developed in this paper between the HTS and the indices BI-6, BI-10, and BI-7 may be used to provide preliminary HTS estimates for the investigated carbonate–dolomite rock formation in Iran. It is recommended that further experimental laboratory studies be performed on other carbonate formations, and for other rock types, to investigate the possible wider application of these three HTS–BI correlations, e.g., in selecting a suitable site or reserve for conducting HF operations.
Author Contributions
Conceptualization, M.E. and E.G.; methodology, M.E. and E.G.; validation, M.E., E.G., E.S.T., A.S. and B.C.O.; formal analysis, M.E., A.S., E.G., E.S.T. and B.C.O.; Data curation, M.E., E.G. and A.S.; writing—original draft preparation, M.E., E.G. and A.S.; writing—review and editing, E.S.T., B.C.O. and A.S.; visualization, E.G. and M.E.; Supervision, E.S.T. All authors have read and agreed to the published version of the manuscript.
Funding
This research received no external funding.
Data Availability Statement
Data that support the findings of this study are available from the corresponding author upon reasonable request.
Conflicts of Interest
The authors declare that they have no known competing financial interests or personal relationships that could have appeared to influence the work reported in this paper.
Abbreviations
| BI | brittleness index |
| BI-1 to BI-10 | brittleness index correlations (numbered 1 to 10) |
| BTS | Brazilian tensile strength |
| HF | hydraulic fracturing |
| HTS | hydraulic tensile strength |
| FT | fracture toughness |
| GU | geomechanical unit |
| MAPE | mean absolute percentage error |
| RMSE | root-mean-square error |
| UCS | uniaxial compressive strength |
Notations
| a, b, and c | coefficients of power equation |
| C | apparent cohesion (cohesion intercept) |
| E | Young’s modulus |
| R2 | coefficient of determination |
| VP | compressional wave velocity |
| VS | shear wave velocity |
| γ | bulk unit weight |
| ν | Poisson’s ratio |
| φ | internal friction angle |
| ρ | bulk density |
| σc | uniaxial compressive strength |
| σt | Brazilian tensile strength |
References
- Economides, M.J.; Nolte, K.G. (Eds.) Reservoir Stimulation; Wiley: Chichester, UK, 2000. [Google Scholar]
- Lu, Y.; Zeng, L.; Xie, Q.; Jin, Y.; Hossain, M.M.; Saeedi, A. Analytical modelling of wettability alteration-induced micro-fractures during hydraulic fracturing in tight oil reservoirs. Fuel 2019, 249, 434–440. [Google Scholar] [CrossRef]
- Lebedev, M.; Zhang, Y.; Sarmadivaleh, M.; Barifcani, A.; Al-Khdheeawi, E.; Iglauer, S. Carbon geosequestration in limestone: Pore-scale dissolution and geomechanical weakening. Int. J. Greenh. Gas Control 2017, 66, 106–119. [Google Scholar] [CrossRef]
- Odling, N.W.A.; Elphick, S.C.; Meredith, P.; Main, I.; Ngwenya, B.T. Laboratory measurement of hydrodynamic saline dispersion within a micro-fracture network induced in granite. Earth Planet. Sci. Lett. 2007, 260, 407–418. [Google Scholar] [CrossRef]
- Zhuang, L.; Kim, K.Y.; Jung, S.G.; Diaz, M.; Min, K.B. Effect of water infiltration, injection rate and anisotropy on hydraulic fracturing behavior of granite. Rock Mech. Rock Eng. 2019, 52, 575–589. [Google Scholar] [CrossRef]
- Rickman, R.; Mullen, M.; Petre, E.; Grieser, B.; Kundert, D. A practical use of shale petrophysics for stimulation design optimization: All shale plays are not clones of the Barnett shale. In Proceedings of the 2008 Society of Petroleum Engineers (SPE) Annual Technical Conference and Exhibition, Denver, CO, USA, 21–24 September 2008; SPE: Richardson, TX, USA, 2008. [Google Scholar] [CrossRef]
- Jin, Z.H.; Johnson, S.E. Effects of elastic anisotropy on primary petroleum migration through buoyancy-driven crack propagation. Geomech Geophys. Geo-Energy Geo-Resour. 2017, 3, 365–378. [Google Scholar] [CrossRef]
- Geng, Z.; Chen, M.; Jin, Y.; Yang, S.; Yi, Z.; Fang, X.; Du, X. Experimental study of brittleness anisotropy of shale in triaxial compression. J. Nat. Gas Sci. Eng. 2016, 36 Pt A, 510–518. [Google Scholar] [CrossRef]
- Gholami, R.; Rasouli, V.; Sarmadivaleh, M.; Minaeian, V.; Fakhari, N. Brittleness of gas shale reservoirs: A case study from the north Perth basin, Australia. J. Nat. Gas Sci. Eng. 2016, 33, 1244–1259. [Google Scholar] [CrossRef]
- Rastegarnia, A.; Sharifi Teshnizi, E.; Hosseini, S.; Shamsi, H.; Etemadifar, M. Estimation of punch strength index and static properties of sedimentary rocks using neural networks in south west of Iran. Measurement 2018, 128, 464–478. [Google Scholar] [CrossRef]
- Jin, X.; Shah, S.N.; Roegiers, J.C.; Zhang, B. An integrated petrophysics and geomechanics approach for fracability evaluation in shale reservoirs. SPE J. 2015, 20, 518–526. [Google Scholar] [CrossRef]
- Guo, J.; Feng, G.R.; Qi, T.Y.; Wang, P.; Yang, J.; Li, Z.; Bai, J.; Du, X.; Wang, Z. Dynamic mechanical behavior of dry and water saturated igneous rock with acoustic emission monitoring. Shock. Vib. Deep. Min. Sci. 2018, 281, 2348394. [Google Scholar] [CrossRef]
- Rastegarnia, A.; Lashkaripour, G.R.; Sharifi Teshnizi, E.; Ghafoori, M. Evaluation of engineering characteristics and estimation of static properties of clay-bearing rocks. Environ. Earth Sci. 2021, 80, 621. [Google Scholar] [CrossRef]
- Noori, M.; Khanlari, G.; Rafiei, B.; Sarfarazi, V.; Zaheri, M. Correction to: Estimation of brittleness indexes from petrographic characteristics of different sandstone types (Cenozoic and Mesozoic Sandstones), Markazi Province, Iran. Rock Mech. Rock Eng. 2022, 55, 6519. [Google Scholar] [CrossRef]
- Chong, Z.; Yao, Q.; Li, X.; Zhu, L.; Tang, C. Effect of rock brittleness on propagation of hydraulic fractures in shale reservoirs with bedding-planes. Energy Sci. Eng. 2020, 8, 2352–2370. [Google Scholar] [CrossRef]
- Oyarhossein, M.; Dusseault, M.B. Sensitivity analysis of factors affecting fracture height and aperture. Upstream Oil Gas Technol. 2022, 9, 100079. [Google Scholar] [CrossRef]
- Perez Altamar, R.; Marfurt, K.J. Identification of brittle/ductile areas in unconventional reservoirs using seismic and microseismic data: Application to the Barnett Shale. Interpretation 2015, 3, T233–T243. [Google Scholar] [CrossRef]
- Zhou, C.; Sun, Z.; Xiao, Y.; Huang, G.; Kuang, D.; Li, M. Study on brittleness characteristics and fracturing crack propaga-tion law of deep thin-layer tight sandstone in Longdong, Changqing. Processes 2023, 11, 2636. [Google Scholar] [CrossRef]
- Zhang, B.; Ji, B.; Liu, W. The study on mechanics of hydraulic fracture propagation direction in shale and numerical simulation. Geomech Geophys. Geo-Energy Geo-Resour. 2018, 4, 119–127. [Google Scholar] [CrossRef]
- Karrari, S.S.; Heidari, M.; Hamidi, J.K.; Tashnizi, E.S. Evaluation brittleness indices of rocks, implication for estimating their toughness modulus. Iran. J. Eng. Geol. 2020, 13, 125–129. [Google Scholar]
- Karrari, S.S.; Haidari, M.; Hamidi, J.K.; Tashnizi, E.S. The assessment of rock brittleness effect on drillability. Adv. Appl. Geol. 2022, 11, 671–689. [Google Scholar] [CrossRef]
- de Pater, C.J.; Cleary, M.P.; Quinn, T.S.; Barr, D.T.; Johnson, D.E.; Weijers, L. Experimental verification of dimensional analysis for hydraulic fracturing. SPE Prod. Facil. 1994, 9, 230–238. [Google Scholar] [CrossRef]
- Kaka, S.I.; Reyes-Montes, J.M.; Al-Shuhail, A.; Al-Shuhail, A.A.; Jervis, M. Analysis of microseismic events during a multistage hydraulic stimulation experiment at a shale gas reservoir. Pet. Geosci. 2017, 23, 386–394. [Google Scholar] [CrossRef]
- Zhao, H.; Wang, X.; Liu, Z. Experimental investigation of hydraulic sand fracturing on fracture propagation under the influence of coal macrolithotypes in Hancheng block, China. J. Pet. Sci. Eng. 2019, 175, 60–71. [Google Scholar] [CrossRef]
- Zhao, Y.; Wang, Y.; Wang, W.; Wan, W.; Tang, J. Testing study on crack propagation due to rheological fracture in quasi-brittle material under compression-shear or double torsional loading. Geotech. Geol. Eng. 2016, 34, 1655–1667. [Google Scholar] [CrossRef]
- Lin, H.; Yang, H.; Wang, Y.; Zhao, Y.; Cao, R. Determination of the stress field and crack initiation angle of an open flaw tip under uniaxial compression. Theor. Appl. Fract. Mech. 2019, 104, 102358. [Google Scholar] [CrossRef]
- Wang, Y.; Zhang, H.; Lin, H.; Zhao, Y.; Liu, Y. Fracture behaviour of central-flawed rock plate under uniaxial compression. Theor. Appl. Fract. Mech. 2020, 106, 102503. [Google Scholar] [CrossRef]
- Song, I.; Suh, M.; Won, K.S.; Haimson, B. A laboratory study of hydraulic fracturing breakdown pressure in tablerock sandstone. Geosci. J. 2001, 5, 263–271. [Google Scholar] [CrossRef]
- Zoback, M.D.; Rummel, F.; Jung, R.; Raleigh, C.B. Laboratory hydraulic fracturing experiments in intact and pre-fractured rock. Int. J. Rock Mech. Min. Sci. Geomech. Abstr. 1977, 14, 49–58. [Google Scholar] [CrossRef]
- Haimson, B.C.; Zhao, Z. Effect of borehole size and pressurization rate on hydraulic fracturing breakdown pressure. In Proceedings of the 32nd U.S. Symp. Rock Mechanics (USRMS), Norman, OK, USA, 10–12 July 1991. [Google Scholar]
- Molenda, M.; Stöckert, F.; Brenne, S.; Alber, M. Comparison of hydraulic and conventional tensile strength tests. In Proceedings of the Int. Conf. for Effective and Sustainable Hydraulic Fracturing, Brisbane, Australia, 20–22 May 2013; pp. 981–992. [Google Scholar] [CrossRef]
- Zhou, J.; Jin, Y.; Chen, M. Experimental investigation of hydraulic fracturing in random naturally fractured blocks. Int. J. Rock Mech. Min. Sci. 2010, 47, 1193–1199. [Google Scholar] [CrossRef]
- Athavale, A.S.; Miskimins, J.L. Laboratory hydraulic fracturing tests on small homogeneous and laminated blocks. In Proceedings of the 42nd U.S. Rock Mechanics Symposium (USRMS), San Francisco, CA, USA, 29 June–2 July 2008. [Google Scholar]
- Ispas, I.; Eve, R.A.; Hickman, R.J.; Keck, R.G.; Willson, S.M.; Olson, K.E. Laboratory testing and numerical modelling of fracture propagation from deviated wells in poorly consolidated formations. In Proceedings of the 2012 Society of Petroleum Engineers (SPE) Annual Technical Conference and Exhibition, San Antonio, TX, USA, 8–10 October 2012. [Google Scholar] [CrossRef]
- Schmitt, D.R.; Zoback, M.D. Infiltration effects in the tensile rupture of thin walled cylinders of glass and granite: Implications for the hydraulic fracturing breakdown equation. Int. J. Rock Mech. Min. Sci. Geomech. Abstr. 1993, 30, 289–303. [Google Scholar] [CrossRef]
- Bieniawski, Z.T.; Hawkes, I. Suggested methods for determining tensile strength of rock materials. Int. J. Rock Mech. Min. Sci. Geomech. Abstr. 1978, 15, 99–103. [Google Scholar] [CrossRef]
- Plinninger, R.J.; Thomée, B.; Wolski, K. The modified tension test (MTT)—Evaluation and testing experiences with a new and simple direct tension test. In Proceedings of the EUROCK 2004 & 53rd Geomechanics Colloquium, Salzburg, Austria, 7–9 October 2004; pp. 545–548. [Google Scholar]
- Erarslan, N.; Williams, D.J. Experimental, numerical and analytical studies on tensile strength of rocks. Int. J. Rock Mech. Min. Sci. 2012, 49, 21–30. [Google Scholar] [CrossRef]
- Aliabadian, Z.; Zhao, G.F.; Russell, A.R. Failure, crack initiation and the tensile strength of transversely isotropic rock using the Brazilian test. Int. J. Rock Mech. Min. Sci. 2019, 122, 104073. [Google Scholar] [CrossRef]
- Meng, F.; Wong, L.N.Y.; Zhou, H. Rock brittleness indices and their applications to different fields of rock engineering: A review. J. Rock Mech. Geotech. Eng. 2021, 13, 221–247. [Google Scholar] [CrossRef]
- Hucka, V.; Das, B. Brittleness determination of rocks by different methods. Int. J. Rock Mech. Min. Sci. Geomech. Abstr. 1974, 11, 389–392. [Google Scholar] [CrossRef]
- Özfırat, M.K.; Yenice, H.; Şimşir, F.; Yaralı, O. A new approach to rock brittleness and its usability at prediction of drillability. J. Afr. Earth Sci. 2016, 119, 94–101. [Google Scholar] [CrossRef]
- Altindag, R. The evaluation of rock brittleness concept on rotary blast hole drills. J. South. Afr. Inst. Min. Metall. 2002, 102, 61–66. [Google Scholar]
- Altindag, R. Assessment of some brittleness indexes in rock-drilling efficiency. Rock Mech. Rock Eng. 2010, 43, 361–370. [Google Scholar] [CrossRef]
- Yagiz, S.; Gokceoglu, C. Application of fuzzy inference system and nonlinear regression models for predicting rock brittleness. Expert Syst. Appl. 2010, 37, 2265–2272. [Google Scholar] [CrossRef]
- Khandelwal, M.; Shirani Faradonbeh, R.; Monjezi, M.; Armaghani, D.J.; Majid, M.Z.B.A.; Yagiz, S. Function development for appraising brittleness of intact rocks using genetic programming and non-linear multiple regression models. Eng. Comput. 2017, 33, 13–21. [Google Scholar] [CrossRef]
- Nejati, H.R.; Moosavi, S.A. A new brittleness index for estimation of rock fracture toughness. J. Min. Environ. 2017, 8, 83–91. [Google Scholar] [CrossRef]
- Ghadernejad, S.; Nejati, H.R.; Yagiz, S. A new rock brittleness index on the basis of punch penetration test data. Geomech. Eng. 2020, 21, 391–399. [Google Scholar] [CrossRef]
- Kashfi, M.S. Geology of the Permian “Super-Giant” gas reservoirs in the Greater Persian Gulf area. J. Pet. Geol. 1992, 15, 465–480. [Google Scholar] [CrossRef]
- Aali, J.; Rahimpour-Bonab, H.; Kamali, M.R. Geochemistry and origin of natural gas in the world’s largest gas field from Persian Gulf, Iran. J. Pet. Sci. Eng. 2006, 50, 163–175. [Google Scholar] [CrossRef]
- ASTM D5550; Standard Test Method for Specific Gravity of Soil Solids by Gas Pycnometer. ASTM International: West Conshohocken, PA, USA, 2014.
- ASTM D4404; Standard Test Method for Determination of Pore Volume and Pore Volume Distribution of Soil and Rock by Mercury Intrusion Porosimetry. ASTM International: West Conshohocken, PA, USA, 2018.
- ASTM D1188; Standard Test Method for Bulk Specific Gravity and Density of Compacted Asphalt Mixtures Using Coated Samples. ASTM International: West Conshohocken, PA, USA, 2022.
- Kahraman, S.; Altindag, R. A brittleness index to estimate fracture toughness. Int. J. Rock Mech. Min. Sci. 2004, 41, 343–348. [Google Scholar] [CrossRef]
Disclaimer/Publisher’s Note: The statements, opinions and data contained in all publications are solely those of the individual author(s) and contributor(s) and not of MDPI and/or the editor(s). MDPI and/or the editor(s) disclaim responsibility for any injury to people or property resulting from any ideas, methods, instructions or products referred to in the content. |
© 2024 by the authors. Licensee MDPI, Basel, Switzerland. This article is an open access article distributed under the terms and conditions of the Creative Commons Attribution (CC BY) license (https://creativecommons.org/licenses/by/4.0/).