Abstract
Minerals are the chief constituents of rocks and have varied properties, such as the surface area, surface charge, site density, etc. Hence, numerous interactions are bound to occur in a reservoir during rock–fluid (i.e., rock, crude oil and brine) interactions. This study seeks to assess the role of the mineralogical composition in the wettability of sandstone rocks (SRs) and mineral mixture (MM) using both surface complexation modeling (SCM) and a flotation test. From the considered sandstone rocks, both the experimental results and the simulated counterparts revealed that the SRs were preferentially hydrophilic. For the MM, when the mass fraction of the hydrophobic mineral was increased, the affinity of the MM became slightly hydrophobic, and vice versa. For the dominant sandstone reservoir rock minerals with predominantly negatively charged surfaces, negligible oil adsorption took place due to the interfacial repulsive forces at the oil–brine and mineral–brine interfaces. For the MM with low calcite content, the wetting preference was influenced by the mineral with a prominent surface area. Our developed model portrayed that the main mechanism of oil adhesion onto sandstone minerals was divalent cation bridging. Nonetheless, adhesion of carboxylate (>COO−) onto the illite, montmorillonite and calcite sites also took place, with the latter being more pronounced.
1. Introduction
In reservoir multiphase flow, the wetting preference is an important parameter due to its pronounced influence on the fluid flow properties. Research has shown that the breakthrough time during waterflooding is dictated by the reservoir rock wettability [1]. It was also reported that early water breakthrough can take place in a strongly hydrophobic media, while late breakthrough occurs for strongly hydrophilic media. This was attributed to the role of wettability in relative permeability [2]. Hence, inaccurate wettability estimation can affect the field development options and the oil recovery processes [3]. For a reservoir multiphase system, the wetting preference is the proclivity of one fluid phase to be adsorbed onto the rock if more than one non-miscible fluid phase exist [4]. Several methods of characterizing the wetting preferences, notably the Amott test and United States Bureau of Mines (USBM) method, have been developed, resulting from the role played by the wetting preferences in the efficiency of the oil recovery. Nonetheless, these techniques are costly and it takes more time to perform the experiment. Thus, a quick and affordable wettability characterization technique is inevitable. Wettability characterization of dominant sandstone rock minerals, notably quartz, kaolinite and calcite, via surface complexation modeling (SCM) has been reported in literature [5]. Not much work has been performed on estimating the wettability of mineral mixtures and rocks via SCM.
Research has shown that the interfacial charge and chemical composition of the fluids (i.e., crude oil and brine) control the wetting preferences of reservoir rocks [6,7,8]. For example, in rock–fluid (i.e., rock, crude oil and brine) systems, different interfacial charges (i.e., either positive or negative) result in diverse chemical interactions [9]. This study seeks to extend the existing model to predict the wettability of rocks and mineral mixtures by capturing the properties of the individual mineral in the model using a geochemical solver (PHREEQ-C).
The SCM technique for characterizing the wettability is a quick but affordable technique for characterizing the wetting preferences in the absence of materials for conventional wettability estimation, such as reservoir core samples and stock tank oil (STO, stabilized crude oil). The SCM technique is a powerful approach for modeling surface reactions, and it relies on the thermodynamic properties of the aqueous species [10,11,12]. Constant capacitance, diffuse-layer, triple-layer and two-pK models are the most commonly employed surface complexation models reported in literature [11,12]. The rationale behind the SCM technique for characterizing wettability is to assess the COBR interactions during reservoir filling. The site densities, surface areas, and equilibrium constants for the protonation, deprotonation and adsorption reactions are some of the parameters required during surface complexation modeling [12,13]. In addition, the type of SCM employed may require one or more additional capacitance values before the surface interactions can be modeled [11,12].
To accomplish this, the equilibrium reaction of the surfaces (i.e., oil and minerals) and their reaction constants cannot be ignored. Numerous chemical reactions are bound to take place in the reservoir before and after the migration and accumulation of the crude oil into the reservoir. Since rocks are composed of different minerals, the mineral/brine interactions prior to the crude oil accumulation have also been studied by numerous authors. For instance, the rock and oil reactions and their reaction constants for the different surface–brine systems have been reported in literature [10,13,14,15,16,17]. Moreover, comprehensive surface complexation studies of numerous minerals have also been reported in literature [18,19,20,21]. In-depth reviews on the surface complexation modeling of carbonate minerals such as calcite, rhodochrosite, siderite, magnesite and dolomite have been carried out in literature [17]. In addition, the possible oil–brine interactions and their reaction constants have also been reported in literature [10,13,14]. Numerous developments have been made in recent years by several researchers to exploit these existing SCM data from literature to elucidate the mechanism during the experiment [22]. For example, zeta potential measurements have successfully been modeled via SCM [22,23]. In addition, research has shown that the SCM technique is capable of modeling polymer interactions such as precipitation reactions at high surface coverage [24]. Surface complexation data of quartz, kaolinite and calcite from literature have successfully been used to estimate their wetting preferences via SCM [5]. They accomplished this by evaluating the interfacial charges that exist at the rock–fluid or fluid–fluid interfaces using PHREEQ-C. This presented study seeks to characterize the wetting preference of rocks and mineral mixtures via SCM.
To improve our existing model for predicting the wettability of reservoir rocks, the individual properties of the minerals need to be captured in the model. Minerals have diverse characteristics, notably the surface area and surface charge. Hence, during reservoir rocks’ (mineral mixtures) interactions with the fluids (i.e., brine or oil), the wetting preferences will be influenced by the properties of all the surfaces involved. To accomplish this, two techniques were employed, namely the flotation test and SCM technique. The flotation experiments were modeled via a geochemical simulator (PHREEQ-C) using similar quantities and qualities of the materials as used in the experiments. This study seeks to evaluate the effect of the mineralogical composition of rocks/mineral mixture on wettability. The SCM technique for estimating wettability was compared to the equivalent experimental results before making inferences. The flotation experiment characterizes the wetting preferences by relying on the proclivity of the reservoir rock (minerals) for the fluid phases (i.e., either the oil or brine) during COBR interactions [5]. These COBR interactions were modeled via SCM to better understand their wetting preferences. To evaluate the effect of the intrinsic properties of the individual minerals on the wettability of reservoir rock, the flotation experiment was also carried out for the main minerals in the studied rocks prior to evaluating their contribution to the rock wettability. In addition, the flotation tests were performed for four mineral mixtures (MMs) designed to assess specific properties, such as increasing the surface area or increasing the hydrophobicity of the mixture.
2. Materials and Methods
The flotation test and the surface complexation modeling (SCM) techniques were employed in this study. The SCM technique was also used to assess the COBR interactions during the spontaneous imbibition of formation water and CO2-saturated brine in carbonate rock (i.e., chalk core) [25].
2.1. Flotation Test Procedure
The rationale behind the flotation test is to mimic the wettability of the minerals/mineral mixtures before and after the migration of the crude oil into the reservoirs. The chosen rocks were crushed and sieved through a 53 µm mesh. Note that, since rocks have their grains held together by the cementing materials, it was essential to crush the rock samples using a mortar and pestle before sieving. The sieving ensured that samples less than 53 µm were used in the experiment. This was to prevent the larger size samples from sinking to the bottom of the test tube (brine phase) even if they were hydrophobic.
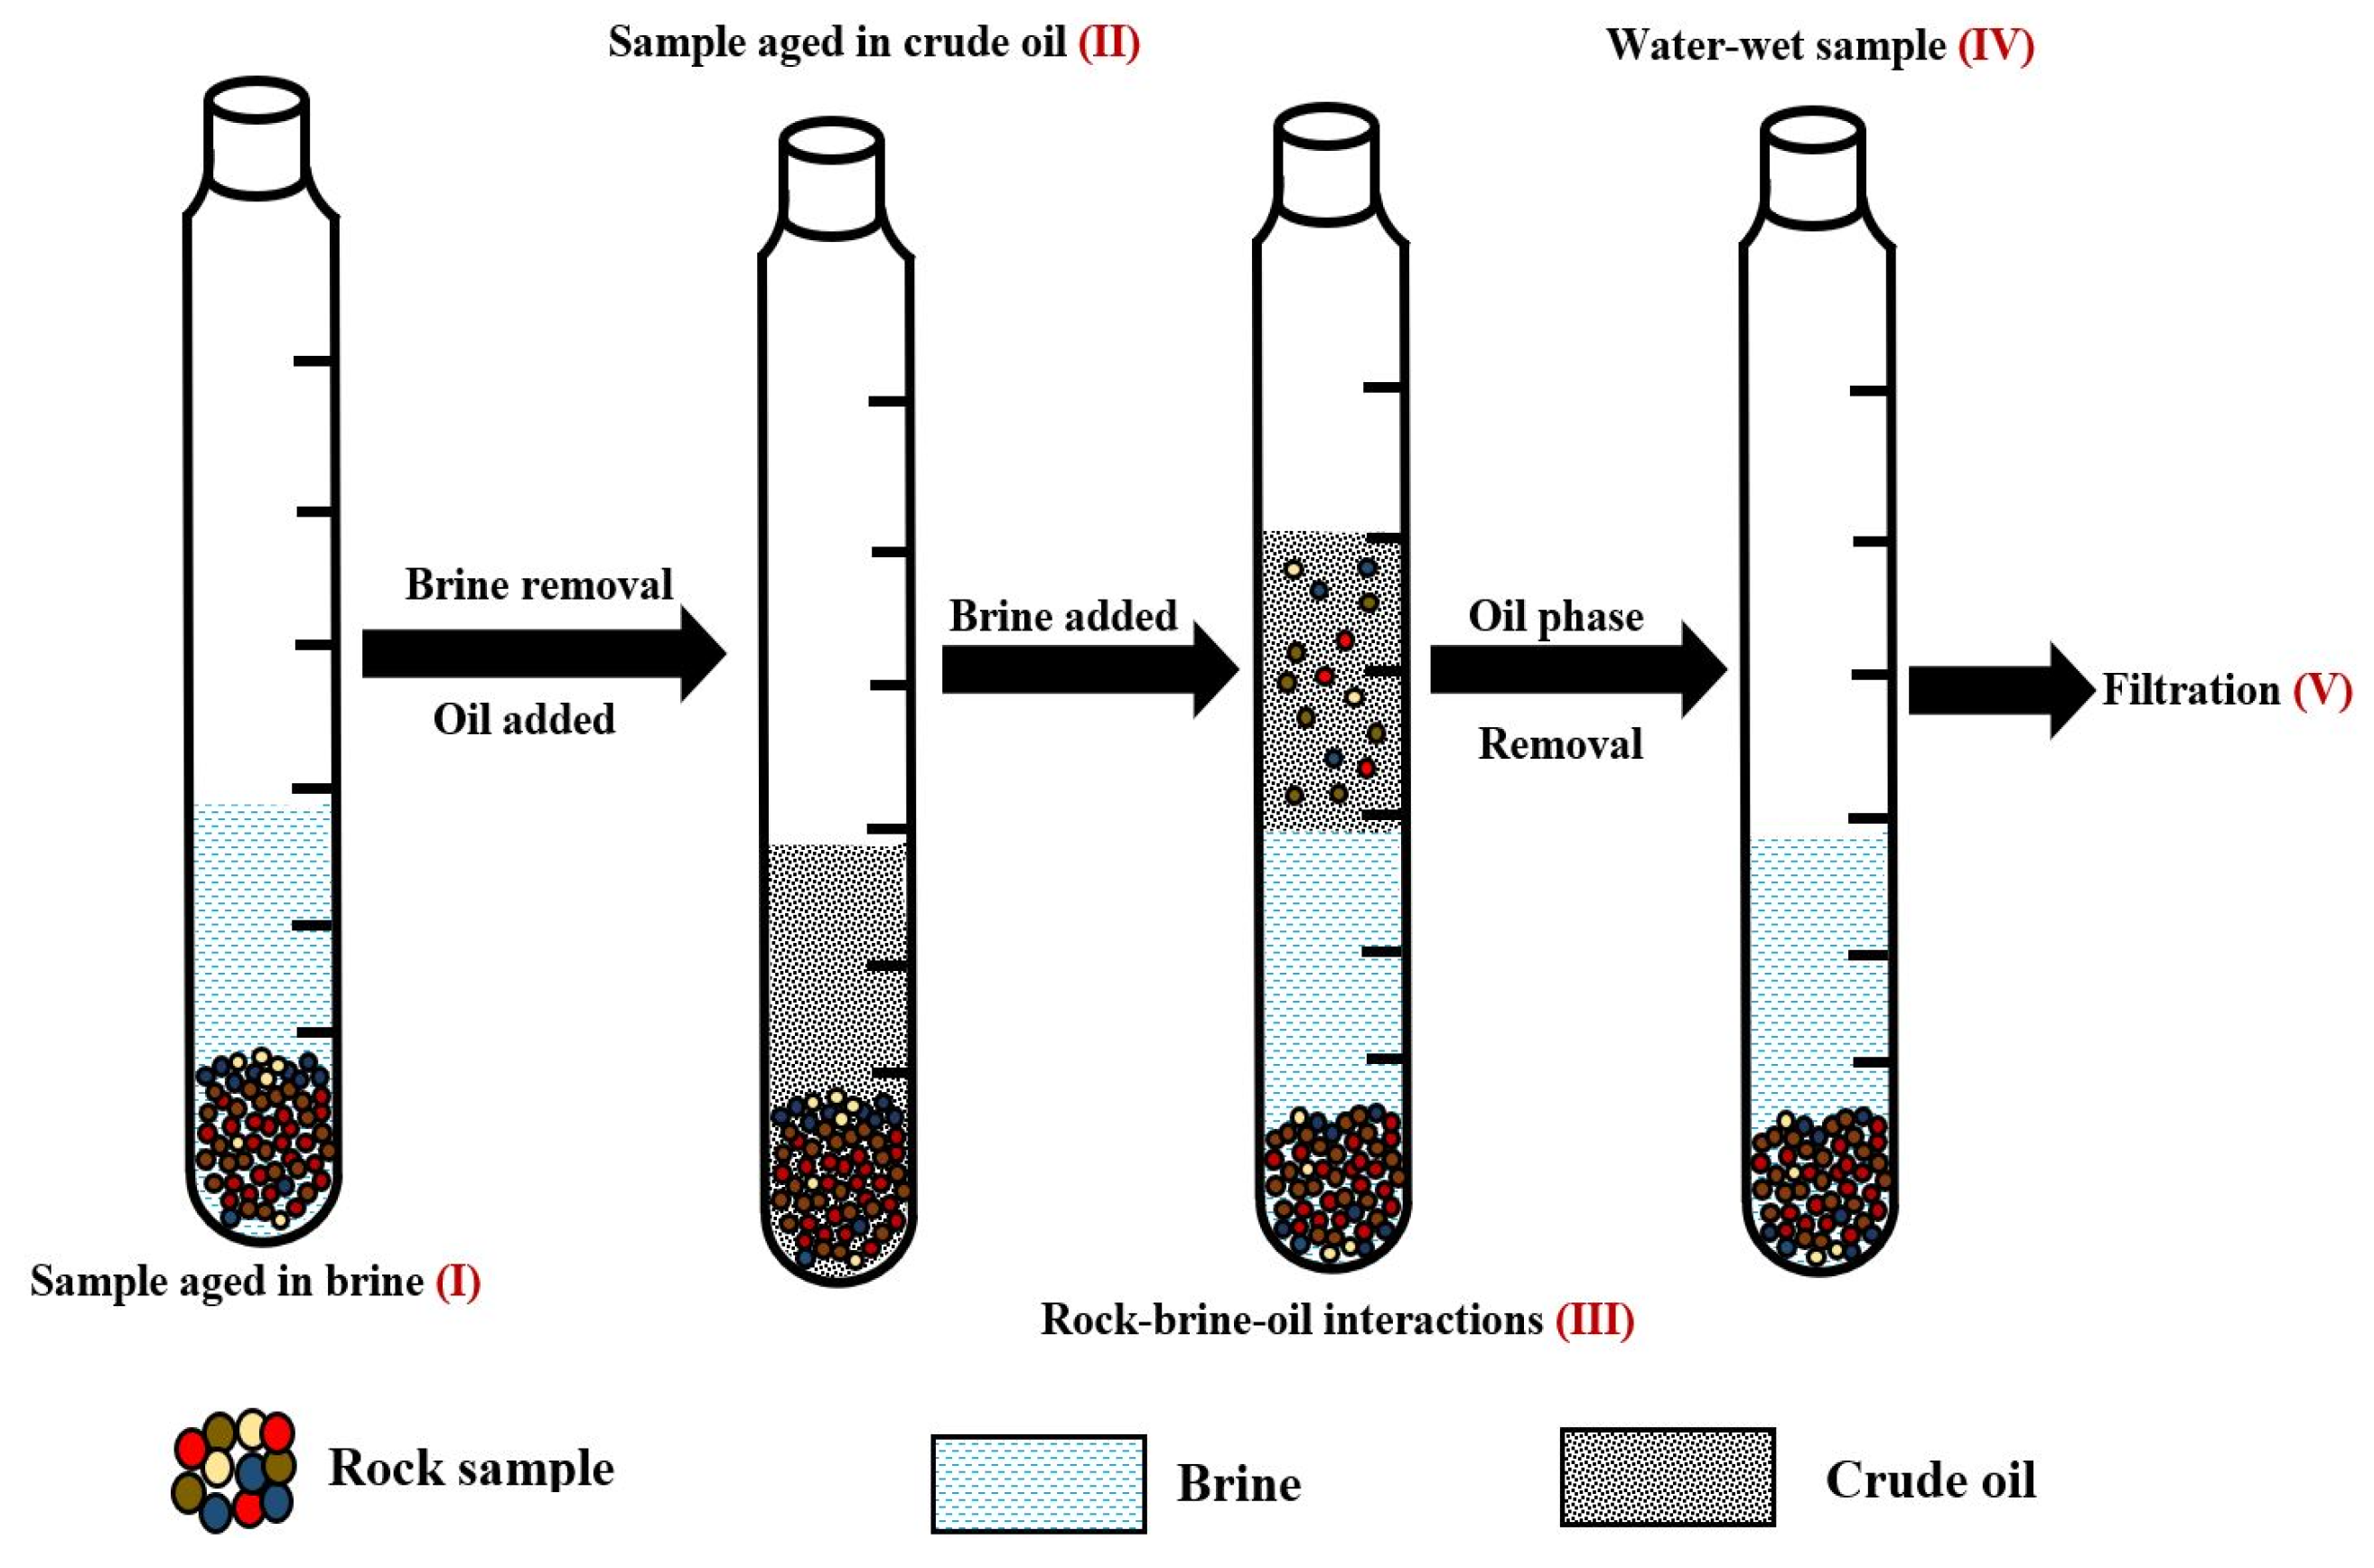
Next, 0.20 g of the sieved rock sample was then aged in a given volume (10.0 mL) of the chosen formation water (FW) at 80 °C for barely 48 h, as depicted in Section I of Figure 1. The FW was then separated and stored, while the wet rock samples were also aged in a known volume (3.0 mL) of the STO at reservoir temperature (80 °C) for 48 h with periodic stirring, as illustrated in Section II. The aforementioned process depicts the rock–crude oil reaction during crude oil migration into the reservoir. After the aging period, the stored FW was added to the aged rock–oil.
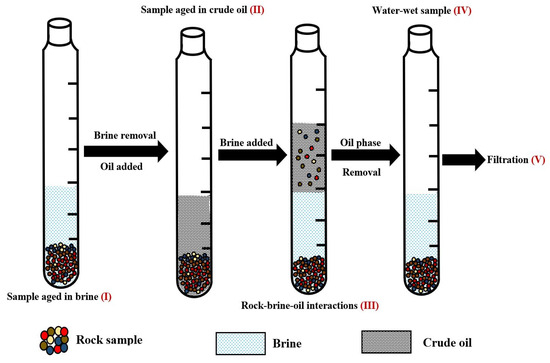
Figure 1.
This figure illustrates the flotation test procedure.
The rock–brine–oil mixtures were thoroughly shaken and kept for approximately a day at 80 °C. The wettability was characterized based on the amount of rock particles in both the oil and FW phases. Note that separating the oil–wet rock samples is difficult, unlike the hydrophilic samples, and hence the STO and its associated hydrophobic minerals were removed and discarded. To add to the above, the FW and its associated hydrophilic rock sample were filtered using a 0.22 µm filter. The filter cake and its residue were dried until the change in mass was negligible. The mass of the hydrophobic rock samples was calculated by subtracting the final dried weight of the hydrophilic rock samples from the total rock sample prior to the experiment (0.20 g). Like the reservoir rock flotation tests, the minerals and mineral mixtures flotation experiments were also carried out using a similar procedure as described above. Interested readers can refer to literature [26,27] for the more detailed flotation test procedure.
Materials Used in the Flotation Test
The experiment was carried out on five main minerals in two sandstone rocks (SRs) prior to evaluating the reservoir rocks. The minerals considered included quartz, albite, illite, montmorillonite and calcite. Throughout this study, the two SRs will be represented as SR #1 and SR #2 correspondingly. In addition, the mineral mixtures (MMs) were also designed to evaluate the impact of increasing the surface area and hydrophobic mineral content. To evaluate the effect of the surface area on the wetting preference, the MMs were accomplished by increasing the content of the chosen mineral (illite) in the SR #1. Conversely, the effect of the equivalent surface area on the wetting preference was evaluated by substituting 25% and 50% of the SR #1 rock mass with illite in MM #1 and MM #2, respectively. The MM #3 and MM #4 were also prepared via a similar approach as used for the MM #1 and MM #2 but using calcite. The mass fraction of the SRs and MMs can be obtained from Table 1. In addition, the chemical compositions of the brine and the crude oil employed in this study are also given in Table 2 and Table 3, correspondingly.

Table 1.
This table illustrates the mass fraction (%) of the SRs and MMs used in this study.

Table 2.
This table provides the ionic composition of the brines employed in this study at 20 °C.

Table 3.
This table provides the crude oil compositions employed in this study.
2.2. Flotation Test Prediction via Surface Complexation Modeling (SCM)
To better appreciate the rock–fluid (i.e., oil and brine) systems during the experiment, the mineral–fluid interactions via SCM, as reported in literature [5], have been extended to capture that of the rock–fluid interactions. The oil adhesion resulted from the attractive electrostatic pair linkage during the COBR interaction was modeled using PHREEQ-C. This was accomplished by using the properties of the rock, brine and crude oil as input into the model as reported in Table 1, Table 2 and Table 3 respectively. The oil adhesion mechanism is depicted through the bond product (BP), as illustrated in the relation:
where
Oind = Individual oil site mole fractions (dimensionless)
mind = Individual mineral site mole fraction with unlike polarity (dimensionless)
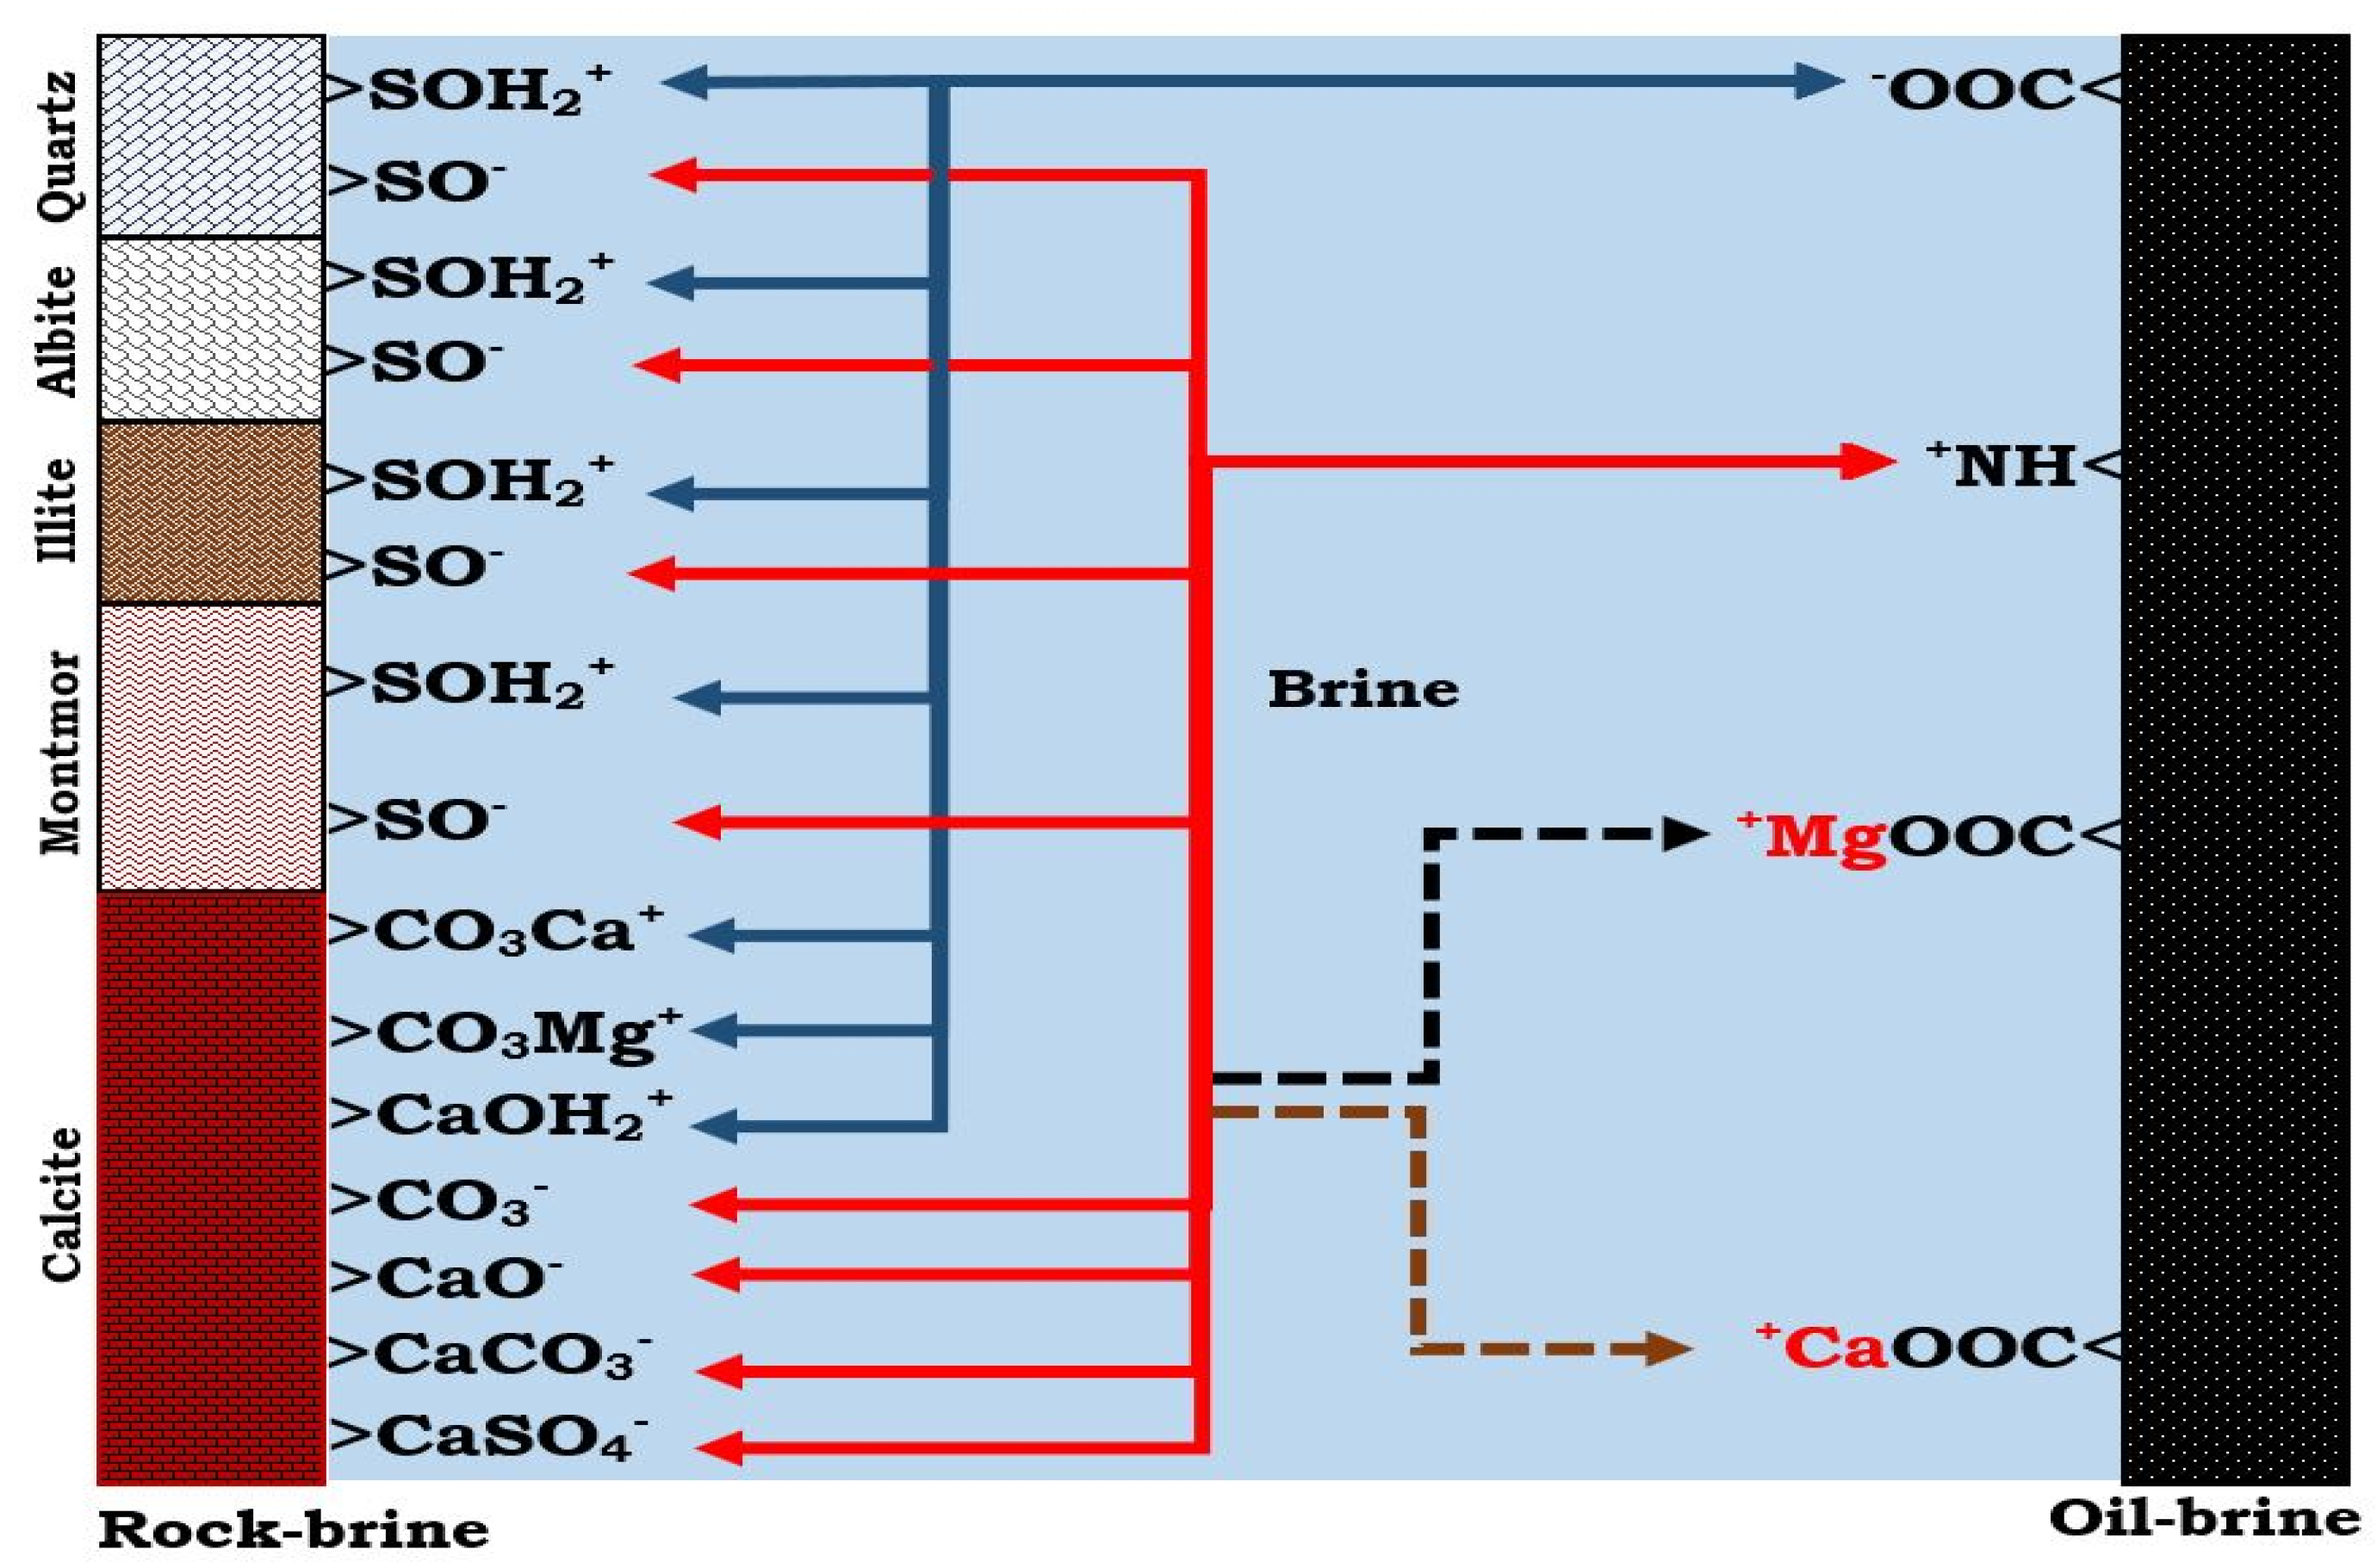
For a rock–fluid system, the wetting preference is depicted via the total bond product (TBP), which is the sum of all the BPs. The flotation experiment estimates the wetting preference by measuring the tendency of the minerals toward either brine or oil. SCM, on the other hand, characterizes the wettability by predicting the proclivity of oil to be adsorbed onto the mineral sites (Figure 2). The “>” in Figure 2 represents the oil and mineral surface groups. The TBP can also be written as:
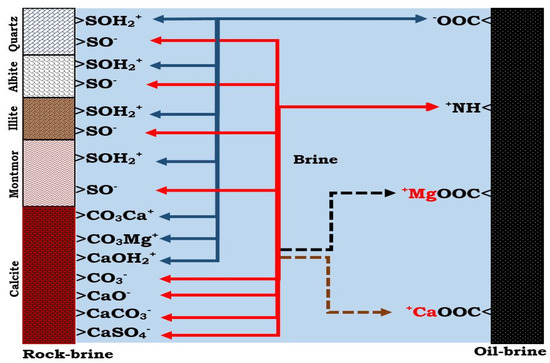
Figure 2.
This figure illustrates the oil adhesion mechanism at the rock–brine and the oil–brine interfaces.
For the SCM technique, the initial condition must always be specified before the mineral–fluid interactions can be predicted under the desired conditions. The initial conditions for the equilibrium reactions and their corresponding reaction constants from literature were reported under standard conditions (25 °C). Since the plan was to predict the flotation test via the SCM technique, the desired temperature was set to 80 °C.
Surface Complexation Modeling (SCM) Input
To predict the rock–fluid reactions during the experiment, the compositions and characteristics of the materials used during the flotation test were employed as inputs into the developed model [5]. The oil and minerals used in the flotation tests were incorporated into the model via their respective surface group. For instance, the polar group in the STO was represented by the corresponding carboxylic acid (>COO−) and basic (>NH+) oil group. In a similar vein, the SR and MM were also denoted by their respective mineral sites (e.g., >Si–O–H, >CO3H and >CaOH). The equilibrium reactions and their reaction constants for the oil surface were obtained from literature [13]. Considering the reservoir rock (mineral mixtures) of varying mineralogical compositions, the individual mineral’s reactions and reaction constants were used as inputs into our developed model. The surface area is an essential input parameter into the SCM. For the individual minerals, the surface area used was as reported in literature. However, for the rocks/mineral mixtures, their surface area varies with the mineralogical composition. Hence, their equivalent surface area was calculated based on the sum product of the individual surface area of the minerals, as reported in literature, and their corresponding mass fraction (Table 1). Mathematically, it is given by the relation:
where
Aeq = Equivalent surface area of the rock/mineral mixture (m2/g)
mind = Mass fraction of the individual mineral (dimensionless)
Aind = Surface area of individual mineral (m2/g)
Note that, if the mass fraction of a given mineral is negligible, it implies that its contribution to the equivalent surface area is approximately zero. The equivalent surface area (Aeq) of the rock (mineral mixture) was used as input into the SCM.
The STO can be incorporated into the SCM by converting the polar oil components into their corresponding acidic and basic sites (site/nm2) using the relation [5]:
The SCM input parameters, such as the oil site density, the surface reactions and their equivalent surface areas (Aeq), can be obtained from Table 4, Table 5 and Table 6, respectively.

Table 4.
This table provides the oil input parameters used in the SCM.

Table 5.
This table provides the surface (i.e., oil and minerals) reactions and reaction constants.

Table 6.
This table provides the mineral/reservoir rock input parameters considered in this study.
3. Results
The experimental outcome of the main sandstone reservoir rocks (SR #1 and SR #2) will be presented first to evaluate the role of these minerals in wettability prior to evaluating their effect on the reservoir rock wettability. The results of the predicted flotation test will then be presented. Note that the flotation test results of quartz and calcite have already been presented [5]. To add to the above, the electrostatic pair interactions at the rock–fluid interfaces were assessed to evaluate the oil adhesion mechanism during the experiment using our developed model. Each flotation test result was obtained from an average of six independent runs with experimental errors of ±5%. The experimental results with the SRs and MMs will be presented prior to presenting their simulated counterparts. To understand the oil adsorption proclivities in the sandstone rocks (SR #1 and SR #2) during the flotation tests, their oil adhesion mechanisms were also assessed via SCM. The role of increasing the equivalent surface areas and the oil–wet mineral fraction were studied by adding illite and calcite, respectively. In addition, the oil adhesion mechanisms of the mineral mixtures were also evaluated regarding their role in the wetting preference. Finally, the correlation between the equivalent surface area of the reservoir rock/mineral(s) and their wetting preferences were also assessed via SCM before meaningful conclusions could be drawn.
3.1. Flotation Test Results
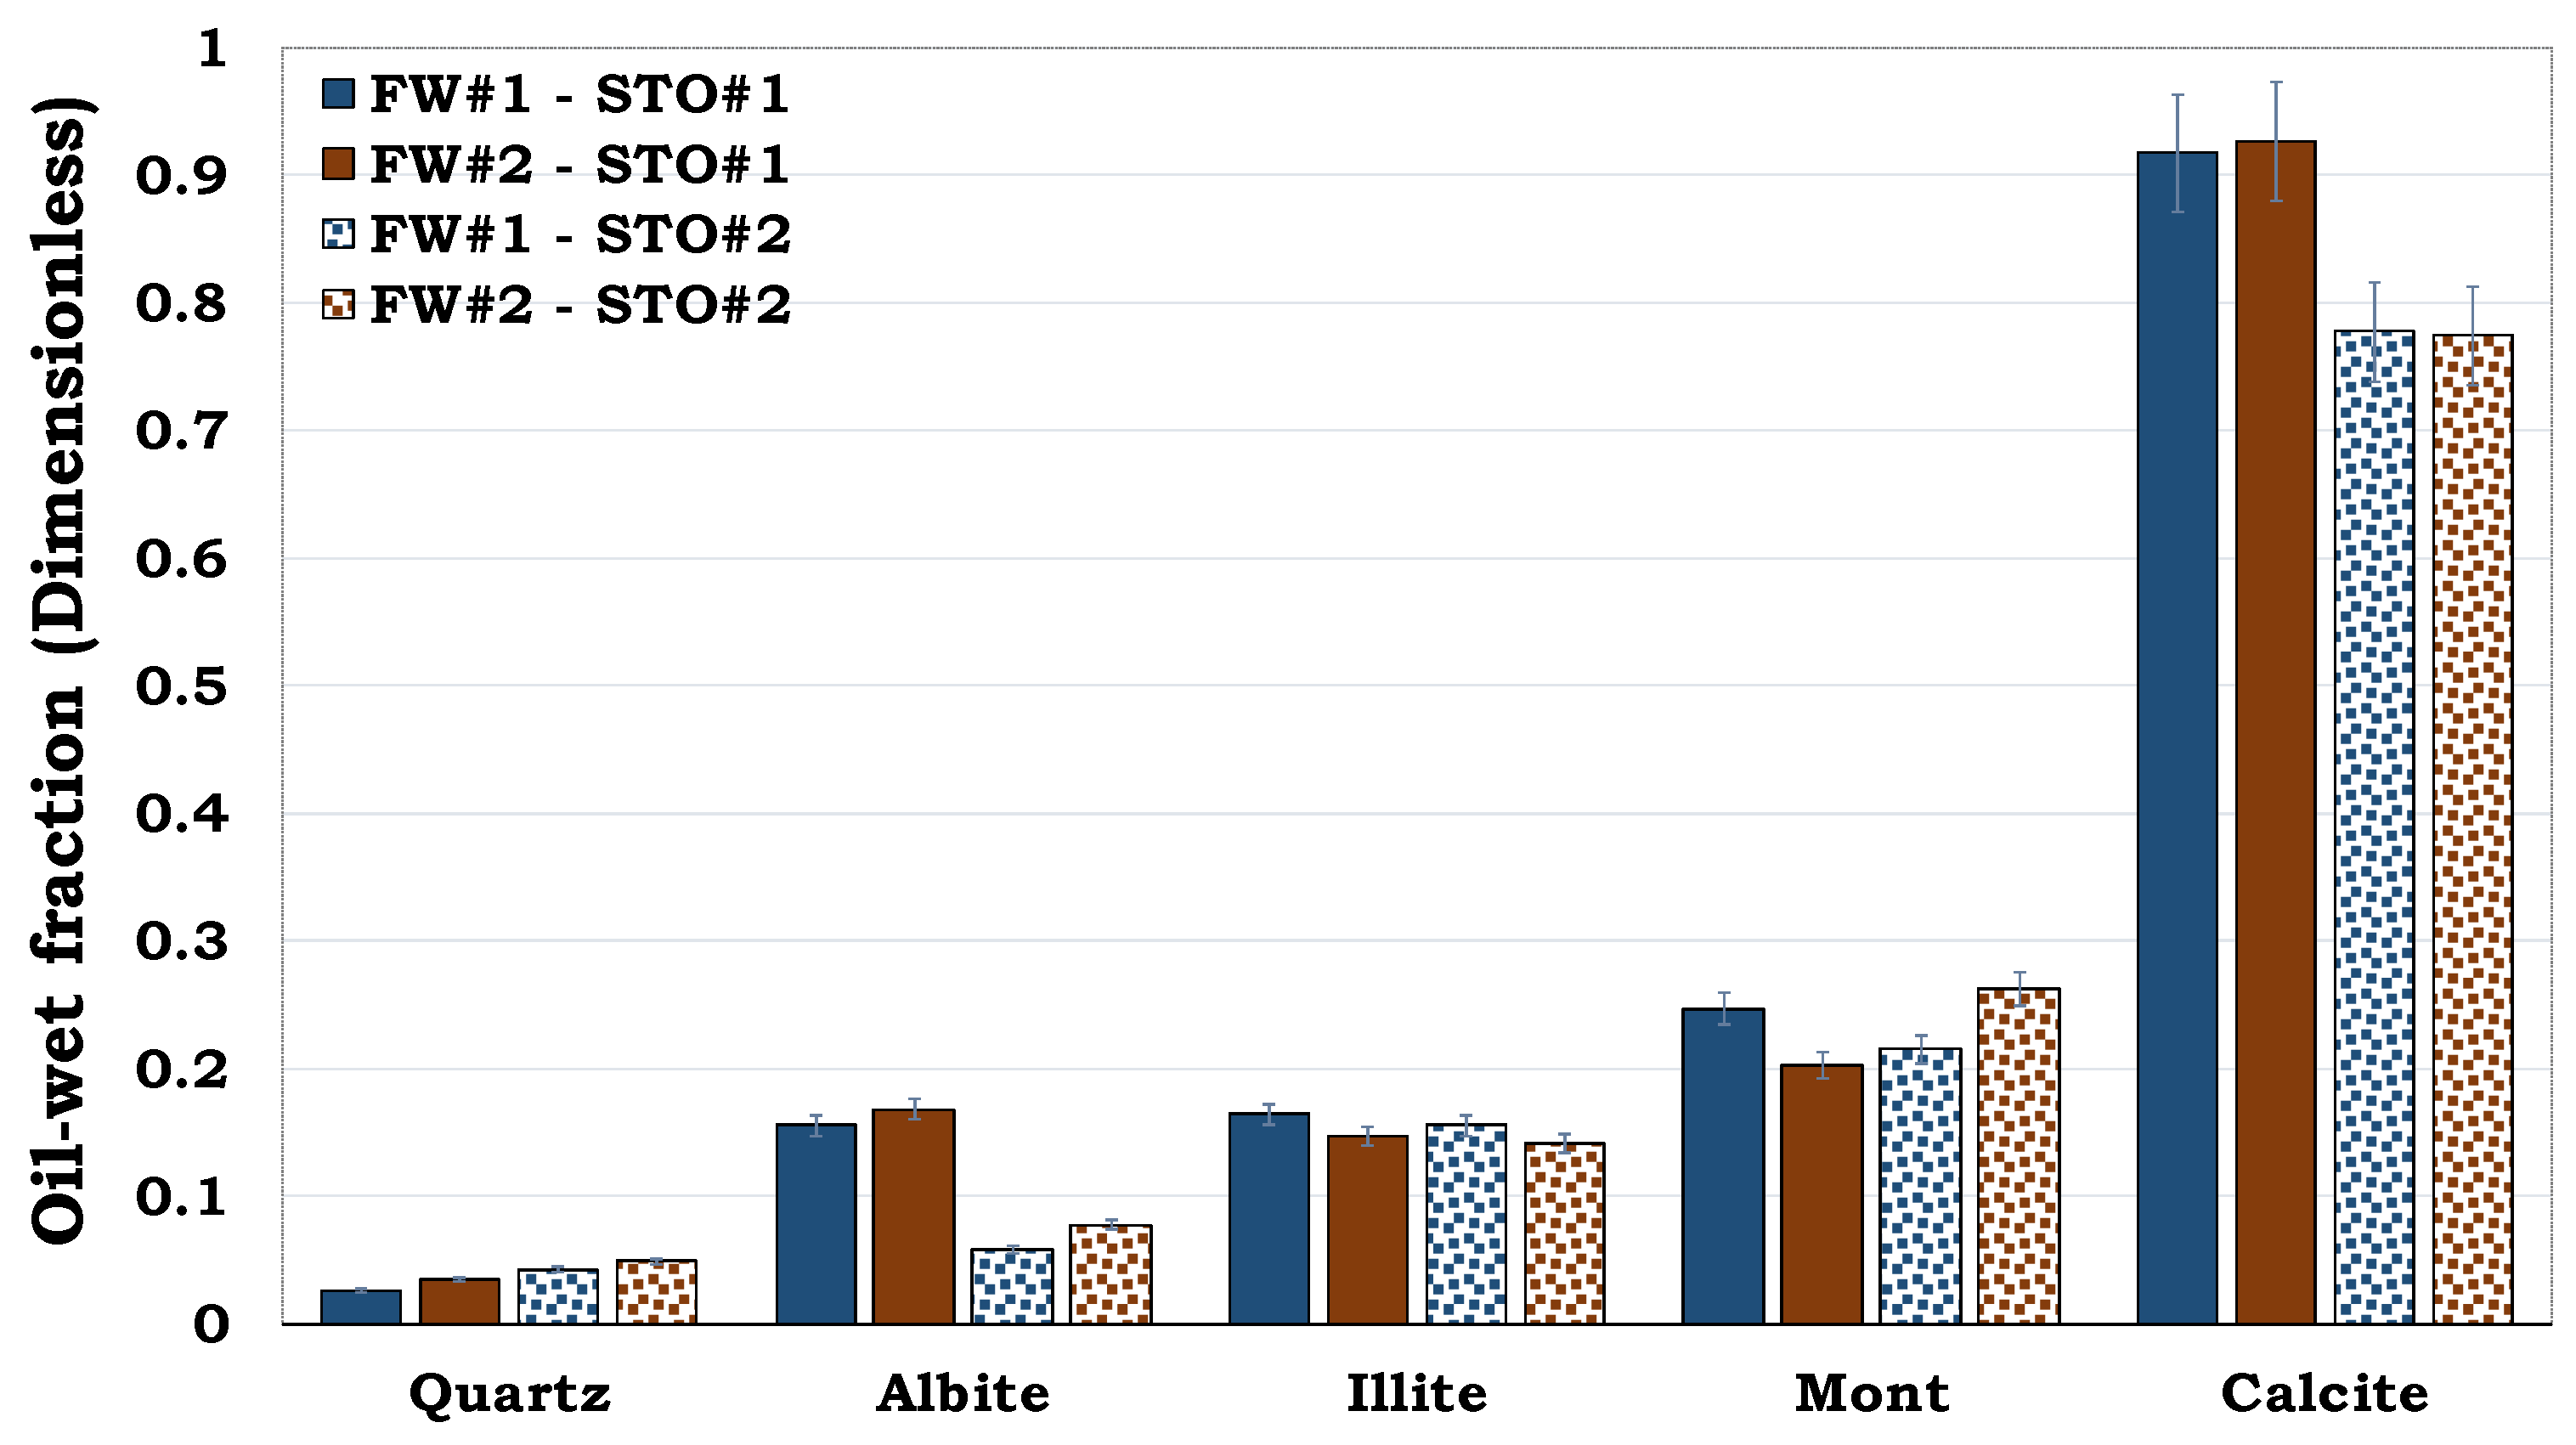
It can be observed from Figure 3 that quartz was more hydrophilic (oil–wet fraction < 0.1), whereas calcite was more hydrophobic (oil–wet fraction > 0.7). Conversely, montmorillonite was observed to be more oil–wet when compared to both illite and albite. Thus, quartz was the least oil–wet, followed by albite, illite, montmorillonite and calcite in that order.
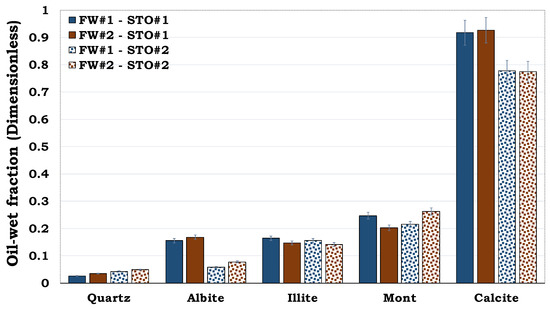
Figure 3.
This figure illustrates the wettability characterization of the reservoir rock mineral using the flotation tests. It can be observed that quartz is strongly hydrophilic, while calcite is strongly hydrophobic.
3.2. Flotation Test Prediction via Our Developed Model
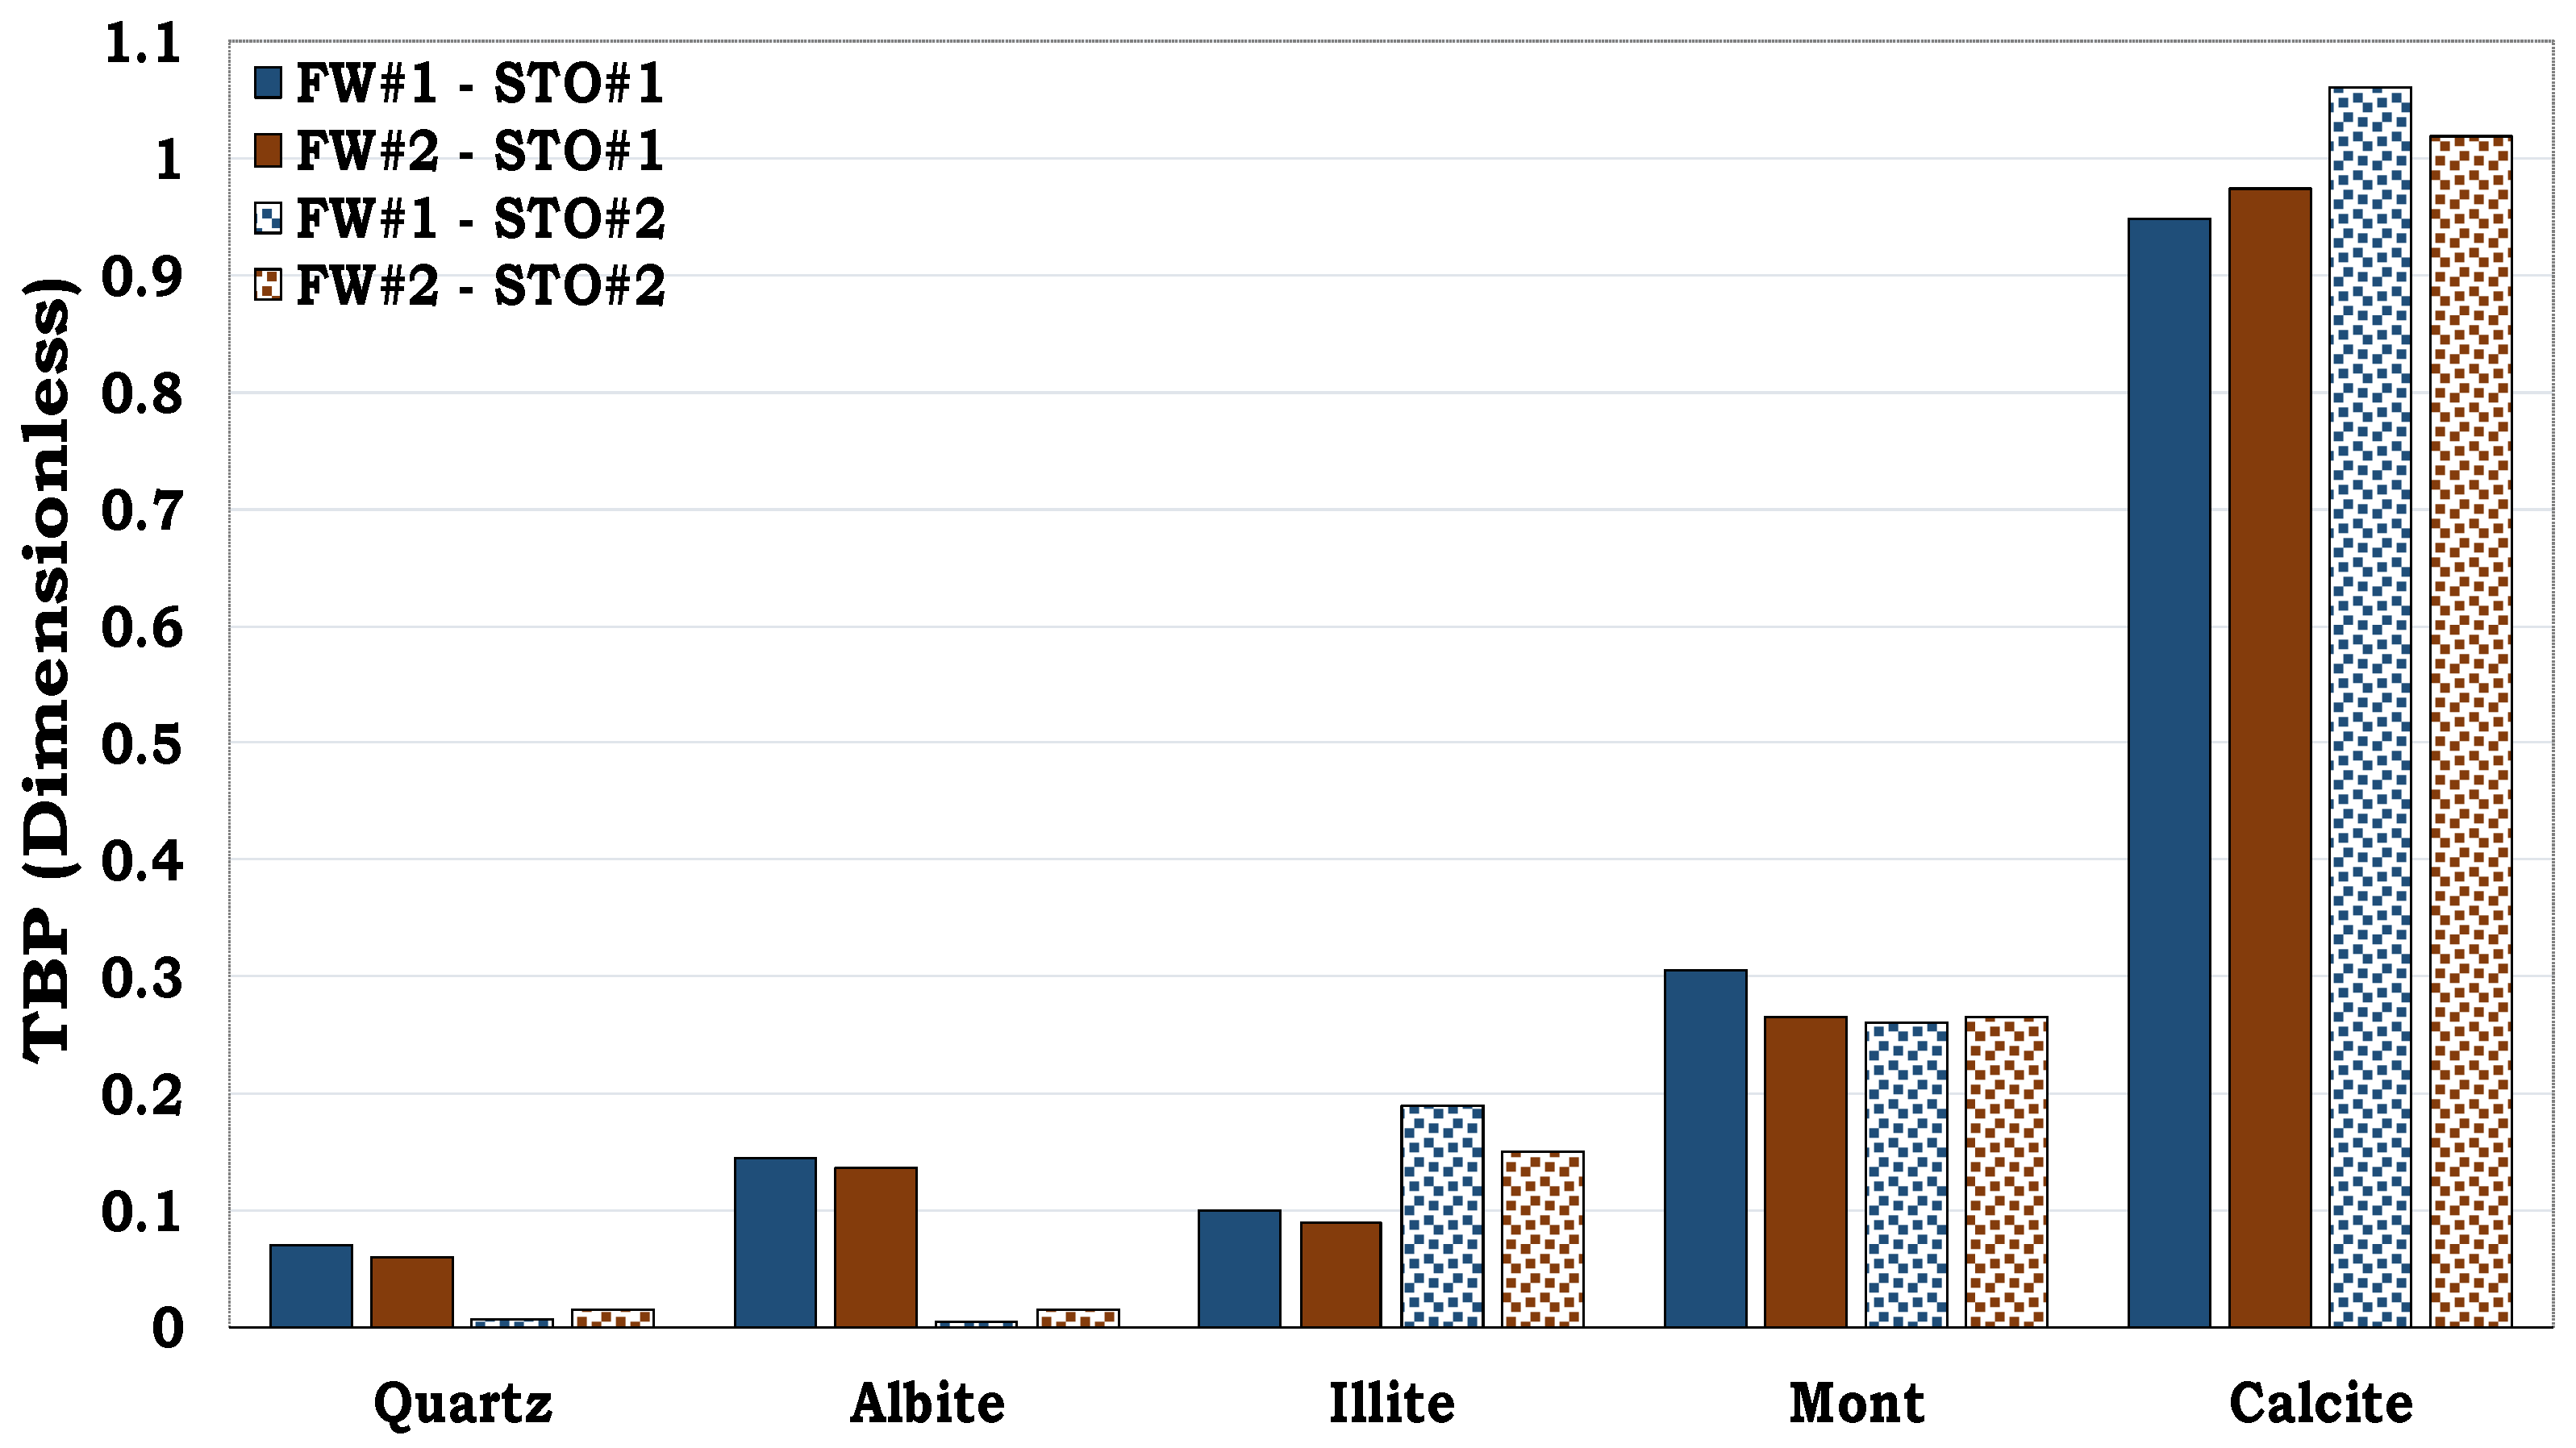
It can be observed that the SCM could capture the trend of the flotation test results. In other words, the ranking of the minerals in the simulations was similar to that observed in the flotation tests (Figure 4).
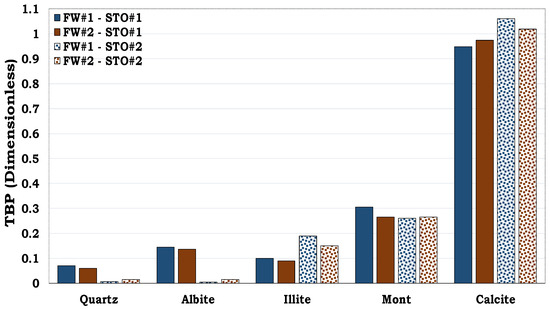
Figure 4.
This figure illustrates the prediction of the oil adsorption proclivities of the dominant minerals during the experiment.
3.3. Mechanisms of Oil Adhesion during the Flotation Test Using Our Developed Model
To appreciate the wettability of the minerals during the experiment, the attractive electrostatic linkages existing at the mineral–fluid interfaces were considered via SCM.
3.3.1. Mechanisms of Oil Adhesion in Quartz
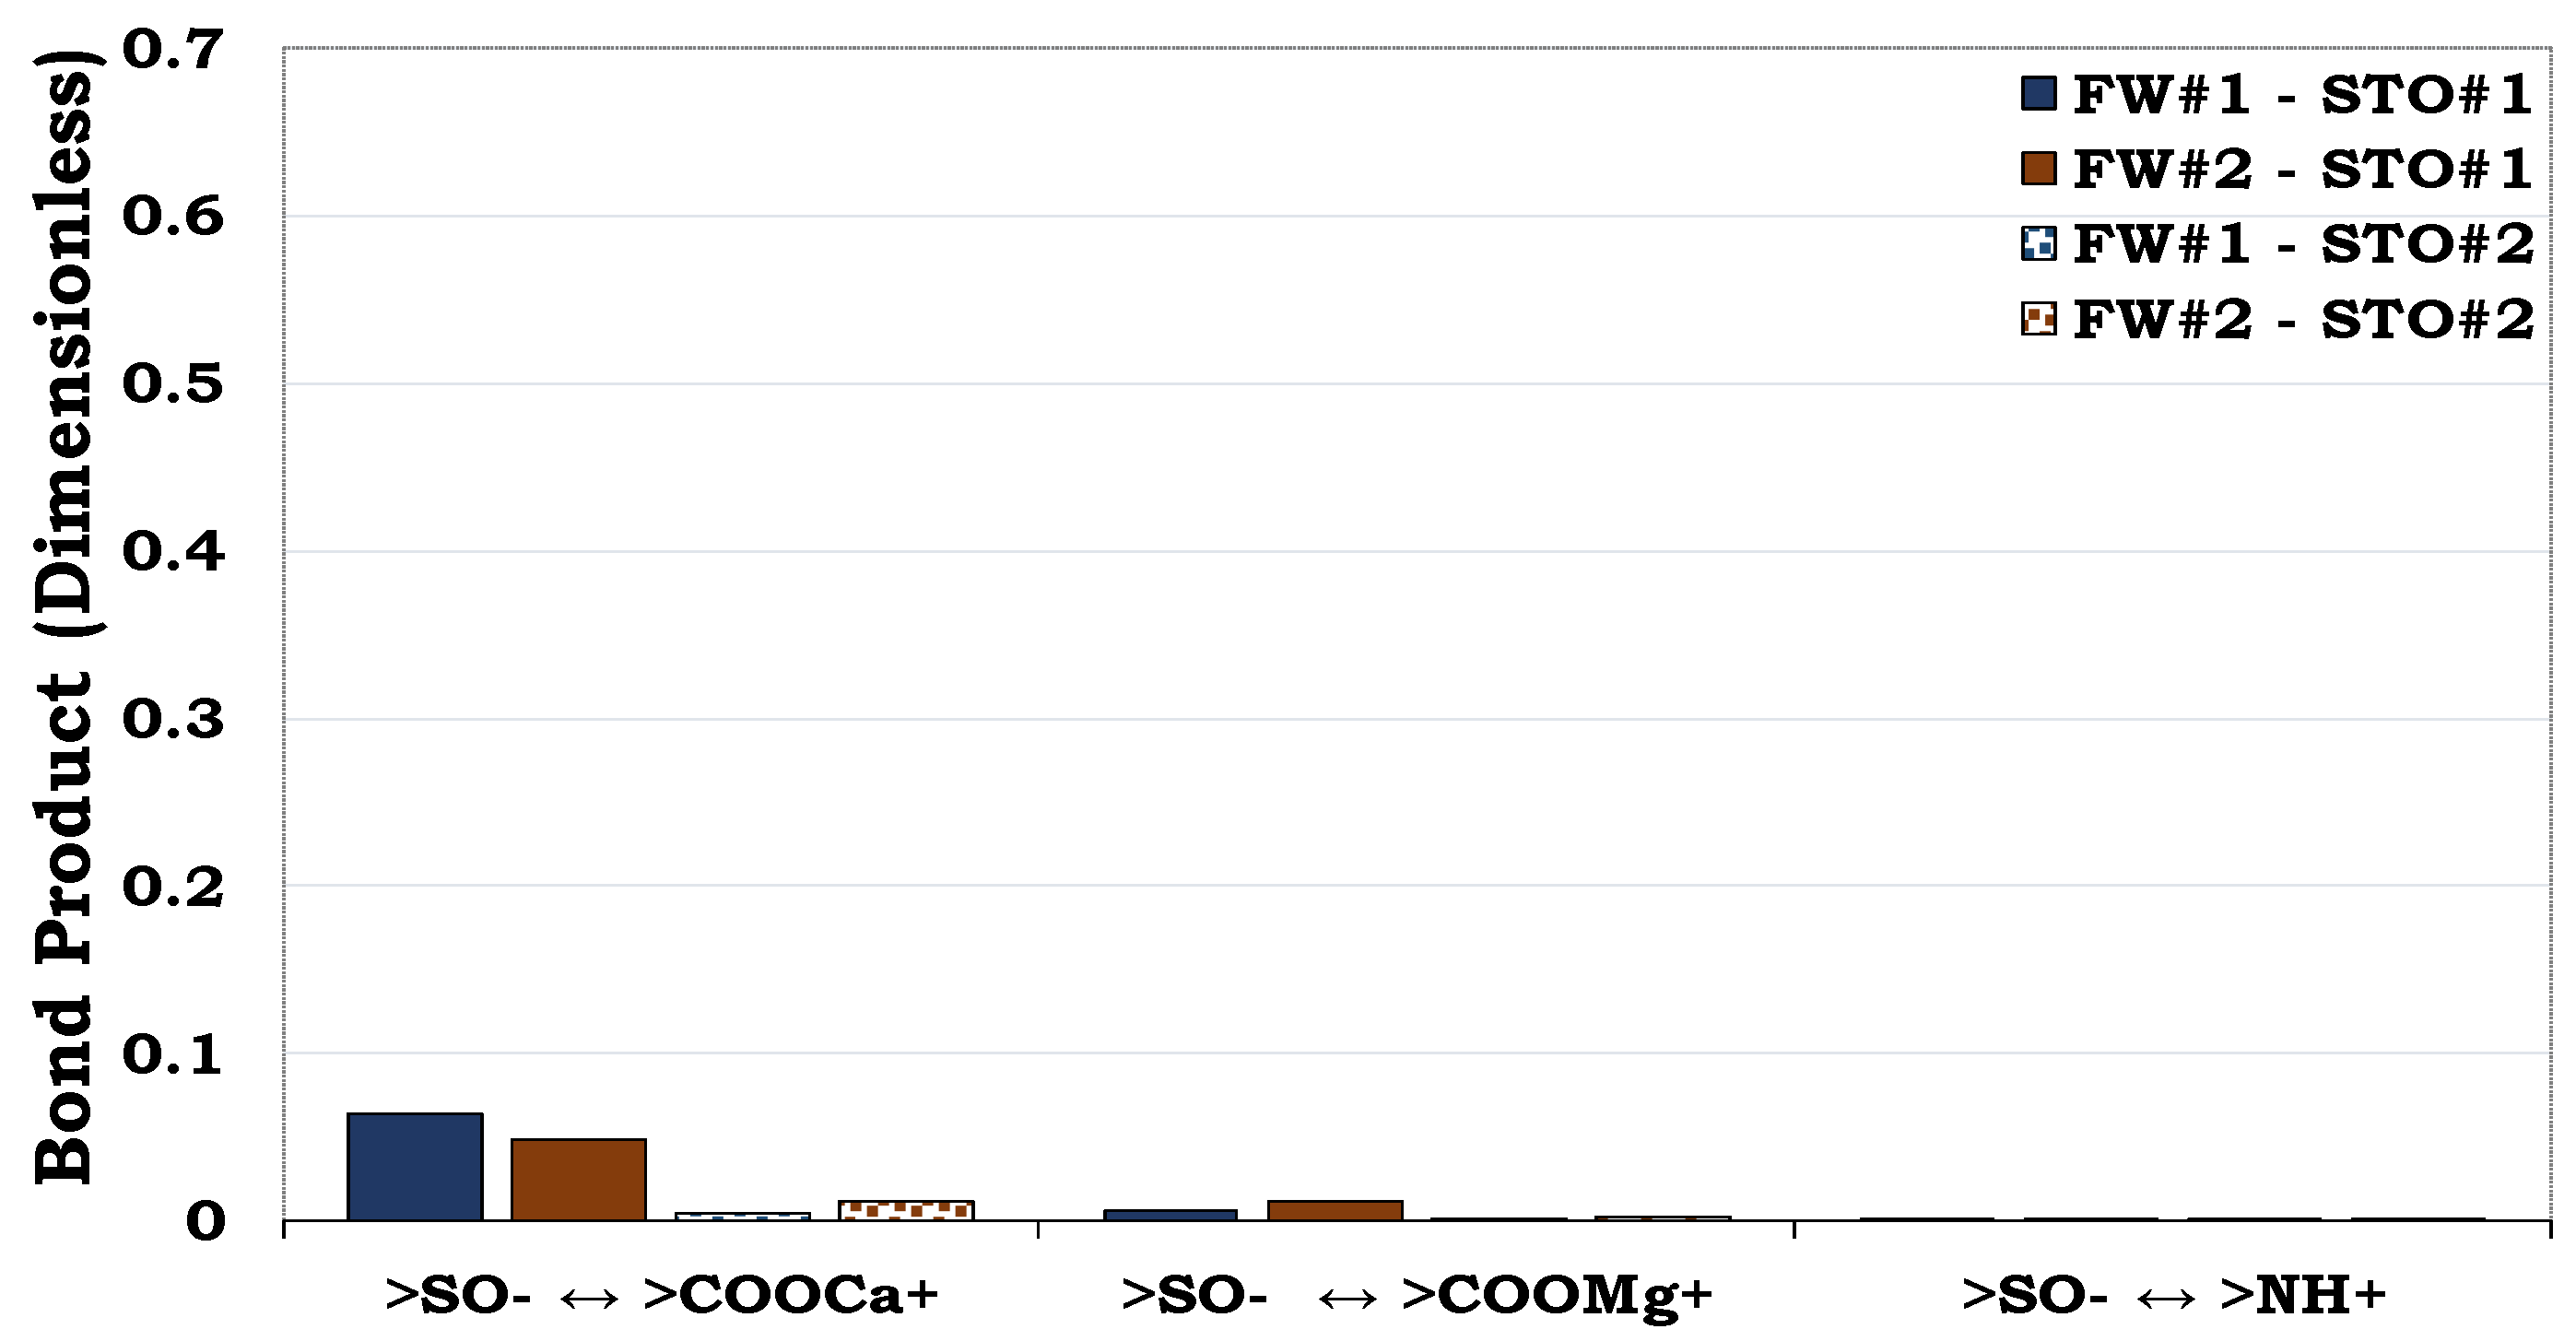
It can be observed that the oil adhesion proclivity of the quartz surface was very small, as depicted by its low dominant BP (<0.1). In addition, considering the quartz–FW and STO–FW interactions, it became obvious that the bridging of the two anionic interfacial charges by Ca2+ and Mg2+ dominated the adsorption of oil onto the rock/mineral surface. Considering the carboxylate and basic components (NH+) of the STO, it can be observed that the effect of the NH+ is not pronounced as compared to the COO−.
3.3.2. Mechanisms of Oil Adhesion in Albite
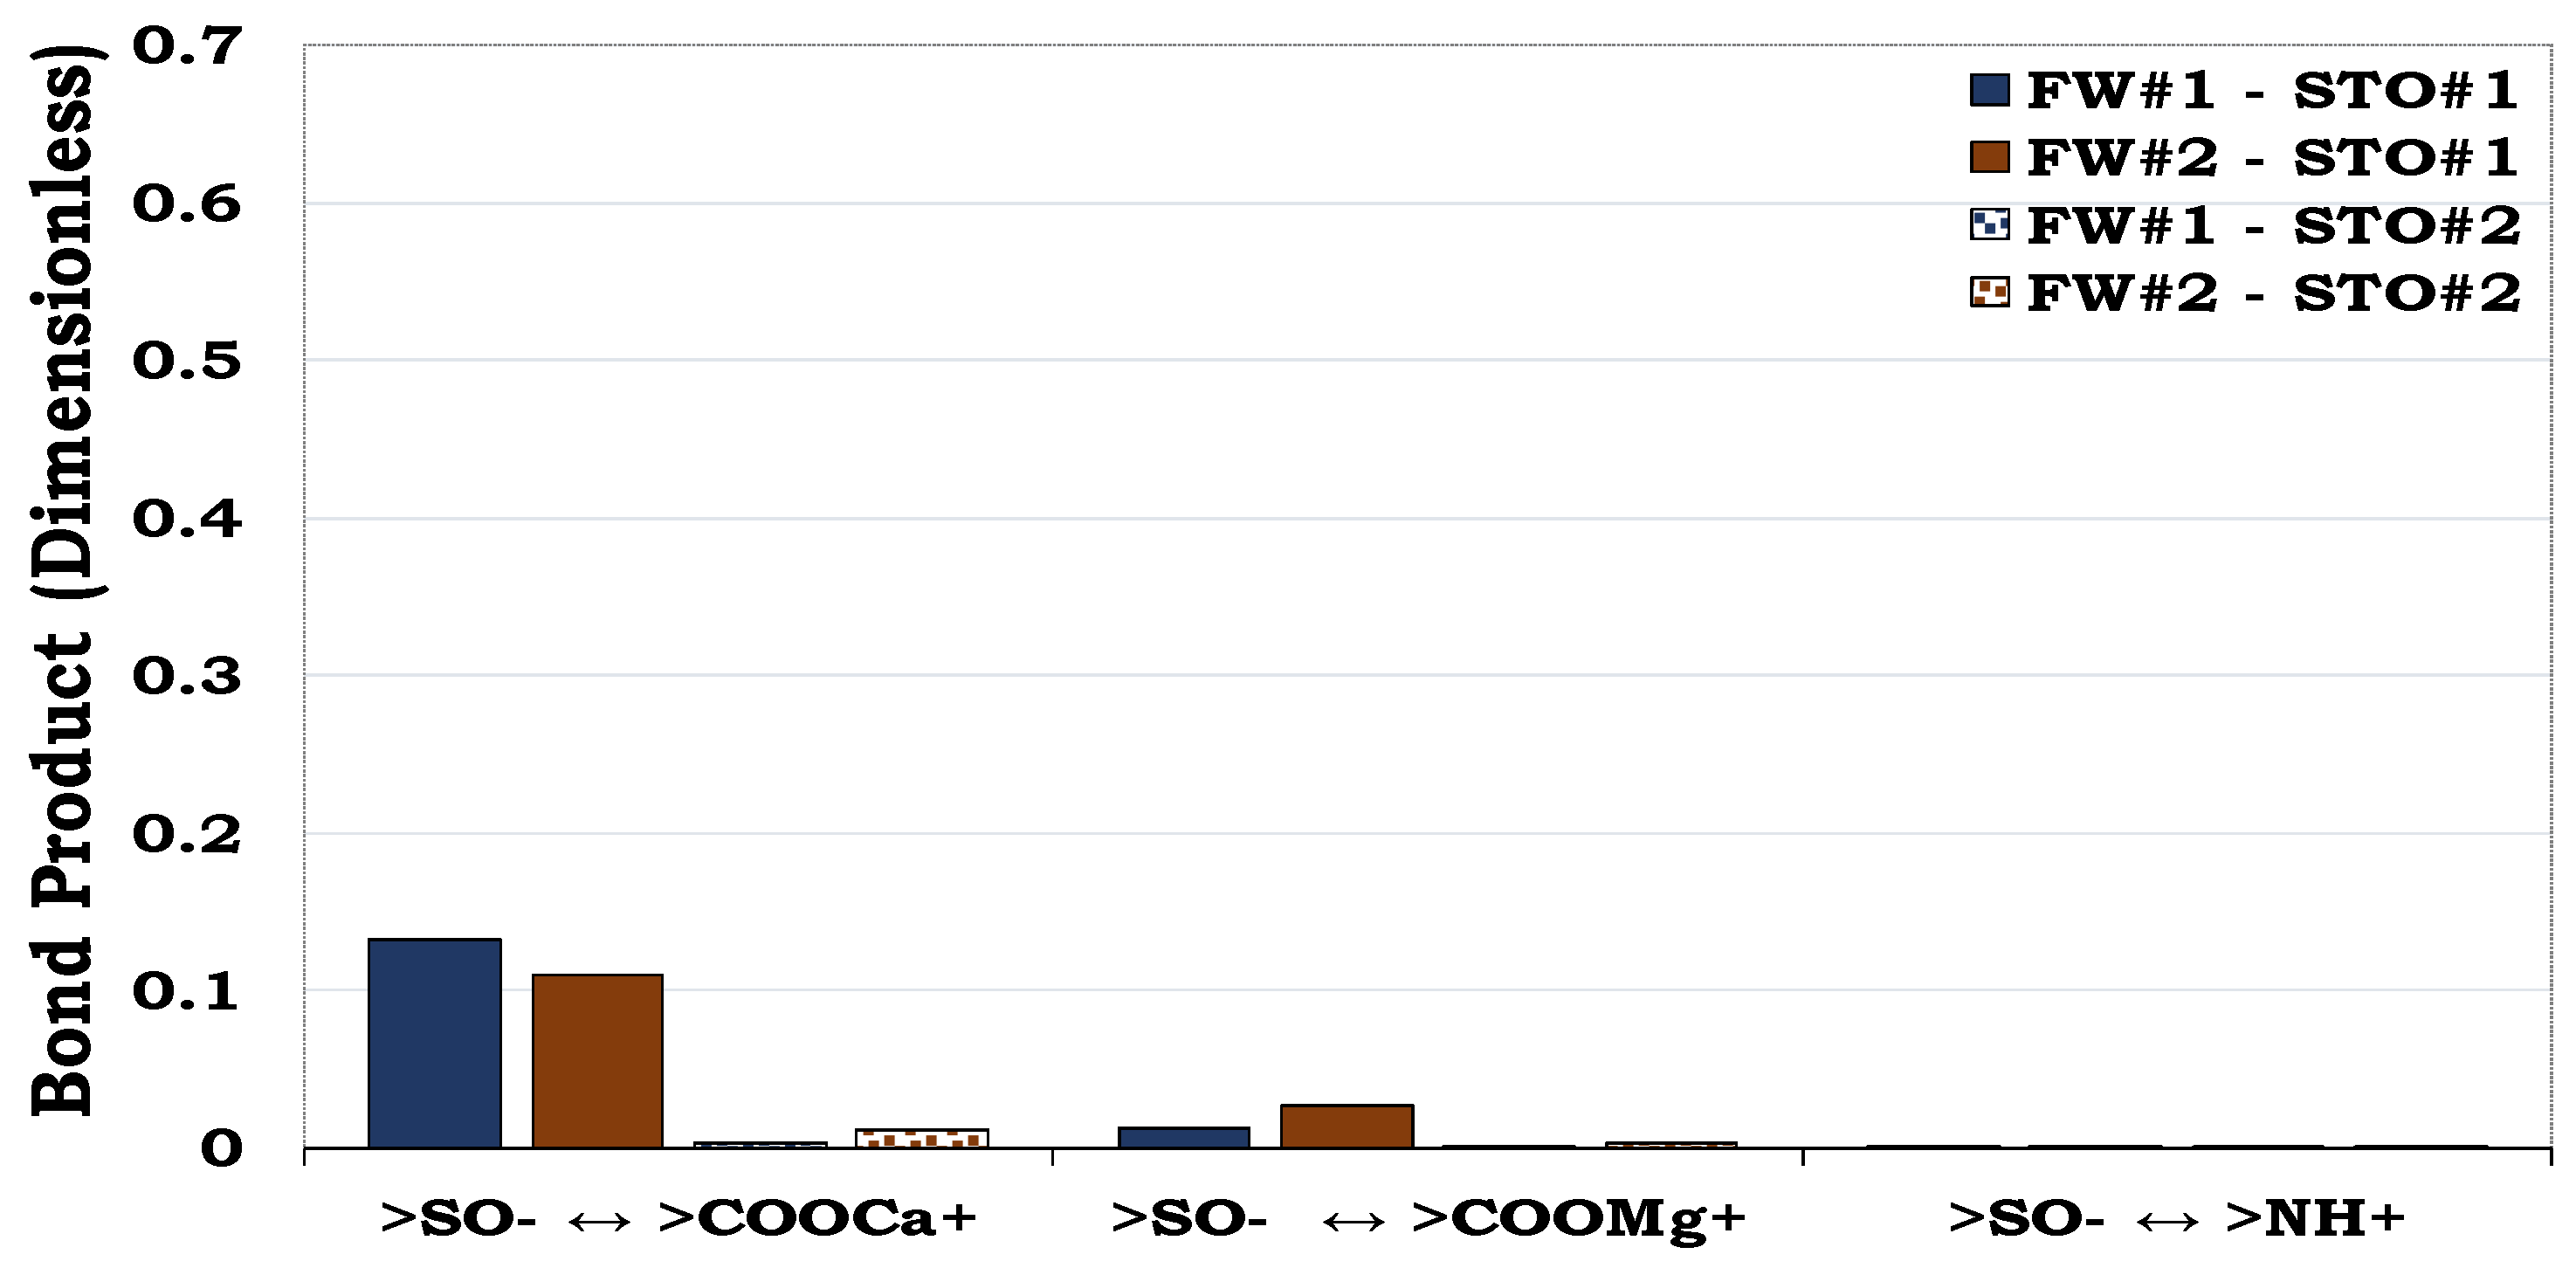
Albite was slightly more oil–wet than quartz, as depicted by their BP (<0.1 and ≈0.1 in Figure 5 and Figure 6, respectively). Similar to the quartz, the cation bridging mechanism was the main oil adhesion mechanism for the albite–fluid systems. As observed for quartz, the magnitude of the oil adsorbed onto the surface of the albite from the NH+ was insignificant as compared to its carboxylic acid counterpart.
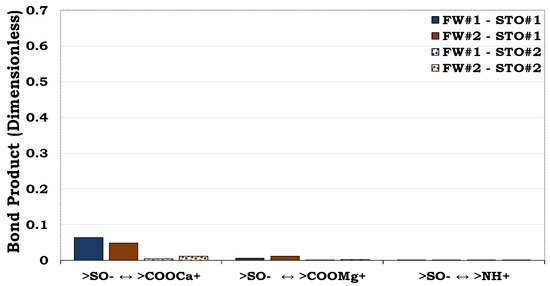
Figure 5.
This figure illustrates the attractive electrostatic forces at the quartz–FW and the oil–brine interface with dissimilar polarities.
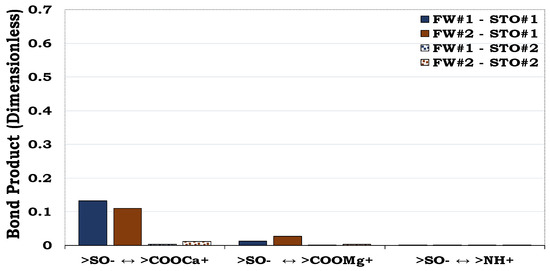
Figure 6.
This figure illustrates the oil adsorption mechanism for the albite–fluid systems with dissimilar interfacial polarity. Albite is relatively less hydrophilic (i.e., BP ≈ 0.1) than quartz (<0.1, see Figure 5).
3.3.3. Mechanisms of Oil Adhesion in Illite
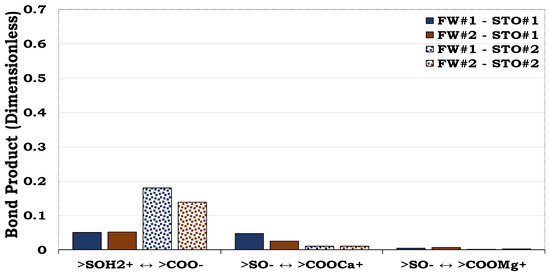
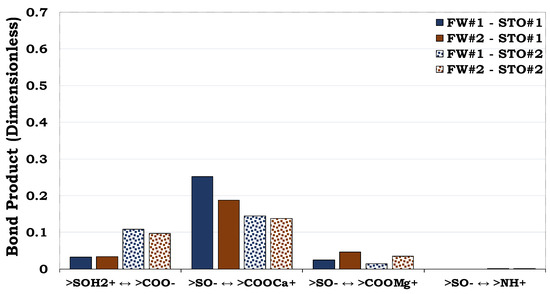
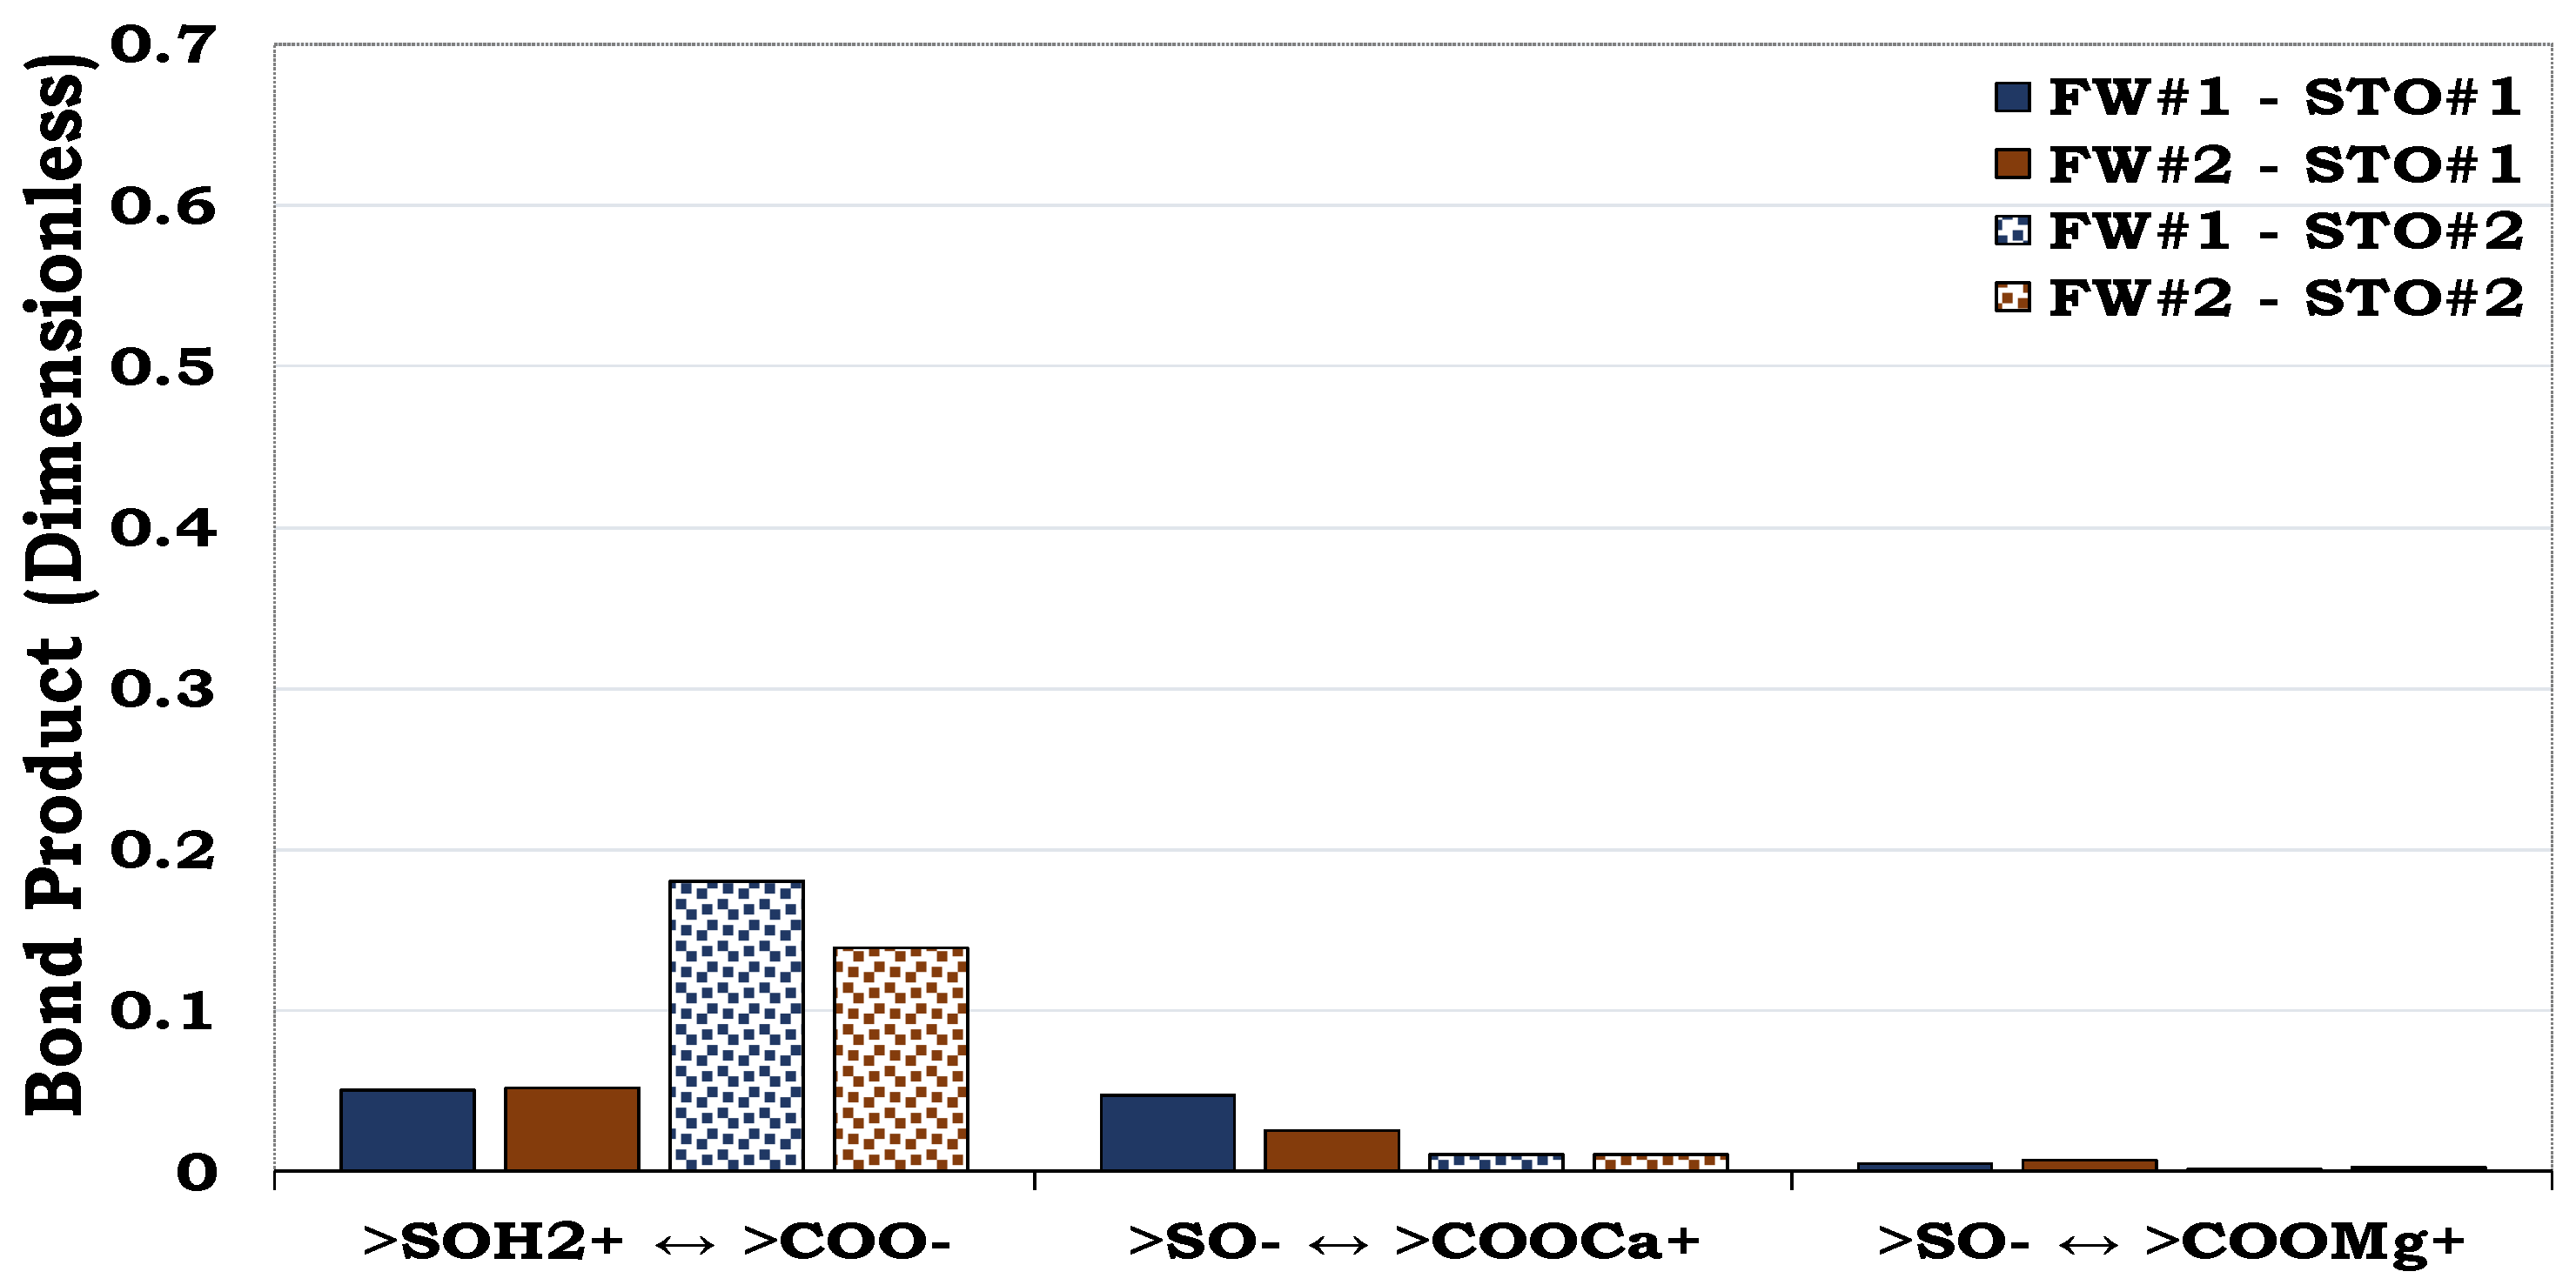
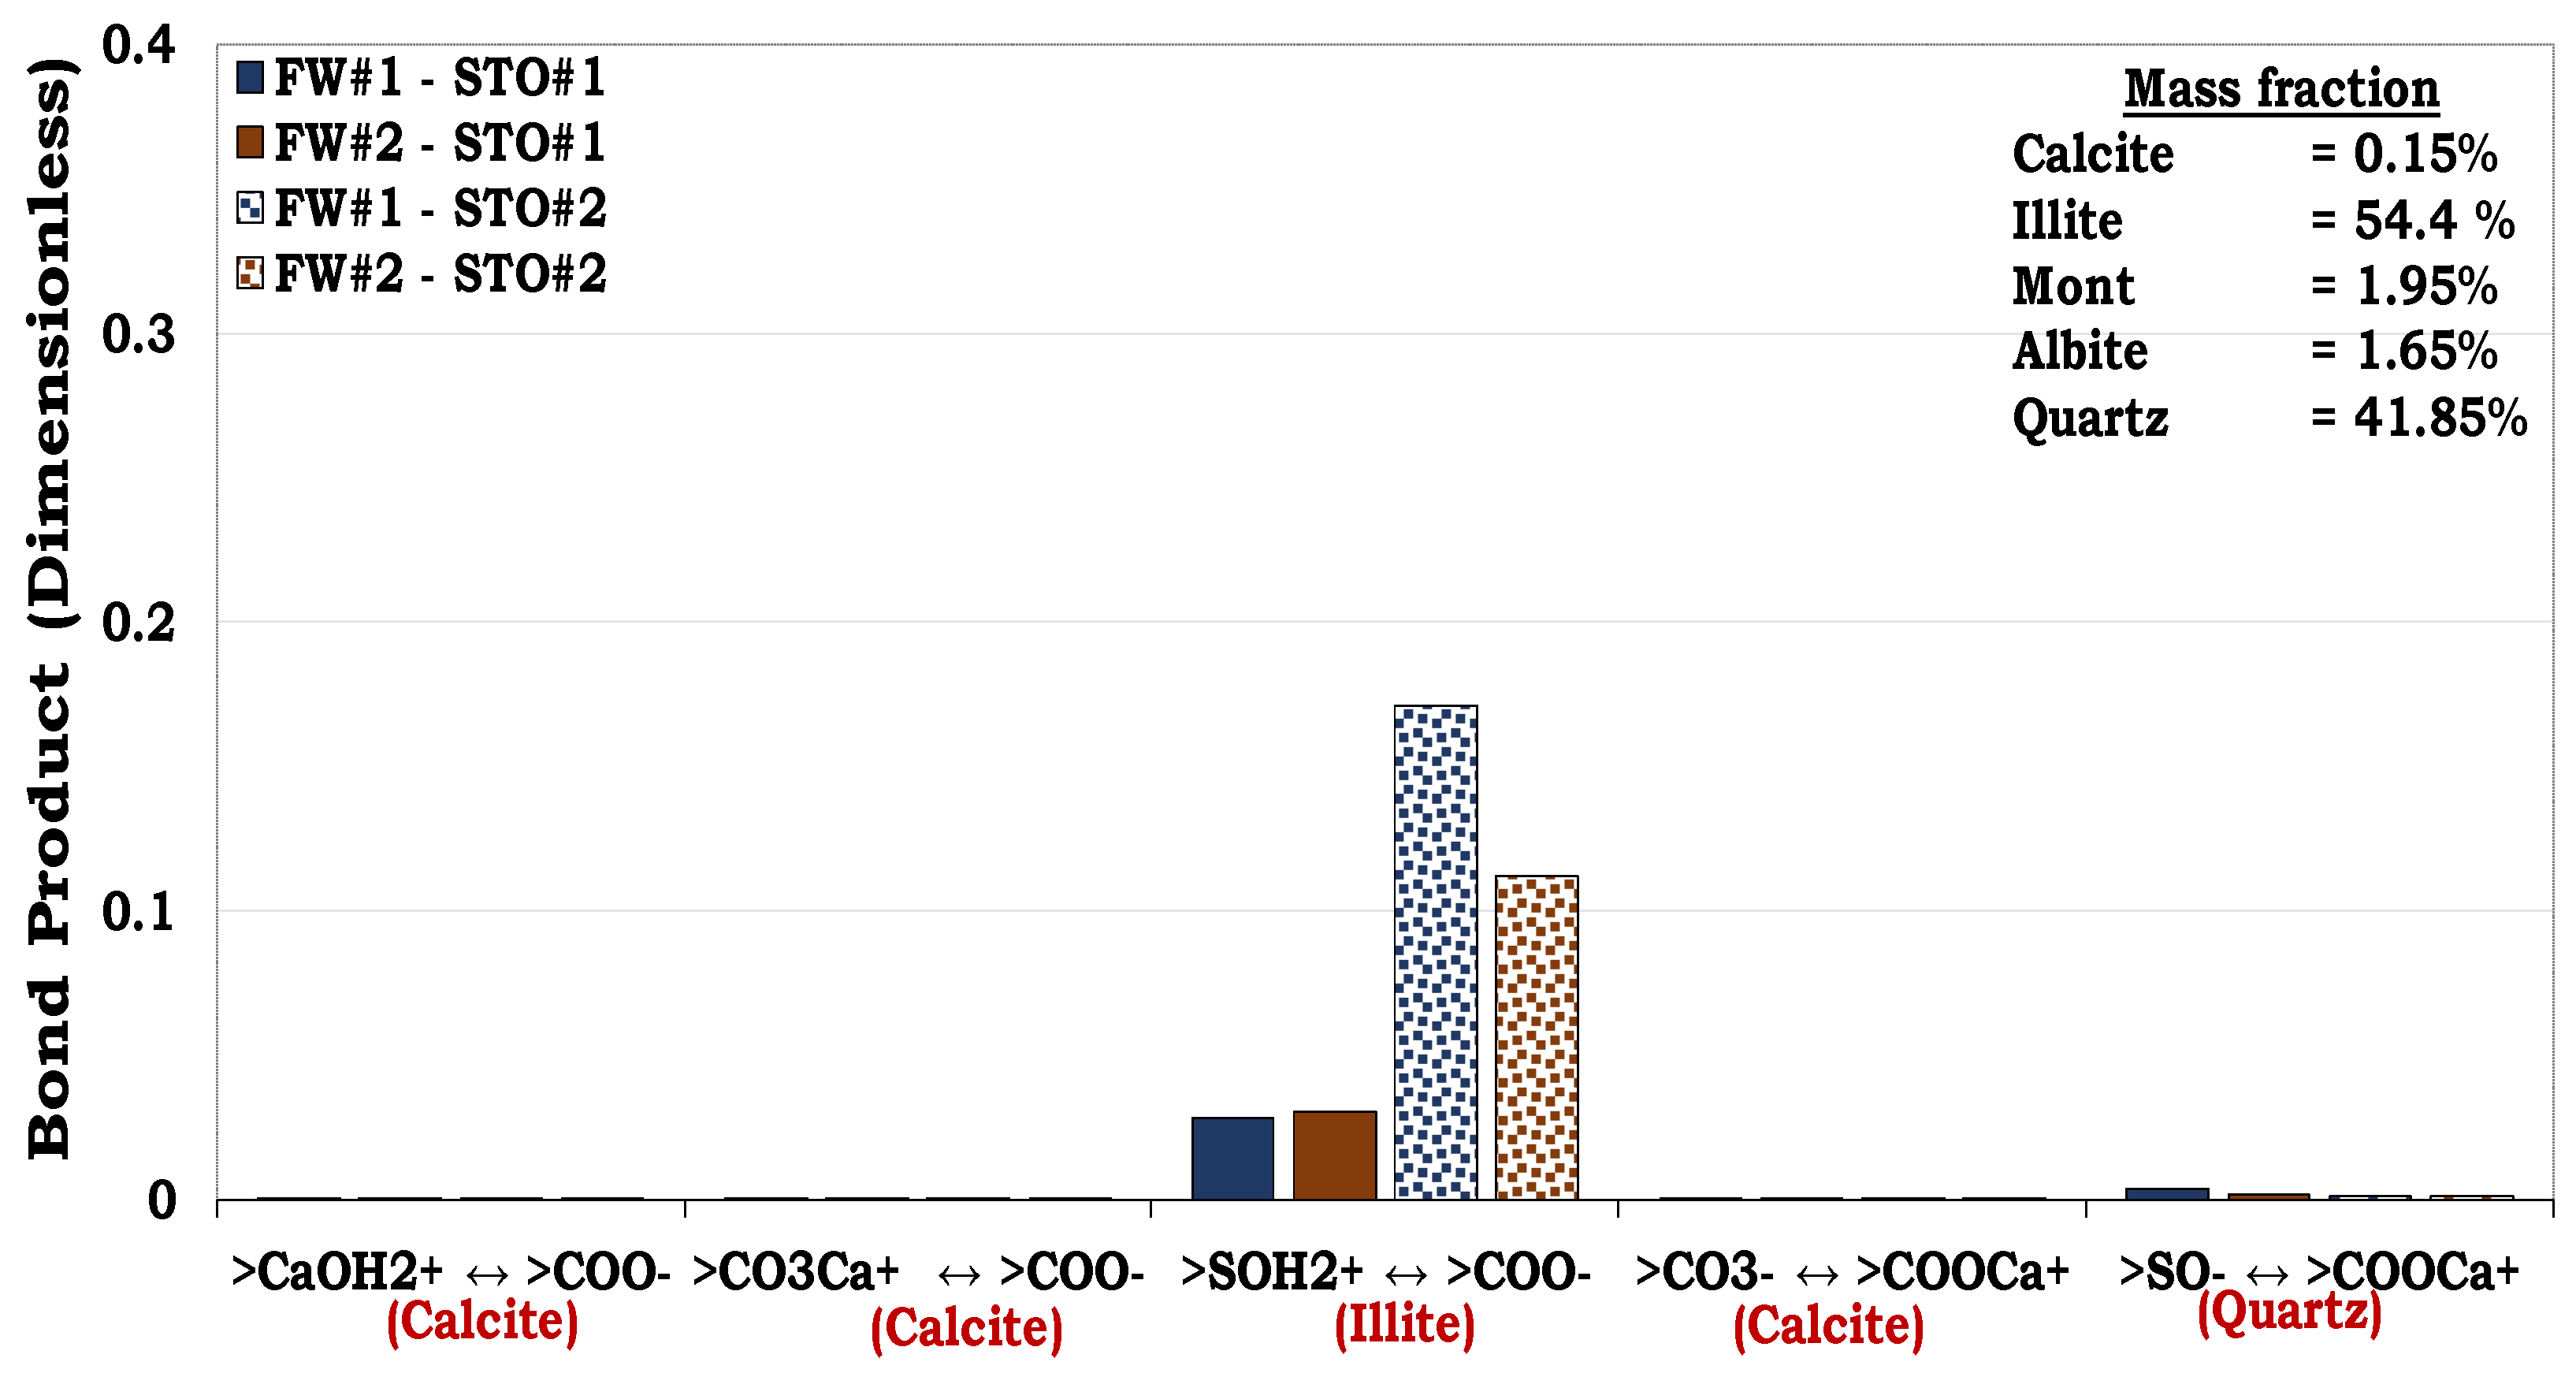
Illite was less water–wet (BP ≈ 0.2) when compared to albite and quartz, as depicted in Figure 5, Figure 6 and Figure 7. Contrary to the oil adhesion mechanisms of quartz and albite, the illite-fluid systems were dominated by the adsorption of the anionic polar oil component (>COO−) onto the cationic illite site (>SOH2+). To add to the above, the linking of the anionic illite surface (>SO−) and the negative oil surface (>COO−) by Ca2+ and Mg2+ also occurred. As observed in the earlier results (Figure 5 and Figure 6), the contributions of NH+ were also negligible when compared to >COO−.
3.3.4. Mechanisms of Oil Adsorption in Montmorillonite
Montmorillonite was more hydrophobic (BP ≈ 0.25) when compared to illite, albite and quartz. Unlike the oil adhesion onto illite, which was dominated by the adhesion of >COO− onto >SOH2+ (Figure 7), the oil adhesion onto montmorillonite was dominated by cation bridging (Figure 8). In other words, the dominant oil adhesion mechanism of montmorillonite was a result of the bridging of the anionic montmorillonite sites (>SO−) and the carboxylate (>COO−) by Ca2+ and Mg2+. To add to the above, the influence of the >NH+ was not significant as when compared to the carboxylate (>COO−), as confirmed by Figure 5 and Figure 6.
3.3.5. Mechanisms of Oil Adhesion in Calcite
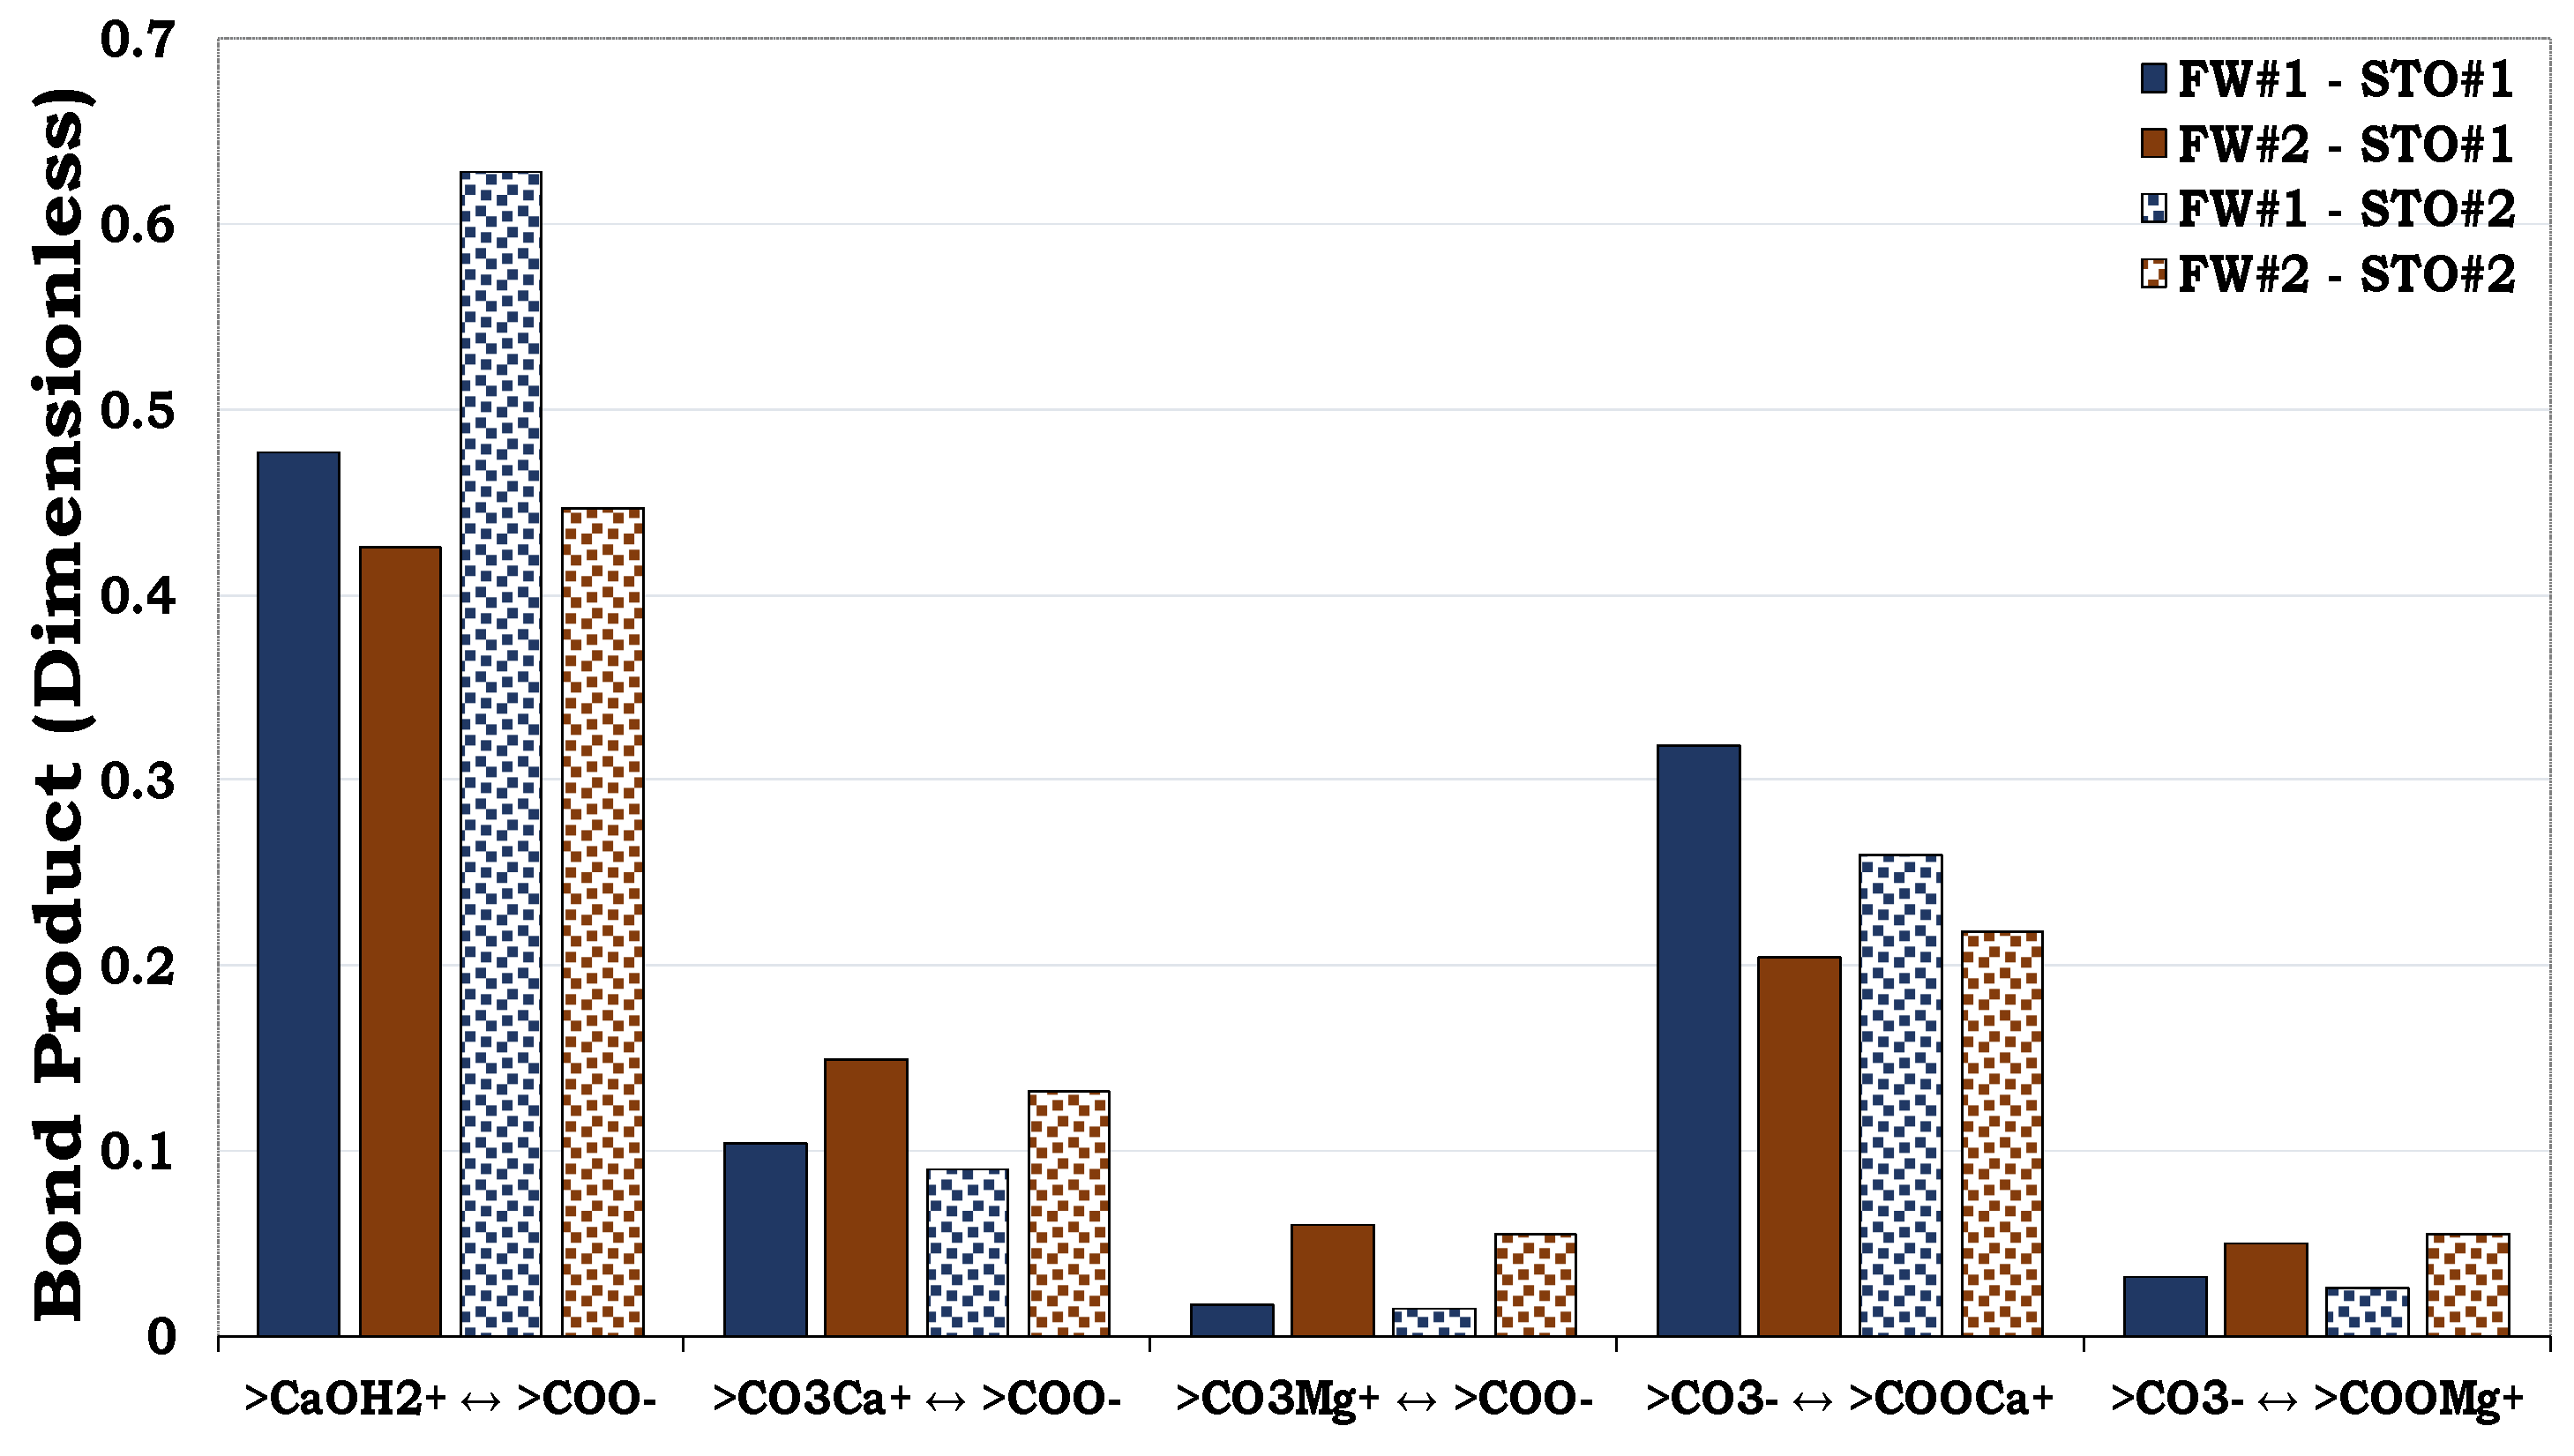
Calcite was more hydrophobic (BP ≈ 0.6) than montmorillonite, illite, albite and quartz. Like the adsorption of >COO− with an anionic surface charge onto illite (>SOH2+) and montmorillonite (>SOH2+), adsorption of carboxylic acid onto the positive calcite site (>CaOH2+) also took place (Figure 9). However, the BP for the calcite (>CaOH2+ ↔ >COO−) was more distinct than that observed in the illite and montmorillonite (>SOH2+ ↔ >COO−), thus confirming the hydrophobic nature of the former. Furthermore, oil adhesion resulting from cation bridging also occurred, as observed for the other minerals. As seen in the other mineral/brine/oil interactions, the role played by >NH+ in the oil adsorption was also negligible when compared to the >COO−.
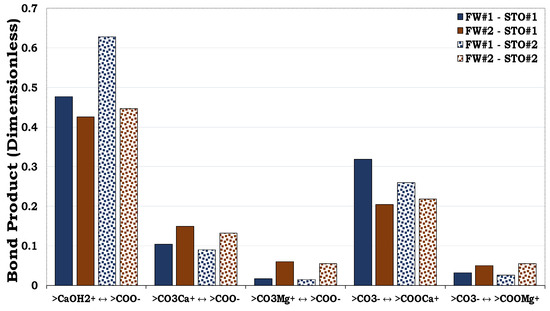
Figure 9.
This figure illustrates the oil adhesion mechanism in calcite–fluid systems with dissimilar inter facial charges. Calcite is strongly hydrophobic as a result its high BP (≈ 0.6) as compared to quartz (BP < 0.1, Figure 5), albite (BP ≈ 0.1, Figure 6), illite (BP ≈ 0.2, Figure 7) and montmorillonite (BP ≈ 0.3, Figure 8).
3.4. Reservoir Rock Flotation Experiment Results
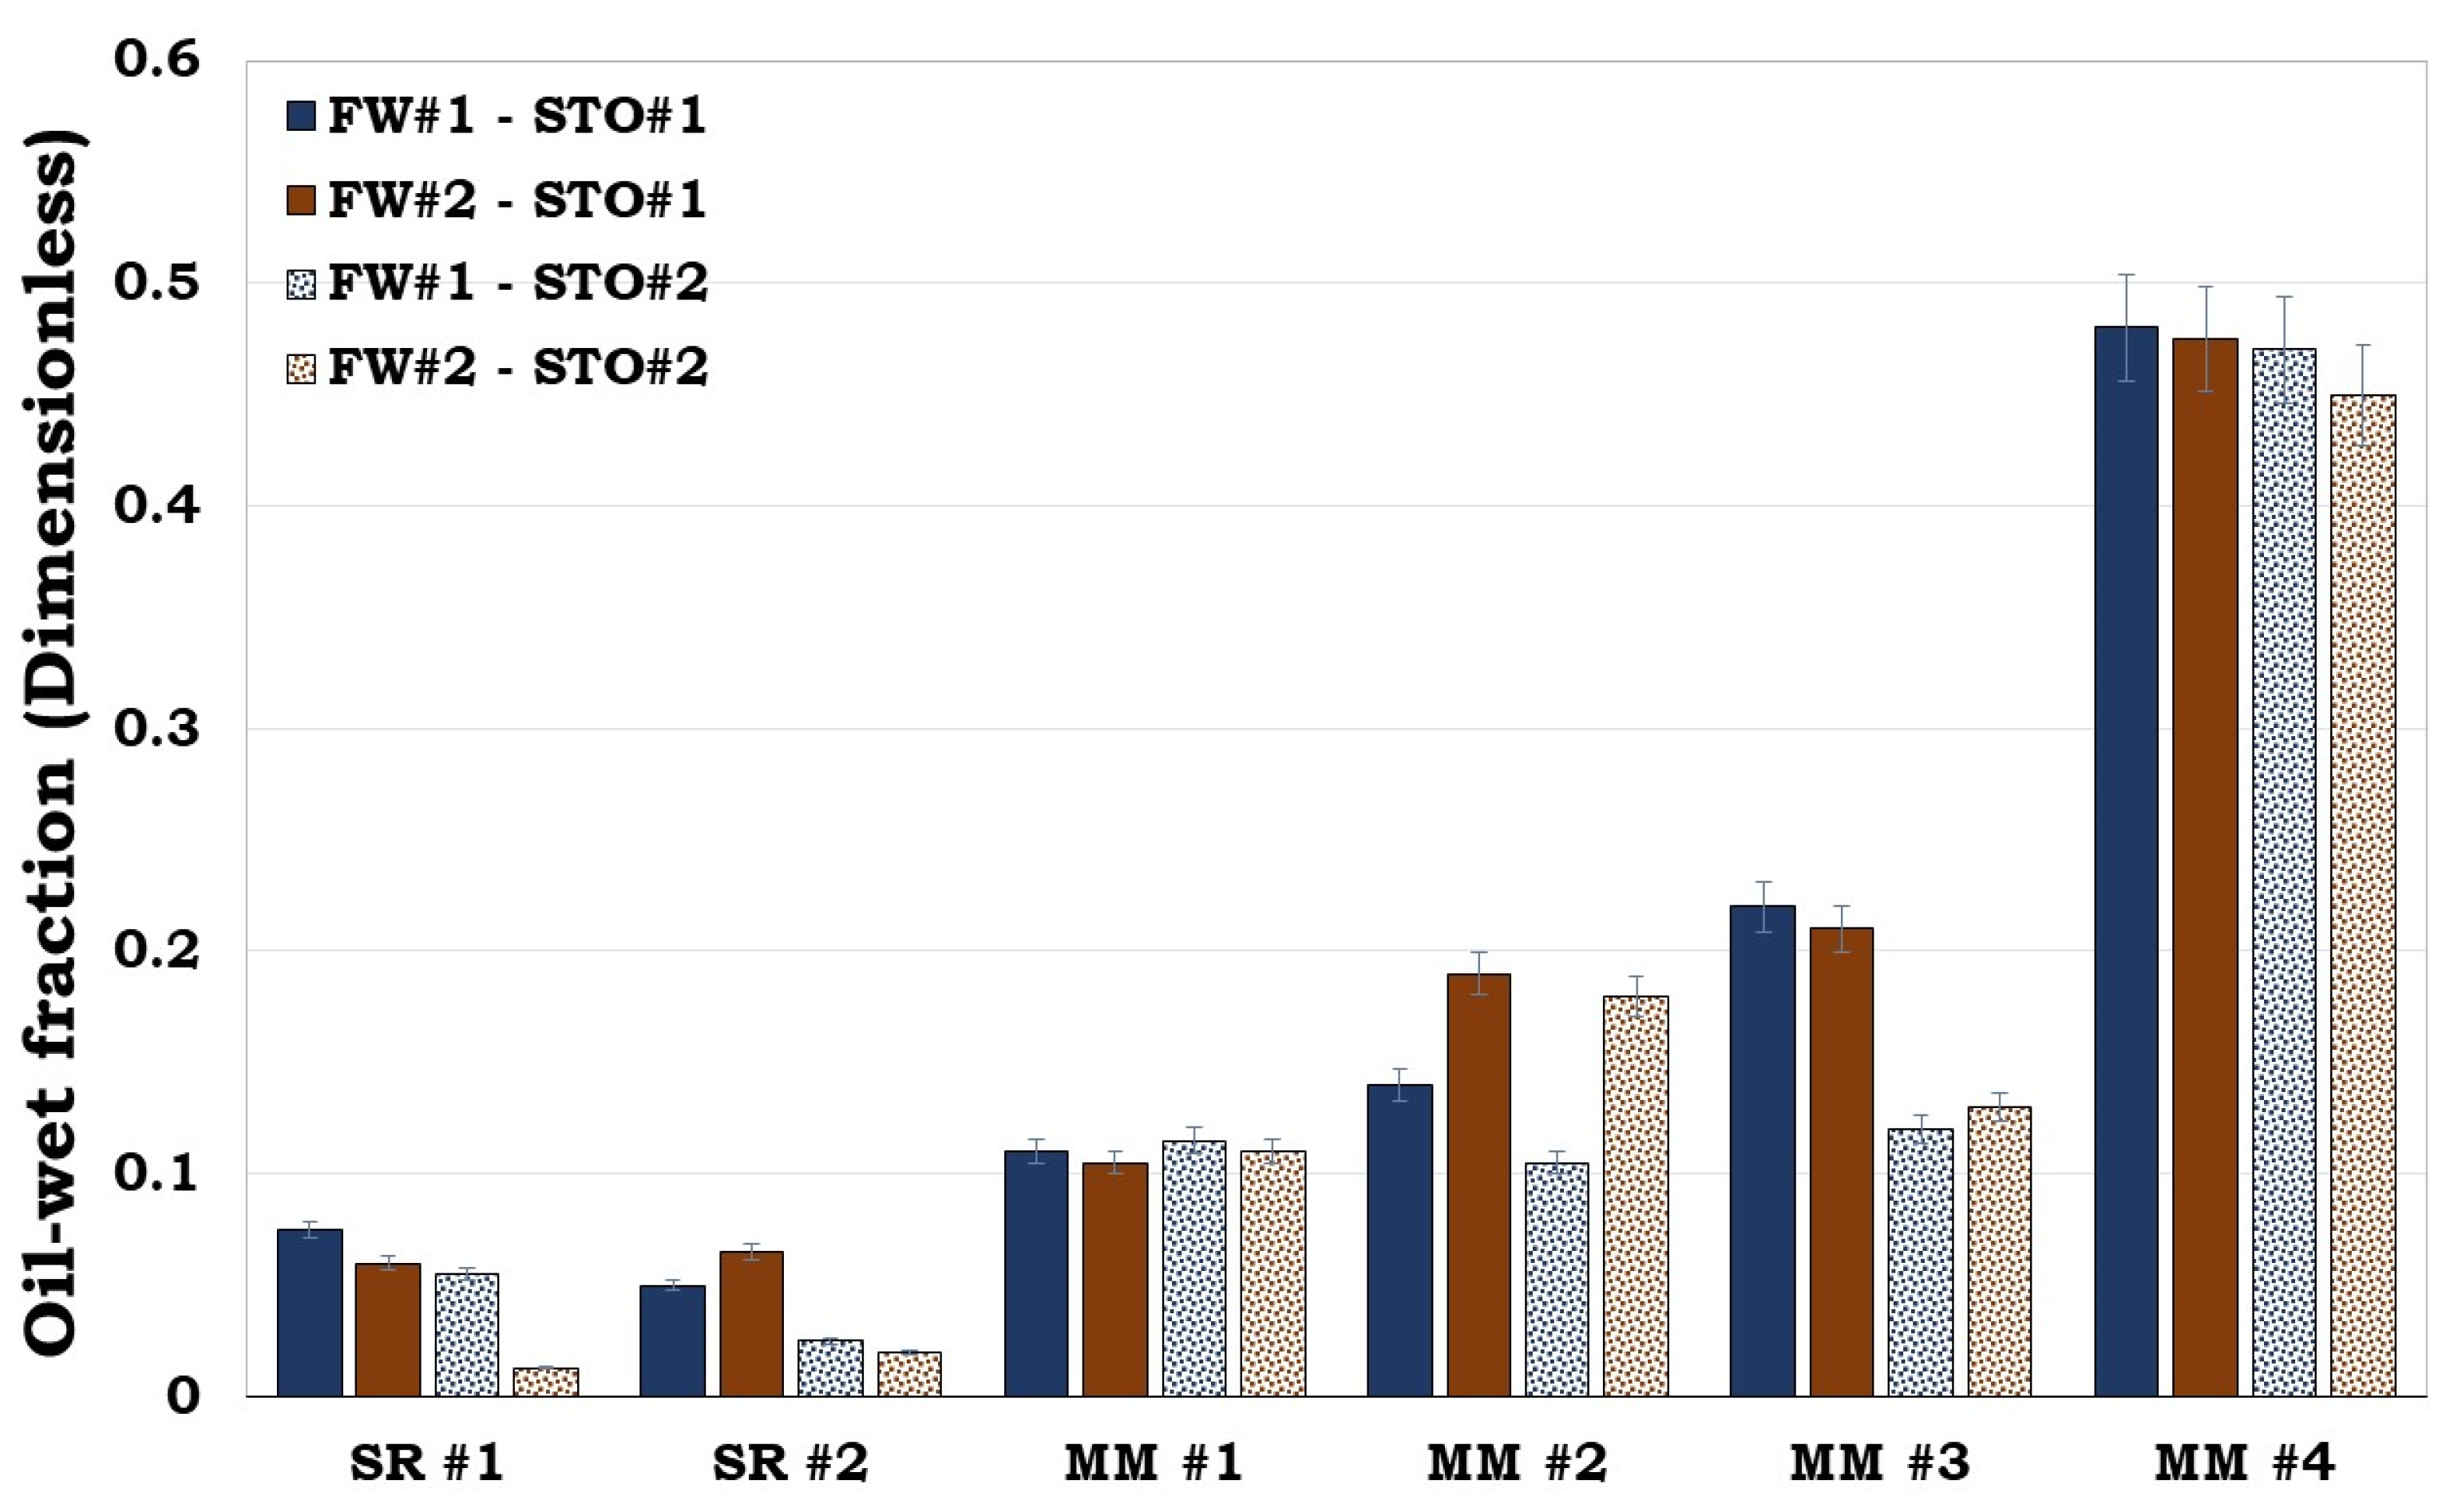
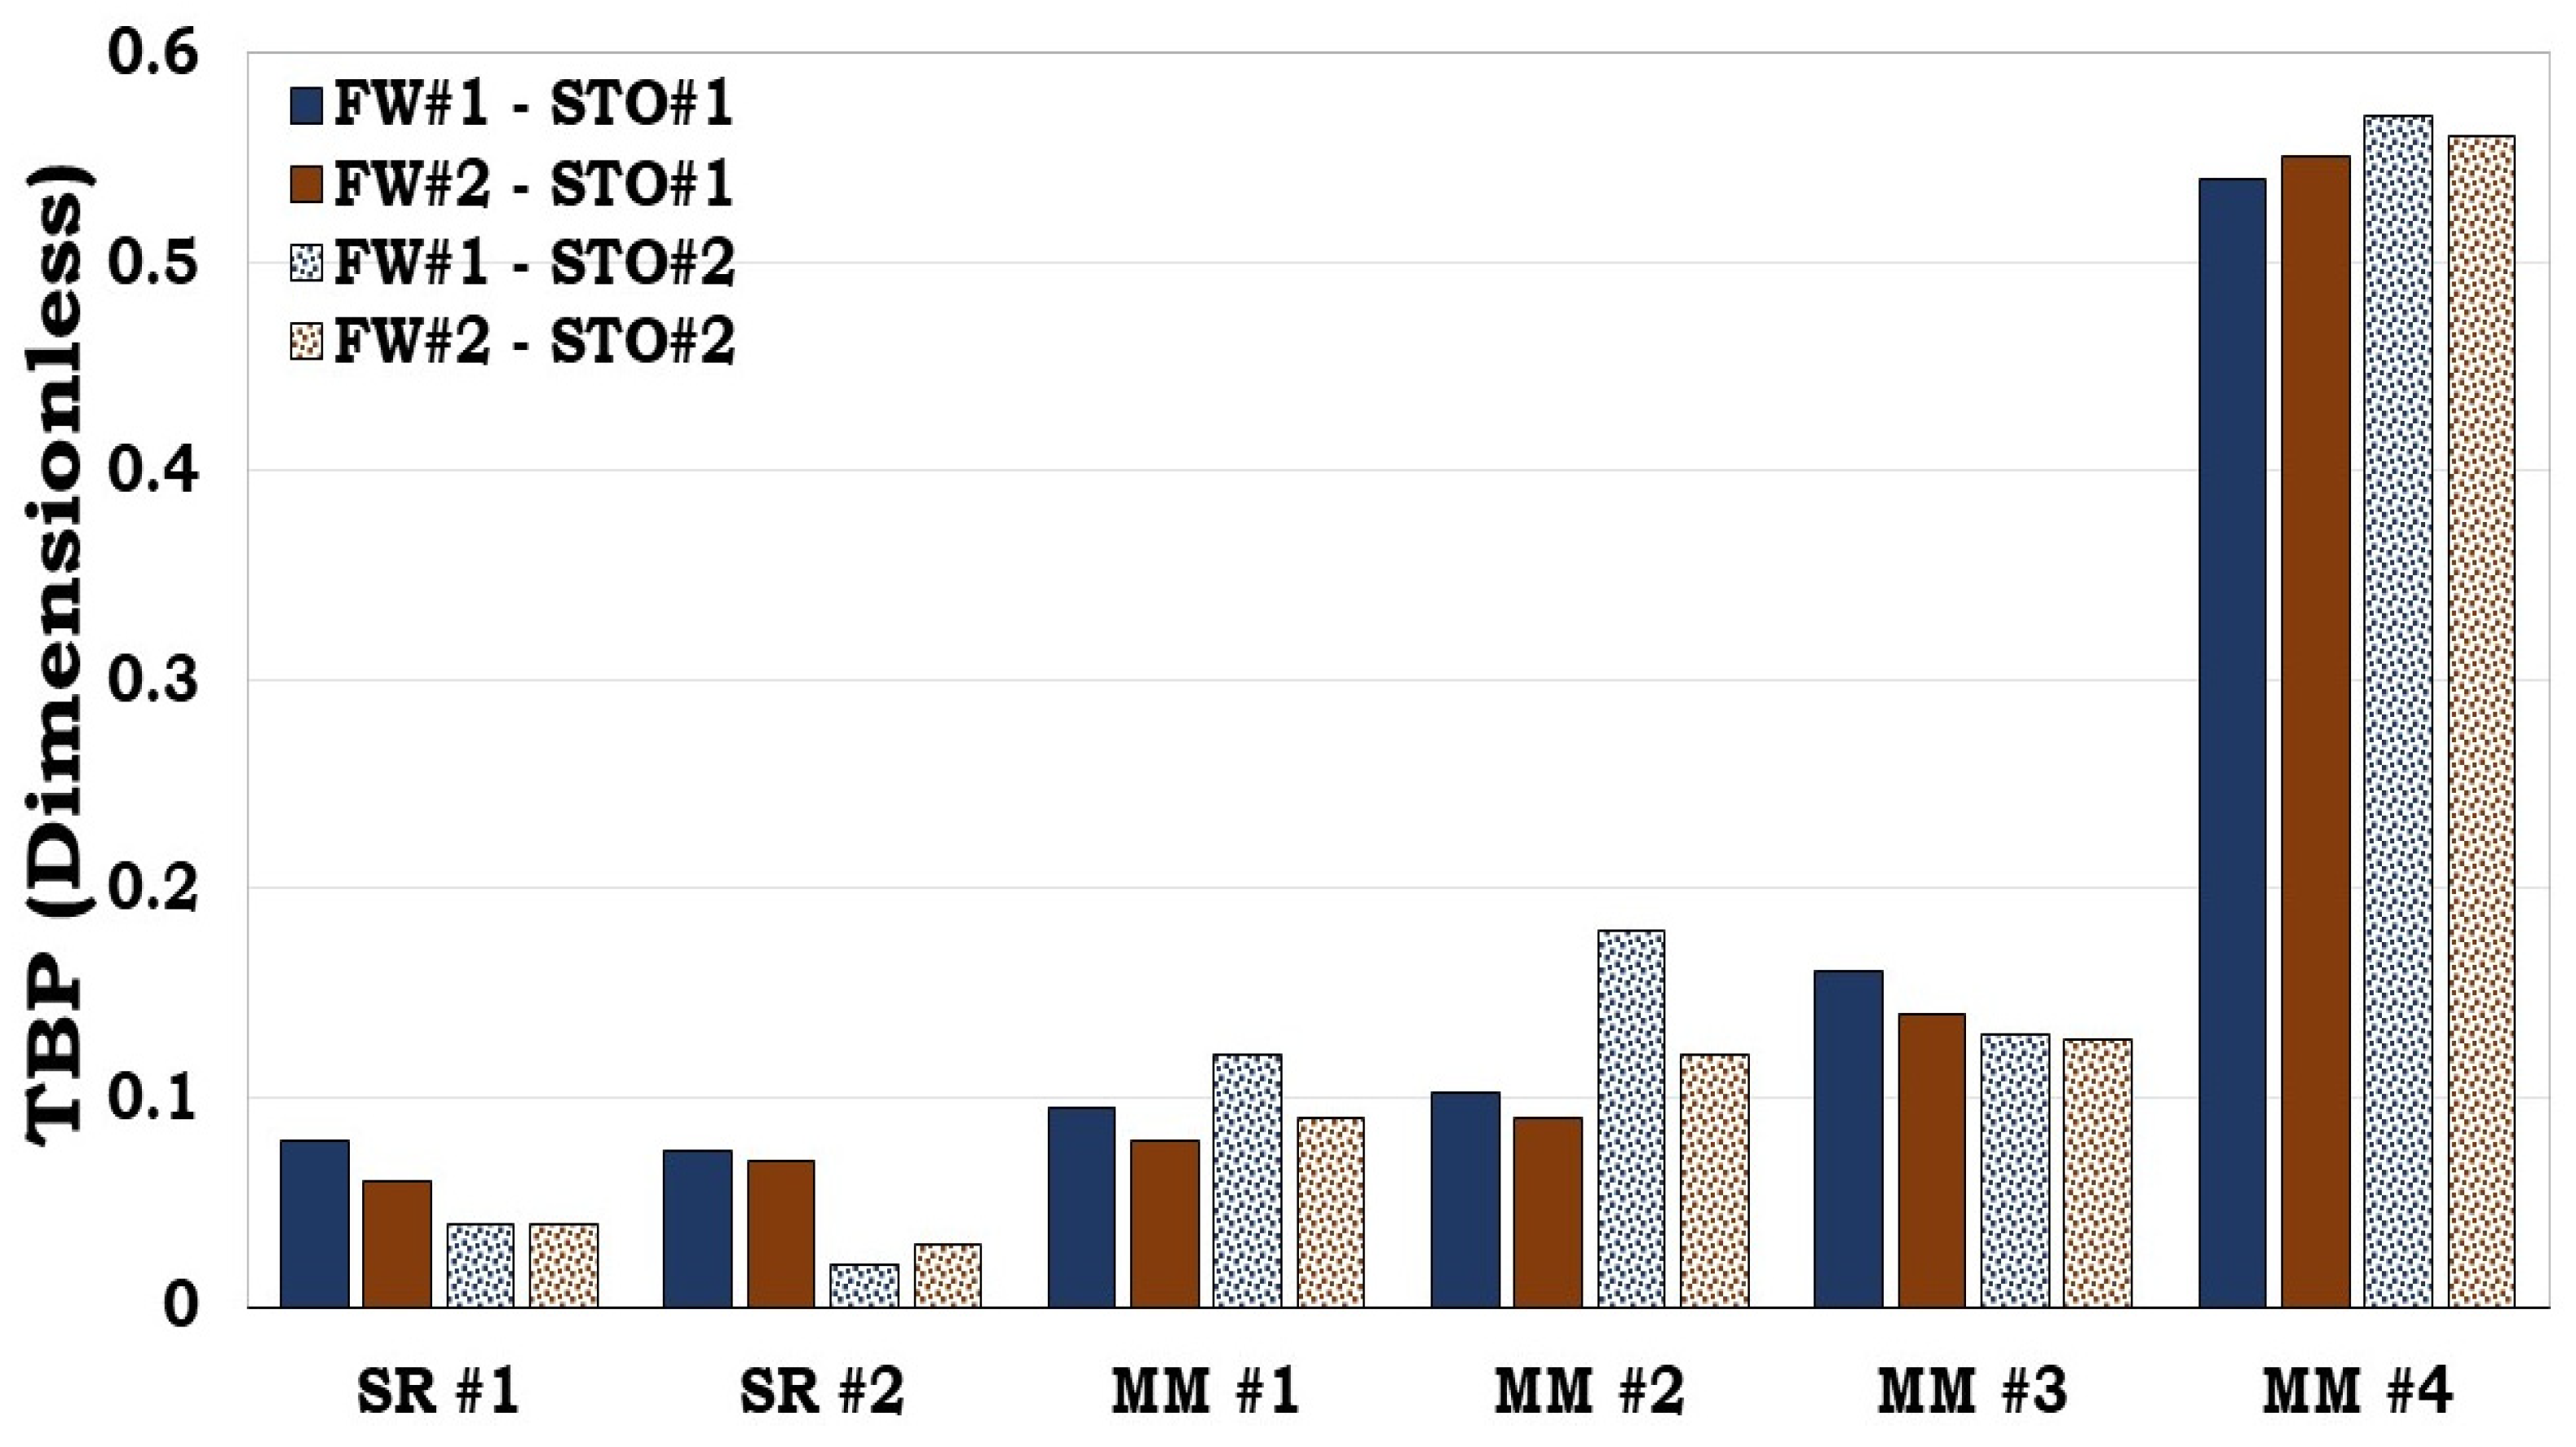
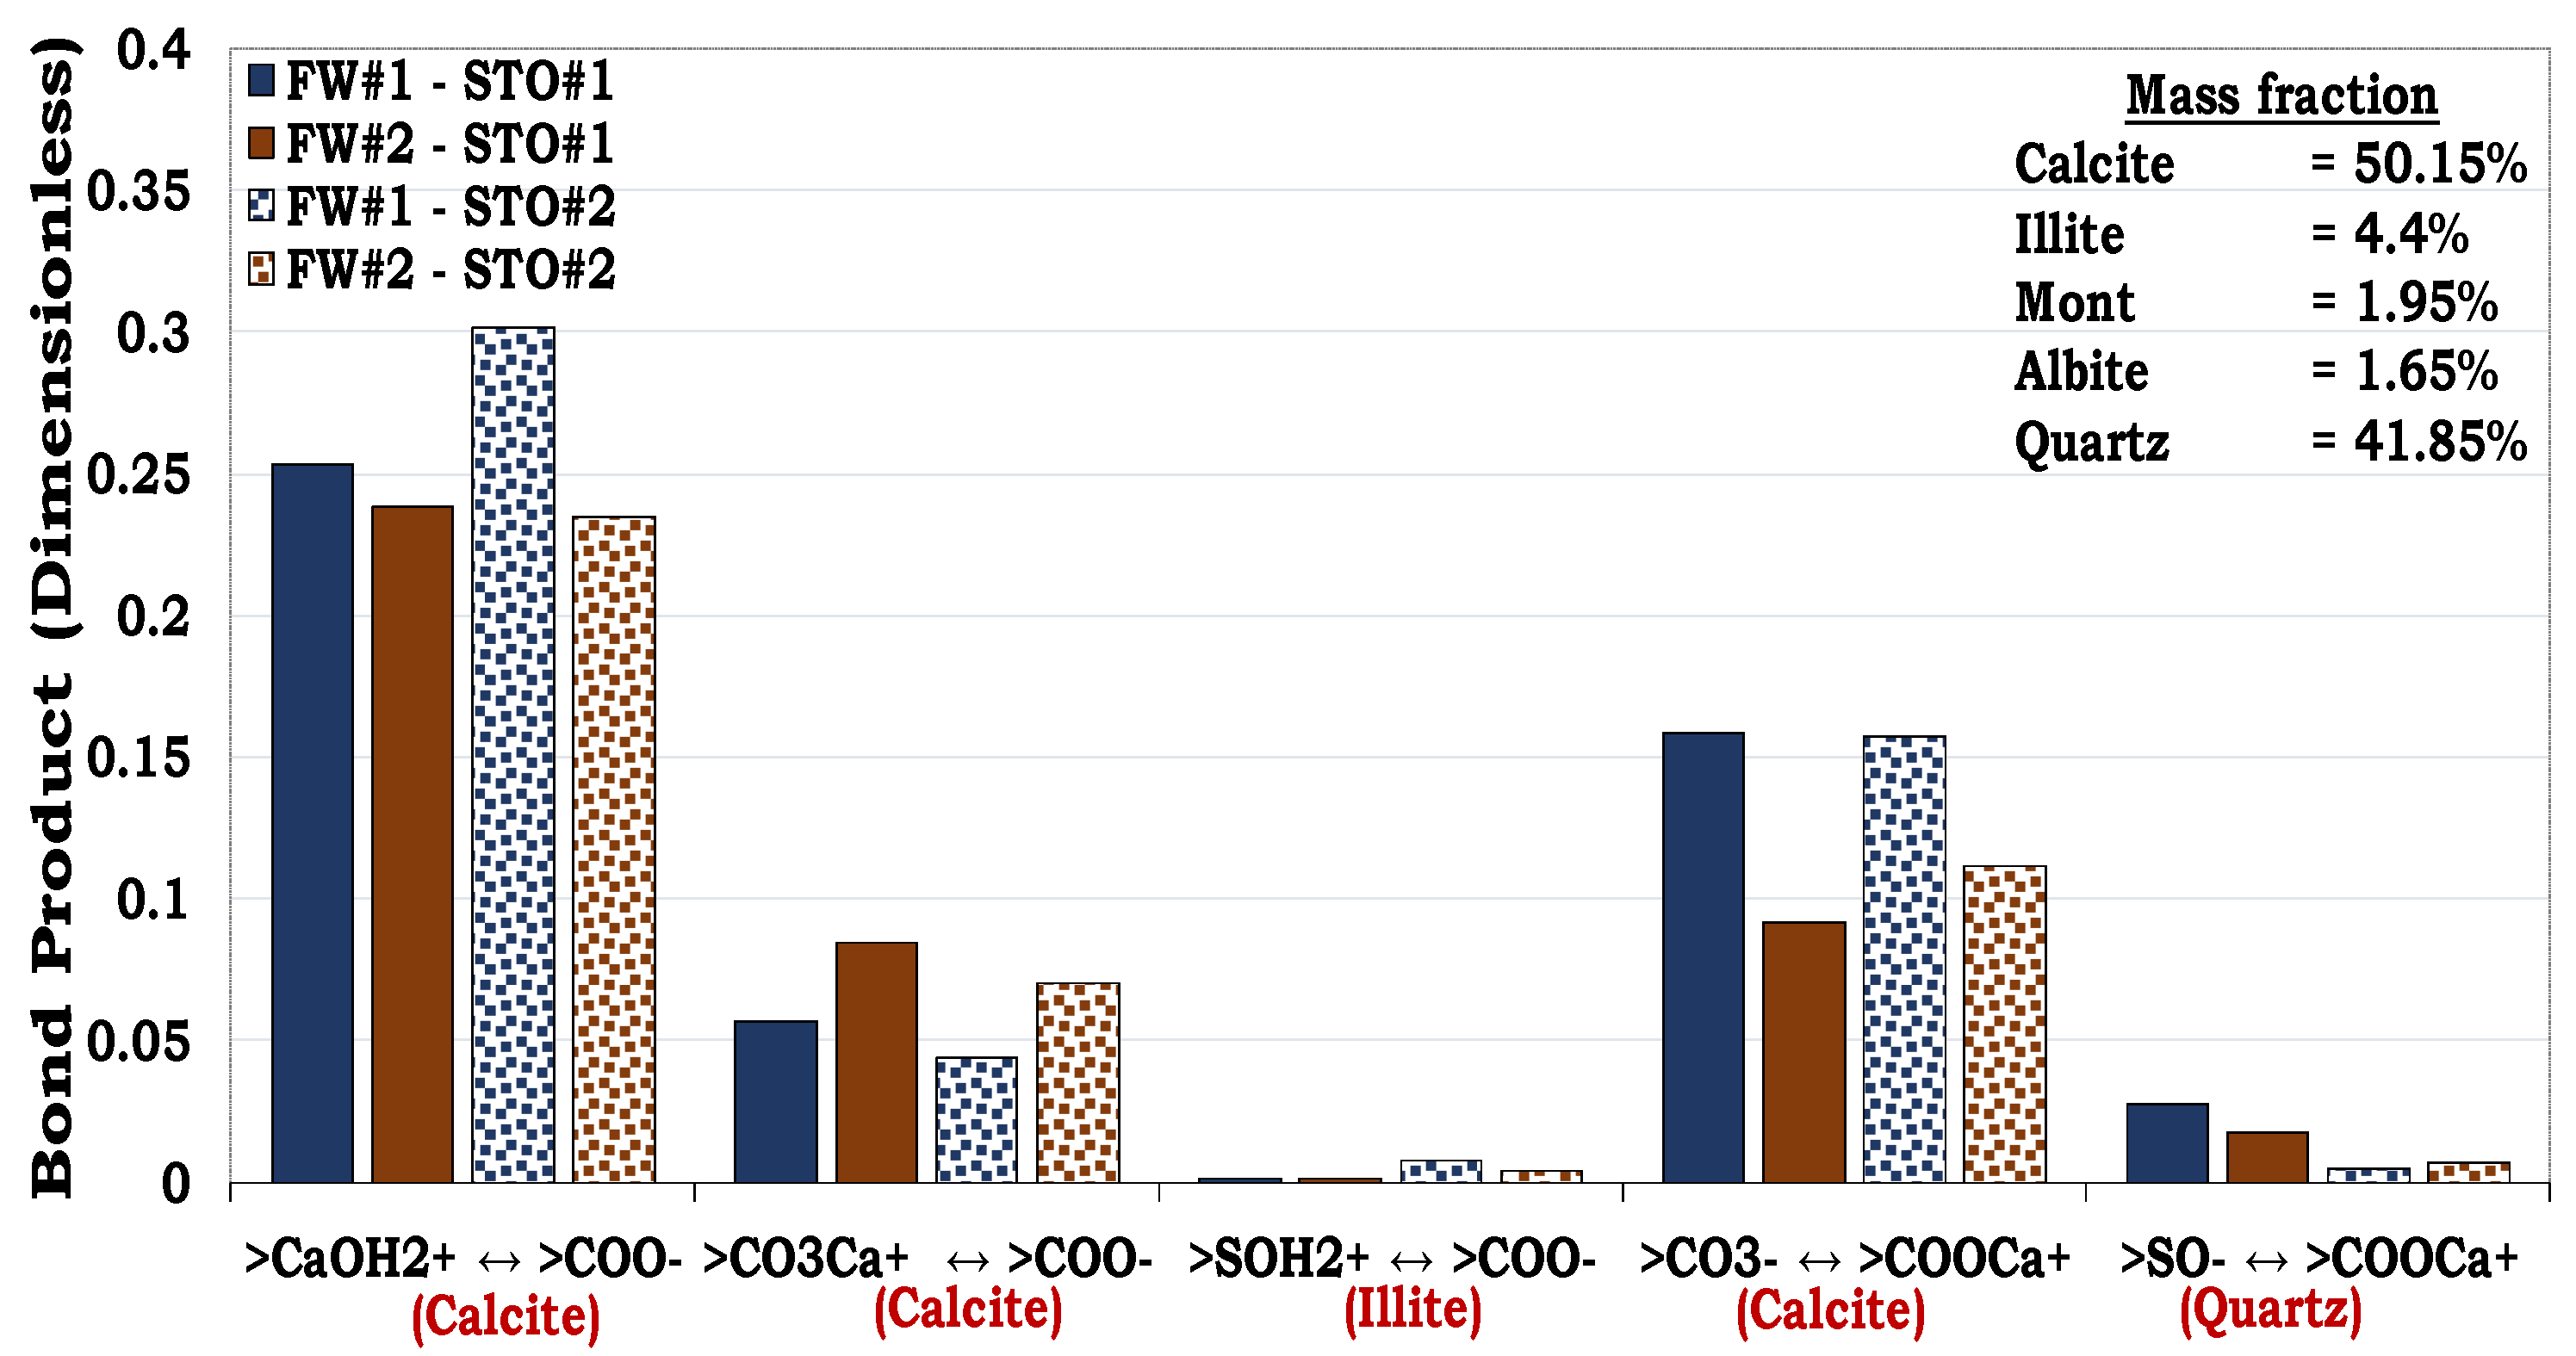
From both the SR and the MM flotation test results (Figure 10), it can be inferred that both the surface area and wetting state of the individual minerals influence the wettability of the SR/MM. For example, the wetting states of MM #1 and MM #2 were dictated by their equivalent surface areas. The equivalent surface areas of MM #1 and MM #2 were 21.98 m2/g and 36.92 m2/g, correspondingly, with the latter being more oil–wet than the former. For the MM #3 and MM #4, the equivalent surface areas were also dominated by illite (4.40 m2/g and 2.94 m2/g, correspondingly). However, the dominant mass fractions of the minerals in the MM #3 composition were quartz (62.8%) and calcite (25.2%), while those of the MM #4 were calcite (50.2%) and quartz (41.9%). From Figure 10, it can be observed that MM #4 was more hydrophobic, unlike MM #3. This shows that the wetting state of SR/MM is influenced by the calcite content. It was observed that, if the SR/MM is dominated by hydrophilic minerals (e.g., illite) but its mineralogical composition is also dominated by the hydrophobic minerals (e.g., calcite), the latter will dictate the wettability of the SR/MM, as confirmed by both the flotation and SCM results (Figure 10 and Figure 11).
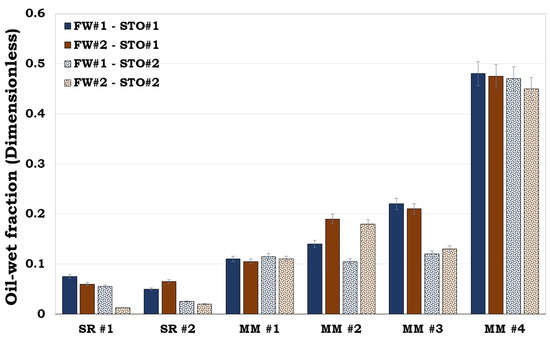
Figure 10.
This figure illustrates the flotation tests results of the sandstone rock (SR #1 and SR #2) and the mineral mixture (MM #1, MM #2, MM #3 & MM #4). It can be observed that SR #1 and SR #2 were strongly hydrophilic, while MM #4 was observed to be hydrophobic.
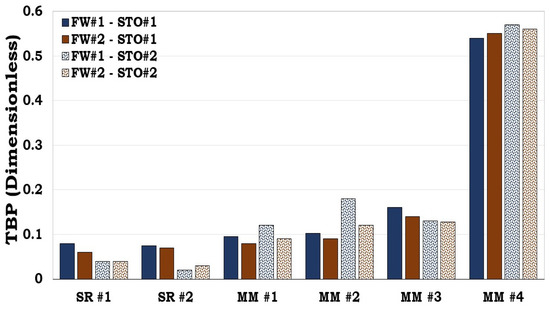
Figure 11.
This figure illustrates the oil adhesion tendencies of SR and MM via TBP. It became obvious that our developed model predicted the experimental results.
3.4.1. Prediction of the Reservoir Rock Flotation Test Results
3.4.2. Mechanisms of Oil Adhesion onto Sandstone Rock #1 (SR #1)
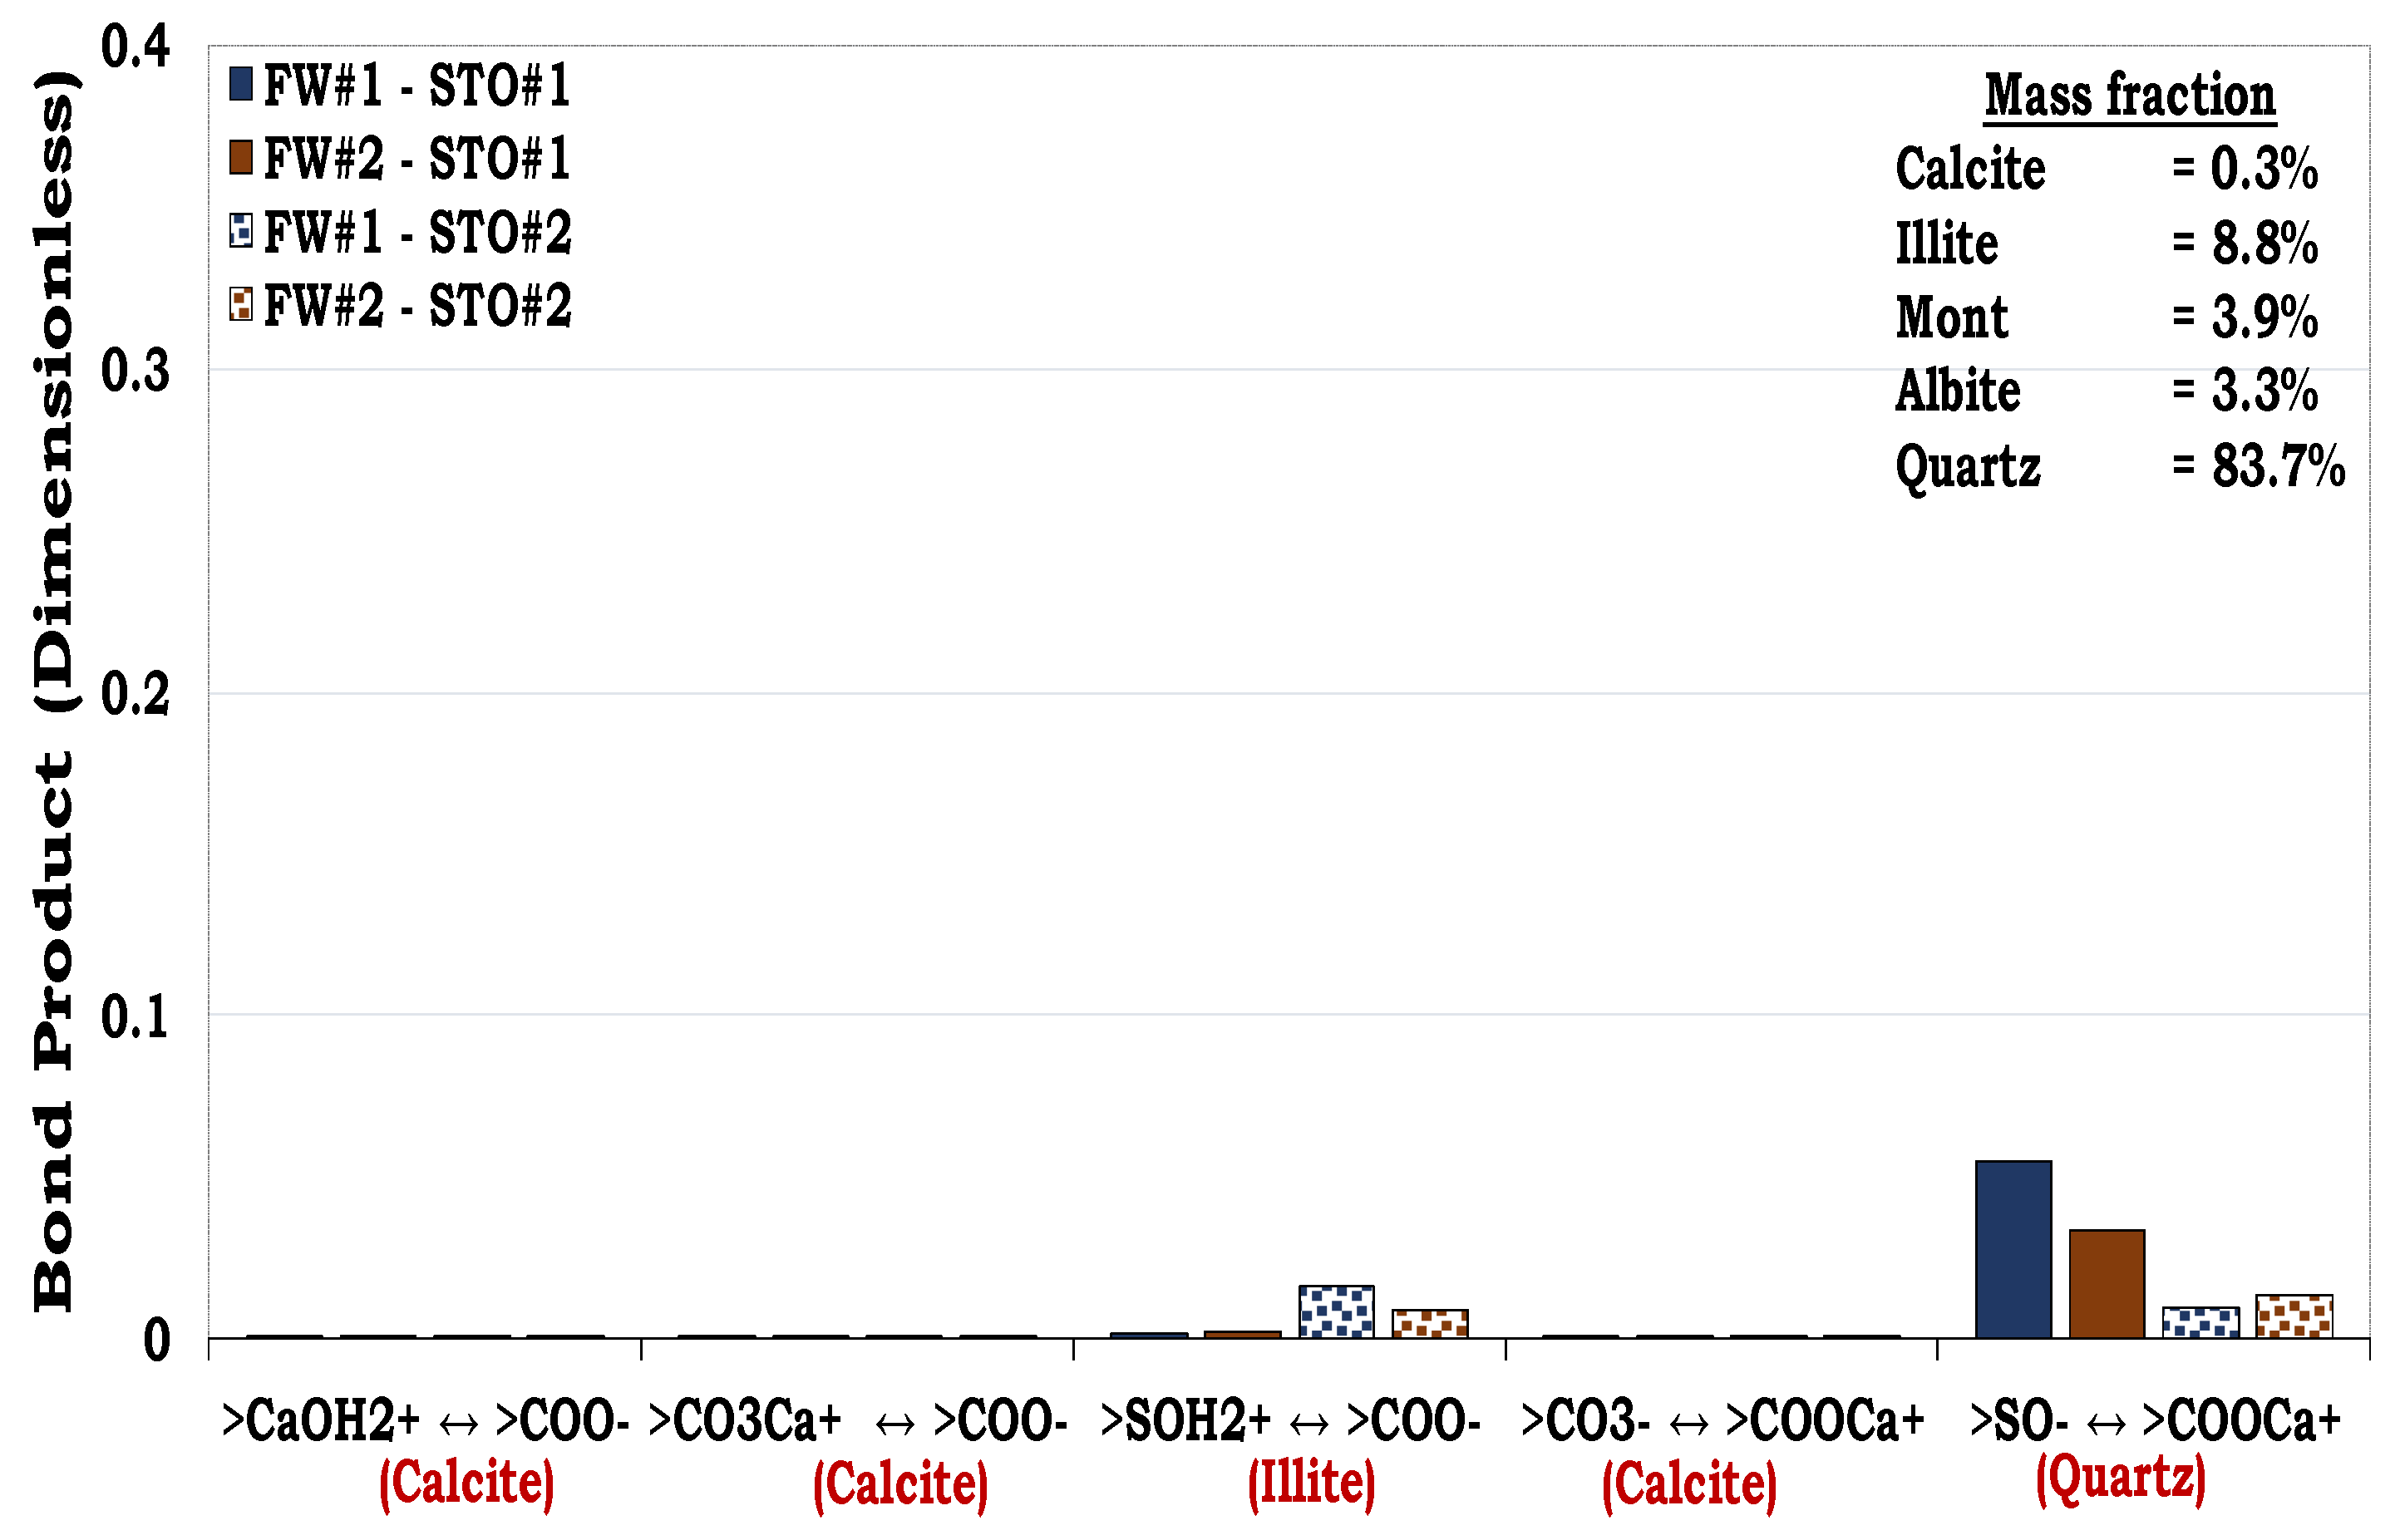
Considering Figure 12, quartz had the highest mass fraction in the SR #1 (83.7%), but its prominent oil adhesion mechanism was negligible (i.e., BP < 0.1), as confirmed by the pure quartz sample (Figure 5). In addition, though the content of illite in the SR #1 was small (8.8%), its contribution to the rock wettability was relatively significant compared to the other mineralogical constituents, resulting from its dominant surface area. Thus, confirming the role played by the mineralogical constituents in the wetting preferences of the rock/mineral mixtures.
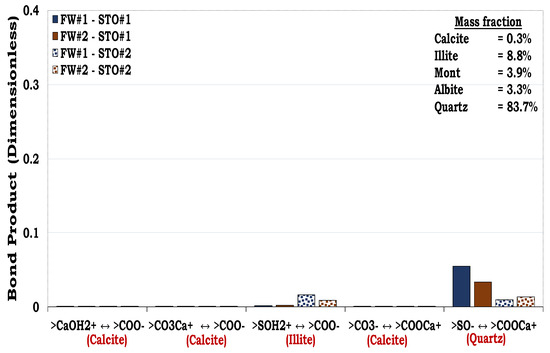
Figure 12.
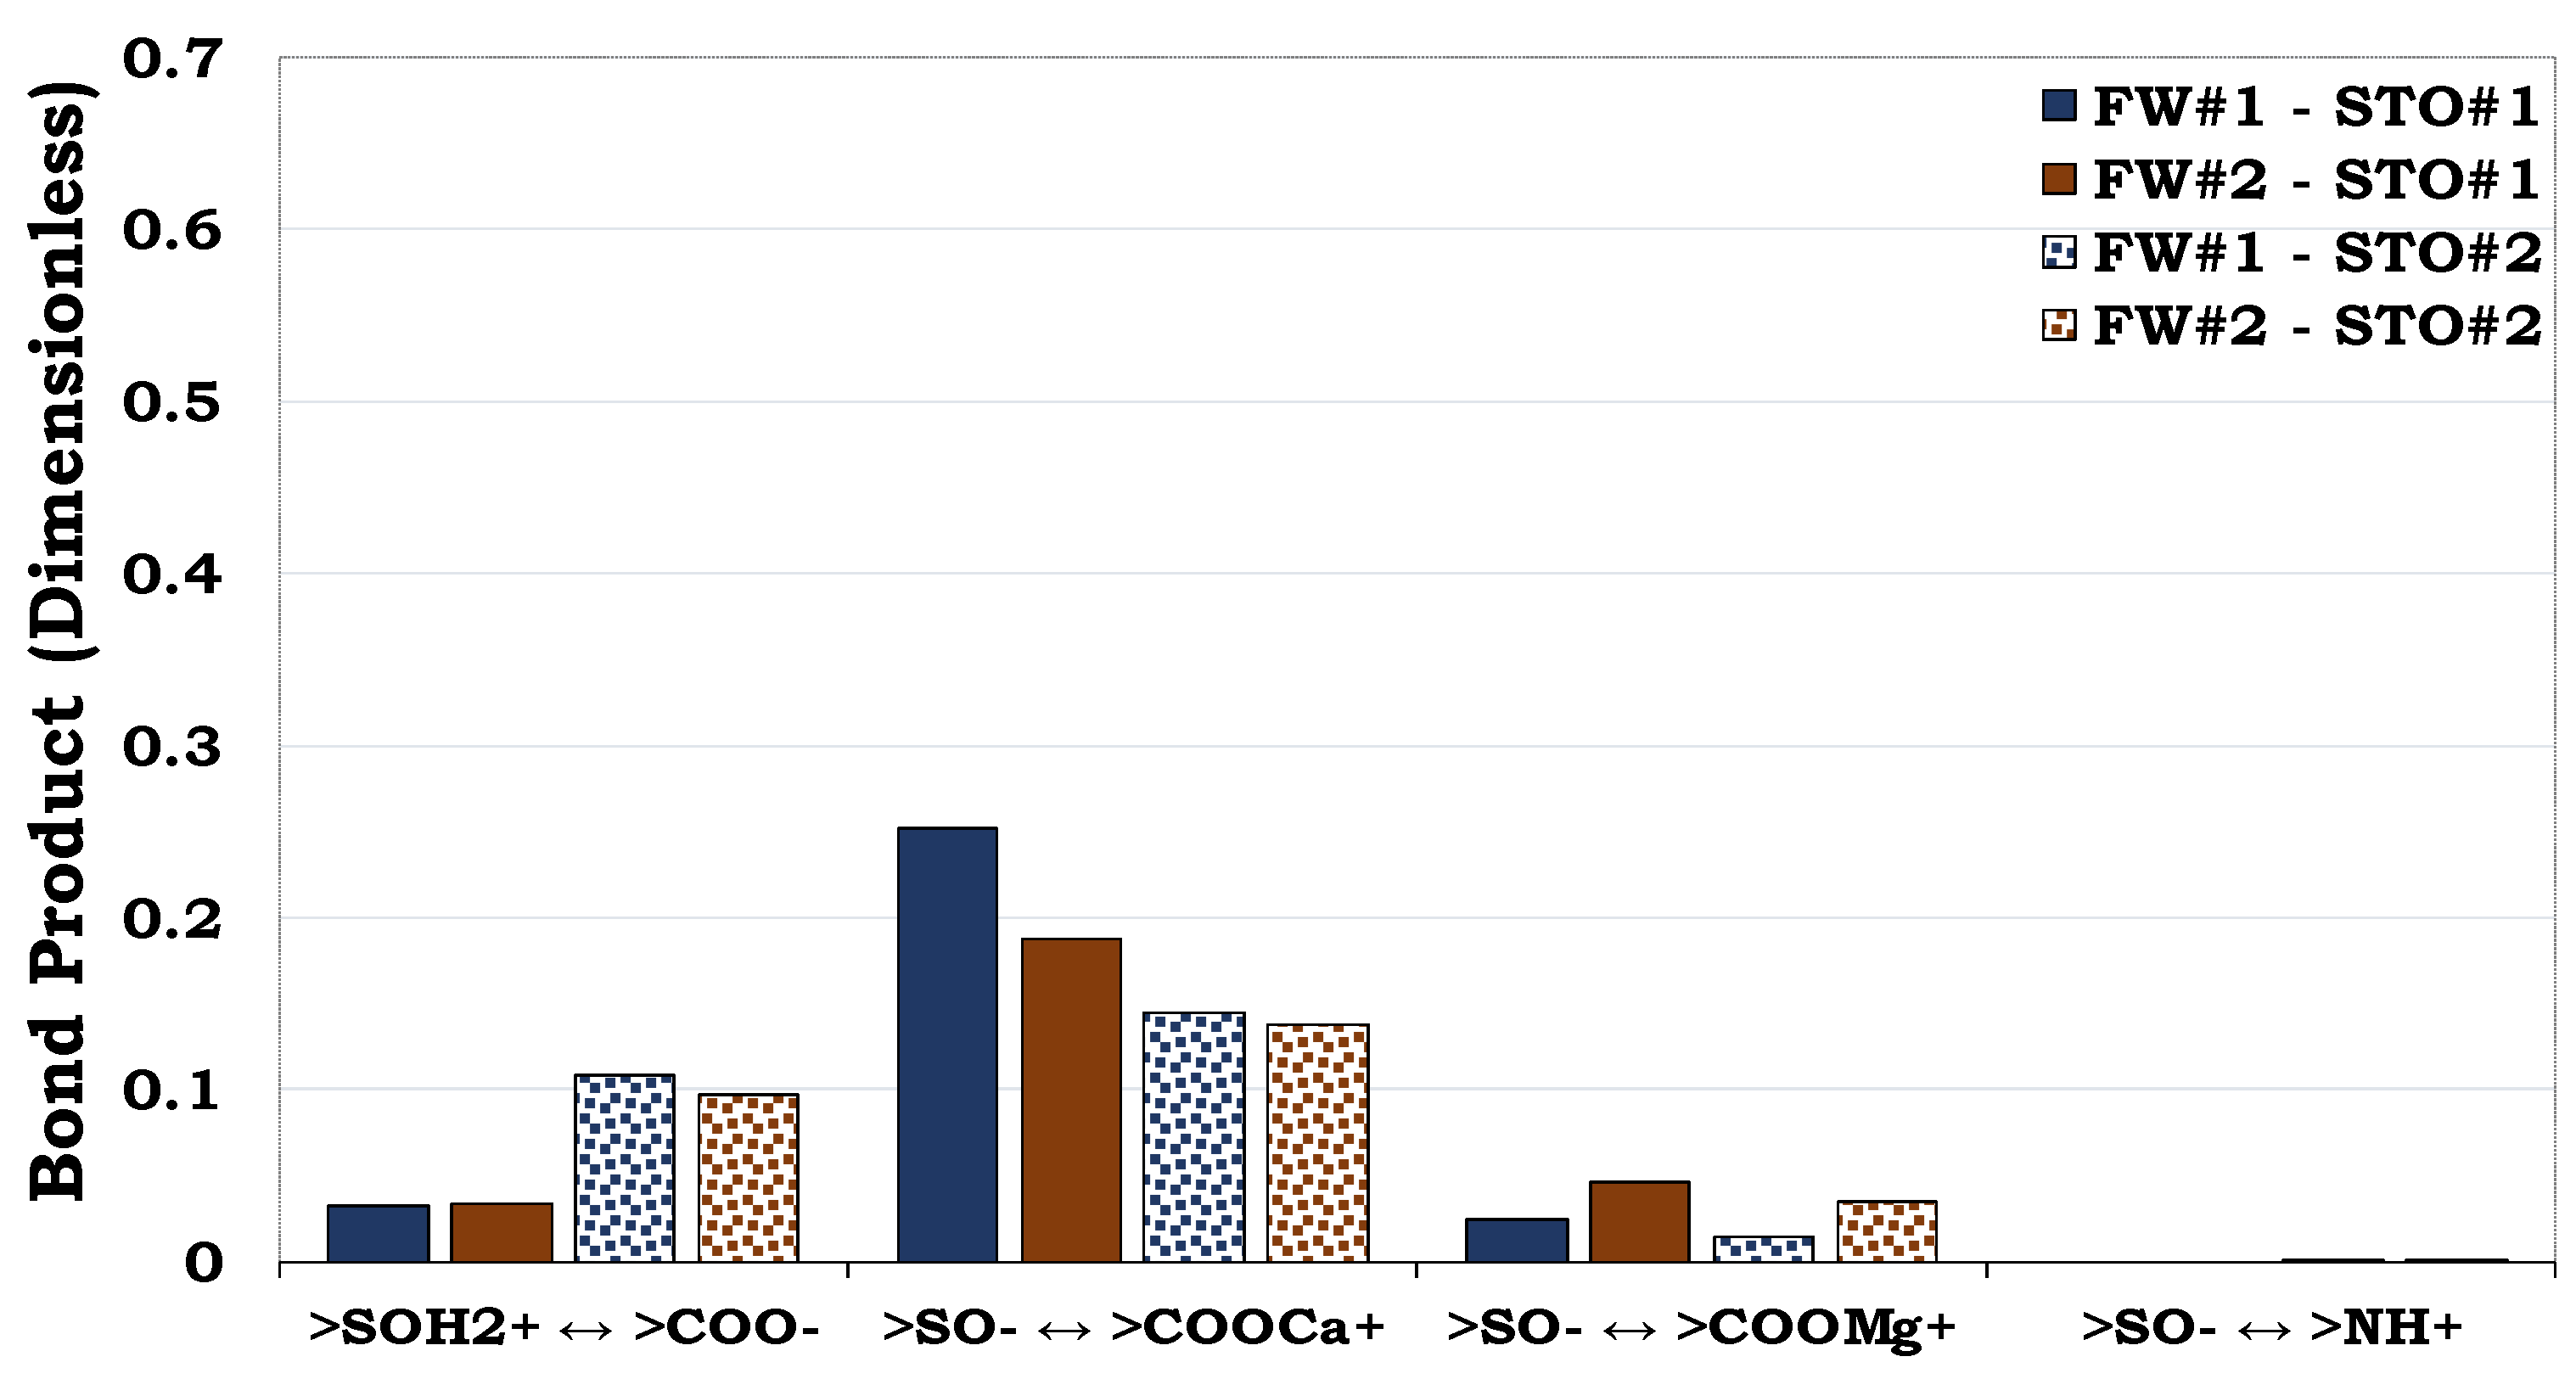
This figure illustrates the oil adhesion mechanisms of the SR #1–fluid systems with dissimilar interfacial polarities. It can be concluded that the SR #1 is strongly hydrophilic due to its low oil adhesion tendencies.
3.4.3. Mechanisms of Oil Adhesion onto Sandstone Rock #2 (SR #2)
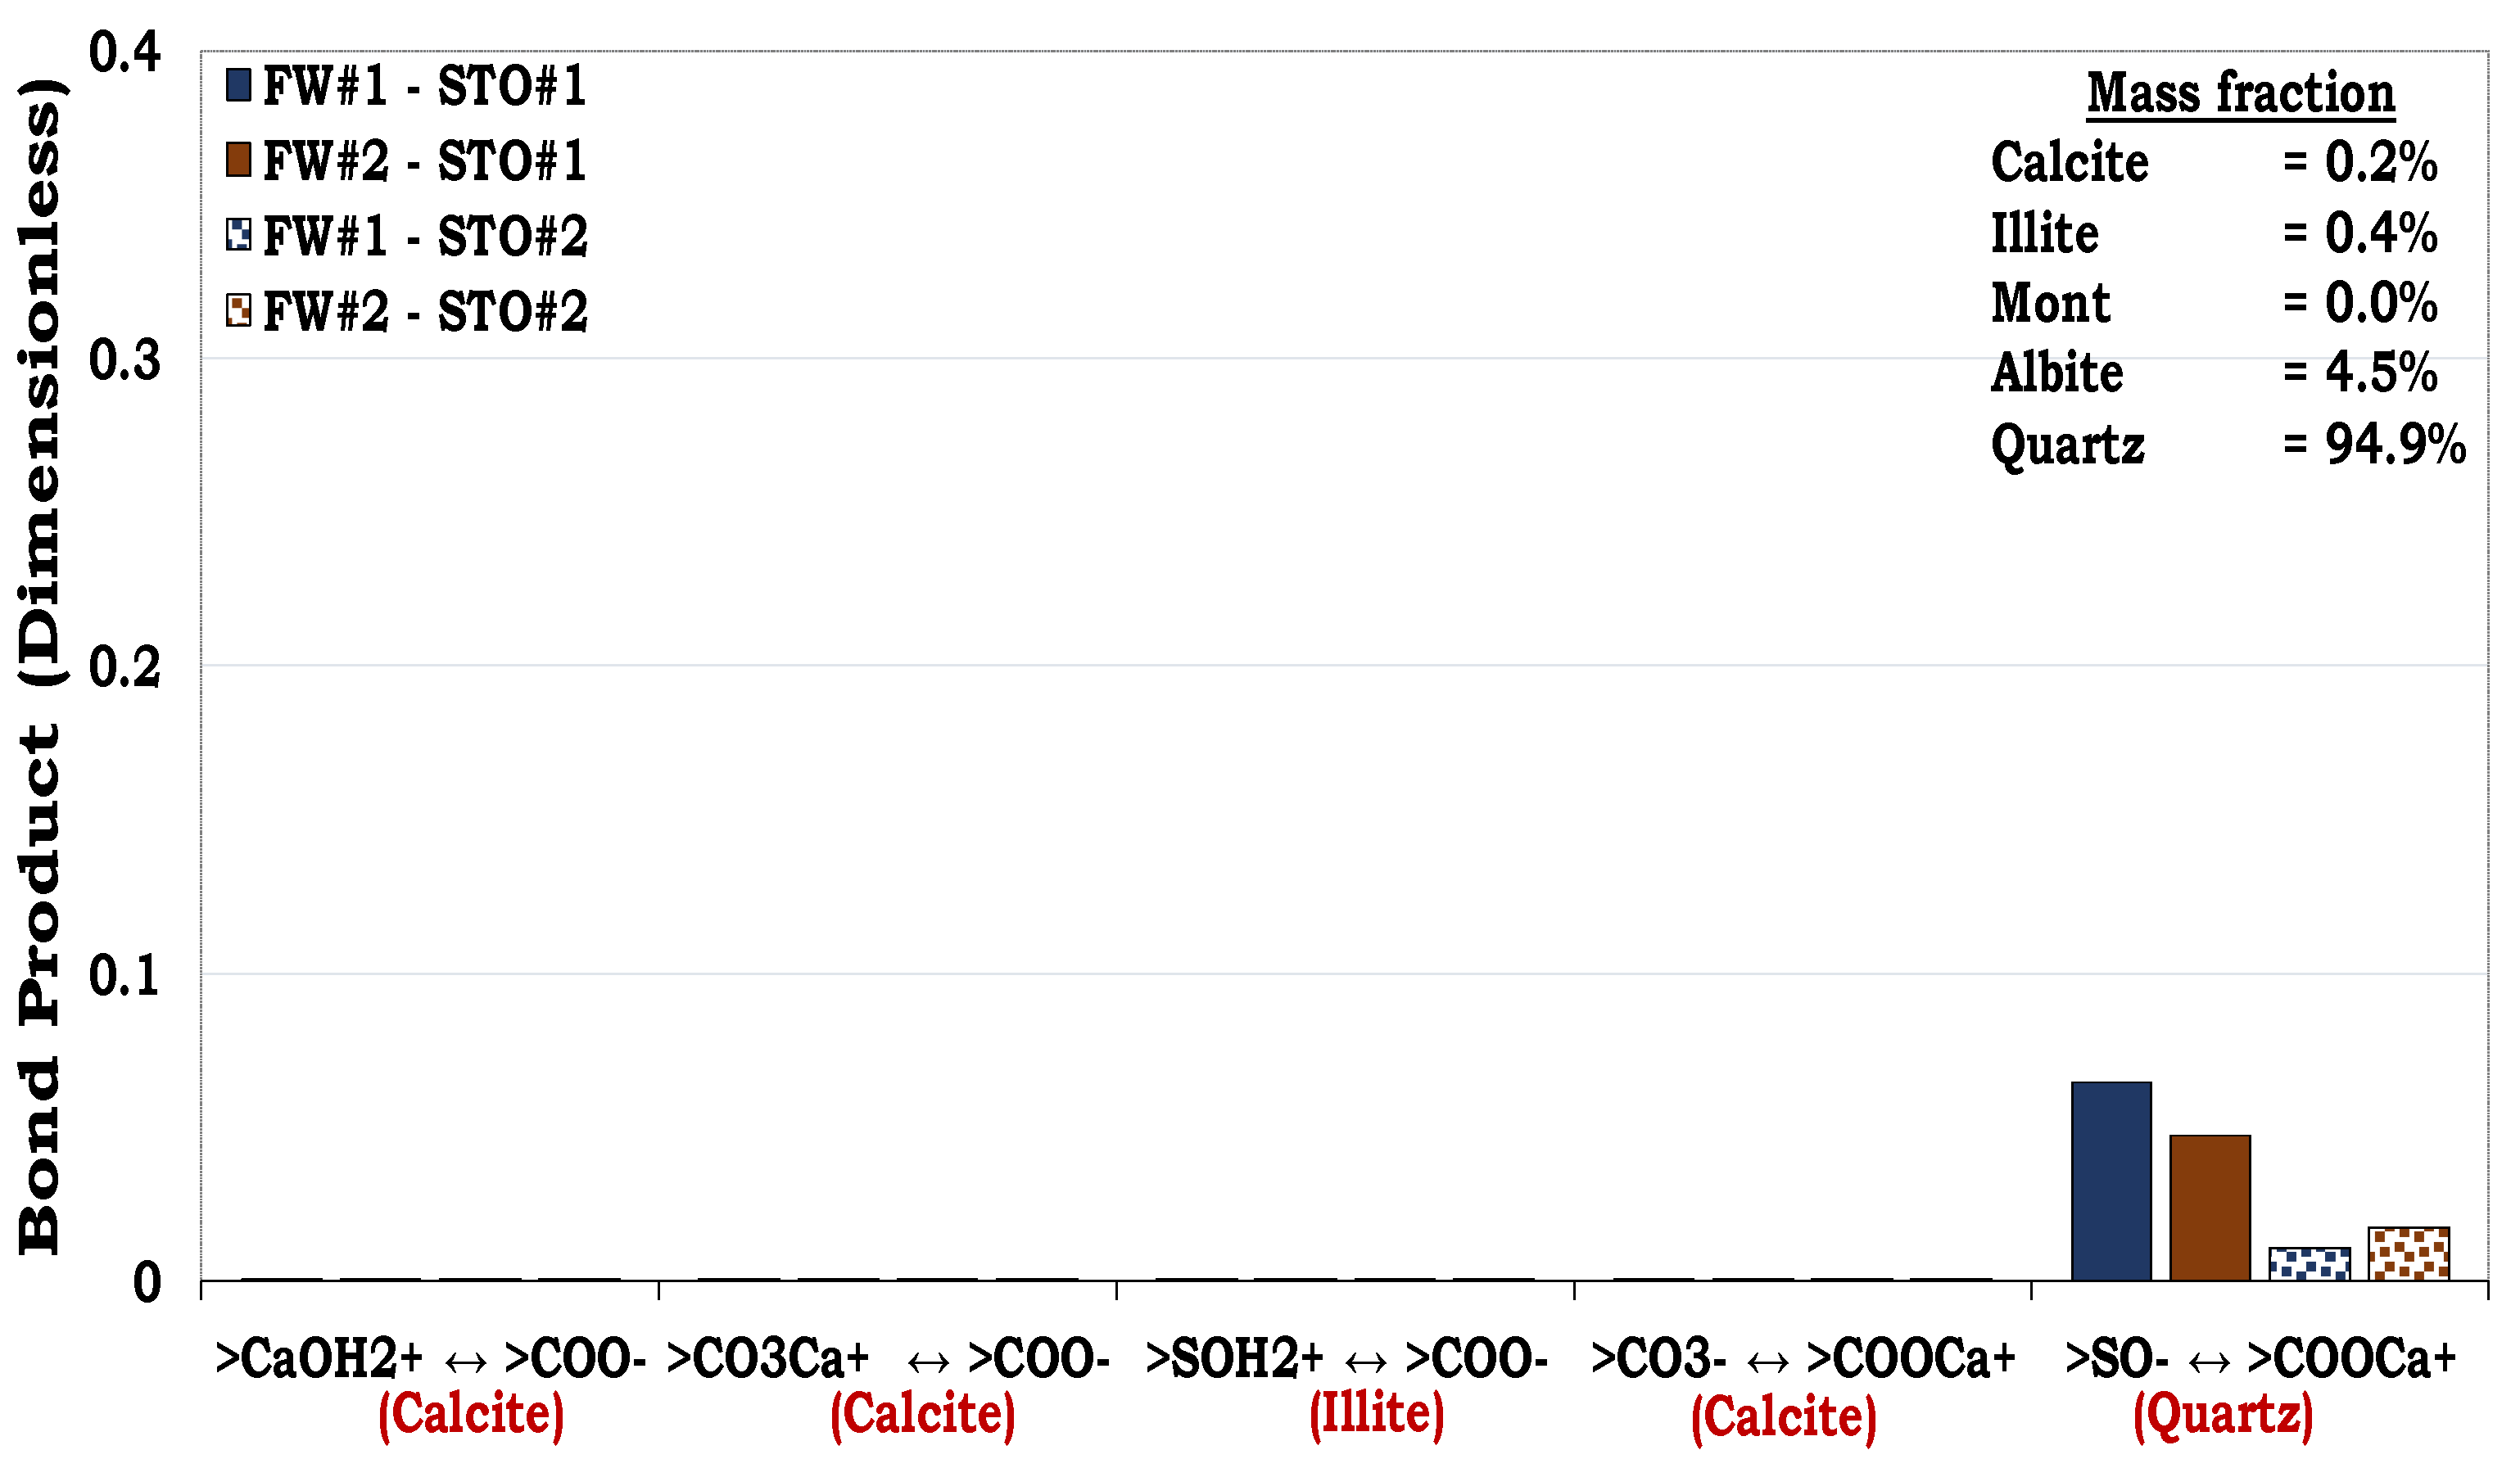
Similar to the composition of SR #1, in which the dominant mineralogical constituent was quartz (83.7%), SR #2 had quartz as the mineral with the highest mass fraction (94.9%), as depicted in Table 1. Hence, the SR #2–fluid system also resulted in approximately the same magnitude of oil adhesion (i.e., BP < 0.1) as observed in the SR #1 (Figure 13). It can also be observed that unlike SR #1 with the mineralogical composition with high illite content (8.8%), the SR #2 mineralogical composition on the other hand has relatively low content of illite (0.4%). Hence, the direct adsorption of the carboxylic oil component onto the cationic illite sites (>SOH2+) was not distinct in the latter as compared to the former. This was due to the smaller equivalent illite surface area available to be bonded by the oil in the SR #2, resulting from the lower illite content (0.4%) than in the SR #1 (8.8%). The main mechanism of oil adhesion onto the SR #2 was the cation bridging (Ca2+) of the two anionic interfacial polarities, namely the quartz site (>SO−) and carboxylic oil site (>COO−) as depicted in Figure 13. In addition, attractive electrostatic pair linkage between the >COO− and the cationic SR #2 sites, such as calcite (>CaOH2+) and illite (>SOH2+), took place, but was its magnitude was negligible. This was linked to their negligible equivalent surface areas available for the surface–active oil components to be bonded onto due to their low mass fractions in the rock.
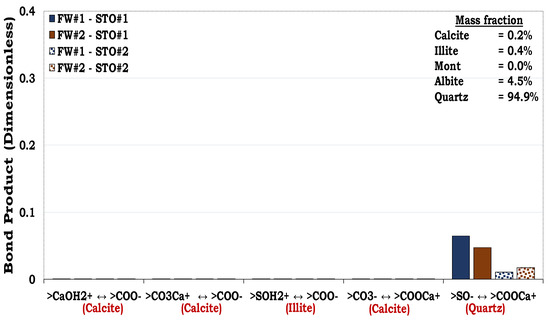
Figure 13.
This figure illustrates the oil adhesion mechanisms in the SR #2–fluid systems with dissimilar interfacial polarities. Similar to the SR #1, the SR #2 was also strongly hydrophilic, as confirmed by the experimental and its simulated counterpart.
3.4.4. Mechanisms of Oil Adhesion onto Mineral Mixture #1 and #2 (MM #1 and MM #2)
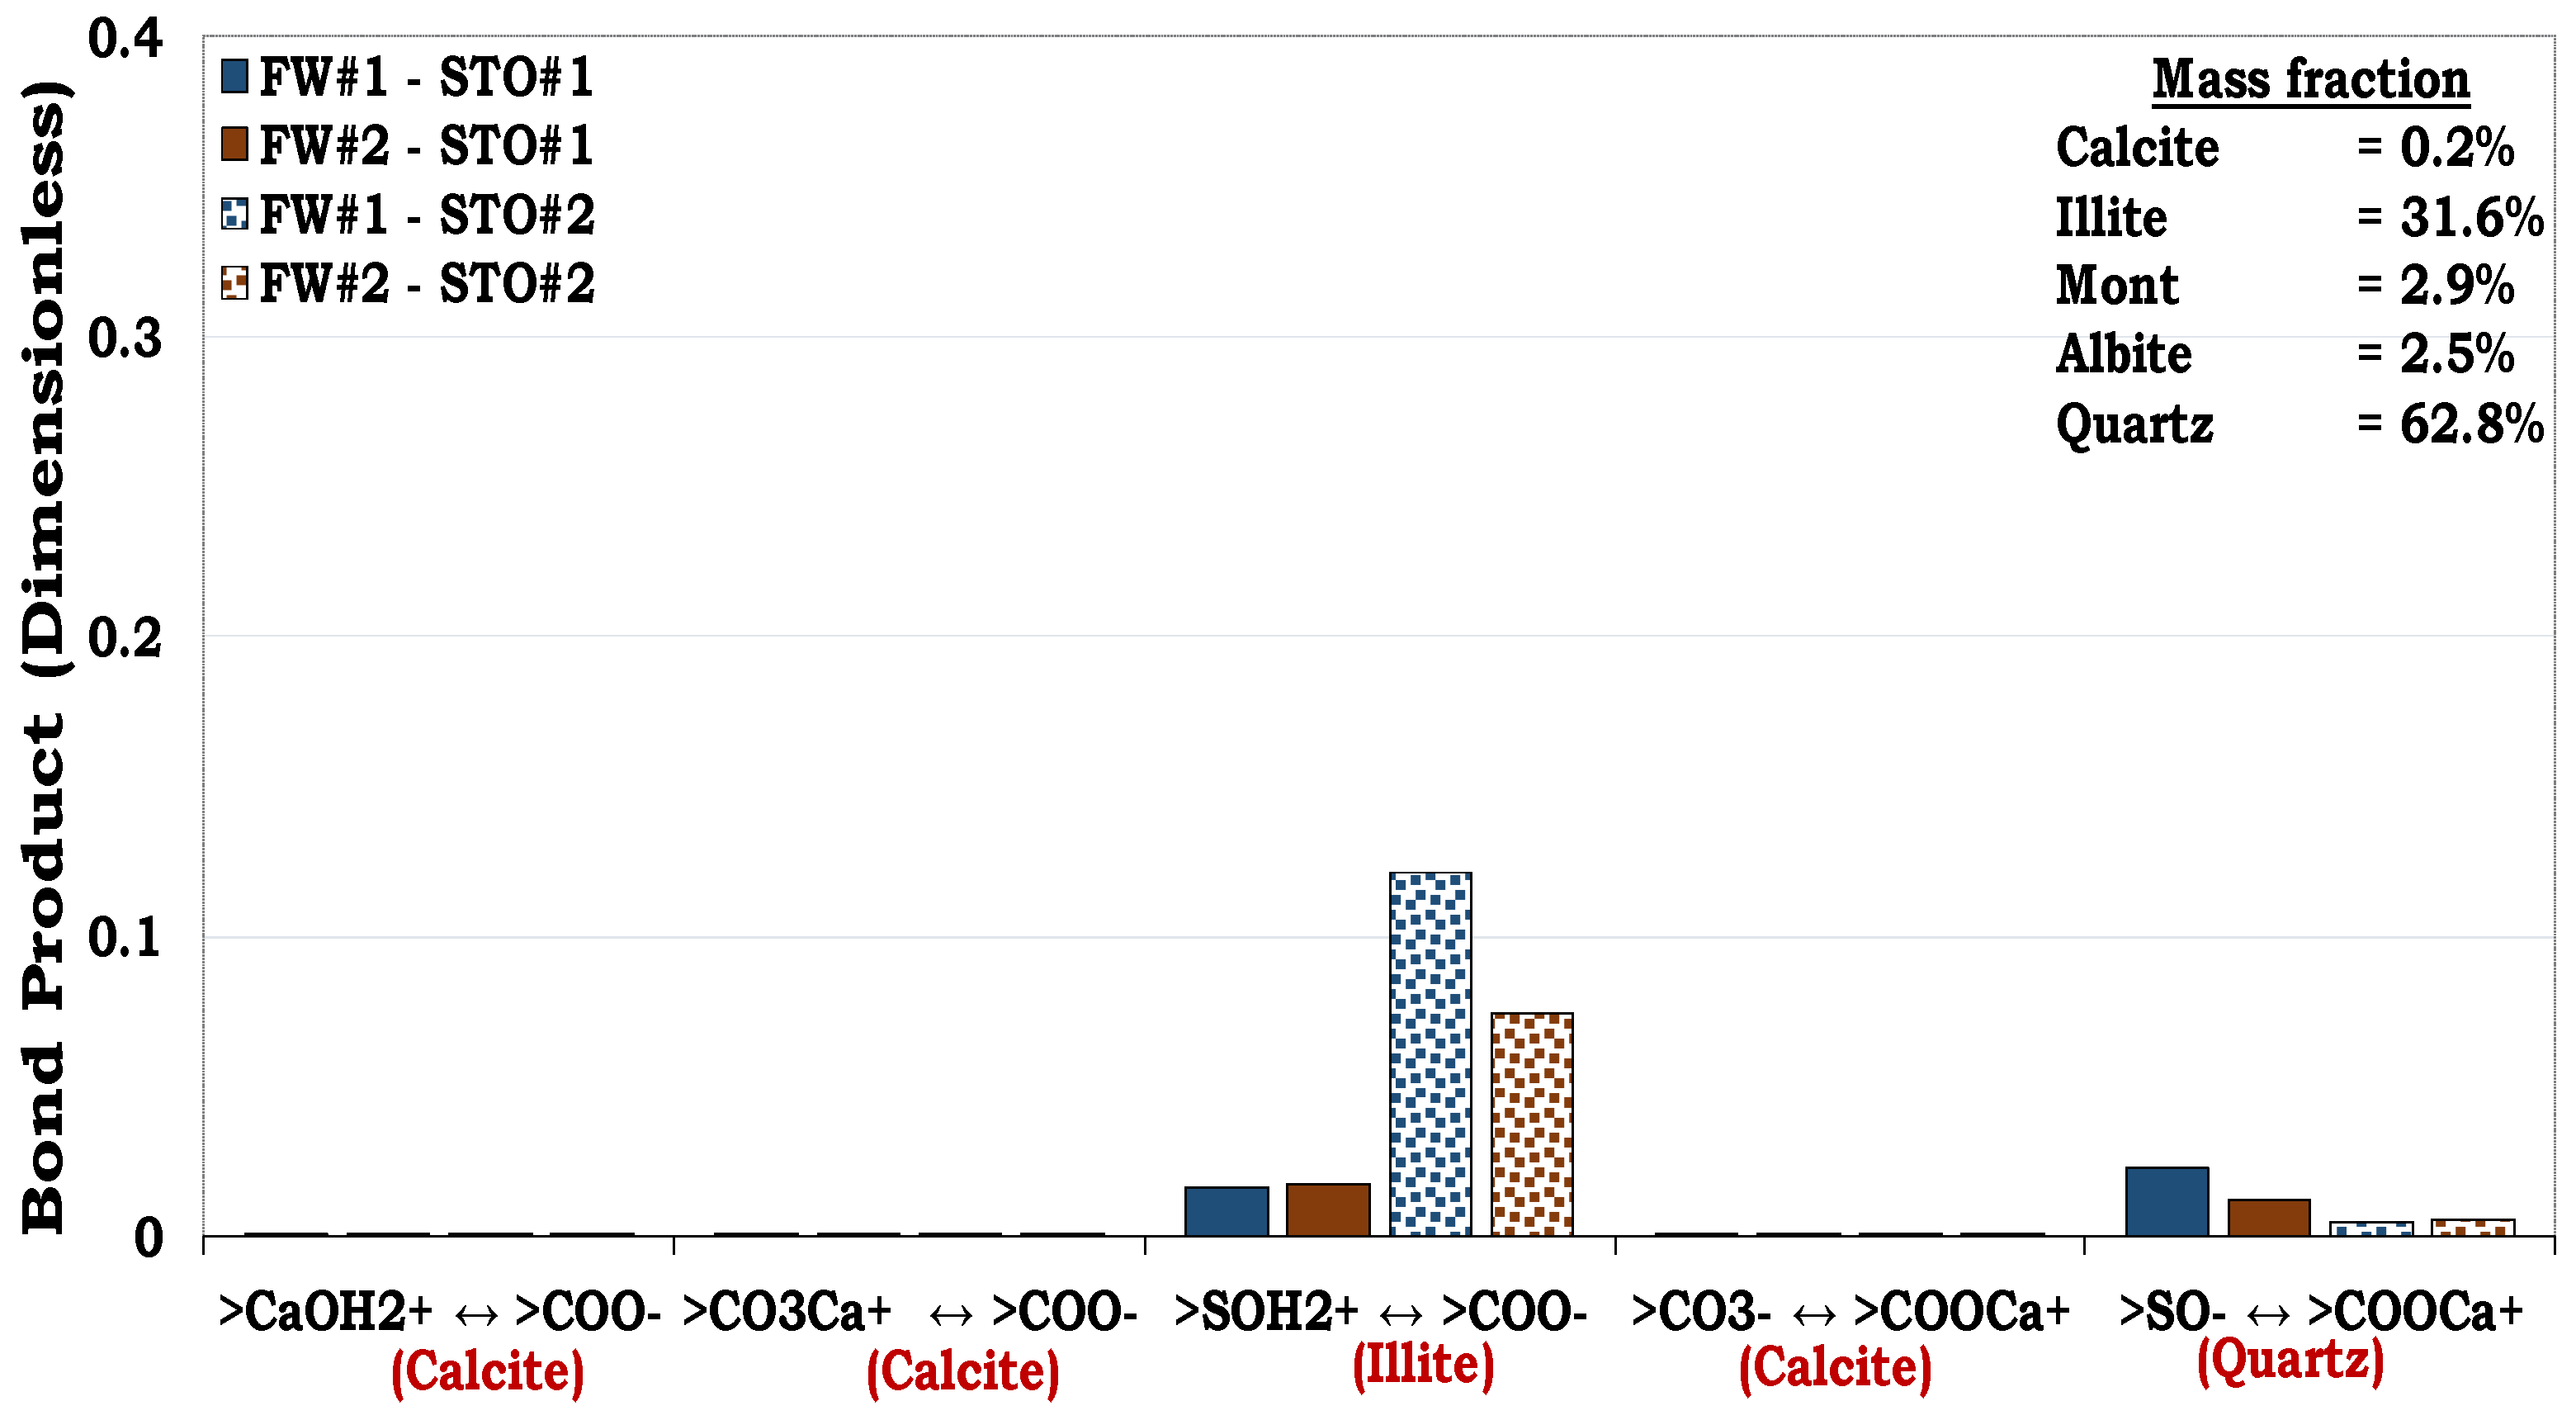
Unlike SR #1 and SR #2, with quartz dominating their mineralogical constituents (83.7% and 94.9%, correspondingly), those of MM #1 and MM #2 were formulated to evaluate the consequence of increasing the surface area of the MM by adding illite. For the MM #1 with approximately 32% illite, attractive electrostatic pair linkage existed between >COO− and illite sites (>SOH2+), as depicted in Figure 14. In addition, bridging by divalent cations (e.g., Ca2+) also took place between the negative oil site (>COO−) and that of quartz (>SO−).
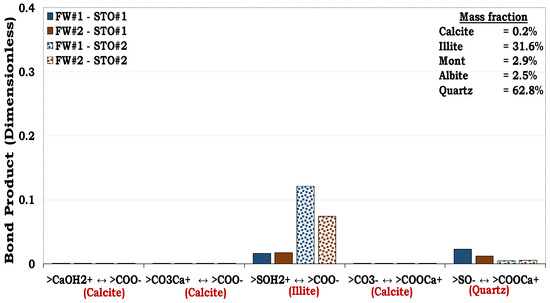
Figure 14.
This figure illustrates the oil adhesion mechanism of the MM #1–fluid systems with dissimilar interfacial polarities.
In a similar vein, direct adsorption of the carboxylic oil component (>COO−) onto the positively charged illite sites (>SOH2+) also dominated the oil adhesion mechanisms in the MM #2. From Figure 14, it became obvious that though illite had the second highest mass fraction (~ 31.6%) in the MM #1, its interaction was stronger than that of quartz (~ 62.8%). It can also be observed from Figure 15 that though quartz was also the second mineralogical constituent in the MM #2 (41.85%), the quartz–brine and oil–brine interactions were not distinct. This was attributed to the fact that the illite overshadowed the contributions of the quartz as a result of its high surface area.
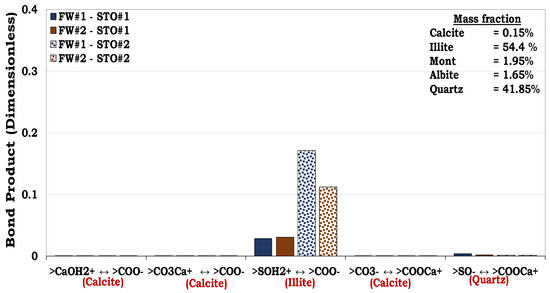
Figure 15.
This figure illustrates the oil adhesion mechanism in the MM #2–fluid systems with dissimilar interfacial polarities. It can be observed that the surface area of the minerals has an overriding effect on the wetting preferences of the reservoir rock.
3.4.5. Mechanisms of Oil Adhesion in Mineral Mixtures #3 and #4 (MM #3 and MM #4)
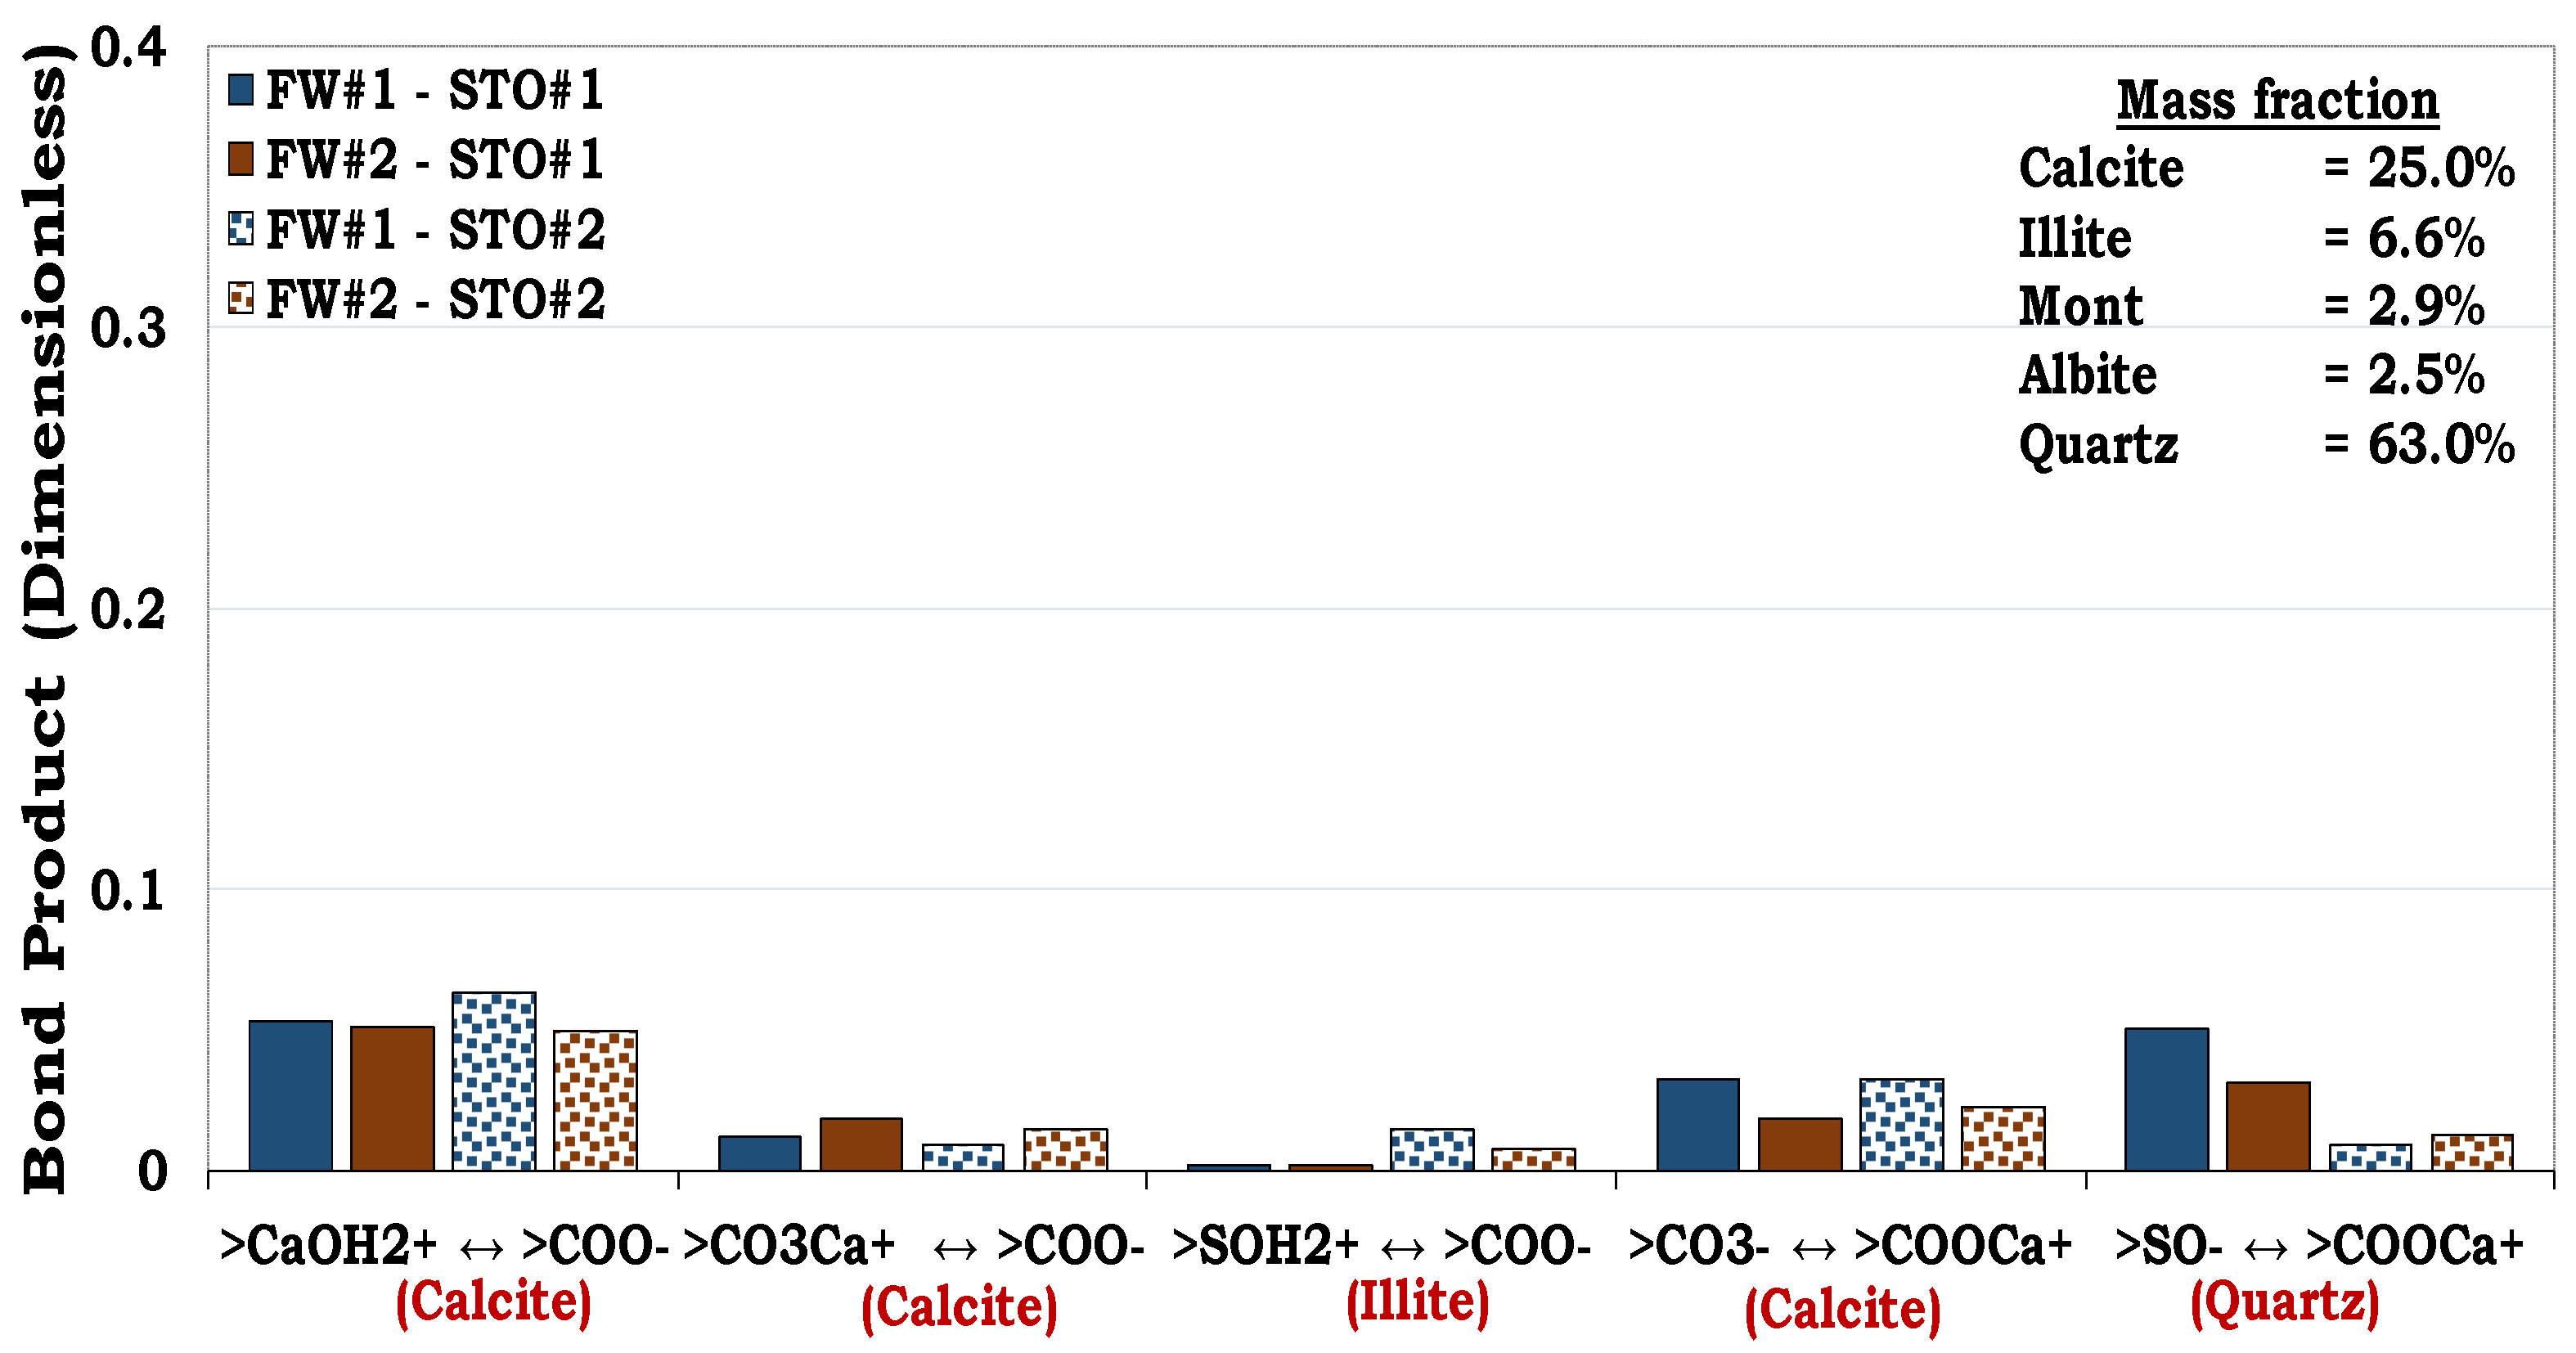
Unlike MM #1 and MM #2, with illite-dominated contents, MM #3 and MM #4 on the other hand were formulated to have high hydrophobic mineral content, e.g., calcite. This was to evaluate the role of increasing the mass fraction of hydrophobic mineral constituents in wettability. The dominant oil adhesion mechanism for the MM #3–fluid system was less than 0.1 (i.e., BP < 0.1), as depicted in Figure 16.
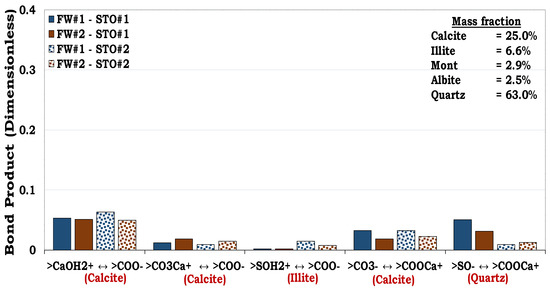
Figure 16.
This figure illustrates the oil adhesion mechanism of the MM #3–fluid systems with dissimilar interfacial polarities. It can be inferred that increasing the contents of the hydrophobic mineral increases the hydrophobicity of the rock, resulting from increasing its equivalent surface area.
From Figure 17, it can be inferred that the main oil adhesion mechanism in MM #4 was approximately 0.3 (i.e., BP ≈ 0.3). Thus, confirming that increasing the calcite mass fraction of the sandstone rock increases its hydrophobicity, as observed for MM #4 (Figure 17). It can be observed that even with the same content of quartz (41.85%) in both the MM #2 and MM #4 (Figure 15 and Figure 17, respectively), the adhesion of oil onto the latter was more distinct than onto the former. This was confirmed by the indistinct cation bridging (Ca2+) existing between the quartz–FW (>SO−) and the STO–FW (>COO−) interfaces in the MM #2 as compared to MM #4. This was due to the fact that the contributions from the quartz in MM #2 were overshadowed by the mineralogical constituent with high surface area.
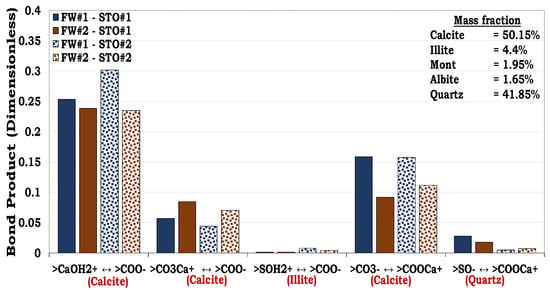
Figure 17.
This figure illustrates the oil adhesion mechanism of the MM #4–fluid systems with dissimilar interfacial polarities. It can be inferred that increasing the contents of the hydrophobic mineral increases the hydrophobicity of the rock, resulting from increasing its equivalent surface area.
3.5. Interfacial Charge Prediction via SCM
To better understand the flotation test results for the SR and MM, the mineral–brine and the oil–brine interface charges were also predicted via SCM for the individual minerals to assess the role of the surface charge in the wetting state of the rock (SR and MM).
3.5.1. Mineral–Brine Interface Charge Estimation
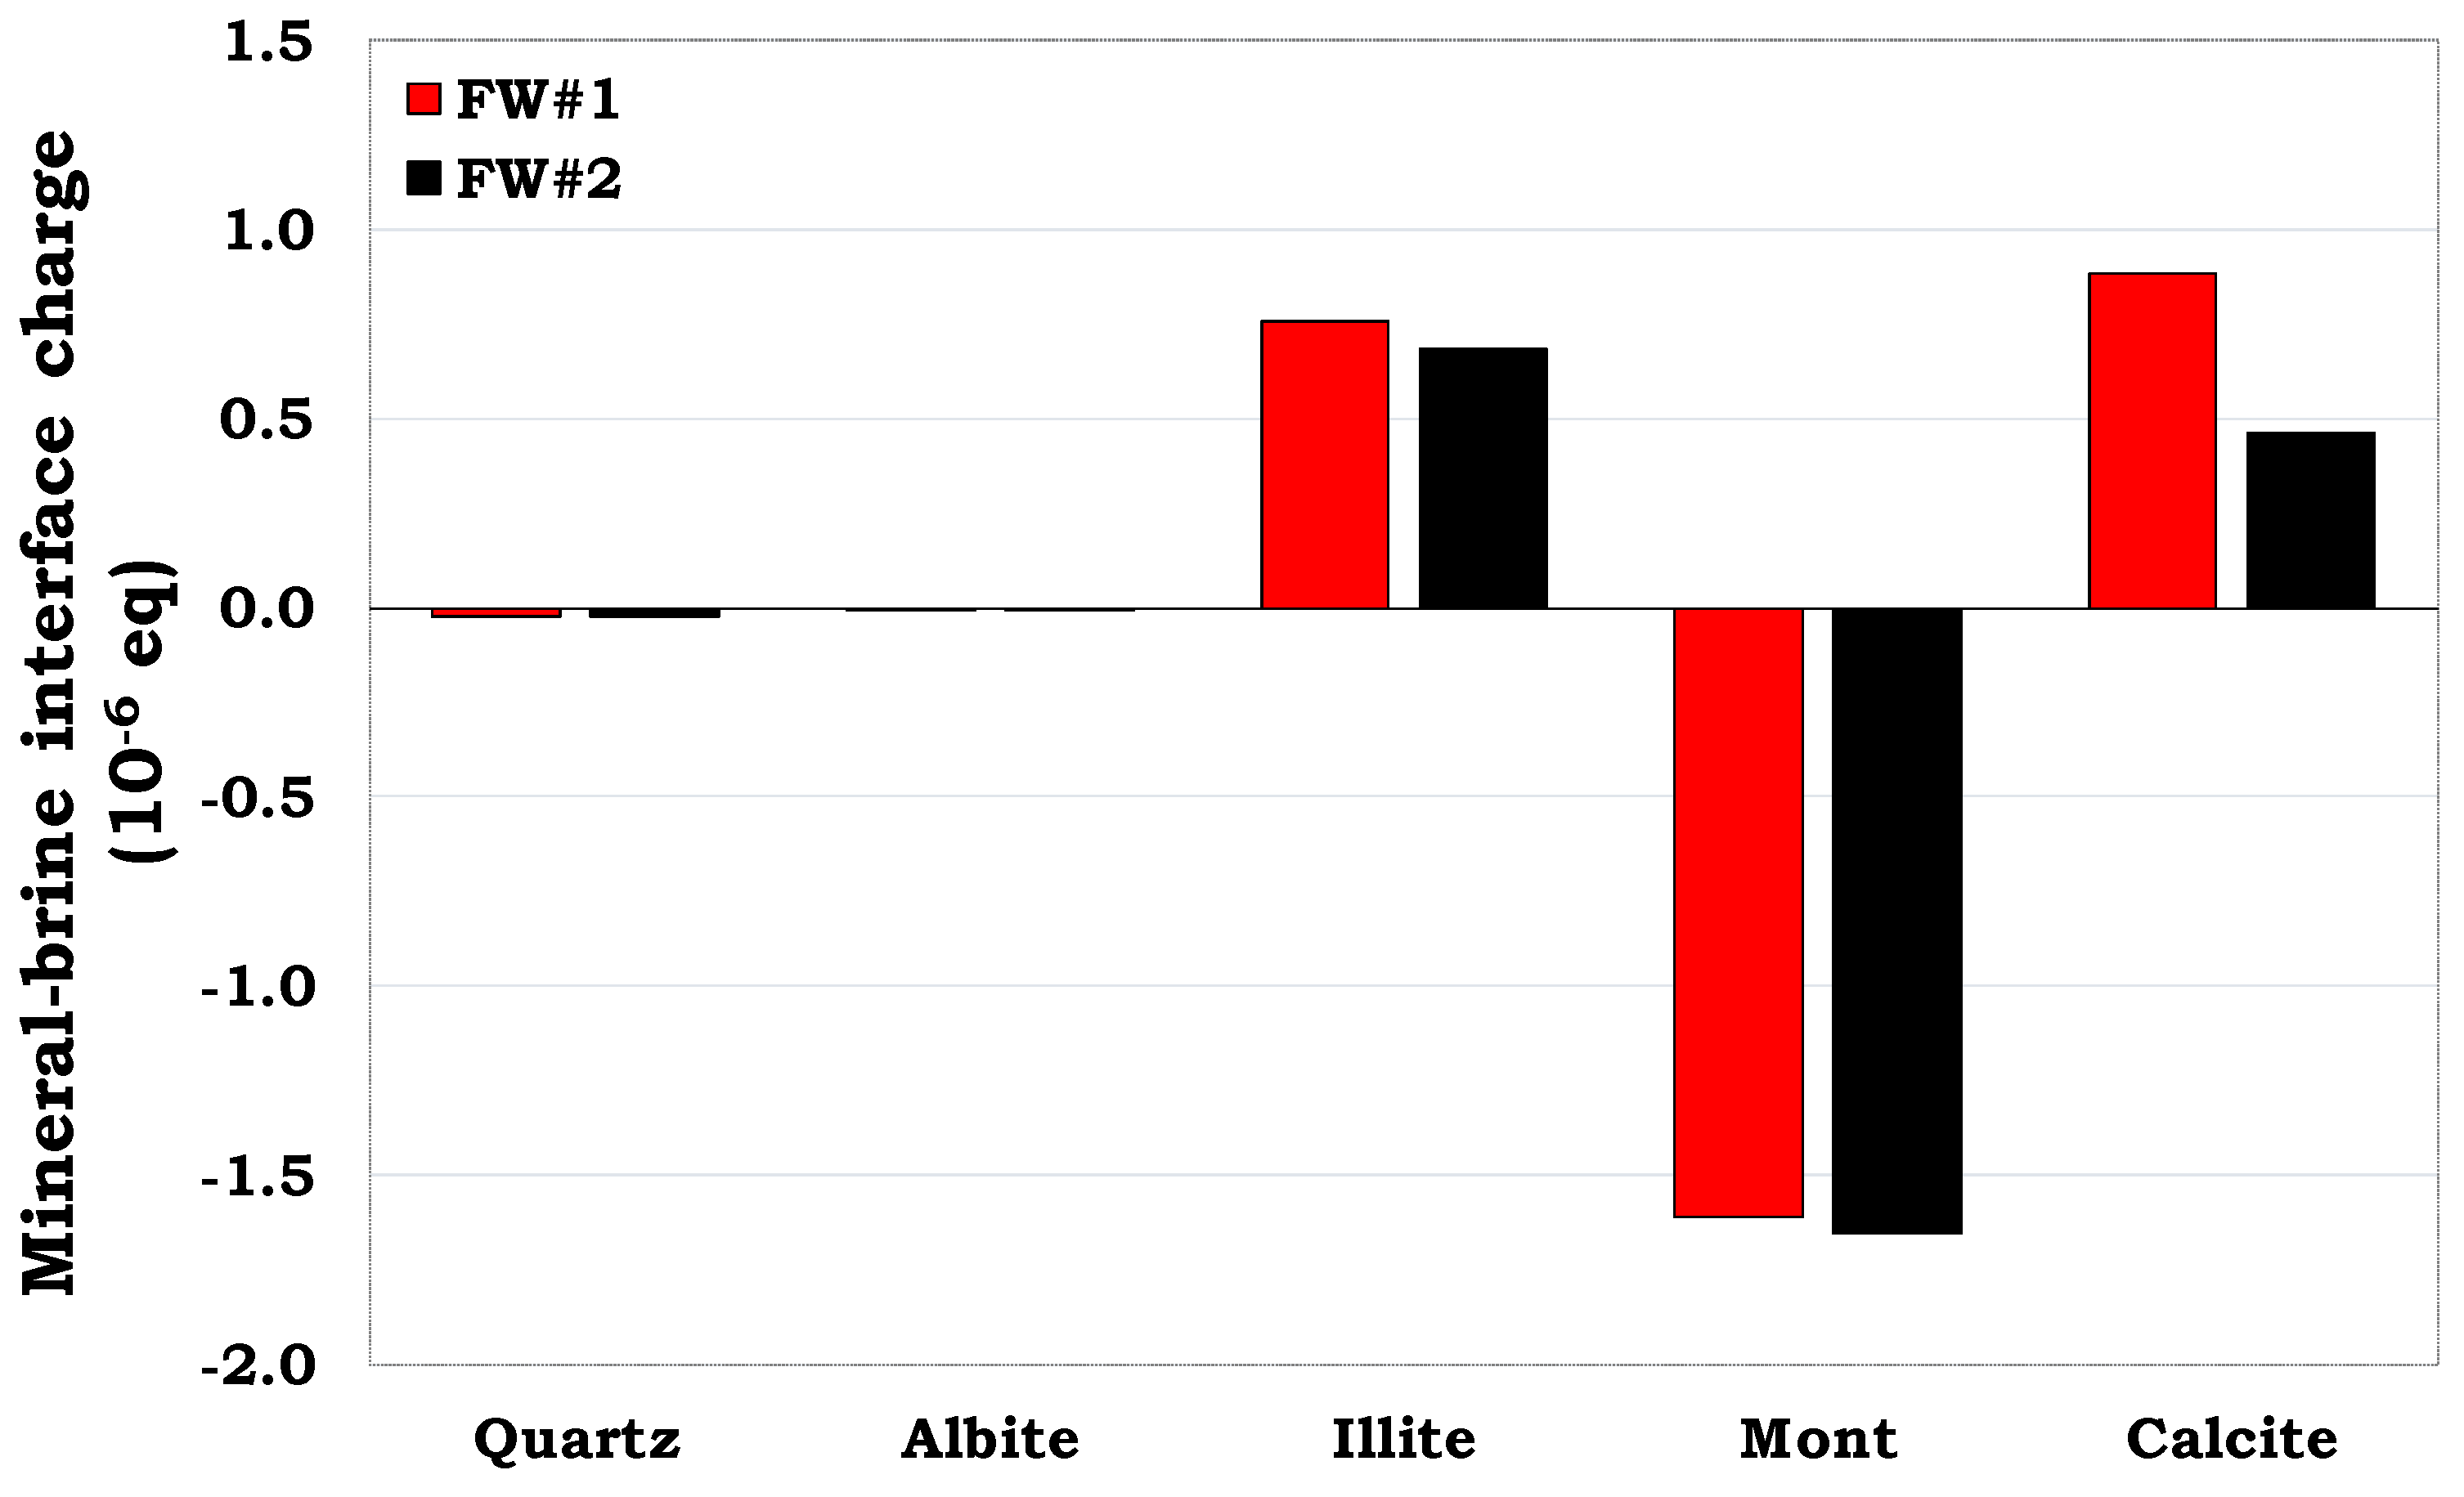
From Figure 18, the surface charges of the illite–FW and the calcite–FW interface were positively charged. This was attributed to the dominant positive sites in both illite (>SOH2+) and calcite (>CaOH2+). Hence, increasing the content of these minerals in the MMs increases their tendencies to adsorb the carboxylate components in the oil (>COO−), thus providing the observed outcome. Conversely, the negative mineral–FW interface charge was attributed to the dominance of the >SO− sites in quartz, albite and montmorillonite.
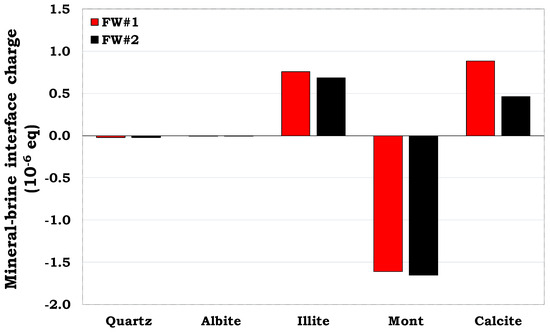
Figure 18.
This figure illustrates the mineral–FW interfacial polarity prediction.
3.5.2. Prediction of the Oil–Brine Interfacial Charge
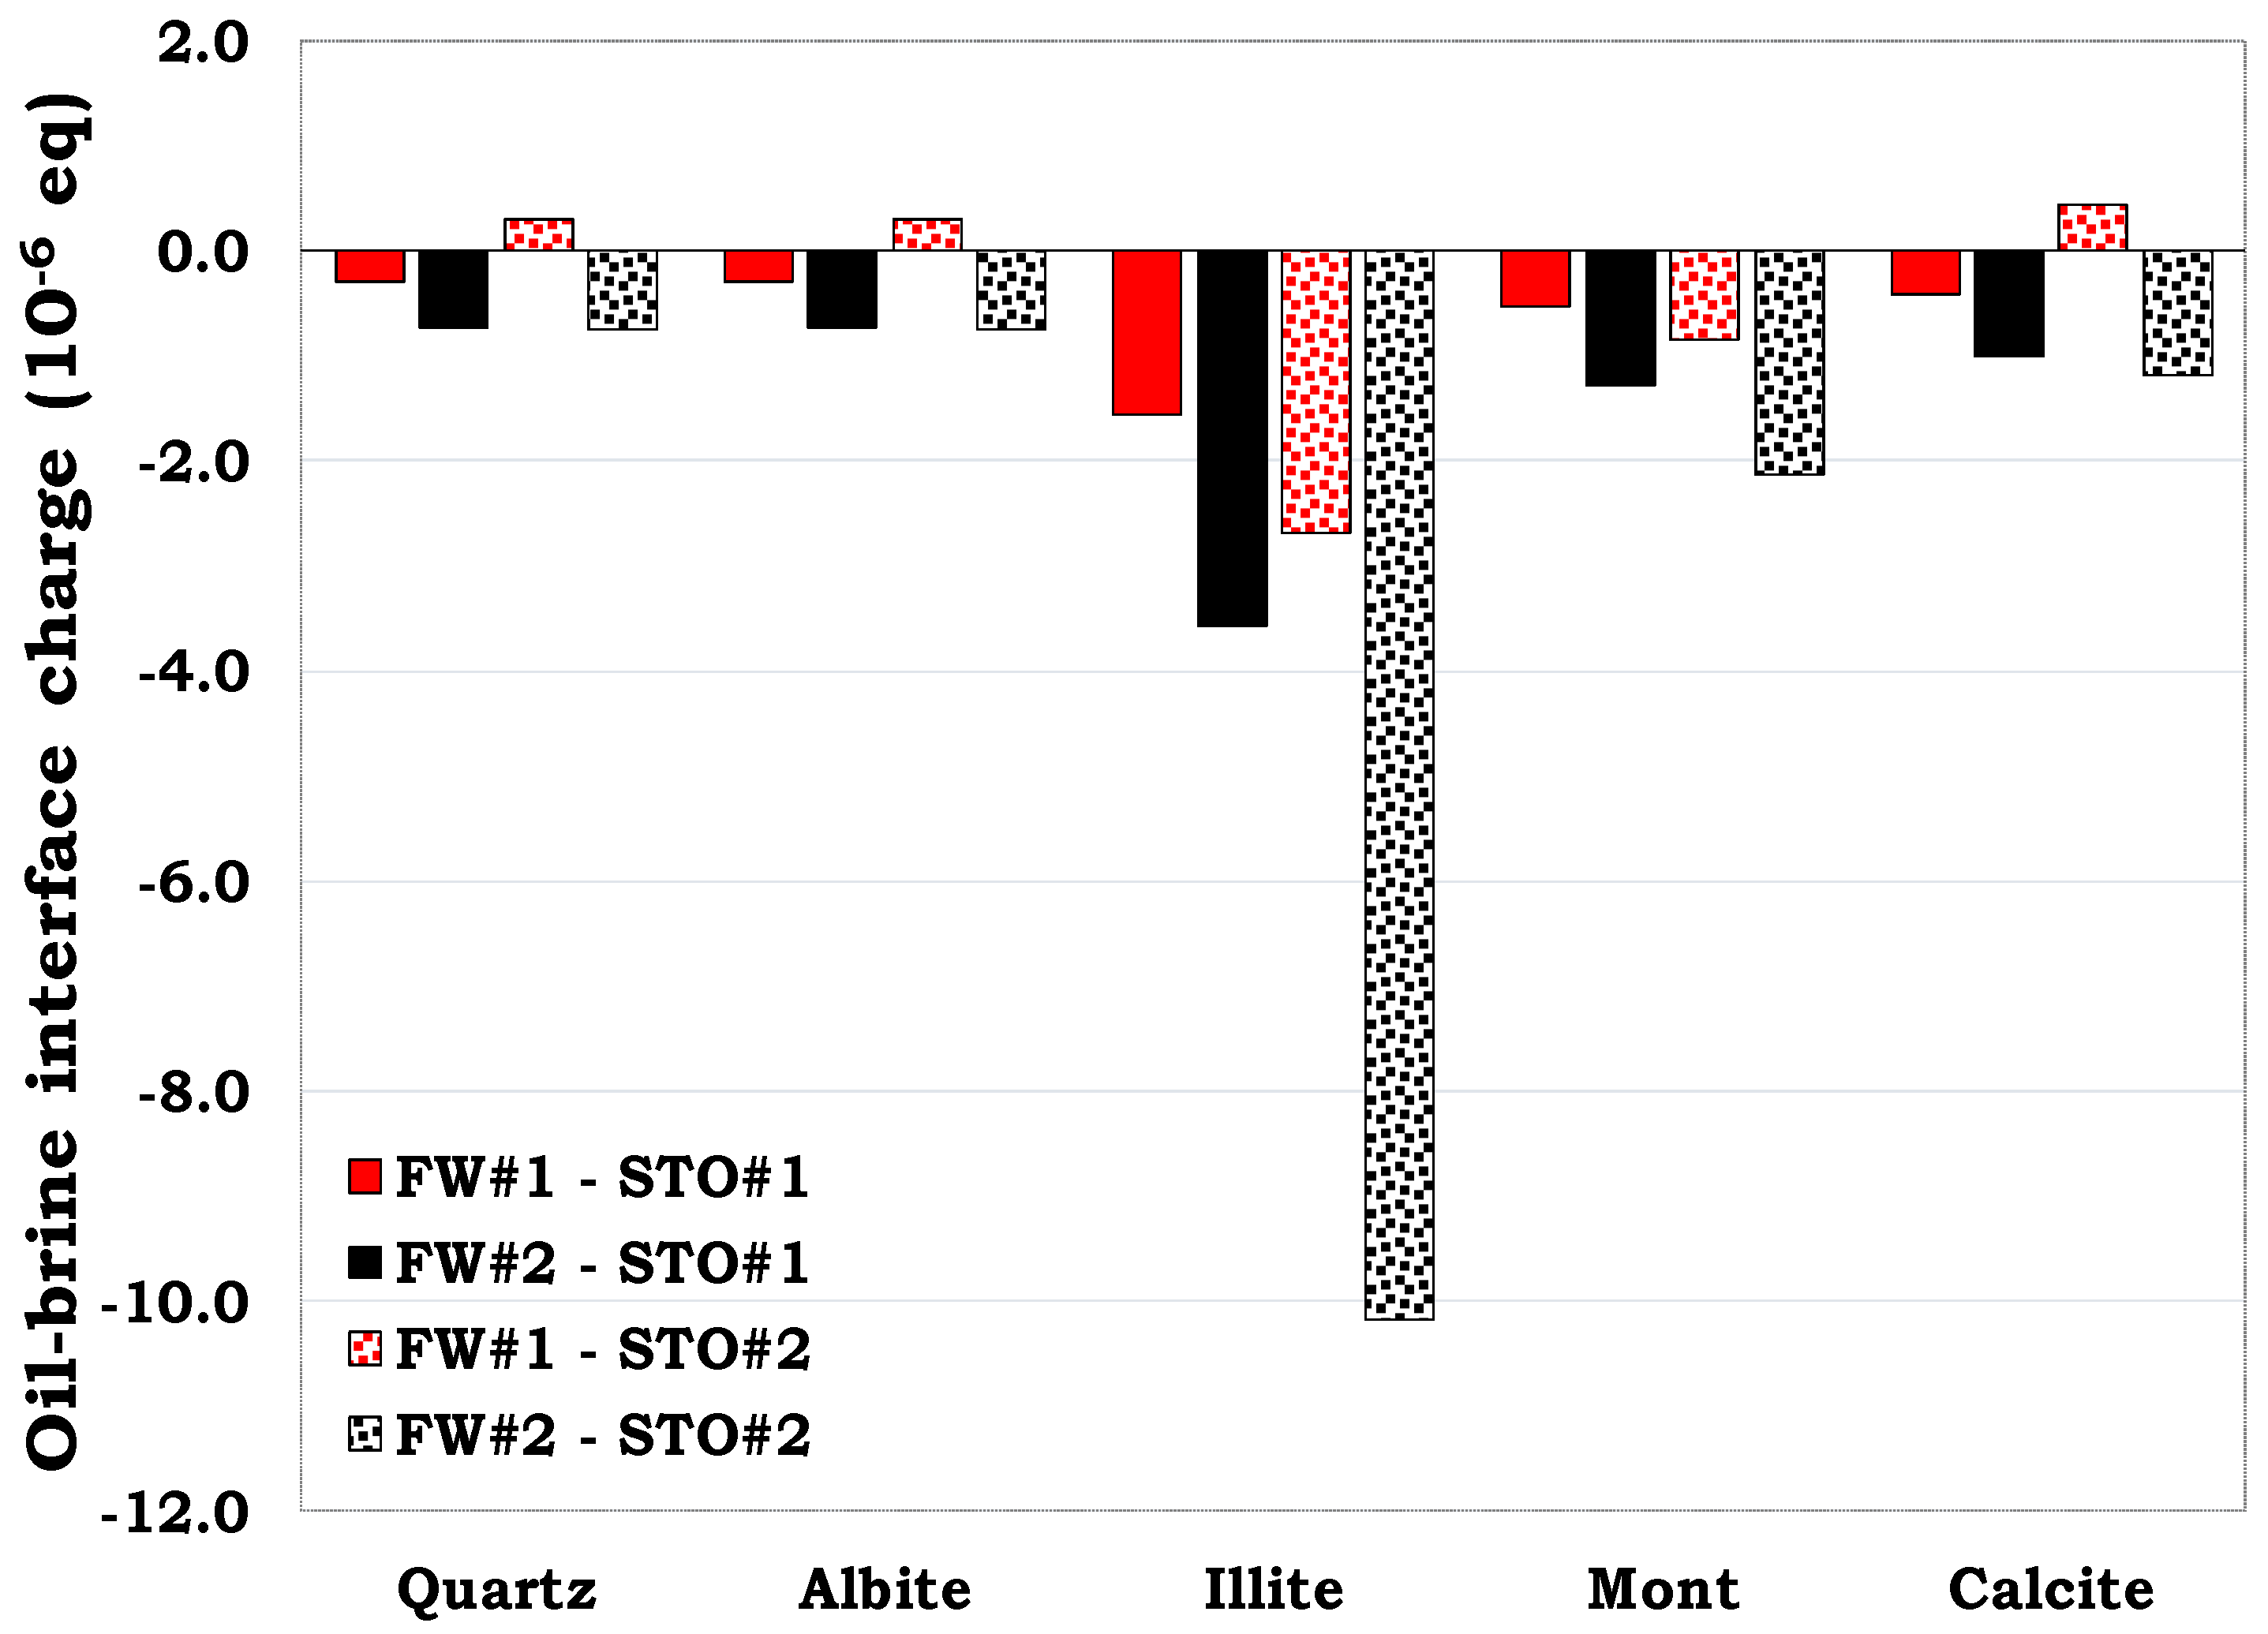
The oil–FW interfaces were mostly negatively charged with the exception of the STO #2-FW #1 interfaces, which were predominantly cationic (Figure 19). This was attributed to the positive oil–complex formed by Ca2+ and Mg2+ in brine with carboxylate (>COO−). Since the concentration of Ca2+ in the FW #1 was higher than that in FW #2 (Table 3), it can be concluded that more divalent cations are available to be bonded to the carboxylate (>COO−) to form the positive oil complexes (>COOCa+ and >COOMg+).
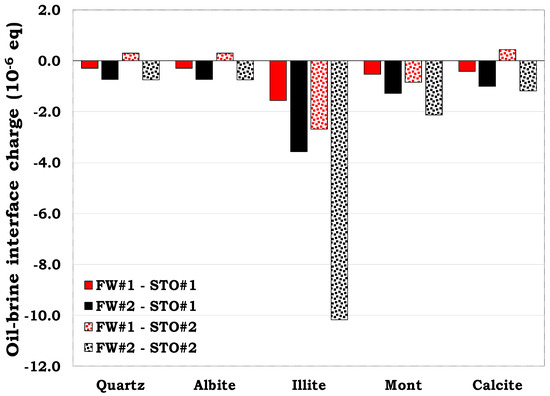
Figure 19.
This figure illustrates the prediction of the oil–FW interfacial polarity.
3.6. Effect of Rock and Fluid Properties on Wettability; Flotation Test Versus Equivalent Surface Area
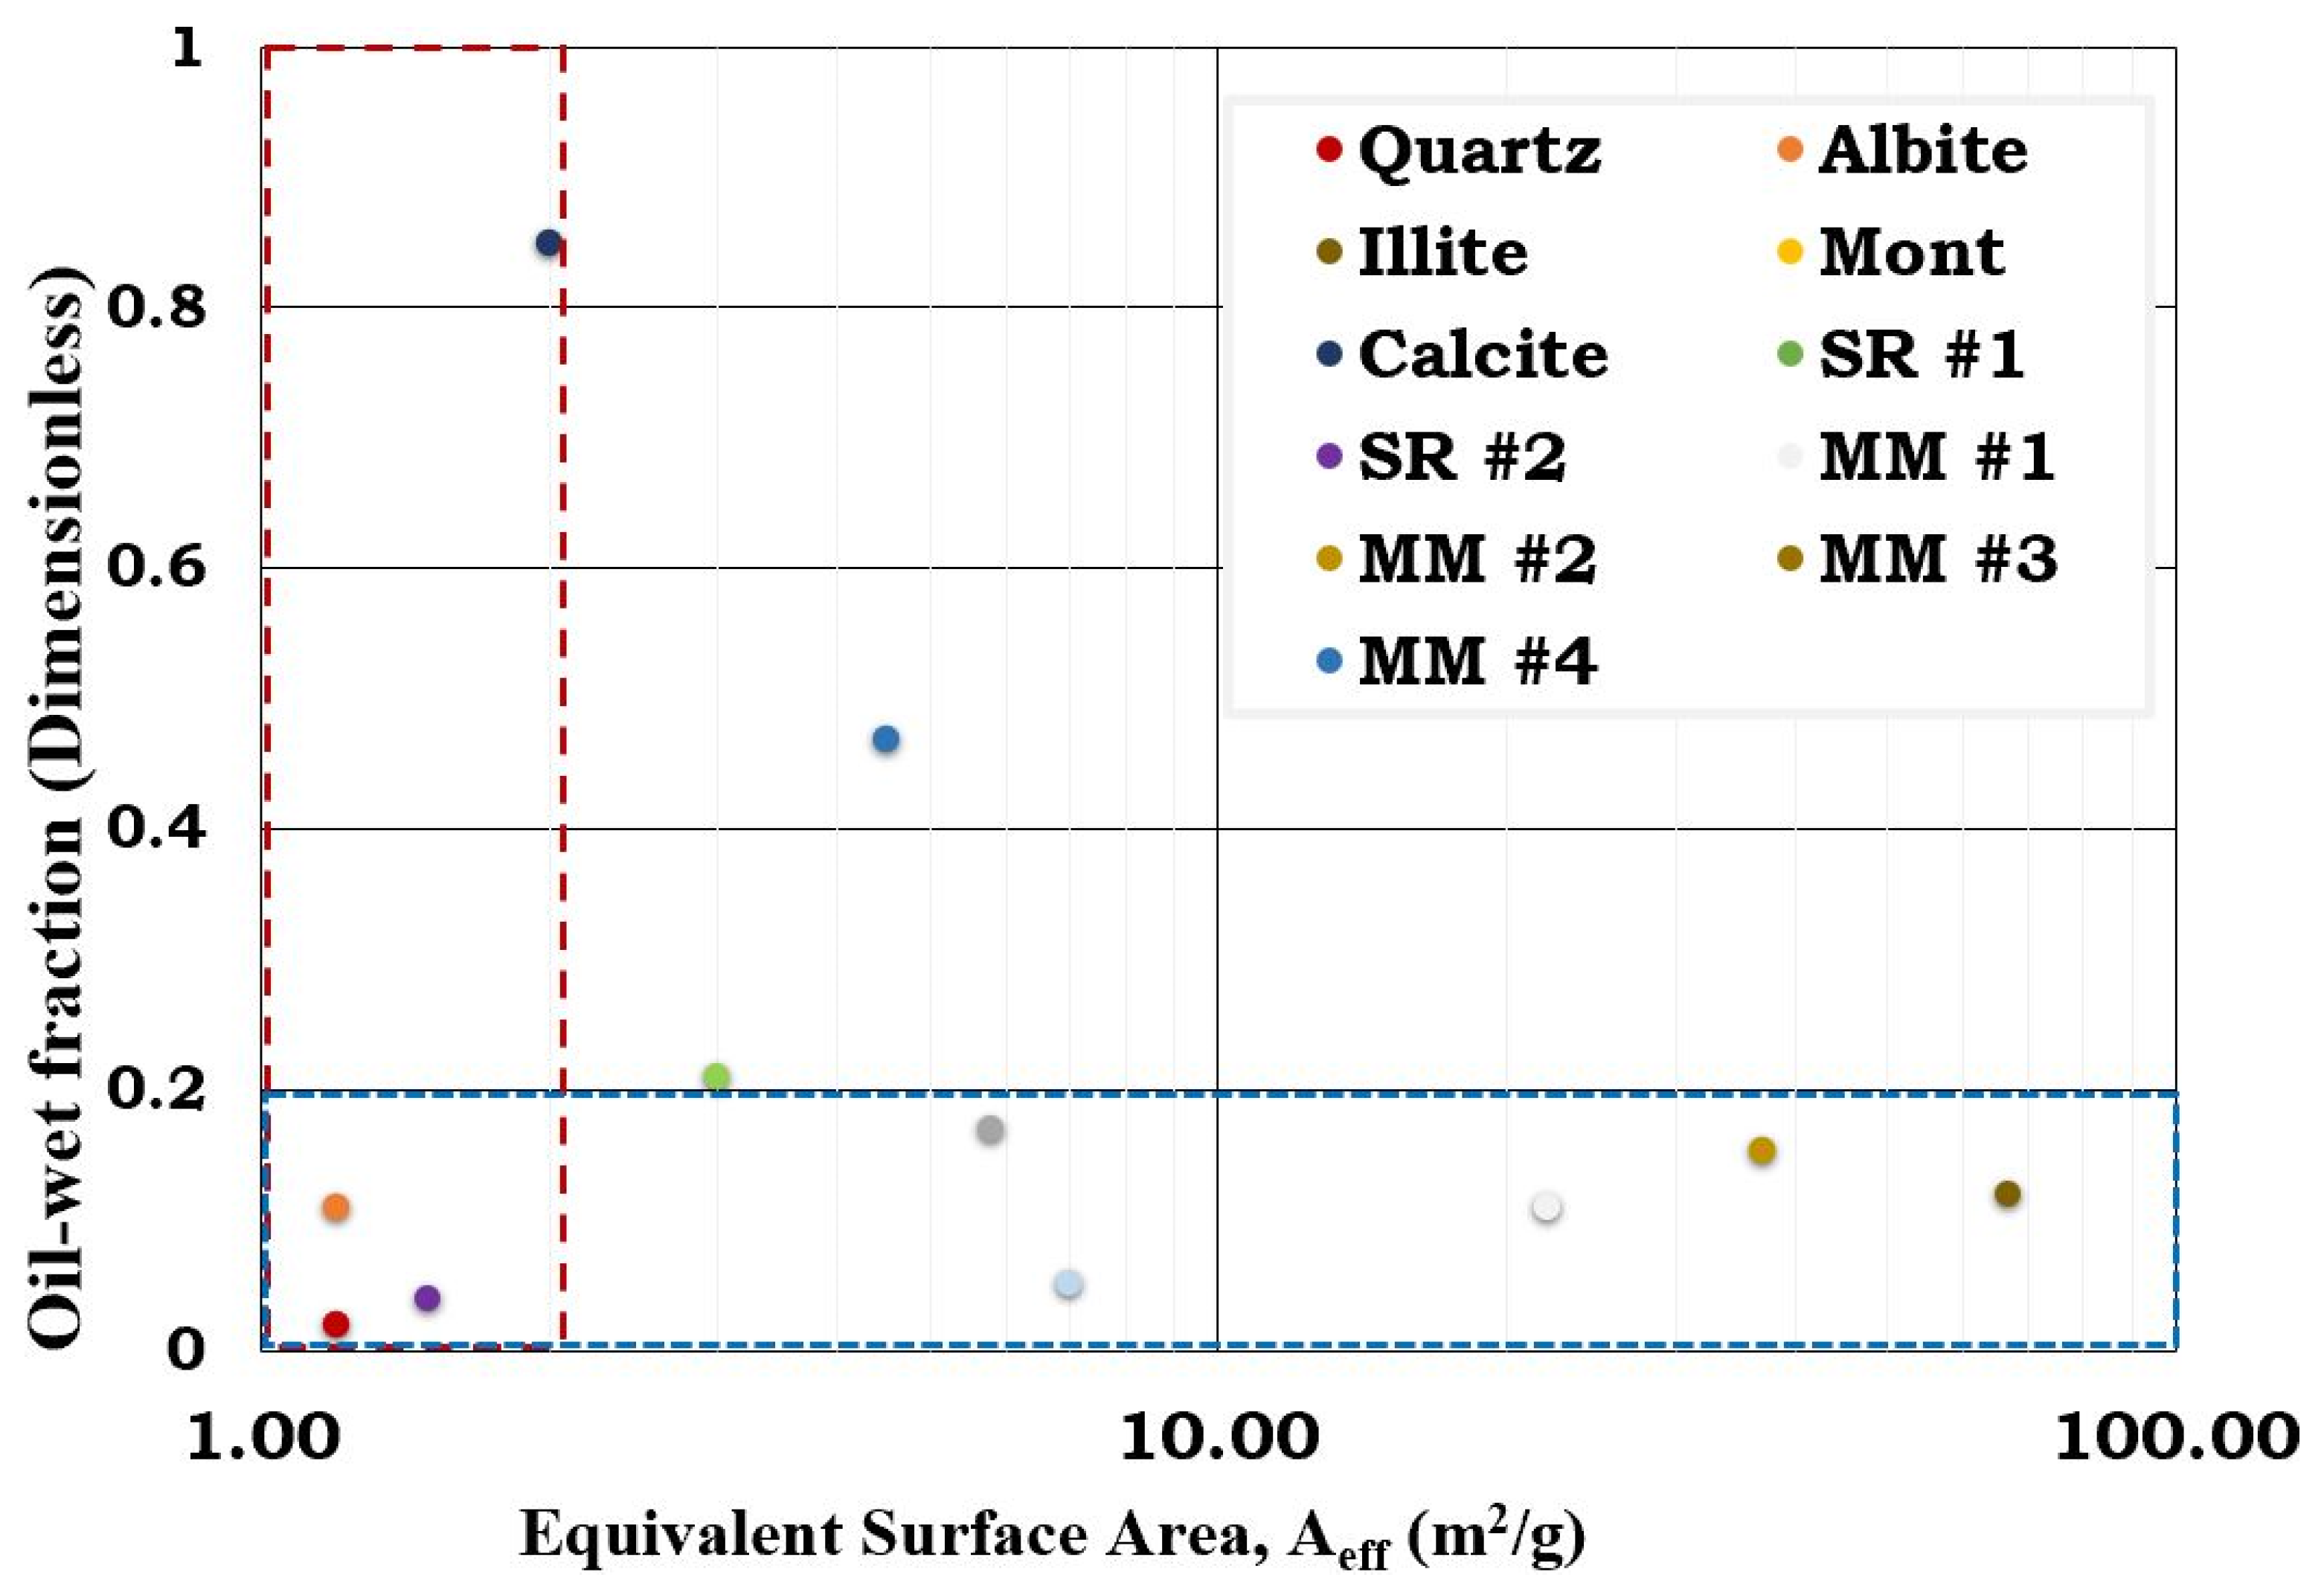
This presented study seeks to investigate the role of increasing the illite and calcite contents in the sandstone reservoir rock (SR #1). It can be inferred from Figure 20 that the wetting states of the reservoir rocks were dictated by either the surface area or calcite content. In other words, MM #1 and MM #2 were illite-dominated, while the MM #3 and MM #4 were calcite-dominated. Based on the mass fraction, the dominant minerals in the studied SR and MM were quartz, illite and calcite, with surface areas of 1.2 m2/g, 66.8 m2/g and 2 m2/g, correspondingly. For SR #1, its equivalent surface area (7.0 m2/g) was illite-dominated (5.88 m2/g), with the second dominant mineral being quartz (1.00 m2/g). Though the mass fraction of illite in the SR #1 was relatively small (8.8%) when likened to quartz (83.7%), the inherent surface area of illite (66.8 m2/g) was higher than quartz (1.2 m2/g), and hence, the observed results. Since the wettability of the two dominant minerals in SR #1, notably quartz (~0.05) and illite (~0.15), were both hydrophilic (Figure 3), it was not surprising that SR #1 was also observed to be hydrophilic (Figure 20). Unlike the illite-dominated SR #1 with a relatively high equivalent surface area (7.0 m2/g), the SR #2 on the other hand was quartz-dominated and hence had a relatively small equivalent surface area (1.5 m2/g). The equivalent surface areas of the two dominant minerals in the SR #2 were 1.14 m2/g (quartz) and 0.27 m2/g (illite). Though the mass fraction of illite in SR #2 was negligible (0.4%) as compared to quartz (94.9%), the former also contributed meaningfully to the equivalent surface area of SR #2 due to its relatively large surface area (66.8 m2/g) when likened to quartz (1.2 m2/g). It was not surprising that the SR #2 was hydrophilic since the dominant minerals in its composition, such as quartz (~0.05) and illite (~0.15), were also observed to be strongly hydrophilic, as depicted by the flotation tests results (Figure 3). Hence, it can be concluded that the wetting preferences of the reservoir rocks (SR #1 and SR #2) were dictated by their equivalent surface area.
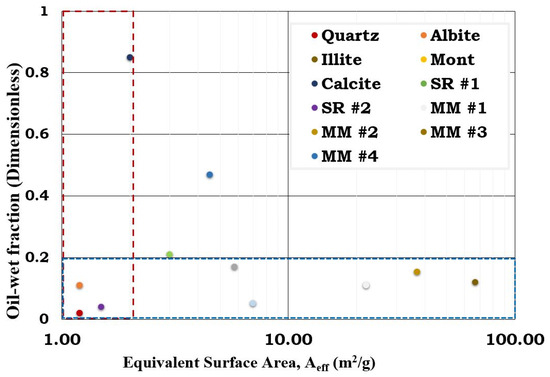
Figure 20.
This figure illustrates the effect of the equivalent surface area on wetting preferences.
Considering the MMs with high illite contents (MM #1 and MM #2), it can be concluded that the wetting state of the reservoir rock was influenced by the surface area of illite. In other words, the wetting states of MM #1 and MM #2 were observed to be in the same order as the mineral with a predominant surface area. Though the mass fraction of the illite in the MM #1 was relatively small (31.6%) as compared to that of quartz (62.8%), its contribution to the equivalent surface area of the MM #1 (22.0 m2/g) was 21.11 m2/g as compared to quartz (0.75 m2/g). As discussed earlier, since both the experimental results and the simulated counterpart revealed that illite and quartz were hydrophilic at the studied conditions, the wetting preference of the MM #1 was as expected. Like the MM #1, the equivalent surface area of the MM #2 (36.9 m2/g) was dominated by illite (36.34 m2/g), while the contribution from quartz was negligible (0.5 m2/g). This was attributed to the mass fractions of the constituent minerals (Table 1) and their surface areas (Table 5). Unlike the MM #1 and MM #2, which were mainly controlled by water–wet minerals, MM #3 and MM #4 were dictated by both water–wet minerals and hydrophobic (calcite) minerals. Nonetheless, the flotation test and the SCM results reveal that the hydrophobic minerals had a more distinct impact on the wetting preferences of the SR and MM than the hydrophilic counterparts, and hence, the observed results.
3.7. Statistical Analysis of the Correlation between the Flotation Test and the SCM Results
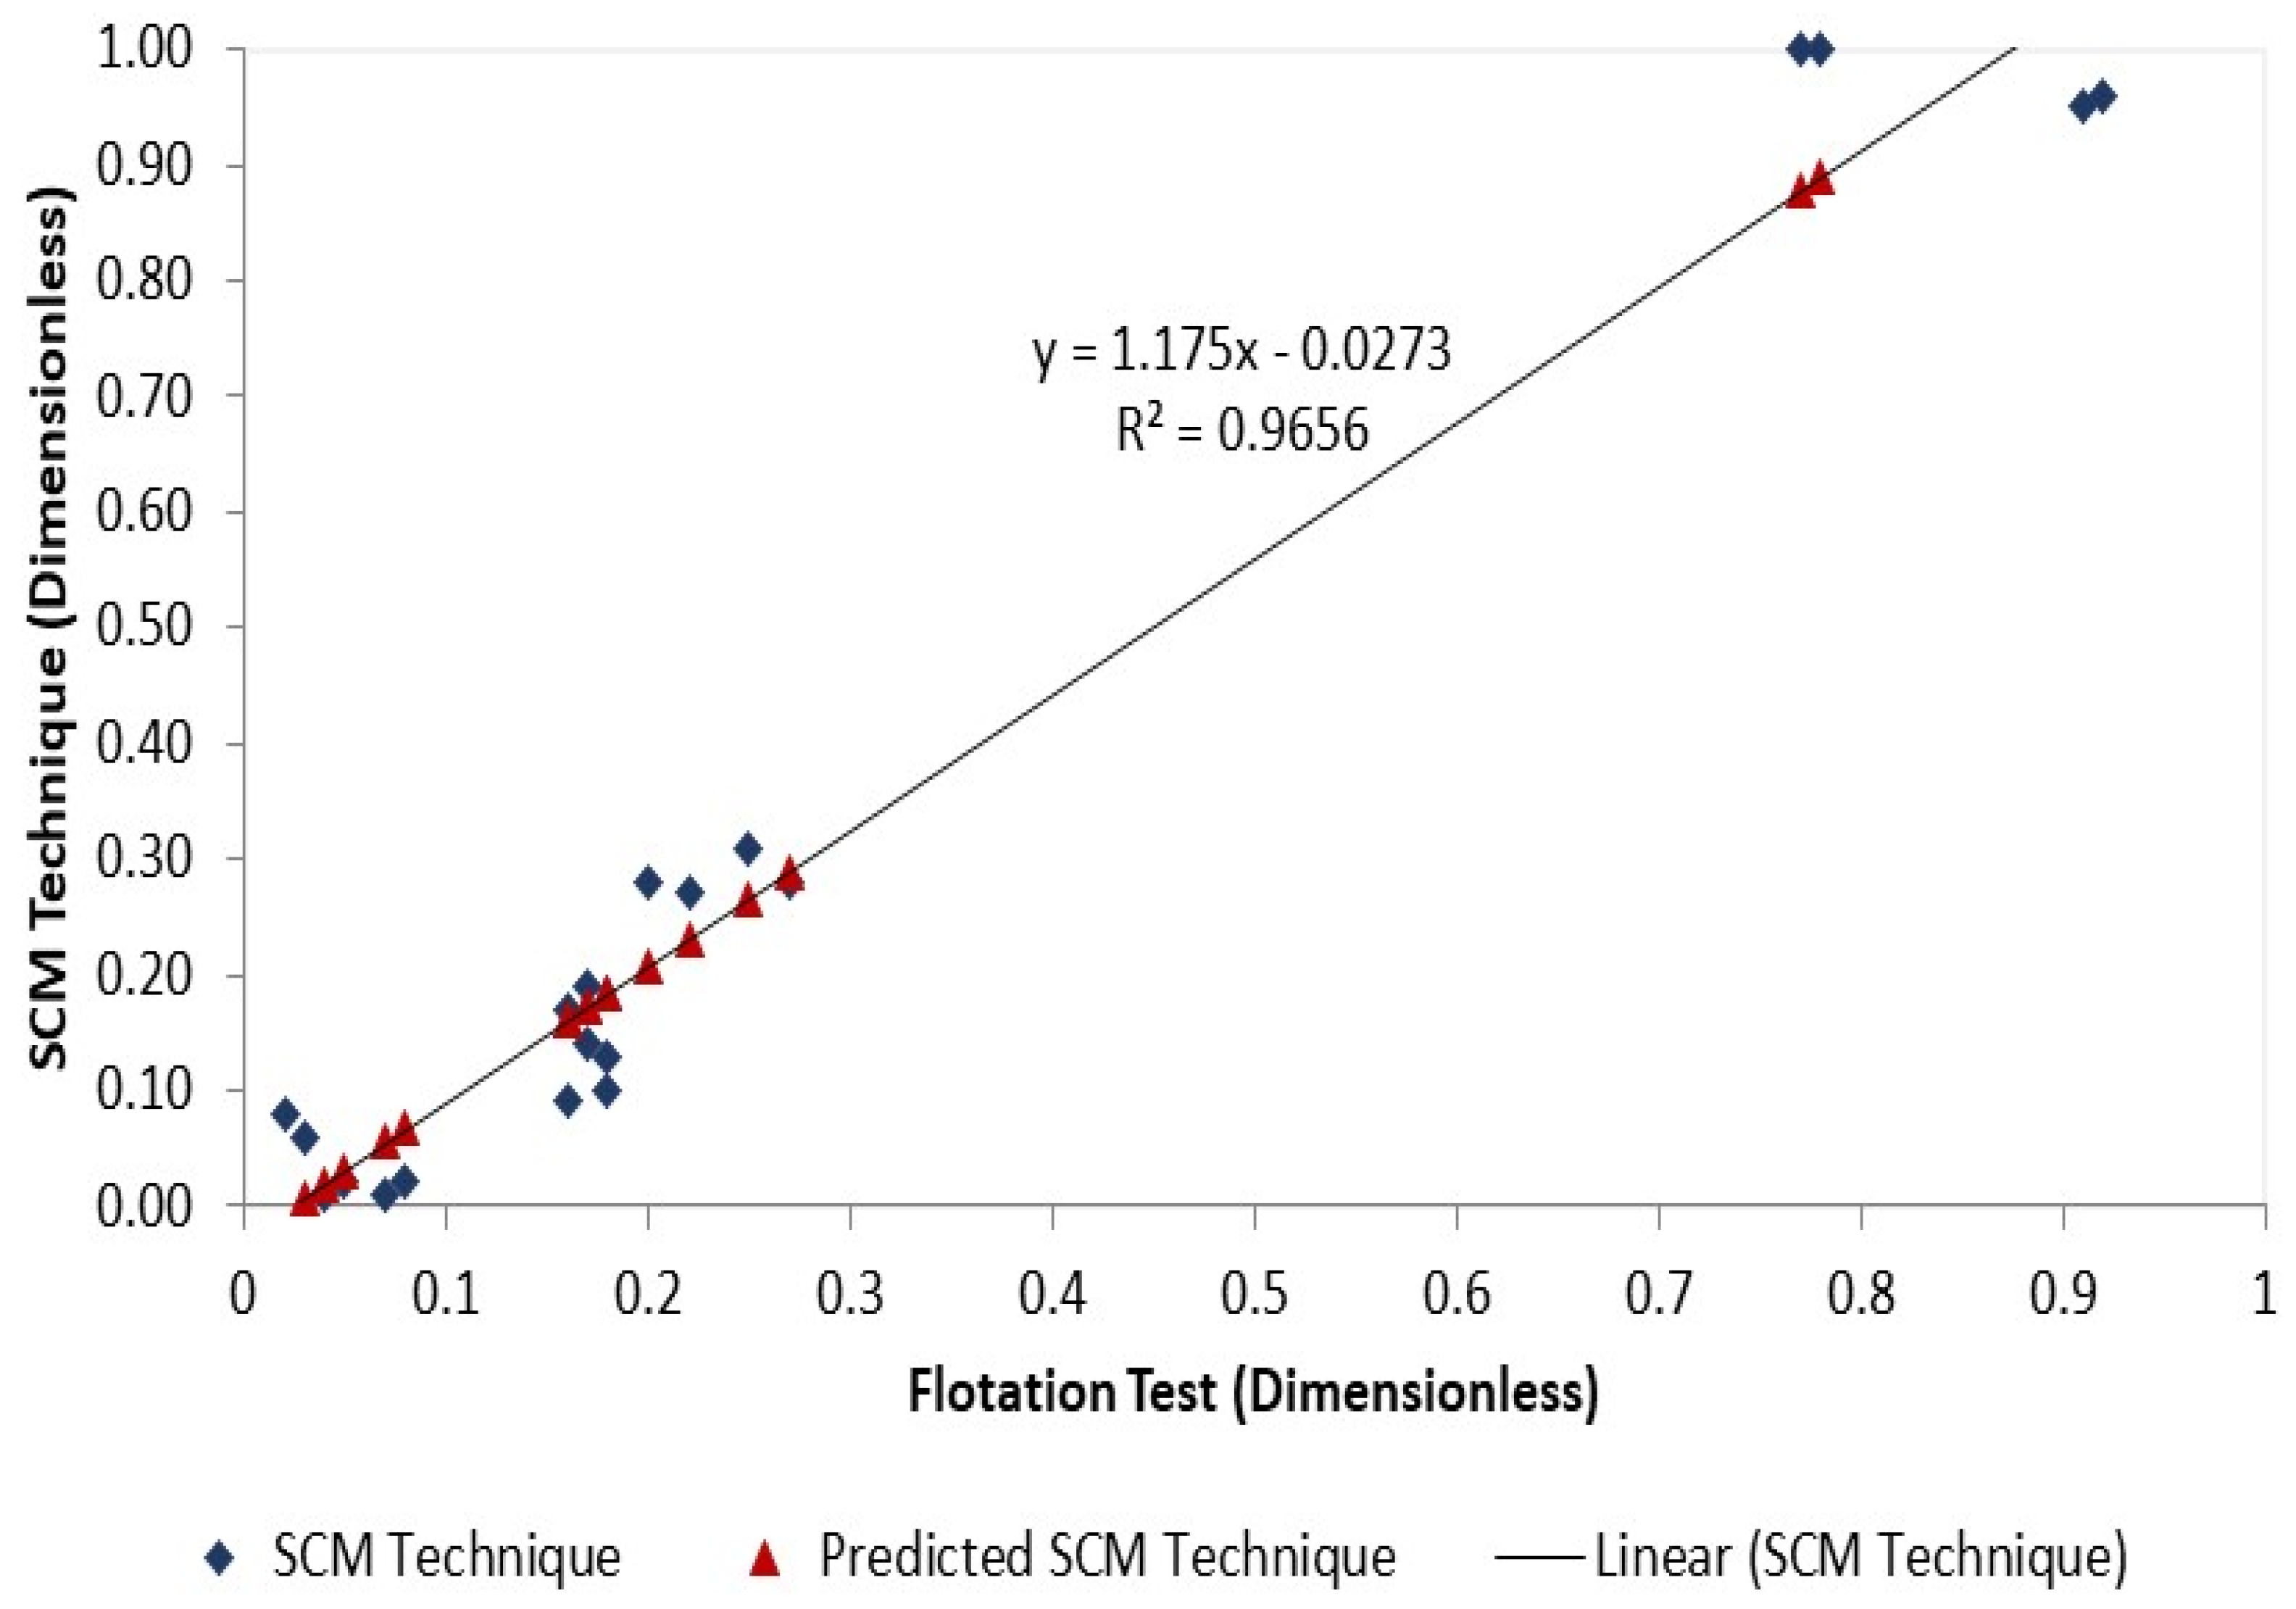
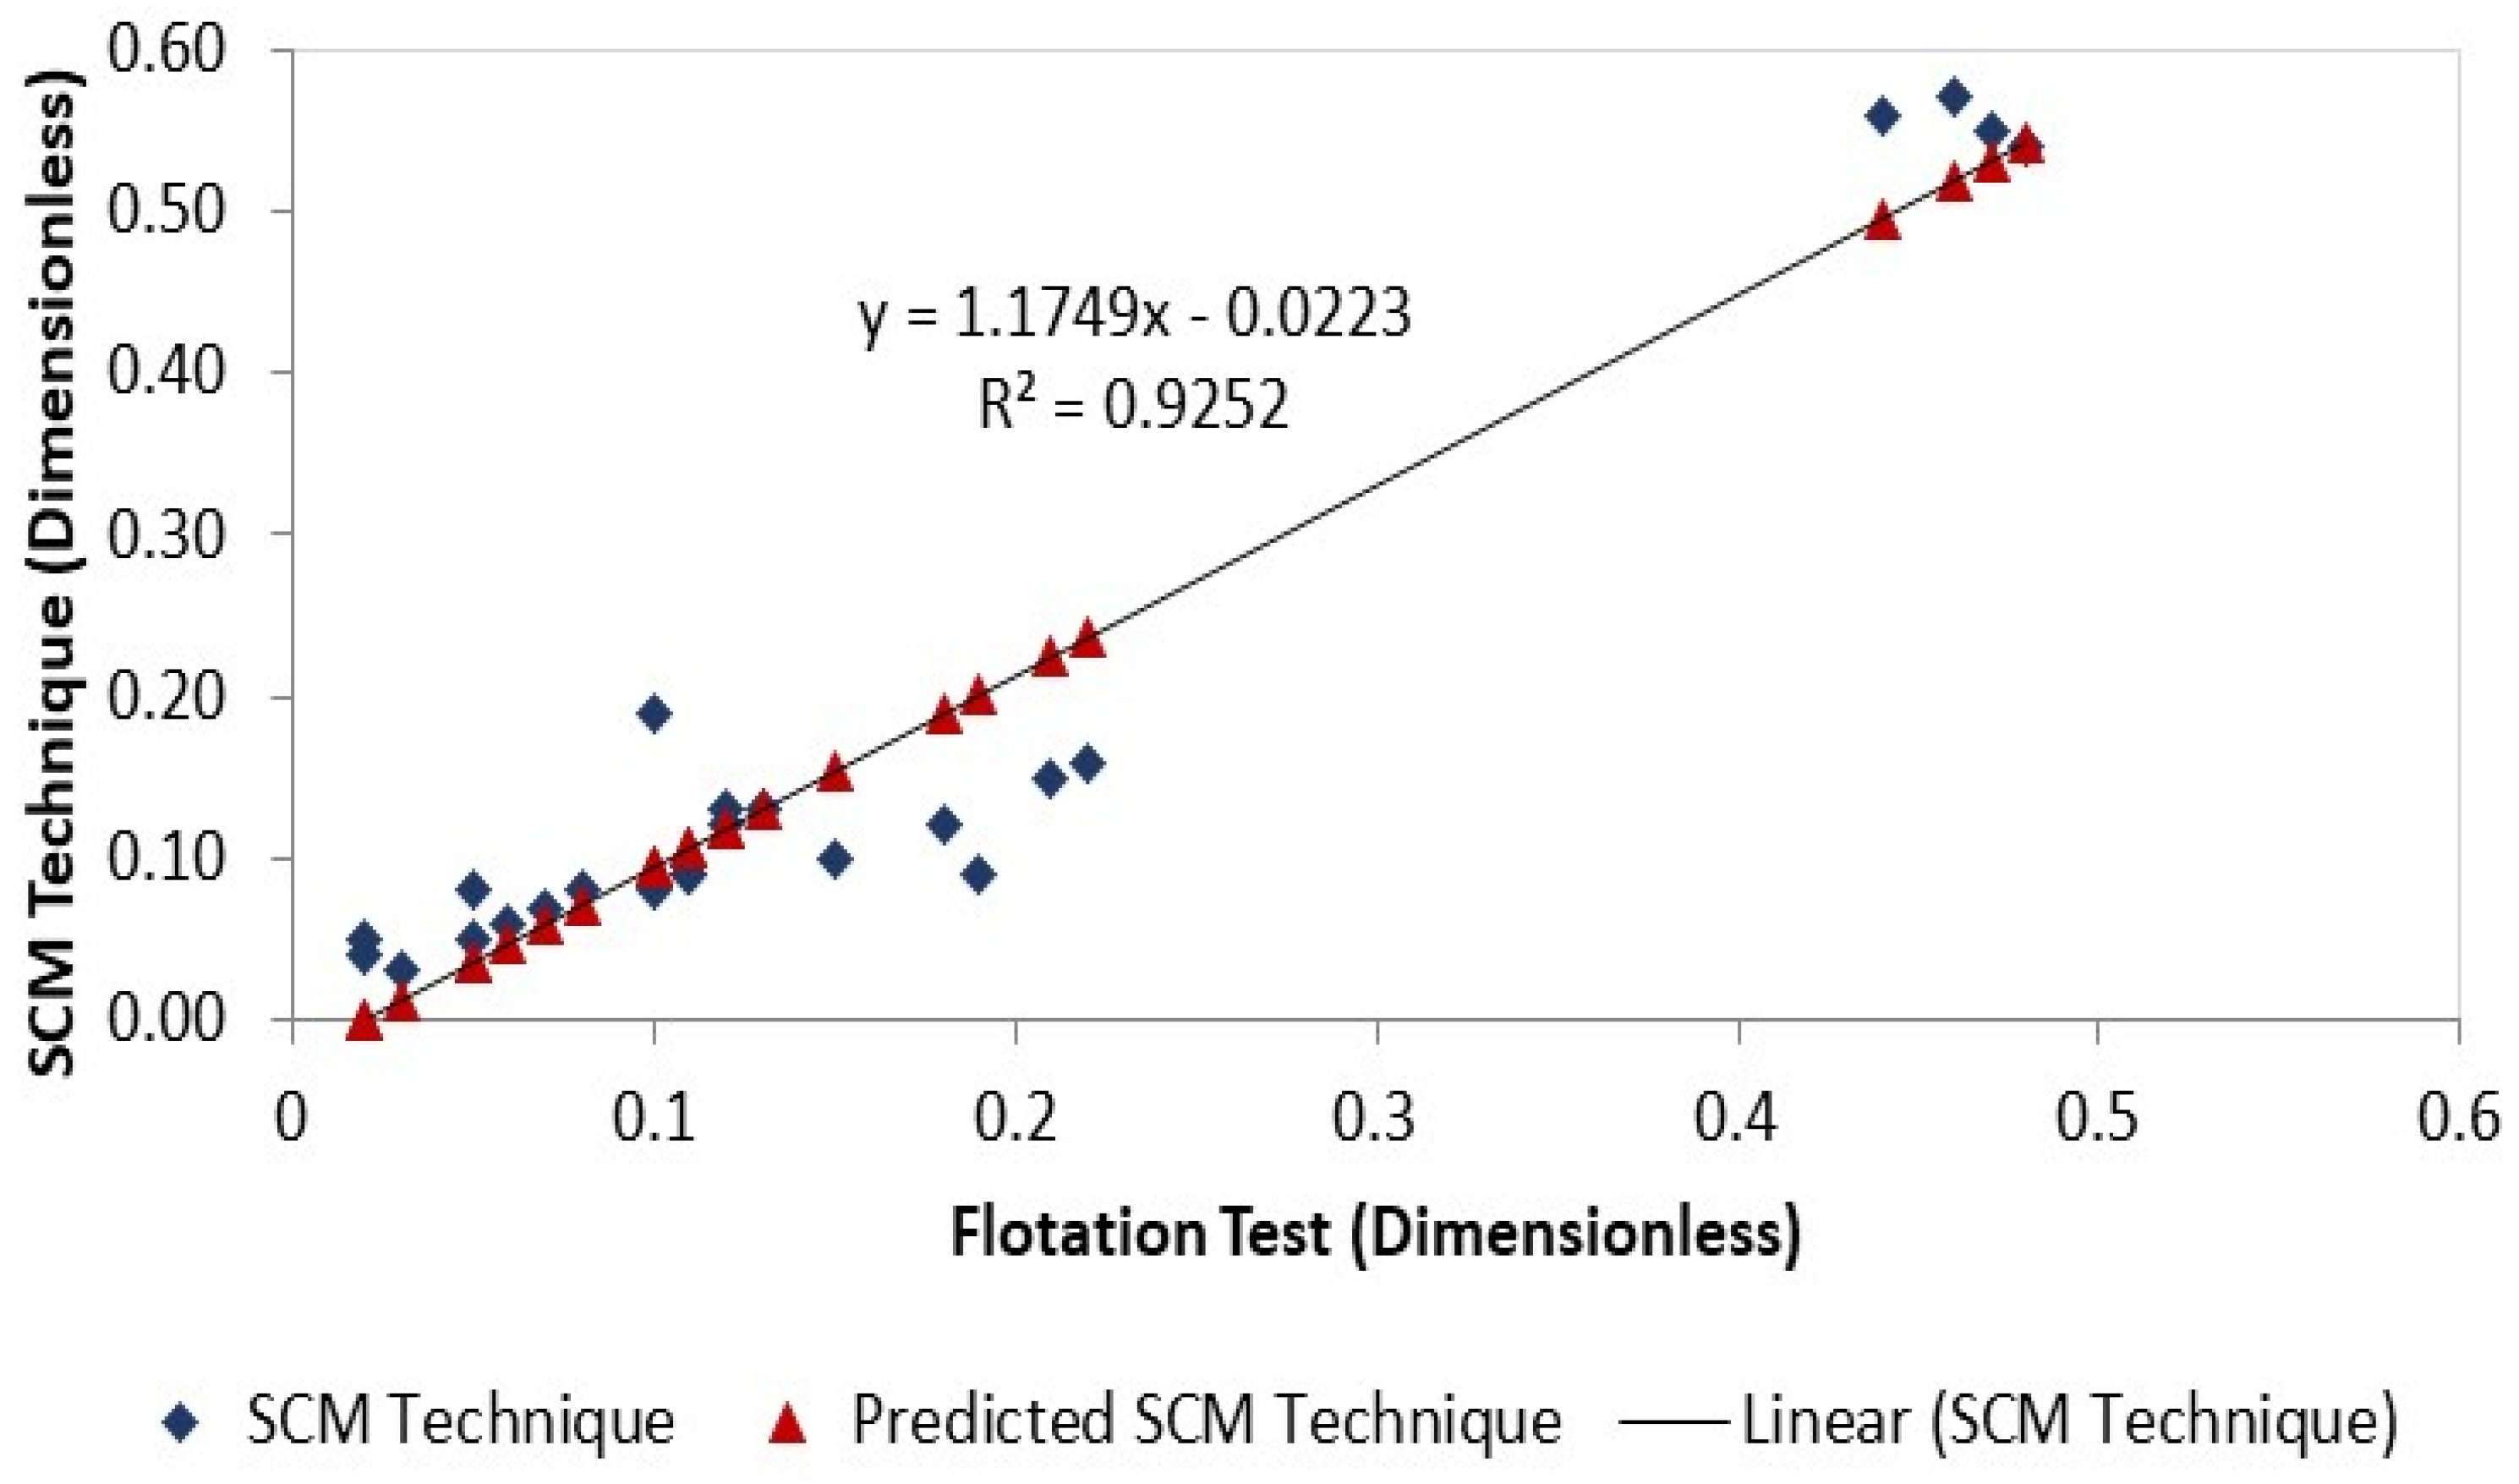
A regression analysis of the flotation test and the SCM correlation was carried out for both the individual minerals (Figure 21) and the rock/mineral mixture (Figure 22). From Figure 21, it can be observed that the SCM technique predicted the flotation test results of the individual minerals with high accuracy, with an R2 value of 0.9656.
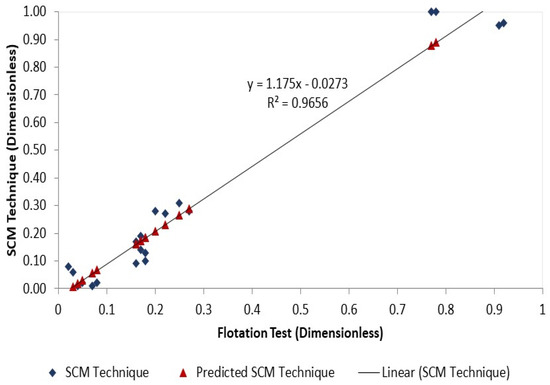
Figure 21.
This figure illustrates the results of the individual mineral flotation tests versus the simulated counterparts (SCM technique).
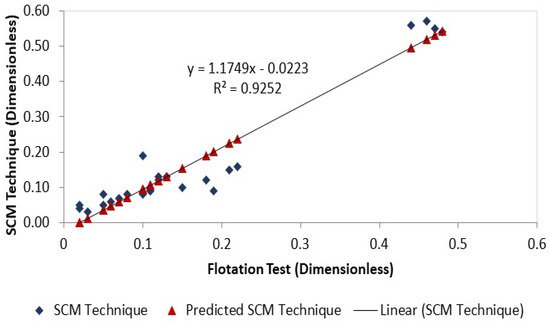
Figure 22.
This figure illustrates the results of the sandstone rock/mineral minerals flotation tests versus the simulated counterparts (SCM technique).
From Figure 22, it can be observed that the flotation test results for the rock/mineral mixtures and their corresponding SCM results show that the latter was able to predict the former with an R2 value of 0.9252.
3.8. Understanding IOR Mechanisms via the SCM Technique
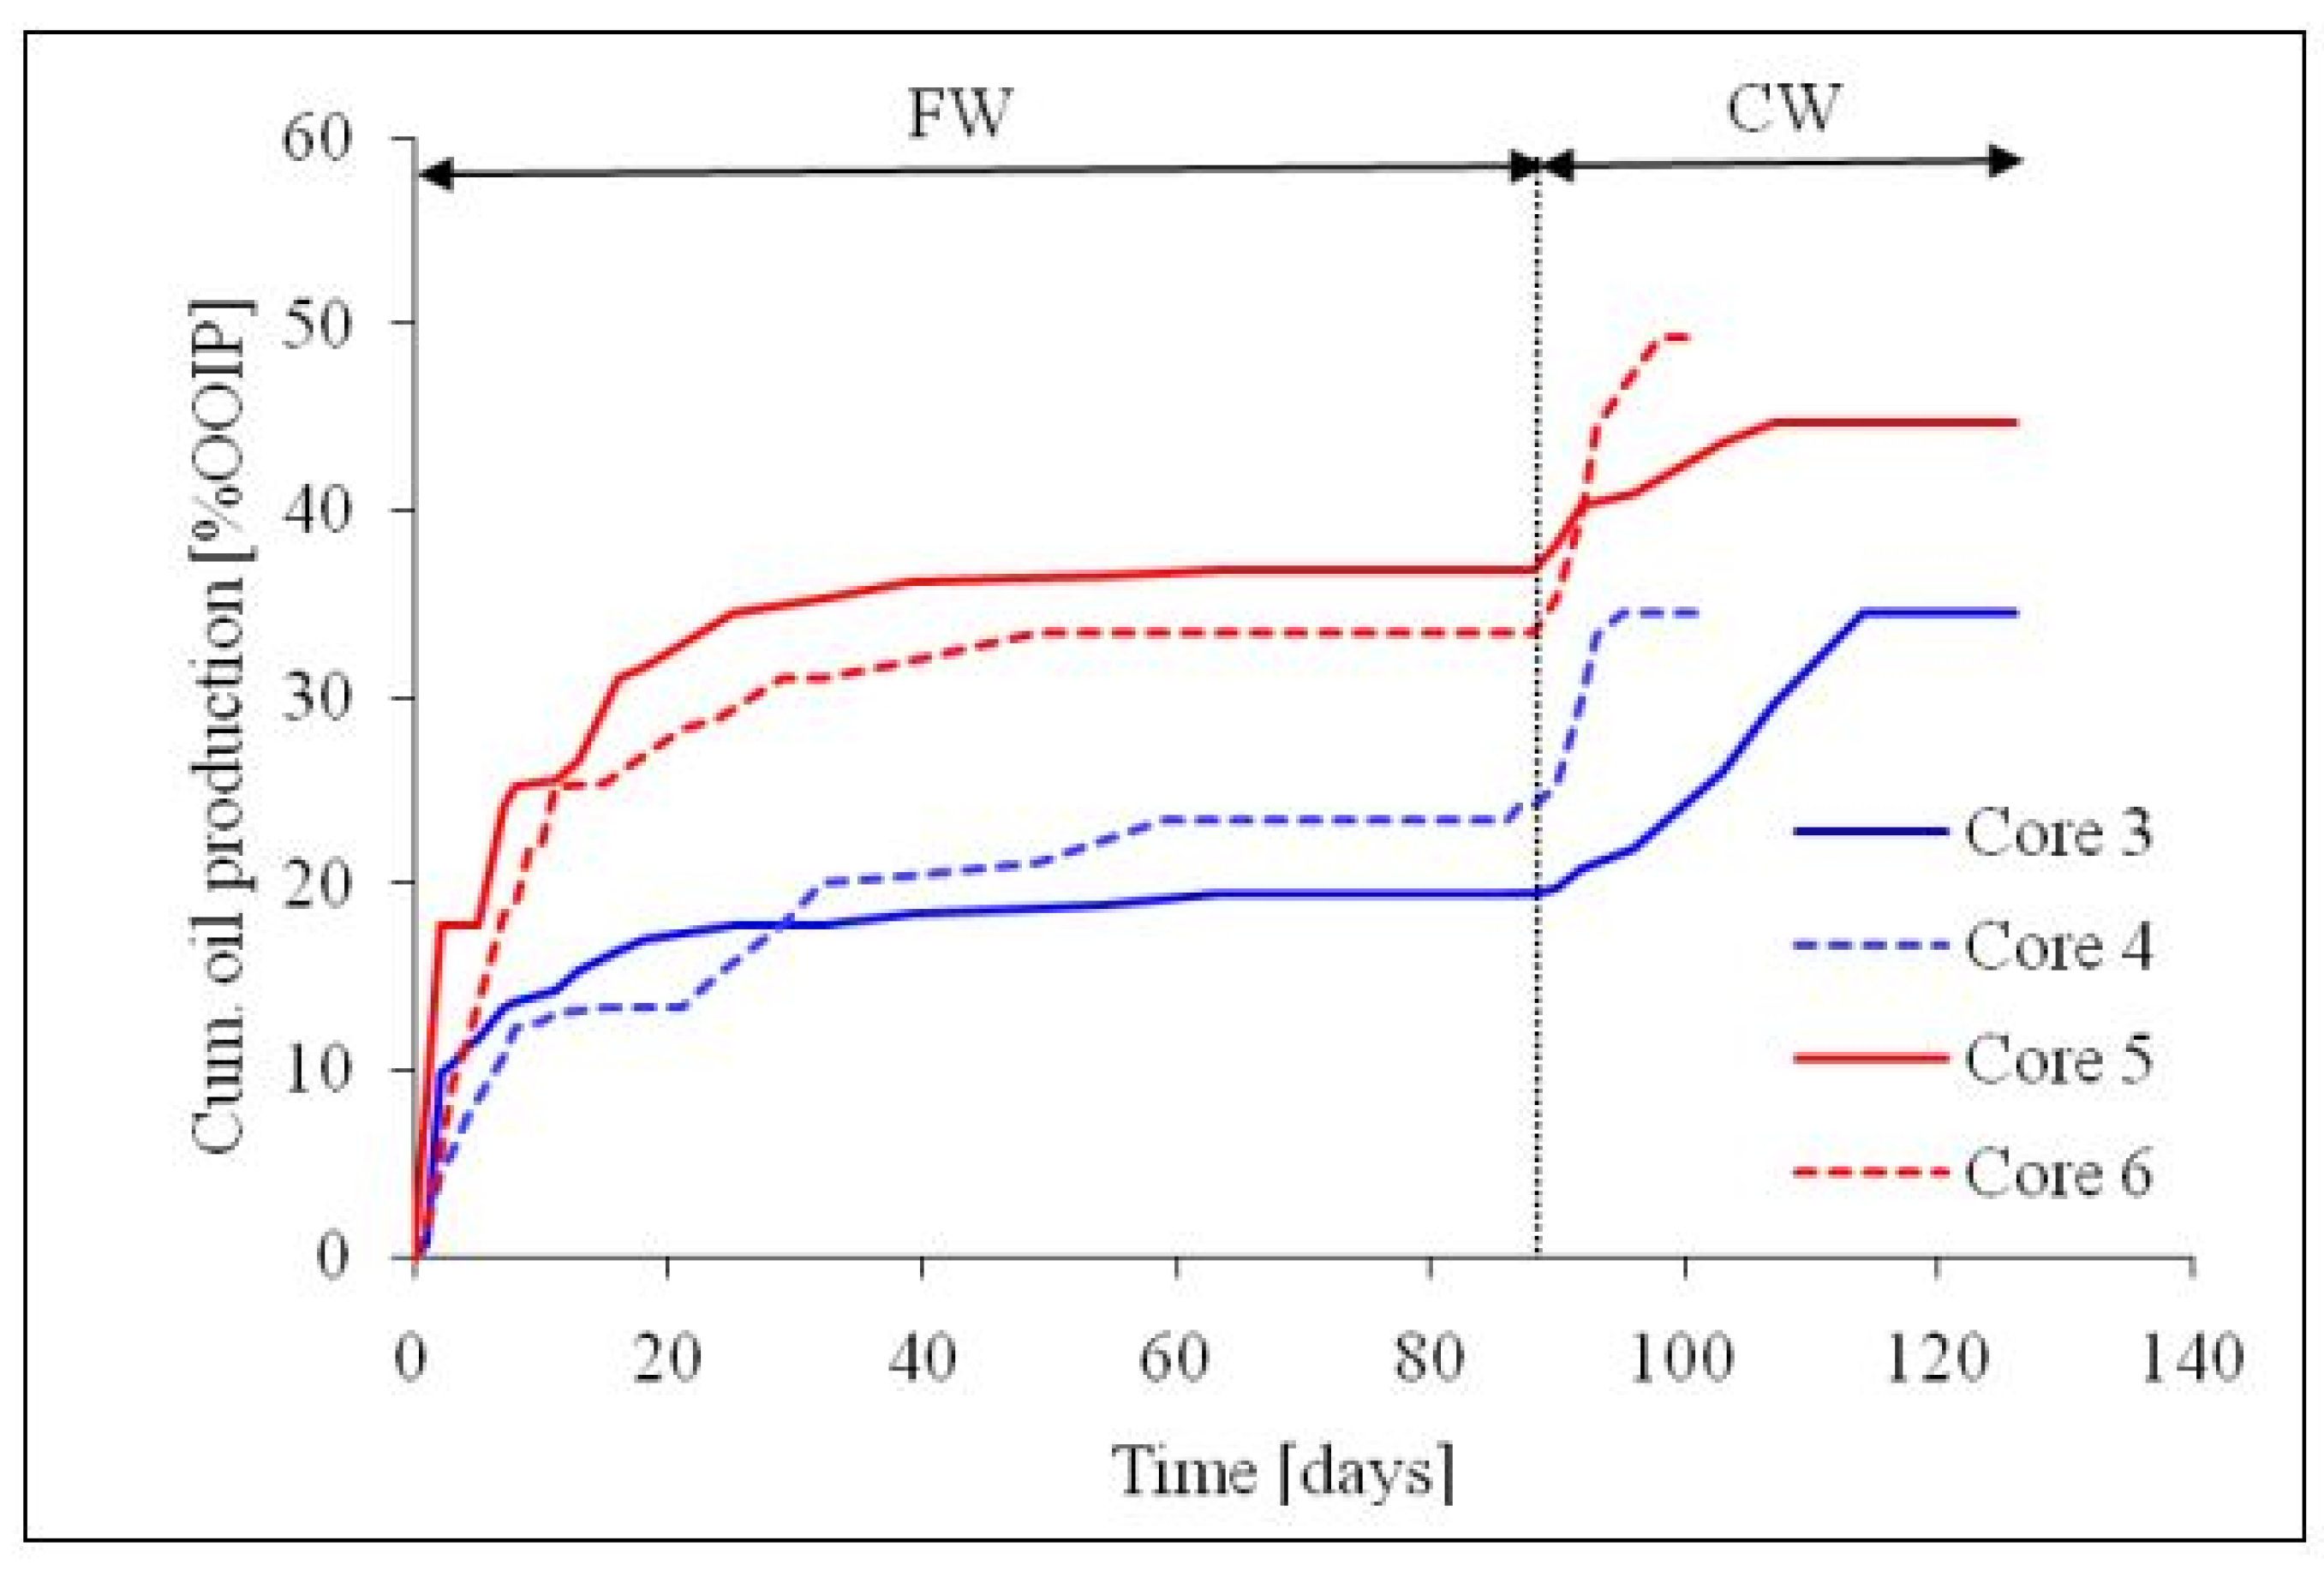
The impact of both carbonated water (CW) and formation water (FW) on the oil recovery efficiency has been assessed in literature [26]. They reported that the CW was observed to optimize the oil recovery during the spontaneous imbibition of an outcrop calcite core under realistic reservoir conditions (Figure 23).
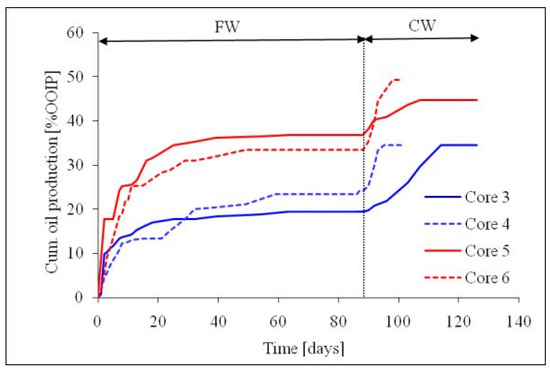
Figure 23.
This figure illustrates the result of the spontaneous imbibition experiments in chalk from literature [26].
3.8.1. Prediction of COBR Interactions during Carbonated Water (CW) Imbibition in Chalk
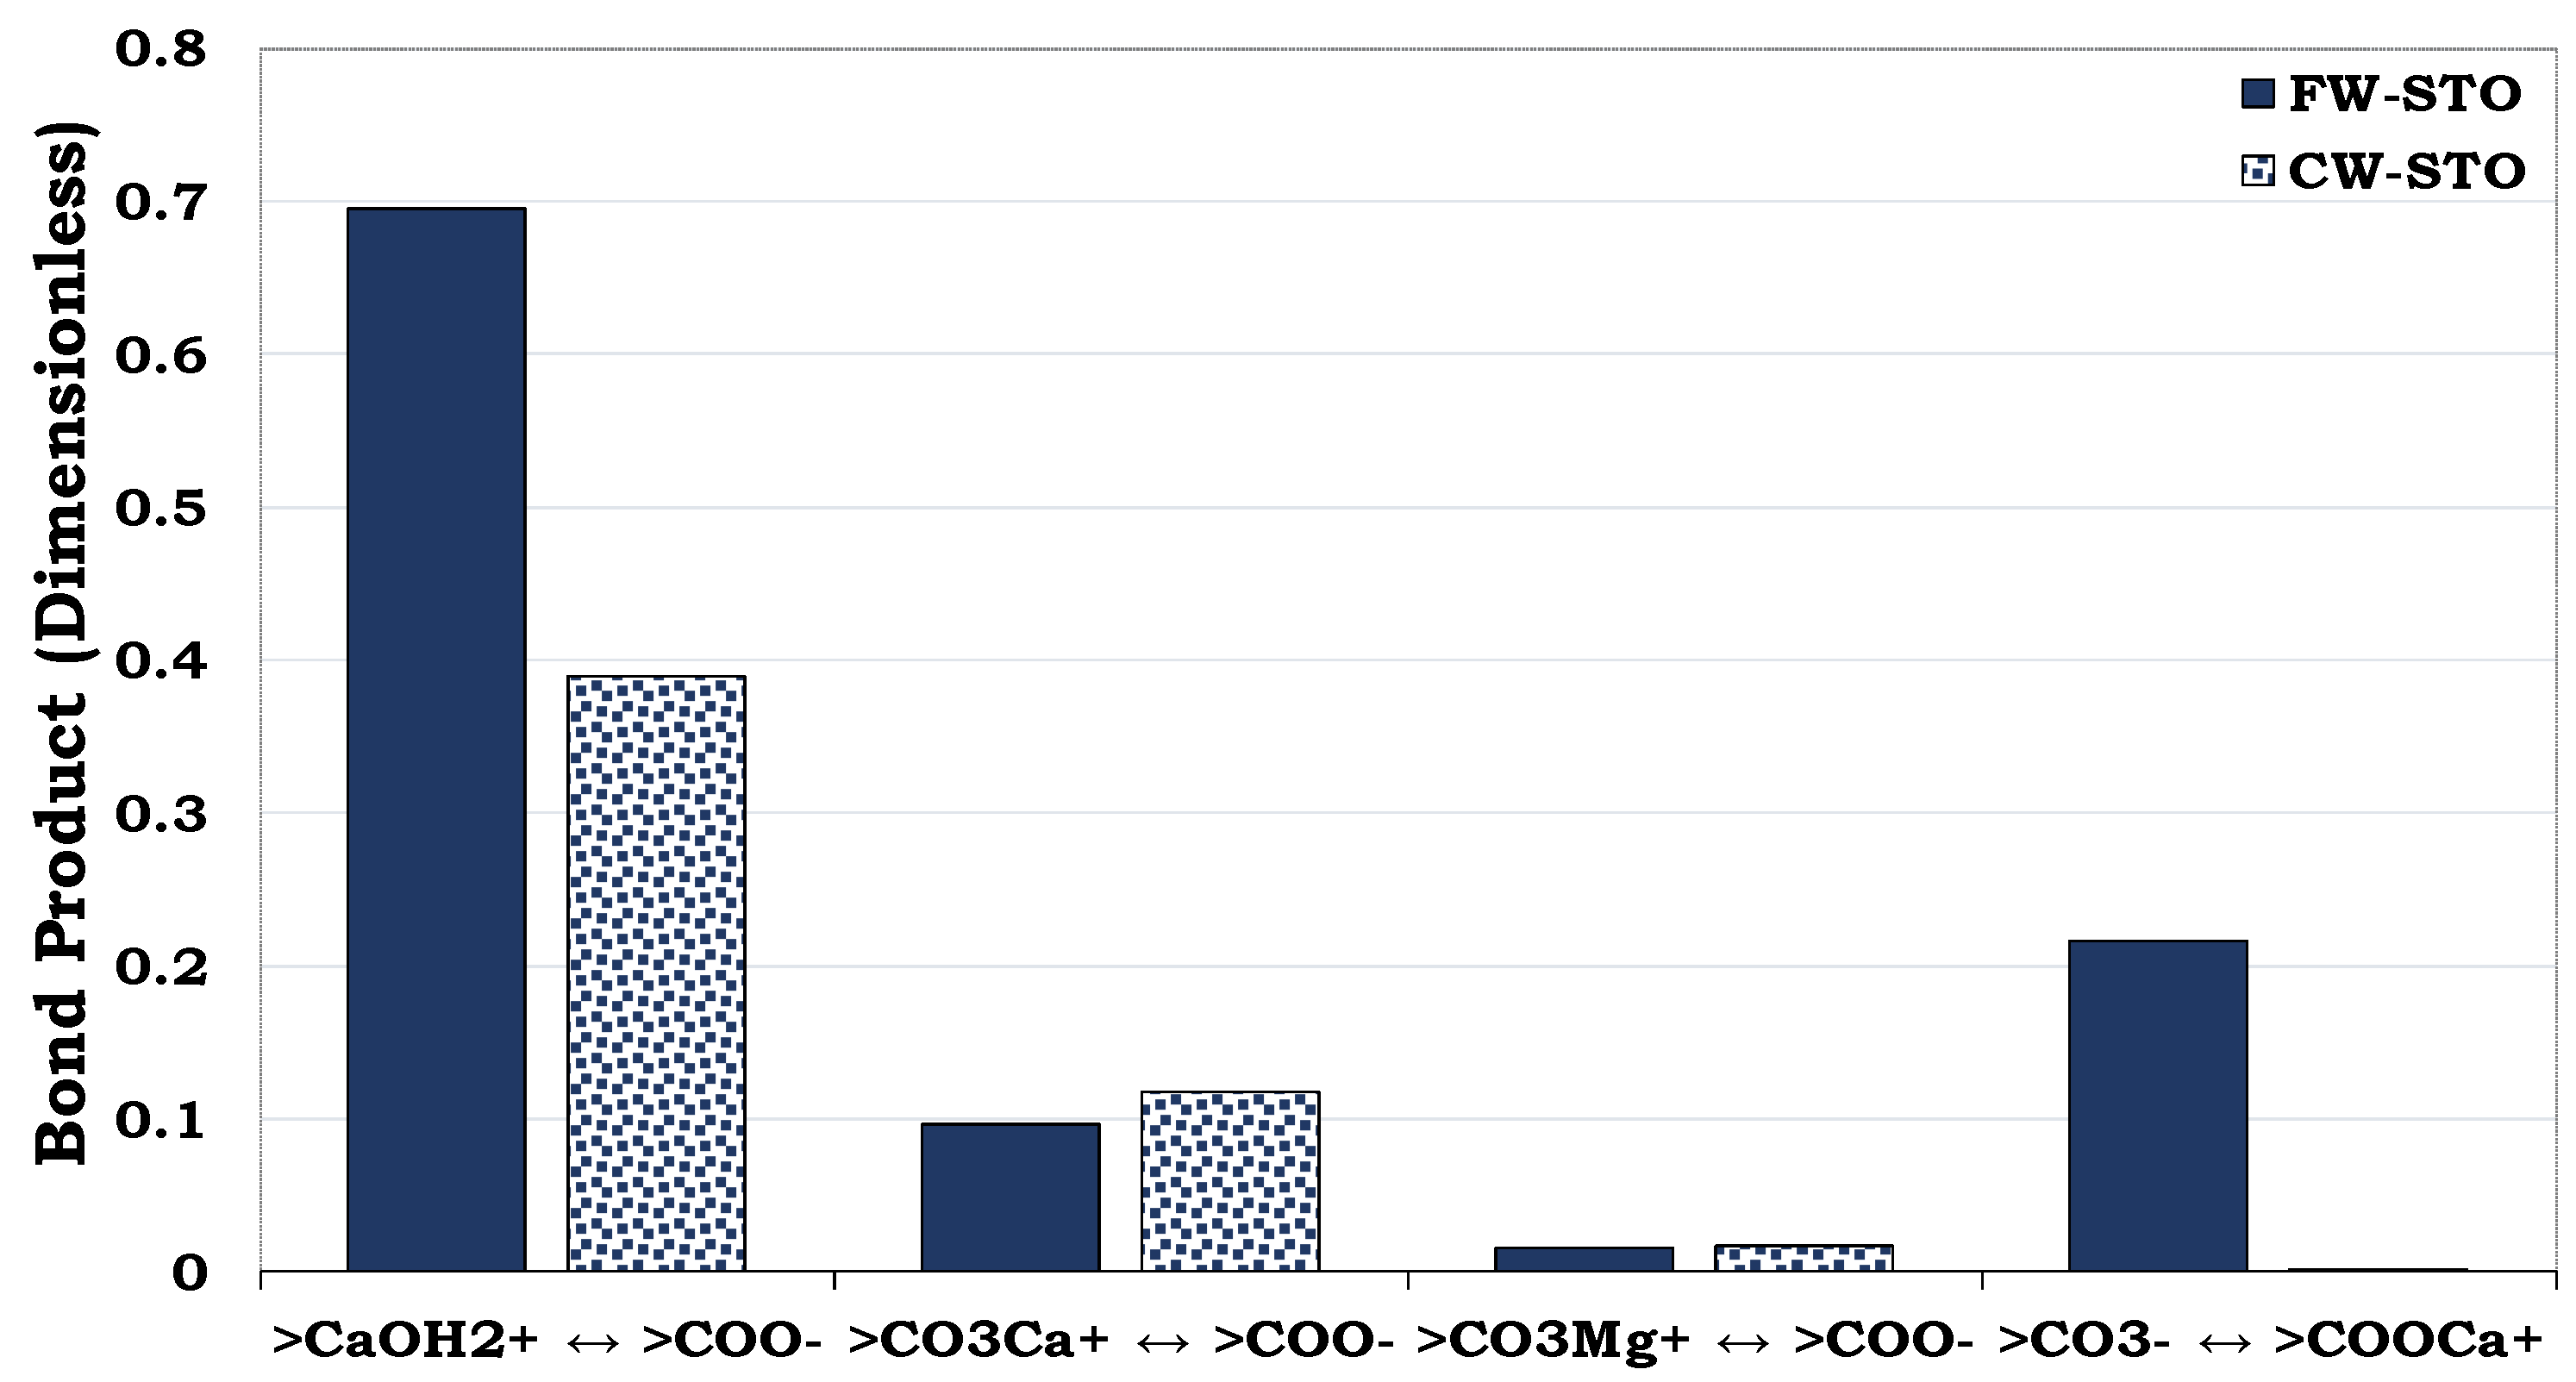
To understand the mechanisms during the FW and CW imbibition, the chalk–fluid systems during the experiments [26] were investigated via SCM. This was achieved by modeling the chalk–brine and oil–brine interactions during the spontaneous imbibition experiment via SCM. To accomplish this, the oil and chalk characteristics used in the spontaneous imbibition experiment were also used as inputs into the SCM. The SCM input parameters were as reported earlier. Table 7 details the chemistry of the brine employed during literature experiment. The dominant oil adhesion mechanism in the chalk exists between the positive chalk site (>CaOH2+) and the carboxylate (>COO−), as depicted in Figure 24. The SCM results revealed that the CW has the potential to change the wetting preference of the chalk from a more hydrophobic to a less hydrophobic state (Figure 24). In other words, the oil adhesion proclivity onto the chalk sites as depicted by the bond product was observed to be higher for the FW (BP ≈ 0.7) than the CW (BP ≈ 0.4). Thus, CW has the potential to desorb some of the adsorbed oil from the rock so that it can be mobilized to be produced with the injected brine.

Table 7.
This table provides the chemical composition of the brine employed in literature experiments with chalk [26].
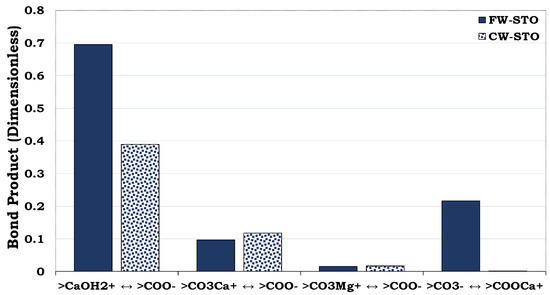
Figure 24.
This figure illustrates the SCM predictions of the chalk/CW/oil interactions during literature experiment.
3.8.2. Predicting the Wetting Preference of Six (6) Sandstone Core Samples from Three (3) Intervals from Literature [29] via the SCM Technique
Torsaeter (1988) carried wettability testing on six sandstone core plugs from the North Sea. The six core plugs were labelled Cores A, B, C, D, E and F. Cores A and B, Cores C and D, and Cores E and F were obtained from three different intervals. Below are the mineralogical compositions of the six core plugs as reported in literature [29].
The surface reactions and the reaction constants of the minerals (Table 8), as reported in literature, were used as inputs into the SCM. The quartz, illite and calcite surface reactions and reaction constants have been used earlier in this study (Table 5). The surface reactions and reaction constants of the other minerals, such as plagioclase, feldspar, kaolinite and chlorite, as reported in literature, are provided in Table 9.

Table 8.
This table provides the mineralogical compositions of the core plugs based on the coring depth [29].

Table 9.
This table provides the minerals’ equilibrium reactions and reaction constants.
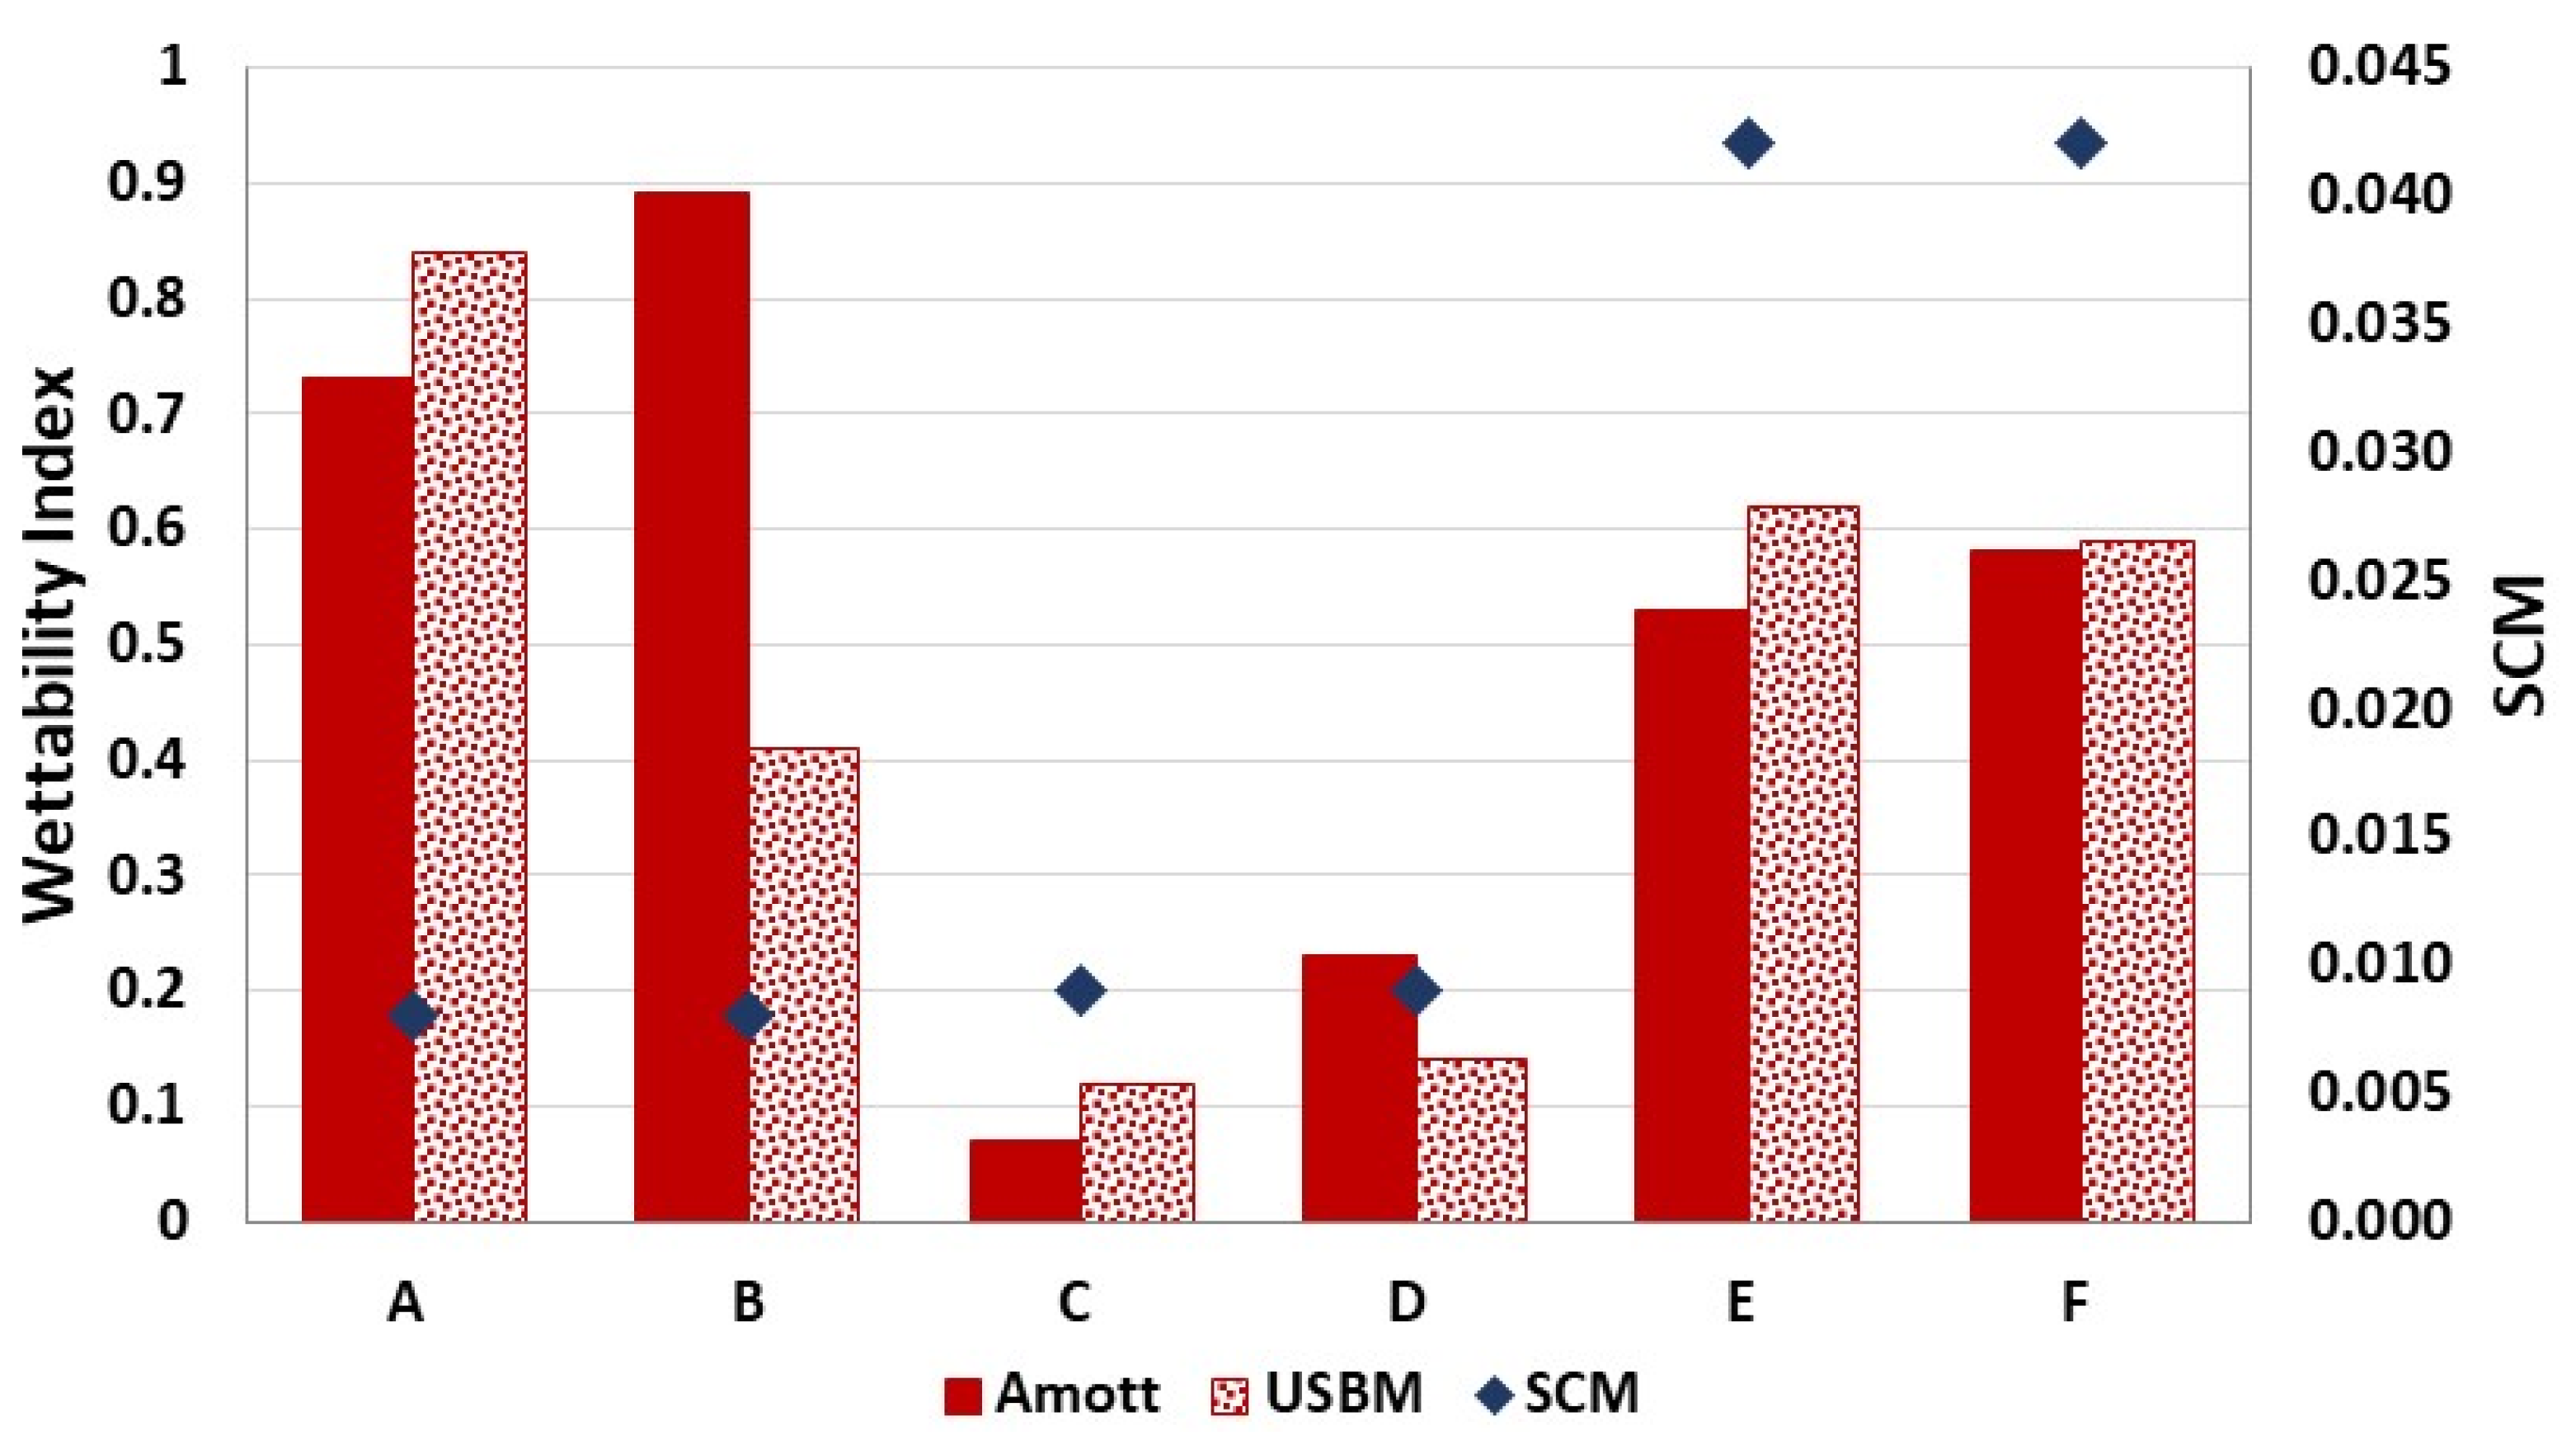
The equivalent surface areas of the sandstone rock samples were calculated using Equation (3). The TAN (0.02 mg KOH/g oil) and TBN (1.1 mg KOH/g oil) of the STO used in the Amott and USBM wettability measurements [29] were converted into their equivalent oil site density using Equation (4). The oil surface reactions and reaction constants were as stated in Table 5. The ionic composition of the brine was the same as reported in literature [29]. With the properties of the rock, the chemical composition of the oil and the ionic composition of the brine used as inputs into the SCM, the crude oil/brine/rock interactions during the Amott and USBM experiments can be predicted. From the Amott and USBM wettability index reported in literature, it can be observed that Cores A and B were strongly hydrophilic (i.e., 0.3 < I < 1). Cores E and F were hydrophilic (i.e., 0.3 < I < 1) but less hydrophilic than Cores A and B. The Cores C and D were observed to be weakly water–wet (0 < I < 0.3).
The SCM predicted the oil adhesion tendencies of the sandstone rock surface during the crude oil/brine/rock interactions. From the SCM predictions, it can be observed that all the sandstone rock were predominantly hydrophilic due to the negligible oil adhesion tendencies (i.e., 0.008 > TBP > 0.042). It is worth noting that the higher the oil adhesion tendencies (i.e., TBP > 0.5), the more hydrophobic it becomes. The SCM was able to capture the trend of the Amott and USBM wettability measurements from literature except the core plugs from the second interval (Cores C and D). From the SCM results, it can be observed that Cores A and B have negligible affinity for the oil phase due to the negligible TBP (≈0.008). This means that most of the Core A and B surfaces were covered with brine, leaving a small fraction being covered with the oil. Hence, their strongly hydrophilic state. Considering Cores E and F from the third coring depth, it can be observed that slightly more oil was adhered onto their surfaces due to the relatively high TBP (≈0.042) as compared to the Cores A and B. This relatively high oil affinity of the Cores E and F could be attributed to their relatively high content (9.9%) of hydrophobic mineral (i.e., calcite) in its mineralogical composition, as compared to 1.4% and 0% in first and second coring depth (Table 8).
Like the first coring depth, the SCM predicted the core samples (i.e., Cores C and D) from the second coring depth to be strongly hydrophilic due to the relatively low TBP (≈0.009). However, the Amott and USBM wettability measurements suggest that the Cores C and D were weakly water–wet (Figure 25). Though the mineralogical composition of the first and second coring depth are similar (Table 8), the discrepancy between the two techniques (i.e., experimental and SCM approach) can be attributed to the distribution of the minerals in the rock. The mineral distribution dictates which mineral is contacted by flowing fluids (i.e., oil and brine). One of the limitations of the SCM technique is how to incorporate the distribution of minerals into the model.
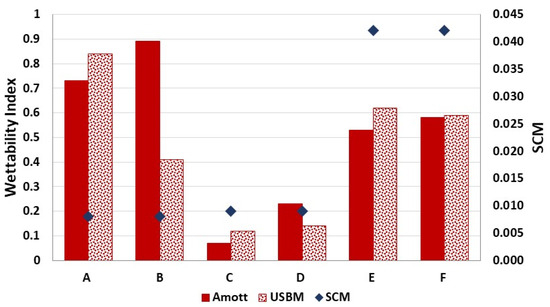
Figure 25.
This figure illustrates the SCM predictions of the Amott and USBM wettability measurements from literature [29].
4. Discussion
The SCM technique for estimating wettability is a fast and affordable technique for estimating the wetting preferences of minerals and reservoir rock via SCM. One striking benefit of the SCM approach over the existing wetting preference estimation approaches is that the SCM technique can simulate the wetting tendencies of the minerals (rock). In addition, our developed model could estimate the oil adsorption mechanisms onto the rock surface. Hence, the SCM has the potential to be used in the design of wettability alteration processes for improving the oil recovery. The characteristics of the oil and rock surfaces, together with their corresponding quantities involved, are used as the SCM input and hence it is less time-consuming than the existing experimental approach. The SCM technique can be used to model the wetting preference of minerals of different geological origins if the properties of the surfaces (i.e., rock and fluid samples) are known. The SCM accounts for the effect of the mineralogical compositions in the model; nonetheless, the role of the distribution of the minerals is yet to be captured as compared to the Amott and the USBM techniques. The mineral surfaces available for the mineral–fluid interactions are determined by the mineral distribution.
To add to the above, the quartz crystal microbalance with dissipation (QCM-D) technique has been reported to characterize the wetting preference by measuring the amount of oil adsorption onto mineral surfaces [30]. Unlike the Amott and the USBM techniques, the QCM-D wettability characterization method is based on the mineral–fluid reaction. The SCM technique for characterizing wettability is also based on the oil and mineral interactions at the contact surface area. The tendency of the rock (minerals) to adsorb oil during COBR interactions was incorporated into the SCM using their equivalent surface area. Note that the SCM characterizes the wettability by estimating the oil adhesion tendencies of the rock/mineral surface by evaluating the electrostatic pair linkages existing between the surfaces (i.e., oil and mineral surfaces) with dissimilar surface charges. Hence, in future studies, infra-red spectroscopy will be employed to better understand the oil adsorption mechanisms as predicted by the SCM. To add to the above, since the double-layer model was employed in this study, the triple-layer model will be considered in our future studies to capture any secondary oil adsorption.
The main challenge with the flotation test is the size of the grains employed. If the sizes of the grains are high, by virtue of gravity they might sink to the bottom of the test tube (i.e., in the dense water phase) even if it was hydrophobic (oil–wet). Hence, if the sizes of the grains are high (>53 µm), especially rock samples need to be crushed to separate the individual grains. However, each mineral has different resistance when crushed. This might have had some adverse effects on the sample prior to the test. Hence, in the future, smaller range mineral particles will be used to minimize the particles size range of our flotation test samples.
5. Conclusions
Our developed model has the tendency to predict the experimental outcomes. Hence, a quick but cheap approach for characterizing the wettability of both the sandstone rocks (mineral mixtures) and their associated dominant minerals has been presented.
- ○
- Among the considered minerals, the quartz was the least hydrophobic, while calcite was observed to be strongly hydrophobic. Albite was also more hydrophobic than quartz but less than illite and montmorillonite, respectively, during the flotation test, as confirmed by the simulated counterparts.
- ○
- Considering the SR and MM, our developed model and the experimental results revealed that the wetting preferences were influenced by the minerals with the highest equivalent surface areas, except for SR/MM with high hydrophobic mineral contents. Thus, the hydrophobic minerals have a stronger influence on the wetting preferences of the considered SR/MM than that of the clay.
- ○
- Unlike the flotation test, our developed model could simulate both the wetting preferences and how the oil is adsorbed onto the rock/mineral surface. For instance, cation bridging was the main oil adhesion mechanism in the studied sandstone rock-fluid systems.
- ○
- For the carbonate minerals (e.g., calcite and mineral mixtures with high hydrophobic mineral fraction), it was observed that direct adhesion of carboxylate was the main oil adhesion mechanism. Nonetheless, oil adhesion via cation bridging mechanisms also occurred.
Author Contributions
Conceptualization, S.E. and I.F.; methodology, S.E. and A.V.O.; software, S.E. and A.V.O.; validation, I.F. and A.V.O.; formal analysis, S.E.; investigation, S.E. and A.V.O.; resources, I.F.; data curation, S.E., I.F. and A.V.O.; writing—original draft preparation, S.E.; writing—review and editing, S.E., I.F. and A.V.O.; visualization, S.E.; supervision, I.F. and A.V.O.; project administration, I.F.; funding acquisition, I.F. All authors have read and agreed to the published version of the manuscript.
Funding
This research received no external funding.
Data Availability Statement
Data are contained within the article.
Acknowledgments
The authors would like to acknowledge the National Centre for Sustainable Subsurface Utilization of the Norwegian Continental Shelf—NCS2030 for their support.
Conflicts of Interest
The authors declare no conflicts of interest.
References
- Morrow, N.R. Interfacial Phenomena in Petroleum Recovery; CRC Press: Boca Raton, FL, USA, 1990. [Google Scholar]
- Anderson, W.G. Wettability Literature Survey—Part 5: The Effect of Wettability on Relative Permeability. JPT J. Pet. Technol. 1987, 39, 1453–1468. [Google Scholar] [CrossRef]
- Cockcroft, P.J.; Guise, D.R.; Waworuntu, I.D. The Effect of Wettability on Estimation of Reserves. In Proceedings of the SPE Asia-Pacific Conference, Sydney, Australia, 13–15 September 1989. [Google Scholar] [CrossRef]
- Craig, F. The Reservoir Engineering Aspects of Waterflooding; Monograph Series; Society of Petroleum Engineers of AIME: Wilkes-Barre, PA, USA, 1971. [Google Scholar]
- Erzuah, S.; Fjelde, I.; Omekeh, A.V. Wettability Estimation using Surface-Complexation Simulations. SPE Reserv. Eval. Eng. 2019, 22, 509–519. [Google Scholar] [CrossRef]
- Mamonov, A.; Kvandal, O.A.; Strand, S.; Puntervold, T. Adsorption of Polar Organic Components onto Sandstone Rock Minerals and its Effect on Wettability and Enhanced Oil Recovery Potential by Smart Water. Energy Fuels 2019, 33, 5954–5960. [Google Scholar] [CrossRef]
- Puntervold, T.; Mamonov, A.; Piñerez Torrijos, I.D.; Strand, S. Adsorption of Crude oil Components onto Carbonate and Sandstone Outcrop Rocks and its Effect on Wettability. Energy Fuels 2021, 35, 5738–5747. [Google Scholar] [CrossRef]
- Dubey, S.; Waxman, M. Asphaltene adsorption and desorption from mineral surfaces. SPE Reserv. Eng. 1991, 6, 389–395. [Google Scholar] [CrossRef]
- Buckley, J.; Liu, Y. Some Mechanisms of Crude Oil/Brine/Solid Interactions. J. Pet. Sci. Eng. 1998, 20, 155–160. [Google Scholar] [CrossRef]
- Brady, P.V.; Krumhansl, J.L. A Surface Complexation Model of Oil-Brine-Sandstone Interfaces at 100 °C: Low Salinity Waterflooding. J. Pet. Sci. Eng. 2012, 81, 171–176. [Google Scholar] [CrossRef]
- Goldberg, S. Surface Complexation Modeling. Ref. Modul. Earth Syst. Environ. Sci. 2013, 10. [Google Scholar] [CrossRef]
- Koretsky, C. The Significance of Surface Complexation Reactions in Hydrologic Systems: A Geochemist’s Perspective. J. Hydrol. 2000, 230, 127–171. [Google Scholar] [CrossRef]
- Brady, P.V.; Krumhansl, J.L.; Mariner, P.E. Surface complexation modeling for improved oil recovery. In Proceedings of the SPE Improved Oil Recovery Symposium, Tulsa, OK, USA, 14–18 April 2012; SPE-153744. [Google Scholar] [CrossRef]
- Brady, P.V.; Krumhansl, J.L. Surface Complexation Modeling for Waterflooding of Sandstones. SPE J. 2013, 18, 214–218. [Google Scholar] [CrossRef]
- Gu, X.; Evans, L.J. Modelling the Adsorption of Cd (II), Cu (II), Ni (II), Pb (II), and Zn (II) onto Fithian Illite. Colloid Interface Sci. 2007, 307, 317–325. [Google Scholar] [CrossRef]
- Van Cappellen, P.; Charlet, L.; Stumm, W.; Wersin, P. A Surface Complexation Model of the Carbonate Mineral-aqueous Solution Interface. Geochim. Cosmochim. Acta 1993, 57, 3505–3518. [Google Scholar] [CrossRef]
- Wolthers, M.; Charlet, L.; Van Cappellen, P. The Surface Chemistry of Divalent Metal Carbonate Minerals; A Critical Assessment of Surface Charge and Potential Data Using the Charge Distribution Multi-site Ion Complexation Model. Am. J. Sci. 2008, 308, 905–941. [Google Scholar] [CrossRef]
- Chen, Y.; Brantley, S.L. Temperature- and pH-Dependence of Albite Dissolution Rate at Acid pH. Chem. Geol. 1997, 135, 275–290. [Google Scholar] [CrossRef]
- Sverjensky, D.A.; Sahai, N. Theoretical Prediction of Single-Site Surface-Protonation Equilibrium Constants for Oxides and Silicates in Water. Geochim. Cosmochim. Acta 1996, 60, 3773–3797. [Google Scholar] [CrossRef]
- Sverjensky, D.A.; Sahai, N. Theoretical Prediction of Single-Site Enthalpies of Surface Protonation for Oxides and Silicates in Water. Geochim. Cosmochim. Acta 1998, 62, 3703–3716. [Google Scholar] [CrossRef]
- Wieland, E.; Wanner, H.; Albinsson, Y. A Surface Chemical Model of The Bentonite-Water Interface and Its Implications For Modelling the Near Field Chemistry in a Repository for Spent Fuel (No. SKB-TR-94-26); Swedish Nuclear Fuel and Waste Management Co.: Stockholm, Sweden, 1994. [Google Scholar]
- Boampong, L.O.; Tetteh, J.T.; Erzuah, S. Understanding the Effects of Mineral Impurities, Brine Ionic Composition and CO2 on Rock-Brine-Oil Electrokinetic Behavior Using a High-Salinity Surface Complexation Model. Energy Fuels 2023, 37, 10200–10217. [Google Scholar] [CrossRef]
- Song, J.; Zeng, Y.; Wang, L.; Duan, X.; Puerto, M.; Chapman, W.G.; Biswal, S.L.; Hirasaki, G.J. Surface Complexation Modeling of Calcite Zeta Potential Measurements in Brines with Mixed Potential Determining ions (Ca2+, CO32−, Mg2+, SO42−) for Characterizing Carbonate Wettability. J. Colloid Interface Sci. 2017, 506, 169–179. [Google Scholar] [CrossRef] [PubMed]
- Katz, L.E.; Hayes, K.F. Surface Complexation Modeling: I. Strategy for Modeling Monomer Complex Formation at Moderate Surface Coverage. J. Colloid Interface Sci. 1995, 170, 477–490. [Google Scholar] [CrossRef]
- Fjelde, I.F.; Aasen, S.M.A.; Zuta, J.F.Z. Improvement of Spontaneous Imbibition in Carbonate Rocks by CO2-saturated Brine. In Proceedings of the IOR 2011—16th European Symposium on Improved Oil Recovery, Cambridge, UK, 12–14 April 2011; cp-230-00022. [Google Scholar] [CrossRef]
- Mwangi, P.; Thyne, G.; Rao, D. Extensive Experimental Wettability Study in Sandstone and Carbonate-Oil-Brine Systems: Part 1—Screening Tool Development. In Proceedings of the International Symposium of the Society of Core Analysts, Napa Valley, CA, USA, 16–19 September 2013; pp. 1–6. [Google Scholar]
- Dubey, S.T.; Doe, P.H. Base Number and Wetting Properties of Crude Oils. SPE Reserv. Eng. 1993, 8, 195–200. [Google Scholar] [CrossRef]
- Hjuler, M.; Fabricius, I.L. Engineering Properties of Chalk Related to Diagenetic Variations of Upper Cretaceous Onshore and Offshore Chalk in the North Sea Area. J. Pet. Sci. Eng. 2009, 68, 151–170. [Google Scholar] [CrossRef]
- Torsaeter, O. A Comparative Study of Wettability Test Methods Based on Experimental Results From North Sea Reservoir Rocks. In Proceedings of the SPE Annual Technical Conference and Exhibition, Houston, TX, USA, 2–5 October 1998; Society of Petroleum Engineers: Richardson, TX, USA, 1988. [Google Scholar] [CrossRef]
- Erzuah, S.; Fjelde, I.; Omekeh, A.V. Wettability Estimation by Oil Adsorption using Quartz Crystal Microbalance with Dissipation (QCM-D). In Proceedings of the Society of Petroleum Engineers—SPE Europec featured at 80th EAGE Conference and Exhibition 2018, Copenhagen, Denmark, 11–14 June 2018. [Google Scholar] [CrossRef]
Disclaimer/Publisher’s Note: The statements, opinions and data contained in all publications are solely those of the individual author(s) and contributor(s) and not of MDPI and/or the editor(s). MDPI and/or the editor(s) disclaim responsibility for any injury to people or property resulting from any ideas, methods, instructions or products referred to in the content. |
© 2024 by the authors. Licensee MDPI, Basel, Switzerland. This article is an open access article distributed under the terms and conditions of the Creative Commons Attribution (CC BY) license (https://creativecommons.org/licenses/by/4.0/).

