

Impact of Land Use and Land Cover Change on Hydrological Processes in Urban Watersheds: Analysis and Forecasting for Flood Risk Management


Abstract
1. Introduction
- (a)
- Forecast LULC maps for the years 2050 and 2080 utilizing the CA–Markov model.
- (b)
- Evaluate the impact of these LULC changes on peak runoff and flood volumes during storm events of varying return periods.
2. Materials and Methods
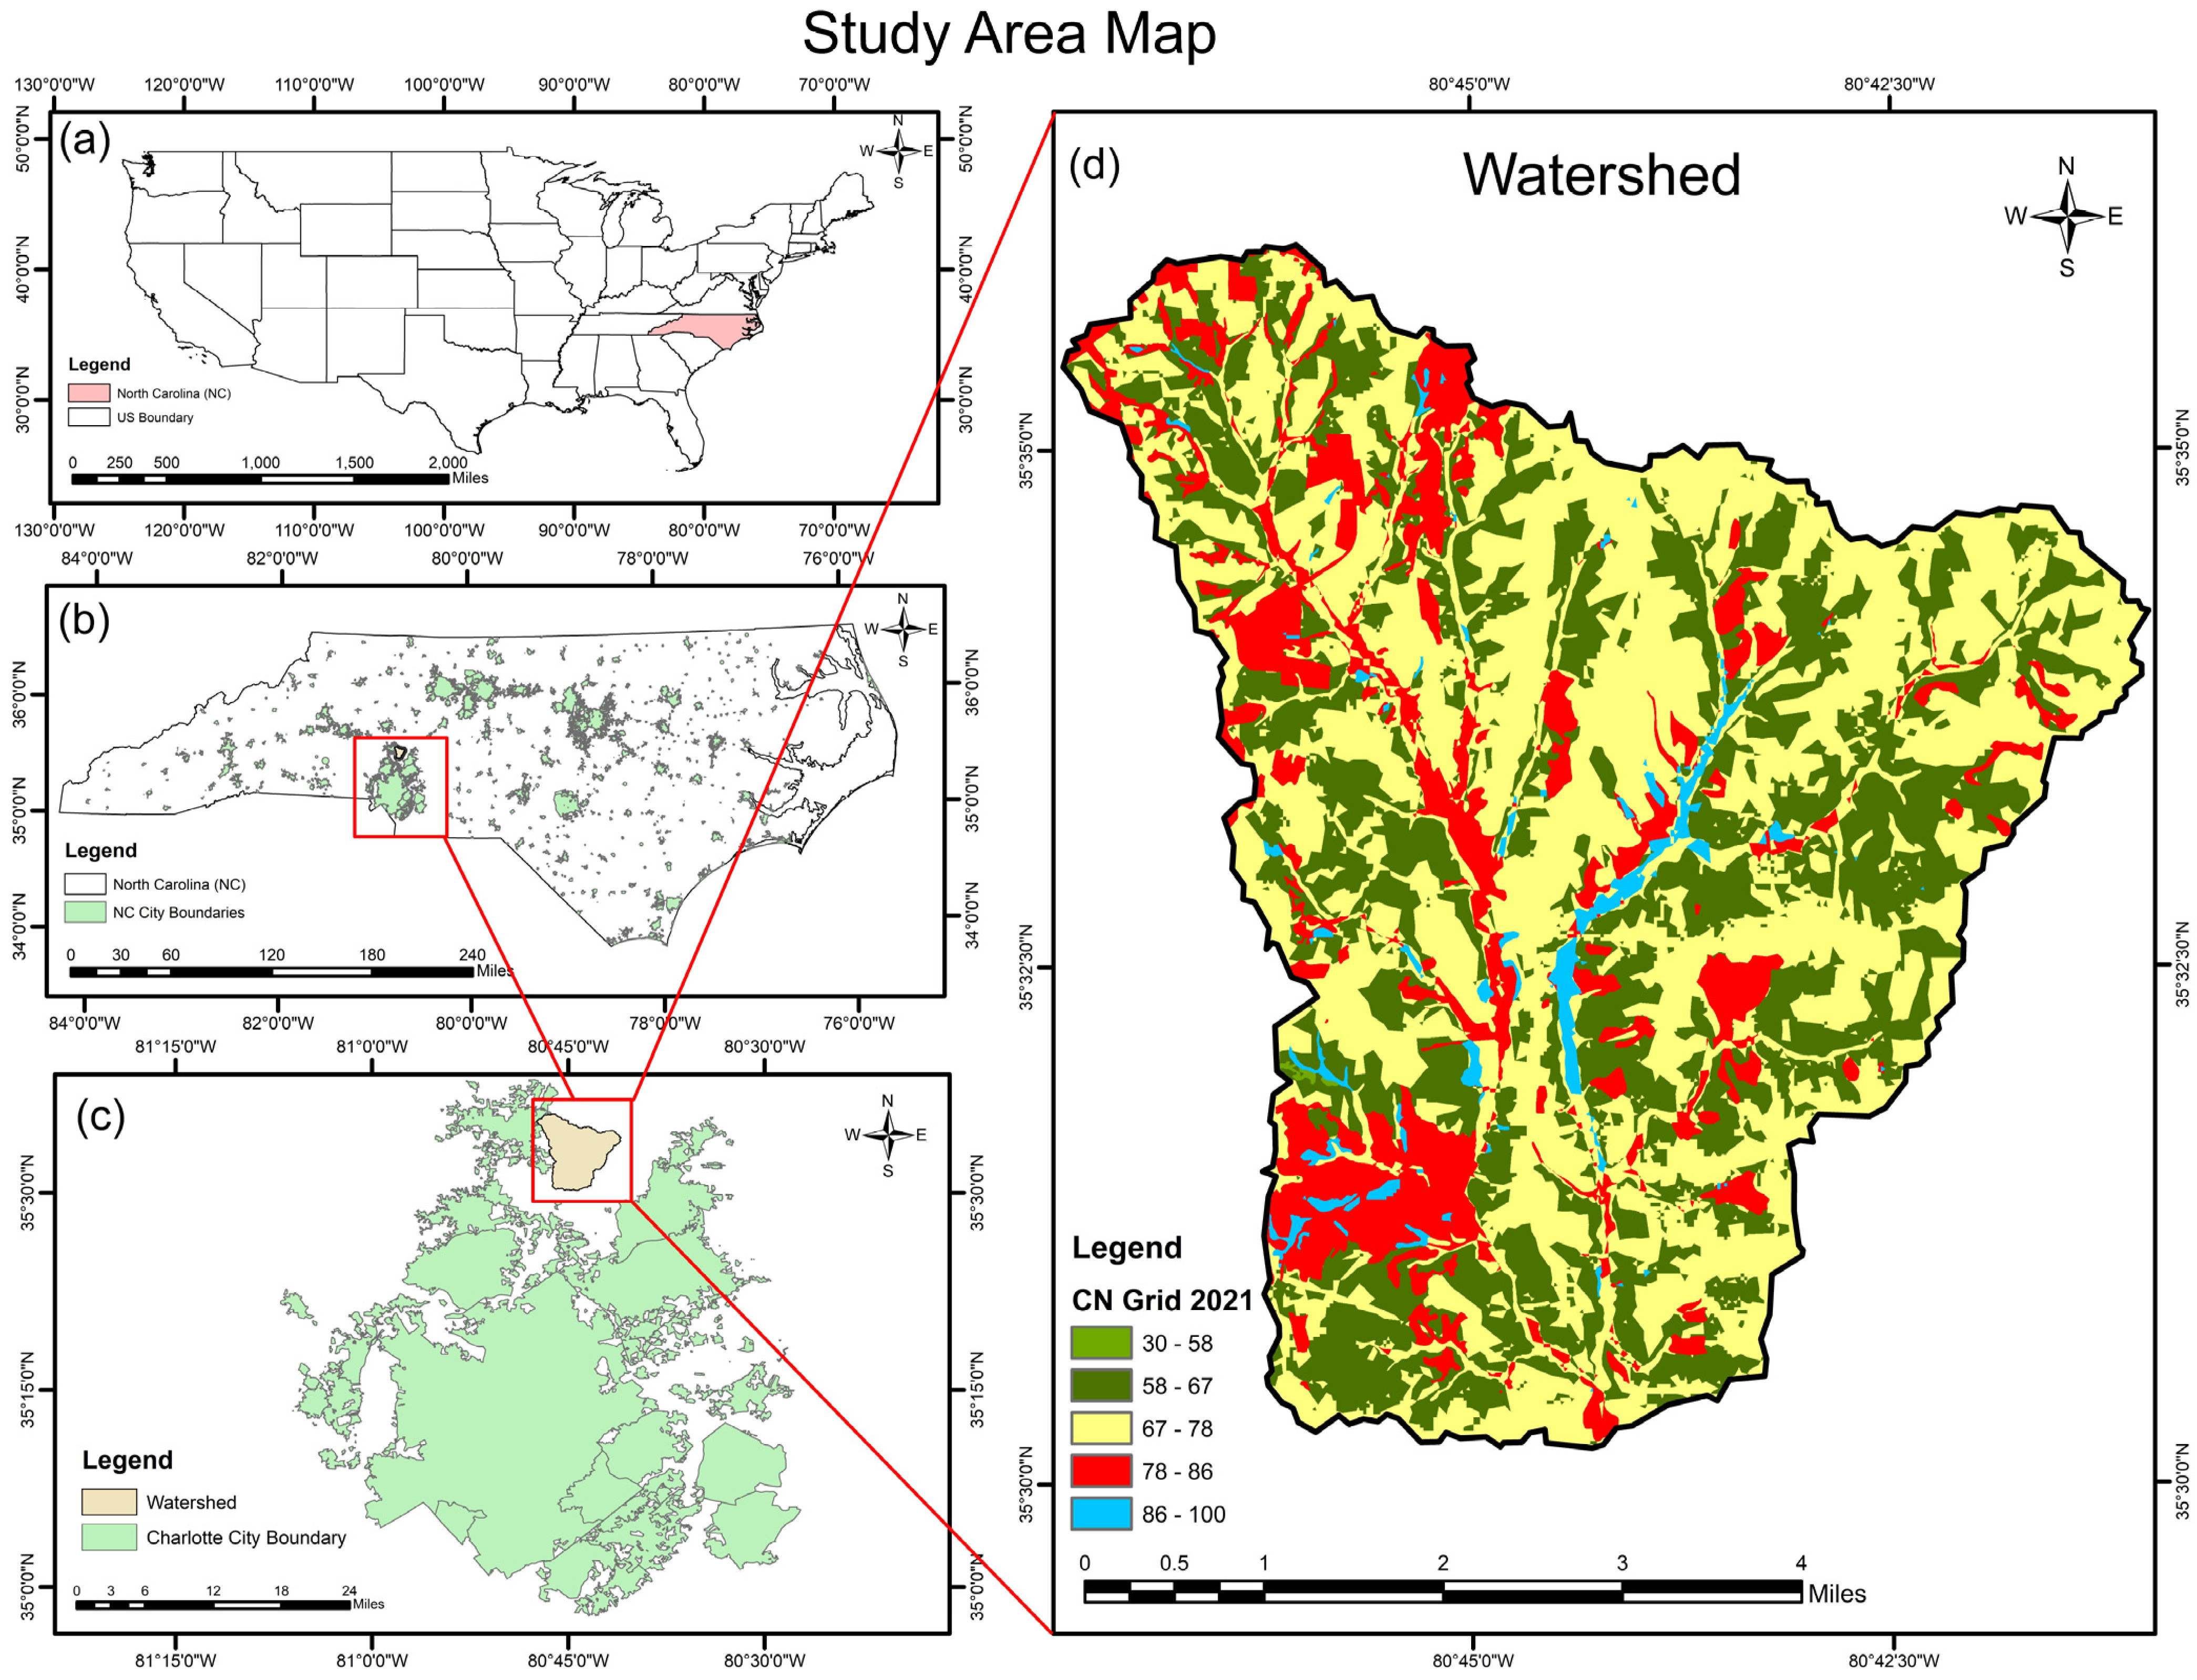
2.1. Study Area
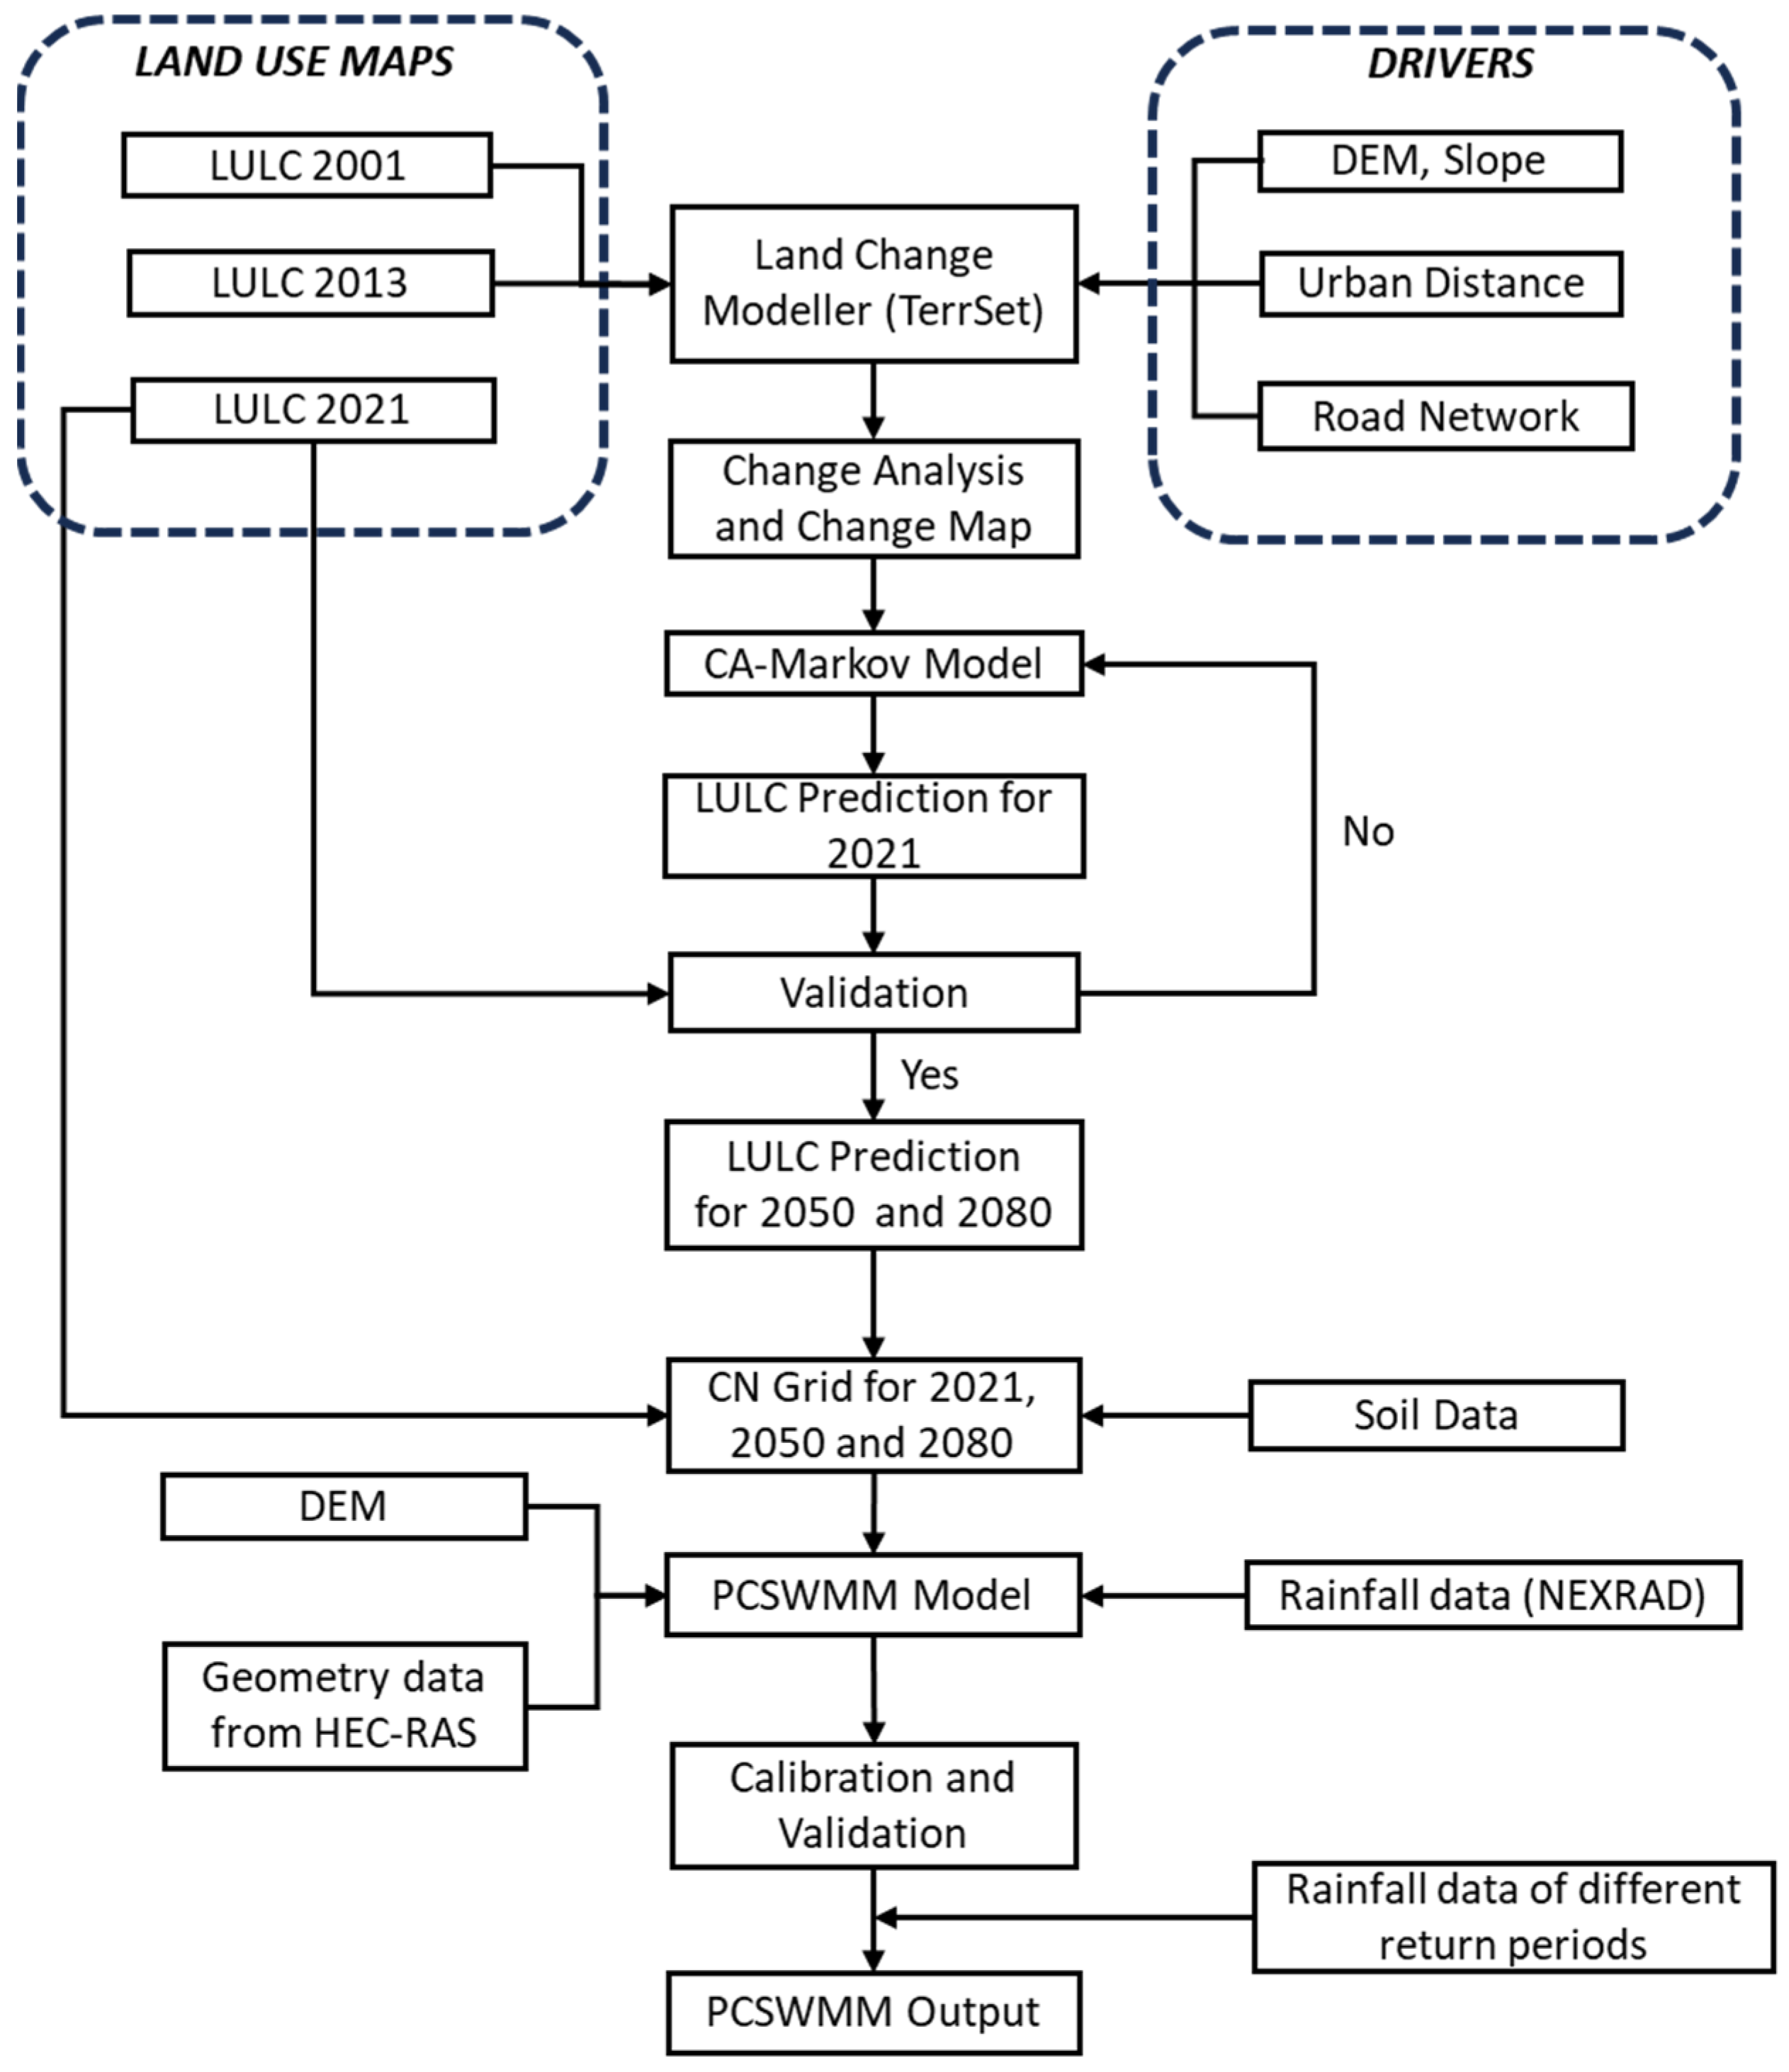
2.2. Methods
2.2.1. CA–Markov Model
2.2.2. Hydrological Model Using PCSWMM
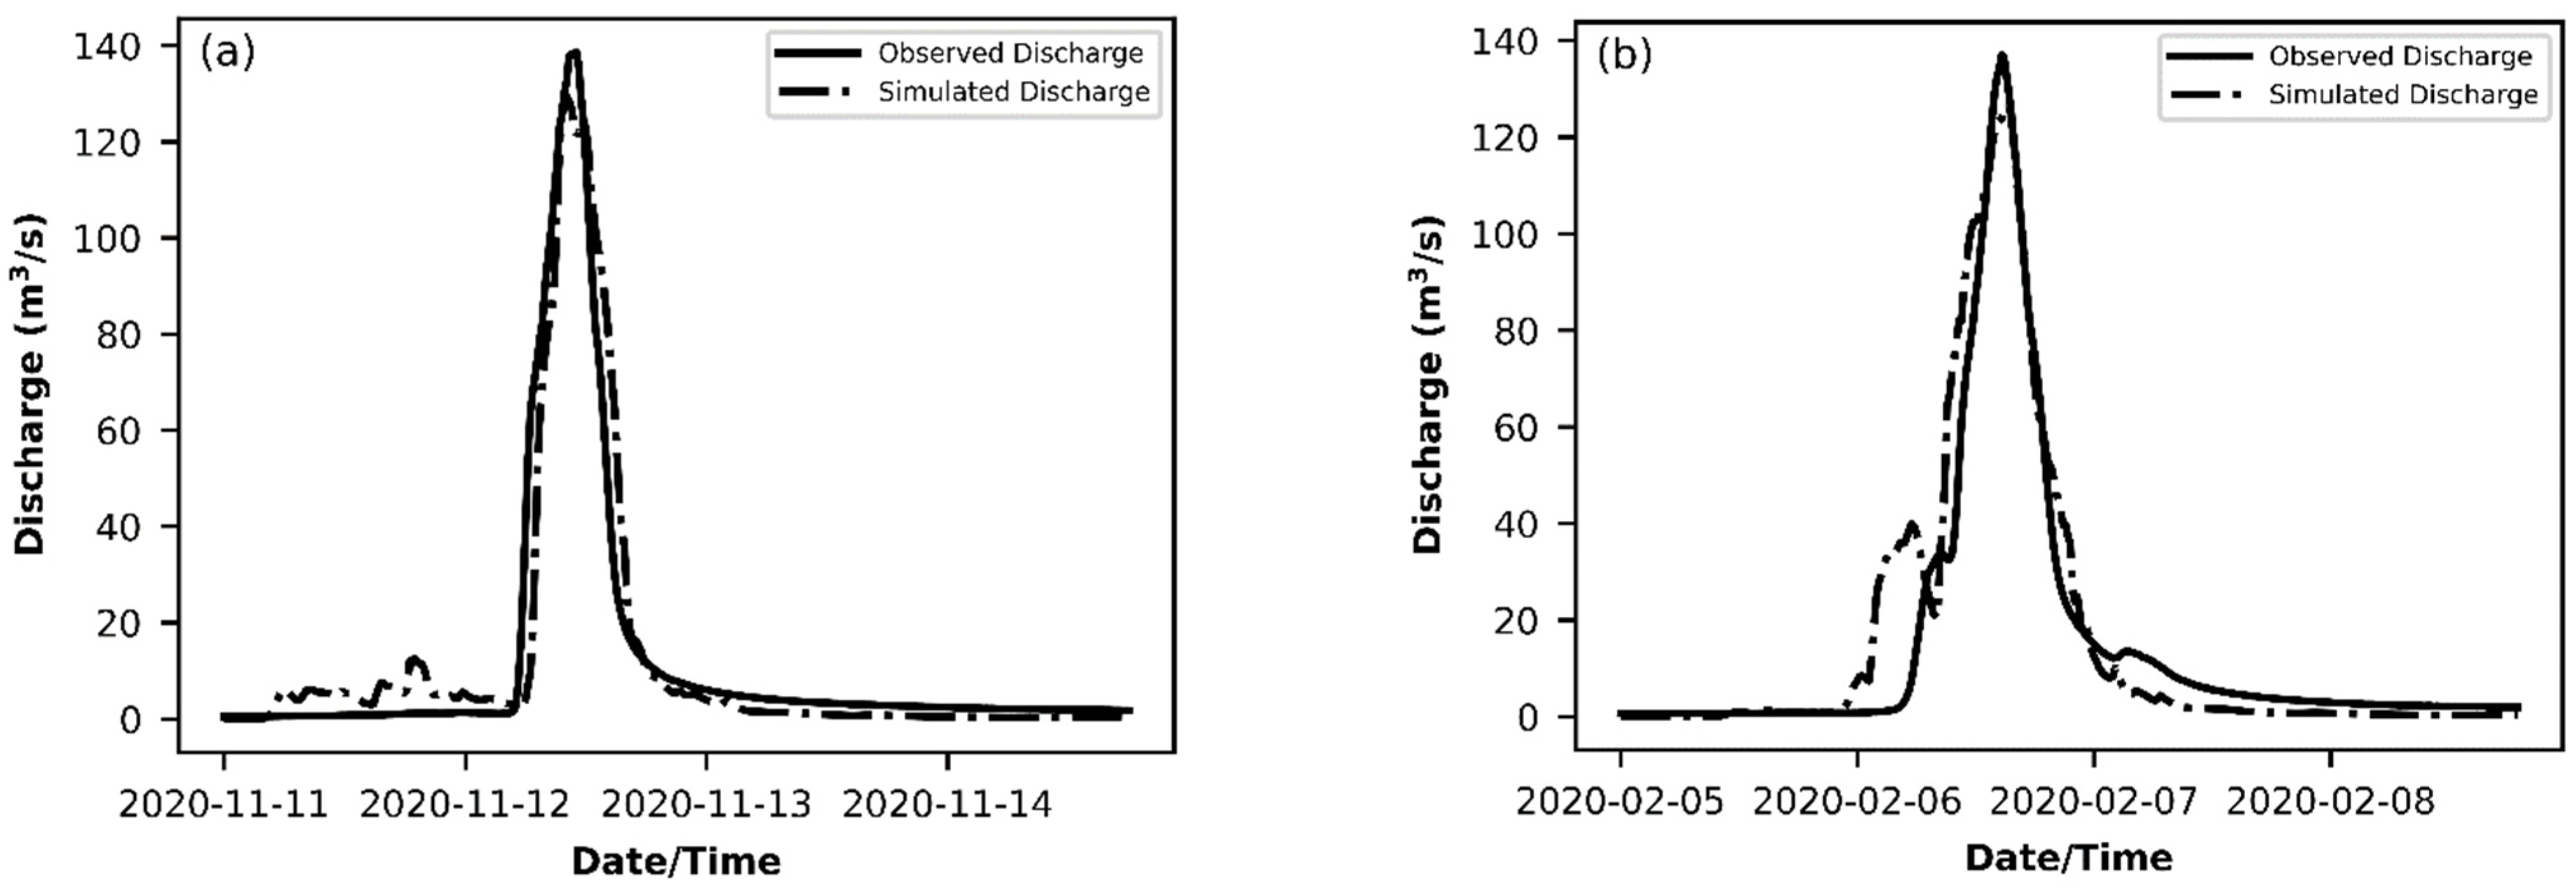
2.2.3. Hydrological Model Evaluation
3. Results
3.1. CA-Markov Model: Validation
3.2. PCSWMM: Calibration and Validation
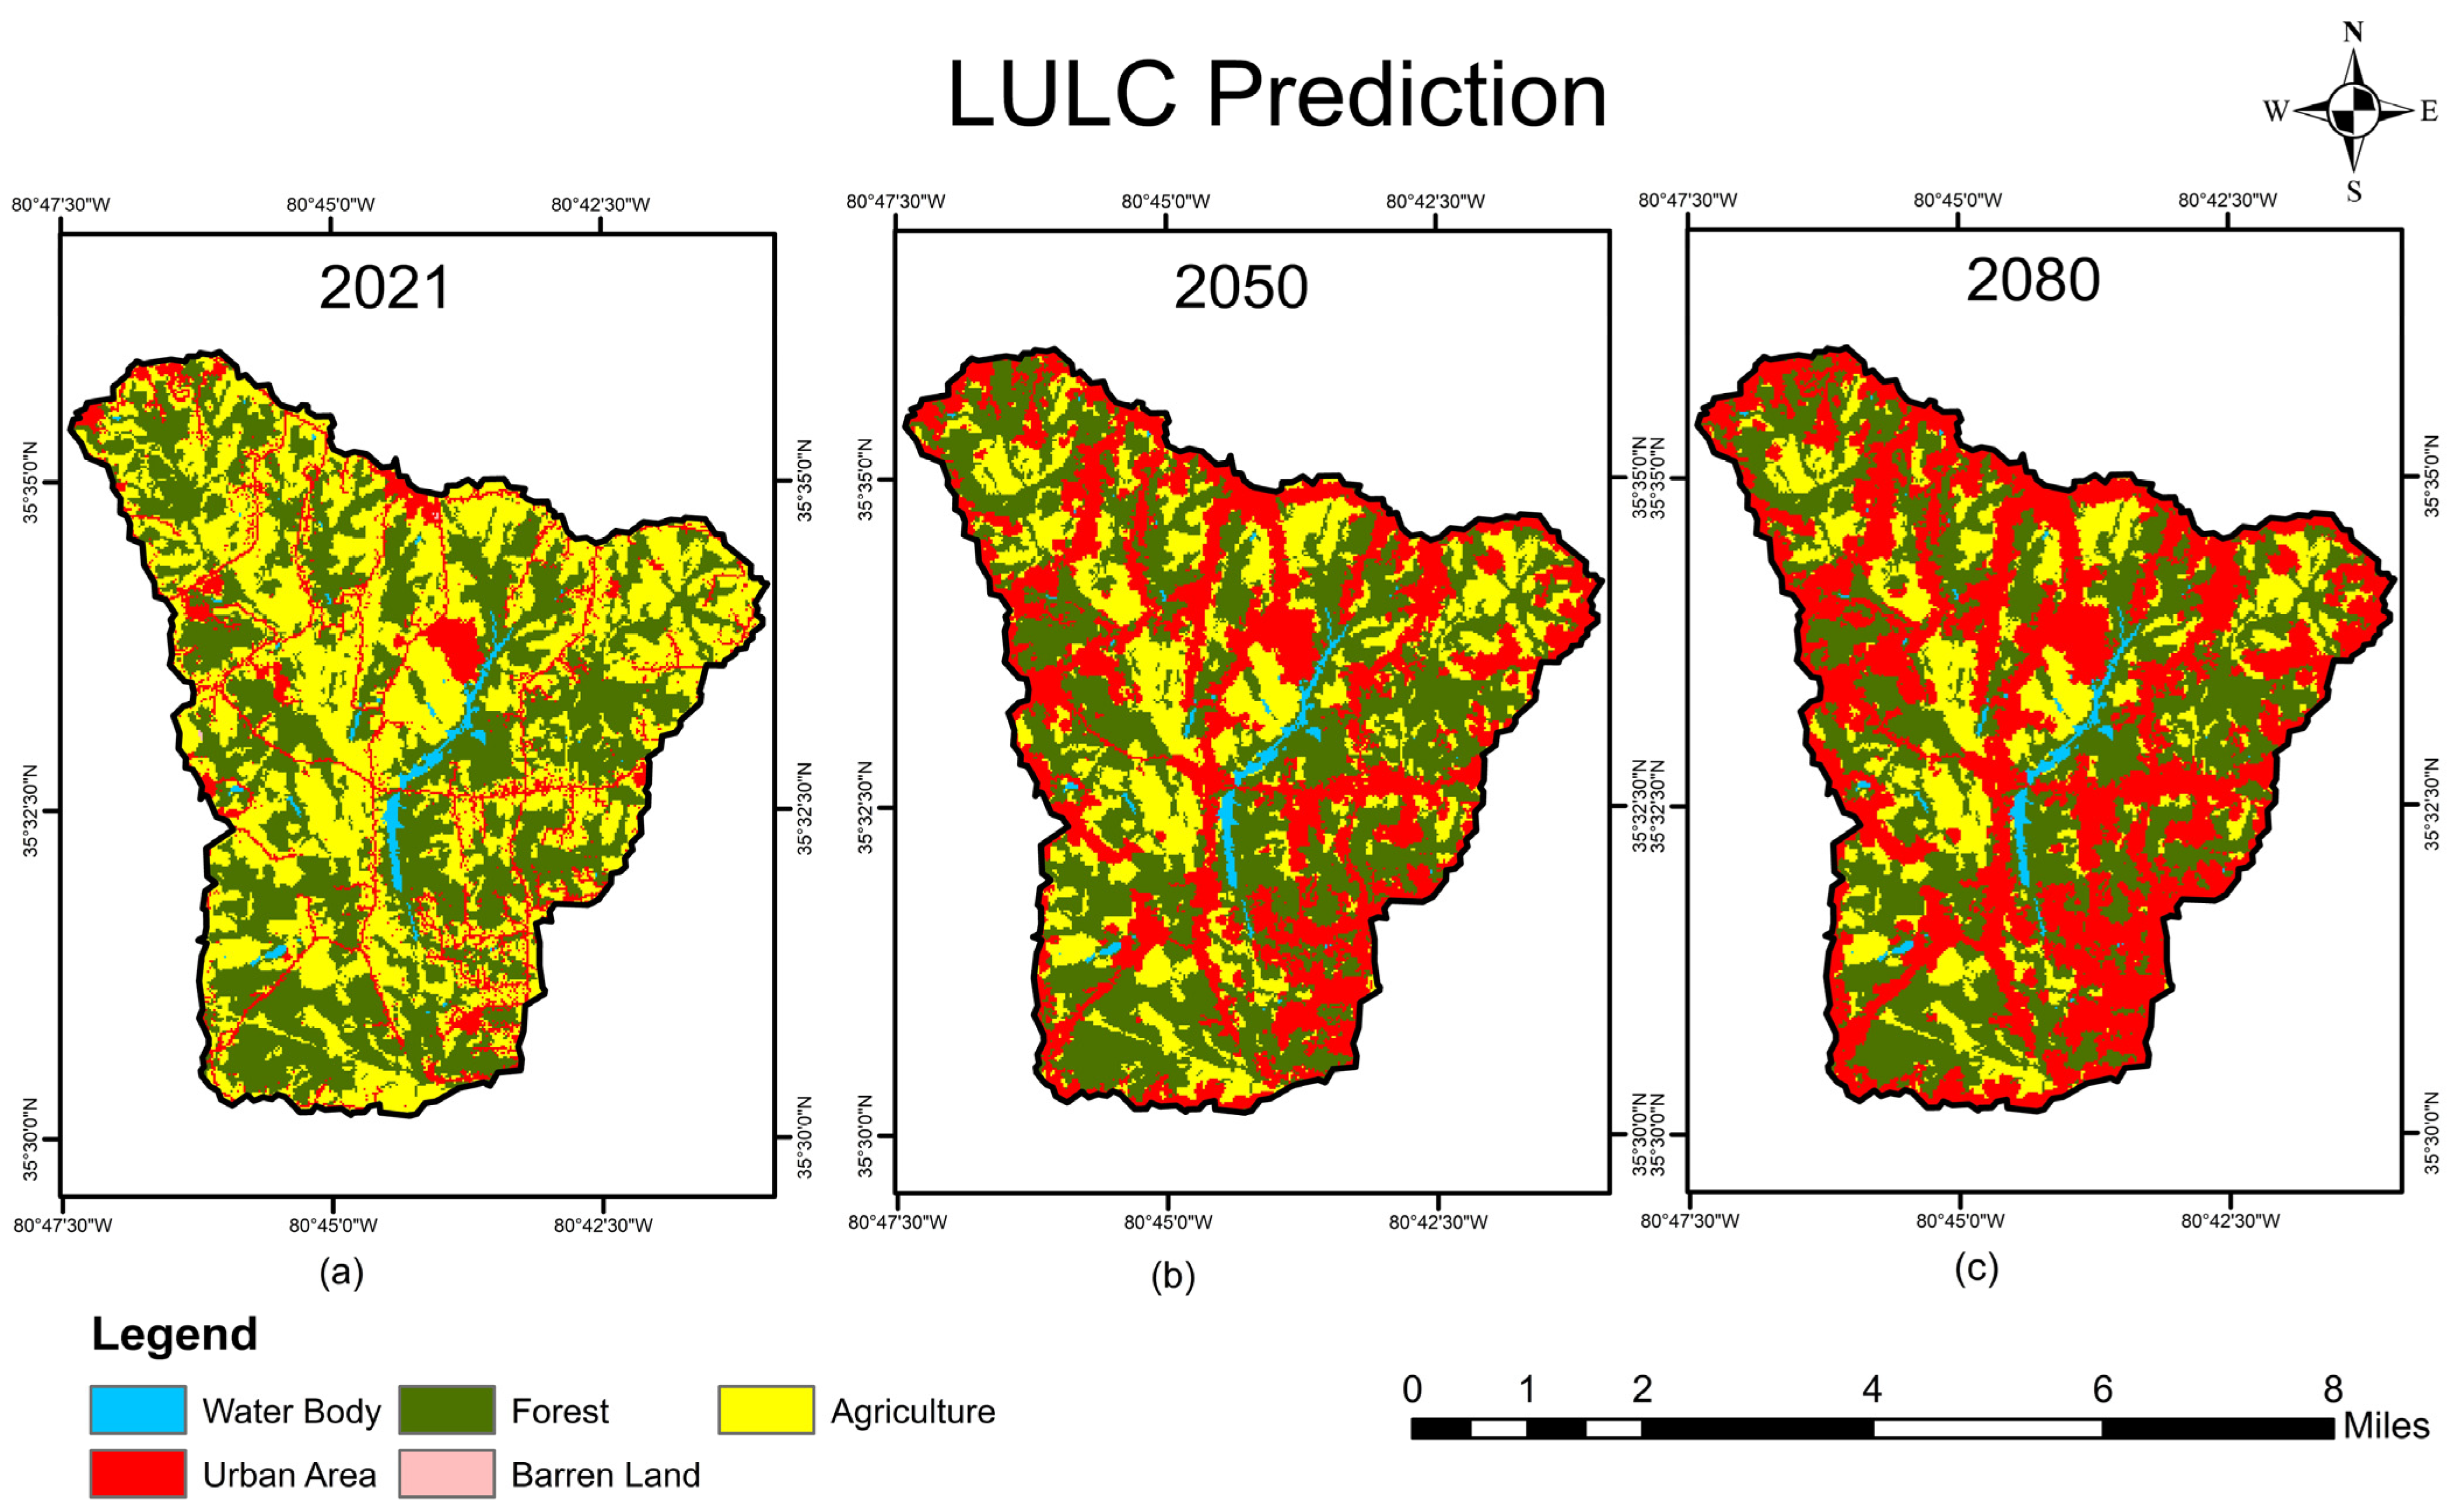
3.3. LULC Change
3.4. Effect of LULC Change on Streamflow
4. Discussion and Conclusions
Author Contributions
Funding
Data Availability Statement
Acknowledgments
Conflicts of Interest
References
- Liu, Y.; Huang, X.; Yang, H.; Zhong, T. Environmental effects of land-use/cover change caused by urbanization and policies in Southwest China Karst area—A case study of Guiyang. Habitat Int. 2014, 44, 339–348. [Google Scholar] [CrossRef]
- Torbick, N.M.; Qi, J.; Roloff, G.J.; Stevenson, R.J. Investigating Impacts of Land-Use Land Cover Change on Wetlands in the Muskegon River Watershed, Michigan, USA. Wetlands 2006, 26, 1103–1113. [Google Scholar] [CrossRef]
- Hassan, M.M.; Nazem, M.N.I. Examination of Land Use/Land Cover Changes, Urban Growth Dynamics, and Environmental Sustainability in Chittagong City, Bangladesh. Environ. Dev. Sustain. 2016, 18, 697–716. [Google Scholar] [CrossRef]
- Van Vliet, J.; de Groot, H.L.; Rietveld, P.; Verburg, P.H. Manifestations and Underlying Drivers of Agricultural Land Use Change in Europe. Landsc. Urban Plan. 2015, 133, 24–36. [Google Scholar] [CrossRef]
- Lant, C.; Stoebner, T.J.; Schoof, J.T.; Crabb, B. The Effect of Climate Change on Rural Land Cover Patterns in the Central United States. Clim. Chang. 2016, 138, 585–602. [Google Scholar] [CrossRef]
- Birhanu, A.; Masih, I.; Van Der Zaag, P.; Nyssen, J.; Cai, X. Impacts of Land Use and Land Cover Changes on Hydrology of the Gumara Catchment, Ethiopia. Phys. Chem. Earth Parts A/B/C 2019, 112, 165–174. [Google Scholar] [CrossRef]
- Yin, J.; He, F.; Xiong, Y.J.; Qiu, G.Y. Effects of Land Use/Land Cover and Climate Changes on Surface Runoff in a Semi-Humid and Semi-Arid Transition Zone in Northwest China. Hydrol. Earth Syst. Sci. 2017, 21, 183–196. [Google Scholar] [CrossRef]
- Aryal, A.; Acharya, A.; Kalra, A. Assessing the Implication of Climate Change to Forecast Future Flood Using CMIP6 Climate Projections and HEC-RAS Modeling. Forecasting 2022, 4, 582–603. [Google Scholar] [CrossRef]
- Pradhan-Salike, I.; Pokharel, J.R. Impact of Urbanization and Climate Change on Urban Flooding: A Case of the Kathmandu Valley. JNRD J. Nat. Resour. Dev. 2017, 7, 56–66. [Google Scholar] [CrossRef]
- Pumo, D.; Arnone, E.; Francipane, A.; Caracciolo, D.; Noto, L.V. Potential Implications of Climate Change and Urbanization on Watershed Hydrology. J. Hydrol. 2017, 554, 80–99. [Google Scholar] [CrossRef]
- Sadeghi, S.M.M.; Gordon, D.A.; Van Stan, J.T., II. A Global Synthesis of Throughfall and Stemflow Hydrometeorology. In Precipitation Partitioning by Vegetation: A Global Synthesis; Van Stan, I., John, T., Gutmann, E., Friesen, J., Eds.; Springer International Publishing: Cham, Switzerland, 2020; pp. 49–70. ISBN 978-3-030-29702-2. [Google Scholar] [CrossRef]
- Wang, Y.; Li, C.; Liu, M.; Cui, Q.; Wang, H.; Lv, J.; Li, B.; Xiong, Z.; Hu, Y. Spatial Characteristics and Driving Factors of Urban Flooding in Chinese Megacities. J. Hydrol. 2022, 613, 128464. [Google Scholar] [CrossRef]
- Vörösmarty, C.J.; Green, P.; Salisbury, J.; Lammers, R.B. Global Water Resources: Vulnerability from Climate Change and Population Growth. Science 2000, 289, 284–288. [Google Scholar] [CrossRef]
- Okello, C.; Tomasello, B.; Greggio, N.; Wambiji, N.; Antonellini, M. Impact of Population Growth and Climate Change on the Freshwater Resources of Lamu Island, Kenya. Water 2015, 7, 1264–1290. [Google Scholar] [CrossRef]
- Aluko, O.E. The Impact of Urbanization on Housing Development: The Lagos Experience, Nigeria. Ethiop. J. Environ. Stud. Manag. 2010, 3. [Google Scholar] [CrossRef]
- Suriya, S.; Mudgal, B.V. Impact of Urbanization on Flooding: The Thirusoolam Sub Watershed—A Case Study. J. Hydrol. 2012, 412–413, 210–219. [Google Scholar] [CrossRef]
- Feng, B.; Zhang, Y.; Bourke, R. Urbanization impacts on flood risks based on urban growth data and coupled flood models. Nat. Hazards 2021, 106, 613–627. [Google Scholar] [CrossRef]
- White, M.D.; Greer, K.A. The Effects of Watershed Urbanization on the Stream Hydrology and Riparian Vegetation of Los Penasquitos Creek, California. Landsc. Urban Plan. 2006, 74, 125–138. [Google Scholar] [CrossRef]
- Woldesenbet, T.A.; Elagib, N.A.; Ribbe, L.; Heinrich, J. Catchment response to climate and land use changes in the Upper Blue Nile sub-basins, Ethiopia. Sci. Total Environ. 2018, 644, 193–206. [Google Scholar] [CrossRef]
- Dwarakish, G.S.; Ganasri, B.P. Impact of Land Use Change on Hydrological Systems: A Review of Current Modeling Approaches. Cogent Geosci. 2015, 1, 1115691. [Google Scholar] [CrossRef]
- Gashaw, T.; Tulu, T.; Argaw, M.; Worqlul, A.W. Modeling the Hydrological Impacts of Land Use/Land Cover Changes in the Andassa Watershed, Blue Nile Basin, Ethiopia. Sci. Total Environ. 2018, 619–620, 1394–1408. [Google Scholar] [CrossRef]
- Masih, I.; Maskey, S.; Uhlenbrook, S.; Smakhtin, V. Impact of Upstream Changes in Rain-Fed Agriculture on Downstream Flow in a Semi-Arid Basin. Agric. Water Manag. 2011, 100, 36–45. [Google Scholar] [CrossRef]
- Nie, W.; Yuan, Y.; Kepner, W.; Nash, M.S.; Jackson, M.; Erickson, C. Assessing Impacts of Landuse and Landcover Changes on Hydrology for the Upper San Pedro Watershed. J. Hydrol. 2011, 407, 105–114. [Google Scholar] [CrossRef]
- Getachew, H.E.; Melesse, A.M. The Impact of Land Use Change on the Hydrology of the Angereb Watershed, Ethiopia. Int. J. Water Sci. 2012, 1. [Google Scholar] [CrossRef]
- Welde, K.; Gebremariam, B. Effect of Land Use Land Cover Dynamics on Hydrological Response of Watershed: Case Study of Tekeze Dam Watershed, Northern Ethiopia. Int. Soil Water Conserv. Res. 2017, 5, 1–16. [Google Scholar] [CrossRef]
- Brody, S.; Blessing, R.; Sebastian, A.; Bedient, P. Examining the Impact of Land Use/Land Cover Characteristics on Flood Losses. J. Environ. Plan. Manag. 2014, 57, 1252–1265. [Google Scholar] [CrossRef]
- Gao, J.; Holden, J.; Kirkby, M. The Impact of Land-cover Change on Flood Peaks in Peatland Basins. Water Resour. Res. 2016, 52, 3477–3492. [Google Scholar] [CrossRef]
- Setegn, S.G.; Srinivasan, R.; Dargahi, B. Hydrological Modelling in the Lake Tana Basin, Ethiopia Using SWAT Model. Open Hydrol. J. 2008, 2, 49–62. [Google Scholar] [CrossRef]
- Gebremicael, T.G.; Mohamed, Y.A.; Betrie, G.D.; van der Zaag, P.; Teferi, E. Trend Analysis of Runoff and Sediment Fluxes in the Upper Blue Nile Basin: A Combined Analysis of Statistical Tests, Physically-Based Models and Landuse Maps. J. Hydrol. 2013, 482, 57–68. [Google Scholar] [CrossRef]
- Neupane, R.P.; Kumar, S. Estimating the Effects of Potential Climate and Land Use Changes on Hydrologic Processes of a Large Agriculture Dominated Watershed. J. Hydrol. 2015, 529, 418–429. [Google Scholar] [CrossRef]
- Huong, H.T.L.; Pathirana, A. Urbanization and Climate Change Impacts on Future Urban Flooding in Can Tho City, Vietnam. Hydrol. Earth Syst. Sci. 2013, 17, 379–394. [Google Scholar] [CrossRef]
- Shanableh, A.; Al-Ruzouq, R.; Yilmaz, A.G.; Siddique, M.; Merabtene, T.; Imteaz, M.A. Effects of Land Cover Change on Urban Floods and Rainwater Harvesting: A Case Study in Sharjah, UAE. Water 2018, 10, 631. [Google Scholar] [CrossRef]
- Bahremand, A.; De Smedt, F.; Corluy, J.; Liu, Y.B.; Poorova, J.; Velcicka, L.; Kunikova, E. WetSpa Model Application for Assessing Reforestation Impacts on Floods in Margecany–Hornad Watershed, Slovakia. Water Resour. Manag. 2007, 21, 1373–1391. [Google Scholar] [CrossRef]
- Somvanshi, S.S.; Bhalla, O.; Kunwar, P.; Singh, M.; Singh, P. Monitoring Spatial LULC Changes and Its Growth Prediction Based on Statistical Models and Earth Observation Datasets of Gautam Budh Nagar, Uttar Pradesh, India. Environ. Dev. Sustain. 2020, 22, 1073–1091. [Google Scholar] [CrossRef]
- Das, S.; Sarkar, R. Predicting the Land Use and Land Cover Change Using Markov Model: A Catchment Level Analysis of the Bhagirathi-Hugli River. Spat. Inf. Res. 2019, 27, 439–452. [Google Scholar] [CrossRef]
- Mozaffaree Pour, N.; Oja, T. Prediction Power of Logistic Regression (LR) and Multi-Layer Perceptron (MLP) Models in Exploring Driving Forces of Urban Expansion to Be Sustainable in Estonia. Sustainability 2021, 14, 160. [Google Scholar] [CrossRef]
- Feng, C.; Zhang, N.; Habiyakare, T.; Yu, H. Development of a Cellular Automata-Based Distributed Hydrological Model for Simulating Urban Surface Runoff. J. Hydrol. 2023, 627, 130348. [Google Scholar] [CrossRef]
- Rahman, M.T.U.; Tabassum, F.; Rasheduzzaman, M.; Saba, H.; Sarkar, L.; Ferdous, J.; Uddin, S.Z.; Zahedul Islam, A.Z.M. Temporal Dynamics of Land Use/Land Cover Change and Its Prediction Using CA-ANN Model for Southwestern Coastal Bangladesh. Environ. Monit. Assess. 2017, 189, 565. [Google Scholar] [CrossRef]
- Tong, X.; Feng, Y. A Review of Assessment Methods for Cellular Automata Models of Land-Use Change and Urban Growth. Int. J. Geogr. Inf. Sci. 2020, 34, 866–898. [Google Scholar] [CrossRef]
- Tan, X.; Deng, M.; Chen, K.; Shi, Y.; Zhao, B.; Liu, Q. A Spatial Hierarchical Learning Module Based Cellular Automata Model for Simulating Urban Expansion: Case Studies of Three Chinese Urban Areas. GIScience Remote Sens. 2024, 61, 2290352. [Google Scholar] [CrossRef]
- Clarke, K.C.; Hoppen, S.; Gaydos, L. A Self-Modifying Cellular Automaton Model of Historical Urbanization in the San Francisco Bay Area. Environ. Plann. B 1997, 24, 247–261. [Google Scholar] [CrossRef]
- Sang, L.; Zhang, C.; Yang, J.; Zhu, D.; Yun, W. Simulation of Land Use Spatial Pattern of Towns and Villages Based on CA–Markov Model. Math. Comput. Model. 2011, 54, 938–943. [Google Scholar] [CrossRef]
- Wagner, D.F. Cellular Automata and Geographic Information Systems. Environ. Plann. B Plann. Des. 1997, 24, 219–234. [Google Scholar] [CrossRef]
- Aburas, M.M.; Ho, Y.M.; Ramli, M.F.; Ash’aari, Z.H. The Simulation and Prediction of Spatio-Temporal Urban Growth Trends Using Cellular Automata Models: A Review. Int. J. Appl. Earth Obs. Geoinf. 2016, 52, 380–389. [Google Scholar] [CrossRef]
- Noszczyk, T. A Review of Approaches to Land Use Changes Modeling. Hum. Ecol. Risk Assess. Int. J. 2019, 25, 1377–1405. [Google Scholar] [CrossRef]
- Almeida, C.M.; Gleriani, J.M.; Castejon, E.F.; Soares-Filho, B.S. Using Neural Networks and Cellular Automata for Modelling Intra-urban Land-use Dynamics. Int. J. Geogr. Inf. Sci. 2008, 22, 943–963. [Google Scholar] [CrossRef]
- Rozos, E.; Butler, D.; Makropoulos, C. An Integrated System Dynamics–Cellular Automata Model for Distributed Water-Infrastructure Planning. Water Sci. Technol. Water Supply 2016, 16, 1519–1527. [Google Scholar] [CrossRef]
- Mustafa, A.; Cools, M.; Saadi, I.; Teller, J. Coupling Agent-Based, Cellular Automata and Logistic Regression into a Hybrid Urban Expansion Model (HUEM). Land Use Policy 2017, 69, 529–540. [Google Scholar] [CrossRef]
- Gaur, S.; Mittal, A.; Bandyopadhyay, A.; Holman, I.; Singh, R. Spatio-temporal analysis of land use and land cover change: A systematic model inter-comparison driven by integrated modelling techniques. Int. J. Remote Sens. 2020, 41, 9229–9255. [Google Scholar] [CrossRef]
- Kumar, V.; Singh, V.K.; Gupta, K.; Jha, A.K. Integrating Cellular Automata and Agent-Based Modeling for Predicting Urban Growth: A Case of Dehradun City. J. Indian Soc. Remote Sens. 2021, 49, 2779–2795. [Google Scholar] [CrossRef]
- Ghosh, P.; Mukhopadhyay, A.; Chanda, A.; Mondal, P.; Akhand, A.; Mukherjee, S.; Nayak, S.K.; Ghosh, S.; Mitra, D.; Ghosh, T. Application of Cellular Automata and Markov-Chain Model in Geospatial Environmental Modeling—A Review. Remote Sens. Appl. Soc. Environ. 2017, 5, 64–77. [Google Scholar] [CrossRef]
- Zhang, Z.; Hu, B.; Jiang, W.; Qiu, H. Identification and Scenario Prediction of Degree of Wetland Damage in Guangxi Based on the CA-Markov Model. Ecol. Indic. 2021, 127, 107764. [Google Scholar] [CrossRef]
- Mondal, M.S.; Sharma, N.; Garg, P.K.; Kappas, M. Statistical Independence Test and Validation of CA Markov Land Use Land Cover (LULC) Prediction Results. Egypt. J. Remote Sens. Space Sci. 2016, 19, 259–272. [Google Scholar] [CrossRef]
- Eastman, J.R. IDRISI Guide to GIS and Image Processing. Accessed in IDRISI Selva 1; Clark University: Worcester, MA, USA, 2009; pp. 182–185. [Google Scholar]
- Amini Parsa, V.; Yavari, A.; Nejadi, A. Spatio-Temporal Analysis of Land Use/Land Cover Pattern Changes in Arasbaran Biosphere Reserve: Iran. Model. Earth Syst. Environ. 2016, 2, 1–13. [Google Scholar] [CrossRef]
- Huang, Y.; Yang, B.; Wang, M.; Liu, B.; Yang, X. Analysis of the Future Land Cover Change in Beijing Using CA–Markov Chain Model. Environ. Earth Sci. 2020, 79, 60. [Google Scholar] [CrossRef]
- Subedi, P.; Subedi, K.; Thapa, B. Application of a Hybrid Cellular Automaton–Markov (CA-Markov) Model in Land-Use Change Prediction: A Case Study of Saddle Creek Drainage Basin, Florida. Appl. Ecol. Environ. Sci. 2013, 1, 126–132. [Google Scholar] [CrossRef]
- Altuwaijri, H.A.; Alotaibi, M.H.; Almudlaj, A.M.; Almalki, F.M. Predicting Urban Growth of Arriyadh City, Capital of the Kingdom of Saudi Arabia, Using Markov Cellular Automata in TerrSet Geospatial System. Arab. J. Geosci. 2019, 12, 135. [Google Scholar] [CrossRef]
- Karimi, H.; Jafarnezhad, J.; Khaledi, J.; Ahmadi, P. Monitoring and prediction of land use/land cover changes using CA-Markov model: A case study of Ravansar County in Iran. Arab. J. Geosci. 2018, 11, 1–9. [Google Scholar] [CrossRef]
- Charlotte Is the 8th Fastest-Growing City in the US. Praise 100.9; 2022. Available online: https://www.wcnc.com/article/money/charlotte-8th-fastest-growing-us-city-unc-research-shows/275-bcf59ea5-e00f-4aba-bdba-5fb6d74cdcaf (accessed on 13 September 2023).
- Charlotte Region Expected to Grow 50 Percent by 2050. Available online: https://www.wcnc.com/article/news/local/charlotte-region-expected-to-grow-50-percent-by-2050-population-growth-york-lancaster-diversity-south-carolina-north-carolina/275-33158760-d79f-4c2c-9da0-eb368e4ca5bf (accessed on 12 September 2023).
- Why Charlotte Is One of the Fastest Growing Cities, Ever. Henderson Properties; 2022. Available online: https://www.hendersonproperties.com/2022/05/charlotte-fast-growth/ (accessed on 13 September 2023).
- Houet, T.; Hubert-Moy, L. Modeling and projecting land-use and land-cover changes with Cellular Automaton in considering landscape trajectories. EARSeL eProc. 2006, 5, 63–76. Available online: https://shs.hal.science/halshs-00195847/document (accessed on 19 November 2023).
- Tang, J.; Wang, L.; Yao, Z. Spatio-temporal Urban Landscape Change Analysis Using the Markov Chain Model and a Modified Genetic Algorithm. Int. J. Remote Sens. 2007, 28, 3255–3271. [Google Scholar] [CrossRef]
- Azizi, A.; Malakmohamadi, B.; Jafari, H.R. Land Use and Land Cover Spatiotemporal Dynamic Pattern and Predicting Changes Using Integrated CA-Markov Model. Glob. J. Environ. Sci. Manag. 2016, 2, 223–234. [Google Scholar] [CrossRef]
- Gong, W.; Yuan, L.; Fan, W.; Stott, P. Analysis and Simulation of Land Use Spatial Pattern in Harbin Prefecture Based on Trajectories and Cellular Automata—Markov Modelling. Int. J. Appl. Earth Obs. Geoinf. 2015, 34, 207–216. [Google Scholar] [CrossRef]
- Lu, Y.; Wu, P.; Ma, X.; Li, X. Detection and Prediction of Land Use/Land Cover Change Using Spatiotemporal Data Fusion and the Cellular Automata–Markov Model. Environ. Monit. Assess. 2019, 191, 68. [Google Scholar] [CrossRef]
- Aliani, H.; Malmir, M.; Sourodi, M.; Kafaky, S.B. Change Detection and Prediction of Urban Land Use Changes by CA–Markov Model (Case Study: Talesh County). Environ. Earth Sci. 2019, 78, 546. [Google Scholar] [CrossRef]
- Camara, M.; Jamil, N.R.B.; Abdullah, A.F.B.; Hashim, R.B. Integrating Cellular Automata Markov Model to Simulate Future Land Use Change of a Tropical Basin. Glob. J. Environ. Sci. Manag. 2020, 6, 403–414. [Google Scholar] [CrossRef]
- Rafaai, N.H.; Abdullah, S.A.; Reza, M.I.H. Identifying Factors and Predicting the Future Land-Use Change of Protected Area in the Agricultural Landscape of Malaysian Peninsula for Conservation Planning. Remote Sens. Appl. Soc. Environ. 2020, 18, 100298. [Google Scholar] [CrossRef]
- Eastman, J.R. TerrSet 2020 Geospatial Monitoring and Modeling System; Clark Labs, Clark University: Worcester, MA, USA, 2020. [Google Scholar]
- Azari, M.; Billa, L.; Chan, A. Multi-Temporal Analysis of Past and Future Land Cover Change in the Highly Urbanized State of Selangor, Malaysia. Ecol. Process. 2022, 11, 2. [Google Scholar] [CrossRef]
- Rahnama, M.R. Forecasting Land-Use Changes in Mashhad Metropolitan Area Using Cellular Automata and Markov Chain Model for 2016–2030. Sustain. Cities Soc. 2021, 64, 102548. [Google Scholar] [CrossRef]
- Gironás, J.; Roesner, L.A.; Davis, J.; Rossman, L.A.; Supply, W. Storm Water Management Model Applications Manual; National Risk Management Research Laboratory, Office of Research and Development, US Environmental Protection Agency: Cincinnati, OH, USA, 2009.
- Akhter, M.S.; Hewa, G.A. The Use of PCSWMM for Assessing the Impacts of Land Use Changes on Hydrological Responses and Performance of WSUD in Managing the Impacts at Myponga Catchment, South Australia. Water 2016, 8, 511. [Google Scholar] [CrossRef]
- Di Bucchianico, A. Coefficient of determination (R2). Encyclopedia of Statistics in Quality and Reliability; John Wiley & Sons, Ltd.: New Jersey, NY, USA, 2008. [Google Scholar] [CrossRef]
- Gupta, H.V.; Sorooshian, S.; Yapo, P.O. Status of automatic calibration for hydrologic models: Comparison with multilevel expert calibration. J. Hydrol. Eng. 1999, 4, 135–143. [Google Scholar] [CrossRef]
- Althoff, D.; Rodrigues, L.N. Goodness-of-Fit Criteria for Hydrological Models: Model Calibration and Performance Assessment. J. Hydrol. 2021, 600, 126674. [Google Scholar] [CrossRef]
- Pontius, R.G.; Peethambaram, S.; Castella, J.-C. Comparison of Three Maps at Multiple Resolutions: A Case Study of Land Change Simulation in Cho Don District, Vietnam. Ann. Assoc. Am. Geogr. 2011, 101, 45–62. [Google Scholar] [CrossRef]
- Pontius, R.G.; Millones, M. Death to Kappa: Birth of Quantity Disagreement and Allocation Disagreement for Accuracy Assessment. Int. J. Remote Sens. 2011, 32, 4407–4429. [Google Scholar] [CrossRef]
- Huber, M.; Trapp, J. A review of nexrad level ii: Data, distribution, and applications. J. Terr. Obs. 2009, 1, 4. [Google Scholar]
- Bhusal, A.; Ghimire, A.B.; Thakur, B.; Kalra, A. Evaluating the Hydrological Performance of Integrating PCSWMM and NEXRAD Precipitation Product at Different Spatial Scales of Watersheds. Model. Earth Syst. Environ. 2023, 9, 4251–4264. [Google Scholar] [CrossRef]
- Hamedi, A.; Fuentes, H.R. Comparative Effectiveness and Reliability of NEXRAD Data to Predict Outlet Hydrographs Using the GSSHA and HEC-HMS Hydrologic Models. In Proceedings of the World Environmental and Water Resources Congress 2015, Austin, TX, USA, 17–21 May 2015; pp. 1444–1453. [Google Scholar] [CrossRef]
- Abduljaleel, Y.; Salem, A.; ul Haq, F.; Awad, A.; Amiri, M. Improving Detention Ponds for Effective Stormwater Management and Water Quality Enhancement under Future Climate Change: A Simulation Study Using the PCSWMM Model. Sci. Rep. 2023, 13, 5555. [Google Scholar] [CrossRef]
- Xiao, H.; Vasconcelos, J.G. Evaluating Curve Number Implementation Alternatives for Peak Flow Predictions in Urbanized Watersheds Using SWMM. Water 2023, 15, 41. [Google Scholar] [CrossRef]
- Salcedo, S.M.; Suson, P.D.; Milano, A.E.; Ignacio, M.T. Impact of dynamically changing land cover on runoff process: The case of Iligan river basin. In Remote Sensing for Agriculture, Ecosystems, and Hydrology XVIII; SPIE: Bellingham, WA, USA, 2016; Volume 9998, pp. 283–297. [Google Scholar]
- Chen, X.; Zhang, H.; Chen, W.; Huang, G. Urbanization and Climate Change Impacts on Future Flood Risk in the Pearl River Delta under Shared Socioeconomic Pathways. Sci. Total Environ. 2021, 762, 143144. [Google Scholar] [CrossRef]
- Gao, J.; Liu, J.; Xu, R.; Pandey, S.; Vankayala Siva, V.S.K.S.; Yu, D. Environmental Pollution Analysis and Impact Study—A Case Study for the Salton Sea in California. Atmosphere 2022, 13, 914. [Google Scholar] [CrossRef]
- Garg, V.; Nikam, B.R.; Thakur, P.K.; Aggarwal, S.P.; Gupta, P.K.; Srivastav, S.K. Human-Induced Land Use Land Cover Change and Its Impact on Hydrology. HydroResearch 2019, 1, 48–56. [Google Scholar] [CrossRef]
- Astuti, I.S.; Sahoo, K.; Milewski, A.; Mishra, D.R. Impact of Land Use Land Cover (LULC) Change on Surface Runoff in an Increasingly Urbanized Tropical Watershed. Water Resour. Manag. 2019, 33, 4087–4103. [Google Scholar] [CrossRef]
- Thakali, R.; Kalra, A.; Ahmad, S.; Qaiser, K. Management of an Urban Stormwater System Using Projected Future Scenarios of Climate Models: A Watershed-Based Modeling Approach. Open Water 2018, 5, 1. [Google Scholar]
- Qin, H.; Li, Z.; Fu, G. The Effects of Low Impact Development on Urban Flooding under Different Rainfall Characteristics. J. Environ. Manag. 2013, 129, 577–585. [Google Scholar] [CrossRef]
- Ahiablame, L.; Shakya, R. Modeling Flood Reduction Effects of Low Impact Development at a Watershed Scale. J. Environ. Manag. 2016, 171, 81–91. [Google Scholar] [CrossRef]
- Okwuashi, O.; Ndehedehe, C.E. Integrating Machine Learning with Markov Chain and Cellular Automata Models for Modelling Urban Land Use Change. Remote Sens. Appl. Soc. Environ. 2021, 21, 100461. [Google Scholar] [CrossRef]
- Zhang, Z.; Hörmann, G.; Huang, J.; Fohrer, N. A Random Forest-Based CA-Markov Model to Examine the Dynamics of Land Use/Cover Change Aided with Remote Sensing and GIS. Remote Sens. 2023, 15, 2128. [Google Scholar] [CrossRef]

| Data | Source |
|---|---|
| DEM (3 m) | National Map viewer |
| LULC | Multi-Resolution Land Characteristics Consortium (MRLC) |
| Soil | Geospatial Data Gateway |
| Precipitation | National Centers for Environmental Information (NCEI), NEXRAD III Radar Data |
| Road | Open Street Maps |
| Agreement Components | % | Disagreement Components | % |
|---|---|---|---|
| Hits | 3.10 | Wrong Hits | 4.70 |
| Correct Rejection | 68 | False Alarms | 9.30 |
| Misses | 14.90 | ||
| Total | 71.10 | Total | 28.90 |
| Events | Date | Parameter | ||
|---|---|---|---|---|
| R2 | NSE | PBIAS | ||
| 1 | 11 November 2020 | 0.91 | 0.87 | 1.45% |
| 2 | 5 February 2020 | 0.88 | 0.83 | 8.70% |
| LULC/Year | Observed | Simulated | ||||||||||
|---|---|---|---|---|---|---|---|---|---|---|---|---|
| 2001 | 2013 | 2021 | 2021 | 2050 | 2080 | |||||||
| km2 | % | km2 | % | km2 | % | km2 | % | km2 | % | km2 | % | |
| Water Body | 0.70 | 1.2 | 0.69 | 1.2 | 0.69 | 1.2 | 0.67 | 1.1 | 0.67 | 1.1 | 0.67 | 1.1 |
| Urban Area | 5.96 | 10.1 | 7.11 | 12.1 | 6.82 | 11.6 | 7.13 | 12.1 | 20.09 | 34.1 | 26.0 | 44.2 |
| Forest | 26.39 | 44.8 | 25.25 | 42.9 | 25.50 | 43.3 | 25.39 | 43.2 | 25.17 | 42.8 | 22.2 | 37.7 |
| Barren | 0.01 | 0.0 | 0.01 | 0.0 | 0.01 | 0.0 | 0.01 | 0.0 | 0.00 | 0.0 | 0.00 | 0.0 |
| Agriculture | 25.81 | 43.9 | 25.81 | 43.8 | 25.85 | 43.9 | 25.67 | 43.6 | 12.94 | 22.0 | 9.99 | 22.0 |
| Return Period | Year | Peak Discharge (m3/s) | Runoff Volume (m3) | Percentage Change Compared to 2021 | |
|---|---|---|---|---|---|
| Peak Discharge | Runoff Volume | ||||
| T = 10 yrs | 2021 | 288.23 | 4,361,300 | ||
| 2050 | 337.52 | 4,691,500 | 17.1% | 7.6% | |
| 2080 | 374.99 | 5,186,000 | 30.1% | 18.9% | |
| T = 50 yrs | 2021 | 450.73 | 6,197,700 | ||
| 2050 | 515.74 | 6,778,600 | 14.4% | 9.4% | |
| 2080 | 532.65 | 7,149,800 | 18.2% | 15.4% | |
| T = 100 yrs | 2021 | 512.72 | 6,891,900 | ||
| 2050 | 538.58 | 7,441,700 | 5.0% | 8.0% | |
| 2080 | 547.62 | 7,810,100 | 6.8% | 13.3% | |
Disclaimer/Publisher’s Note: The statements, opinions and data contained in all publications are solely those of the individual author(s) and contributor(s) and not of MDPI and/or the editor(s). MDPI and/or the editor(s) disclaim responsibility for any injury to people or property resulting from any ideas, methods, instructions or products referred to in the content. |
© 2024 by the authors. Licensee MDPI, Basel, Switzerland. This article is an open access article distributed under the terms and conditions of the Creative Commons Attribution (CC BY) license (https://creativecommons.org/licenses/by/4.0/).
Share and Cite
Banjara, M.; Bhusal, A.; Ghimire, A.B.; Kalra, A. Impact of Land Use and Land Cover Change on Hydrological Processes in Urban Watersheds: Analysis and Forecasting for Flood Risk Management. Geosciences 2024, 14, 40. https://doi.org/10.3390/geosciences14020040
Banjara M, Bhusal A, Ghimire AB, Kalra A. Impact of Land Use and Land Cover Change on Hydrological Processes in Urban Watersheds: Analysis and Forecasting for Flood Risk Management. Geosciences. 2024; 14(2):40. https://doi.org/10.3390/geosciences14020040
Chicago/Turabian StyleBanjara, Mandip, Amrit Bhusal, Amrit Babu Ghimire, and Ajay Kalra. 2024. "Impact of Land Use and Land Cover Change on Hydrological Processes in Urban Watersheds: Analysis and Forecasting for Flood Risk Management" Geosciences 14, no. 2: 40. https://doi.org/10.3390/geosciences14020040
APA StyleBanjara, M., Bhusal, A., Ghimire, A. B., & Kalra, A. (2024). Impact of Land Use and Land Cover Change on Hydrological Processes in Urban Watersheds: Analysis and Forecasting for Flood Risk Management. Geosciences, 14(2), 40. https://doi.org/10.3390/geosciences14020040