Abstract
Seismic risk management in urban areas requires accurate prediction of the expected seismic hazard. The seismic design standards in the world provide the seismic design spectra (DS). These are crucial for estimating seismic forces on a structure, are typically derived from theoretical models in deterministic or probabilistic seismic hazard studies, especially for bedrock soils. Characterizing soil dynamic amplification frequencies or periods is necessary to establish site-specific design spectra (DSsite). Geotechnical and geophysical studies, along with environmental vibration records, determine soil stratigraphy characteristic features and their dominant frequency or period. These parameters improve our understanding of seismic wave behavior from bedrock to surface soil during earthquakes. This article details the utilization of geotechnical, geophysical studies, and environmental vibration records to estimate DSsite in accordance with Mexican seismic regulation and examines the cost–benefit aspects of using the Dssite in optimizing the structural design of a medium-rise steel building in southeastern Mexico, characterized by soft soil and a moderate seismic hazard. The case study demonstrates an 18% cost savings in the structural elements of the building by employing the DSsite with more rational spectral ordinates for study site.
1. Introduction
Seismic risk of a location involves assessing the likelihood of a seismic event occurring in a specific geographical area within a defined timeframe, leading to potential material damage and human losses [1]. This assessment hinges on the interplay of two key factors [2]: 1. the seismic hazard inherent to the site, and 2. The structural vulnerability of buildings situated there. Seismic hazard refers to the probability of earthquakes with specific magnitudes and frequencies taking place in each region, drawing from historical earthquake data, seismic activity of the area, and geological information, among other aspects [3]. While seismic vulnerability is related to the structural design features of structures and their response to the dynamic forces induced by an earthquake [4].
Considering these two aspects, it is crucial to recognize that an effective seismic risk management policy for urban areas requires a comprehensive approach encompassing prevention, mitigation, and response strategies to seismic events, all aimed at minimizing adverse impacts and for urban planning with resilient constructions of buildings and infrastructures, thus safeguarding the population against seismic risks. To proactively address and mitigate risks in urban settings, adherence to contemporary earthquake-resistant structural design standards is imperative. This ensures a reduction of vulnerabilities in both new constructions and reinforcement of existing structures. Furthermore, in the process of analysis and structural design of buildings, a careful consideration of the expected seismic hazard at the site is essential. The current seismic regulations in the Republic of Mexico, the Manual of Civil Structures Design, Earthquake Design of Federal Electricity Commission (MDOC-CFE, in Spanish) [5], determine seismic hazard across the entire country through a combination of deterministic and probabilistic approaches. These approaches involve studying: (1) recurrence laws of seismicity in earthquake-tectonic zones and characteristic earthquakes in Mexico, and (2) the laws governing the attenuation of the seismic waves by the ground motion prediction equations (GMPE). This comprehensive analysis results in, for Mexico, a division into four seismic zones (A = low seismicity; B = medium seismicity; C = high seismicity; and D = very high seismicity). Additionally, the PRODISIS program [6] is introduced, enabling the generation of uniform seismic hazard spectra (reference spectrum with equal probability of exceedance of a certain hazard in all structural periods) for rock soil. Based on these spectra, design spectra can be derived for any site in the Mexican Republic, considering variations in soil hardness (I for rock soil, II for medium soil, and III for soft soil).
The PRODISIS software [6] is a significant stride in seismic engineering for the country. However, it is essential to point out that the estimates of the uniform seismic hazard spectrum rely on theoretical–numerical models. To achieve a danger, an estimate more closely aligned with the anticipated reality for a specific site, measurements of earthquake accelerograms occurring around interest would be invaluable. Ground acceleration records from earthquakes enable the characterization of frequencies or periods of dynamic amplification at a given site. Despite Mexico boasting an extensive accelerographic network, its coverage is insufficient to span the entire country. A current alternative to characterizing soil dynamics and enhancing seismic hazard estimation at a site involves conducting geotechnical exploration and geophysical prospecting studies. Through these studies, the site’s stratigraphy can be determined, including thicknesses, soil unit weight (γs), shear-wave propagation velocities (Vs), and the fundamental period or fundamental frequency of the soil through environmental vibration records. Utilizing this information, a transfer function can be developed to illustrate the amplification of seismic waves from bedrock to the surface soil. This approach allows for a more accurate depiction of dynamic soil amplification effects at the site, facilitating the derivation of design spectra that better align with the real seismic threat posed to the location. Tabasco is a state with seismic hazards regions ranging from moderate to high, as indicated by the seismic regionalization map of Mexico [5], but with an accelerographic network that is very limited. Also, due to the prevalence of soft soils in this state, there is a potential for substantial amplification of ground accelerations during an earthquake. Hence, it was deemed an appropriate location for this study.
2. Seismic Hazard in Mexico
The exploration of seismic hazard is a topic permanently studied by the global scientific community, given the intricacies of the phenomenon and the threat it poses to societies. Each significant seismic event contributes to new knowledge, often incurring substantial economic and social costs. In this context, Mexico is situated in a region with notable seismic activity, prompting endeavors to establish tools for structural engineers to determine seismic demands in designing and/or reviewing structures. This involves utilizing seismic hazard studies for a specific area to establish criteria ensuring building safety and accepting appropriate seismic action levels. In Mexico, the MDOC-CFE [5] serves as the regulatory framework for reviewing the earthquake-resistant design of buildings. For the capital city, Mexico City, the Complementary Technical Norms for the Review of the Structural Safety of Buildings (NTC-RSEE, in Spanish) [7] are particularly adopted.
For the seismic hazard in Mexico, the MDOC-CFE [5] conducted a study employing both deterministic and probabilistic approaches to assess earthquake occurrences across the Mexican Republic. Then, the Mexican territory was divided into 48 zones characterized by the country’s tectonics and historical earthquake records. These zones generate earthquakes with a recurrence rate per unit area. The seismic activity of each source is measured as the rate of exceedance of a given magnitude, indicating the recurrence of earthquakes in an area with a magnitude greater than a specified threshold. To assess exceedance rates, two seismicity models were utilized: (i) the modified Gutenberg–Richter relationship and (ii) the characteristic earthquake model. Within the earthquake recurrence zones, specific types of earthquakes occur in accordance with the geological faults present in the country: (1) subduction earthquakes; (2) normal faulting earthquakes; and (3) intermediate-depth and shallow continental crust earthquakes. Three ground motion prediction equations (GMPE) were employed: (a) for interplate coastal earthquakes, the attenuation model studied by Arroyo et al. [8] was used, which describes ground accelerations for earthquakes generated by subduction on the southern Pacific coast; (b) for intermediate-depth earthquakes, the empirical attenuation model of Zhao [9] was used; and (c) for shallow earthquakes, the Abrahamson and Silva attenuation model [10] was used, considering strike-slip faults for firm ground and without accounting for the “hanging wall” effect.” After determining the seismic recurrence of seismogenic sources along with their uncertainties and attenuation behavior, the cumulative effects of all seismic sources are considered. This involves calculating the distances between each source and the study area to assess the seismic hazard. The hazard is expressed in terms of intensity exceedance rates (Sa) and is computed through a spatial integration process that takes into account all potential focal locations [11,12]. As a result of these approaches, the MDOC-CFE [5] developed a seismic regionalization for zones in the Mexican Republic based on maximum acceleration in rock soil (a0r), denoted as a0r for an optimal return period. This regionalization categorizes seismic zones as follows: Zone A (low seismicity) with intensities a0r < 50 cm/s2; Zone B (moderate seismicity) with intensities 50 cm/s2 ≤ a0r ≤ 100 cm/s2; Zone C (high seismicity) with intensities 100 cm/s2 ≤ a0r ≤ 200 cm/s2; and Zone D (very high seismicity) with intensities a0r ≥ 200 cm/s2. Also, design spectra for the republic were presented based on uniform seismic hazard spectra, wherein the spectral ordinates contain an equal probability of exceedance for a specified return period.
To streamline the process of defining seismic demand in the Mexican territory, CFE provides the PRODISIS software [6]. This tool serves as a centralized resource for the seismic hazard study of the Mexican Republic, enabling engineers to extract seismic parameters for constructing design spectra for any geographical coordinate in the country, including the maximum acceleration (a0r), the maximum velocity (vrmax), and the maximum displacement (drmax) in the rock soil in cm/s2, cm/s, and cm, respectively. As well as the acceleration of the reference spectrum in rock soil (cr) in cm/s2; the reference return period (Tr) for the optimal recurrence rate for the design of common structures, classified as group B1; the seismic zone classification of the site, and the reference seismic hazard spectrum (ER) in rock soil to a specific return period. Importantly, the program allows for obtaining these seismic parameters for a return period different (EPR) from the one considered by the reference program. Figure 1 illustrates the seismic parameters for a site (longitude coordinate of 93°0′12.1968″ N and latitude coordinate of 18°24′45.453″ W) located within Tabasco state, Mexico, as derived from PRODISIS software. This location will serve as the reference point for this study.
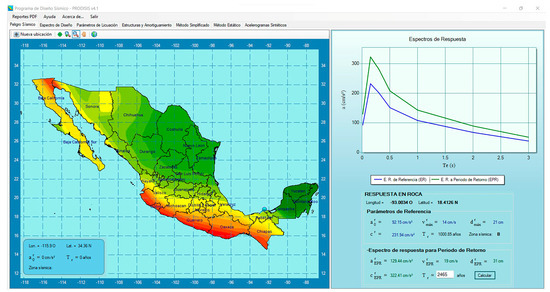
Figure 1.
Seismic parameters for a location in Tabasco state, Mexico, for both the reference seismic hazard spectrum (ER) and a 2465-year return period, as derived from PRODISIS software (in Spanish) [6]. Red color is very high seismicity (seismic zone D); orange color is high seismicity (seismic zone C); yellow color is medium seismicity (seismic zone B), and green color is low seismicity (seismic zone A).
3. Design Spectra in Mexico
The reference seismic hazard spectrum (ER) in rock soil holds paramount importance, as it serves as the basis for determining the seismic design spectrum (DS). This spectrum DS is constructed following the recommendations and formulas outlined by MDOC-CFE [5] as a function of the structural periods and damping (ξ) factor, and it is easily obtained by the PRODISIS software [6]. For this purpose, it becomes imperative to ascertain the required safety level for the studied structure, thereby defining the appropriate type of design spectrum. MDOC-CFE [5] categorizes structural groups and classes based on their importance. Table 1 provides a concise summary of this classification.

Table 1.
Building classifications in Mexico according to the sector they belong to and size of the building.
MDOC-CFE [5] establishes the construction of design spectra for each building group, providing a summary for each. For building the B2 group, the recommended use is the Constant Acceleration Spectrum, applicable to any structural period. Its application depends solely on the seismic zone of the study site, considering the parameter a0r multiplied by the site and response factors from Table A1 and Table A2 of the MDOC-CFE [5] (see Appendix A). While this spectrum is the most conservative, it is suitable for buildings of common importance. The A2 and B1 building groups are recommended to use the so-called “Regional Spectrum (RS)”, constructed following Equations in Figure A1, along with values from Table A4 of the MDOC-CFE [5] (see Figure A1 in Appendix A). Their construction requires knowledge of the soil type (type I, type II, and type III), obtained through the direct and indirect exploration methods explained in subsequent sections. For type II soil and type III soil, the site and response factors from Table A1, Table A2 and Table A3 of the MDOC-CFE [5] (see Appendix A) are employed. These spectra are generally conservative, accounting for dynamic amplification conditions of the soil in types II and III in each seismic zone. The PRODISIS software [6] simplifies the generation of design spectra for building groups B1, B2, and A2. While for design spectra for building groups A1 and A+ need a more extensive study, since it is necessary to obtain the Site-Specific Design Spectrum (DSsite). Using site-specific design spectra is advisable for obtaining spectral ordinates more rationally, allowing a more real evaluation of the seismic hazard. One methodology to follow to determine the DSsite is presented below:
- Select a reference spectrum for rock soil, considering the following options: a) probabilistic spectrum for a specified return period (EPR) of 2475 years for A1 and 10,000 years for A+ from PRODISIS software or a probabilistic seismic hazard study of the site; b) deterministic maximum feasible spectrum by the deterministic seismic hazard analysis for seismicity affecting the site; c) reference seismic hazard spectrum (ER) at the site multiplied by a building importance factor of 1.5; and d) the envelope of the three previous options.
- Generate a set of at least five synthetic accelerograms with equivalent energy content to the reference spectrum in the preceding section. Determine the response spectrum and Fourier spectrum for each synthetic accelerogram.
- Conduct detailed explorations in the subsoil of the site with geotechnical and geophysical studies, to determine the so-called “site effect”, that represents the dynamic amplification response on the soil surface of the study area. In this way, it is possible to characterize the stratigraphy of subsoil based on Standard Penetration Tests (SPT), “Down-Hole” surveys, and the H/V ratio analysis of environmental vibration records to obtain the fundamental period or fundamental frequency at the site. With the information properties of each stratum of the subsoil with or without uncertainty and an iterative equivalent linear acceleration method [13,14], it is possible to simulate the propagation of seismic waves from the rock stratum to the surface soil. This results in a Transfer Function (FT) showing the dynamic amplification for each period or frequency of the soil at a specific site.
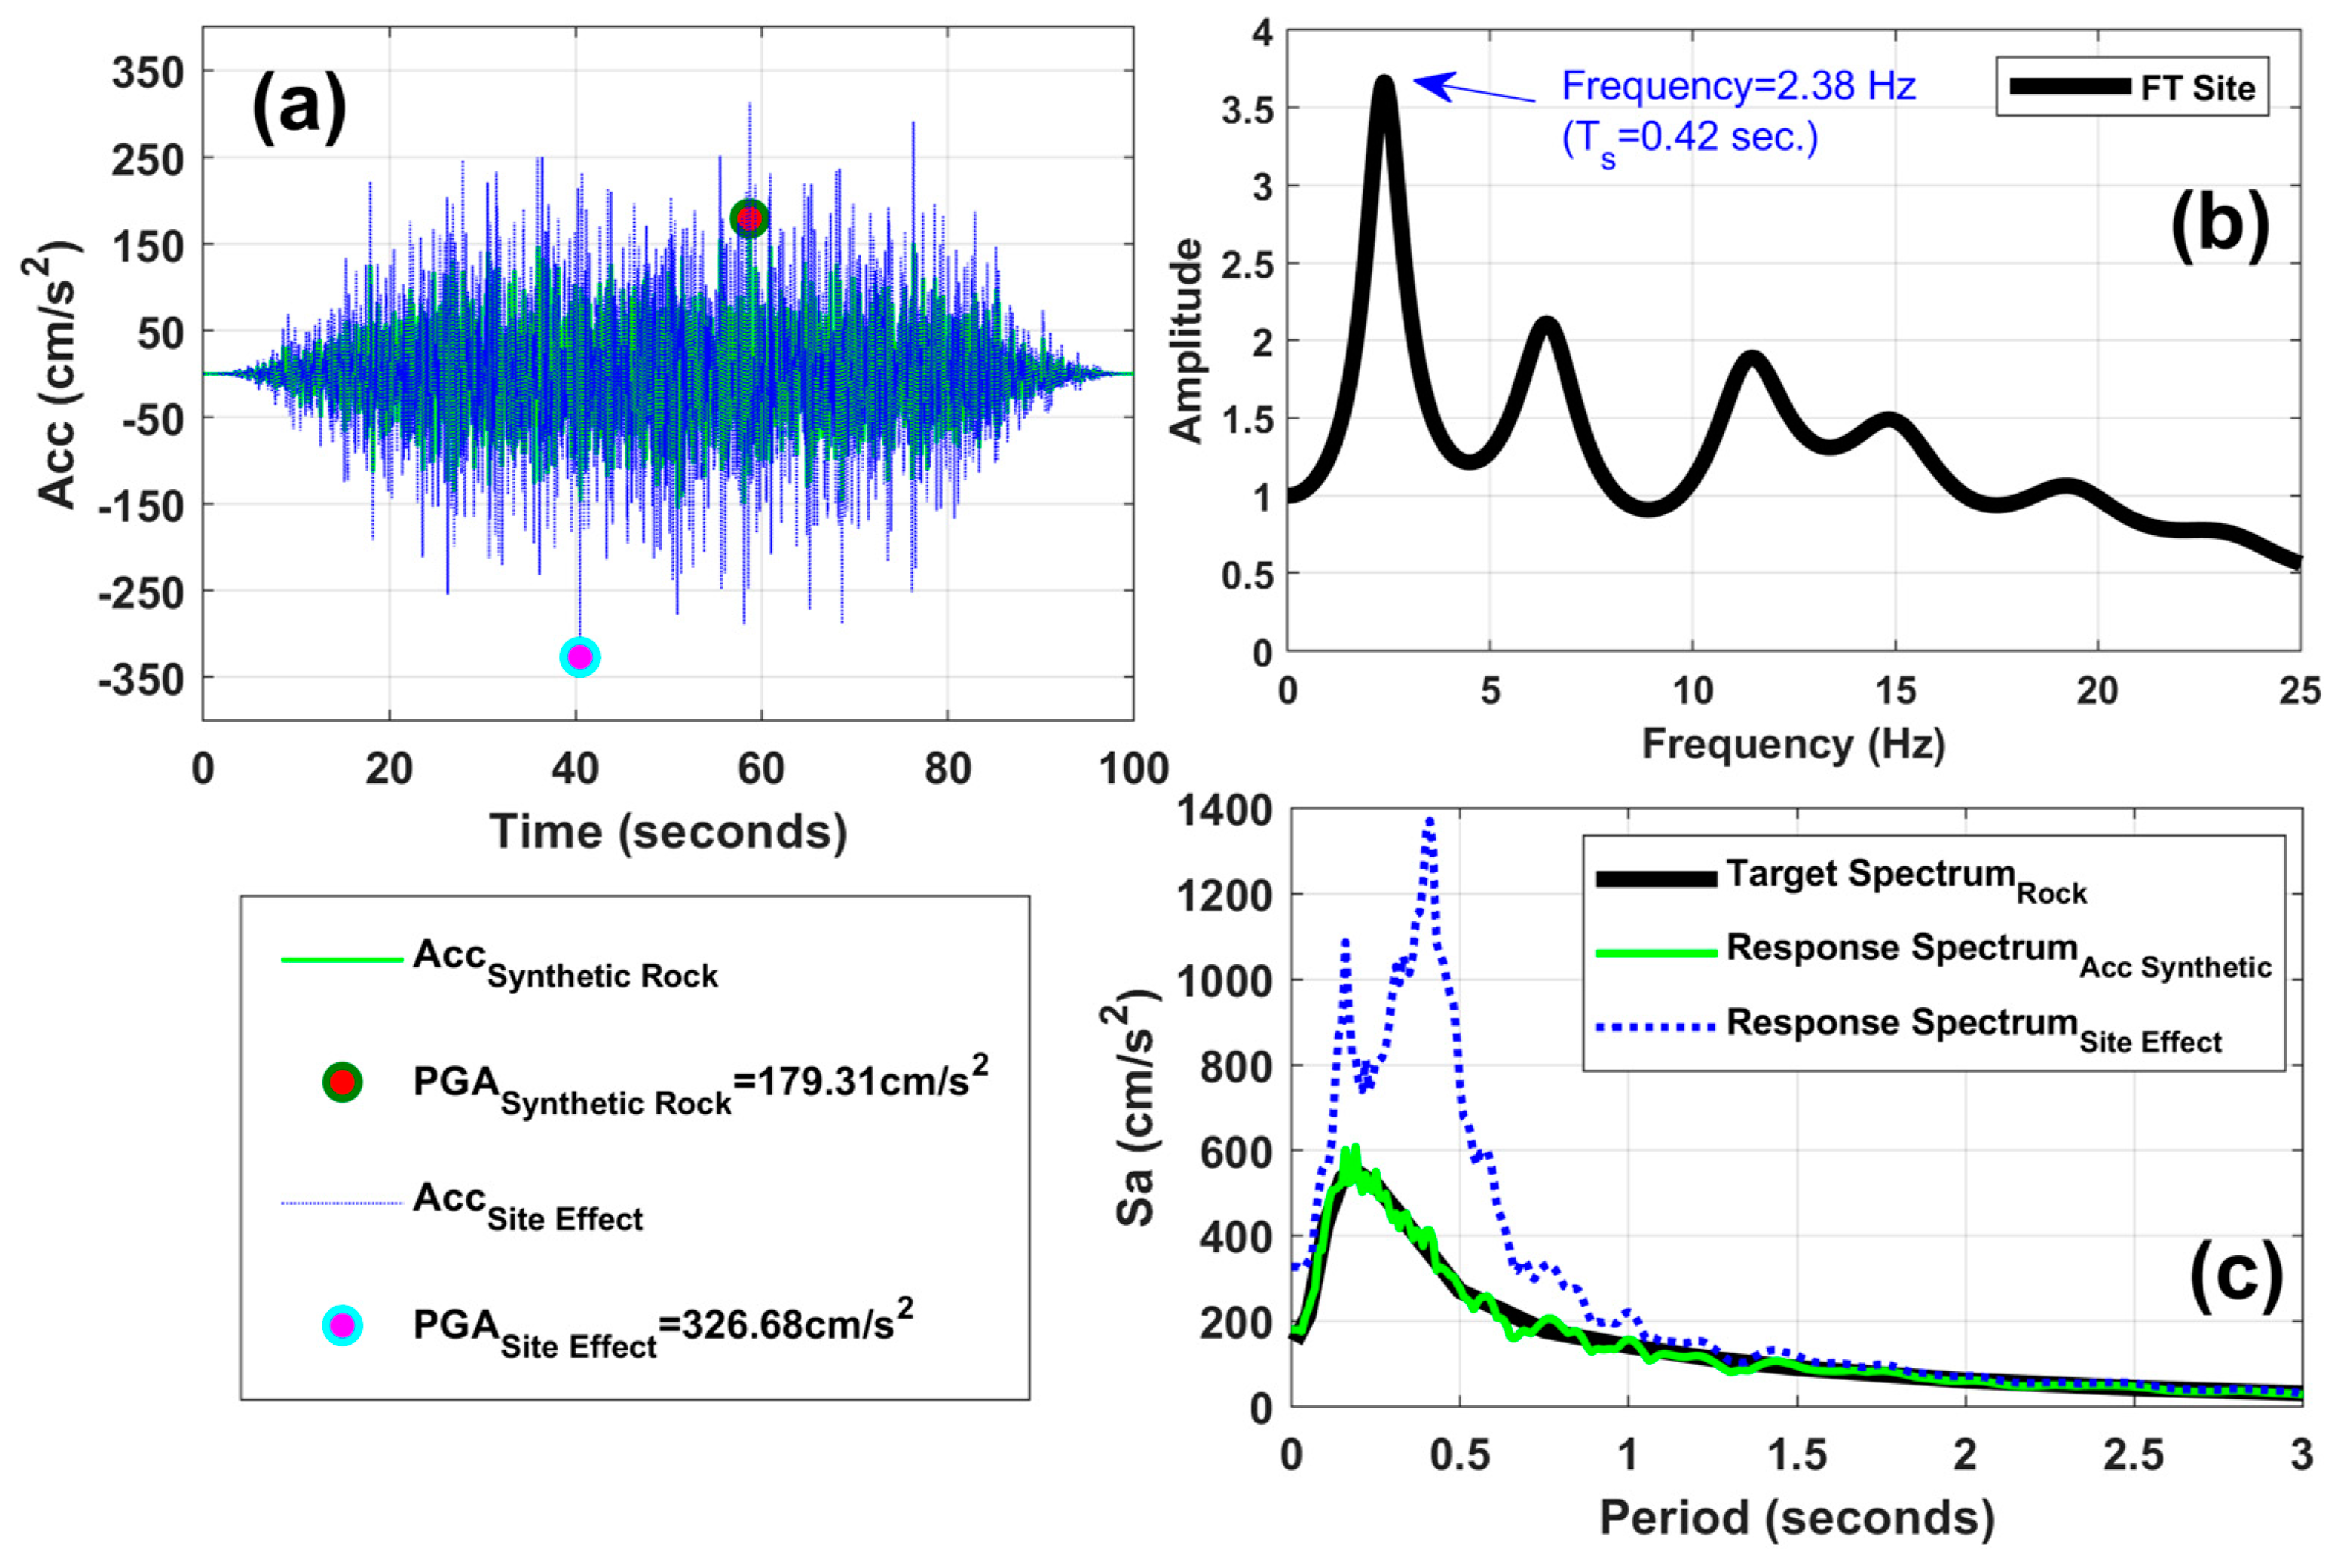
- By means of a convolution process between the Fourier spectrum of the set of synthetic accelerograms in rock and the FT, the respective response spectrum with the site effect on the surface is obtained. Subsequently, through a deconvolution process, the set of synthetic accelerograms on the surface is obtained. Figure 2 illustrates an example of a synthetic accelerogram in rock (Figure 2a) compatible with a target spectrum (Figure 2c) and using the transfer function of Figure 2b and its respective response spectrum (Figure 2c), an accelerogram with the site amplification effect (Figure 2a) is determined. Figure 2 illustrates the amplification in the Peak Ground Acceleration (PGA) and Spectral Accelerations (Sa) in both the accelerogram and response spectrum with the site effect with respect to rock soil.
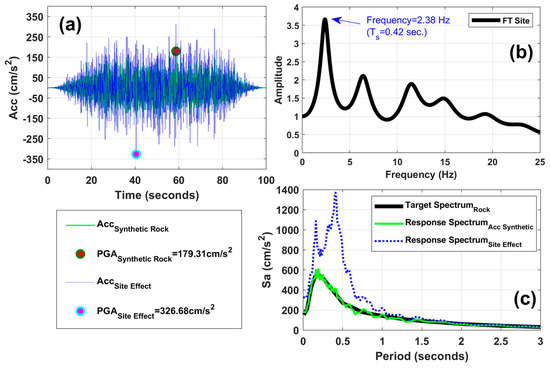 Figure 2. Example of the “site effect” (a) in a synthetic accelerogram compatible with (b) an objective response spectrum in rock soil, given by (c) a transfer function.
 - The elastic and inelastic response spectra, for each synthetic surface accelerogram from the previous step considering structural damping (generally 5%) and various ductilities (1, 2, 3, and 4), are calculated. Therefore, a response spectrum will be obtained for each synthetic accelerogram amplified by the “site effect”.
- Finally, the parameters of the Site-Specific Design Spectrum (DSsite) are defined based on the average of the elastic and inelastic surface response spectra. The shape of the DSsite will be constructed according to Equations in Figure A1 of the MDOC-CFE [5]. Ensure that the DSsite covers all structural periods under elastic and inelastic conditions.
4. Soil Type in the Design Spectrum
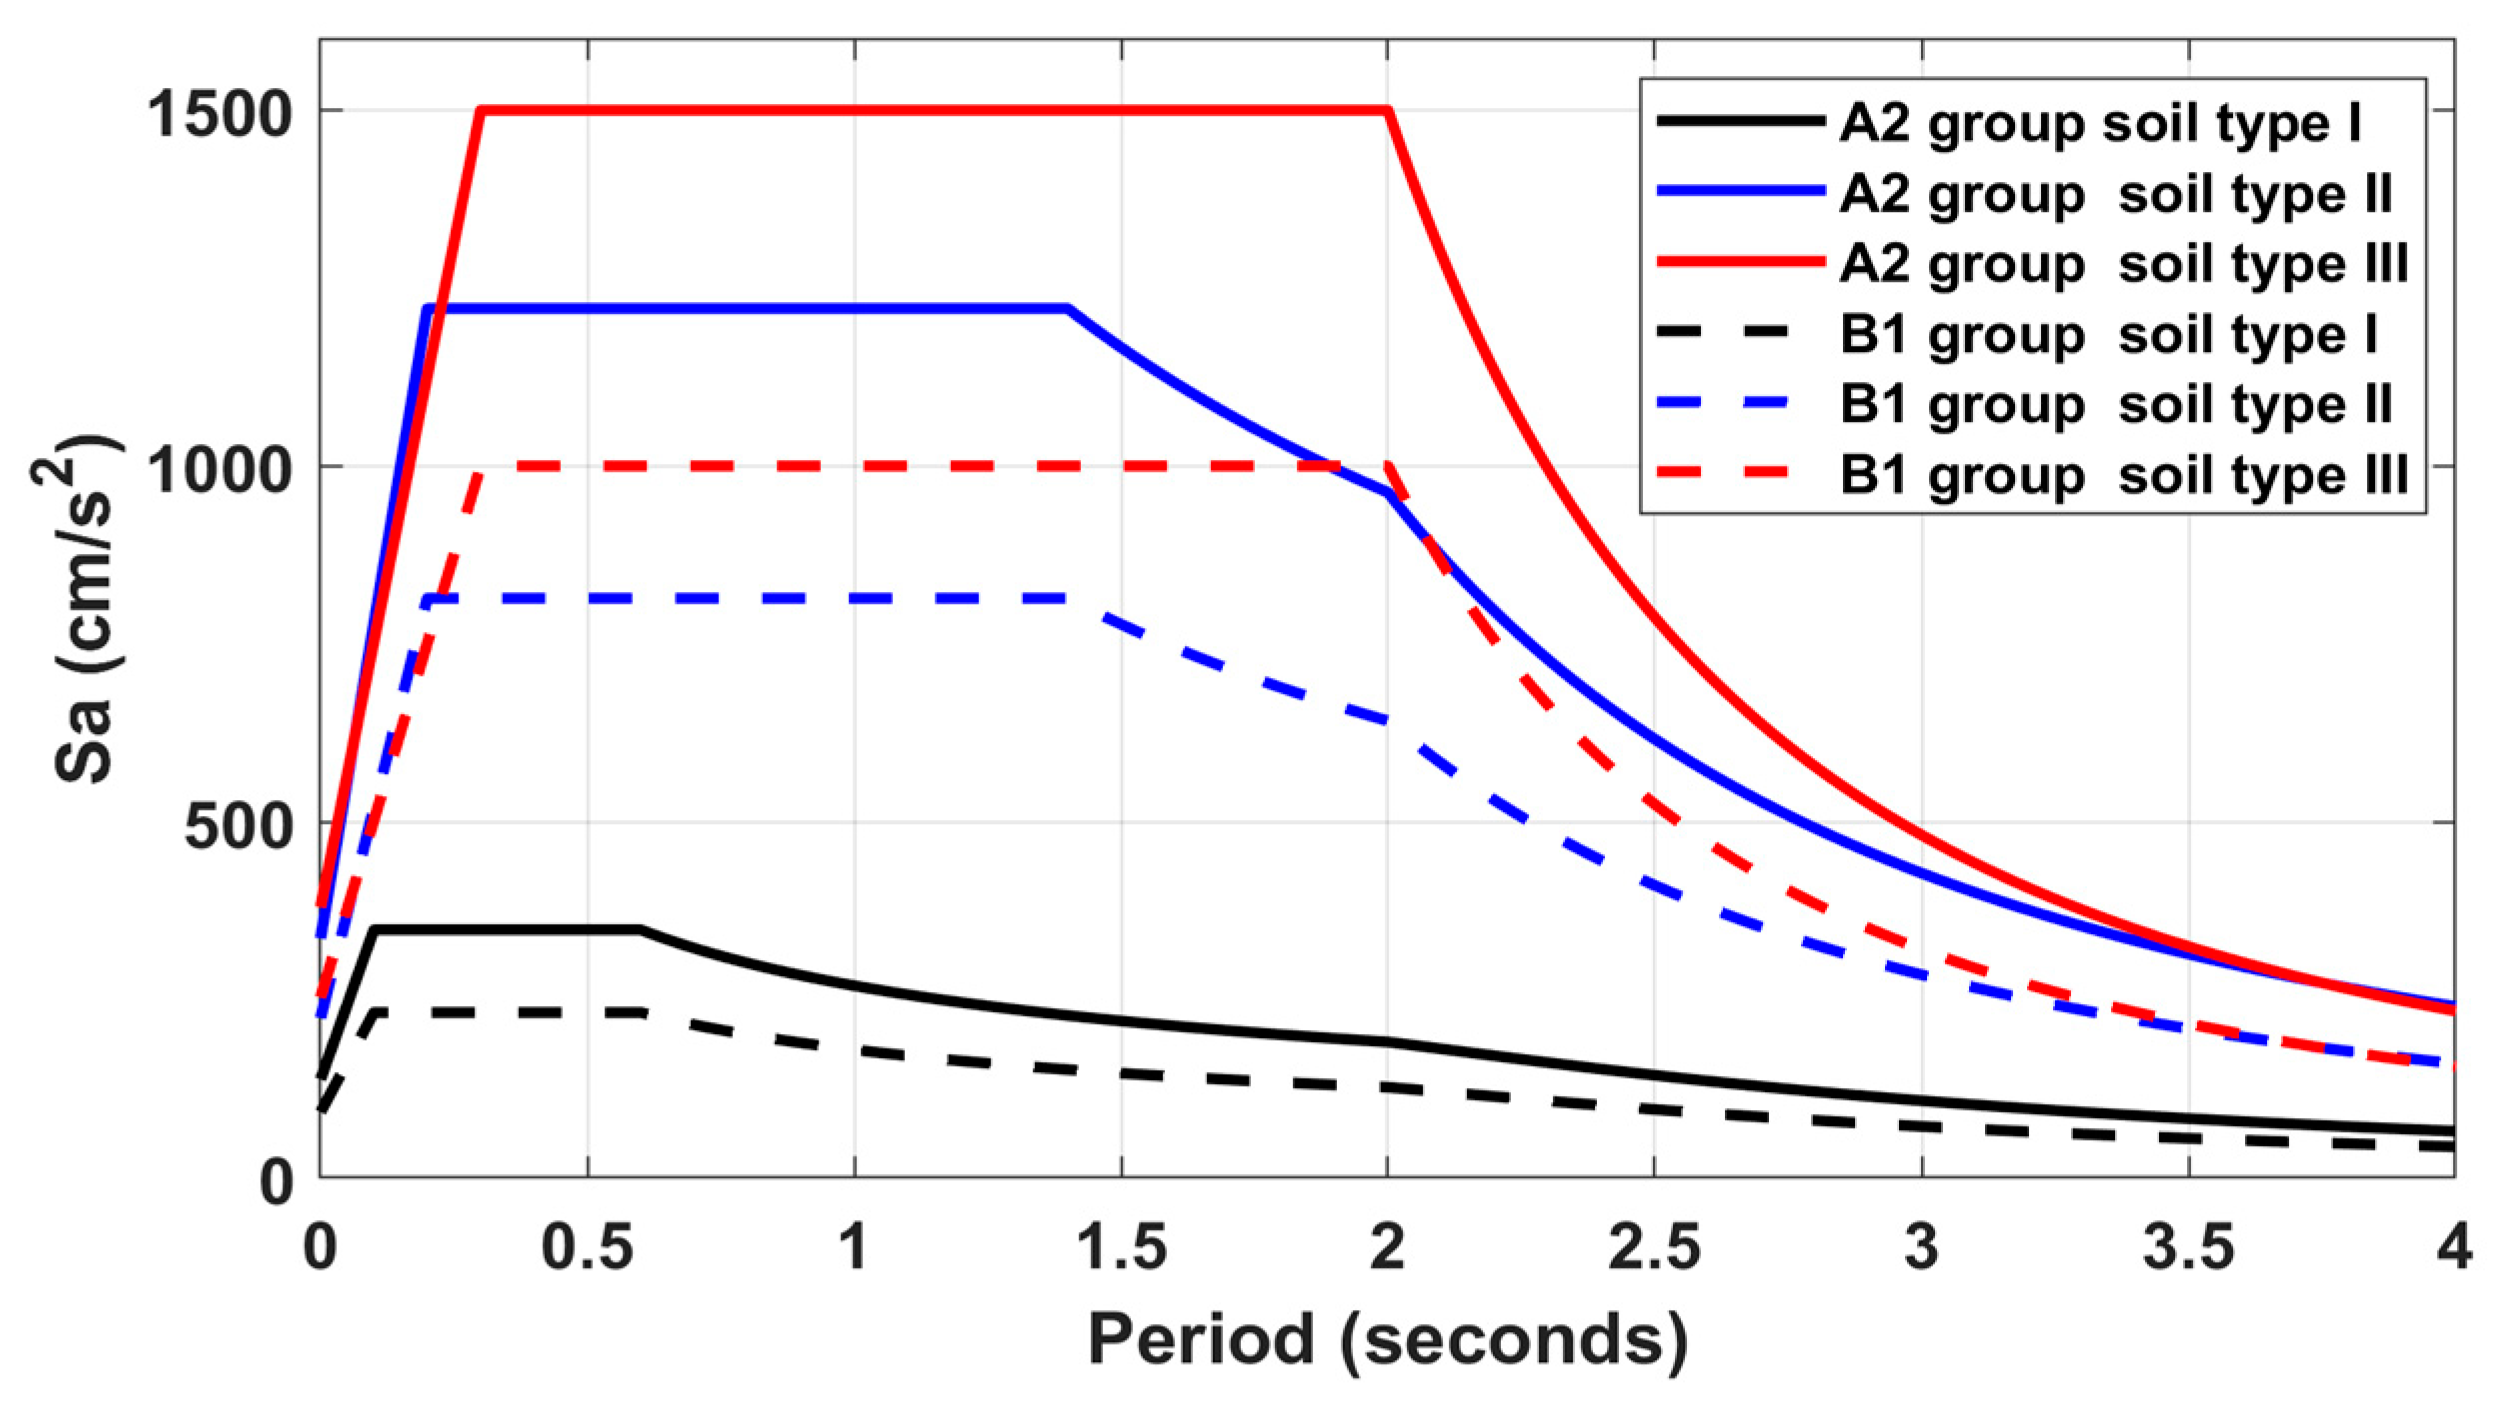
Soil classification plays a crucial role in determining the spectral ordinates of the seismic design spectrum, and there are significant variations among different soil types. Figure 3 displays regional spectra obtained from the PRODISIS software [6] for the analyzed seismic zone B site depicted in Figure 1 and located in Tabasco. Three soil types are considered, specifically for buildings from groups A2 and B1. Hence, understanding the dynamic properties of the soil in detail is essential for accurate soil classification at the study site.
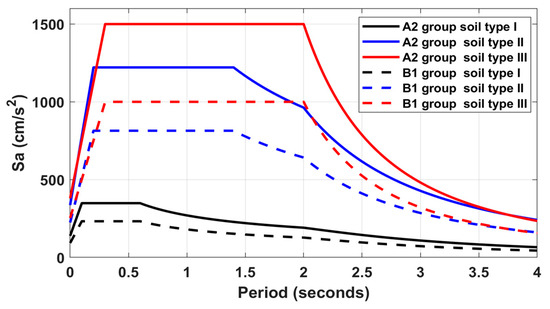
Figure 3.
The regional design spectra for the building from groups A2 and B1 and for the three soil types for the analyzed seismic zone B site that is shown in Figure 1, and that is in Tabasco state.
As per MDOC-CFE [5] guidelines, for the buildings in group B2, soil exploration is unnecessary, requiring only the site’s location. Otherwise, for buildings in the B1, A2, A1, and A+ groups, the definition of regional design spectra (DSregional) requires a certain level of soil exploration through direct or indirect methods. Geotechnical and geophysical studies provide key soil properties defining the soil dynamic behavior, employing techniques such as:
- The thickness of the soil stratum or depth of firm ground or rock layer (Hs): geotechnical exploration survey, vertical electrical survey, transient electromagnetic survey, wave dispersion tests (MASW and SPAC), among others.
- Shear-wave propagation velocities (Vs): wave dispersion tests (MASW and SPAC), seismic refraction laying, cross-hole, and down-hole, among others.
- Dominant period of ground vibration (Ts): environmental vibration records or site seismic records.
- Damping coefficient of soil (ξs): laboratory tests such as cyclic triaxial, resonant column, etc.
- Soil unit weight (γs): laboratory tests such as triaxial tests, simple compression, etc.
In the following, two scenarios are explored that structural engineers encounter in professional practice when determining the seismic hazard of a site.
4.1. Scenario 1 with Just Geotechnical Studies
In this first scenario, the structural engineer has access solely to information derived from geotechnical studies. For instance, the basic geotechnical exploration study, the Standard Penetration Test (SPT). This direct exploration method involves driving a standardized sampler into the ground with standardized mass, recording the number of blows required at three 0.15 m intervals. This number reflects the ground’s resistance and is the sum of blows from the second and third intervals. Additionally, unaltered soil samples can be obtained and subjected to laboratory tests for index and mechanical properties, including the layers’ soil unit weight (γs). By integrating field and laboratory data, the stratigraphic profile of the exploration site is developed, enabling the determination of the soil stratum thickness or the depth of the rock or firm soil stratum. MDOC-CFE [5] recommends an exploration depth of at least 30 m using direct methods such as the SPT test and provides a formula to estimate the soil’s fundamental period, acknowledging its approximate nature compared to results from specific tests designed for this purpose.
where:
γsi = soil unit weight of the i-th layer.
Gi = shear modulus of the i-th layer, equal to (γsi vsi2)/g.
g = the acceleration of gravity.
Vsi = shear-wave propagation velocities of the m-th layer.
hi = thickness of the m-th layer.
M = number of layers.
Estimation of the shear-wave propagation velocities (Vs) in the equivalent ground soil () can be determined using the most critical condition from the following formulas.
From the combination of Ts, Hs, and Vs and through the MDOC-CFE [5] seismic microzonation chart, soil type I, II, or III is determined.
- TYPE I. Firm soil or rock layer in which dynamic amplifications do not occur: soil deposit with Vs ≥ 720 m/s or Hs ≤ 2 m.
- TYPE II. Soils in which intermediate dynamic amplifications occur: soil deposit with 360 m/s ≤ Vs < 720 m/s and Hs > 2 m, or Hs > 30 m and Vs < 720 m/s.
- TYPE III. Soils in which large dynamic amplifications occur: soil deposit with Vs < 360 m/s and 2 m < Hs ≤ 30 m.
A challenge in this scenario is that the shear-wave propagation velocities (Vsi) for each layer of soil are required for the previous formulas, and these are determined through geophysical studies. In cases where only geotechnical study data are accessible, a commonly employed option is to utilize correlations based on the number of blows (N) from the Standard Penetration Test (SPT) to estimate the Vsi parameter. One example is the correlation proposed by Seed and Idriss [15], or another deemed more suitable for the specific study area. It is important to note that these are approximate formulas, developed under certain conditions and for specific soil types.
Vsi = 61.8Ni0.5
In addition to approximations considered in the previous formulas for this scenario, it is essential to acknowledge that, in soft soils, reaching firm ground at a depth of 30 m, let alone the rock layer, is not always guaranteed. This occasional limitation can result in imprecise characterization of the soil profile and over or underestimate of the soil type in the design spectrum when relying solely on geotechnical studies.
4.2. Scenario 2 with Geotechnics and Geophysics Studies
This scenario is the most suitable for today’s structural engineers. It involves enhancing geotechnical studies with geophysical tests, specifically through the “Down-Hole (DH)” test, “Cross-Hole (CH)” test, and environmental vibration records. The DH test is conducted in a borehole, typically the same one used for the SPT geotechnical exploration survey. Essentially, it entails measuring the arrival time of S and/or P waves using triaxial geophones placed at various depths in the test well (usually at one-meter intervals). An impulse is generated at a surface near the test hole. This test facilitates the creation of a velocity profile for the soil, known as a “Domocrona”. Therefore, the characterization of the soil is based on velocity magnitudes [16]. Subsequently, this information allows for the derivation of other soil properties, such as the dynamic elastic modulus (E), Poisson’s ratio (μ), and the shear rigidity modulus (G). The CH test additionally allows us to obtain the damping coefficient of the soil (ξs) of each subsoil layer. On the flip side, the soil’s vibration period, Ts, is a crucial property that must be studied, as it delineates the dynamic behavior of the soil. This parameter can be determined in two ways: (i) via records from accelerographic stations and (ii) through measuring environmental vibration records. Subsequently, spectral ratio techniques, such as H/V or the Nakamura [17,18] technique, are applied to ascertain the dominant frequencies (fs) or their inverse of the period (Ts). The H/V spectral ratio has found extensive use in various seismic microzonings due to its cost effectiveness in acquisition and analysis in countries such as the United States, Japan, Italy, and Spain [19,20,21]. In Table 2, the data of the stratigraphic profile: thickness (hi), volumetric weight (γsi), and shear-wave propagation velocities (Vsi), are presented for the seismic zone B site of Figure 1, located in Tabasco state. This information is extracted from geotechnical (SPT test) and geophysical (Down-Hole test) studies conducted up to a depth of 45 m for this site. Figure 4 showcases the H/V spectral ratio for this site. The H/V spectral ratio is obtained from an environmental vibration record and using the Geopsy program [22].
Table 2.
Data of the stratigraphic profile obtained by the SPT test and Down-Hole test from the study site located in Tabasco state, Mexico, as shown in Figure 1.
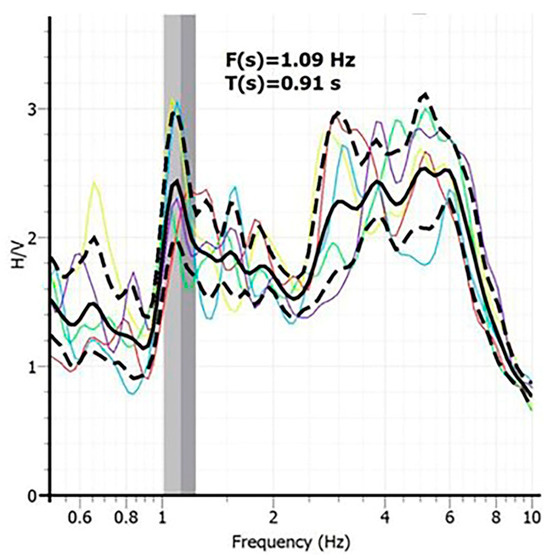
Figure 4.
The H/V spectral ratio from the study site located in Tabasco state, Mexico, as shown in Figure 1. In the curves graph shows the colored curves correspond to the H/V spectral ratio of each analyzed time window of the complete signals; the average curve (black line); the amplitude standard deviation curves (dashed lines) and the peak frequency standard deviation domains (the two vertical gray areas). The peak frequency is the value at the limit between the two gray areas.
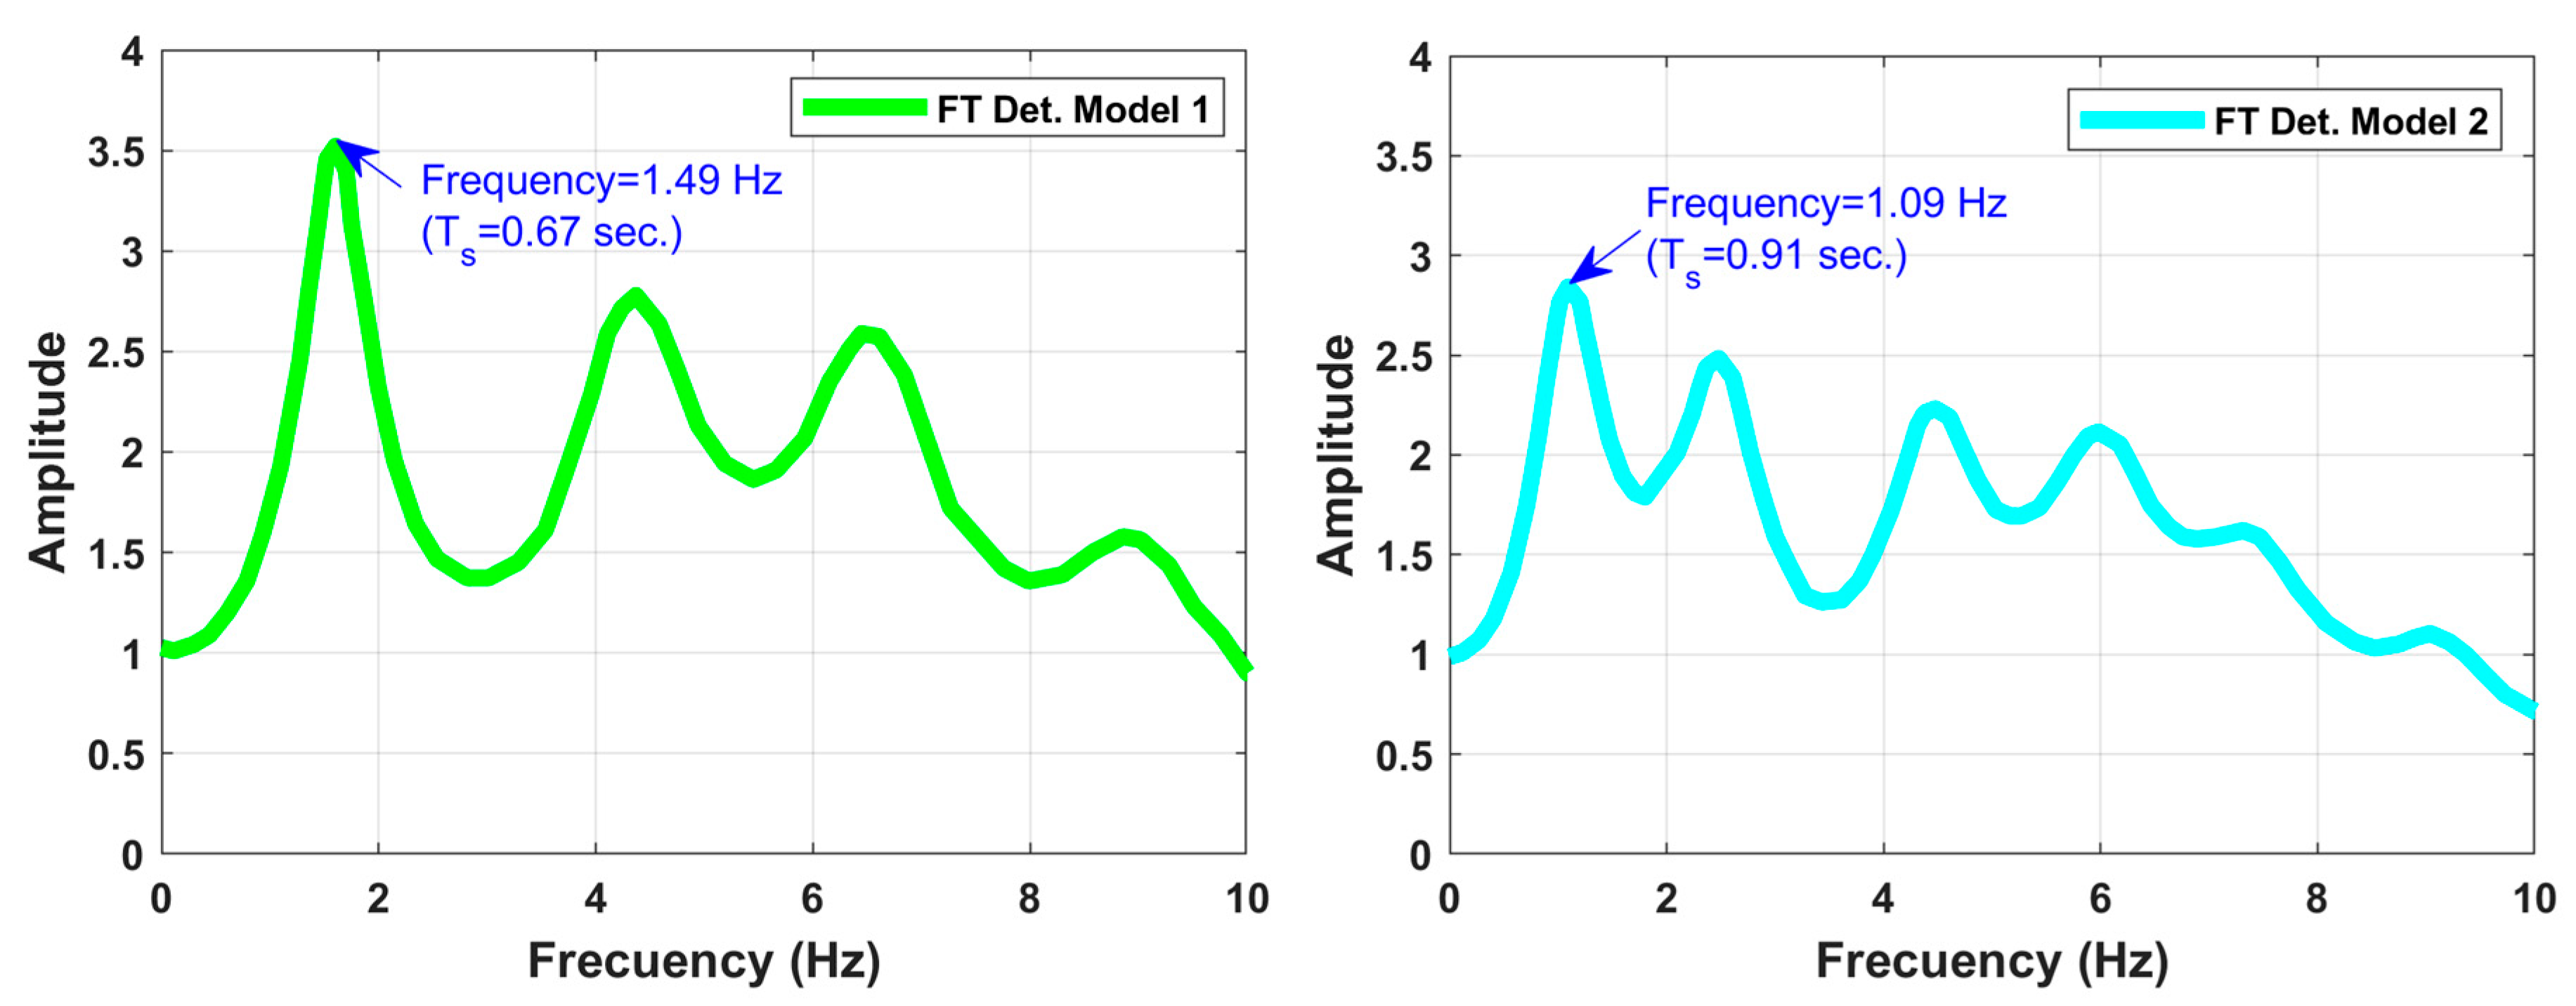
Figure 4 shows that the dominant frequency for the study site is 1.09 Hz, corresponding to a period of Ts = 0.91 s. Conversely, utilizing the data of Table 2; the thickness (hi), soil unit weight (γsi), and the shear-wave propagation velocity (Vsi) of each layer subsoil in Equation (1) yields a period of Ts = 0.67 s (1.49 Hz). This period differs from the direct measurement obtained through the Nakamura technique (Ts = 0.91 s). This discrepancy indicates that the geotechnical and geophysical study, conducted up to 45 m depth, was insufficient to fully characterize the soil deposit, as a rocky soil stratum had not been encountered at that depth. Consequently, it is better to use, for this case, environmental vibration records to adequately characterize the fundamental period of the site. The variation in the measurement of the soil stratigraphy parameters should be duly acknowledged. Hence, it is advisable to characterize the anticipated uncertainty associated with these parameters and employ a probabilistic approach to integrate it into the estimation of the site’s frequency or fundamental period in Equation (1). The probabilistic approach can also be applied when determining the transfer function (FT) that simulates the propagation of seismic waves from the rock stratum to the surface soil.
The seismic hazard of a location is typically influenced by two key factors: (1) the inherent seismic activity of the site, determined by its proximity to geological faults, convergence of tectonic plates, volcanoes, etc., and (2) the site soil conditions. The significance of geotechnical and geophysical studies becomes evident in the second factor, providing crucial data on the dynamic behavior of the soil and influencing the amplification of seismic waves during an earthquake. As this methodology relies on comprehensive geotechnical and geophysical data, it can be applied across various soil types or in regions with varying degrees of seismic hazard.
5. Site-Specific Design Spectrum for Buildings in A2 Group
The MDOC-CFE [5] indicates that the geotechnical and geophysical studies complement each other, enabling the determination of soil type based on the combination of parameters, Ts, Hs, and Vs in the seismic microzonation chart soil and thus determining the seismic parameters for the building of the regional design spectrum (DSregional) for buildings in the A2 and B1 groups for soil type I, II, or III. For the study site in Tabasco state we determined the class of the soil as type II per the MDOC-CFE [5] and their respective DSregional can be seen in Figure 3. Alternatively, more detailed site studies can be conducted for a more rational design spectrum characterization, as outlined in Section 3, particularly for the design spectra of A1 and A+ structures. However, it can also be recommended to generate a site-specific design spectrum (DSsite) for buildings in the A2 and B1 groups, particularly in cases of soft soil (type II or III) where the rocky soil stratum was not found in the geotechnical exploration, and also when there is an absence of nearby seismic instrumentation references. This section presents the formulation of the DSsite, taking site effects into account for group A2 structures. The development is based on the geotechnical and geophysical characterization of the site situated in Tabasco state, Mexico, as illustrated in Figure 1.
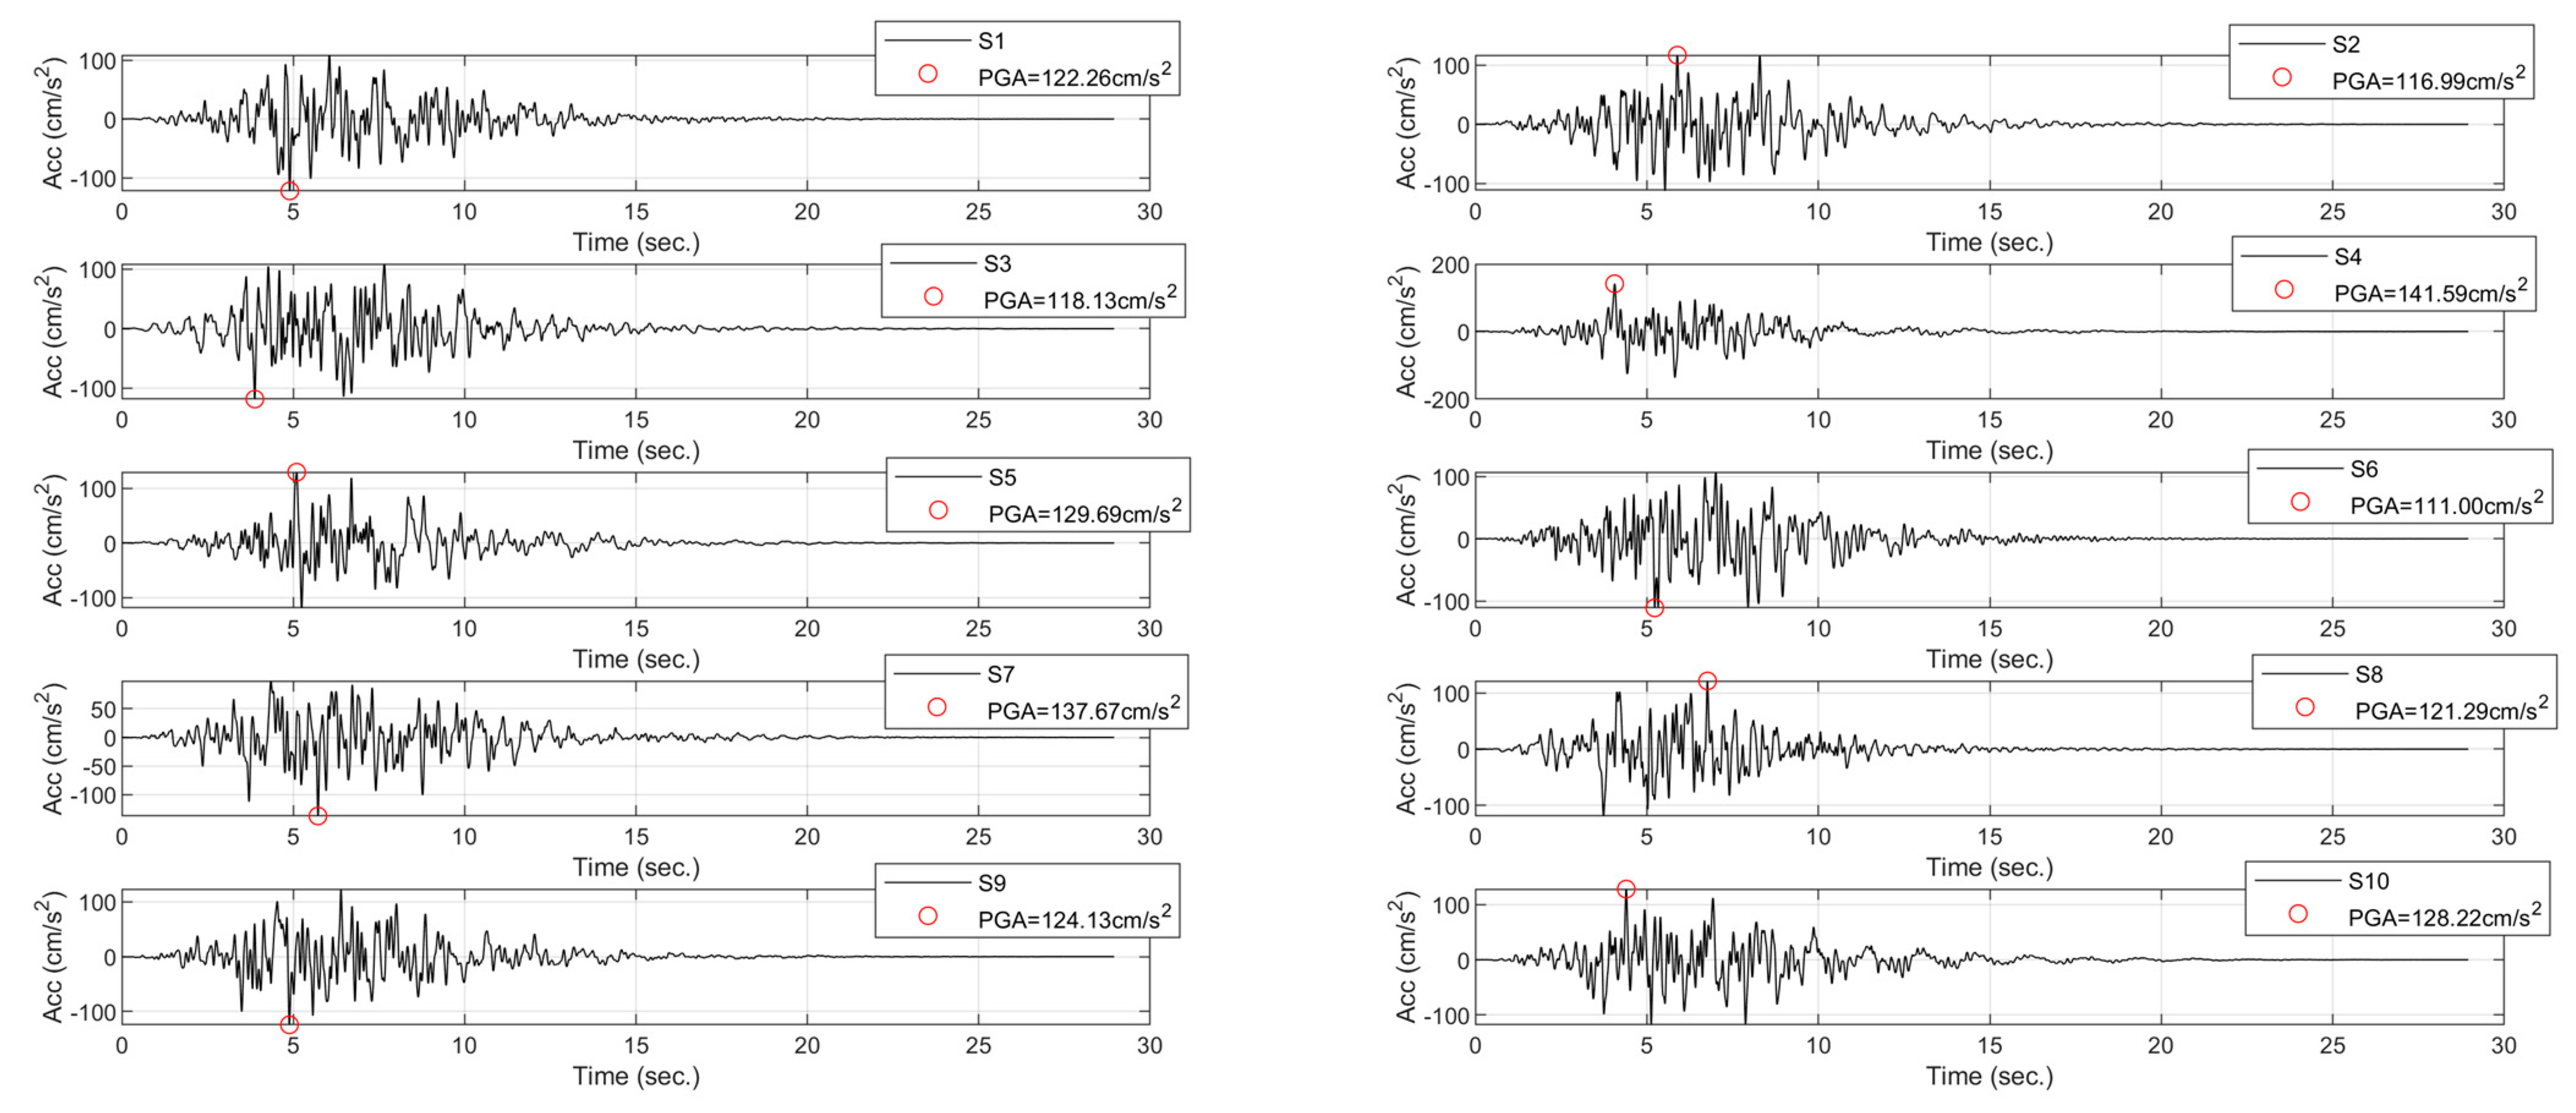
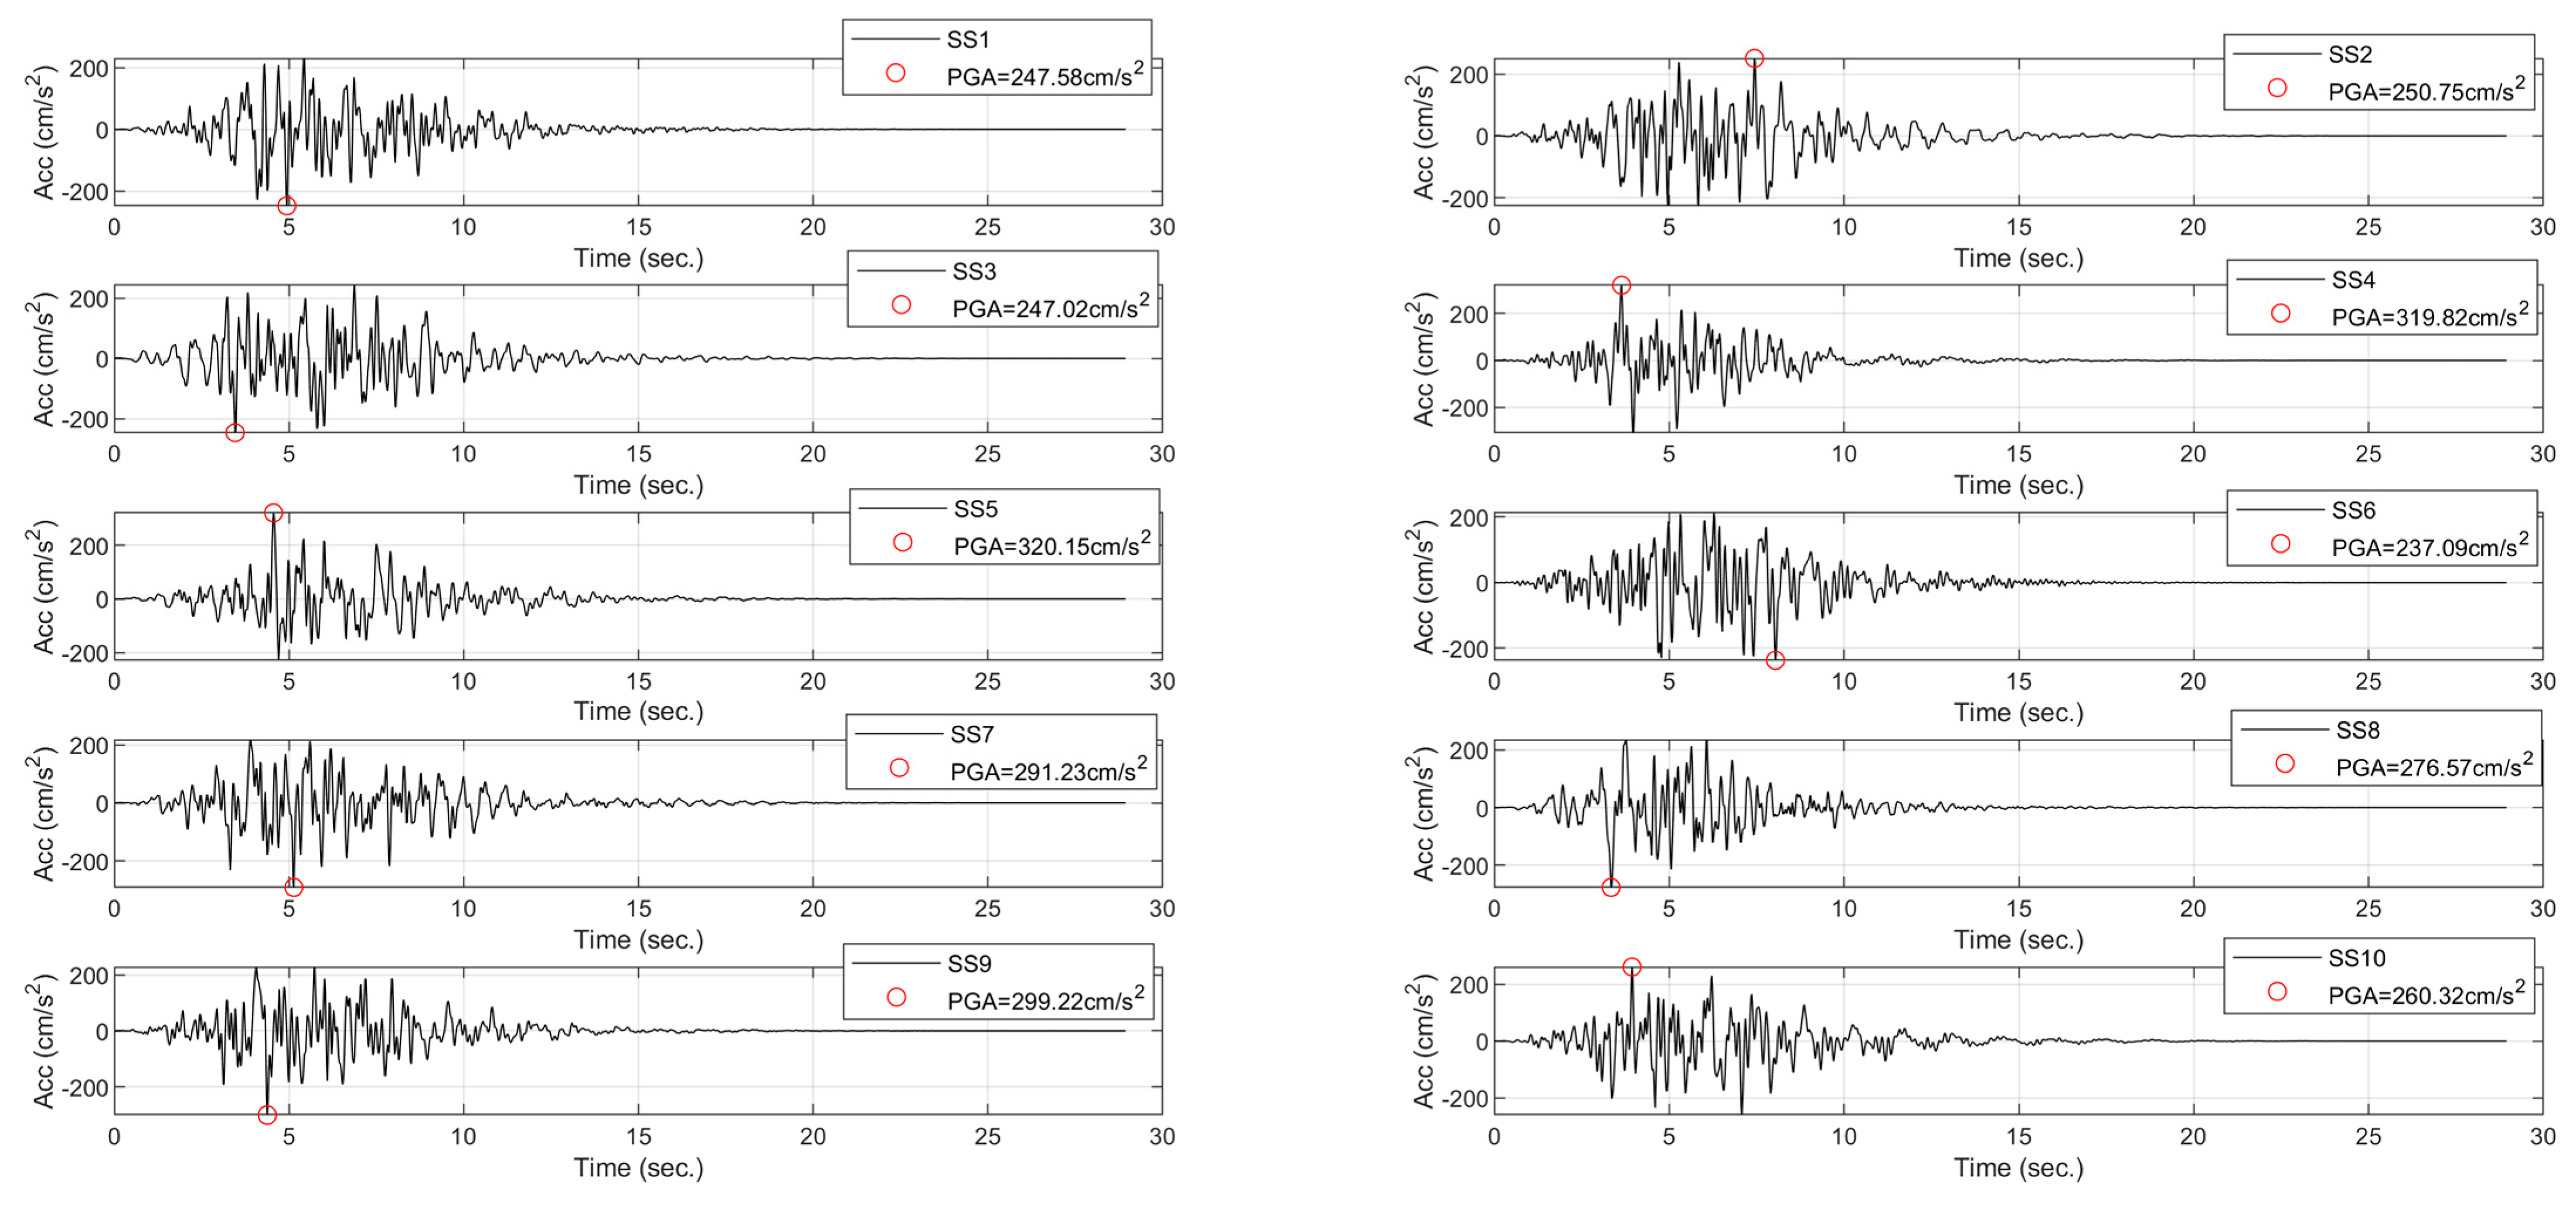
Initially, 10 synthetic accelerograms are created, featuring spectral responses matched with the reference seismic hazard spectrum (ER) of buildings the A2 group (B1 group reference spectrum from Figure 1 multiplied by the importance factor 1.5) for the study site. This is accomplished through the PRODISIS software [6]. Figure 5 and Figure 6 illustrate this set of 10 synthetic accelerograms along with their corresponding response spectra, matched with the reference spectrum for buildings the A2 group.
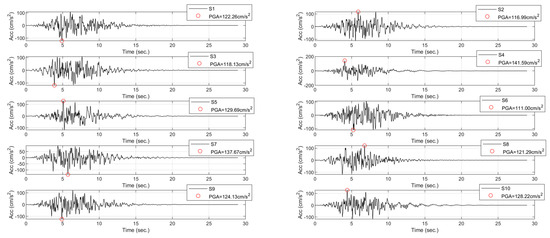
Figure 5.
Synthetic accelerograms with spectral response matched with the A2 group reference seismic hazard spectrum (ER) in rock soil for the study site, generated with the PRODISIS software [6].
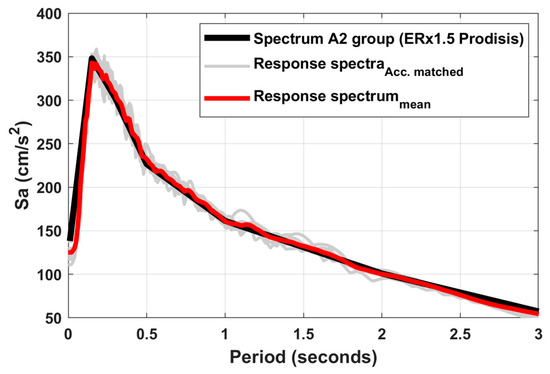
Figure 6.
Response spectra matched with the A2 group reference seismic hazard spectrum (ER) in rock soil for the study site.
The data derived from the geotechnical (SPT test) and geophysical (Down-Hole and environmental vibration record) studies of the site are employed in the DeepSoil v7.0 program [13] with the linear acceleration equivalent method to simulate wave propagation in stratified media from the rock layer stratum to the surface layer. In this process, the damping coefficient (ξs) of each subsoil layer is considered to be 5%, because that was not obtained in the field [5]. As a result, two deterministic transfer functions (FT) were generated. Model 1 represents the period or frequency of the soil (Ts = 0.67 s or 1.51 Hz), obtained with the stratigraphic profile soil by the SPT test and Down-Hole test up to 45 m and Equation (1), and Model 2 represents the period or frequency of the ground (Ts = 0.91 s or 1.09 Hz) obtained in the environmental vibration records. Both transfer functions are illustrated in Figure 7.
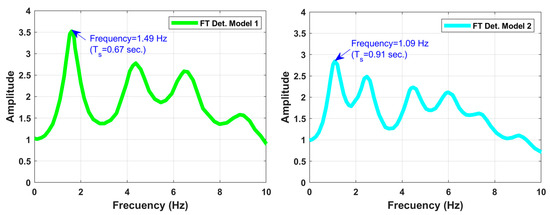
Figure 7.
Transfer functions (FT) for Model 1 and Model 2 of the study site.
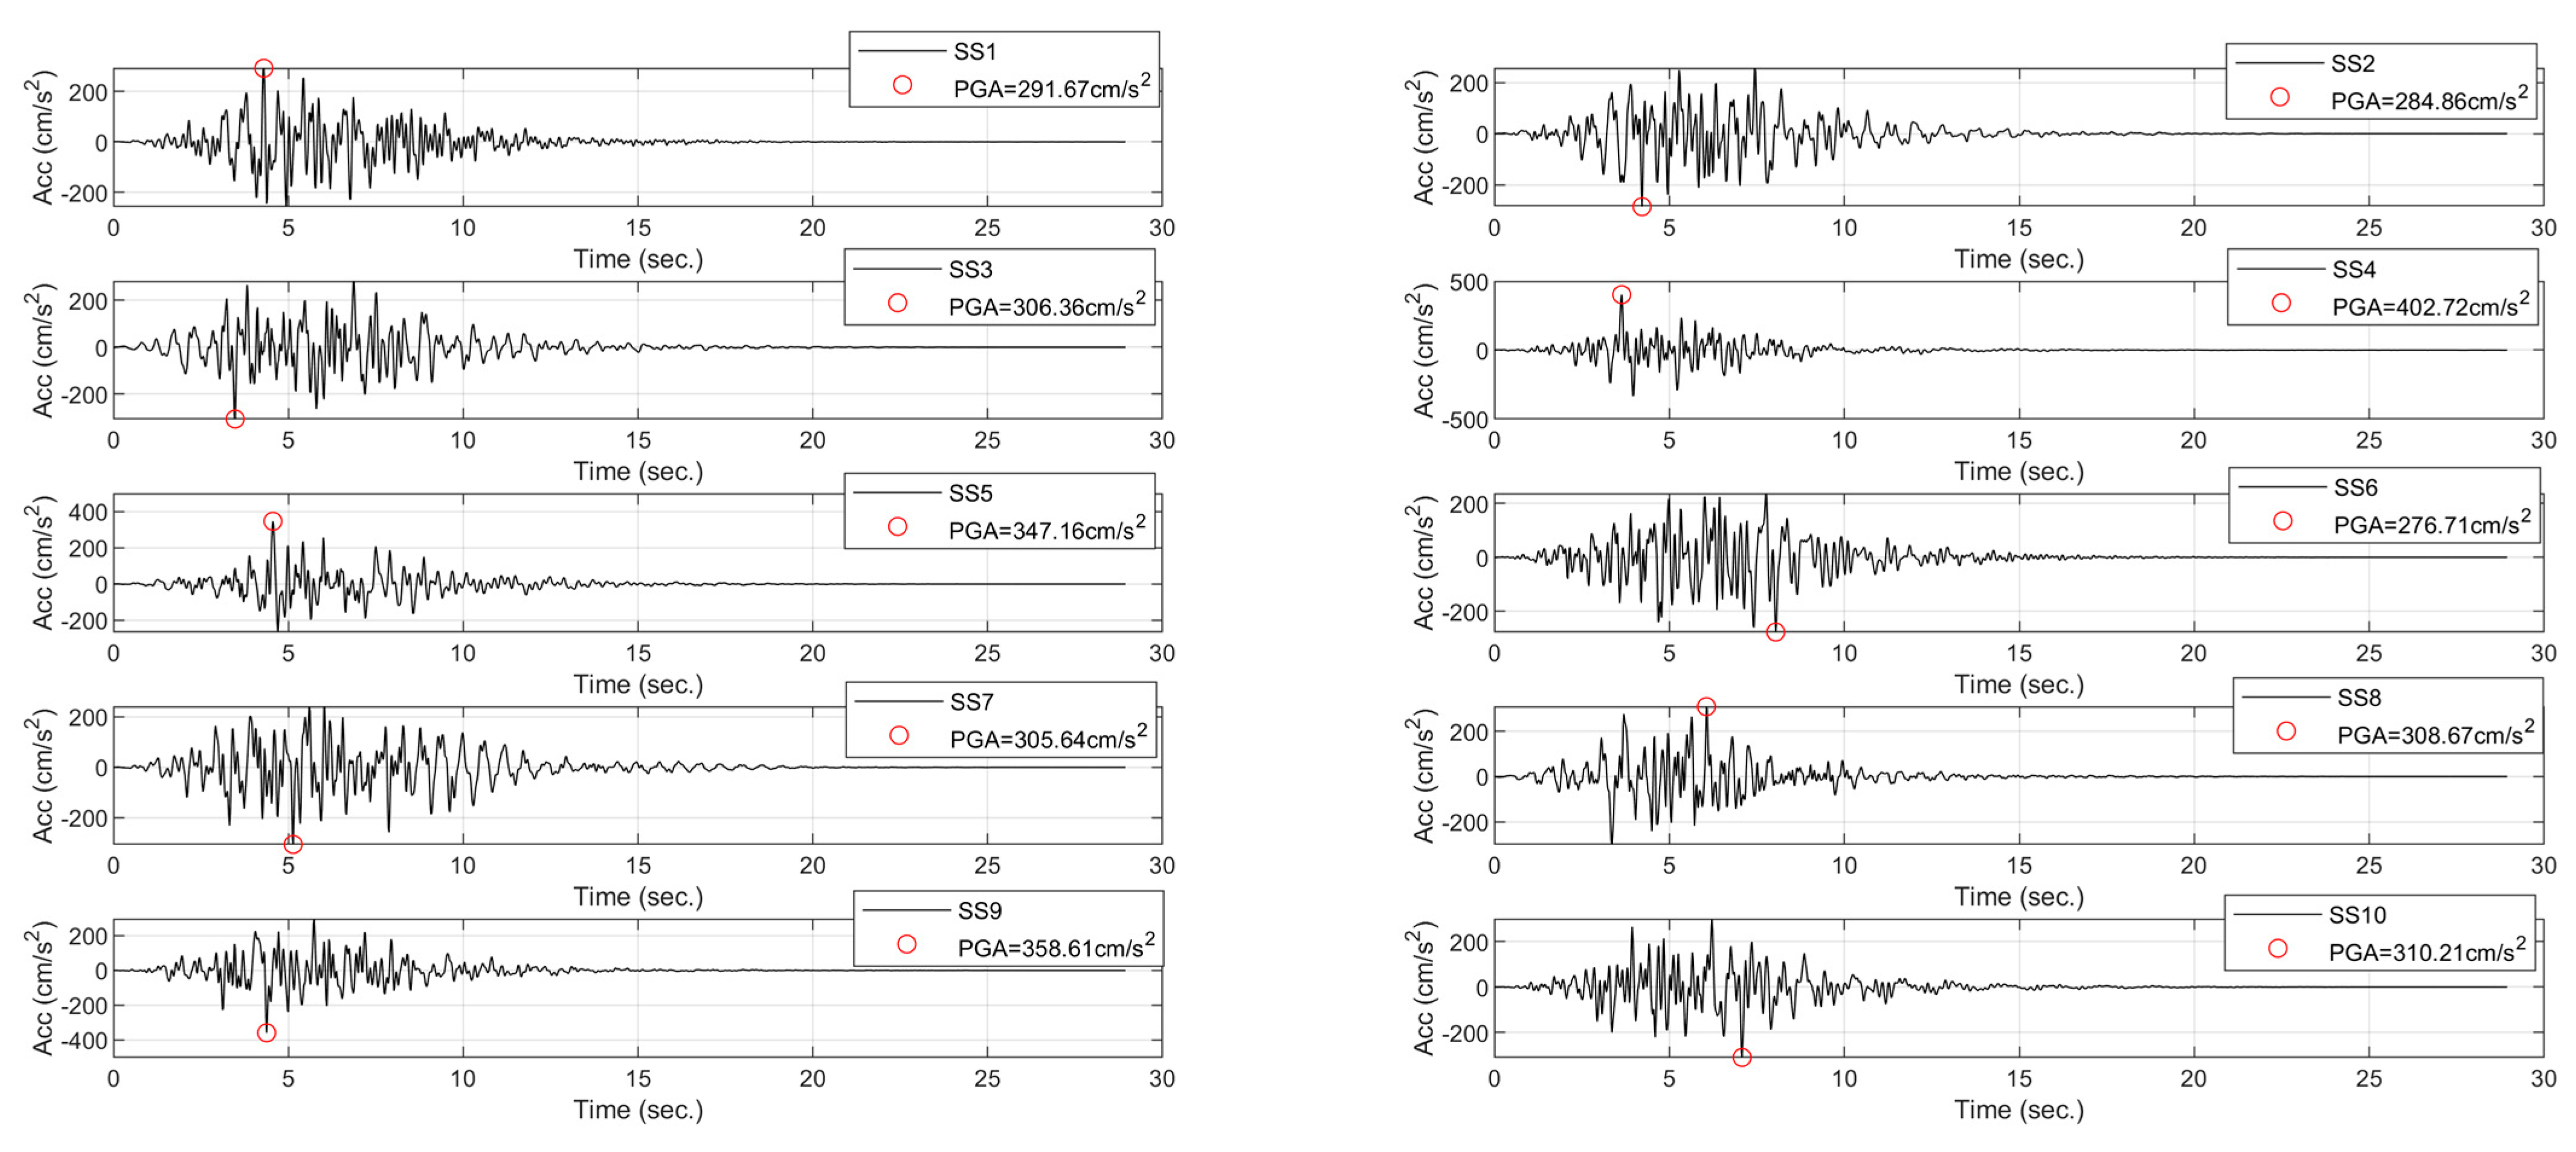
Subsequently, the Fourier spectrum of the synthetic rock accelerograms is obtained, and a point-to-point convolution process is executed for the frequency range of both transfer functions. In this way, we incorporate the site effect into the dynamic response in the synthetic rock accelerograms. Figure 8, Figure 9, Figure 10 and Figure 11 showcase the synthetic site accelerograms for Model 1 and Model 2, along with their respective response spectra, mean spectrum, and site-specific design spectrum (DSsite) for buildings of the A2 group.
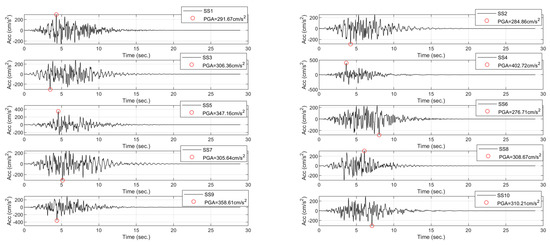
Figure 8.
Set of synthetic accelerograms with the site effect for buildings of A2 group for Model 1.
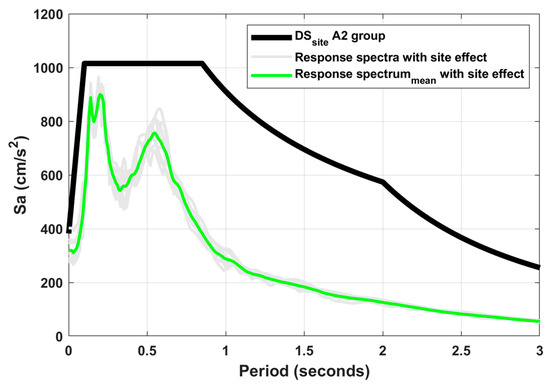
Figure 9.
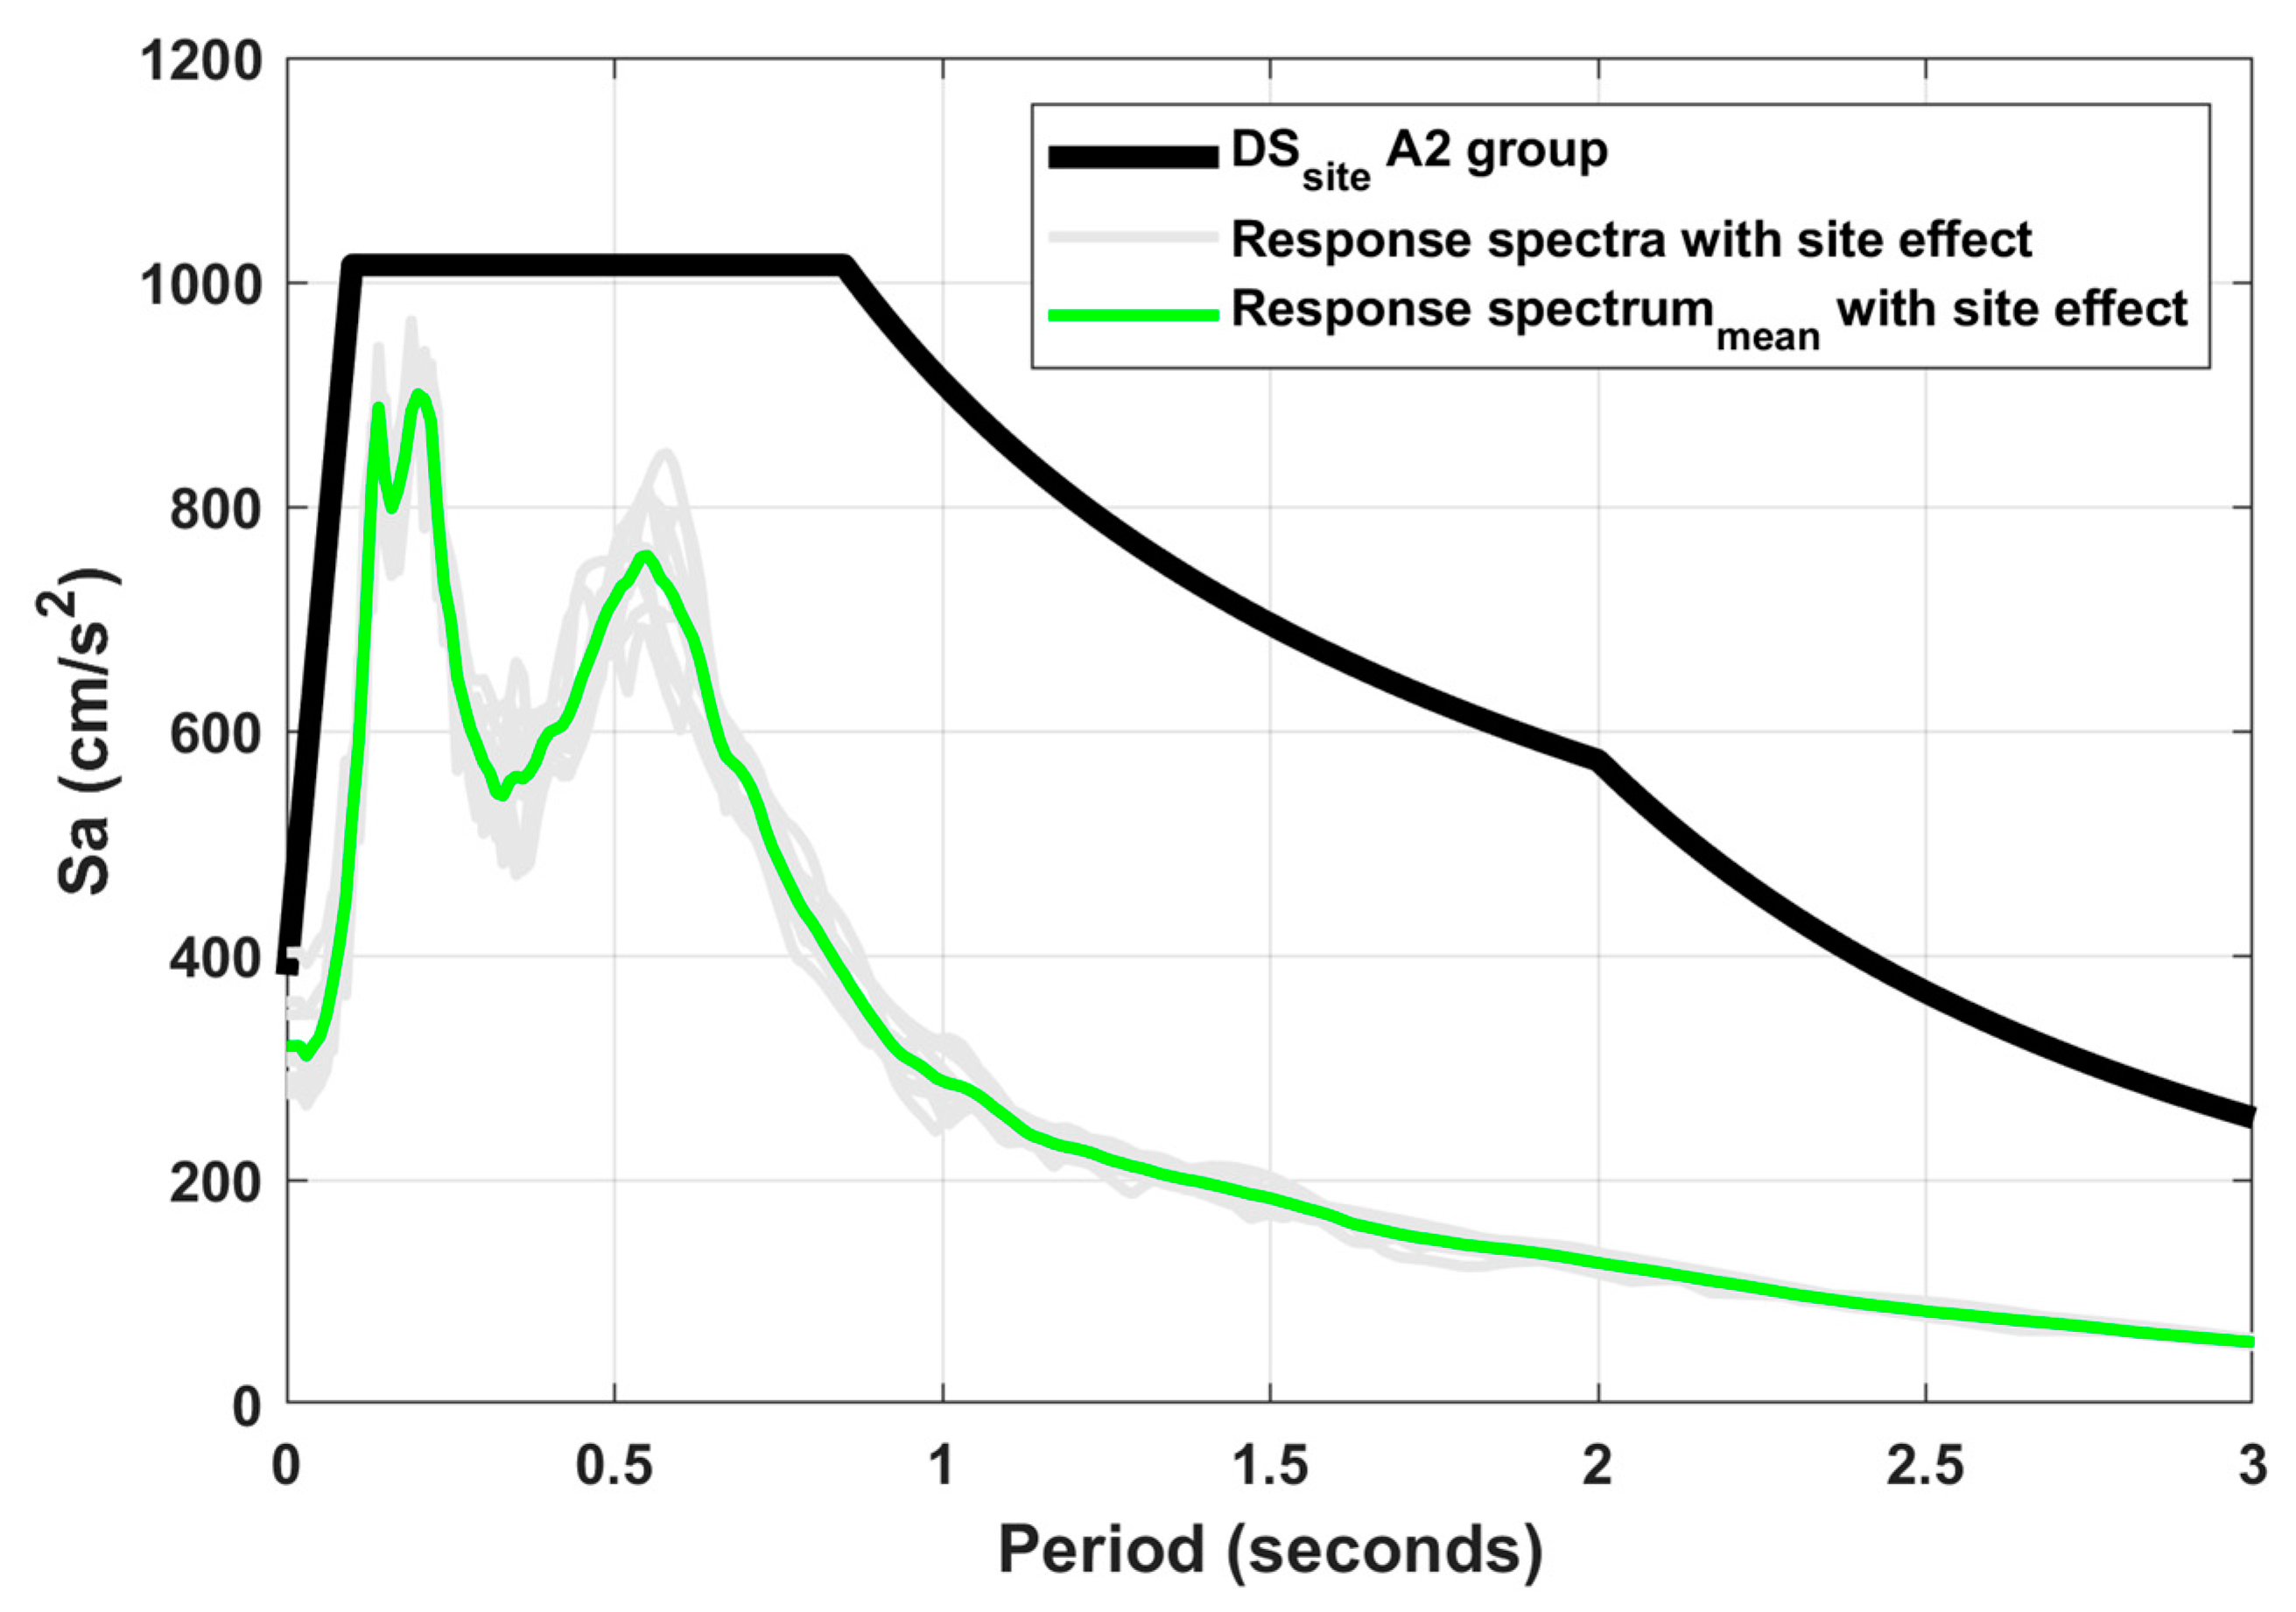
Response spectra, mean spectrum, and site-specific design spectrum (DSsite) with the site effect for buildings of A2 group for Model 1.
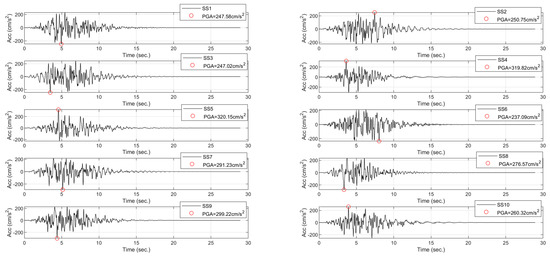
Figure 10.
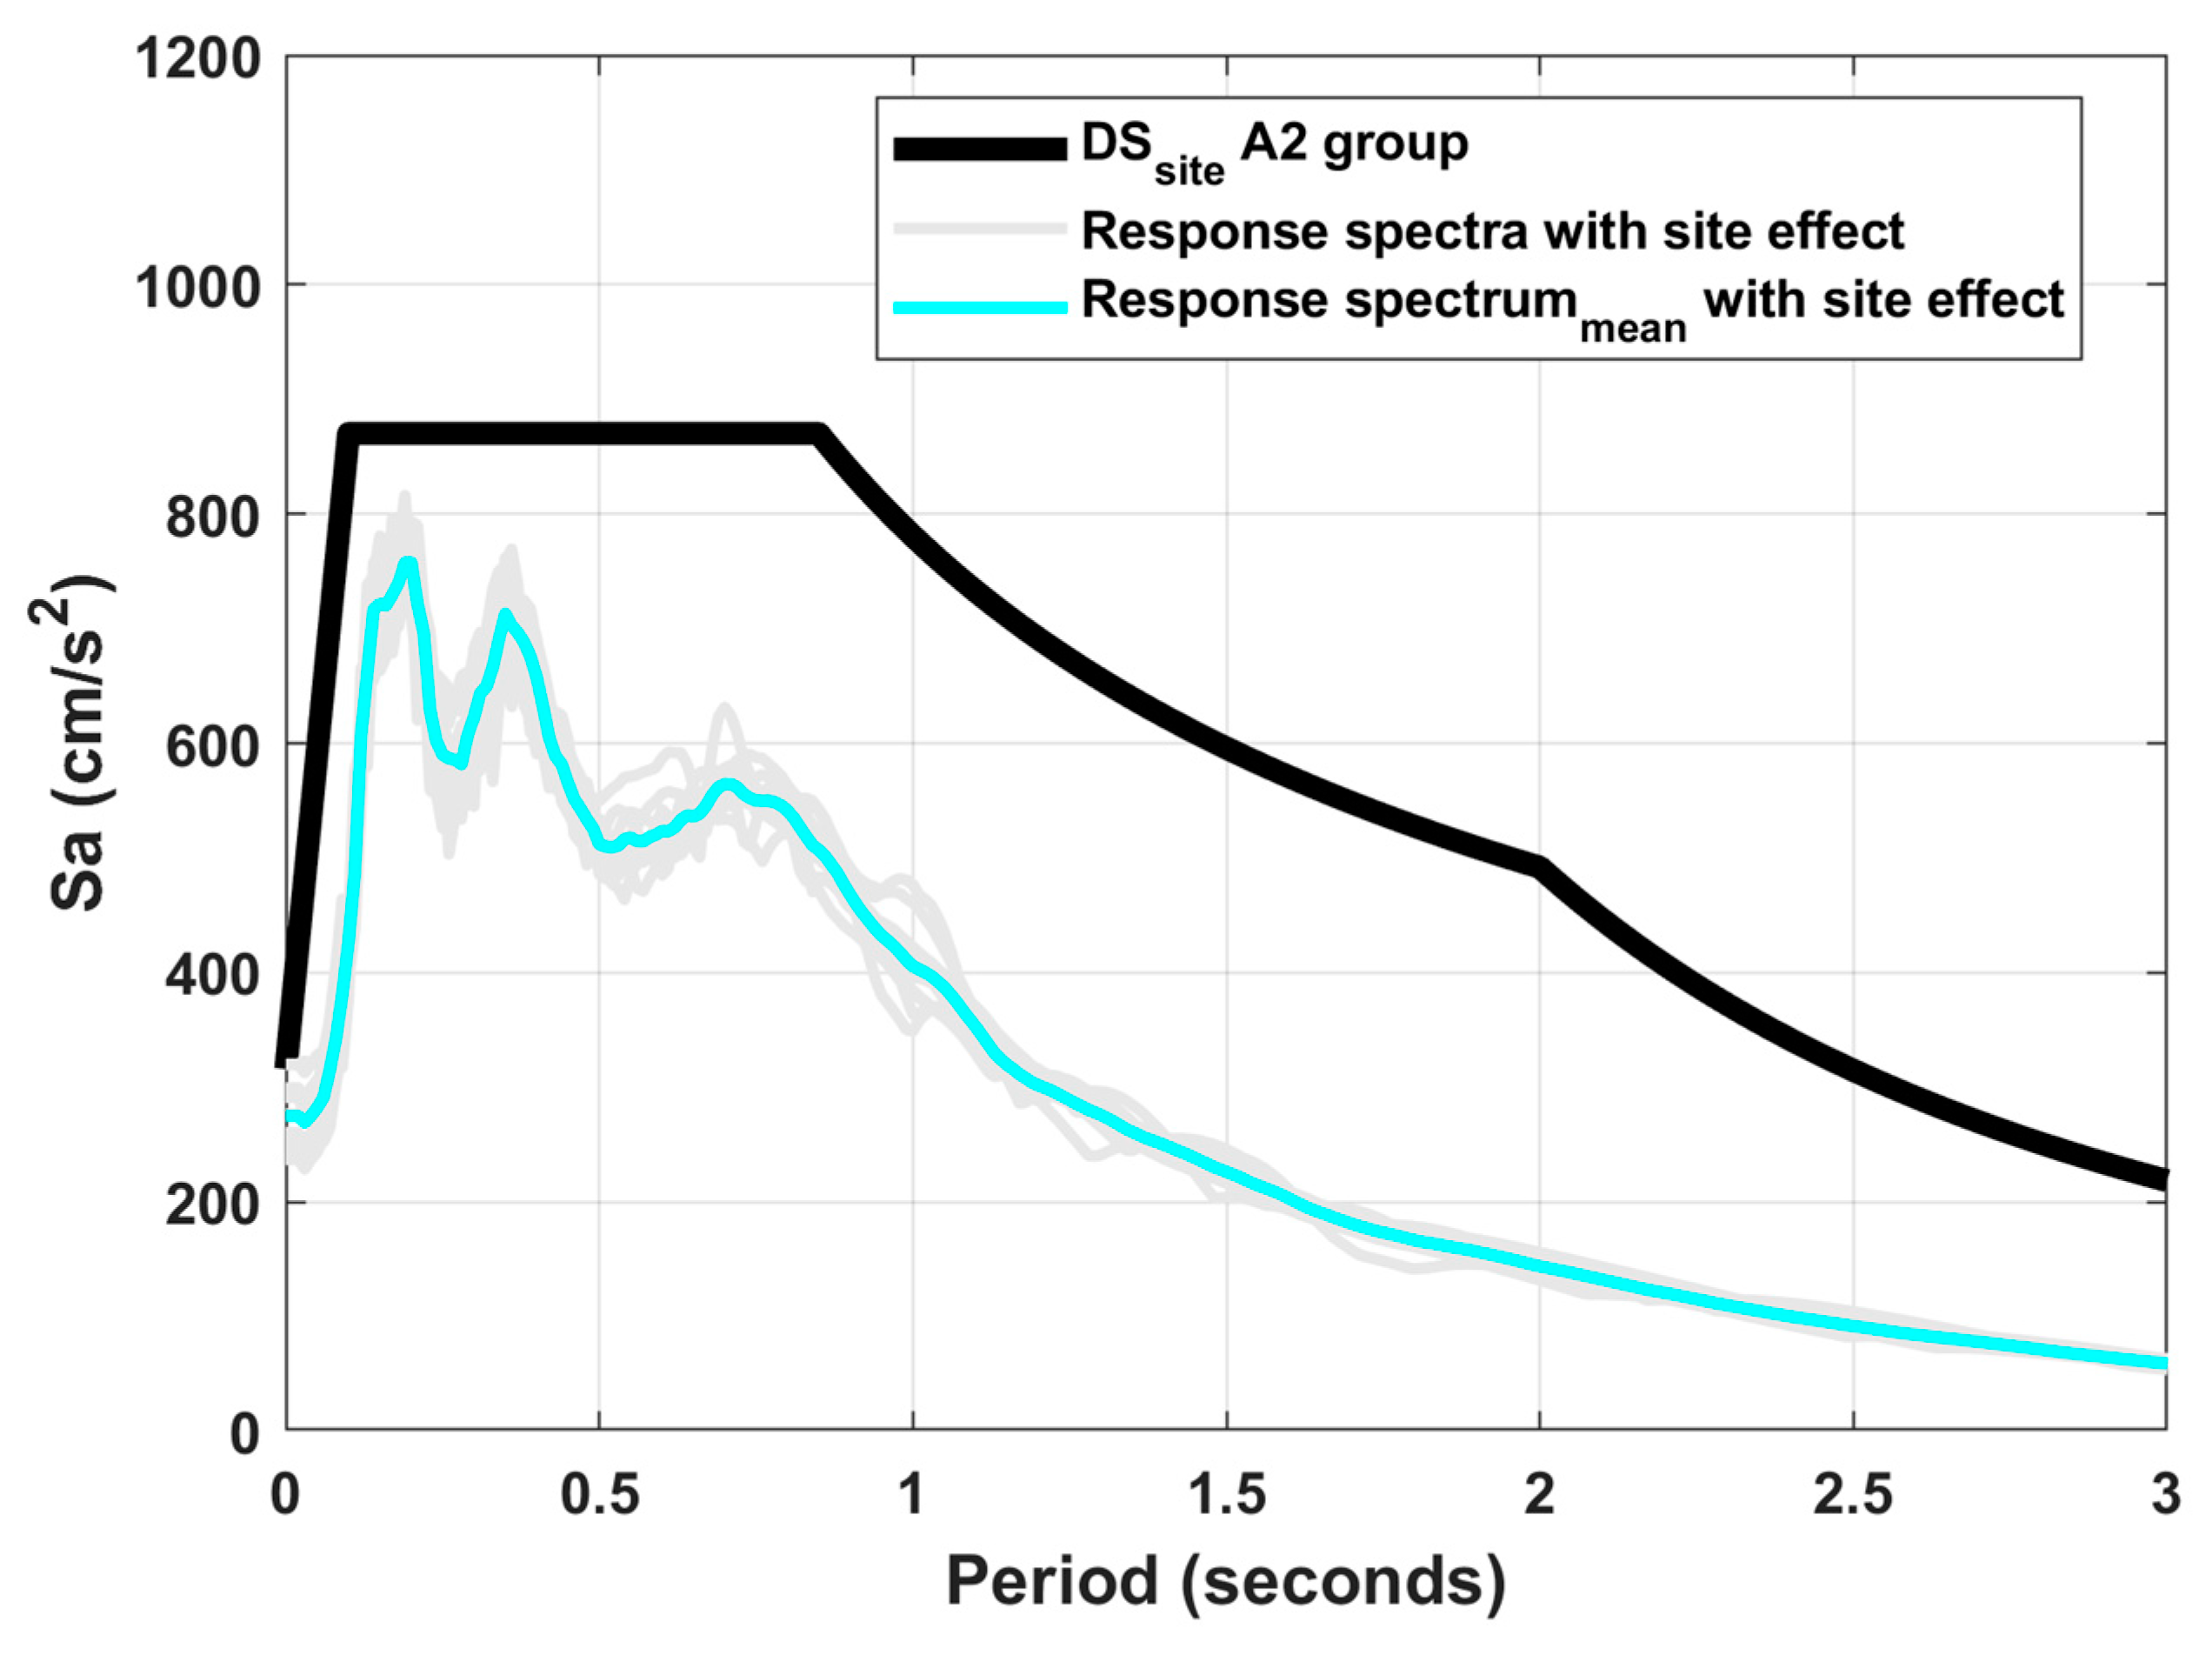
Set of synthetic accelerograms with the site effect for buildings of A2 group for Model 2.

Figure 11.
Response spectra, mean spectrum, and site-specific design spectrum (DSsite) with the site effect for buildings of A2 group for Model 2.
To build the DSsite for buildings of the A2 group with Models 1 and 2, the parameters from MDOC-CFE [5] for zone B and soil type II were utilized as a reference. These parameters reflect the seismic zone and soil classification for the site in question. In addition, due to our utilizing an FT deterministic that does not consider uncertainties in the soil stratigraphy, the amplitude, and width of the spectral plateau were increased by 15%, as per the MDOC-CFE [5] guidelines. This 15% increase covers the variability given by uncertainties associated with the soil dynamics. When we consider uncertainties associated with the soil dynamics with the probabilistic approaches (e.g., Monte Carlo method) for FT development, such an augmentation is not necessary. Additionally, it was ensured that all response spectra maintained spectral accelerations for all periods and structural ductilities (Q = 1, 1.5, 2, and 3) within the examined range. For this specific site, the A2 design spectrum from Model 1 was selected, as it exhibited the highest spectral ordinates.
6. Optimization of Structural Design Using the DSsite in Buildings in A2 Group
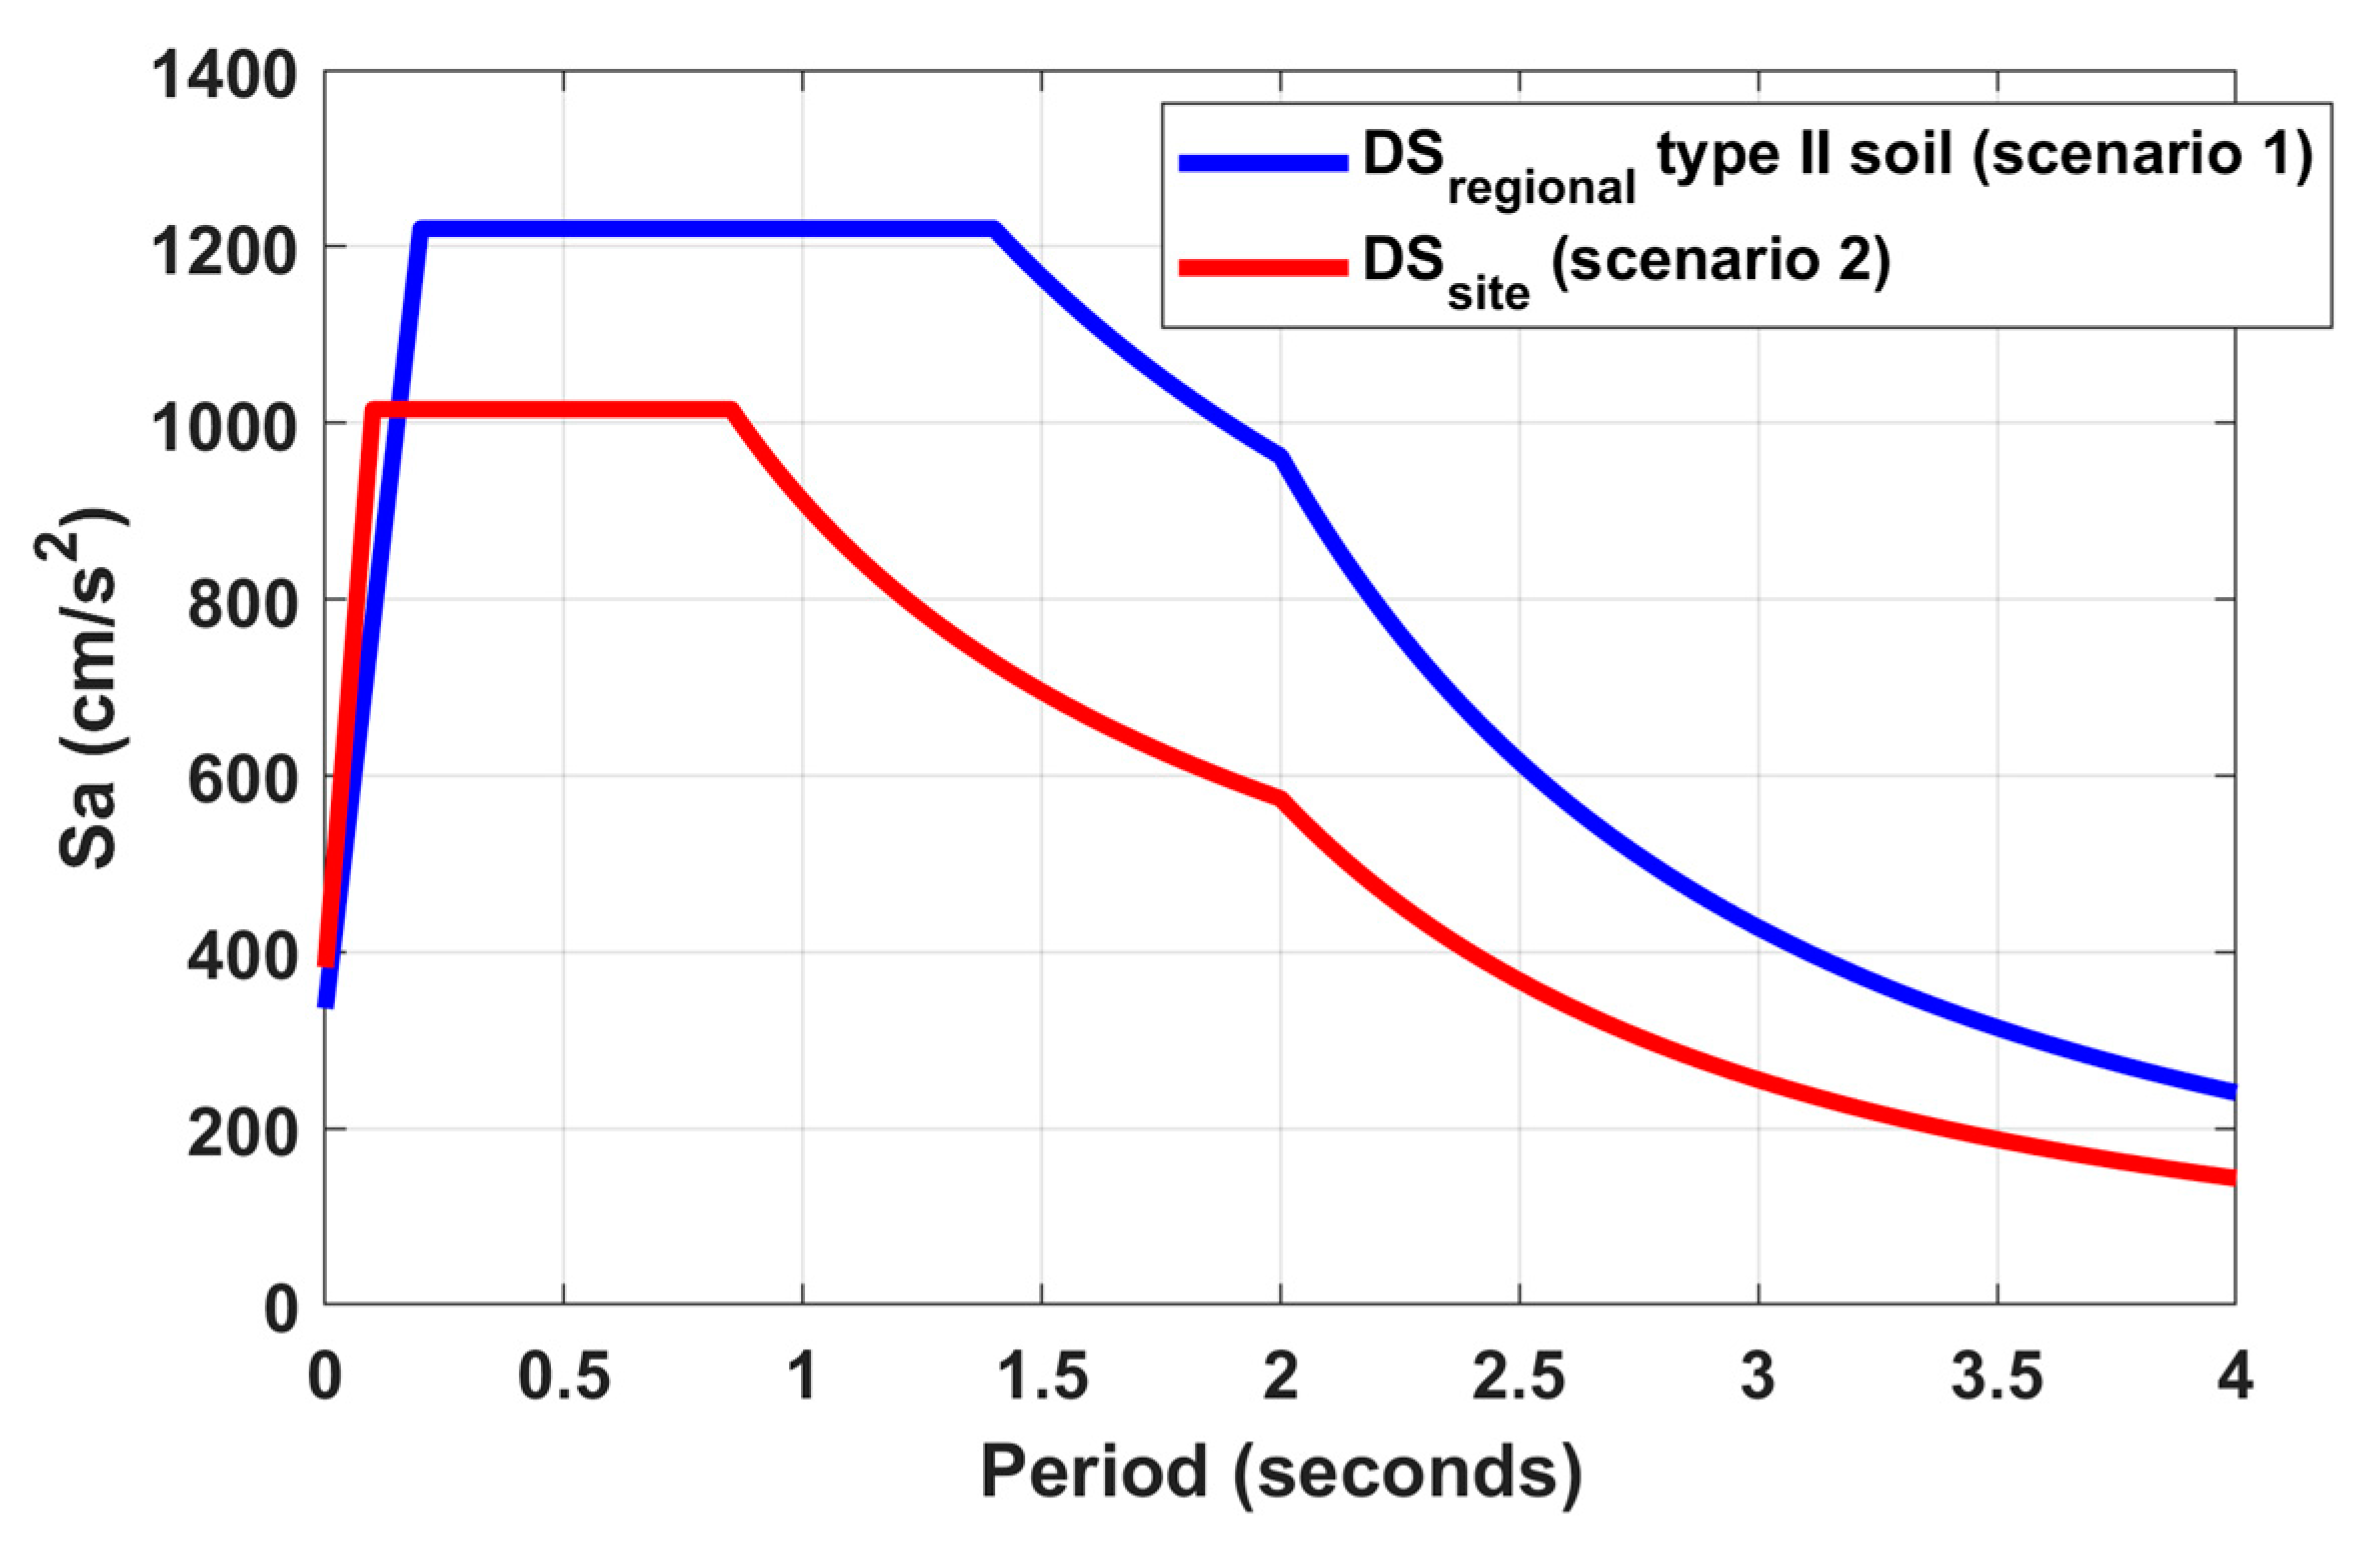
This section delves into a case study exploring the cost–benefit analysis in optimizing the structural design of a mid-rise building featuring a steel structural system. The study is conducted for the site situated in Tabasco state, Mexico, studied throughout this article and characterized by soft soils and with an accelerographic network that is very limited. The case study considers the two scenarios outlined in the professional practice of structural engineers for defining seismic threats, discussed in Section 5. Figure 12 illustrates the seismic design spectra intended for use in the two scenarios evaluated for the study site in a building in A2 group. In scenario 1, we utilize the regional design spectrum (DSregional) for type II soil, that is determined by the site’s stratigraphy and the formulas outlined in the MDOC-CFE [5]. In scenario 2, we incorporate geotechnical and geophysical studies defined by the site’s seismic hazard, the site-specific design spectrum (DSsite) from Model 1 of the previous section is employed.
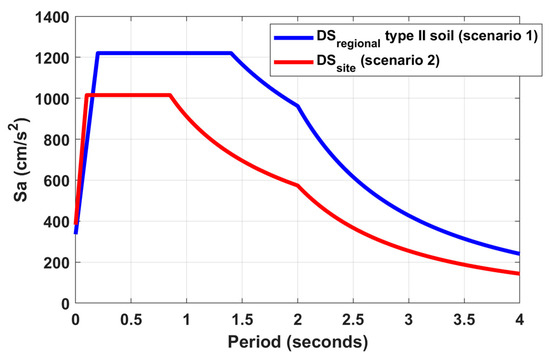
Figure 12.
Regional design spectrum (DSregional) for type II soil [5] and site-specific design spectrum (DSsite) for the two scenarios to be evaluated in the case study.
The studies for both scenarios incur initial additional costs in the structural project, but they are imperative to ensure the safety of the constructions. Table 3 outlines the approximate costs associated with conducting geotechnical and geophysical studies for a project within Tabasco state.
Table 3.
Approximate costs of geotechnical and geophysical studies in Tabasco state, Mexico.
6.1. Characteristics of the Building under Study
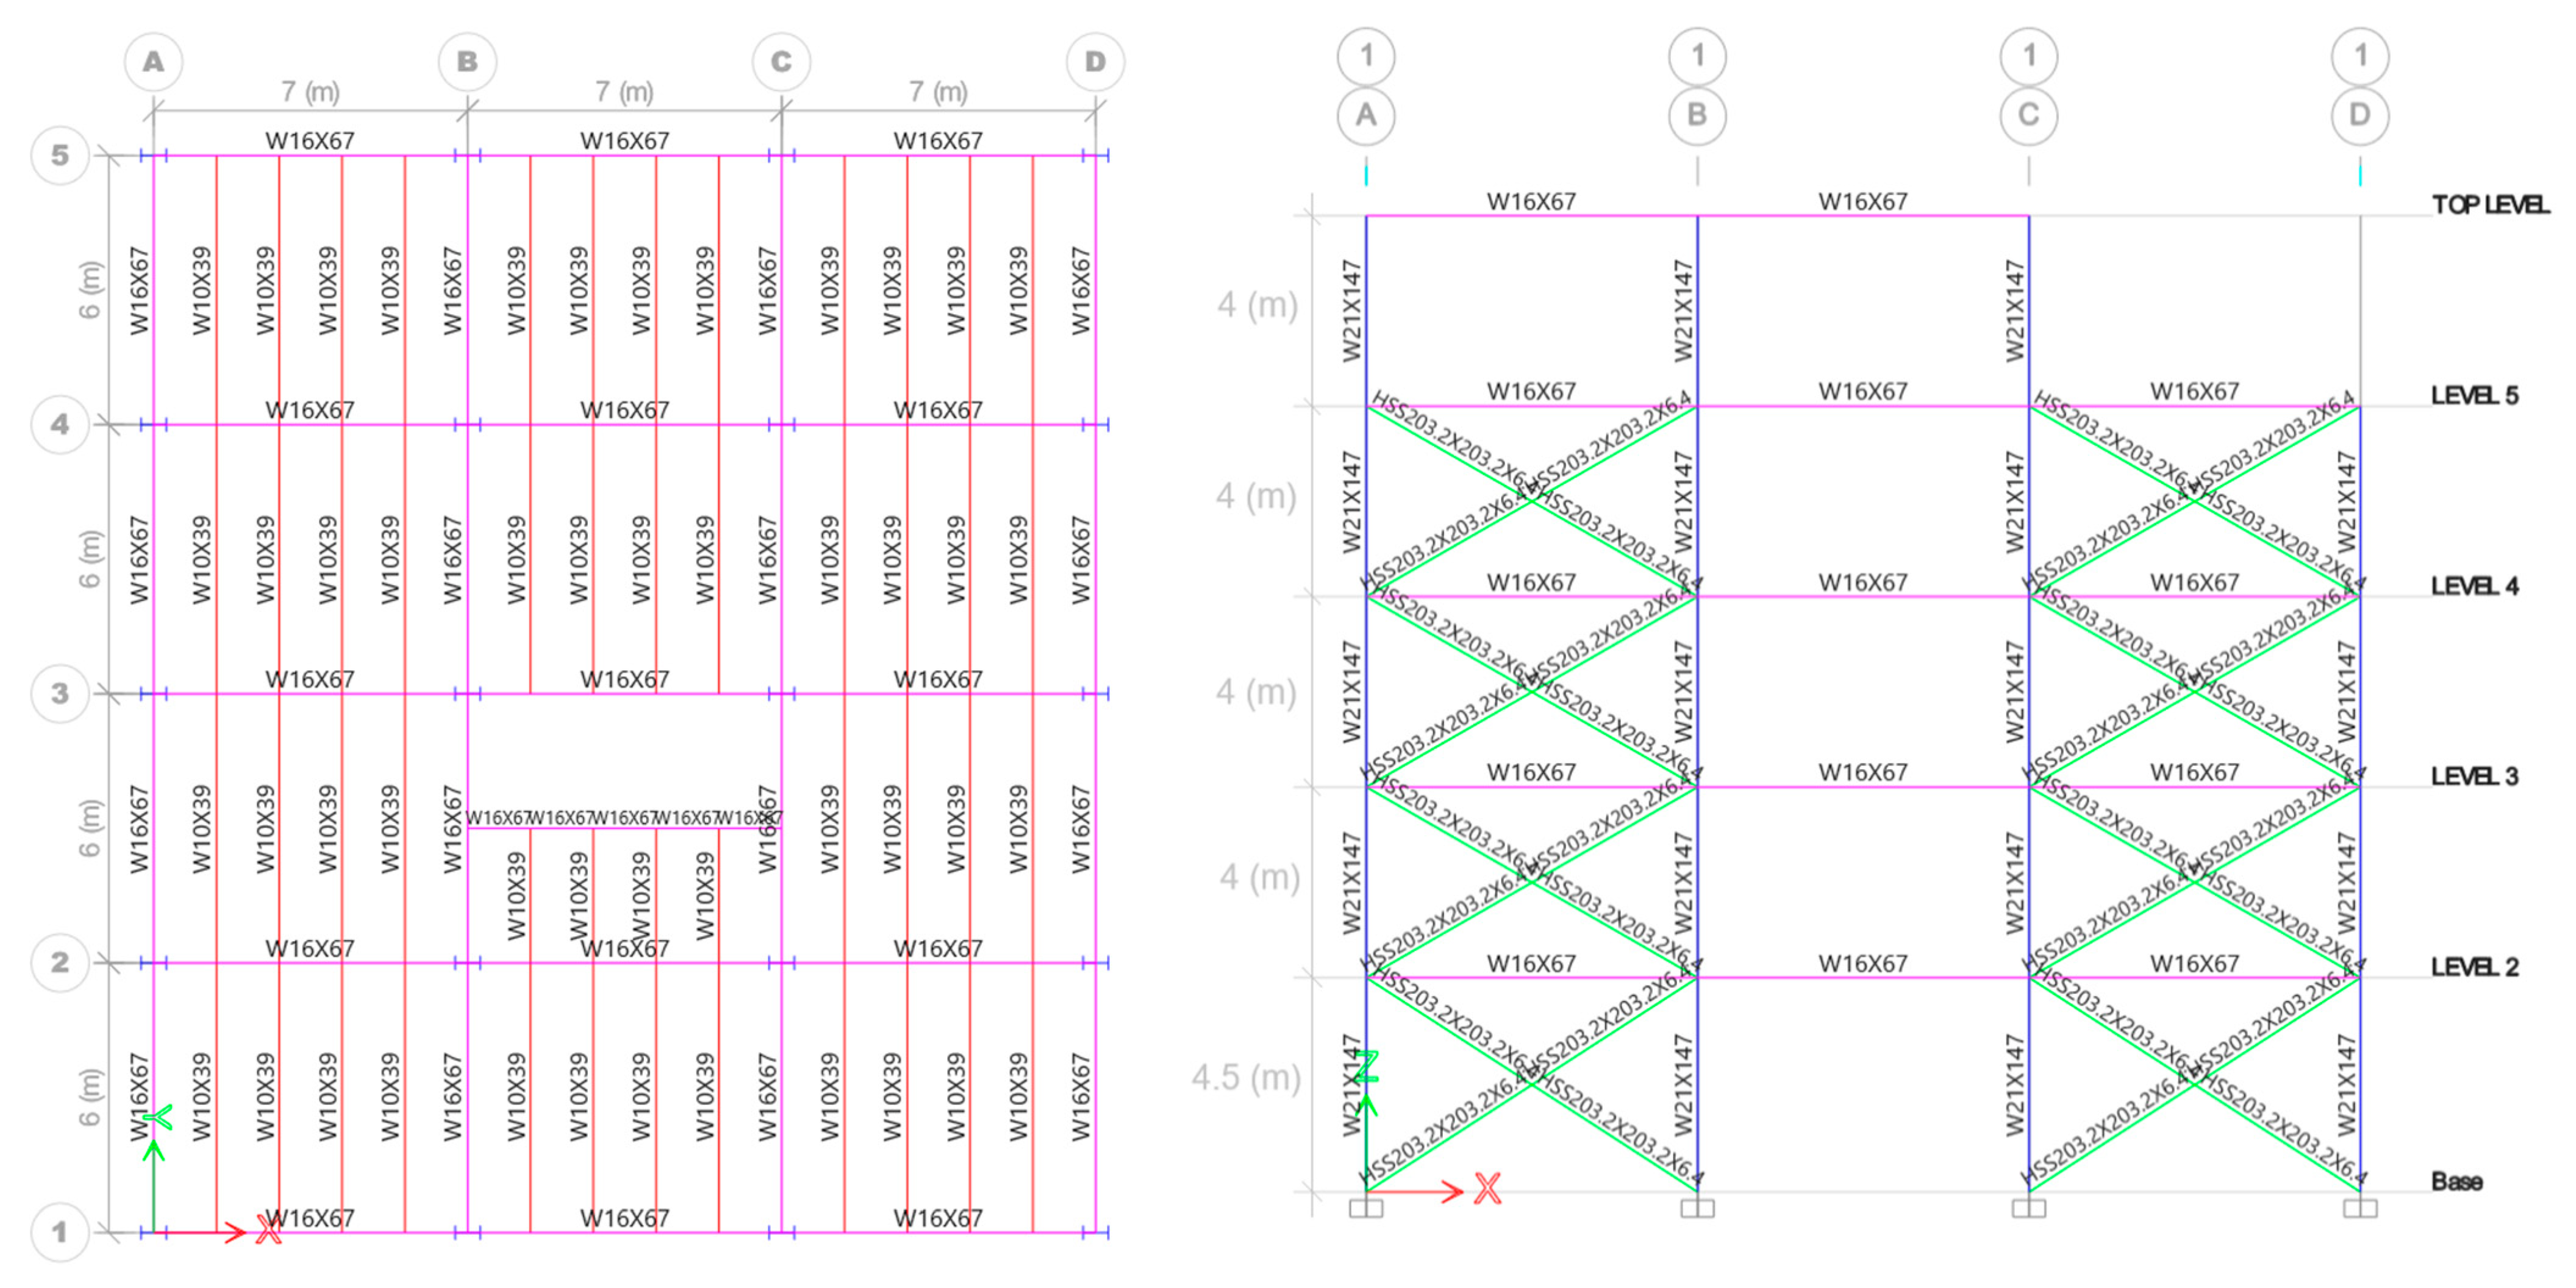
In this case study, a five-story steel building designed for educational purposes is analyzed (A2 group). The building has a structural system of rigid frames comprising columns, primary and secondary beams, and a floor system with a composite slab (consisting of a steel slab and a reinforced concrete compression layer). The plan and elevation geometry are illustrated in Figure 13. The design incorporates W sections for columns and main and secondary beams of A992 G50 steel, and OR sections for the braces of A500 B46 steel. The floor system serves as a load transmission element, and each level is assigned a rigid diaphragm.
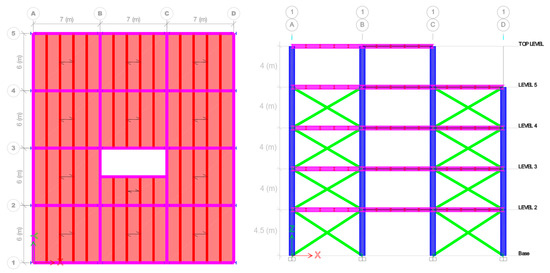
Figure 13.
Plan view and elevation of the building for the case under study. The letters and numbers enclosed in circles represent the main axes of the building. The red color is the steel slab, and its orientation is indicated with the dates. The blue color is the columns; the magenta color the beams and the green color the X-braces.
6.2. Structural Design
The structural modeling was performed using the ETABS structural software [23]. A dead load, which includes the weight of the slab, non-structural components, and loads per regulations, was considered as 407 kg/m2 for each floor and 415 kg/m2 for the roof. Live loads based on NTC-RSEE [7], are presented in Table 4. Seismic actions were defined according to the design spectra of the two scenarios being evaluated in this case study; only the modifications corresponding to structural behavior are considered. Details of this analysis will be explained later. For the structural design of the elements, nine load combinations were employed: (i) a combination of dead load and maximum live load (with load factors of 1.3 and 1.5, respectively); (ii) eight combinations incorporating dead load, accidental live load, and earthquake in the X and Y directions (with load factors of 1.1 for all loads); (iii) the accidental combinations were conducted with a combination of percentages (100% + 30%) in the X and Y directions and reversing their direction; and (iv) the criteria for designing structural elements followed the NTC-RSEE guidelines [7]. Important points of this regulation include the utilization of the Load and Resistance Factor Design (LRFD) method and the use of the concept of a resistance ratio to incorporate a factor considering the inevitable deviations between the real and theoretical resistance, as well as the failure mode characteristics. This ratio is set at 0.9 for the primary frame elements in flexure, shear, compression, torsion, and tensile yielding in the gross section, while for tensile rupture in the net section, it is established at 0.75. Additionally, the regulation proposes two overstrength ratios for structural steel: Ry for the yield stress and Ru for the ultimate stress. For A992 G50 steel, these ratios are Ry and Ru of 1.1, and for A500 B46 steel, they are Ry of 1.4 and Ru of 1.3.
Table 4.
Live loads for school buildings (A2 group) in the NTC-RSEE [7].
It is essential to determine the rigidity, mass, and structural period of the building. For this, the design process commences with a preliminary dimensioning. This preliminary sizing of the structural elements just considers the gravitational loads (dead and live loads) to the mathematical model and selects a specific structural section for each element type. Figure 14 illustrates the profiles assigned to various elements in this process. With this structural preliminary sizing, a modal analysis was conducted to determine the fundamental structural periods in the X-axis and Y-axis directions; giving Tfx = 0.482 s and Tfy = 0.534 s.
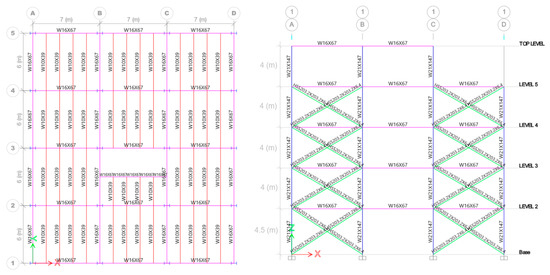
Figure 14.
Structural profiles of the building derived from preliminary sizing. The letters and numbers enclosed in circles represent the main axes of the building. The red color is the steel slab, and its orientation is indicated with the dates. The blue color is the columns; the magenta color the beams and the green color the X-braces.
6.3. Modified Design Spectrum
The estimation of seismic forces for the structural design relies on the provided spectral acceleration for the fundamental period in the direction of analysis in the modified design spectrum (MDS). To derive this, the design spectrum (DS) needs modification. Therefore, modification factors that account for the structural characteristics of the building and its interaction with the ground are necessary. In the case study, the DS from each scenario depicted in Figure 12 are utilized to obtain their respective MDS. The MDOC-CFE [5] suggests the following equation for MDS calculation.
where
- Sa(T, β(T, ξ)). Design spectrum as a function of structural periods (T) and specific damping β (T, ξ).
- β(T, ξ). Factor that takes into account the damping level (ζ) of the structural system and its material for T.
- Q’(T, Q). Ductility factor, accounting for the inelastic performance of the structure based on the seismic behavior factor (Q) corresponding to each analysis direction and T. Q can assume values of 1.25, 1.5, 2, 3, and 4 [5].
- Ro. Factor incorporating building overstrength. This factor can vary as 2, 2.5, and 3 for different structural systems [5].
- ρ. Redundancy factor determines the redistribution of actions among structural elements for each analysis direction. It can take values of 0.8, 1.0, and 1.25, selected based on the number of frames or lines of defense in the analysis direction [5].
- α. Irregularity factor. This considers the structural regularity through eleven conditions for geometric, load, and rigidity regularity of the system, following MDOC-CFE [5] guidelines. The regularity factor can be 0.7, 0.8, or 0.9 based on the degree of irregularity.
- Acd. Amplification factor for degrading behavior; this considers the rigidity degradation and/or resistance degradation in the structural system in a building founded on soft soils such as type II or III. Acd is a function of the structure fundamental period (Tf) in the analysis direction and the dominant period of the soil (Ts).
For a comprehensive understanding of the formulas for each modification factor of the design spectrum, detailed information can be found in the MDOC-CFE [5] guidelines. Additionally, the article by González and Calderón [24] provides a review and in-depth perspective on seismic regulations in Mexico. Table 5 outlines the structural parameters and reduction/amplification factors applied to determine the modified design spectra (MDS) for each scenario, analyzed in the two primary directions (X-axis and Y-axis) of the case study building. Figure 15 shows the MDS of both scenarios. The seismic design demand for the strength and serviceability review was assessed using the MDS of each scenario with a modal spectral analysis.
Table 5.
Structural parameters and reduction/amplification factors applied to determine the modified design spectra (MDS).
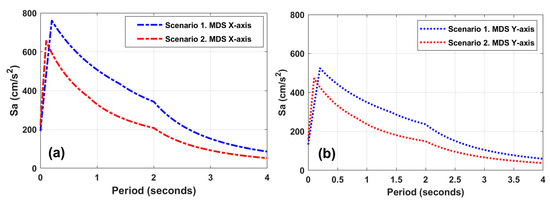
Figure 15.
Modified design spectrum on the (a) X-axis and (b) Y-axis of the case study building.
For steel buildings equipped with X-braced frames, the NTC-RSEE guidelines [7] emphasize the importance of damage control, especially during earthquakes. This is ensured by ensuring the following criteria: (1) The frames within these dual systems should possess the capacity to withstand the forces on each story independently, with a requirement that X-braces contribute at least 30% of the total shear force in the story. (2) The detailing of frames should ensure an equivalent level of ductility as that achieved by X-braces. (3) It is essential to ensure that tension X-braces can withstand between 30% and 70% of the applied shear force on each story. (4) The maximum inter-story drift ratio (MIDR), calculated based on the forces derived from the modified design spectra (MDS), remains below 0.002. Additionally, the MIDR is multiplied by QRo to ensure it does not surpass the permissible inter-story drift limit for the collapse prevention state, which stands at 0.01 for such buildings with a Q value of 2 [7]. Following these premises, collapse mechanisms in the building will be obtained: strong column—weak beam—weaker braces. This means that, during intense ground motions, the X-braces should undergo plastic deformations, while the primary structural elements such as beams, columns, and connections maintain their elastic behavior [25,26,27,28].
6.4. Cost–Benefit Study
For the two scenarios examined, the definitive design of the structural elements was executed, and the allowable lateral displacements were scrutinized based on the maximum inter-story drift ratio (MIDR) to meet the service and collapse prevention conditions specified in the MDOC-CFE [5]. Presently, earthquake-resistant design standards worldwide regard MIDR as a highly effective parameter for damage control in the face of the intense seismic actions a building may encounter throughout its operational life [29,30]. The structure increased rigidity in both analysis directions due to seismic demands. In the X direction, a stiffness increase of 26% was observed for scenario 1 and 13% for scenario 2. Similarly, in the Y direction, there was an increase of 26% for scenario 1 and 14% for scenario 2. These percentages were calculated concerning the initial pre-sizing of the structure. Table 6 presents the fundamental periods in the primary directions of the building after the final design for each scenario and their comparison with the period of the pre-sized building. The change in the periods of the buildings between pre-sizing and the final design resulted in a non-significant change in the Acd factor, less than 5% in both scenarios. In any way, the design and deformations were reviewed, for the new Acd factors, and the selected profiles in the final design continued to be satisfactory. Table 7 shows the sections resulting from the final structural design of each scenario for the case study.
Table 6.
Fundamental periods in the primary directions of the building with the final design and the pre-sized building.
Table 7.
Final structural design for the two scenarios considered in the analyzed building.
We can observe a substantial contrast in the building’s weight when conducting the analysis and design considering the seismic demands from scenarios 1 and 2. This variance amounts to 42.59 tons, signifying a 16.6% difference relative to the total weight of the structure. The structure’s weight calculation excludes connection weights or foundations, and a reduction in these aspects is also anticipated. Also, we do not consider in the cost–benefit analysis any trade-offs identified in terms of construction complexity, materials, or other structural considerations that could impact the overall feasibility of the proposed optimization. Table 8 provides a comparison, encompassing only material costs and the inclusion of applicable geotechnical and geophysical studies for each scenario.
Table 8.
Comparative table of costs between scenarios 1 and 2 of the case under study.
In this case study, the design for scenario 2 (DSsite) results in a cost 18% lower than scenario 1 (DSregional), even when taking into account the costs of the geotechnical study, geophysical study, ambient vibration test, and seismic hazard study with site-specific design spectrum (DSsite). This highlights that employing the DSsite leads to more rational spectral ordinates. This optimization in accelerations provides a more accurate characterization of the seismic hazard to which structures are exposed and holds the potential for substantial cost savings in the design process.
The implementation of the new technological advancements and monitoring systems results in a better cost benefit and can play a crucial role in enhancing the efficiency of seismic risk management in cities. Specifically, the technology enables the seamless integration of data from diverse sources, including satellite imagery, geotechnical studies, geophysical measurements, ground acceleration sensors, and more. This integration results in comprehensive databases detailing the anticipated dynamic behavior of the soil in each region. Such data will be very useful in the accuracy of seismic hazard assessments and facilitates the evaluation of the seismic performance of structures in the region using advanced models that incorporate soil–structure interaction.
7. Conclusions
This document has discussed the methodology for studying the seismic hazard to determine the site-specific design spectra of the Mexico seismic regulations [5]. Furthermore, a cost–benefit analysis has been presented to underscore the significance and benefits of integrating geotechnical, geophysical studies, and environmental vibration records in assessing earthquake hazard for the seismic design of structures. The following conclusions have been drawn from this research:
- In regions lacking seismic instrumentation, utilizing geotechnical, geophysical studies, and environmental vibration records aids in interpreting the soil’s dynamic behavior during seismic events. The results of these tests can be used to incorporate them into seismic hazard studies, and thus obtain the site-specific design spectra according to the MDOC-CFE [5]. This approach allows for a more accurate seismic hazard assessment by incorporating site-specific effects.
- The structural engineer must be very clear about the soil dominant period (Ts) at the site, since, through it, the degrading behavior factor (Acd) applicable for type II and III soils can be considered in the Mexico seismic regulations. The Acd factor can amplify or reduce the modified seismic design spectrum and depends on the ratio between the fundamental structural period of the building (Tf) and Ts. Furthermore, if the Ts is like the Tf, it will be necessary to carry out a soil–structure interaction study to consider the effects of possible resonance in the structure.
- In sites where conventional geotechnical exploration (SPT test) or geophysical studies (Down-Hole test) do not reach the rock basement (type II and III soils), it is essential to carry out environmental vibration records to determine the correct soil dominant period (Ts). Not knowing the Ts of the site can cause bad practice and make certain considerations arbitrary in the design spectrum with PRODISIS [6], potentially causing an overestimation or underestimation of the real seismic demand.
- The cost–benefit analysis for the structural design of the group A2 building in this case study reveals an 18% reduction in the cost of structural elements without compromising the building’s safety. It is crucial to acknowledge the context-specific nature of the study. Generalizing the findings to regions with different geological and seismic conditions may not be feasible. Hence, it is advisable to conduct diverse cost–benefit analyses to assess potential benefits across various scenarios.
- Based on the aspects mentioned throughout this article, it is recommended that, although current regulations in Mexico [5] establish mandatory geotechnical, geophysical studies, environmental vibration records, and seismic hazard study to determine the site-specific design spectrum (DSsite) for constructions in the energy sector (buildings in A1 group or A+ group) and the basic exploration of geotechnics and geophysics for the construction of regional spectra of structures B1 and A2, it is important that, given the current availability and ease of carrying out more complete studies of the dynamic behavior of the soil, it is established as a policy for its implementation for seismic designs in high-security constructions (building A2 group) and medium-security constructions (building B1 group). Especially in areas with soft soils and little or no seismic instrumentation. So that the seismic hazard of the sites is better defined, and this leads to better estimation and management of the seismic risk of cities.
- It is crucial to acknowledge that geotechnical and geophysical data for sites are typically not readily available, it is necessary studies need to be carried out. Nevertheless, these studies are becoming more accessible, and their cost effectiveness renders them feasible for sites of interest. The greater the availability of geotechnical and geophysical studies for a region or city, the more accurately the expected seismic hazard maps can be defined. An illustrative instance of this can be observed in the SASID [31] application, which is part of the seismic design regulations of Mexico City, where site effects have been integrated into the design spectra.
- In future research, it is recommended to explore and compare global alternative methodologies for acquiring site-specific design spectra and assess how their utilization influences other types of buildings [32]. We can also analyze the progressive collapse of the building designed with DSsite, and so determined their seismic performance, fragility, robustness, and damage through incremental nonlinear dynamic analysis for the strong ground motions expected on site [33]. Additionally, it is suggested to conduct comprehensive regional studies where complete information from geotechnical and geophysical studies is available. This approach could involve the utilization of programs such as R-Crisis [34], enabling the creation of seismic hazard maps by considering grids with site effects. These lines of research have the potential to enhance and contribute to the ongoing discourse on seismic risk management.
- Finally, enhancing seismic risk management in countries can be achieved by ensuring the availability and accessibility of data derived from geotechnical and geophysical studies of urban areas. This necessitates a substantial collaborative effort from stakeholders, including architects, engineers, educational and research institutions in both the public and private sectors. The goal is to effectively communicate to society the advantages of adopting policies that reinforce the creation of platforms providing clearer definitions of seismic hazards in a region. This collective effort aims to foster the development of resilient cities, better prepared to withstand seismic events.
Author Contributions
Conceptualization, J.A.R.-S., S.A.D. and R.S.M.-O.; Data curation, J.A.R.-S. and G.P.-S.; Formal analysis, J.A.R.-S., S.A.D. and R.S.M.-O.; Funding acquisition, G.P.-S.; Investigation, J.A.R.-S. and G.P.-S.; Methodology, J.A.R.-S., S.A.D. and R.S.M.-O.; Project administration, S.A.D., R.S.M.-O. and F.M.-H.; Resources, J.A.R.-S. and G.P.-S.; Software, J.A.R.-S., S.A.D. and R.S.M.-O.; Supervision, S.A.D., R.S.M.-O. and F.M.-H.; Validation, J.A.R.-S., S.A.D. and R.S.M.-O.; Writing—original draft, J.A.R.-S. and S.A.D.; Writing—review and editing, S.A.D., R.S.M.-O. and F.M.-H. All authors have read and agreed to the published version of the manuscript.
Funding
The APC was funded by Consejo de Ciencia y Tecnología del Estado de Tabasco (CCYTET) of the Tabasco State Government and Tecnosolum Ingeniería y Cimentaciones S.A. de C.V.
Data Availability Statement
Data are contained within the article.
Acknowledgments
S.A.D.: R.S.M.-O. and F.M.-H. thank the Academic Group: Risk Assessment and Sustainability of Civil Works (UJAT-CA-287) in the Universidad Juárez Autónoma de Tabasco (UJAT) and SNI-CONACYT in México for their support.
Conflicts of Interest
The authors declare no conflicts of interest.
Appendix A
This annex shows the formulas to construct the design spectrum of the MDOC-CFE [5] regulations. Figure A1 shown the shape of the spectrum and Equations in Figure A1 of the MDOC-CFE [5] regulations for each section.
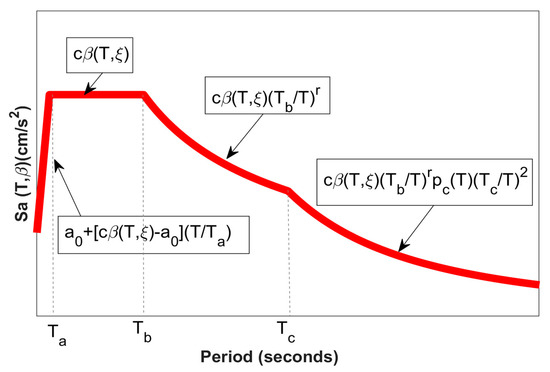
Figure A1.
The shape of the design spectrum of the MDOC-CFE [5] regulations.
Figure A1.
The shape of the design spectrum of the MDOC-CFE [5] regulations.

Where the parameters of the figure are:
- Sa(T, β(T, ξ)). Design spectrum as a function of structural periods (T) and specific damping β (T, ξ).
- β(T, ξ). Factor that takes into account the damping level (ζ = 5%) of the structural system and its material for T. Where this is estimated as β = (0.05/ζ)λ; with λ= 0.45 if T < Tc or 0.45 (Tc/T) if T≥ Tc.
- a0 = Maximum ground acceleration.
- c = Maximum spectral acceleration.
- Ta = Lower limit of the plateau of the design spectrum.
- Tb = Upper limit of the plateau of the design spectrum.
- Tc = Onset period of the descending branch.
- r = Parameter that controls the drop of the spectral ordinates for Tb ≤ T < Tc.
- k = Parameter that controls the fall of the spectral ordinates for T ≥ Tc.
- pc = Factor used to define the variation of the spectrum in the descending branch, calculated as follows: pc = k + (1 − k)(Tc/T)2
The parameters necessary for using the formulas in Figure A1 are indicated in Table A4 of the MDOC-CFE [5]. Also, for type II and III soils, the site and response factors from Table A1, Table A2, and Table A3 of the MDOC-CFE [5] are employed, and the parameters on the maximum acceleration in rock soil (c), maximum ground acceleration (a0), and maximum spectral acceleration (c). These tables are shown below:
Table A1.
Table A1 of the MDOC-CFE [5], site factor (FSit) for different zones and soil types.
Table A1.
Table A1 of the MDOC-CFE [5], site factor (FSit) for different zones and soil types.
| Type I Soil | Type II Soil | Type III Soil | |
|---|---|---|---|
| Zone A | 1.0 | 2.6 | 3.0 |
| Zone B | 1.0 | 2.6-0.2(ar0-50/50) | 3.0-0.3(ar0-50/50) |
| Zone C | 1.0 | 2.4-0.3(ar0-100/100) | 2.7-0.4(ar0-100/100) |
| Zone D | 1.0 | 2.1-0.5(ar0-200/290) | 2.3-0.6(ar0-200/290) |
Table A2.
Table A2 of the MDOC-CFE [5], response factor (FRes) for different zones and soil types.
Table A2.
Table A2 of the MDOC-CFE [5], response factor (FRes) for different zones and soil types.
| Type I Soil | Type II Soil | Type III Soil | |
|---|---|---|---|
| Zone A | Data of the PRODISIS [6] | 3.8 | 4.2 |
| Zone B | Data of the PRODISIS [6] | 3.8-0.2(ar0-50/50) | 4.2-0.3(ar0-50/50) |
| Zone C | Data of the PRODISIS [6] | 3.6-0.2(ar0-100/100) | 3.9-0.3(ar0-100/100) |
| Zone D | Data of the PRODISIS [6] | 3.4-0.5(ar0-200/290) | 3.6-0.6(ar0-200/290) |
Table A3.
Table A3 of the MDOC-CFE [5], restriction of the values of ar0, a0, and c (cm/s2).
Table A3.
Table A3 of the MDOC-CFE [5], restriction of the values of ar0, a0, and c (cm/s2).
| Type I Soil | Type II Soil | Type III Soil | |
|---|---|---|---|
| ar0 | 32 ≤ ar0 ≤ 490 | 80 ≤ a0 ≤ 690 | 94 ≤ a0 ≤ 752 |
| c | 80 ≤ c ≤ 1225 | 320 ≤ c ≤ 2000 | 390 ≤ c ≤ 2256 |
Table A4.
Table A4 of the MDOC-CFE [5], values of the characteristic periods and exponents that control the descending branches of the design spectrum.
Table A4.
Table A4 of the MDOC-CFE [5], values of the characteristic periods and exponents that control the descending branches of the design spectrum.
| Zone | Type Soil | Ta (s.) | Tb (s.) | Tc (s.) | k | r |
|---|---|---|---|---|---|---|
| A | I | 0.1 | 0.6 | 2.0 | 1.5 | 1/2 |
| II | 0.2 | 1.4 | 2.0 | 1.0 | 2/3 | |
| II | 0.3 | 2.0 | 2.0 | 0.5 | 1 | |
| B | I | 0.1 | 0.6 | 2.0 | 1.5 | ½ |
| II | 0.2 | 1.4 | 2.0 | 1.0 | 2/3 | |
| II | 0.3 | 2.0 | 2.0 | 0.5 | 1 | |
| C | I | 0.1 | 0.6 | 2.0 | 1.5 | 1/2 |
| II | 0.2 | 1.4 | 2.0 | 1.0 | 2/3 | |
| II | 0.2 | 2.0 | 2.0 | 0.5 | 1 | |
| D | I | 0.1 | 0.6 | 2.0 | 1.5 | ½ |
| II | 0.1 | 1.4 | 2.0 | 1.0 | 2/3 | |
| II | 0.1 | 2.0 | 2.0 | 0.5 | 1 |
References
- Bertero, V.; Bozorgnia, Y. The early years of earthquake engineering and its modern goal. In Earthquake Engineering from Engineering Seismology to Performance-based Engineering; Chapter 1; CRC Press: Boca Raton, FL, USA, 2004; p. 17. ISBN 9780429204968. [Google Scholar]
- Baker, J.W.; Bradley, B.A.; Stafford, P.J. Seismic Hazard and Risk Analysis; Cambridge University Press: Cambridge, UK, 2021; p. 79. [Google Scholar] [CrossRef]
- McGuire, R.K. Seismic Hazard and Risk Analysis; Institute Earthquake Engineering Research: Oakland, CA, USA, 2004; p. 221. ISBN 0943198011/9780943198019. [Google Scholar]
- Barbat, A.H.; Carreño, M.L.; Pujades, L.G.; Lantada, N.; Cardona, O.D.; Marulanda, M.C. Seismic vulnerability and risk evaluation methods for urban areas. A review with application to a pilot area. Struct. Infrastruct. Eng. 2010, 6, 17–38. [Google Scholar] [CrossRef]
- MDOC-CFE. Manual of Civil Structures Design. Earthquake Design; Federal Electricity Commission (CFE): Mexico City, Mexico, 2015; pp. 1–745. Available online: https://www.gob.mx/ineel/es/articulos/manual-de-diseno-de-obras-civiles-diseno-por-sismo-logro-de-la-ingenieria-de-mexico?tab= (accessed on 10 December 2023). (In Spanish)
- PRODISIS. Seismic Design Program; Electrical Research Institute: Washington, DC, USA, 2015; Available online: https://civil.ineel.mx/prodisis/es/prodisis.php (accessed on 10 December 2023). (In Spanish)
- NTC-RSEE. Complementary Technical Norms for the Review of the Structural Safety of Buildings of the México City; Official Gazette of the Federal Government of Mexico; 2017; pp. 1–712. Available online: https://smie.com.mx/smie-2022/informacion-tecnica/normas-tecnicas-complementarias.php (accessed on 10 December 2023). (In Spanish).
- Arroyo, D.; García, D.; Ordaz, M.; Mora, M.A.; Singh, S.K. Strong ground-motion relations for Mexican interplate earthquakes. J. Seismol. 2010, 14, 769–785. [Google Scholar] [CrossRef]
- Zhao, J.X. Attenuation Relations of Strong Ground Motion in Japan Using Site Classification Based on Predominant Period. Bull. Seismol. Soc. Am. 2006, 96, 898–913. [Google Scholar] [CrossRef]
- Abrahamson, N.A.; Silva, W.J. Empirical Response Spectral Attenuation Relations for Shallow Crustal Earthquakes. Seismol. Res. Lett. 1997, 68, 94–127. [Google Scholar] [CrossRef]
- Esteva, L. Criterios para la construcción de espectros para diseño sísmico. In Proceedings of the 3er Simposio panamericano de estructuras, Caracas, Venezuela, 3–8 July 1967. [Google Scholar]
- Cornell, C.A. Engineering Seismic Risk Analysis. Bull. Seismol. Soc. Am. 1968, 69, 9–48. [Google Scholar] [CrossRef]
- Hashash, Y.; Musgrove, M.; Park, D.; Tsai, C.-C.; Phillips, C.; Groholski, D. DeepSoil v7.0, 1-D Wave Propagation Program for Geotechnical Sire Response. Board of Trustees of University of Illinois at Urbana-Champaign and Youssef Hashash. 2020. Available online: http://deepsoil.cee.illinois.edu/ (accessed on 10 December 2023).
- Pitilakis, D. Waveprop, Function Calculates Displacement Wave Field in A Layered Medium Using Elastic Wave Equation 2023. Available online: https://www.mathworks.com/matlabcentral/fileexchange/60589-waveprop (accessed on 10 December 2023).
- Seed, H.B.; Idriss, I.M. Evaluation of Liquefaction Potential of Sand Deposits Based on Observations and Performance in Previous Earthquakes. En ASCE Annu. Conf. Sess. 1981, 24, 81–544. [Google Scholar]
- Kramer, L.S. Geotechnical Earthquake Engineering, 1st ed.; Prentice Hall: Upper Saddle River, NJ, USA, 1996; pp. 1–653. ISBN 0-13-374943-6. [Google Scholar]
- Nakamura, Y. A method for dynamic characteristics estimation of subsurface using microtremor on the ground surface. Railw. Tech. Res. Inst. Q. Rep. 1989, 30, 25–33. [Google Scholar]
- Zhao, J.X.; Irikura, K.; Zhang, J.; Fukushima, Y.; Somerville, P.G.; Asano, A.; Ohno, Y.; Oouchi, T.; Takahashi, T.; Ogawa, H. An empirical site-classification method for strong-motion stations in Japan using H/V response spectral ratio. Bull. Seismol. Soc. Am. 2006, 96, 914–925. [Google Scholar] [CrossRef]
- Fukushima, Y.; Bonilla, L.F.; Scotti, O.; Douglas, J. Site classification using horizontal-to-vertical response spectral ratios and its impact when deriving empirical ground-motion prediction equations. J. Earthq. Eng. 2007, 11, 712–724. [Google Scholar] [CrossRef]
- Di Alessandro, C.; Bonilla, L.F.; Boore, D.M.; Rovelli, A.; Scotti, O. Predominant-period site classification for response spectra prediction equations in Italy. Bull. Seismol. Soc. Am. 2012, 102, 680–695. [Google Scholar] [CrossRef]
- Pinzón, L.A.; Pujades, L.G.; Macau, A.; Carreño, E.; Alcalde, J.M. Seismic Site Classification from the Horizontal-to-Vertical Response Spectral Ratios: Use of the Spanish Strong-Motion Database. Geosciences 2019, 9, 294. [Google Scholar] [CrossRef]
- Wathelet, M.; Chatelain, J.-L.; Cornou, C.; Di Giulio, G.; Guillier, B.; Ohrnberger, M.; Savvaidis, A. Geopsy: A User-Friendly Open-Source Tool Set for Ambient Vibration Processing. Seismol. Res. Lett. 2020, 91, 1878–1889. [Google Scholar] [CrossRef]
- CSI. ETABS. V21.0.1. Building Analysis and design. Computers and Structures, Inc. Structural and Earthquake Engineering Software. 2023. Available online: https://www.csiamerica.com/products/etabs (accessed on 10 December 2023).
- Gonzalez, A.; Calderon, J. An Overview of the Seismic Elastic Response Spectra and Their Application According to Mexican, U.S., and International Building Codes. Appl. Sci. 2022, 12, 3472. [Google Scholar] [CrossRef]
- Costanzo, S.; D’Aniello, M.; Landolfo, R. Proposal of design rules for ductile X-CBFS in the framework of EUROCODE 8. Earthq. Eng. Struct. Dyn. 2018, 48, 124–151. [Google Scholar] [CrossRef]
- Marino, E.M. A unified approach for the design of high ductility steel frames with concentric braces in the framework of Eurocode 8. Earthq. Eng. Struct. Dyn. 2014, 43, 97–118. [Google Scholar] [CrossRef]
- Longo, A.; Montuori, R.; Piluso, V. Failure Mode Control of X-Braced Frames Under Seismic Actions. J. Earthq. Eng. 2008, 12, 728–759. [Google Scholar] [CrossRef]
- Elghazouli, A.Y. Assessment of European seismic design procedures for steel framed structures. Bull. Earthq. Eng. 2010, 8, 65–89. [Google Scholar] [CrossRef]
- Arcos-Díaz, D.; Díaz, S.A.; Pinzón, L.A.; Jesús, H.; Mora-Ortiz, R.S. Seismic performance assessment based on the interstory drift of steel building. Lat. Am. J. Solids Struct. 2022, 19, e431. [Google Scholar] [CrossRef]
- Díaz, S.A.; Pinzón, L.A.; Vargas-Alzate, Y.F.; Mora-Ortiz, R.S. Seismic Damage “Semaphore” Based on the Fundamental Period Variation: A Probabilistic Seismic Demand Assessment of Steel Moment-Resisting Frames. Buildings 2023, 13, 1009. [Google Scholar] [CrossRef]
- SASID. Seismic Design Action System. Complementary Technical Norms for the Review of the Structural Safety of Buildings of the México City. Gaceta Oficial del Gobierno de México. 2023. Available online: https://sasid.unam.mx/webNormasCDMX/ (accessed on 10 December 2023). (In Spanish).
- Formisano., A.; Nicola Chieffo, N.; Clementi, F.; Mosoarca, M. Influence of Local Site Effects on the Typological Fragility Curves for Class-Oriented Masonry Buildings in Aggregate Condition. Open Civ. Eng. J. 2021, 15, 149–164. [Google Scholar] [CrossRef]
- Formisano, A.; Landolfo, R.; Mazzolani, F.M. Robustness assessment approaches for steel framed structures under catastrophic events. Comput. Struct. 2015, 147, 216–228. [Google Scholar] [CrossRef]
- Ordaz, M.; Martinelli, F.; Aguilar, A.; Arboleda, J.; Meletti, C.; D’Amico, V. R-Crisis V20.3.0. Program for Computing Seismic Hazard. Instituto de Ingeniería de la UNAM and ERN Internacional. Available online: http://www.r-crisis.com/ (accessed on 10 December 2023).


Disclaimer/Publisher’s Note: The statements, opinions and data contained in all publications are solely those of the individual author(s) and contributor(s) and not of MDPI and/or the editor(s). MDPI and/or the editor(s) disclaim responsibility for any injury to people or property resulting from any ideas, methods, instructions or products referred to in the content. |
© 2024 by the authors. Licensee MDPI, Basel, Switzerland. This article is an open access article distributed under the terms and conditions of the Creative Commons Attribution (CC BY) license (https://creativecommons.org/licenses/by/4.0/).