Analysis of Geological Multi-Hazards in an Urban District
Abstract
1. Introduction
2. Study Area
3. Materials and Methods
3.1. Data Collection
- -
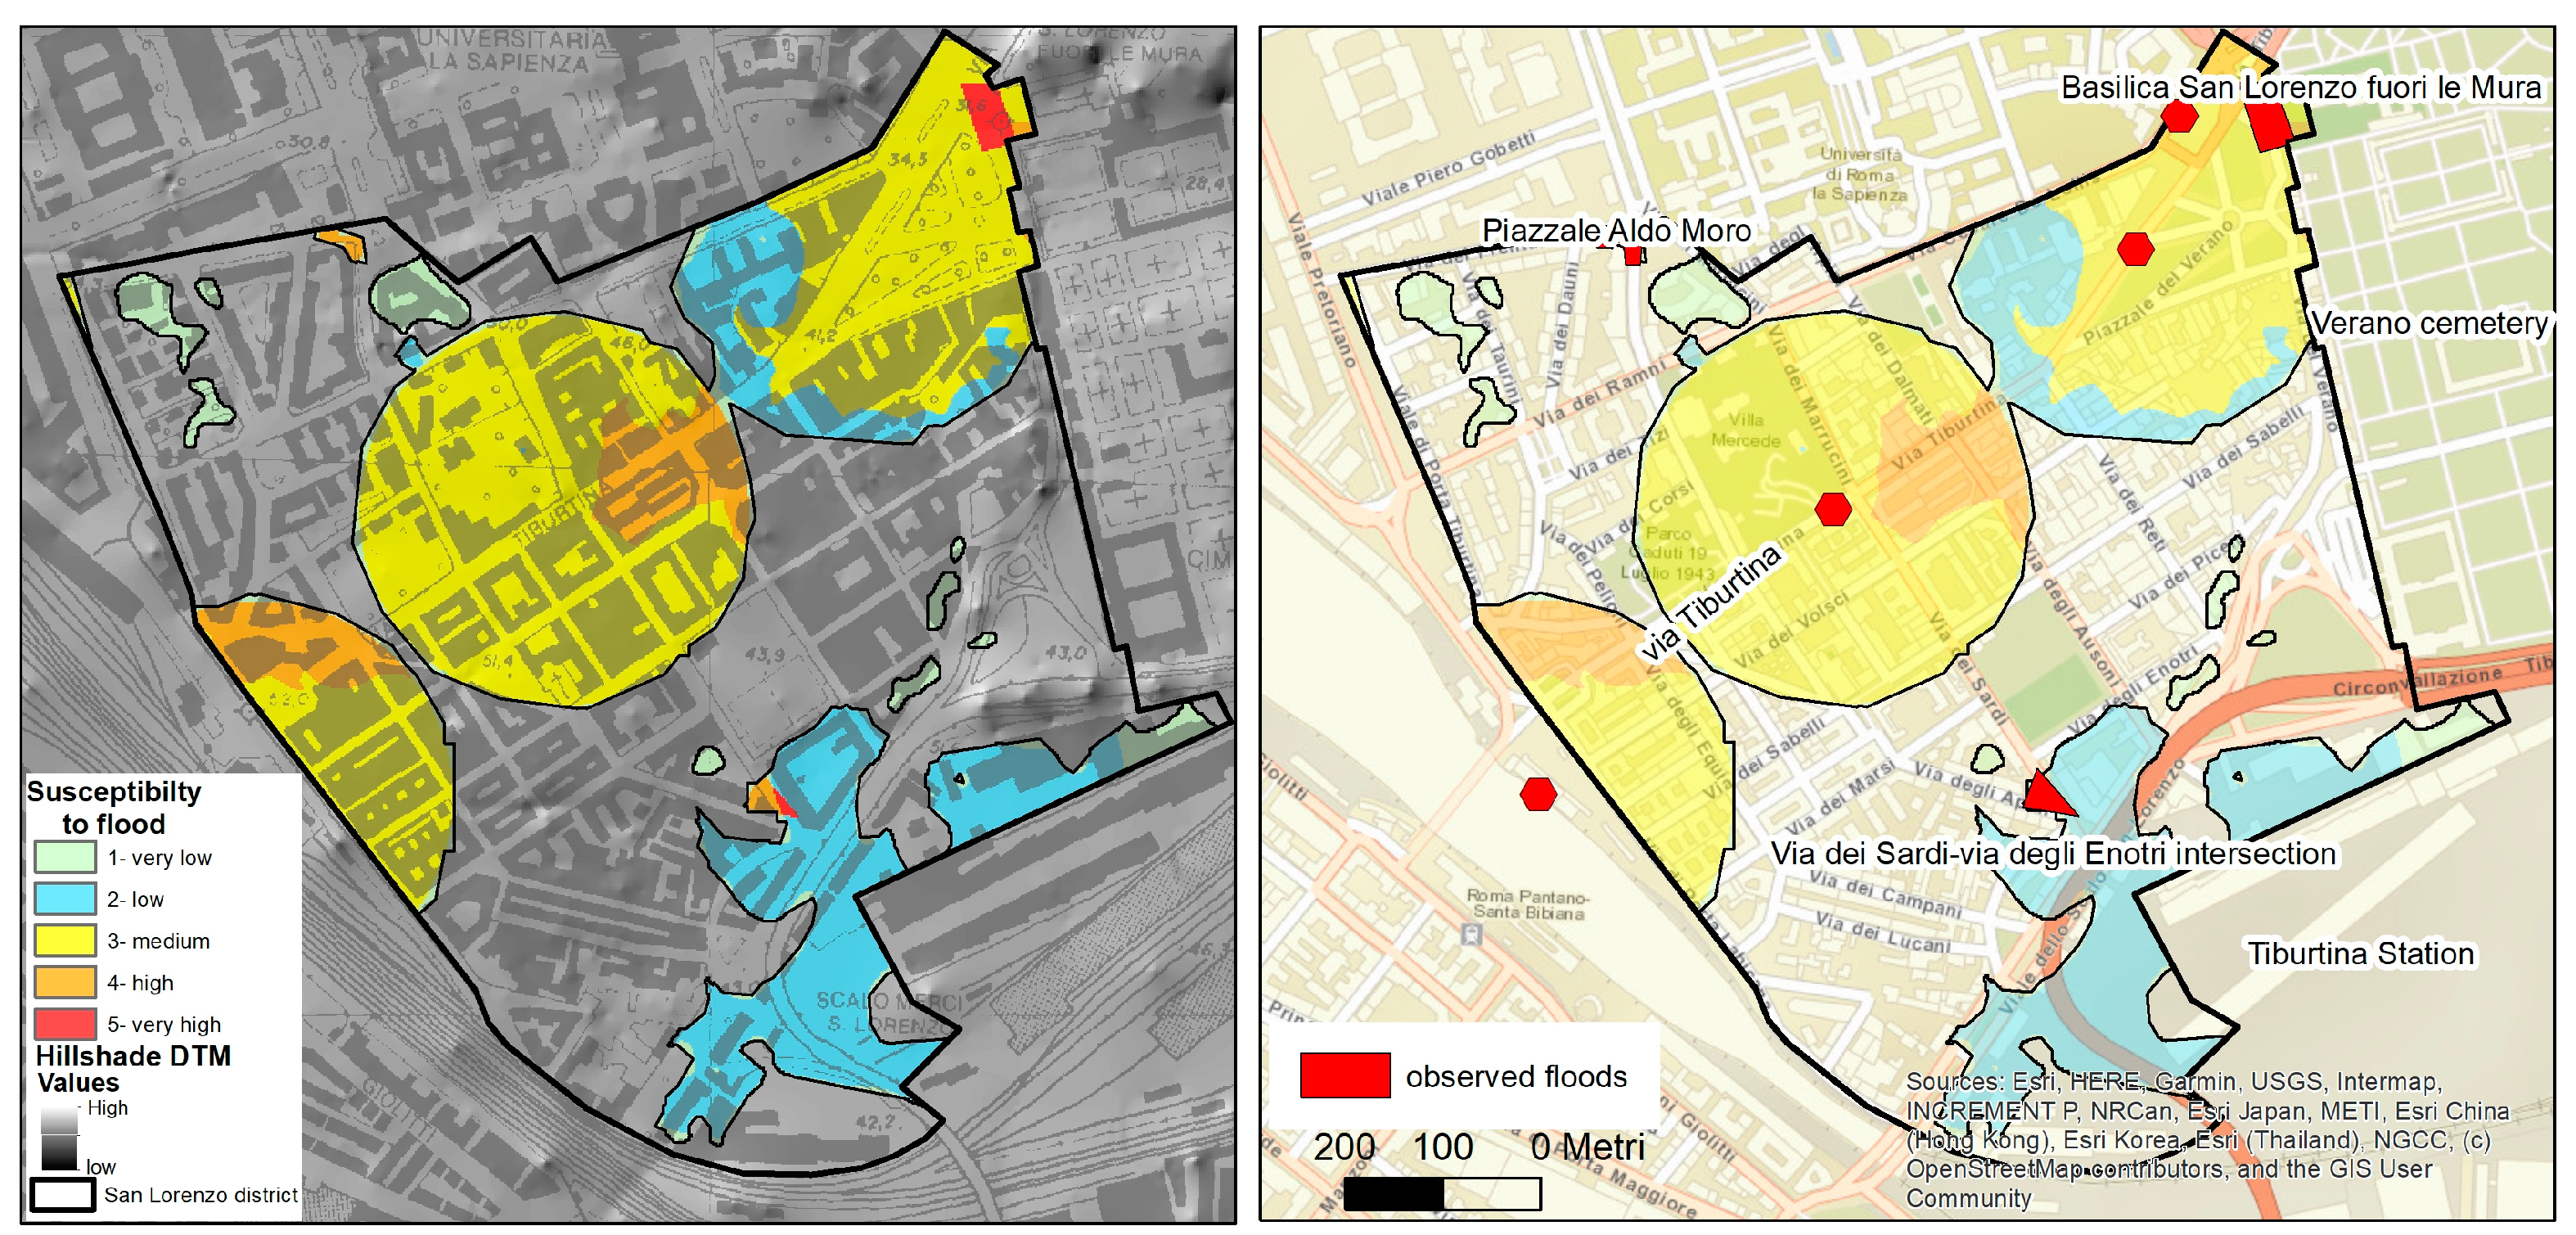
- A vector layer with polygon geometry, with floods occurring between 2004 and 2007, was recorded and published by the Civil Protection of Rome municipality (Comune di Roma, Ufficio Extradipartimentale della Protezione Civile, 2008).
- -
- Observed floods with point geometry occurred between 2001 and 2014, derived from the Fire Department, Municipal Police, and web media.
3.2. Topographic Analysis
3.3. Geological, Hydrological, and Hydrogeological Reconstruction
3.4. Single-Hazard Analysis
3.4.1. Pluvial Flood Susceptibility Assessment
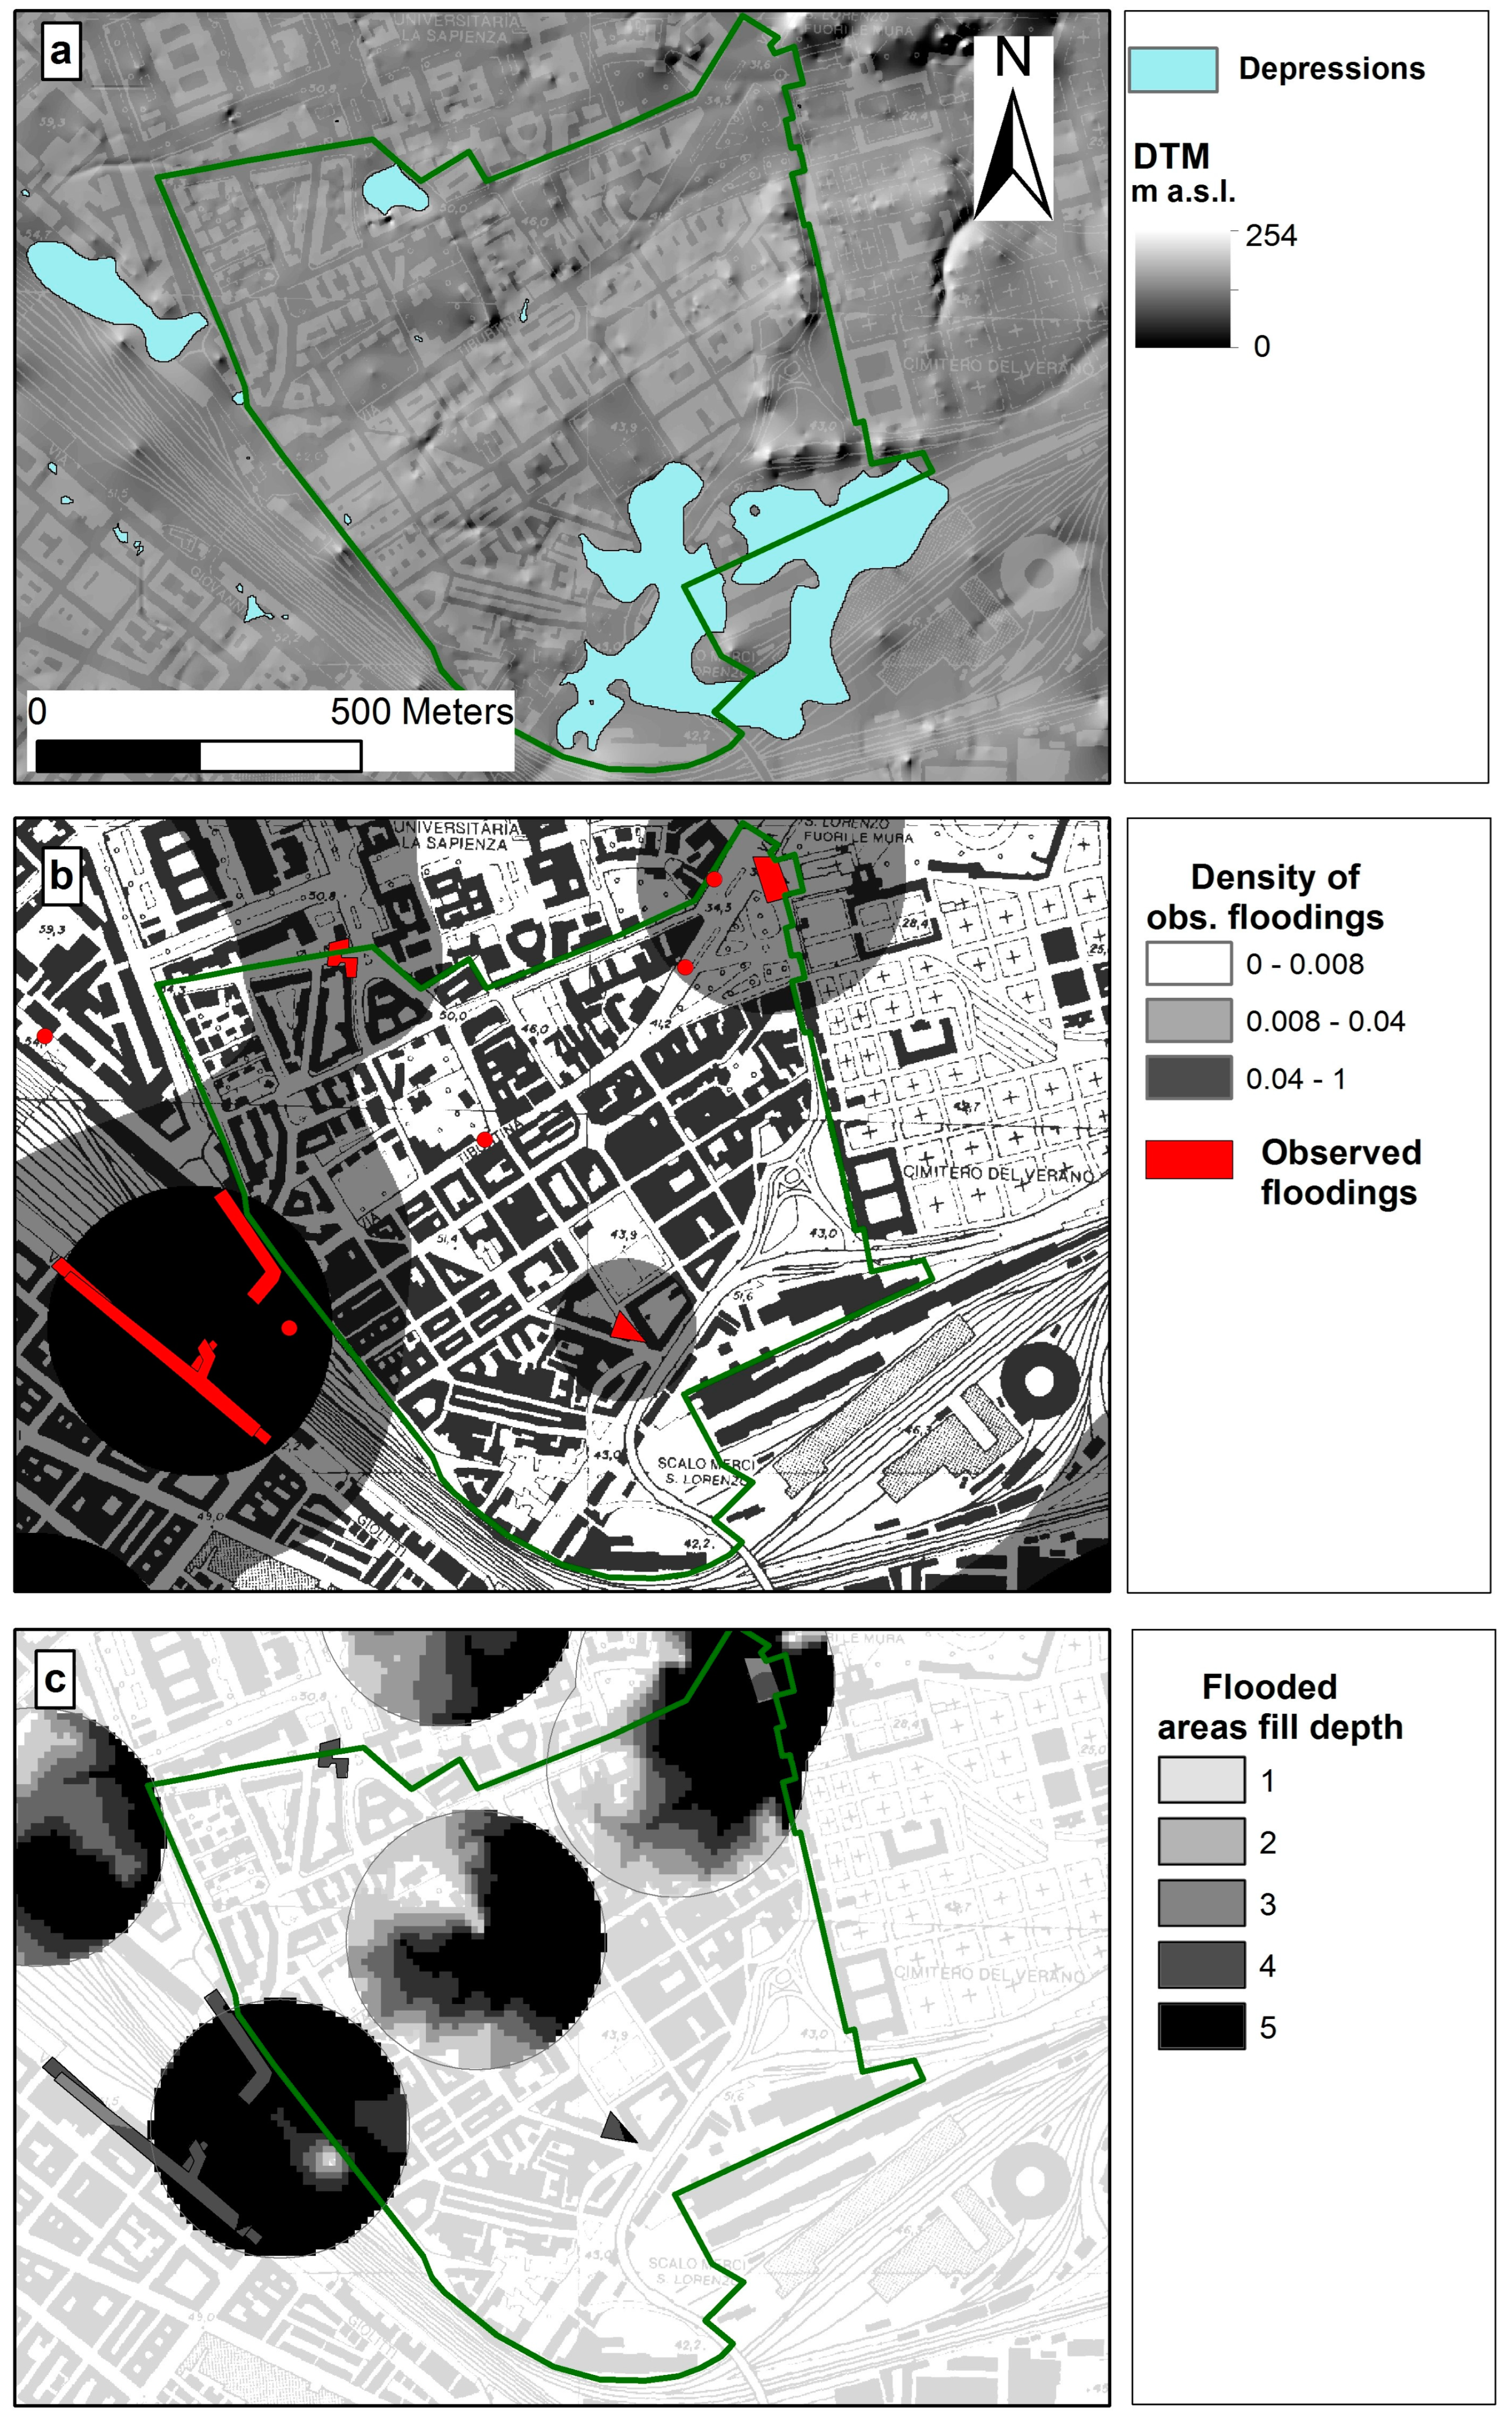
- (A)
- detection and selection of topographic depression from the DTM;
- (B)
- processing of observed floodings;
- (C)
- weighting depressions by the flood density;
- (D)
- weighting the flooded areas by fill depth;
- (E)
- combining a flood area fill depth grid and a weighted depression grid to obtain the susceptibility map of pluvial flood-prone areas.
- A
- Detection and selection of topographic depression from the DTM
- B
- Processing of observed flooding
- C
- Weighting the depression layer by the flood density
- D
- Weighting the flooded areas by fill depth
- E
- Combining the fill depth grid and the weighted depression grid to obtain a map of the susceptibility to a pluvial flood
3.4.2. Sinkhole Susceptibility Assessment
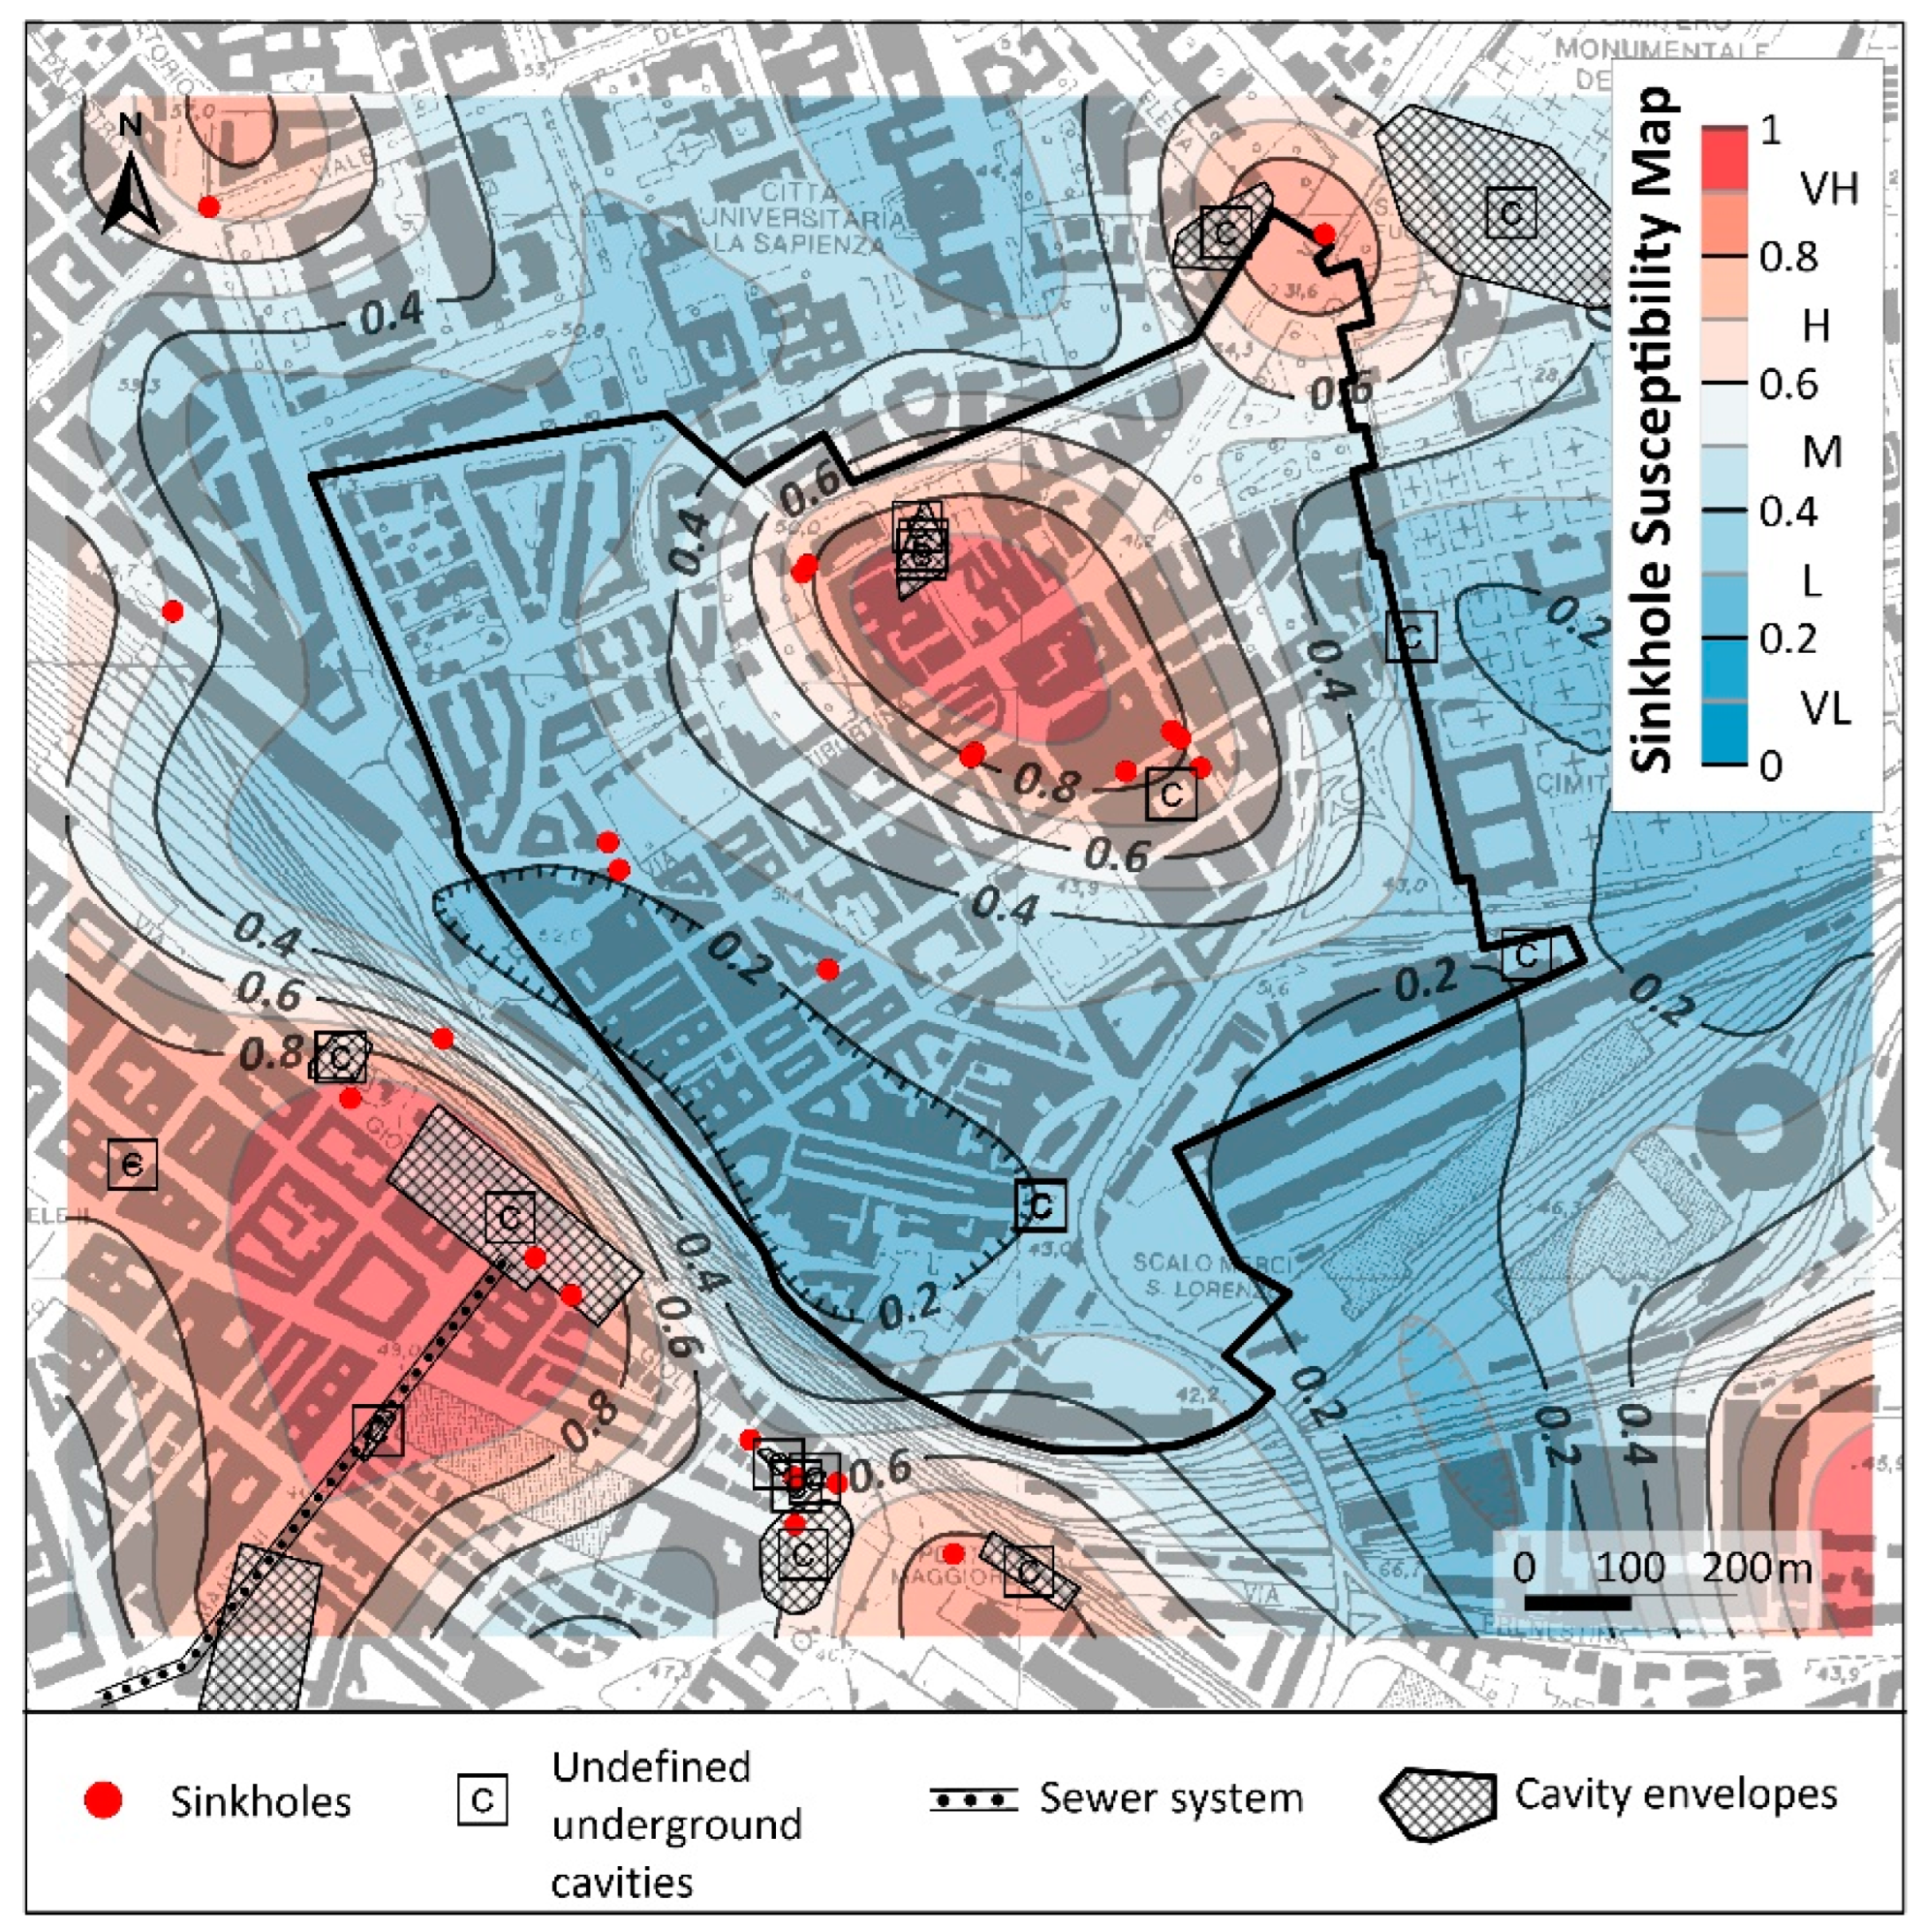
- The anthropogenic sinkhole occurred in the Rome area in the period 1960–2021 (a period of increased modern urban expansion) (Figure 3).
- The identification of environmental spatial factors (recent and past) (e.g., the morphological-physiographic and geological characteristics of the Rome area) and of the anthropic aspects (e.g., the presence of underground cavities and the sewer network) that constitute the predisposing factors.
- The application of the maximum entropy technique to derive a probabilistic model applicable in other similar areas, to provide a susceptibility map of the study area, and to evaluate the most important predisposing factors able to trigger the phenomenon. (https://www.isprambiente.gov.it/en/archive/news-and-other-events/ispra-news/files2022/attivita/mappa-roma.jpg, accessed on 22 January 2024. Unlike machine learning classification and regression techniques (such as the Random Forest), the application of the MaxEnt algorithm requires only the presence of event locations (e.g., Presence-only Prediction), so the response variable does not have to be a binary variable of type 0/1 (i.e., presence/absence). In this work, predictors and final susceptibility maps were re-elaborated for the San Lorenzo area according to raster maps with a 10 × 10 m grid.
- -
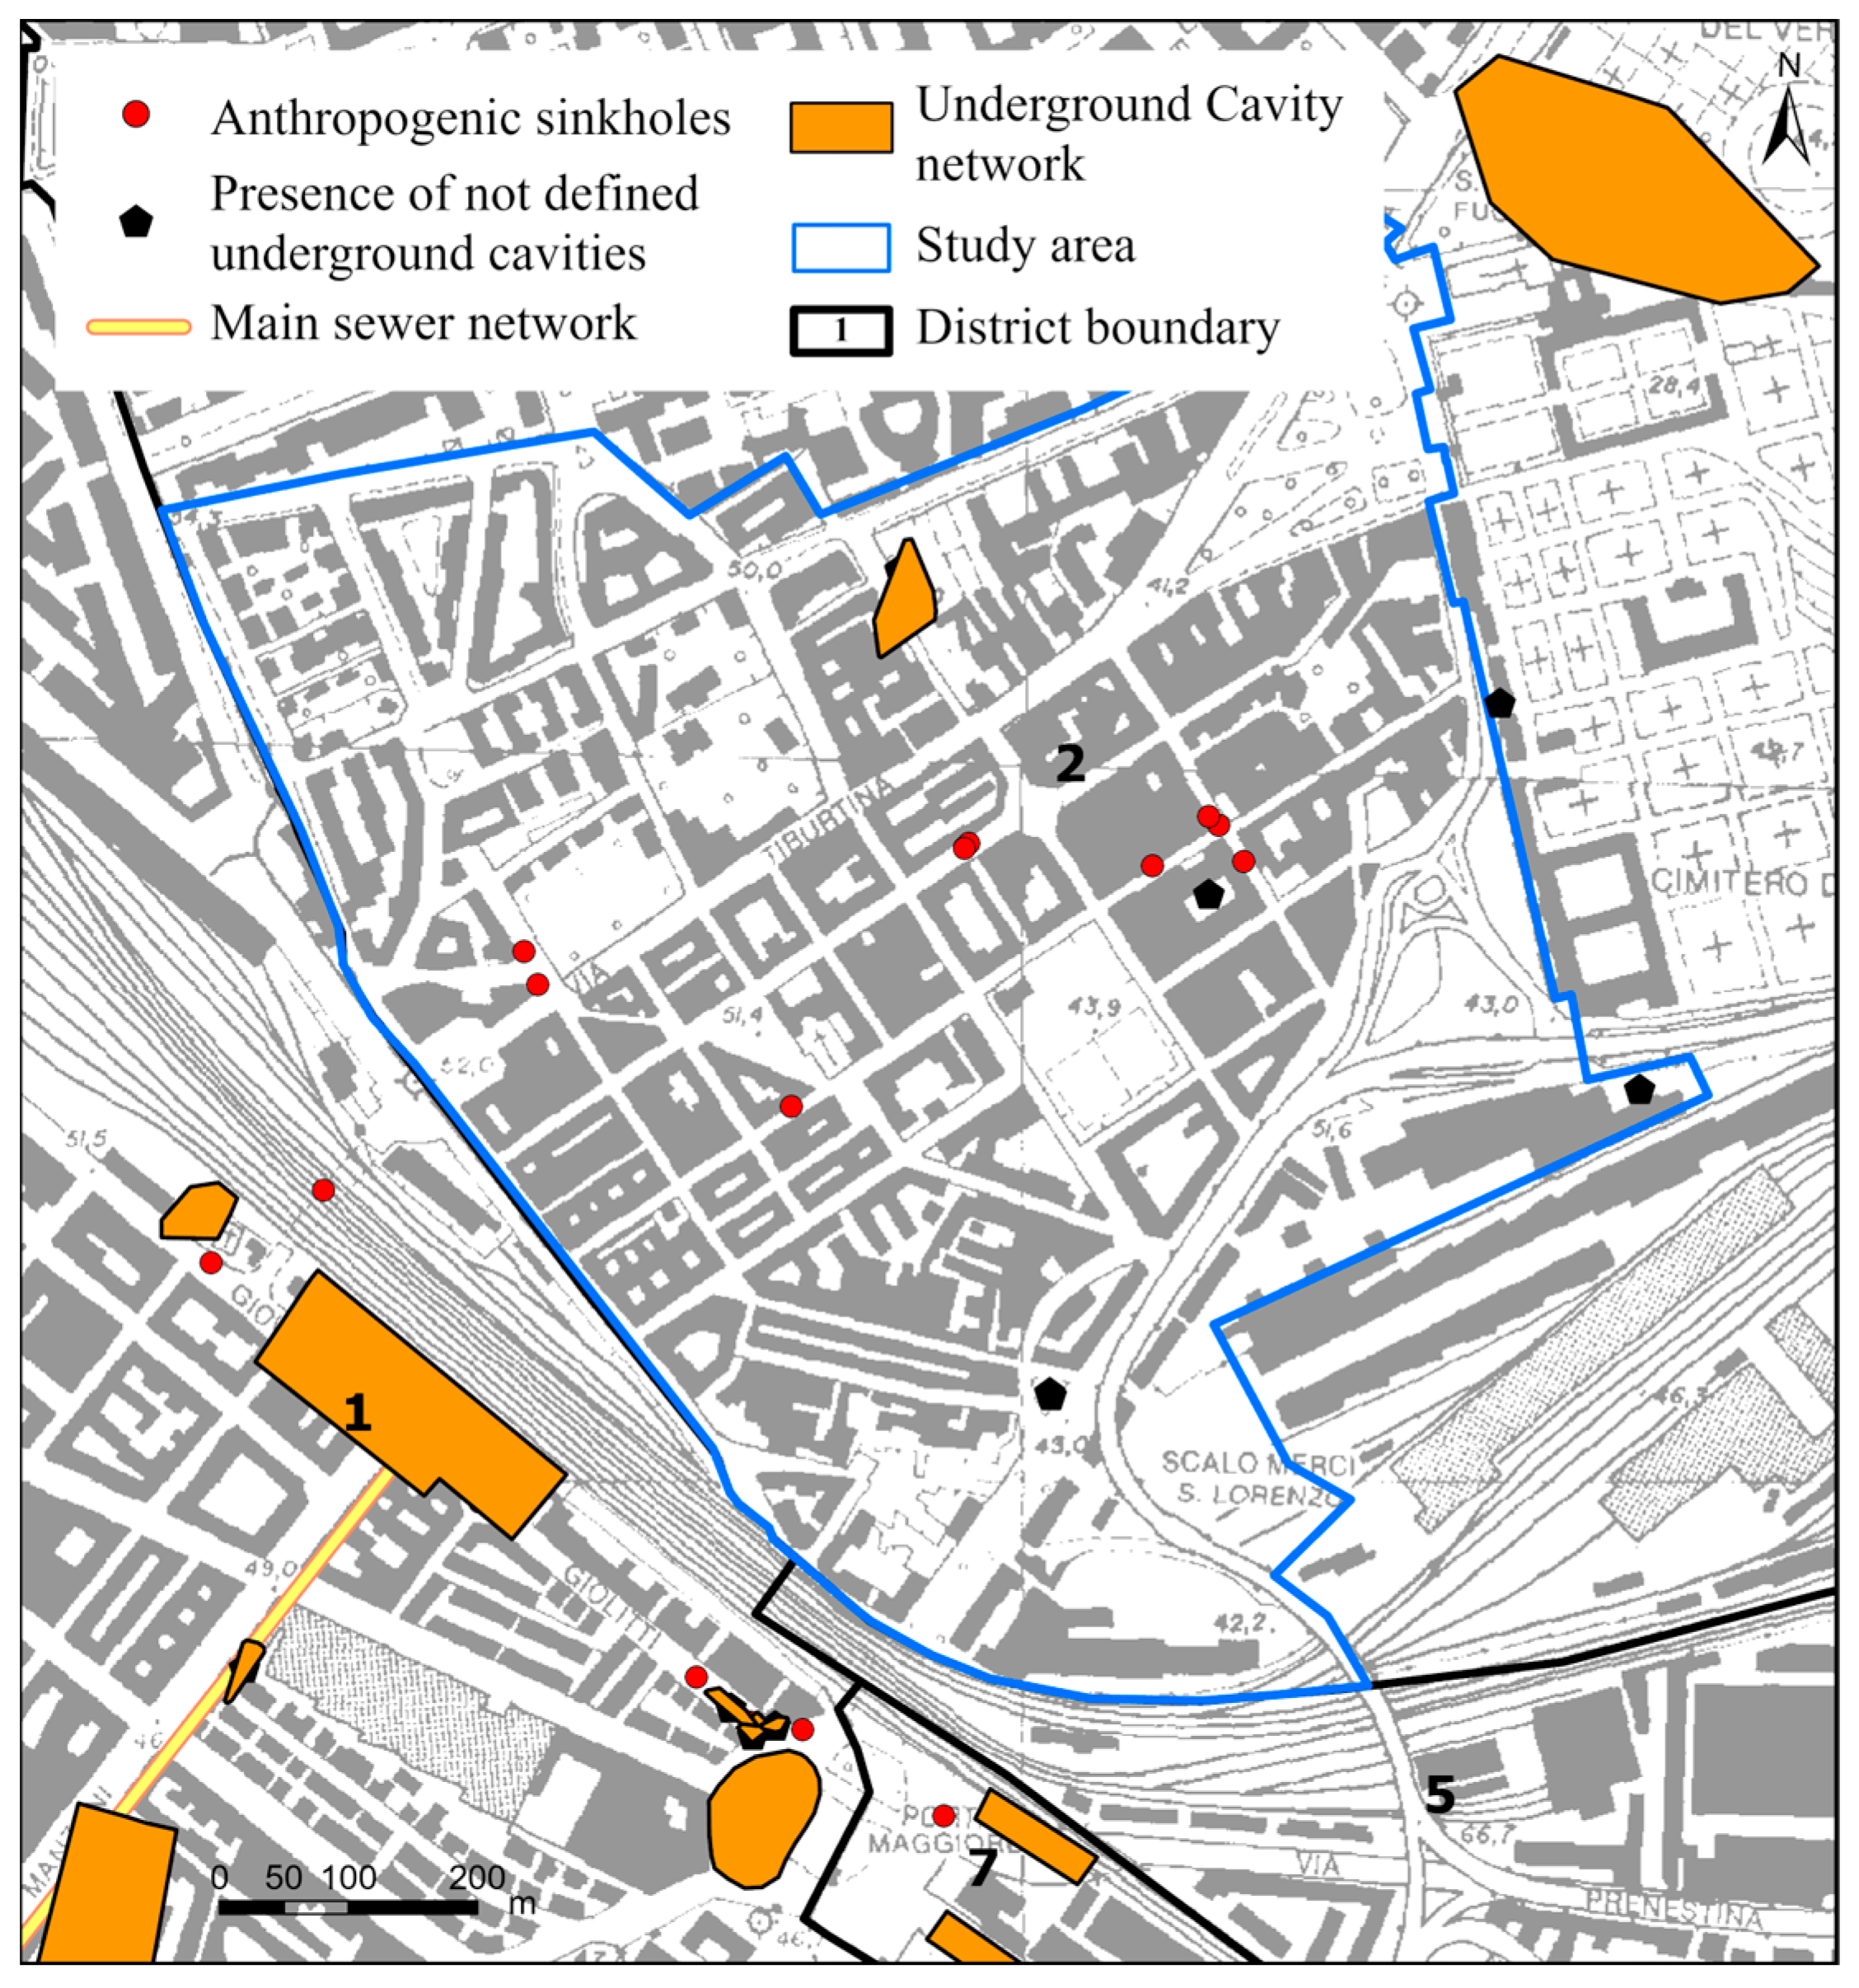
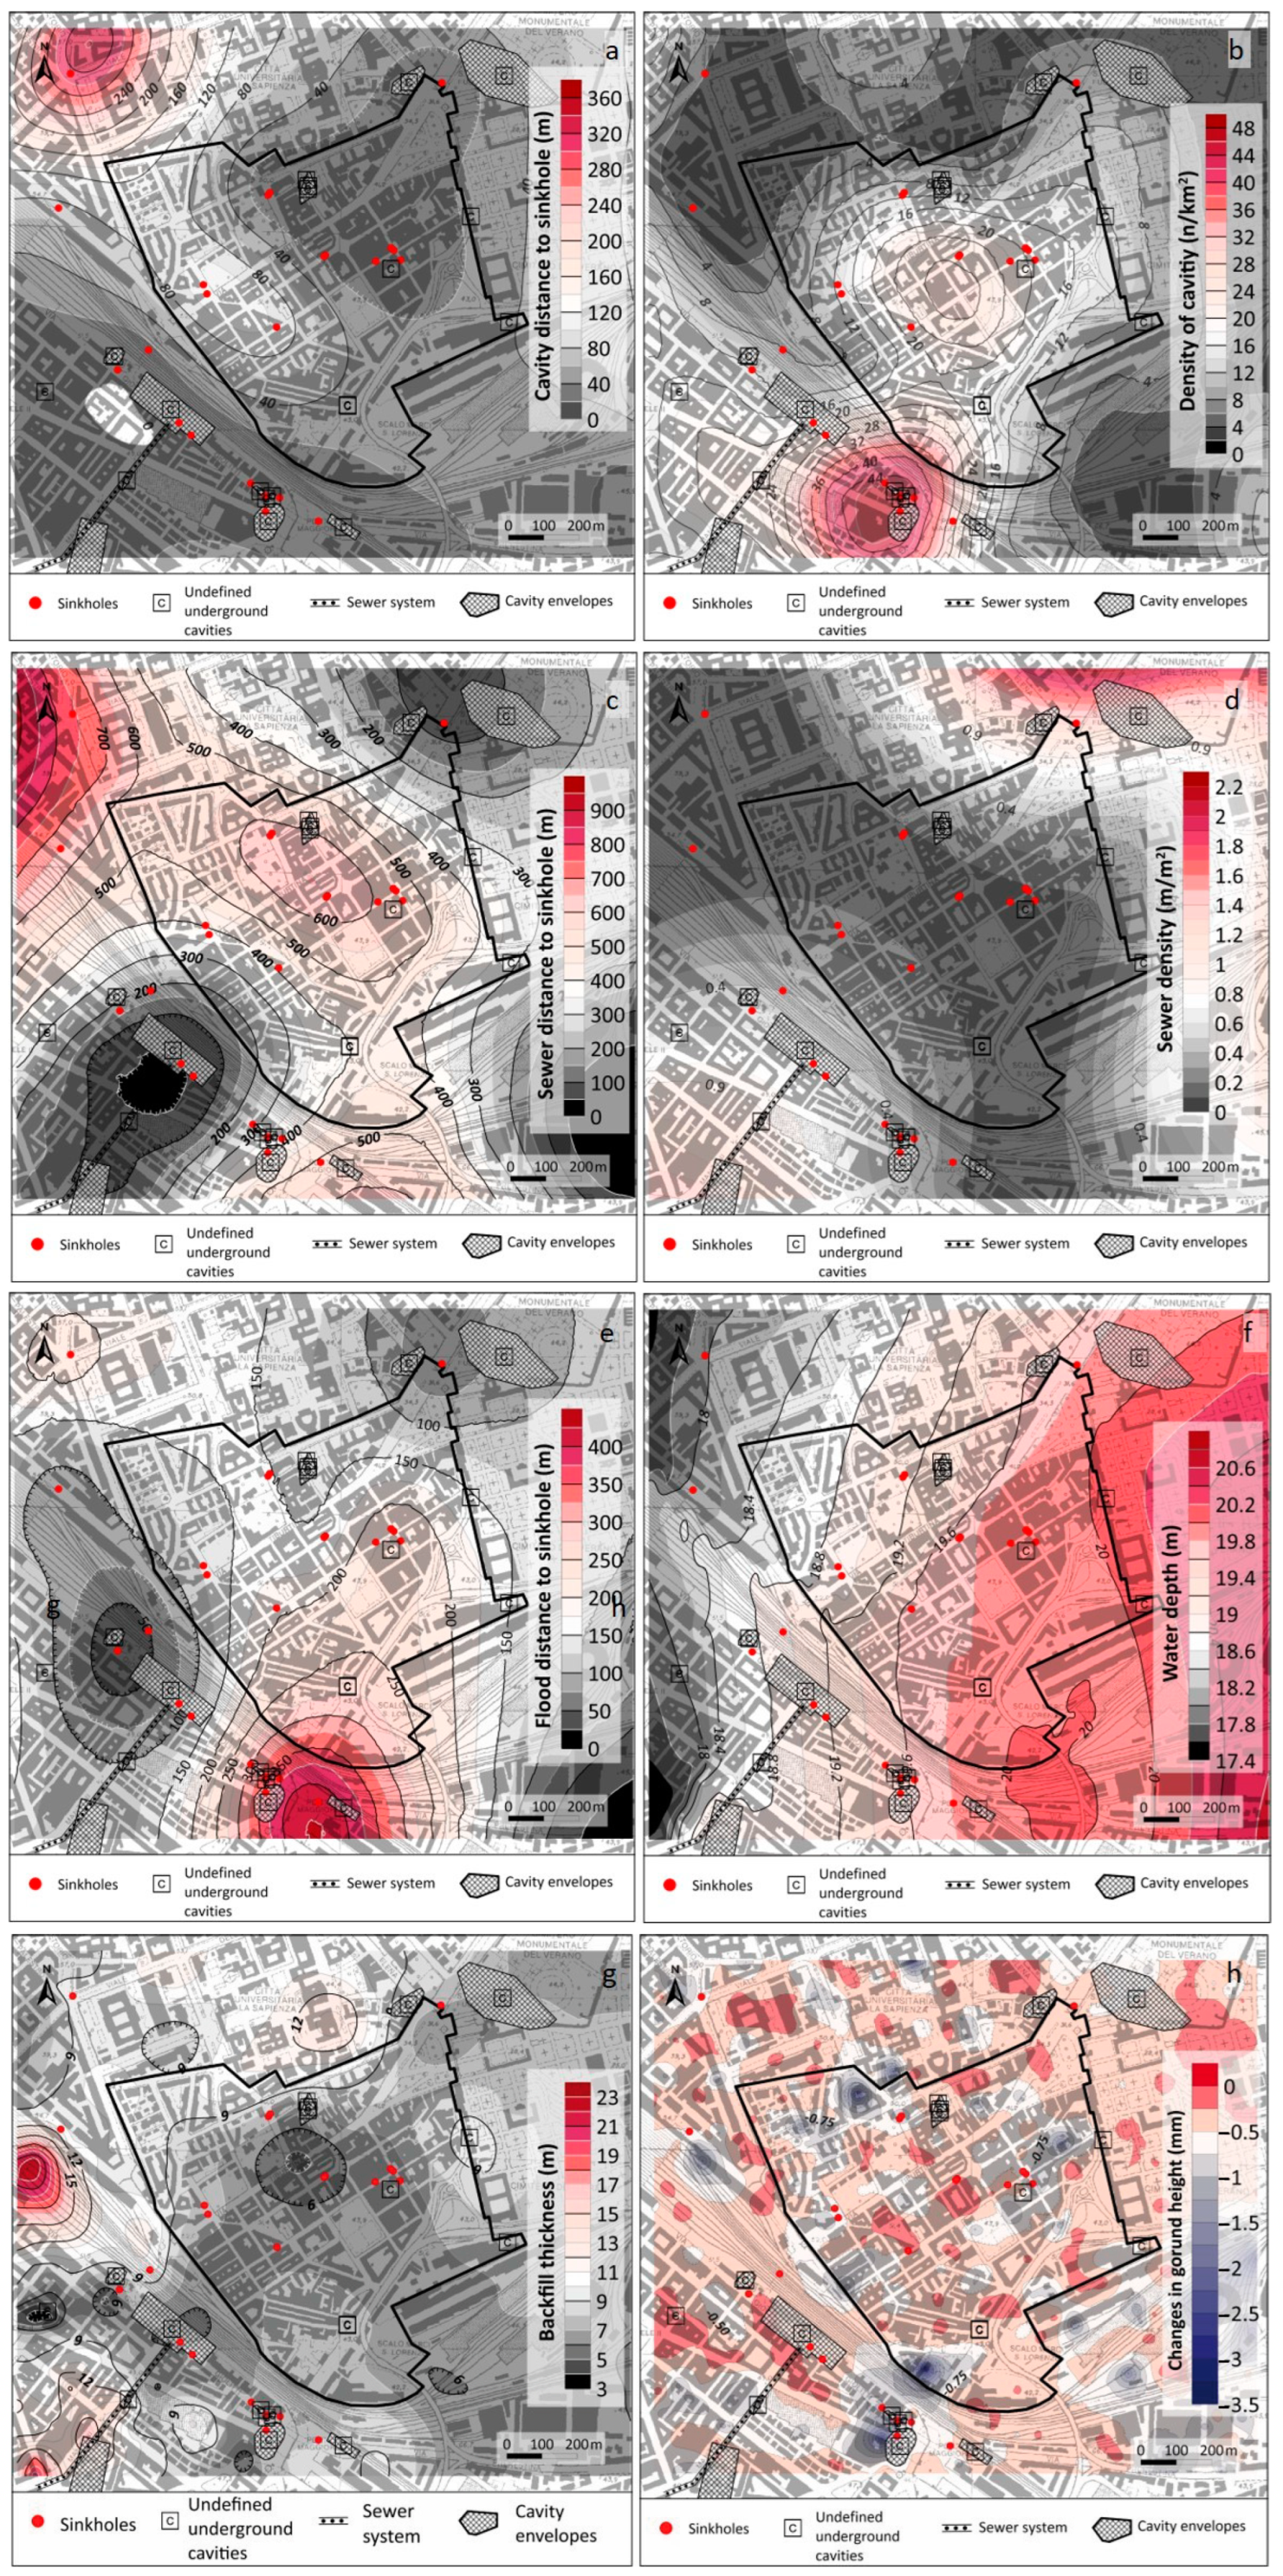
- Sewer network (Figure 4). The location of the sewer network (provided by Roma Capitale) was included in the model as a further cause of sinkhole formation due to erosive processes of water exfiltration and infiltration due to faults, leaks, and dysfunctions of the hydraulic network, or during extreme rainfall events, which can cause surface subsidence phenomena up to the formation of sinkholes. As part of the susceptibility model, the distance between the sinkholes and the nearest collector was considered; a buffer zone of 20 m was applied to the collectors.
- -
- The distribution of the underground cavities reported at the ISPRA website (https://www.isprambiente.gov.it/it/attivita/suolo-e-territorio/cartografia/carta-delle-cavita-sotterranee-di-roma (accessed on 22 January 2024)) (Figure 4). The types of cavities that have been found in the investigated area can be classified as catacombs, single hypogea, tunnels, and bunkers [65,66]. As part of the Geographical Information System for the city of Rome, the cavities were represented in point geometry information layers, where the underground envelope of the cavity is unknown, and polygonal geometry layers, where the possibility of carrying out inspections by speleological associations allowed the reconstruction of the underground geometry of the cavity. Within the framework of the susceptibility model, the underground cavity information layers were entered in the form of a density map for point cavities and as a distance between the sinkhole and the nearest cavity.
- -
- Lithology is an intrinsic predisposing factor in the urban area of Rome closely linked to the presence of underground cavities (catacombs, quarries, tunnels, etc.) that generally involve the Pleistocene pyroclastic pozzolanic and tufaceous deposits of the Albani Hills Volcanic District and, subordinately (on the hydrographic right of the Tiber), the volcanic rocks of the Sabatini Mountains Volcanic District and the Pleistocene sedimentary formations (sands and gravels of the Ponte Galeria and Santa Cecilia Units) [46,47,67,68,69]. The various lithologies of the litho-technical map derived from the geological map of Rome (scale 1:50,000) were grouped into 5 classes, with a score ranging from 1 to 5, based on the most quarried lithologies and the number of cavities occurring in a given lithology.
- -
- Backfill thickness was obtained from [69] (Figure 4g). The millennia-long history of human activity in the territory of Rome has strongly reworked the topography by filling and/or obliterating river valleys, often modifying their original drainage, modifying the slopes of hillsides, building roads, extracting material from the subsoil, etc. All these activities have inevitably created a type of anthropogenic deposit known as backfill that constitutes a true “geological body” as they are constantly superimposed on the natural soil. Due to its intrinsic characteristics, the backfill is made up of very heterogeneous material with poor mechanical properties and can, therefore, be considered one of the geological factors that may condition the occurrence of sinkhole phenomena. In particular, the backfill thickness can provide important information, especially in the case of sinkholes caused by the action of fluid circulation in the subsurface [37,69]. The map of the thickness of the slopes was obtained by reprocessing the data reported in [69] with 50 × 50 m resolution. In the study area, the backfill thickness varies between 0 and 36 m, with a mean value of 8 m.
- -
- Satellite data (INSAR) (Figure 4h) allows the analysis of ground movements (subsidence/elevation) detected by PS (Persistent Scatterers) radar benchmarks in terms of spatial and temporal velocity patterns (mm/year). The data analysis can support the assessment of subsidence rates with millimeter accuracy over time. The analysis was performed on INSAR data provided by the Ministry of Ecological Transition (formerly the Ministry of the Environment) for the period 2005–2020. INSAR data were processed using Simple Kriging (SK) to obtain an estimated map of the subsidence velocities at a 50 × 50 m resolution.
- -
- Floodings distribution map (#732) is reported in [21] (Figure 4b). In the past 15 years, an increase in short-lived but heavy rainfall events (>40 mm/h) has been observed. The high susceptibility of the urban area of Rome to flooding due to heavy rainfall events is mainly due to the malfunctioning, undersized, or even absent drainage network (especially in most peripheral districts). The natural drainage network, often obliterated, is in many areas replaced by the sewer system, which is often insufficient to support the volume of water in the event of extreme rainfall events. The stagnation of undisposed water at the surface is a factor that can increase the infiltration of water into the subsoil, resulting in the same consequences as described by the sewer collectors. The database of flooded areas in the period 2001–2014 refers to [22].
- -
- Depth of the water table [70] (Figure 4f). In urban areas, groundwater level can condition and predispose the territory to sinkhole formation in the following cases: (i) the seasonal fluctuation of the water table level (generally lowering) can cause a loss of support for the fine material in the rocky spaces to the point of giving rise to collapse phenomena on the surface; (ii) the modification of the gradient of the water table level (due to the removal or introduction of water into the hydrogeological system) can cause a rapid washout of the loose material, causing the collapse of the surface. Piezometric data referring to the depth of the surface water table in m a.s.l. were obtained from the Hydrogeological Map of the City of Rome [70,71].
3.4.3. Multi-Hazard Assessment
4. Results
4.1. DTM Reconstruction and Map of the Anthropic Backfill
4.2. Geological Reconstruction
4.3. Hydrology and Hydrogeology
4.4. Map of the Susceptibility to Flood
4.5. Map of the Susceptibility to Sinkhole
4.6. Multi-Hazard Map
- -
- Fifty percent of buildings are in flood susceptibility areas (6215 inhabitants); between these, 34% (2770 inhabitants) are in classes high and very high.
- -
- Hundred percent of buildings are in sinkhole susceptibility areas (9200 inhabitants); between these, 26% are in classes high and very high.
- -
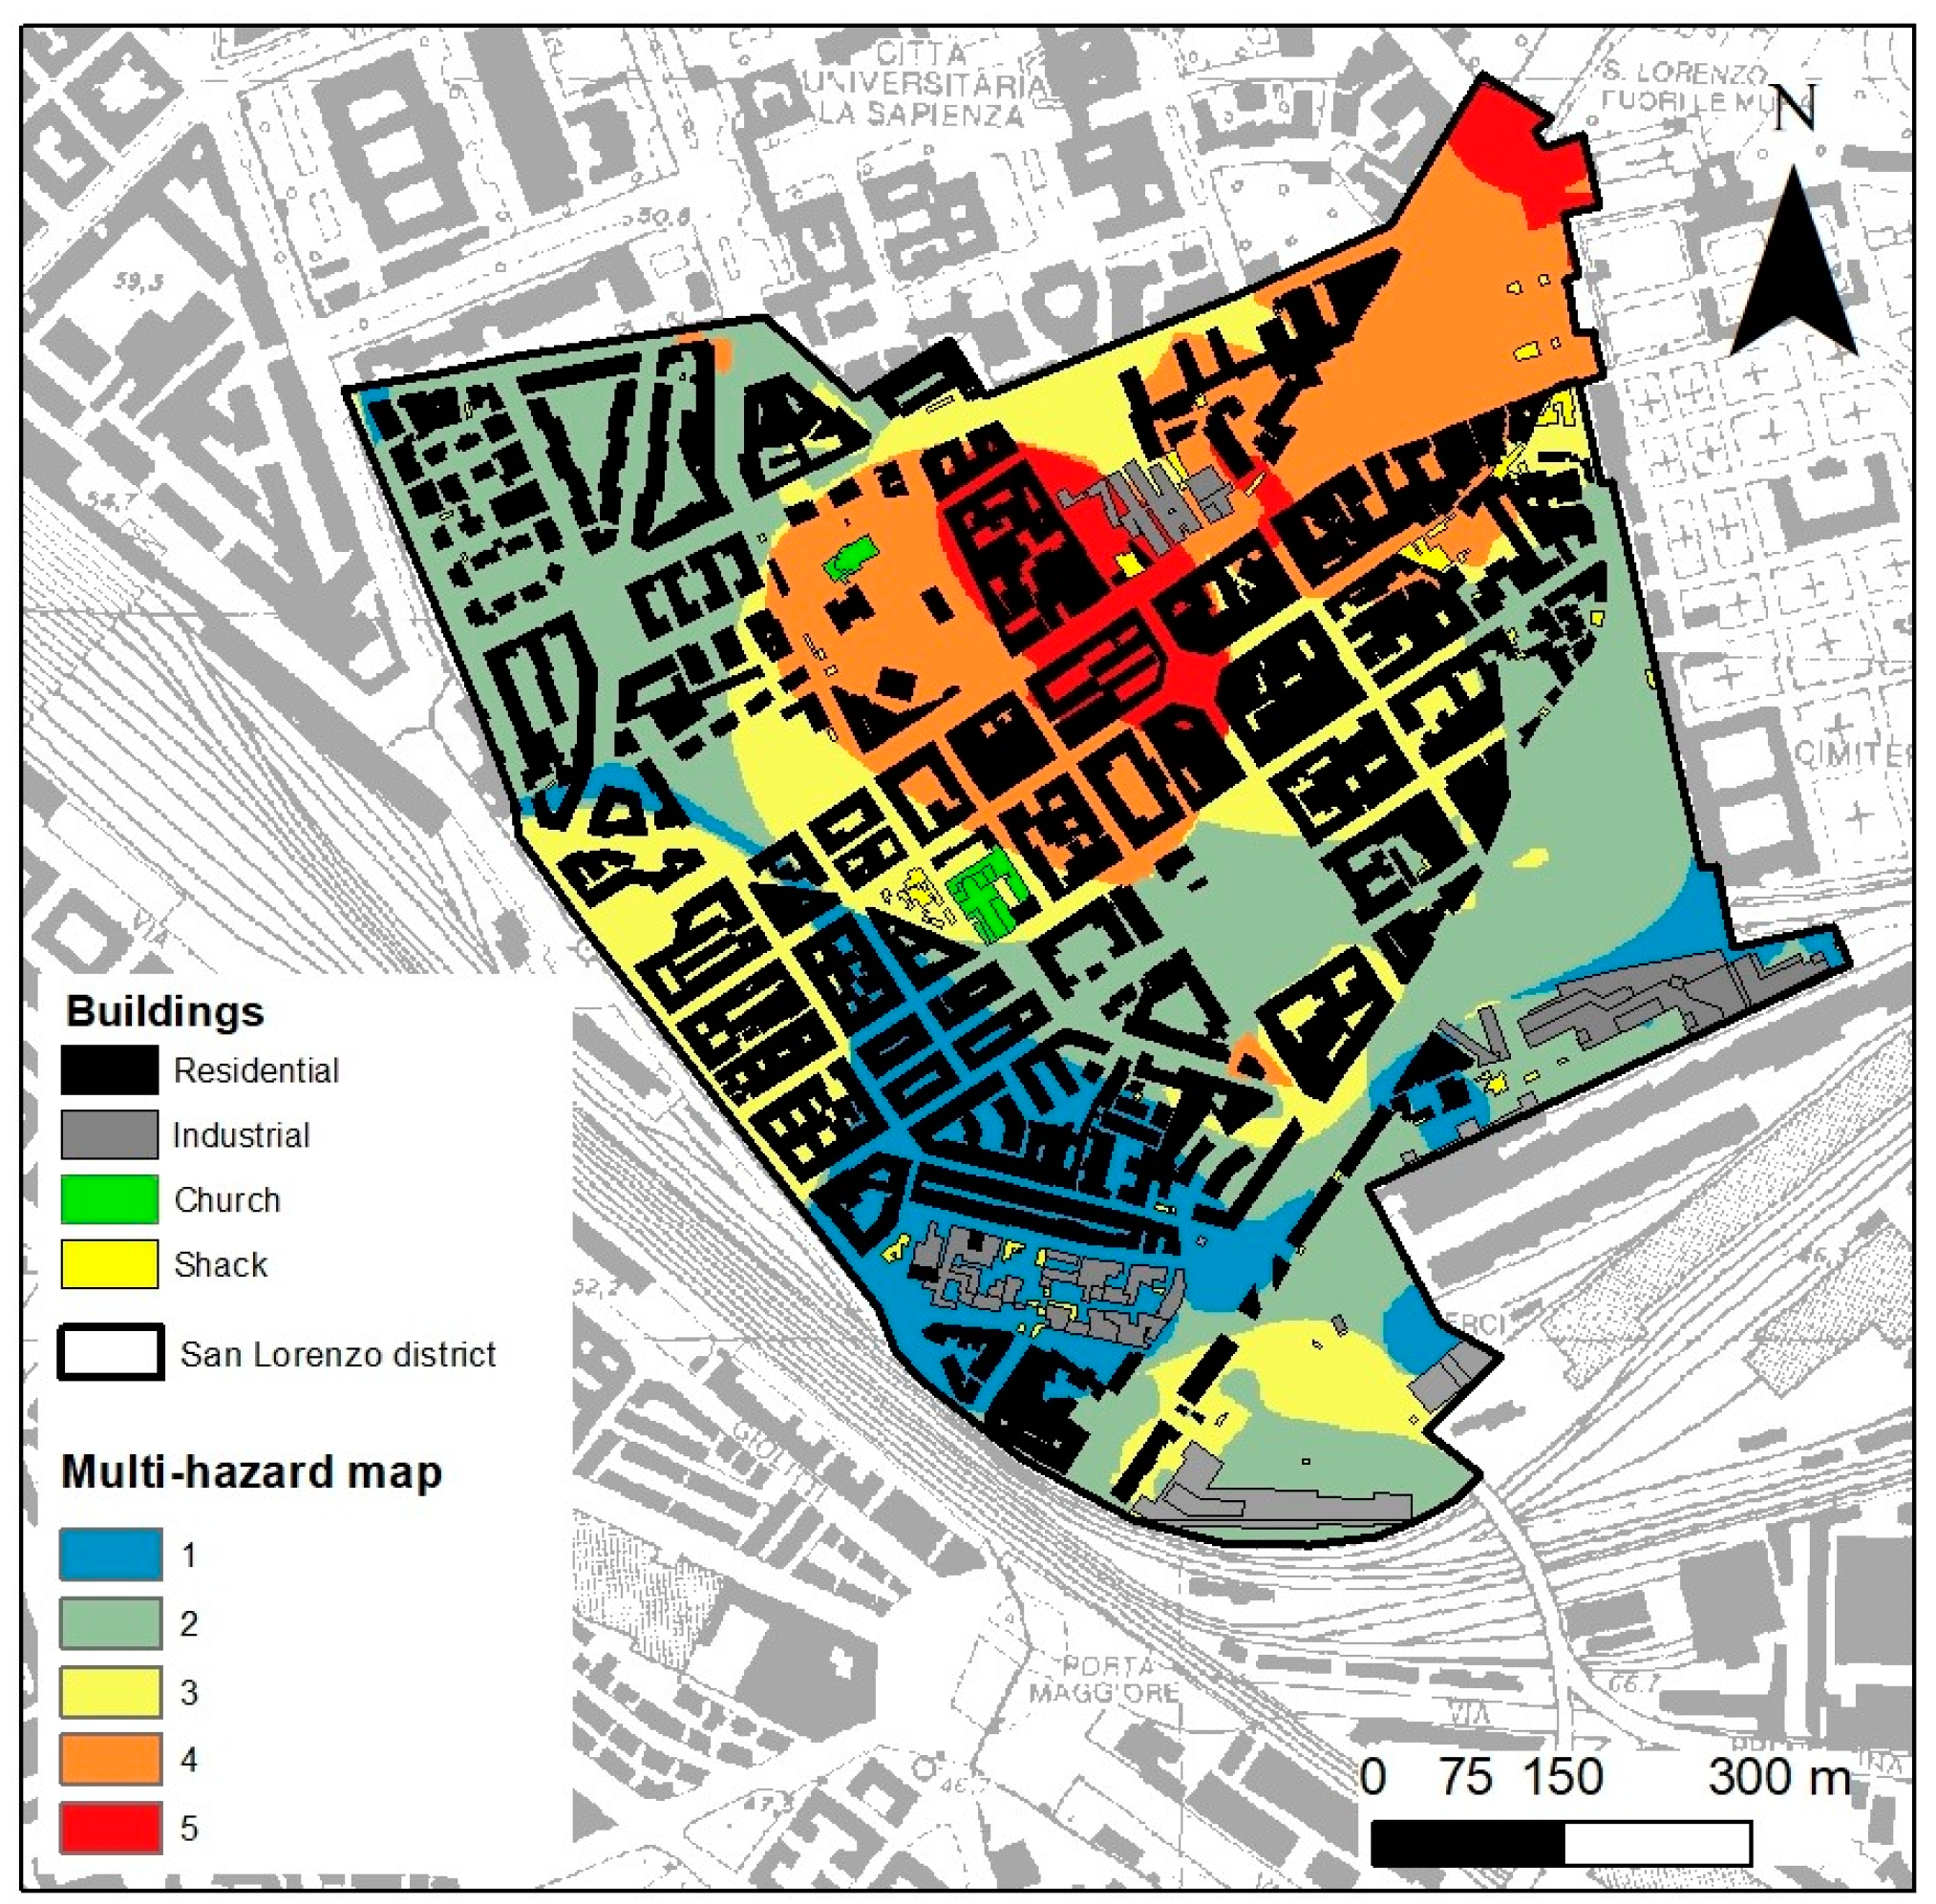
- The use of buildings is mostly residential, but there are also a few industrial and railway buildings, two churches, and some shacks (Figure 15);
- -
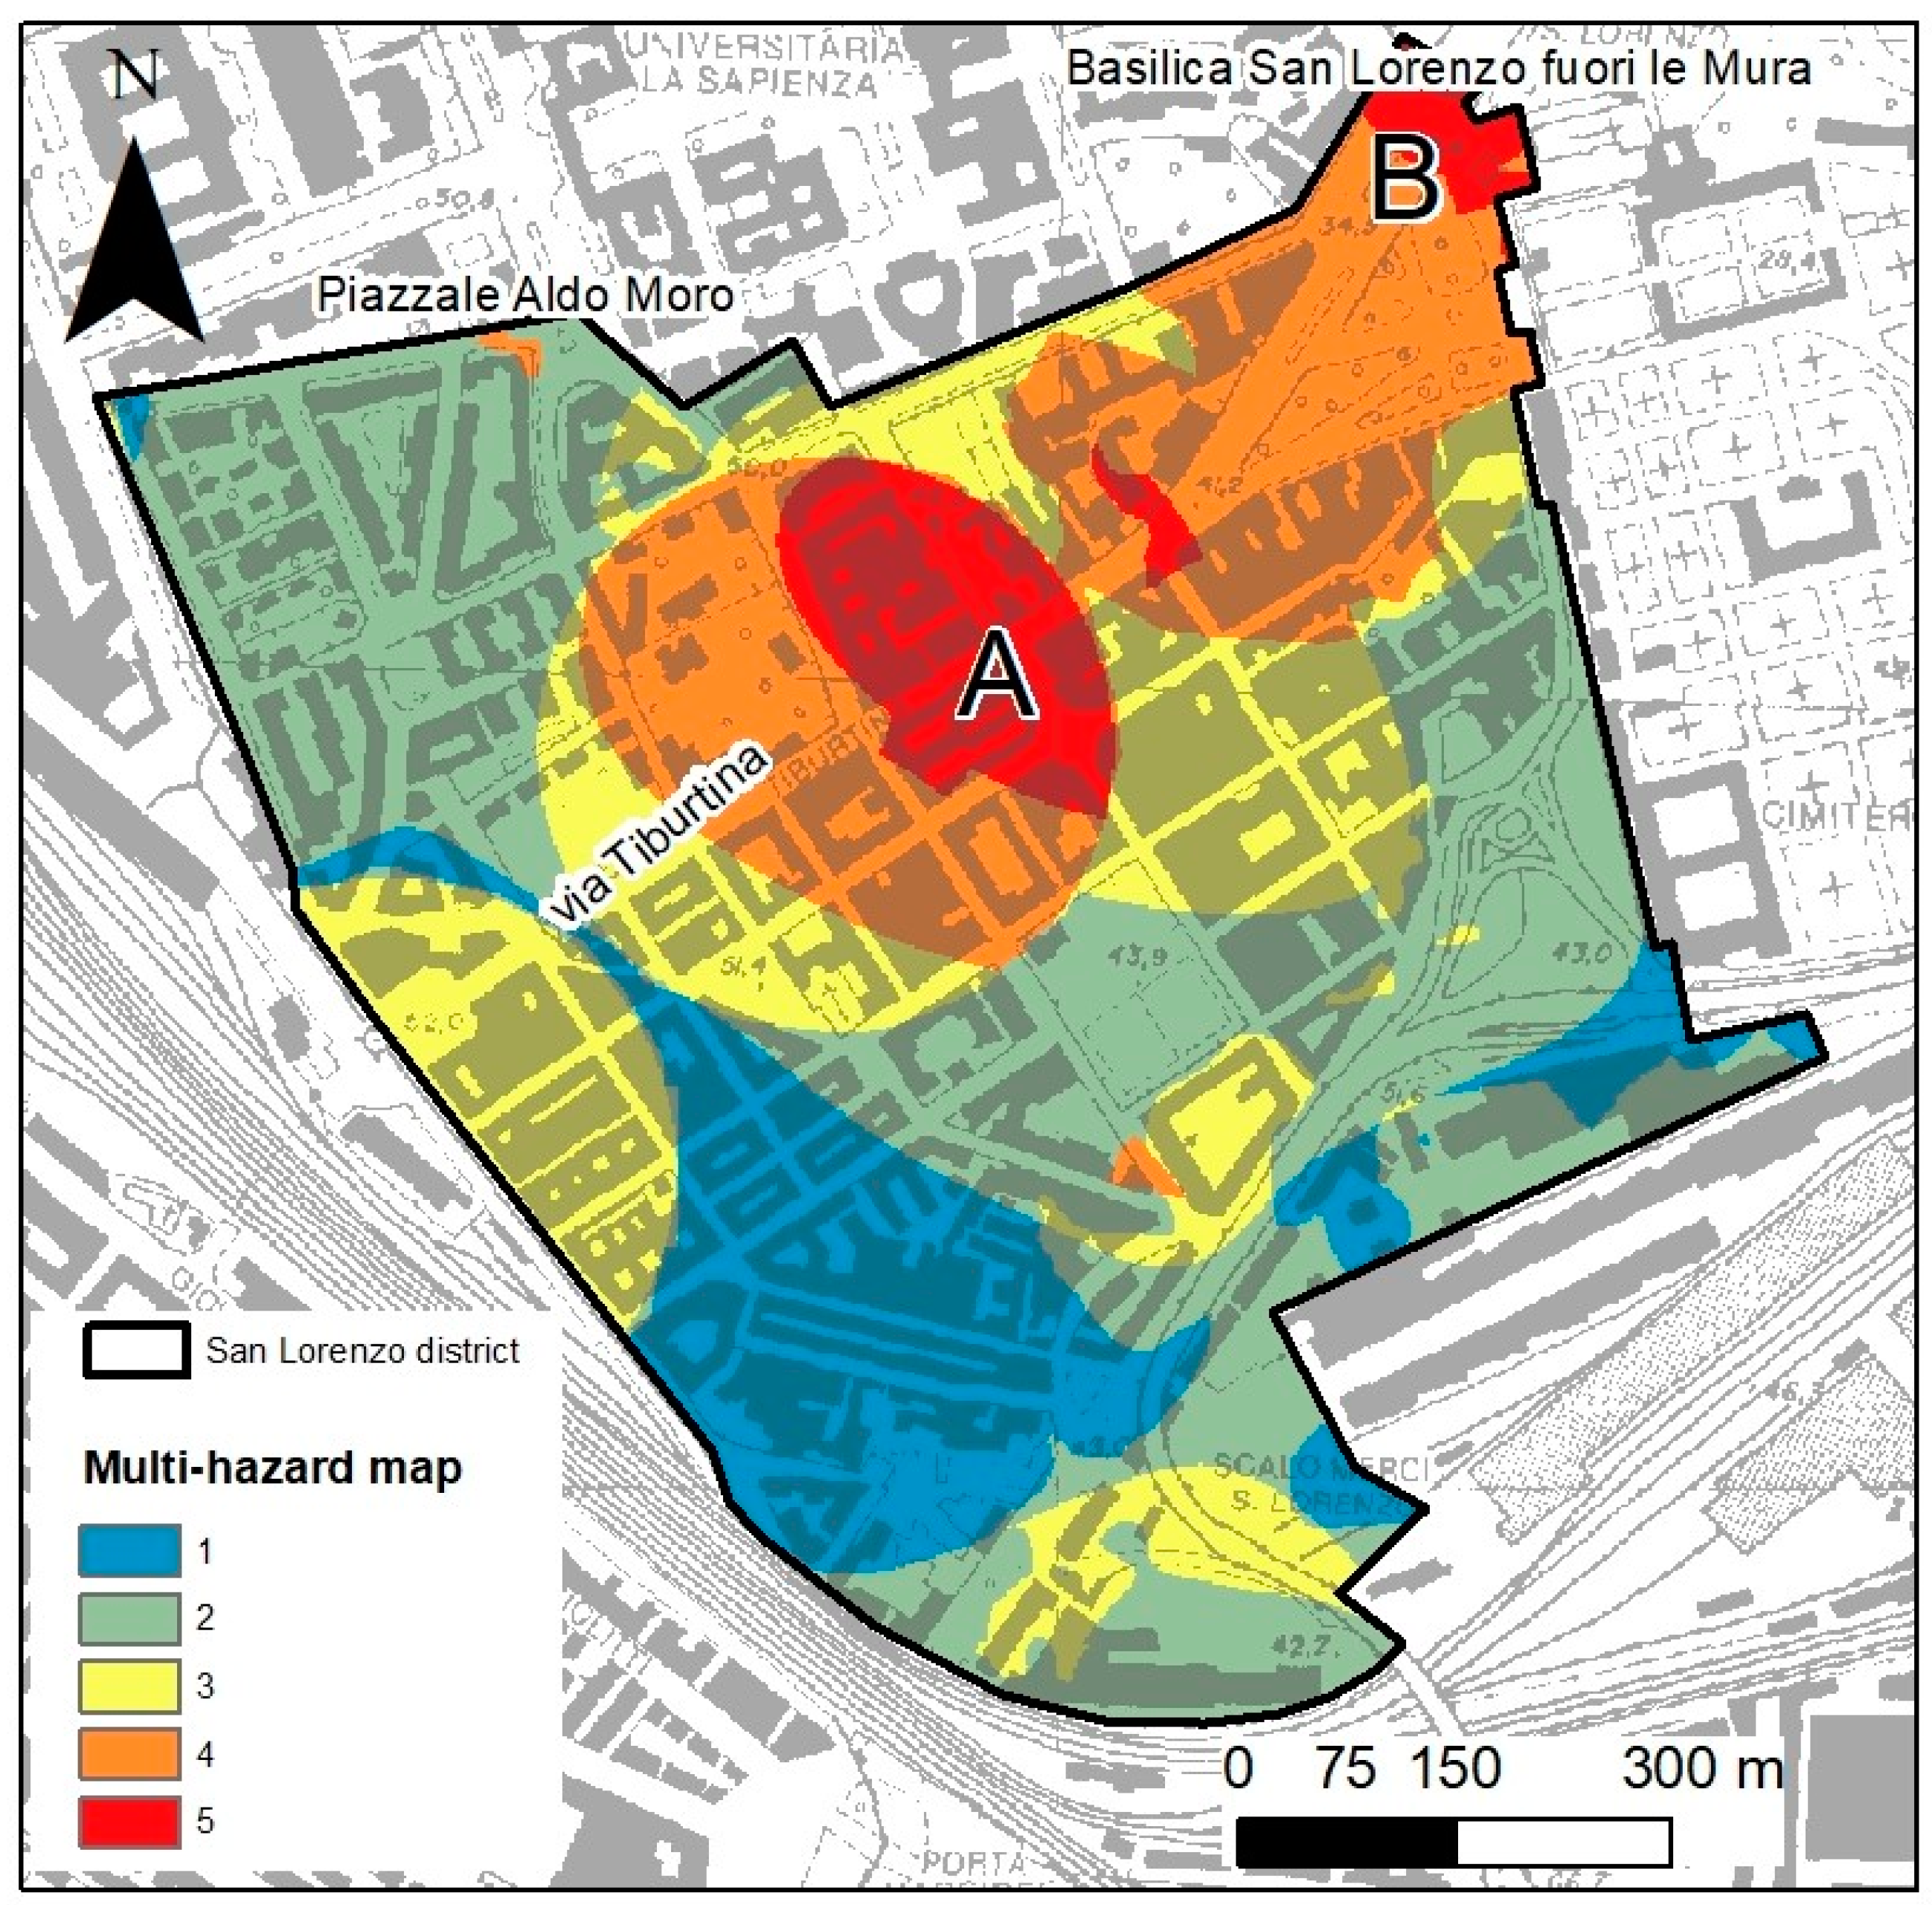
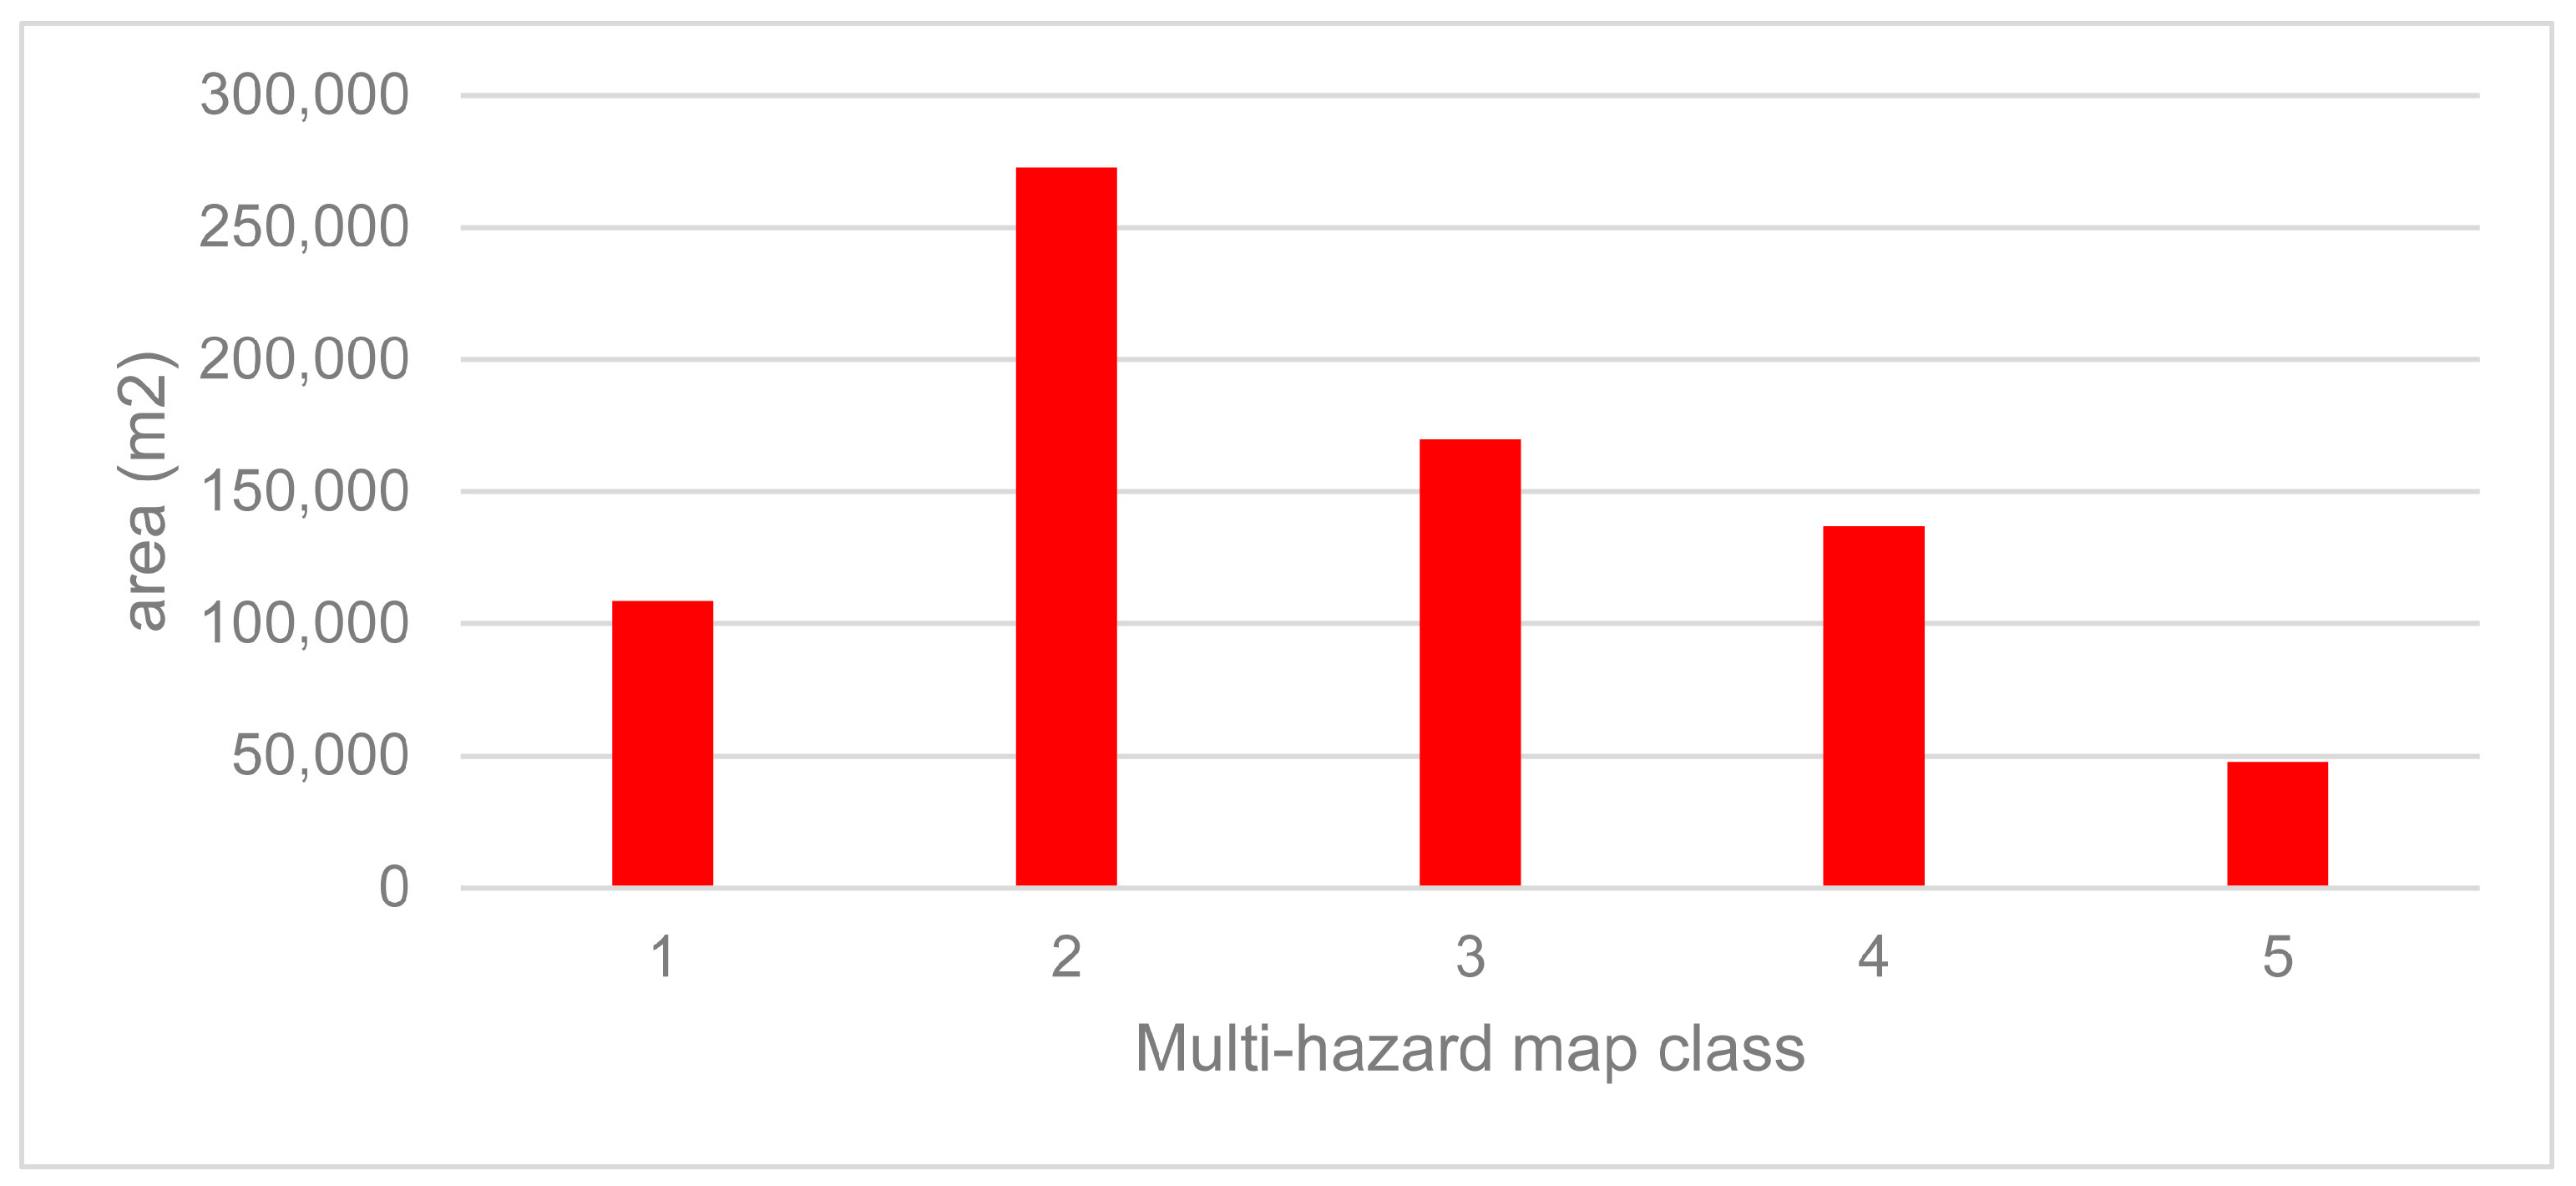
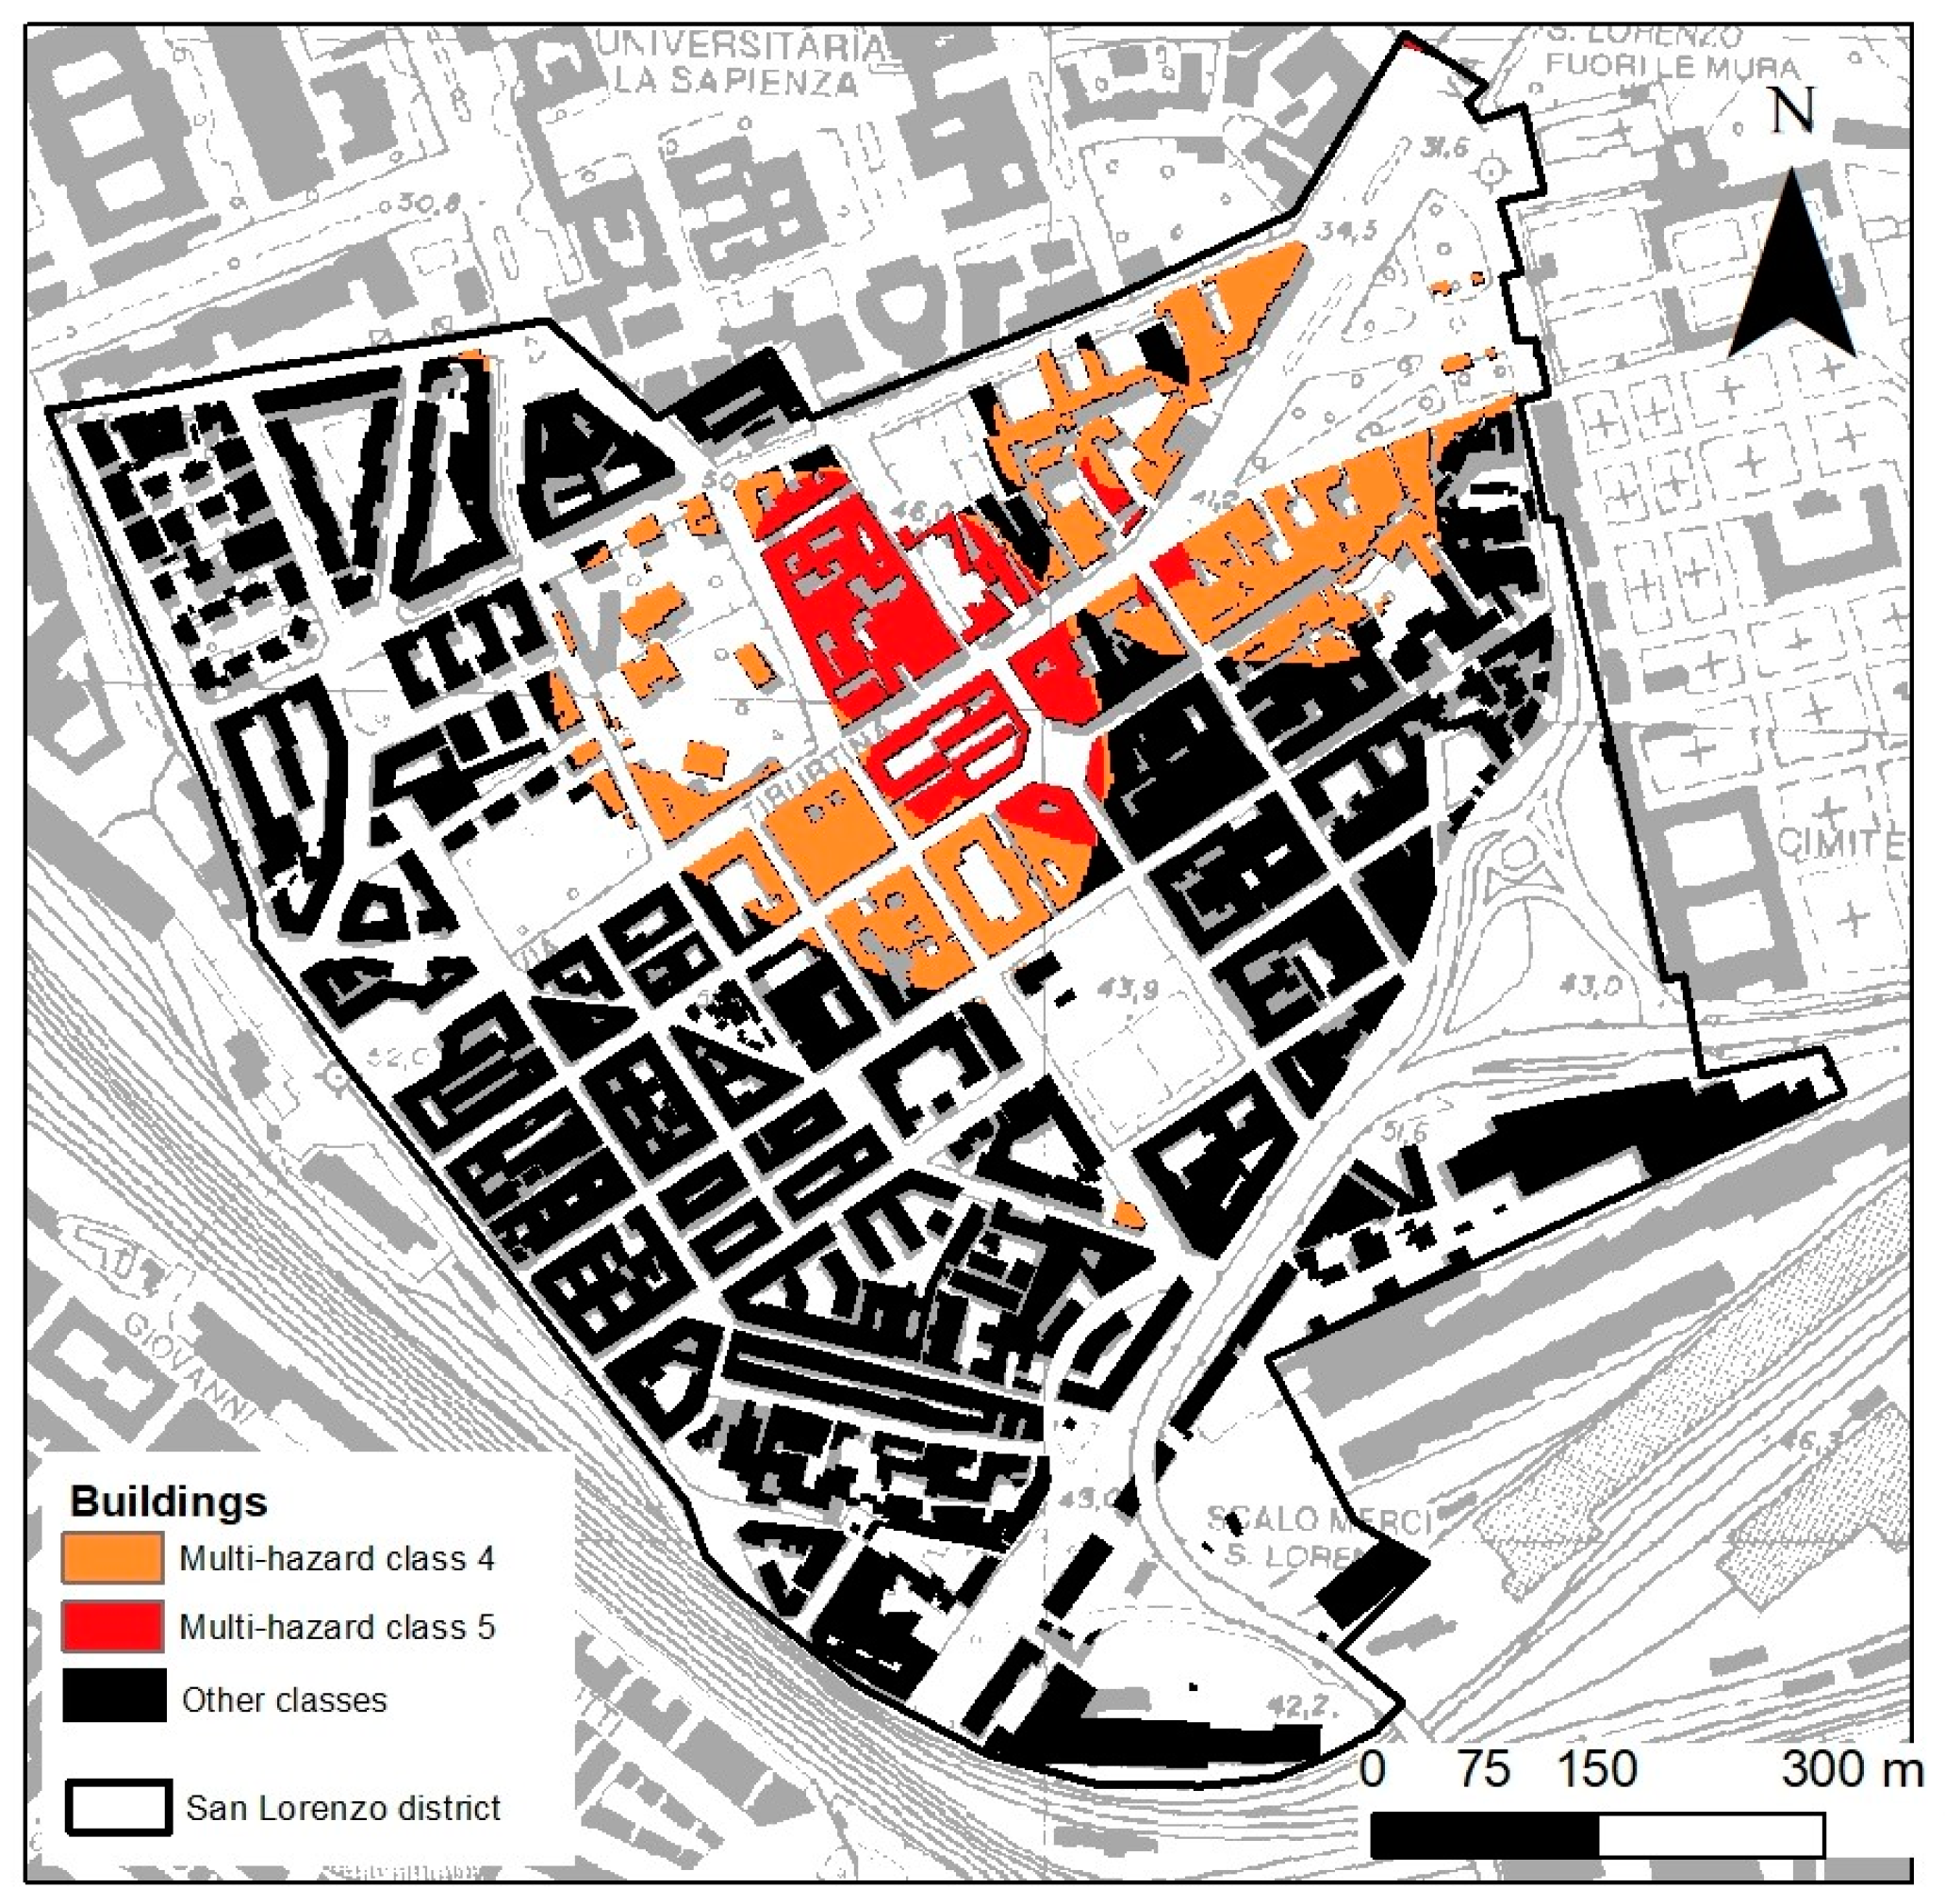
- Fifty percent of buildings are areas of combined susceptibility; among these, 8% are in multi-hazard class 5, and 17% are in multi-hazard class 4. In other words, 25% of buildings are in the highest multi-hazard classes (4 and 5), corresponding to about 1530 inhabitants. This area can be defined as a “multi-hazard hotspot” (Figure 16).
5. Discussion
6. Conclusions
Author Contributions
Funding
Data Availability Statement
Conflicts of Interest
References
- United Nations, Department of Economic and Social Affairs, Population Division. The World’s Cities in 2018—Data Booklet; United Nations: New York, NY, USA, 2018; (ST/ESA/SER.A/417). [Google Scholar]
- Dottori, F.; Szewczyck, W.; Ciscar, J.C.; Zhao, F.; Alfieri, L.; Hirabayashi, Y.; Bianchi, A.; Mongelli, I.; Frieler, K.; Betts, R.A.; et al. Increased human and economic losses from river flooding with anthropogenic warming. Nat. Clim. Change 2018, 8, 1758–2678. [Google Scholar] [CrossRef]
- Arrighi, C.; Tanganelli, M.; Cristofaro, M.T.; Cardinali, V.; Marra, A.; Castelli, F.; De Stefano, M. Multi-risk assessment in a historical city. Nat. Hazards 2022, 119, 1041–1072. [Google Scholar] [CrossRef]
- IPCC. 2023: Sections. In Climate Change 2023: Synthesis Report. Contribution of Working Groups I, II and III to the Sixth Assessment Report of the Intergovernmental Panel on Climate Change; Core Writing Team, Lee, H., Romero, J., Eds.; IPCC: Geneva, Switzerland, 2023; pp. 35–115. [Google Scholar] [CrossRef]
- CRED. 2021 Disasters in Numbers; CRED: Brussels, Belgium, 2022; Available online: https://cred.be/sites/default/files/2021_EMDAT_report.pdf (accessed on 27 December 2023).
- Terzi, S.; Tirresan, S.; Schneiderbauer, S.; Critto, A.; Zebisch, M.; Marcomini, A. Multi-risk assessment in mountain regions: A review of modelling approaches for climate change adaptation. J. Environ. Manag. 2019, 232, 759–771. [Google Scholar] [CrossRef] [PubMed]
- Wang, J.; He, Z.; Weng, W. A review of the research into the relations between hazards in multi-hazard risk analysis. Nat. Hazards 2020, 104, 2003–2026. [Google Scholar] [CrossRef]
- Karatzetzou, A.; Stefanidis, S.; Stefanidou, S.; Tsinidis, G.; Pitilakis, D. Unified hazard models for risk assessment of transportation networks in a multi-hazard environment. Int. J. Disaster Risk Reduct. 2022, 75, 102960. [Google Scholar] [CrossRef]
- Gao, R.; Wang, C.; Liang, Z.; Han, S.; Li, B. A Research on Susceptibility Mapping of Multiple Geological Hazards in Yanzi River Basin, China. ISPRS Int. J. Geo-Inf. 2021, 10, 218. [Google Scholar] [CrossRef]
- Sun, L.; Ma, C.; Li, Y. Multiple geo-environmental hazards susceptibility assessment: A case study in Luoning County, Henan Province, China. Geomat. Nat. Hazards Risk 2019, 10, 2009–2029. [Google Scholar] [CrossRef]
- Wang, S.J. Interaction between human engineering activity and geo-environment and its environmental effects. J. Geol. Hazards Environ. Preserv. 1997, 8, 20–27. [Google Scholar]
- Xu, H.L. Environmental Geology; Geological Publishing House: Beijing, China, 2009. [Google Scholar]
- Huang, Y.Z. Research on the Vulnerability of the Geological Environment and Its Countermeasures in Lijiang. Ph.D. Thesis, Kunming University of Science and Technology, Kunming, China, 2010. [Google Scholar]
- Aksha, S.K.; Resler, L.M.; Juran, L.; Carstensen, L.W. A geospatial analysis of multi-hazard risk in Dharan, Nepal. Geomat. Nat. Hazards Risk 2020, 11, 88–111. [Google Scholar] [CrossRef]
- Tilloy, A.; Malamud, B.D.; Winter, H.; Joly-Laugel, A. A review of quantification methodologies for multi-hazard interrelationships. Earth Sci. Rev. 2019, 196, 102881. [Google Scholar] [CrossRef]
- Goda, K.; De Risi, R. Multi-hazard loss estimation for shaking and tsunami using stochastic rupture sources. Int. J. Disaster Risk Reduct. 2018, 28, 539–554. [Google Scholar] [CrossRef]
- Araya-Munoz, D.; Metzger, M.J.; Stuart, N.; Wilson, A.M.W.; Carvajal, D. A spatial fuzzy logic approach to urban multi-hazard impact assessment in Concepcion, Chile. Sci. Total Environ. 2017, 576, 508–519. [Google Scholar] [CrossRef] [PubMed]
- Marzocchi, W.; Garcia-Aristizabal, A.; Gasparini, P.; Mastellone, M.L.; Di Ruocco, A. Basic principles of multi-risk assessment: A case study in Italy. Nat. Hazards 2012, 62, 551–573. [Google Scholar] [CrossRef]
- Dilley, M. Disaster Risk Hotspots: A Project Summary; United Nations University Press: New York, NY, USA; Tokyo, Japan, 2006; pp. 182–188. [Google Scholar]
- Johnson, K.; Depietri, Y.; Breil, M. Multi-hazard risk assessment of two Hong Kong districts. Int. J. Disaster Risk Reduct. 2016, 19, 311–323. [Google Scholar] [CrossRef]
- Di Salvo, C.; Ciotoli, G.; Pennica, F.; Cavinato, G.P. Pluvial flood hazard in the city of Rome (Italy). J. Maps 2017, 13, 545–553. [Google Scholar] [CrossRef]
- Di Salvo, C.; Pennica, F.; Ciotoli, G.; Cavinato, G.P. A GIS-based procedure for preliminary mapping of pluvial flood risk at metropolitan scale. Environ. Model. Soft. 2018, 107, 64–84. [Google Scholar] [CrossRef]
- Mastrantoni, G.; Masciulli, C.; Marinim, R.; Esposito, C.; Scarascia Mugnozza, G.; Mazzanti, P. A novel model for multi-risk ranking of buildings at city level based on open data: The test site of Rome, Italy. Geomat. Nat. Haz. Risk 2023, 14, 2275541. [Google Scholar] [CrossRef]
- Esposito, C.; Mastrantoni, G.; Marmoni, G.M.; Antonielli, B.; Caprari, P.; Pica, A.; Schilirò, L.; Mazzanti, P.; Bozzano, F. From theory to practice: Optimization of available information for landslide hazard assessment in Rome relying on official, fragmented data sources. Landslides 2023, 20, 2055–2073. [Google Scholar] [CrossRef]
- Delgado Blasco, J.M.; Foumelis, M.; Stewart, C.; Hooper, A. Measuring urban subsidence in the Rome metropolitan area (Italy) with Sentinel-1 SNAP-StaMPS persistent scatterer interferometry. Remote Sens. 2019, 11, 129. [Google Scholar] [CrossRef]
- Comerci, V.; Vittori, E.; Cipolloni, C.; Di Manna, P.; Guerrieri, L.; Nisio, S.; Bertoletti, E. Geohazards monitoring in Roma from InSAR and in situ data: Outcomes of the PanGeo project. Pure Appl. Geophys. 2015, 172, 2997–3028. [Google Scholar] [CrossRef]
- Moscatelli, M.; Mancini, M.; Stigliano, F.; Simionato, M.; Di Salvo, C.; Cavinato, G.P.; Piro, S. A multidisciplinary approach for characterizing the shallow subsoil of the Central Archaeological Area of Rome for geohazard assessment. In Non-Intrusive Meth-odol. Large Area Urban Res; Haynes, I.P., Ravasi, T., Kay, S., Piro, S., Liverani, P., Eds.; Archaeopress Publishing Ltd.: Oxford, UK, 2023; pp. 81–86. ISBN 978-1-80327-447-8. [Google Scholar]
- Maffucci, R.; Ciotoli, G.; Pietrosante, A.; Cavinato, G.P.; Milli, S.; Ruggiero, L.; Sciarra, A.; Bigi, S. Geological hazard assessment of the coastal area of Rome (Central Italy) from multi-source data integration. Eng. Geol. 2022, 297, 106527. [Google Scholar] [CrossRef]
- Carapezza, M.L.; Barberi, F.; Tarchini, L.; Ranaldi, M. Hazard from endogenous gas emissions and phreatic explosions in Rome city (Italy). Geophys. Res. Lett. 2021, 48, e2020GL089797. [Google Scholar] [CrossRef]
- Bianchi Fasani, G.; Bozzano, F.; Cardarelli, E.; Cercato, M. Underground cavity investigation within the city of Rome (Italy): A multi-disciplinary approach combining geological and geophysical data. Eng. Geol. 2013, 152, 109–121. [Google Scholar] [CrossRef]
- Barberi, F.; Carapezza, M.L.; Ranaldi, M.; Tarchini, L. Gas blowout from shallow boreholes at Fiumicino (Rome): Induced hazard and evidence of deep CO2 degassing on the Tyrrhenian margin of Central Italy. J. Volc. Geother. Res. 2007, 165, 17–31. [Google Scholar] [CrossRef]
- Mancini, M.; Marini, M.; Moscatelli, M.; Pagliaroli, A.; Stigliano, F.; Di Salvo, C.; Simionato, M.; Cavinato, G.P.; Corazza, A. A physical stratigraphy model for seismic microzonation of the Central Archaeological Area of Rome (Italy). Bull. Earthq. Eng. 2014, 12, 1339–1363. [Google Scholar] [CrossRef]
- Francipane, A.; Pumo, D.; Sinagra, M.; La Loggia, G.; Noto, L.V. A paradigm of extreme rainfall pluvial floods in complex urban areas: The flood event of 15 July 2020 in Palermo (Italy). Nat. Hazards Earth Syst. Sci. 2021, 21, 2563–2580. [Google Scholar] [CrossRef]
- Sperotto, A.; Torresan, S.; Gallina, V.; Coppola, E.; Critto, A.; Marcomini, A. A multi-disciplinary approach to evaluate pluvial floods risk under changing climate: The case study of the municipality of Venice (Italy). Sci. Total Environ. 2016, 562, 1031–1043. [Google Scholar] [CrossRef]
- Pacetti, T.; Cioli, S.; Castelli, G.; Bresci, E.; Pampaloni, M.; Pileggi, T.; Caporali, E. Planning Nature Based Solutions against urban pluvial flooding in heritage cities: A spatial multi criteria approach for the city of Florence (Italy). J. Hydrol. Reg. Stud. 2022, 41, 101081. [Google Scholar] [CrossRef]
- Palla, A.; Colli, M.; Candela, A.; Aronica, G.T.; Lanza, L.G. Pluvial flooding in urban areas: The role of surface drainage efficiency. J. Flood Risk Manag. 2018, 1, S663–S676. [Google Scholar] [CrossRef]
- Ciotoli, G.; Nisio, S. Roma città sotterranea: Storia di coltivazioni e pericolosità al dissesto. Mem. Descr. Carta Geol. d’It. 2023, 110, 145–168. [Google Scholar]
- Bausilio, G.; Annibali Corona, M.; Di Martire, D.; Guerriero, L.; Tufano, R.; Calcaterra, D.; Di Napoli, M.; Francioni, M. Comparison of two machine learning algorithms for anthropogenic sinkhole susceptibility assessment in the city of Naples (Italy). In Geotechnical Engineering for the Preservation of Monuments and Historic Sites III, 1st ed.; Lancellotta, R., Viggiani, C., Flora, A., de Silva, F., Mele, L., Eds.; CRC Press: Boca Raton, FL, USA, 2022. [Google Scholar] [CrossRef]
- Bianchini, S.; Confuorto, P.; Intrieri, E.; Sbarra, P.; Di Martire, D.; Calcaterra, D.; Fanti, R. Machine learning for sinkhole risk mapping in Guidonia-Bagni di Tivoli plain (Rome), Italy. Geocarto Int. 2022, 37, 16687–16715. [Google Scholar] [CrossRef]
- Park, J.H.; Kang, J.; Kang, J.; Mun, D. Machine-learning-based ground sink susceptibility evaluation using underground pipeline data in Korean urban area. Sci. Rep. 2022, 12, 20911. [Google Scholar] [CrossRef] [PubMed]
- Subedi, P.; Subedi, K.; Thapa, B.; Subedi, P. Sinkhole susceptibility mapping in Marion County, Florida: Evaluation and comparison between analytical hierarchy process and logistic regression-based approaches. Sci. Rep. 2019, 9, 7140. [Google Scholar] [CrossRef] [PubMed]
- El Morjani, Z.E.A.; Ebener, S.; Boos, J.; Abdel Ghaffar, E.; Musani, A. Modelling the spatial distribution of five natural hazards in the context of the WHO/EMRO Atlas of Disaster Risk as a step towards the reduction of the health impact related to disasters. Int. J. Health Geogr. 2007, 6, 1–28. [Google Scholar] [CrossRef] [PubMed]
- Lytton, H.D. Bombing Policy in the Rome and Pre-Normandy Invasion Aeral Campaigns of World War II: Bridge-Bombing Strategy Vindicated and Railyard-Bombing Strategy Invalidated. Mil. Aff. 1983, 47, 53–59. [Google Scholar]
- Giannini, M.; Massobrio, G. Bombardate l’Italia. In Storia della Guerra di Distruzione Aerea 1940–1945; Rizzoli Storica: Milan, Italy, 2007; p. 574. [Google Scholar]
- Funiciello, R. (Ed.) La Geologia di Roma. Il Centro Storico. In Mem. Descr. Carta Geol. d’It; Servizio Geologico Nazionale: Rome, Italy, 1995; Volume 50. [Google Scholar]
- Funiciello, R.; Giordano, G. Geological Map of Italy 1:50,000, Sheet n. 374 “Roma” and Explanatory Notes; Servizio Geologico d’Italia, Se.l.c.a.: Firenze, Italy, 2008. [Google Scholar]
- Funiciello, R.; Giordano, G. La nuova Carta Geologica di Roma alla scala 1:10,000: Litostratigrafia e organizzazione stratigrafica. In La Geologia di Roma. Mem. Descr. Carta Geol. d’It; Funiciello, R., Praturlon, A., Giordano, G., Eds.; Servizio Geologico Nazionale: Rome, Italy, 2008; pp. LXXX, 39–86. [Google Scholar]
- Luberti, G.M.; Prestininzi, A.; Esposito, C. Development of a geological model useful for the study of the natural hazards in urban environments: An example from the eastern sector of Rome (Italy). Ital. J. Eng. Geol. Env. 2015, 2, 41–62. [Google Scholar]
- Luberti, G.M. Segnalazione dell’esistenza di un fosso nell’area di San Lorenzo e del Verano e relative implicazioni sulla carta geologica del Comune di Roma. Prof. Geol. 2014, 38, 17–21. [Google Scholar]
- Luberti, G.M. Computation of modern anthropogenic-deposit thicknesses in urban areas: A case study in Rome, Italy. Anthr. Rev. 2018, 5, 2–27. [Google Scholar] [CrossRef]
- Lazio, R. Carta Tecnica Regionale Numerica, Scala 1:50,000–Provincia di Roma; Regione Lazio: Rome, Italy, 2017. [Google Scholar]
- Hutchinson, M.F.; Dowling, T.I. A continental hydrological assessment of a new grid-based digital elevation model of Australia. Hydrol. Process. 1991, 5, 45–58. [Google Scholar] [CrossRef]
- ANU Fenner School of Environment and Society and Geoscience Australia. GEODATA 9 Second DEM and D8 Digital Elevation Model and Flow Direction Grid. User Guide. Geoscience Australia. 2008; p. 43. Available online: https://ecat.ga.gov.au/geonetwork/srv/api/records/a05f7892-d78f-7506-e044-00144fdd4fa6 (accessed on 23 January 2024).
- Piano Topografico di Roma e Suburbio (1924), scala 1:5.000, Istituto Geografico Militare, Firenze. Si Tratta di una Edizione Aggiornata e Rivisitata Rispetto a Quella Prodotta nel 1907 e pubblicata nel 1908–1909. Available online: https://geoportale.cittametropolitanaroma.it/index.php/cartografia-storica/20/41/roma-e-suburbio-nel-1924 (accessed on 23 January 2024).
- Frutaz, A.P. Le piante di Roma, Roma 1962, III, CCXXVII, 584. Available online: https://geoportale.cittametropolitanaroma.it/cartografia-storica/20 (accessed on 23 January 2024).
- Mark, O.; Weesakul, S.; Apirumanekul, C.; Boonya Aroonet, S.; Djordjevic, S. Potential and limitations of 1D modelling of urban flooding. J. Hydrol. 2004, 299, 284–299. [Google Scholar] [CrossRef]
- Adeyemo, O.J.; Maksimovic, C.; Booyan–Aaronnet, S.; Leitao, J.; Butler, D.; Makropoulos, C. Sensitivity analysis of surface runoff generation for Pluvial Urban Flooding. In Proceedings of the 11th International Conference on Urban Drainage, Edinburgh, UK, 31 August–5 September 2008. [Google Scholar]
- Hertz, P. Über den gegenseitigen durchschnittlichen Abstand von Punkten, die mit bekannter mittlerer Dichte im Raume angeordnet sind. Math. Ann. 1909, 67, 387. [Google Scholar] [CrossRef]
- Clark, P.J.; Evans, F.C. Distance to nearest neighbor as a measure of spatial relationships in populations. Ecology 1954, 35, 445–453. [Google Scholar] [CrossRef]
- Silverman, B.W. Density Estimation for Statistics and Data Analysis; Routledge: London, UK, 2018. [Google Scholar]
- FEMA. Guidance for Flood Hazard Analysis and Mapping; U.S. Department of Homeland Security, 2014. Available online: https://www.fema.gov/sites/default/files/nepa/Base_Map_Guidance_May_2014_SUPERSEDED.pdf (accessed on 23 January 2024).
- Ciotoli, G.; Corazza, A.; Finoia, M.G.; Nisio, S.; Succhiarelli, C. Gli sprofondamenti antropogenici nell’aria urbana di Roma. Mem. Descr. Carta Geol. d’It. 2013, 93, 143–182. [Google Scholar]
- Phillips, S.J.; Anderson, R.P.; Schapire, R.E. Maximum entropy modeling of species geographic distributions. Ecol. Model. 2006, 190, 231–259. [Google Scholar] [CrossRef]
- Phillips, S.J.; Anderson, R.P.; Dudik, M.; Schapire, R.E.; Blair, M. Opening the black box: An open-source release of Maxent. Ecography 2017, 40, 887–893. [Google Scholar] [CrossRef]
- Nisio, S.; Allevi, A.; Ciotoli, G.; Ferri, G.; Fiore, R.; Pascucci, R.; Stranieri, I.; Succhiarelli, C. Carta delle Cavità sotterranee di Roma; Pubblicazione ISPRA: Rome, Italy, 2017.
- Nisio, S.; Ciotoli, G.; Ferri, F.; Moretti, P.; Puzzilli, L.M.; Ruggiero, L.; Ruscito, V.; Carlucci, G. Primo con- tributo allo studio delle cavità sotterranee nascoste sotto il Parco di Centocelle nell’area urbana di Roma. Mem. Descr. Carta Geol. d’It. 2021, 108, 353–371. [Google Scholar]
- Ventriglia, U. Geologia della Città di Roma; Amministrazione Provinciale di Roma: Rome, Italy, 1971; 417p.
- Ventriglia, U. Geologia del Territorio del Comune di Roma; Amministrazione Provinciale di Roma: Rome, Italy, 2002; 810p.
- Ciotoli, G.; Di Loreto, E.; Finoia, M.G.; Liperi, L.; Meloni, F.; Nisio, S.; Sericola, A. Sinkhole susceptibility map of the Lazio Region, central Italy. J. Maps 2016, 12, 287–294. [Google Scholar] [CrossRef]
- La Vigna, F.; Mazza, R.; Amanti, M.; Di Salvo, C.; Petitta, M.; Pizzino, L.; Succhiarelli, C. Groundwater of Rome. J. Maps 2016, 12, 88–93. [Google Scholar] [CrossRef]
- Mazza, R.; La Vigna, F.; Capelli, G.; Dimasi, M.; Mancini, M.; Mastrorillo, L. Hydrogeology of Rome. Acque Sotterranee. Ital. J. Groundw. 2015, 4, 19–30. [Google Scholar] [CrossRef]
- ISTAT, Istituto Nazionale di Statistica. Dati Geografici e Variabili Censuarie per Sezione di Censimento, anno 2011. 2015. Available online: www.istat.it (accessed on 24 March 2017).
- Ford, J.R.; Price, S.J.; Cooper, A.H.; Waters, C.N. An assessment of lithostratigraphy for anthropogenic deposits. In A Stratigraphical Basis for the Anthropocene; Waters, C.N., Zalasiewicz, J.A., Williams, M., Ellis, M.A., Snelling, A.M., Eds.; Geological Society: London, UK; Special Publications: London, UK, 2014; Volume 395, pp. 55–89. [Google Scholar]
- Karner, D.B.; Marra, F.; Renne, P.R. The history of the Monti Sabatini and Alban Hills volcanoes: Groundwork for assessing volcanic-tectonic hazards for Rome. J. Volc. Geother. Res. 2001, 107, 185–219. [Google Scholar] [CrossRef]
- Giordano, G. Stratigraphy, volcano tectonics and evolution of the Colli Albani volcanic field. In The Colli Albani volcano. Special Publications of IAVCEI; Funiciello, R., Giordano, G., Eds.; Geological Society: London, UK, 2010; Volume 3, pp. 43–97. [Google Scholar]
- Arrighi, C.; Domeneghetti, A. Brief communication: On the environmental impacts of 2023 flood in Emilia-Romagna. Nat. Hazards Earth Syst. Sci. 2023, 2023, 1–10. [Google Scholar]
- Kozliakova, I.; Eremina, O. Mapping geological risk in urban areas. Arab. J. Geosci. 2020, 13, 492. [Google Scholar] [CrossRef]
- Grünthal, G.; Thieken, A.H.; Schwarz, J.; Radtke, K.S.; Smolka, A.; Merz, B. Comparative risk assessments for the city of Cologne–storms, floods, earthquakes. Nat. Hazards 2006, 38, 21–44. [Google Scholar] [CrossRef]
- Nirei, H.; Mezzano, A.; Satkunas, J.; Furuno, K.; Marker, B.; Mitamura, M. Environmental problems associated with man-made strata and their potential management. Episodes 2014, 37, 33–40. [Google Scholar] [CrossRef]

| Unit | Acronym | Max Thickness | Age |
|---|---|---|---|
| Backfill | RP | 20 m | From historical age to the actual age (about 3000 ka) |
| Tiber River Synthem alluvial deposit | SFTba | 10 m | Upper Pleistocene pro parte—Holocene |
| Villa Senni Formation: Tufo Litoide Lionato | VSN1 | 3–4 m | Middle Pleistocene p.p. (357 ± 2 ka) |
| Pozzolane Rosse | RED | 12 m | Middle Pleistocene p.p. (457 ± 4 ka) |
| Tufi stratificati varicolori di Sacrofano | SKF | 6 m | Middle Pleistocene p.p. (488 ± 2 ka) |
| Palatino Unit | PTI | 10 m | Middle Pleistocene p.p. (533 ± 5 ka) |
| Tor de Cenci Unit | TDC | 10 m | Middle Pleistocene p.p. (561 ± 1 ka) |
| Santa Cecilia Formation | CIL | 47 m | Middle Pleistocene p.p. |
| Monte Vaticano Formation | MVA | >16 m | Lower—Upper Pliocene p.p. |
| Susceptibility Class | % of Occurrence |
|---|---|
| Very low | 8.4 |
| Low | 24.6 |
| Medium | 57.4 |
| High | 8.8 |
| Very high | 0.8 |
Disclaimer/Publisher’s Note: The statements, opinions and data contained in all publications are solely those of the individual author(s) and contributor(s) and not of MDPI and/or the editor(s). MDPI and/or the editor(s) disclaim responsibility for any injury to people or property resulting from any ideas, methods, instructions or products referred to in the content. |
© 2024 by the authors. Licensee MDPI, Basel, Switzerland. This article is an open access article distributed under the terms and conditions of the Creative Commons Attribution (CC BY) license (https://creativecommons.org/licenses/by/4.0/).
Share and Cite
Di Salvo, C.; Ciotoli, G.; Mancini, M.; Nisio, S.; Stigliano, F. Analysis of Geological Multi-Hazards in an Urban District. Geosciences 2024, 14, 27. https://doi.org/10.3390/geosciences14020027
Di Salvo C, Ciotoli G, Mancini M, Nisio S, Stigliano F. Analysis of Geological Multi-Hazards in an Urban District. Geosciences. 2024; 14(2):27. https://doi.org/10.3390/geosciences14020027
Chicago/Turabian StyleDi Salvo, Cristina, Giancarlo Ciotoli, Marco Mancini, Stefania Nisio, and Francesco Stigliano. 2024. "Analysis of Geological Multi-Hazards in an Urban District" Geosciences 14, no. 2: 27. https://doi.org/10.3390/geosciences14020027
APA StyleDi Salvo, C., Ciotoli, G., Mancini, M., Nisio, S., & Stigliano, F. (2024). Analysis of Geological Multi-Hazards in an Urban District. Geosciences, 14(2), 27. https://doi.org/10.3390/geosciences14020027


