Article

Strain Accumulation Along the Eastern Java Back–Arc Thrust System Inferred from a Dense Global Navigation Satellite System Network

by
Nurrohmat Widjajanti
1,*,
Cecep Pratama
1,
Iqbal Hanun Azizi
1,
Yulaikhah Yulaikhah
1,
Muhammad Farhan Abiyyu
2,
Sheva Aulia Rahman
2,
Mokhamad Nur Cahyadi
3,
Evi Aprianti
4 and
Oktadi Prayoga
5
1
Department of Geodetic Engineering, Universitas Gadjah Mada, Yogyakarta 55281, Indonesia
2
Graduate School of Geodetic Engineering, Universitas Gadjah Mada, Yogyakarta 55281, Indonesia
3
Geomatics Engineering Department, Institut Teknologi Sepuluh Nopember, Surabaya 60117, Indonesia
4
Disaster Management Study Program, The Graduate School of Hasanuddin, Makassar 90245, Indonesia
5
Geospatial Information Agency, Cibinong 16911, Indonesia
*
Author to whom correspondence should be addressed.
Geosciences 2024, 14(12), 346; https://doi.org/10.3390/geosciences14120346
Submission received: 27 October 2024 / Revised: 5 December 2024 / Accepted: 14 December 2024 / Published: 17 December 2024

Abstract

:
The back–arc thrust region in Eastern Java to Flores is significantly influenced by the arc–continent collision between the Australian Plate and the Eastern Sunda Arc, leading to a tectonic regime characterized by high seismic and volcanic hazards. This area has experienced several major earthquakes. However, back–arc thrust in Eastern Java remains absent from significant shallow earthquakes, which might indicate intense deformation. We conducted an analysis using recent and dense Global Navigation Satellite System (GNSS) observations from both continuous and campaign stations to develop a strain rate model and explore the detailed crustal behavior and strain accumulation within the Eastern Java back–arc thrust system. Our findings revealed varying values of compression and extension throughout the region, with compression values ranging from −2.24 to 0.086 μstrain/year. Additionally, we observed that the maximum shear strain rate and dilatation strain rate were within the ranges of 0.0013 to 1.12 μstrain/year and −2.24 to 0.698 μstrain/year, respectively. These findings could facilitate more informed strategies and improve preparedness for future seismic events.

1. Introduction

The back–arc thrust region in Eastern Java has dominated as a consequence of the arc–continent collision between the Australian Plate and the Eastern Sunda Arc [1], where the tectonic regime implies that seismotectonic and volcanic hazard occurrences are high as well as its potential [2]. Back–arc thrust in the Eastern Java region, also known as part of the Baribis–Kendeng active fault system, may connect with the Flores back–arc thrust [3], where the damaging 2018 Mw 6.9 earthquake source was located [4,5,6,7,8]. On the other hand, Koulali et al. [9] revealed an active westward extension of the Flores back–arc thrust where fault slip partitioning occurred, implying that Eastern Java is a highly active deformation with parallel motions accommodated along the Kendeng thrust (Figure 1).
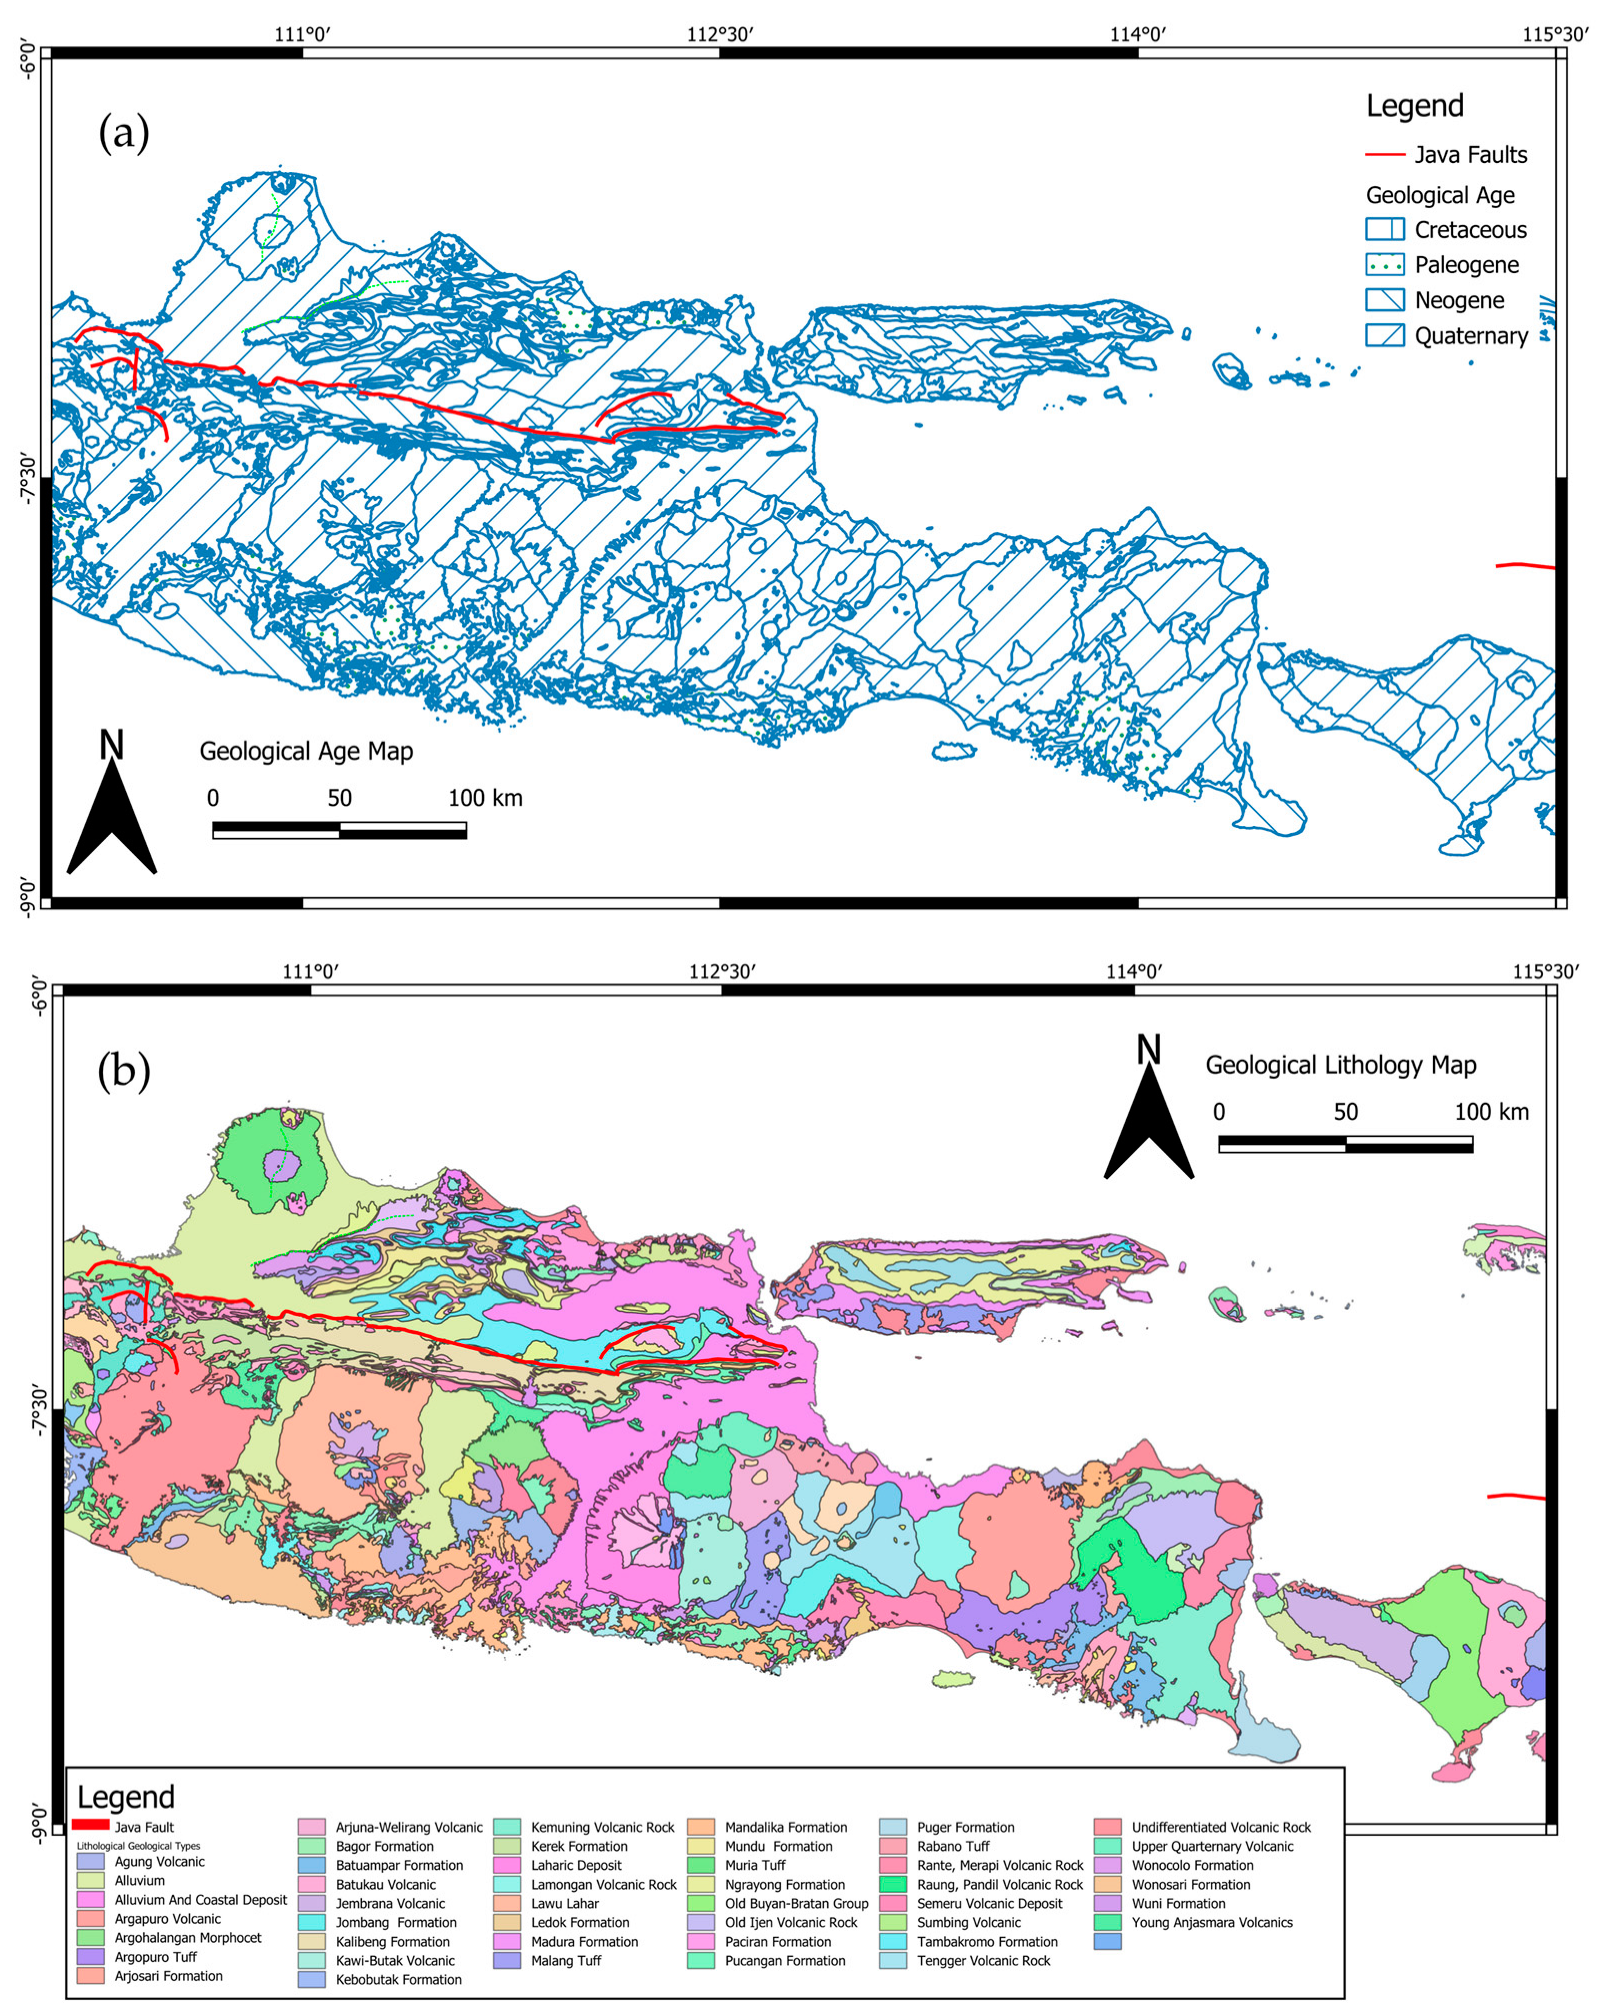
Geological maps (Figure 2) show that the back–arc thrust of Eastern Java is situated along the boundary separating Tertiary (Paleogen–Neogen) rocks from Quaternary deposits. The figure clearly demonstrates that the Kendeng folds affected both the Tertiary and Quaternary layers. Seismic reflection profiles revealed that the Kendeng folds are linked to a (blind) thrust that dips southward [10]. Marliyani (2016) noted the presence of raised Holocene River terraces associated with the Kendeng fold–thrust zone, indicating fault activity during the Holocene Epoch [11].
Earthquake history along this back–arc thrust shows migration occurrences from the Flores earthquake in 1992 with Mw 7.8 [12,13], the Lombok earthquake in 2018 with Mw 6.9 [4,5,6,7,8], the Bali earthquake in 1976 with Mw 6.5 [14], and the Situbondo earthquake in 2018 with Mw 6.2 [15]. The lack of recognized large earthquakes in the Eastern Java back––arc thrust and this westward migration may raise the future earthquake potential in the region. However, the detailed crustal structure and strain accumulation along the region remain poorly understood. The strain accumulation along the other convergent plate margins, such as the subduction zone or along the forearc region, has been widely discussed [16,17]. Here, the accumulated strain along Eastern Java would give a valuable recent strain–––stress condition in the back–arc thrust region.
Crustal deformation studies based on continuous GNSS observations in Java Island between 2008–2011 and 2011–2014 and considering a viscoelastic relaxation due to the 2006 Java tsunami earthquake have suggested an NS gradient across the Kendeng thrust, with stress accumulation between 2.3 and 5.6 mm/year [9]. Meanwhile, an updated kinematic crustal block model inferred from more recent permanent GNSS data between 2008 and 2018 and neglecting viscoelastic relaxation due to the 2006 Java tsunami earthquake indicated a compressive NS pattern between 2.1 and 2.5 mm/year [18]. The geodetic strain rate also inferred from the same continuous GNSS dataset with [9] showed a large compressional dilatation rate extending from Central Java to the east up to the Madura Strait [19]. Meanwhile, Purwaningsih et al. [20], focusing on Eastern Java, estimated the strain rate from the continuous GNSS observation from 2010 to 2019, suggesting a higher compression pattern related to the Eastern Java back––arc thrust. Most of those studies used continuous GNSS, which is relatively sparse, to investigate detailed crustal structure and strain accumulation of an active fault. The data also range from 2008 to 2019, which might have been influenced by the post––seismic deformation caused by the 2006 Java tsunami earthquake.
In this study, we analyzed recent and dense GNSS observations consisting of 10 continuous and 35 campaign stations to investigate the detailed crustal and strain accumulation along the Eastern Java back––arc thrust system between 7°40′ S–6°20′ S and 110° E–112°4′ E. Those additional campaign stations could provide beneficial information to identify local active tectonics that have not been included in the previous studies. We inferred the strain rate based on the estimated displacement rate between 2016 and 2023 to avoid the influence of post––seismic deformation due to the 2006 Java tsunami earthquake. Consequently, this study could have considerable implications for evaluating future seismic hazards in the region.

2. Data and Methods

2.1. GNSS and Seismicity Data

We utilized GNSS stations situated in the eastern region of Java. These eight continuous stations are part of the Indonesian Continuous Operating Reference Station (Ina––CORS) network [21], along with 35 campaign stations provided by the Geospatial Information Agency of Indonesia. We comprehensively analyzed daily solutions from 2016 to 2023, utilizing the International Terrestrial Reference Frame 2014 (ITRF2014) as a reference framework [22]. This study aimed to enhance our understanding of the underlying active tectonics during this period.
The GNSS data for this study were processed using the GAMIT/GLOBK version 10.7 software suite, a robust tool for high––precision geodetic analysis [23]. The processing incorporated data from eight International GNSS Service (IGS) stations and all observation sites. The IGS stations employed in the processing, situated in the surrounding region of Indonesia, consist of COCO, CCJ2, CUSV, DARW, DGAR, IISC, PIMO, and TOW2. Identifying and handling errors in GNSS data using TEQC is a crucial step in ensuring the reliability of data processed with GAMIT/GLOBK. TEQC is particularly effective for evaluating data quality through residual analysis, multipath metrics, and ionospheric delay indicators. To detect outliers, TEQC generates residuals that highlight observations that deviate significantly from expected patterns, enabling users to identify and exclude problematic data points [24].
The data workflow entailed an initial set of GAMIT computations to estimate the stations’ positions, orbits, and atmospheric parameters, which were then refined in GLOBK. GLOBK combines the results of multiple sessions by applying temporal constraints and statistical adjustments to enhance the accuracy of its positioning. This methodology provided the reliable and precise geodetic solutions crucial for analyzing crustal deformations and tectonic dynamics in the region [25]. In GNSS data processing with GAMIT, a priori coordinates derived from precise point positioning (PPP) were utilized as the initial approximations.
To obtain the most accurate results, we applied a series of corrections, including those related to ocean loading (FES2014) and factors concerning the pole, solid earth, and tidal forces (IERS2010) [26]. The selection of GNSS stations was made to achieve a precise estimation of the strain rate in the Eastern Java region. This careful selection process involved considering various factors, such as station distribution, historical data availability, and the geological characteristics of the area. By utilizing a network of strategically placed GNSS stations, we aimed to enhance our understanding of tectonic activity and monitor the surface deformations that could impact the region.
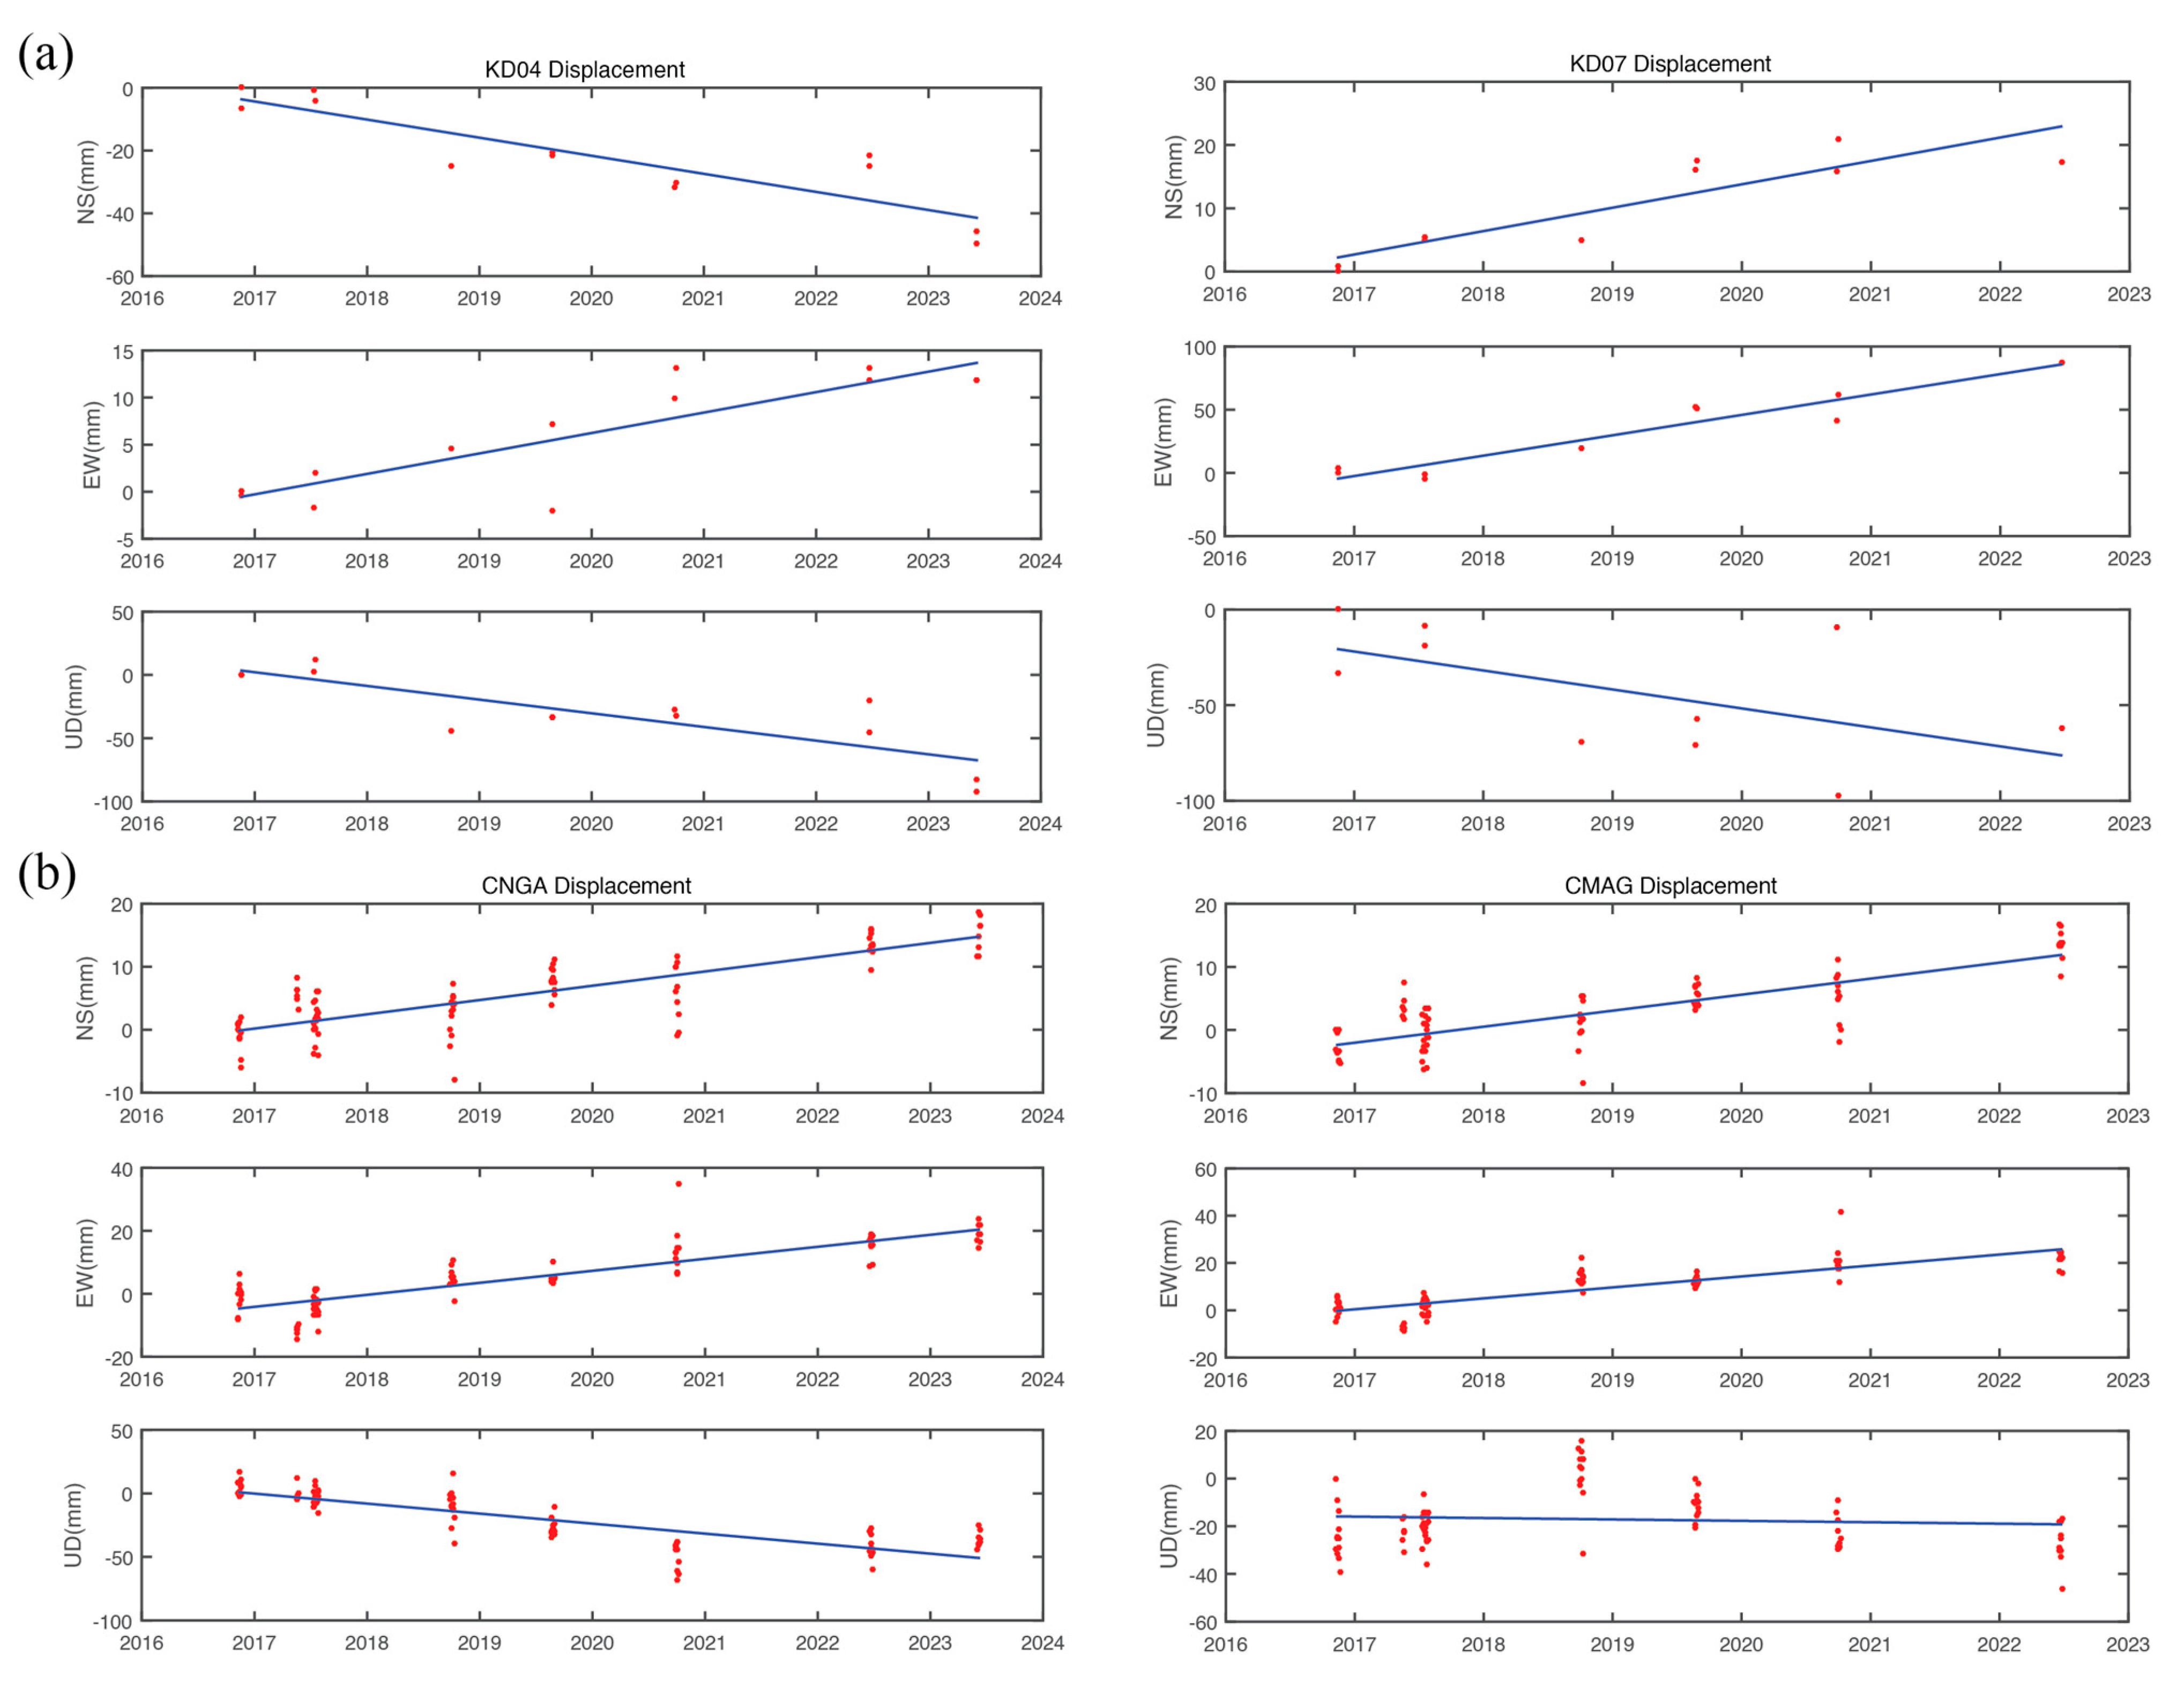
In this study, we transformed the GNSS daily solutions into the Sunda block reference frame. The transformation was achieved by utilizing the Euler pole angular velocity (ϖ) of 0.337°/Myear and its position (45.63° N, −88.71° E), which are tied to ITRF2014 [27]. This approach was adopted to represent local deformation [28]. The time––series plot depicting both the campaign and continuous GNSS observations offers a clear visualization of the trends in temporal displacement. The result is illustrated in detail in Figure 3, highlighting the deformation dynamics over time. It facilitates a detailed analysis of patterns and tectonic deformation.
Seismicity data were obtained from the USGS Earth Explorer to identify significant earthquakes with magnitudes of 6.0 or greater, which were then used to visualize focal mechanisms (Figure 1). Furthermore, earthquake data with magnitudes below 6.0 were also obtained from the USGS. The focal mechanisms for the significant earthquakes were derived from the Global Centroid Moment Tensor (GCMT) catalog [14], which provides essential information on the source characteristics of these seismic events. This approach enabled a comprehensive analysis of tectonic activity and strain distribution in the Eastern Java back––arc thrust along the Kendeng Fault area, encompassing various seismic events.
After acquiring the daily solutions with respect to the Sunda block, we estimated each GNSS station’s velocity by utilizing combinations of mathematical expressions designed to account for the geophysical signal. The final stage of the process entailed the decomposition of the GNSS daily solutions, which was achieved through the utilization of the linear least squares method [29]. Therefore, the equation can be written as follows:
[ y a ] = m [ x ] + b
The matrix [ y a ] represents the displacement observed at a designated location a encompassing three spatial components: East, North, and Up. In this context, m signifies the gradient line, which characterizes the relationship between observed displacements and their respective spatial displacements, providing a framework for analyzing variations in movement. The variable x denotes the epoch observation matrix at station a , reflecting the temporal dimension of the measurements taken over successive epochs. Additionally, b represents a constant associated with the ordinate (y––axis) during the observation period, serving as a baseline reference for interpreting displacement changes. The generated velocity data were subjected to a reduction process aimed at eliminating outliers (Figure 4). As shown in Figure 4, the EW component had no relationship with NS component velocities, while the uncertainties were directly proportional between the EW and NS components. This process is essential, as outliers can distort statistical calculations and lead to erroneous conclusions, affecting the overall interpretation of the investigated geological and geodynamic phenomena.

2.2. Strain Rate

We employed strain rate analysis to investigate active tectonics in the Eastern Java back––arc thrust region. This approach is particularly effective because it operates independently of any specific reference frame, making it well––suited for discussions related to tectonic activity and deformation [29]. By examining the strain rates, we can gain valuable insights into the tectonic processes at play in this geologically dynamic area. We calculated the principal strain using velocity data that had been transformed into the Sunda block reference frame. These data were calculated using the Velocity Interpolation for Strain Rate (VISR) algorithm. The method represents an optimal horizontal strain rate field based on the least squares method and spatial weighting [30]. The study used distance––dependent weighting, which can be optimally achieved by applying a Gaussian weighting scheme to estimate the principal strain. A weighting scheme, especially for the geodetic––derived model with relative weight, would give a better fit and explain the observation [31]. The equations for the VISR method are presented below.
d = a m + e
ε p r i n c = ε x x + ε y y 2   ± ε x x + ε y y 2 + ε x y 2
  θ p r i n c = t a n 1 ( 2   x   ε x y )   ε x x   ε y y 2
Equation (2) defines the relationship between observed displacement ( d ), the design matrix ( a ), the model parameters ( m ), and the residuals ( e ). Equations (3) and (4) calculates the principal strain ( ε p r i n c ) . The normal strain component ( ε x x ,   ε y y ) represents the relative change in length along the x––axis and y––axis due to deformation. The shear strain component ( ε x y ) captures the distortion or angular deformation within the xy––plane due to shear forces. The dilatation strain represents the total volumetric deformation by summing the principal strain components. The shear strain quantifies the maximum deformation due to shear forces. The difference between the principal strains determines the magnitude of the shear strain. Principal strain shows the fractional length change along the principal strain axis. The dilatation rate value indicates the presence of dip––slip faults (thrust fault or normal fault), while maximum shear strain indicates the presence of strike––slip faults [32].

3. Result and Discussion

3.1. Displacement Rate

The displacement rates and velocity fields were calculated during 201 campaigns and at continuous observation stations along the Kendeng Fault. Two types of velocity calculations were performed, as detailed in Table 1 and Table S1. The velocity values relative to the ITRF2014 range from 13.12 to 40.9 mm/year for the EW component, −15.24 to 8.64 mm/year for the NS component, and −131.3 to 21.63 mm/year for the up––down (UD) component. In contrast, the velocity fields relative to the Sunda block show a narrower range between −11.29 to 16.13 mm/year for the EW component and −5.76 to 17.19 mm/year for the NS component. When velocities are referenced to the Sunda block, they reflect primarily the localized movements within this stable block. This observation suggests that localized movements within the Sunda block are smaller than those recorded against the ITRF, highlighting the complexities of tectonic dynamics in the Eastern Java back––arc thrust region.
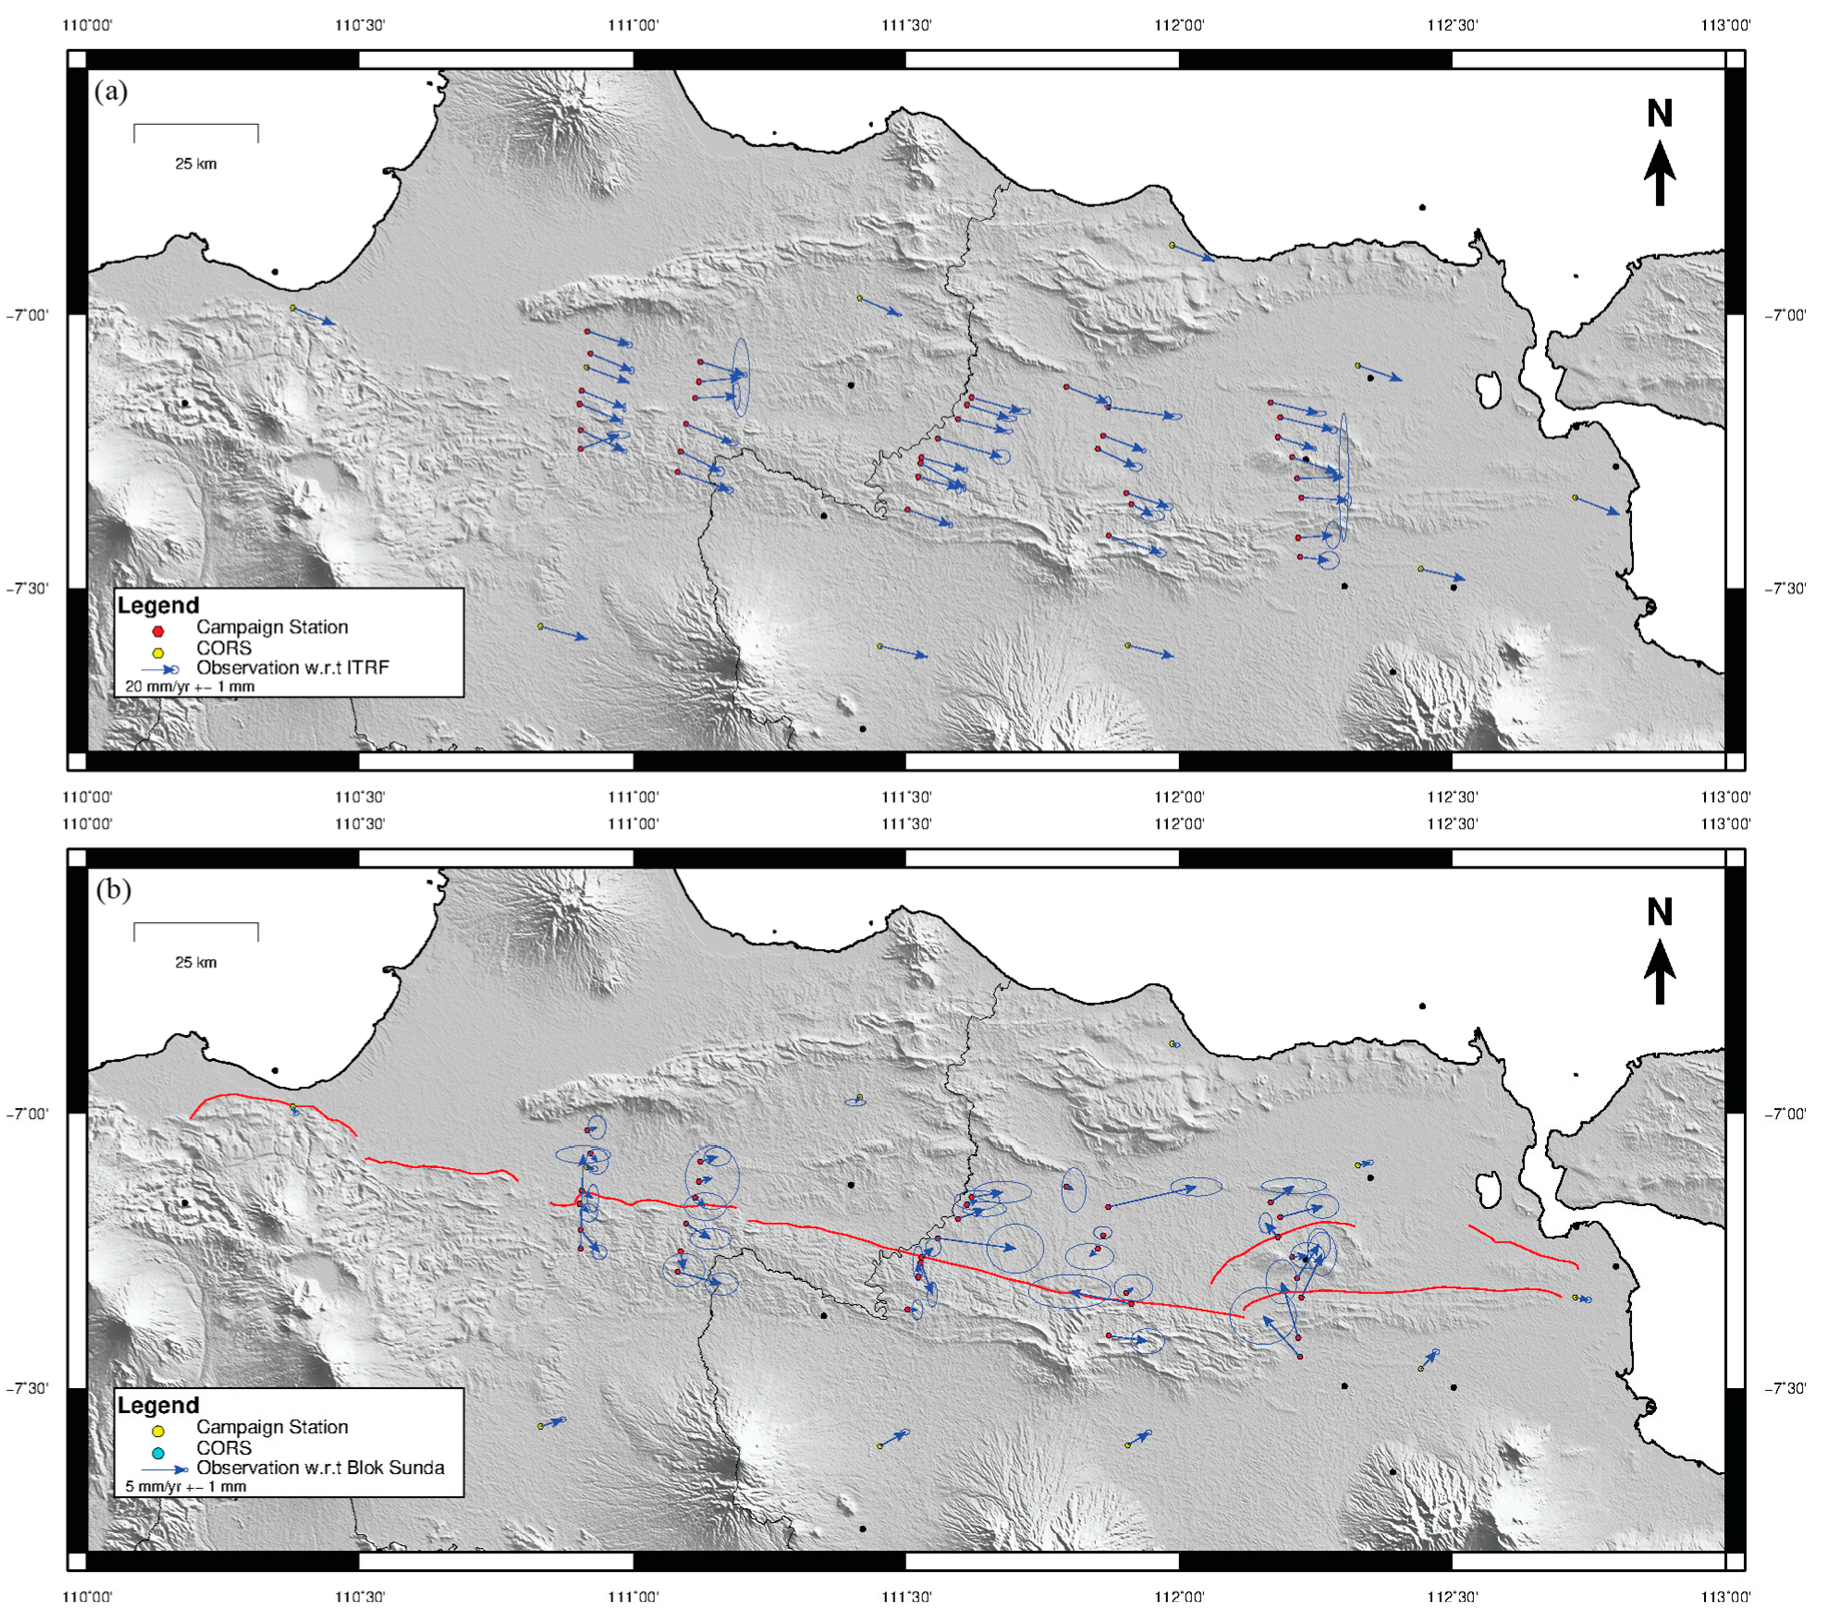
The visual representation of the ITRF2014 reference velocity results alongside the reduced velocity of the Sunda block is illustrated in Figure 5. Specifically, Figure 5a depicts the outcomes and direction of the ITRF2014 reference velocity, which predominantly indicates a southeastward movement across all observation points, consistent with previous studies [14]. In contrast, Figure 5b presents the results and direction of the Sunda block’s reduced velocity, revealing a range of predominantly counterclockwise directions that reflect the local deformation patterns in the region, aligning with several studies [9,16].
The velocity visualization concerning the ITRF2014 shows a relatively uniform pattern, with a dominant displacement rate directed southeast. Meanwhile, the velocity visualization about the Sunda block exhibits a more varied pattern. The figure highlights a significant difference in the direction and magnitude of the two velocities [27]. The variation in standard deviation between velocity data referenced to the Sunda block and that referenced to the ITRF2014, as detailed in Table 1, is primarily due to the coordinate transformation applied when reducing velocities to the Sunda block reference frame.
In 2023, a notable earthquake with a class magnitude of 7 occurred in the northern region of Java Island at a depth of 597 km, as documented by the USGS National Earthquake Information Center (NEIC). It can be reasonably deduced that this event had the potential for widespread impact. To assess the impact of the earthquake on the observation points, an empirical formula was employed to approximate the earthquake’s radius of influence. The formula considers the magnitude of the earthquake [33]. The calculations concluded that the observation points in question were situated outside the radius of influence generated by the earthquake.
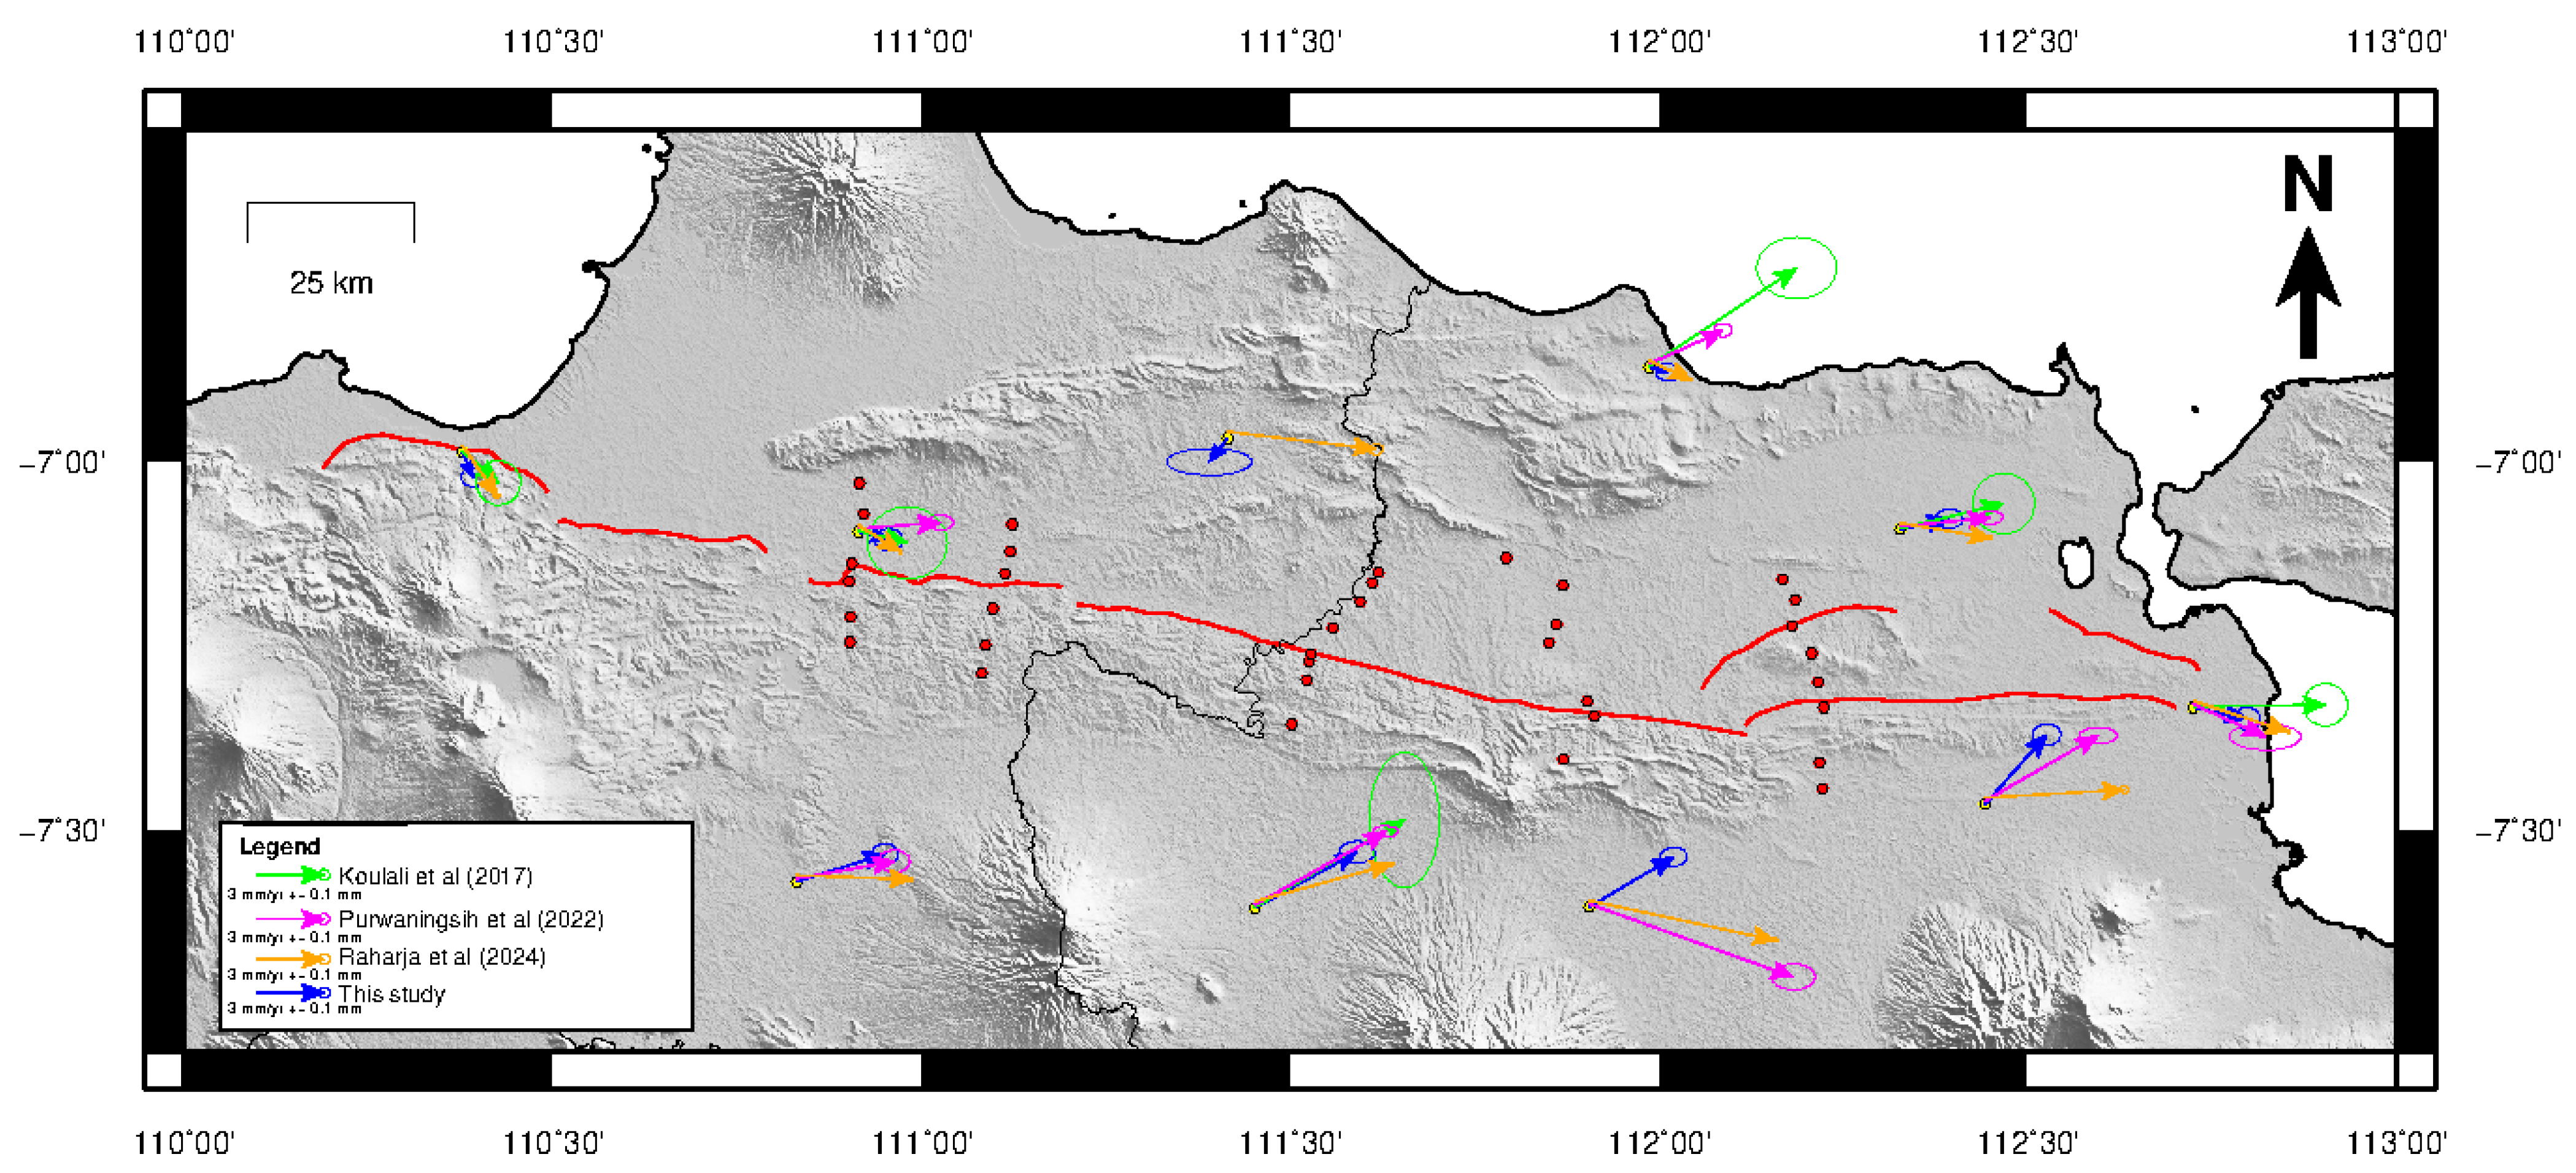
We compiled the previous velocities across the Eastern Java back––arc thrust, namely from Koulali et al. [9] as referred to as velocity of Koulali (VK), from Purwaningsih et al. [20] as referred to as velocity of Purwaningsih (VP), and from Raharja et al. [18] as referred to as velocity of Raharja (VR), and compared it with our estimated velocities for the horizontal component, particularly as shown in Figure 4. We also summarize the detailed velocities of each study in Table 2. The visualization in Figure 6 shows that in some locations, there is an overlap of observations from various studies that show a general conformity of displacement rate direction. However, there are variations in magnitude and direction in specific locations. The eastern region shows more significant variations between studies, which may indicate the complexity of deformation in the area.

3.2. Regional Scale Strain Rate

Based on our compiled estimates and previous velocities across the Eastern Java back–arc thrust from Koulali et al. [9], Purwaningsih et al. [20], and Raharja et al. [18], we estimated the regional strain rate and its derivative consisting of principal strain rate, maximum shear strain, and dilatation strain rate, as shown in Figure 7. Although the velocities observed in this study are largely consistent with those from previous research, it is essential to note that certain continuous stations were omitted from the analysis. These omitted stations exhibit differing displacement rates, suggesting significant variations in both magnitude, direction, and uncertainty of displacement rate, which influence the strain rate distribution.
The principal strain rate result shows a similar Northwest––Southeast trend between this study and the VK velocity model. However, our study shows a slightly lower magnitude of compressional strain than VK. On the other hand, the principal strain rate result based on the VP and VR velocity models shows a clockwise change, with the lowest compressional strain among all velocity models. One interesting fact is that the principal strain rates, in both pattern and magnitude within the eastern side of the back–arc thrust near the Surabaya cities, are consistent.
The estimated maximum shear strain rate shows almost similar spatial variation with moderate differences in their magnitudes. We also obtained a consistently, relatively higher maximum strain rate on the eastern side of the back–arc thrust. In addition, all models show maximum shear strain rate contrast between the west side and the east side of the Waru Fault. This result indicates that the parallel motion change is increasingly eastward controlled by the Blumbang and Waru Faults, which support the slip partitioning of Java back–arc thrust [9].
The distribution of the dilatation strain rate is clearly not the same since magnitude is not always discussed, but also, the negative strain corresponds to compression, and the positive strain corresponds to extension. The dilatation strain rate based on this study and the VK velocity model shows a similar distribution compared to the other two, while the VP and VR exhibit east– and west–side delimitation between compressional and extensional regions. Note that VP velocity model did not remove the post–seismic deformation due to the 2006 Java tsunami earthquake, while those results also may indicate the fault control between the Cepu, Waru, and Blumbang Faults [20].
Our regional geodetic strain rate is comparably consistent with those of Gunawan et al. [19] and Purwaningsih et al. [20] since their strain rate maps showed a similar large compressional dilatation rate extending from Central Java to the east, approaching the Madura Strait. However, some regions near the CTBN station in Purwaningsih et al. [20] were slightly extensional. The extensional signal might correspond to the local response of stress release due to previous events.
The Sunda Arc is part of the global deforming zone included in the Global Strain Rate Model estimated from the compiled global velocities [16]. The estimated dilatational strain rate shows high contraction along the Java subduction and its back–arc thrust, which is consistent with our regional scale strain rate. The global model presents individual grid cells consisting of 0.2 (latitudinal) by 0.25 (longitudinal) in dimension. Meanwhile, our model presents higher resolution depicting short wavelength features in the region [34].

3.3. Principal Strain Rate with Additional Campaign Observation

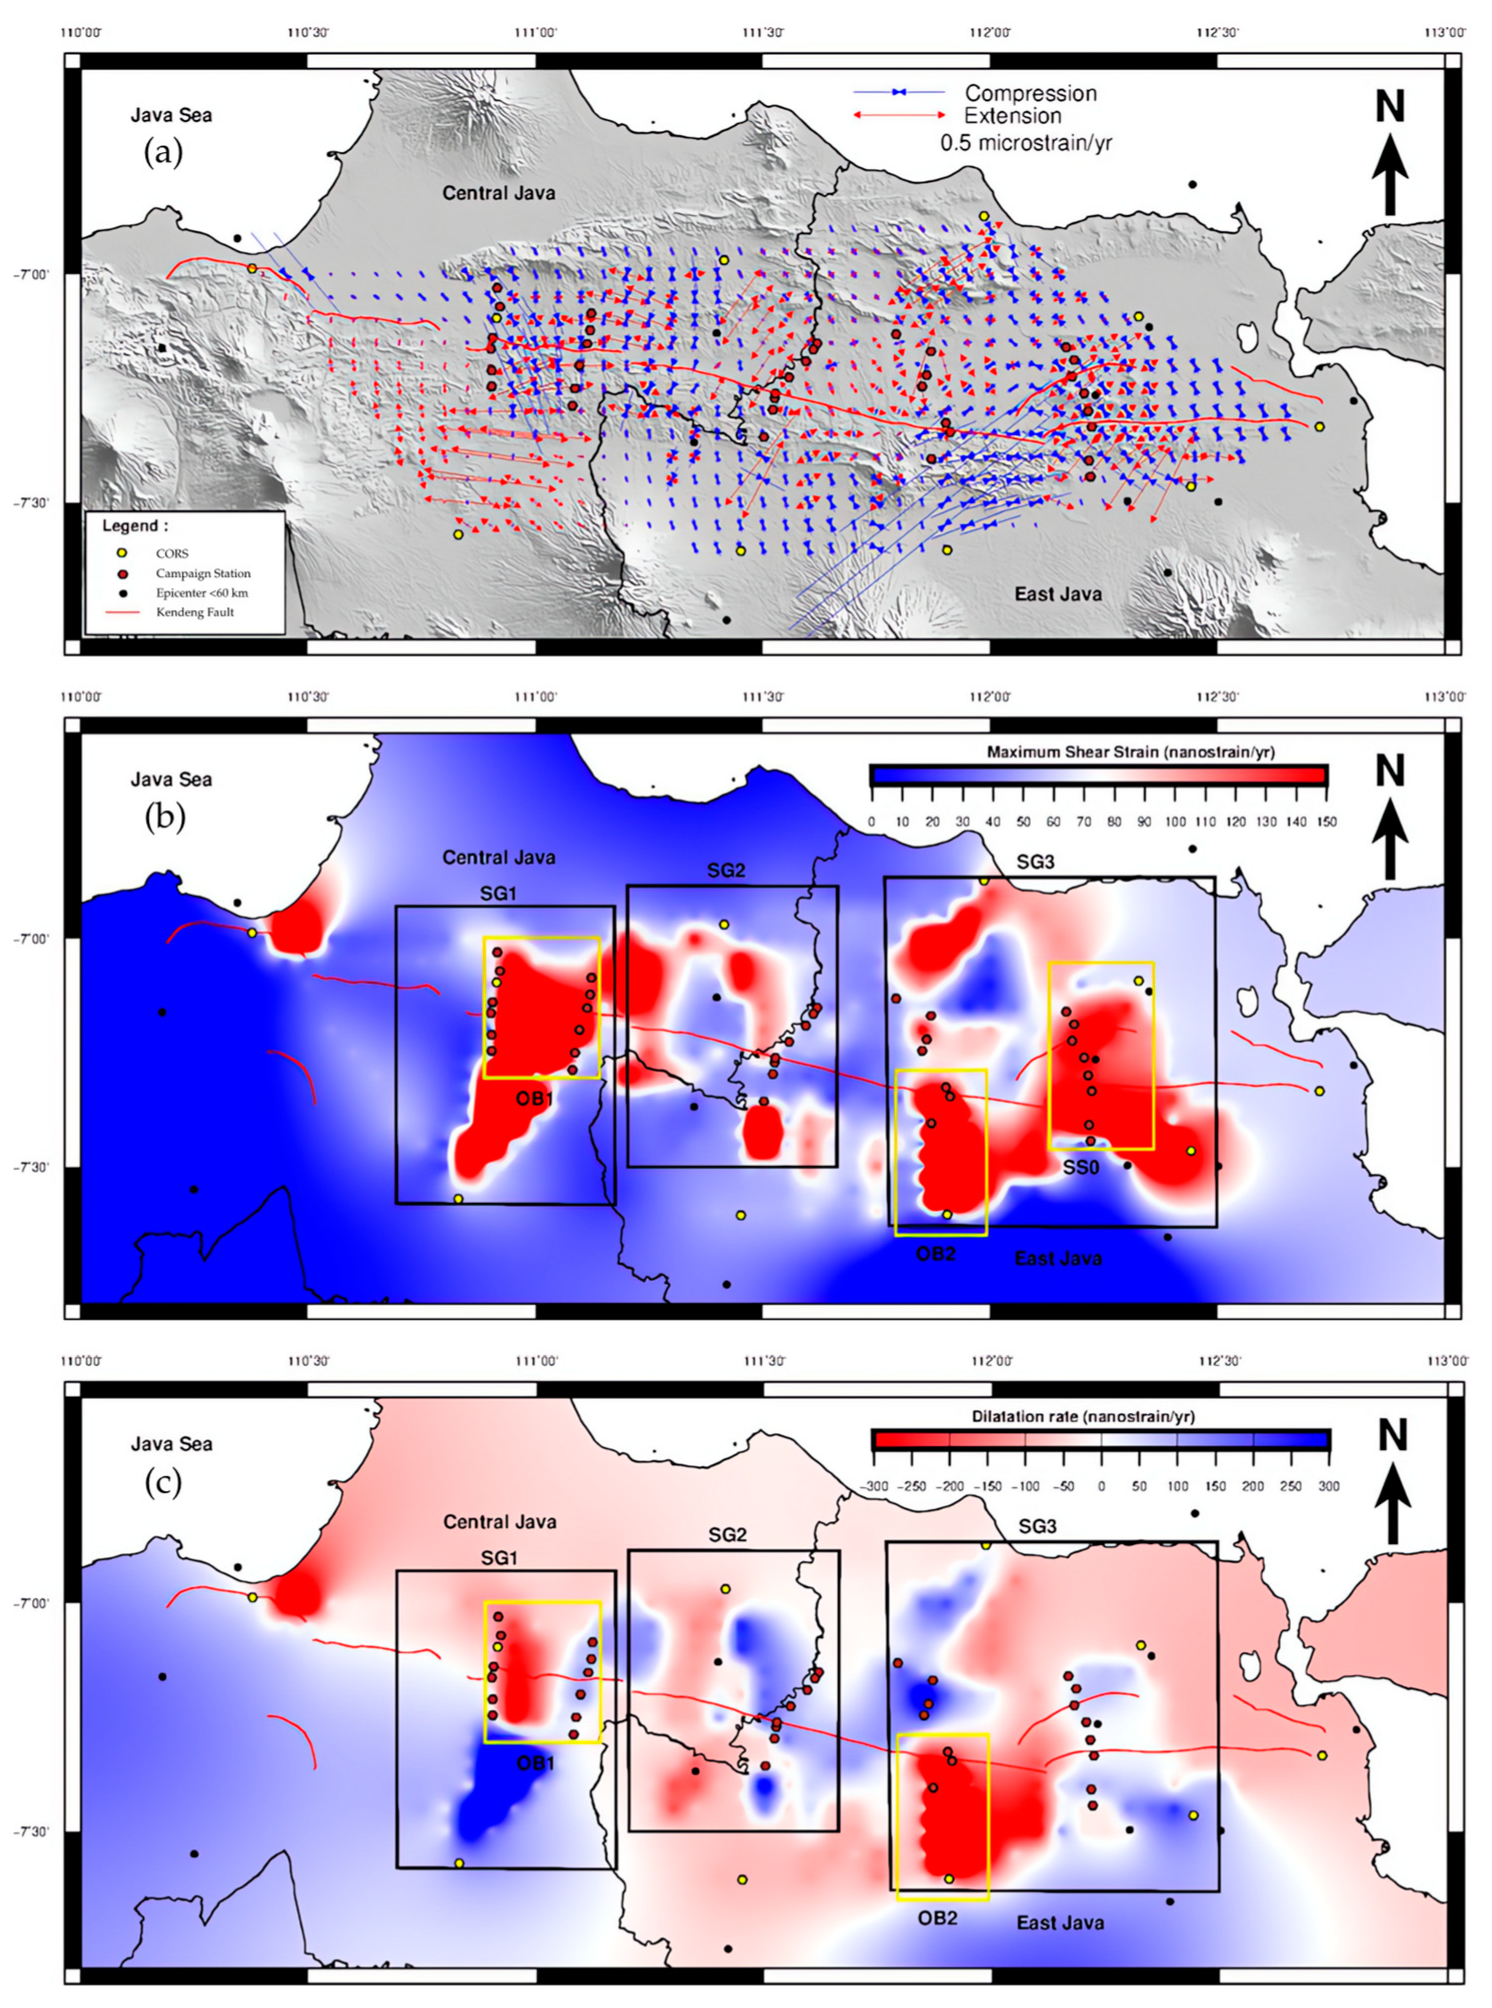
The strain was calculated using the VISR algorithm, which calculates the strain value from the interpolated velocity around the Kendeng Fault. Figure 8a is a visualization of the principal strain rate. The visualization shows that the compression and extension processes around the Kendeng Fault have a high spatial variation. Compression and extension values around the Kendeng Fault have varying values, with a range of values in compression of −2.24 to 0.086 μstrain/year and a range of extension values of −0.73 μstrain/year. Large compression strains are also observed around the Grobogan District (111° E, 7.2° S) and Nganjuk District (111.9° E, 7.4° S).
We observed primarily compressional zones along the Eastern Java back–arc thrust, except for the east side of the Cepu and Demak Faults, which showed extensional tendencies (Figure 8). However, those extensions may arise from a need for observation points since the distance between the surrounding stations is relatively far compared to other segments. Therefore, we need an additional observation station across the east side of the Cepu and Demak Faults.

3.4. Maximum Shear and Dilatation Strain Rate with Additional Campaign Observation

In this study, the maximum shear strain rate is 0.0013 to 1.12 μstrain/year. Figure 8b is the visualization result of the maximum shear strain rate. The visualization results show the high value of the maximum shear strain rate in the western and southeastern regions. The high value of the maximum shear strain rate indicates the presence of strike–slip faults, so the potential for earthquakes in the region is quite high.
In contrast with the regional scale of strain rate, based on additional campaign stations, we obtained a more localized maximum shear strain rate along the Purwodadi Fault, the northern and southern part of the Cepu Fault, the Waru Fault, and the Blumbang Fault. In this analysis, we also obtained an insignificant maximum shear strain rate across the Demak Fault and the central Cepu Fault, which needs to be investigated considerably by additional campaign stations.
The dilatation rate in this study has a value range of −2.24 to 0.698 μstrain/year. The distribution of the dilatation rate values is shown in Figure 8c. The visualization shows the magnitude of the compression and extension process. Negative values in the dilatation rate results of this research are more dominant than positive values, which indicates that the compression process is found more around the Kendeng Fault.
The dilatation contrast was also observed across the Purwodadi Fault and the east and west sides of the Cepu Fault, a considerably compressional zone that implies high strain accumulation related to dip–slip faulting. Meanwhile, several spots show extensional regions with recorded seismicity. In this analysis, we observed that the maximum shear strain rate along the Demak and central Cepu Faults was insignificant. This finding underscores the necessity for further investigation to gain a deeper understanding of the geophysical processes at play. To achieve this, we recommend deploying additional campaign stations in these areas, allowing for more comprehensive monitoring and data collection. Such efforts could enhance our insights into the fault dynamics and contribute to a better understanding of regional tectonic activity.

3.5. Implication of Stress Accumulation and Earthquake Potential Stress

The geodetic strain rate within the deforming zone reflects the stress accumulation that will be released in future earthquakes. Although the recorded seismicity based on modern instruments shows limited occurrences [35], evaluating the stress field is essential to provide earthquake mechanisms, which provide valuable insight into future seismic hazards. The extension of back–arc thrust across the Flores shows the north––south orientation of the stress field perpendicular to the trench and has dominant thrust faulting [35]. The north––south orientation of the stress field is consistent with our generally north––south compression for long wavelength features from regional scale strain rate (Figure 7). On the other hand, the limited stress data by the World Stress Map (WSM) based on the focal mechanism demonstrates a slightly northern trend in Central Java and a gradual shift to the NE in East Java [36]. This trend is pretty similar to a gradual shift of principal strain rate from the NW trend in Central Java to the NE trend in East Java (Figure 7).
We evaluated the seismic moment accumulation rate for assessing earthquake potential based on the estimated strain rate, as has been demonstrated in previous studies [18,37,38]. The moment accumulation rate was calculated based on Ward [39], which originated from Kostrov [40] as follows:
i j = 2 μ H i = 1 n j = 1 n A i j Max   ( ε ˙ 1 , i j ,   ε ˙ 2 , i j )
where i j is the moment accumulation rate, μ is the rigidity, H is the depth of the seismogenic layer at which most of the earthquakes occur, A i j is the gridded surface area, and ε ˙ 1   and ε ˙ 2 are the absolute eigenvalues of the strain rate tensor of the grid cells within each seismogenic zone.
We assumed the rigidity is set to 30 GPa, where the elastic thickness H is fixed at a maximum of 12.5 km, according to Purwaningsih et al. [20]. We divided the seismogenic zone into three main segments, SG1, SG2, and SG3, as shown in Figure 8. In SG1, with a total area of approximately 2975 km2, the seismic moment accumulation rate was estimated to be 1.69 × 10 17 N m/year. In SG2, with a total area of approximately 3450 km2, the seismic accumulation rate was estimated to be 1.44 × 10 17 N m/year. Meanwhile, in SG3, with a total area of approximately 4100 km2, the seismic accumulation rate was estimated to be 3.01 × 10 17 N m/year. According to previous studies, historical earthquakes based on the estimated magnitude and fault slip rate in East Java were about 181 ± 16 years ago [20,41]. We computed the seismic moment of SG1, SG2, and SG3, accumulating the moment rate to date, suggesting earthquake potentials of Mw 6.9, Mw 6.9, and Mw 7.1, respectively.
As mentioned above, the dilatation rate and maximum shear strain were considered as oblique and strike–slip earthquake potential. We also evaluated the earthquake potential based on the earthquake mechanism shown by the strain rate signal (Figure 8) divided by the oblique zone as OB1 and OB2 and the strike–slip zone as SS0. We obtained the moment accumulation rates of OB1, OB2, and SS0 are 7.88 × 10 16 N m/year, 1.20 × 10 17 N m/year, and 6.41 × 10 16 N m/year, respectively. If those moment accumulation rates last for 181 ± 16 years, they would be considered as Mw 6.7, Mw 6.8, and Mw 6.6 earthquake potential. The M6– to M7–class earthquake potential in the back–arc thrust along Eastern Java is aligned with previous studies [18,20,41] and historical earthquakes along the extension of the back–arc thrust from the Flores [12,13], the Lombok [4,5,6,7,8], the Bali [14], and the Situbondo [15] earthquakes.
The strain rate modeling in this study has certain limitations. We did not adjust the parameters related to fault geometry. Additionally, we presumed that the secular motion is linear throughout the brief interseismic period. Instead of advanced optimizations like variational inference, we employed a straightforward optimization approach [42]. These limitations ought to be considered in future studies. The findings from this research offer preliminary insights to refine the detailed strain rate distribution utilizing dense GNSS data, which include continuous and campaign observations.

4. Conclusions

The back–arc thrust region from Eastern Java to Flores is dominated by the arc–continent collision between the Australian Plate and the Eastern Sunda Arc. The tectonic regime implies that seismotectonic and volcanic hazard occurrences are high. Westward migration on several previous large earthquakes implies that Eastern Java is a highly active deformation. We analyzed recent and dense GNSS observations of continuous and campaign stations to investigate the detailed crustal and strain accumulation along the Eastern Java back–arc thrust system. We obtained very detailed active tectonics along the Eastern Java back–arc thrust, with high spatial variation. Based on the maximum shear strain rate and dilatation strain rate, we would benefit from determining whether the corresponding segment is strike–slip, dip–slip, or oblique. As a result, this study could significantly reshape how we assess seismic hazards in the region moving forward. Its findings may pave the way for more informed strategies and better preparedness for future seismic events.

Supplementary Materials

The following supporting information can be downloaded at https://www.mdpi.com/article/10.3390/geosciences14120346/s1. Table S1: Detailed magnitude of the secular motion during 2016 to 2023. The columns are campaign stations name [Station Name], velocity [EW, NS, UD], uncertainty [σEW, σNS, σUD].

Author Contributions

Conceptualization, N.W. and C.P.; formal analysis, N.W., C.P., Y.Y., I.H.A., M.F.A. and S.A.R.; investigation: N.W. and C.P.; data curation: N.W., C.P., Y.Y., I.H.A., M.N.C., E.A., O.P., M.F.A. and S.A.R.; writing—original draft preparation, I.H.A., M.F.A. and S.A.R.; writing—review and editing, N.W., C.P. and Y.Y.; visualization, M.F.A. and S.A.R. All authors have read and agreed to the published version of the manuscript.

Funding

This research was funded by the Strategic Research Collaboration (KATALIS) 2024 with contract number: 3771/UN1/DITLIT/PT/01/03/2024 from the Directorate General of Higher Education, Ministry of Education and Culture of Indonesia.

Data Availability Statement

Data is contained within the article or Supplementary Materials.

Acknowledgments

The authors would like to express their gratitude to the anonymous reviewers for their insightful feedback and constructive suggestions, which have greatly contributed to the improvement of this study. We are also deeply thankful to the Geospatial Information Agency (BIG) for providing the essential data utilized in this research. Most figures were generated by the Generic Mapping Tools [43].

Conflicts of Interest

The authors declare no conflicts of interest.

References

  1. Silver, E.A.; Reed, D.; McCaffrey, R. Back Arc Thrusting in the Eastern Sunda Arc, Indonesia: A Consequence of Arc–Continent Collision. J. Geophys. Res. 1983, 88, 7429–7448. [Google Scholar] [CrossRef]
  2. Hutchings, S.J.; Mooney, W.D. The Seismicity of Indonesia and Tectonic Implications. Geochem. Geophys. Geosyst. 2021, 22, e2021GC009812. [Google Scholar] [CrossRef]
  3. Clements, B.; Hall, R.; Smyth, H.R.; Cottam, M.A. Thrusting of a Volcanic Arc: A New Structural Model for Java. Petrol. Geosci. 2009, 15, 159–174. [Google Scholar] [CrossRef]
  4. Kusuma, A.R.; Pratama, C.; Widjajanti, N.; Yulaikhah; Prayoga, O.; Kurniasari, E.D. Spatiotemporal Postseismic Due to the 2018 Lombok Earthquake Based on InSAR Revealed Multi Mechanisms with Long Duration Afterslip. J. Appl. Geod. 2024, 18, 473–482. [Google Scholar] [CrossRef]
  5. Yang, X.; Singh, S.C.; Tripathi, A. Did the Flores Backarc Thrust Rupture Offshore during the 2018 Lombok Earthquake Sequence in Indonesia? Geophys. J. Int. 2020, 221, 758–768. [Google Scholar] [CrossRef]
  6. Supendi, P.; Nugraha, A.D.; Widiyantoro, S.; Pesicek, J.D.; Thurber, C.H.; Abdullah, C.I.; Daryono, D.; Wiyono, S.H.; Shiddiqi, H.A.; Rosalia, S. Relocated Aftershocks and Background Seismicity in Eastern Indonesia Shed Light on the 2018 Lombok and Palu Earthquake Sequences. Geophys. J. Int. 2020, 221, 1845–1855. [Google Scholar] [CrossRef]
  7. Sasmi, A.T.; Nugraha, A.D.; Muzli, M.; Widiyantoro, S.; Syuhada, S.; Muttaqy, F.; Zulfakriza, Z.; Wei, S.; Priyono, A.; Afif, H.; et al. Shear Wave Splitting of the 2018 Lombok Earthquake Aftershock Area, Indonesia. Geosci. Lett. 2023, 10, 7. [Google Scholar] [CrossRef]
  8. Gunawan, E.; Amey, R.; Elliott, J.; Widiyantoro, S.; Puspito, N.T.; Hanifa, N.R.; Syamsuddin; Hussain, E. Coseismic Deformation of the 19 August 2018 Mw 7.2 Lombok Earthquakes, Indonesia, Estimated through InSAR and GPS Observations. Nat. Hazard 2023, 119, 545–558. [Google Scholar] [CrossRef]
  9. Koulali, A.; McClusky, S.; Susilo, S.; Leonard, Y.; Cummins, P.; Tregoning, P.; Meilano, I.; Efendi, J.; Wijanarto, A.B. The Kinematics of Crustal Deformation in Java from GPS Observations: Implications for Fault Slip Partitioning. Earth Planet. Sci. Lett. 2017, 458, 69–79. [Google Scholar] [CrossRef]
  10. Natawidjaja, D.H.; Sapiie, B.; Pamumpuni, A.; Marliyani, G.I.; Daryono, M.R. Baribis–Kendeng Thrust–fold Zone of Java, Indonesia: New Evidences of Active Back Arc Tectonics and their Implications to Seismic Hazards. In Proceedings of the Joint Convention Malang 2017, HAGI–IAGI–IAFMI–IATMI (JCM 2017), Malang, Indonesia, 25–28 September 2017. [Google Scholar]
  11. Marliyani, G.I. Neotectonics of Java, Indonesia: Crustal Deformation in the Overriding Plate of an Orthogonal Subduction System. Ph.D. Thesis, Arizona State University, Tempe, AZ, USA, 2016. [Google Scholar]
  12. Beckers, J.; Lay, T. Very Broadband Seismic Analysis of the 1992 Flores, Indonesia, Earthquake (Mw = 7.9). J. Geophys. Res. 1995, 100, 18179–18193. [Google Scholar] [CrossRef]
  13. Pranantyo, I.R.; Cummins, P.R. Multi–Data–type Source Estimation for the 1992 Flores Earthquake and Tsunami. Pure Appl. Geophys. 2019, 176, 2969–2983. [Google Scholar] [CrossRef]
  14. Ekström, G.; Nettles, M.; Dziewoński, A.M. The Global CMT Project 2004–2010: Centroid–moment Tensors for 13,017 Earthquakes. Phys. Earth Planet. Inter. 2012, 200–201, 1–9. [Google Scholar] [CrossRef]
  15. Patimah, S.H.; Gunawan, E.; Widiyantoro, S.; Triyoso, W. A Blind Thrust Fault Ruptured during the 10 October 2018 Situbondo, East Java, Indonesia, Earthquake Estimated using GNSS Data. Geotech. Geol. Eng. 2022, 40, 5717–5724. [Google Scholar] [CrossRef]
  16. Kreemer, C.; Blewitt, G.; Klein, E.C. A Geodetic Plate Motion and Global Strain Rate Model. Geochem. Geophys. Geosyst. 2014, 15, 3849–3889. [Google Scholar] [CrossRef]
  17. Heliani, L.S.; Pratama, C.; Wibowo, A.; Sahara, D.P.; Susilo, S.; Wibowo, S.T.; Safi’i, A.N.; Prayoga, O.; Sudrajat, A.; Fuady Bisri, M.B.; et al. Strain Accumulation in the Mentawai Forearc Sliver, Indonesia, Inferred from Continuous GNSS–derived Strain Rate. Geod. Geodyn. 2024, 1–6. [Google Scholar] [CrossRef]
  18. Raharja, R.; Ito, T.; Meilano, I. Evaluation of Earthquake Potential using a Kinematic Crustal Block Motion Model in Java, Indonesia, Based on GNSS Observation. J. Asian Earth Sci. X 2024, 11, 100171. [Google Scholar] [CrossRef]
  19. Gunawan, E.; Widiyantoro, S. Active Tectonic Deformation in Java, Indonesia Inferred from a GPS–Derived Strain Rate. J. Geodyn. 2019, 123, 49–54. [Google Scholar] [CrossRef]
  20. Purwaningsih, R.E.Y.; Sekarsari, A.; Sari, T.W.; Pratama, C.; Wibowo, S.T. Active Tectonics of the Eastern Java Based on a Decade of Recent Continuous Geodetic Observation. Geod. Geodyn. 2022, 13, 376–385. [Google Scholar] [CrossRef]
  21. Pratama, C.; Susanta, F.F.; Ilahi, R.; Khomaini, A.F.; Abdillah, H.W.K. Coseismic Displacement Accumulation Between 1996 and 2019 using a Global Empirical Law on Indonesia Continuously Operating Reference Station (InaCORS). JGISE J. Geospat. Inf. Sci. Eng. 2019, 2, 237–244. [Google Scholar] [CrossRef]
  22. Altamimi, Z.; Rebischung, P.; Métivier, L.; Collilieux, X. ITRF2014: A New Release of the International Terrestrial Reference Frame Modeling Nonlinear Station Motions. J. Geophys. Res. Solid Earth 2016, 121, 6109–6131. [Google Scholar] [CrossRef]
  23. Herring, T.A.; King, R.W.; Floyd, M.A.; McClusky, S.C. Introduction to GAMIT/GLOBK Release 10.7. Department of Earth, Atmospheric, and Planetary Sciences Massachusetts Institute of Technology. 2018. pp. 1–50. Available online: https://geoweb.mit.edu/gg/Intro_GG.pdf (accessed on 2 August 2024).
  24. Estey, L.H.; Meertens, C.M. TEQC: The Multi–purpose Toolkit for GPS/GLONASS Data. GPS Solut. 1999, 3, 42–49. [Google Scholar] [CrossRef]
  25. Li, Y. Analysis of GAMIT/GLOBK in High–precision GNSS Data Processing for Crustal Deformation. Earthq. Res. Adv. 2021, 1, 100028. [Google Scholar] [CrossRef]
  26. Lyard, F.H.; Allain, D.J.; Cancet, M.; Carrère, L.; Picot, N. FES2014 Global Ocean Tide Atlas: Design and Performance. Ocean Sci. 2021, 17, 615–649. [Google Scholar] [CrossRef]
  27. Alif, S.M.; Ching, K.E.; Sagiya, T.; Wahyuni, W.N. Determination of Euler Pole Parameters for Sundaland Plate Based on Updated GNSS Observations in Sumatra, Indonesia. Geosci. Lett. 2024, 17, 615–649. [Google Scholar] [CrossRef]
  28. Simons, W.J.F.; Socquet, A.; Vigny, C.; Ambrosius, B.A.C.; Abu, S.H.; Promthong, C.; Subarya, C.; Sarsito, D.A.; Matheussen, S.; Morgan, P.; et al. A Decade of GPS in Southeast Asia: Resolving Sundaland Motion and Boundaries. J. Geophys. Res. Solid Earth 2007, 112, 1–10. [Google Scholar] [CrossRef]
  29. Sagiya, T.; Miyazaki, S.; Tada, T. Continuous GPS Array and Present–Day Crustal Deformation of Japan. Pure Appl. Geophys. 2000, 157, 2303–2322. [Google Scholar] [CrossRef]
  30. Shen, Z.K.; Wang, M.; Zeng, Y.; Wang, F. Optimal Interpolation of Spatially Discretized Geodetic Data. Bull. Seismol. Soc. Am. 2015, 105, 2117–2127. [Google Scholar] [CrossRef]
  31. Xi, C.; Wang, L.; Zhao, X.; Sun, Z.; Zhao, W.; Pang, M.; Wu, F. A Simple Weighting Method for Inverting Earthquake Source Parameters using Geodetic Multisource Data under Bayesian Algorithm. Geophys. J. Int. 2024, 237, 1142–1156. [Google Scholar] [CrossRef]
  32. Li, L.; Wu, Y.; Li, Y.; Zhan, W.; Liu, X. Dynamic Deformation and Fault Locking of the Xianshuihe Fault Zone, Southeastern Tibetan Plateau: Implications for Seismic Hazards. Earth Planets Space 2022, 74, 35. [Google Scholar] [CrossRef]
  33. Herring, T.A.; Melbourne, T.I.; Murray, M.H.; Floyd, M.A.; Szeliga, W.M.; King, R.W.; Phillips, D.A.; Puskas, C.M.; Santillan, M.; Wang, L. Plate Boundary Observatory and Related Networks: GPS Data Analysis Methods and Geodetic Products. Rev. Geophys. 2016, 54, 759–808. [Google Scholar] [CrossRef]
  34. Pratama, C.; Heliani, L.S.; Widjajanti, N.; Gunawan, E.; Anjasmara, I.M.; Novianti, S.T.; Sari, T.W.; Yuni, R.E.; Sekarsari, A. Recent GPS–Based Long Wavelength Crustal Deformation Revealed Active Postseismic Deformation Due to the 2006 Yogyakarta Earthquake. J. Appl. Geod. 2022, 16, 131–141. [Google Scholar] [CrossRef]
  35. Pratama, W.N.; Kita, S.; Imanishi, K. Stress Field Orientation Obtained from Earthquake Focal Mechanisms in Indonesia Region. Master’s Thesis, IISEE-GRIPS, Tokyo, Japan, 2022. [Google Scholar]
  36. Marliyani, G.I.; Helmi, H.; Arrowsmith, J.R.; Clarke, A. Volcano Morphology as an Indicator of Stress Orientation in the Java Volcanic Arc, Indonesia. J. Volcanol. Geotherm. Res. 2020, 400, 106912. [Google Scholar] [CrossRef]
  37. Rahmadani, S.; Meilano, I.; Susilo, S.; Sarsito, D.A.; Abidin, H.Z.; Supendi, P. Geodetic Observation of Strain Accumulation in the Banda Arc Region. Geomat. Nat. Hazards Risk 2022, 13, 2579–2596. [Google Scholar] [CrossRef]
  38. Guns, K.; Sandwell, D.; Xu, X.; Bock, Y.; Yong, L.W.; Smith–Konter, B. Seismic Moment Accumulation Rate from Geodesy: Constraining Kostrov Thickness in Southern California. J. Geophys. Res. Solid Earth 2024, 129, e2023JB027939. [Google Scholar] [CrossRef]
  39. Ward, S.N. A Multidisciplinary Approach to Seismic Hazard in Southern California. Bull. Seismol. Soc. Am. 1994, 84, 1293–1309. [Google Scholar] [CrossRef]
  40. Kostrov, V.V. Seismic Moment and Energy of Earthquakes, and the Seismic Flow of Rocks. Izv. Acad. Sci. USSR Phys. Solid Earth 1974, 1, 23–44. [Google Scholar]
  41. Nguyen, N.; Griffin, J.; Cipta, A.; Cummins, P.R. Indonesia’s Historical Earthquakes: Modelled Examples for Improving the National Hazard Map; Geoscience Australia: Canberra, Australia, 2015. [Google Scholar] [CrossRef]
  42. Sun, L.; Wang, L.; Xu, G.; Wu, Q. A New Method of Variational Bayesian Slip Distribution Inversion. J. Geod. 2023, 97, 10. [Google Scholar] [CrossRef]
  43. Wessel, P.; Smith, W.H.F.; Scharroo, R.; Luis, J.; Wobbe, F. Generic Mapping Tools: Improved Version Released. Eos Trans. Am. Geophys. Union 2013, 94, 409–410. [Google Scholar] [CrossRef]
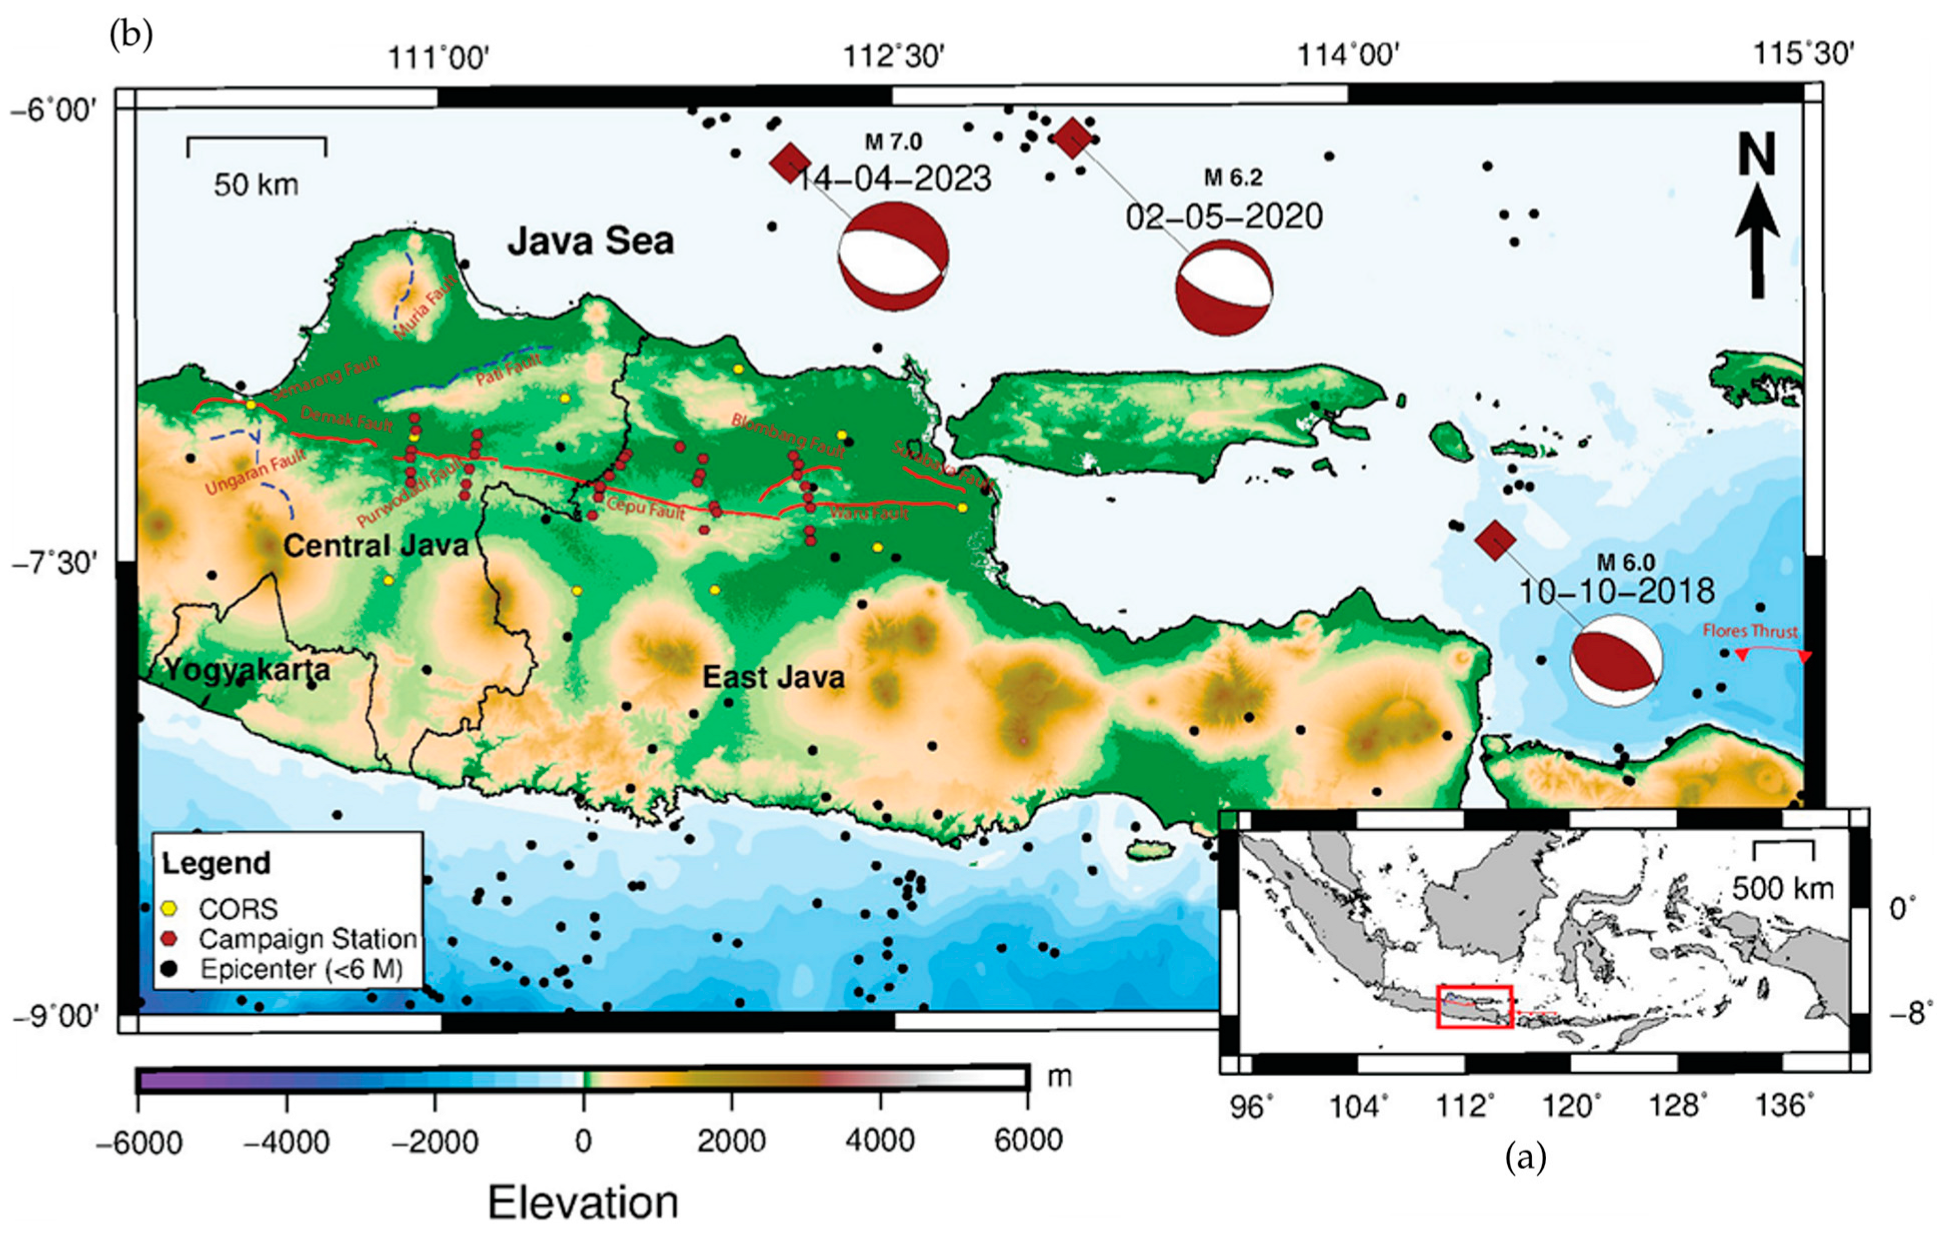
Figure 1. (a) Map of the Indonesian Archipelago. The red box shows the location of the study. (b) An Indonesian seismic map shows the topography and earthquake activity occurring on the island of Java, especially in Eastern Java. The solid black circle shows seismic activity with a magnitude less than 6 as recorded by the United States Geological Survey (USGS), while the diamond and sphere symbols show earthquakes from 2018 to 2023 with a magnitude greater than 6.0. The red line shows the observed fault, and the dashed blue line shows other faults around the study site.
Geosciences 14 00346 g001
Figure 2. (a) Geological age map and (b) Geological lithology map of Eastern Java. The red line shows the observed fault, and the solid green line shows other faults around the study area. The data used for these maps were sourced from the Indonesian Ministry of Energy and Mineral Resources (ESDM).
Geosciences 14 00346 g002
Figure 3. (a) Visual representation of the campaign GNSS time series consisting of the N, E, and U components. (b) Visual representation of the continuous GNSS time series consisting of the N, E, and U components. Red dots denote the daily solution, while blue lines indicate the least square solution.
Geosciences 14 00346 g003
Figure 4. (a) Scatter plot illustrates the relationship between velocity components in the North-South (NS) and East-West (EW) directions. (b) Scatter plot illustrates the relationship between uncertainty components in the NS and EW directions. The red linear trendlines in both subplots provide a visual representation of the data’s underlying trends.
Geosciences 14 00346 g004
Figure 5. (a) Velocity vector and its associated error ellipse referenced to ITRF2014. (b) Velocity vector and its associated error ellipse in reference to Sunda block.
Geosciences 14 00346 g005
Figure 6. Comparison of velocity vector from this study with previous research from Koulali et al. [9], Purwaningsih et al. [20], and Raharja et al. [18].
Geosciences 14 00346 g006
Figure 7. Comparison of the strain in this study and previous research: (a,b) strain visualization of Koulali et al. [9], (c,d) strain visualization of Purwaningsih et al. [20], (e,f) strain visualization of Raharja et al. [18], and (g,h) strain visualization of this research.
Geosciences 14 00346 g007
Figure 8. (a) Distribution of the principal strain rate showing the compression and extension process. (b) Estimated maximum shear strain rate value indicating the presence of strike–slip faults. (c) Estimated dilatation rate value that shows the magnitude of compression and extension values around the Kendeng Fault.
Geosciences 14 00346 g008
Table 1. Detailed magnitude of the secular motion from 2016 to 2023. The columns are continuous stations name [Station Name], velocity [EW, NS, UD], and uncertainty [σEW, σNS, σUD].
No.Station NameVelocity with Respect to ITRF2014Velocity with Respect to Sunda Block
EW
(mm)
NS
(mm)
UD
(mm)
σEW
(mm)
σNS
(mm)
σUD
(mm)
EW
(mm)
NS
(mm)
UD
(mm)
σEW
(mm)
σNS
(mm)
σUD
(mm)
1CBLR23.56−10.381.030.770.261.71−0.83−1.061.030.780.251.71
2CLMG26.43−9.18−6.320.220.170.692.220.48−6.320.250.180.69
3CMAG28.34−6.65−0.590.260.180.774.632.54−0.590.330.200.77
4CMJT26.84−6.59−7.010.200.180.562.783.14−7.010.260.200.56
5CNGA27.78−7.22−7.880.200.150.583.812.27−7.880.250.170.58
6CPWD25.58−9.41−9.210.220.202.251.37−0.36−9.210.260.212.25
7CSBY26.55−10.36−8.000.200.190.562.43−0.51−8.000.230.210.56
8CSEM24.91−10.02−5.340.180.180.570.51−1.15−5.340.220.180.57
9CSLO27.96−7.74−1.210.200.170.654.011.27−1.210.240.180.65
10CTBN25.19−9.77−2.600.200.160.520.85−0.24−2.600.230.160.52
Table 2. Detailed magnitude of the secular motion compiled from previous studies.
No.Station NameKoulali et al. [9] Purwaningsih et al. [20]Raharja et al. [18]This Study
EW ± σ (mm)NS ± σ (mm)EW ± σ (mm)NS ± σ (mm)EW ± σ (mm)NS ± σ (mm)EW ± σ (mm)NS ± σ (mm)
1CBLRN/AN/AN/AN/A6.7 ± 0.13−0.79 ± 0.10−0.83 ± 0.78−1.06 ± 0.25
2CLMG4.68 ± 0.571.13 ± 0.564.07 ± 0.230.37 ± 0.124.1 ± 0.03−0.70 ± 0.032.22 ± 0.250.48 ± 0.18
3CMAG6.76 ± 0.653.94 ± 1.255.92 ± 0.223.32 ± 0.116.2 ± 0.031.70 ± 0.034.63 ± 0.332.54 ± 0.20
4CMJTN/AN/A5.11 ± 0.342.97 ± 0.156.3 ± 0.080.36 ± 0.062.78 ± 0.263.14 ± 0.20
5CNGAN/AN/A9.22 ± 0.40−3.32 ± 0.248.4 ± 0.04−1.80 ± 0.043.81 ± 0.252.27 ± 0.17
6CPWD2.21 ± 0.74−0.54 ± 0.673.70 ± 0.250.27 ± 0.141.9 ± 0.03−1.20 ± 0.031.37 ± 0.26−0.36 ± 0.21
7CSBY5.96 ± 0.410.08 ± 0.393.23 ± 0.66−1.47 ± 0.254.3 ± 0.02−1.40 ± 0.022.43 ± 0.23−0.51 ± 0.21
8CSEM1.64 ± 0.41−1.45 ± 0.41N/AN/A1.6 ± 0.07−2.30 ± 0.030.51 ± 0.22−1.15 ± 0.18
9CSLON/AN/A4.41 ± 0.290.78 ± 0.205.2 ± 0.03−0.18 ± 0.034.01 ± 0.241.27 ± 0.18
10CTBN6.66 ± 0.744.44 ± 0.573.33 ± 0.171.51 ± 0.121.9 ± 0.03−0.87 ± 0.020.85 ± 0.23−0.24 ± 0.16
Disclaimer/Publisher’s Note: The statements, opinions and data contained in all publications are solely those of the individual author(s) and contributor(s) and not of MDPI and/or the editor(s). MDPI and/or the editor(s) disclaim responsibility for any injury to people or property resulting from any ideas, methods, instructions or products referred to in the content.