Abstract
This study conducts a morphodynamic analysis of beaches located in the northern sector of the Gulf of Roses (NW Mediterranean, Spain). The primary objective is to investigate mid-short (2004–2020) term spatial and temporal variations in shoreline position and sedimentological behaviour. The study area covers the northern part of the gulf, spanning 9.86 km, and includes both natural beaches and heavily anthropized ones. The following GIS methodologies were employed to study the variations in the coastline: QGIS for areas and DSAS-ArcGIS for transects, quantifying coastal changes from 2004 to 2020. Sediment samples were collected from both the dry beach and swash areas for each profile. The results reveal minor discrepancies in shoreline evolution data, depending on the method used (transects or areas). Profile-based analysis shows an average annual rate of −0.11 m·y−1 (ranging between 0.53 and −0.55 m·y−1), while areal-based results (2004–2020) indicate a total loss of −20,810 m2 (−1300 m2·y−1). Sediment grain size decreases northward (from 745 to 264 µm in the swash zone). Changes in shoreline position and grain size illustrate the impact of various anthropogenic structures on morphodynamic behaviour. These structures preferentially deposit specific grain sizes and impede sediment transport, which will cause an advance in the position of the shoreline and sediment grain sizes upstream and a reverse process downstream. This study underscores the influence of coastal anthropization on beach morphology and sedimentology, generating distinct morphodynamic behaviour.
1. Introduction
Coastal areas are the most densely populated and developed land areas in the world because of the attraction they gain for their abundant amenities, aesthetic value, and the various ecosystem services they provide [1]. Coastal systems have exhibited high dynamism throughout Earth’s history, rendering them vulnerable to various disturbances that disrupt natural processes [2], thereby influencing their morphology and sedimentology. The central concept of coastal morphodynamics revolves around the interplay between sediment dynamics and morphology [3]. This interaction involves both positive and negative feedback loops, ultimately striving for an equilibrium that is seldom attained, driving changes across diverse temporal and spatial scales [4]. Despite their susceptibility to natural and anthropogenic influences, coastal environments possess significant resilience, owing in part to transitional areas like wetlands and dune systems. These environments serve as natural defences against factors such as extreme wave action [5]. However, disturbances like storms or human activities such as coastal planning and climate change can lead to sediment loss and beach erosion. Given that 37% of the global population depends on coastal resources [6], coastal erosion has emerged as a critical issue in territorial planning. Especially in urbanized coastlines with substantial tourist activity, monitoring has become imperative. Understanding, defining, and evaluating coastal processes are essential to mitigating the adverse impacts of coastal anthropization.
The objective of the present work focuses on the description of the morphological and sedimentological (morphodynamic) changes along the shoreline of the northern sector of the Gulf of Roses (northwestern Mediterranean, Spain), and the effects that anthropogenic constructions in the area have had on them. To achieve this goal, a morphological analysis employing GIS tools (QGIS and DSAS-ArcGIS) was conducted to identify short- to medium-term variations in the coast between 2004 and 2020. Simultaneously, a sedimentological analysis was performed to discern trends in the grain size distribution across the study area.
1.1. Study Area: The Gulf of Roses
The Gulf of Roses is the largest and most extensive bay in the northeast of the Iberian Peninsula (Figure 1). Bounded by two rocky promontories, Cap de Creus to the north and the Montgrí massif to the south, it has a total coastline length of 25 km. These characteristics make the Gulf of Roses a typical embayed beach, between two rocky headlands that limit the flow of onshore–offshore and alongshore sediments [7].
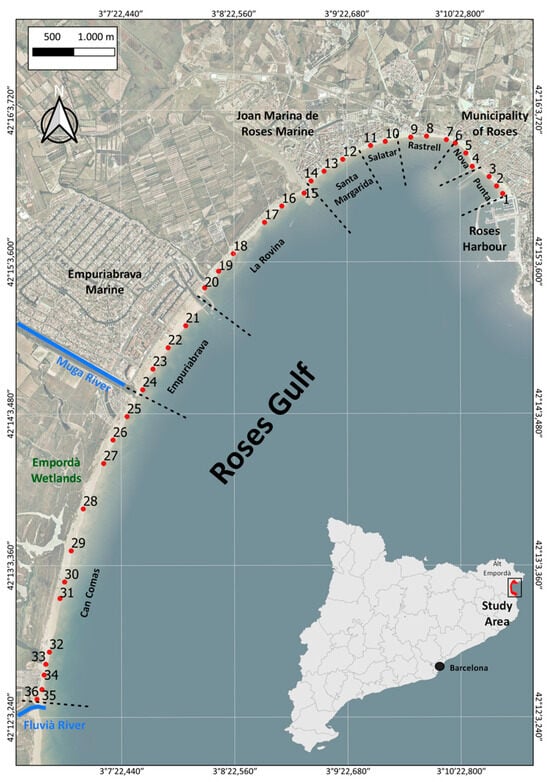
Figure 1.
Location of the study area. Beaches studied and sampling stations (red dots) used for the sedimentological analysis. Mouth of two rivers and the breakwaters ordered numerically according to their distance from the Fluvià River mouth.
The morphology of the Gulf of Roses is defined as a large ellipse created by two tangent ellipses [8], with the minor axes of these ellipses coinciding in direction and position with the extension into the sea of the two rivers that flow into this gulf. These terrestrial contributions are responsible for a low and smooth coastal configuration and the formation of environments such as the Empordà marshes [9,10]. This gulf is part of the Empordà basin located at the North Catalan Margin [11], an ideal environment for the deposition of alluvial materials from the following main rivers: the Fluvià and the Muga Rivers. The Fluvià River, with a hydrographic basin of 1008 km2, exhibits an average flow rate of 9.4 m3·s−1 and a maximum recorded flow rate of 1200 m3·s−1, while the Muga River, with a hydrographic basin of 863 km2, presents an average flow rate of 3.0 m3·s−1 and a maximum recorded flow rate of 950 m3·s−1 [12]. These rivers have very low concentrations of suspended material (<20 mg·L−1), and Liquete et al. [12] demonstrated a low relationship between flow and suspended material. The submarine shelf of the Gulf of Roses is mainly occupied by the prodelta of the two rivers [13]. The gradient of the seafloor is 0.4° on average throughout the inner and middle shelf, except for the areas closest to the rocky coasts (Cap de Creus peninsula and Montgrí massif).
The study area focuses on the northern sector of the Gulf of Roses (Figure 1), covering a length of 10 km, bounded to the south by the mouth of the Fluvià River and to the north by the breakwater of the Port of Roses. The following sedimentary environments are distinguished [9,10]: (a) a fluvial environment, which includes both an alluvial plain and a floodplain, formed by sands and silts deposited by overflows and crevassing; (b) a marsh environment caused by seasonal or permanent flooding. This environment includes many lagoon areas, some dried by anthropic activities, and other marsh and lagoons related to the progradation of the coastal beaches, giving rise to the coastal marsh; and finally, (c) a barrier island, formed by the activity of the waves and coastal drift, and where ancient beach ridges can be seen. According to [14], the beaches in the study area serve both protective and recreational purposes. They comprise natural beaches in the south and urban beaches in the north. The beaches are listed below in their spatial order, from south to north, as follows: (1) Can Comes, (2) Empuriabrava, (3) La Rovina, (4) Santa Margarida, (5) El Salatar, (6) El Rastrell, (7) La Nova, and (8) La Punta (Table 1). The location of the sampling stations, analyses, and interpretation of results followed this spatial sequence. Table 1 outlines the main characteristics of the different beaches studied.

Table 1.
Names of the beaches studied, including the length and width of the beaches, DSAS transects, and sampling stations for each beach.
1.2. Anthropic Interventions in the Study Area
The coast of the Gulf of Roses and the area of the Empordà marshes have attracted the attention of different studies referring to the evolution of the paleolandscape [15,16,17]. For example, between ~3150 BC and the 17th century AD, Ejarque et al. [16] showed the progressive anthropization of the area of Castelló d’Ampuries and the disappearance of the lagoon of Castelló (currently occupied by the Santa Margarida marina harbour), with a progressive passage from periods of grazing to more agricultural periods. Another study by Bouzas et al. [17] focused on the citadel of Roses, located just behind the beaches of Ristell and La Nova, showing a progressive progradation (advance) of the coast from 500 BC to the present, due to the supply of sediments and eustatic stability.
The coastline of the studied area has undergone significant changes over the past 60 years because of the construction of various anthropogenic structures, which are mainly jetties located in the former inlets of the barrier island. Figure 2 and Figure 3 illustrate the historical evolution of the changes experienced by the northern coast of the Gulf of Roses. The 1945 photograph depicts a still pristine coast, with the Muga River mouth bar extending northward at the lower limit. Between the beaches and cultivated fields are marsh and dune areas, while the upper right corner shows the small delta of the Ginjolers stream. In the subsequent 1987 photo, jetties can be observed at the entrances of the Marinas of Empuriabrava (located between the Muga River and the Salins Channel, built in 1967) and Santa Margarida (north of the Grau River, also constructed in 1967), causing the disappearance of marsh and dune areas. A small groin between La Nova and El Rastrell beaches is also noticeable. In the 2020 photo, the main change is observed in the northernmost region, with the removal of the small groin and the construction of jetties (1992) in the delta of the Ginjolers stream.
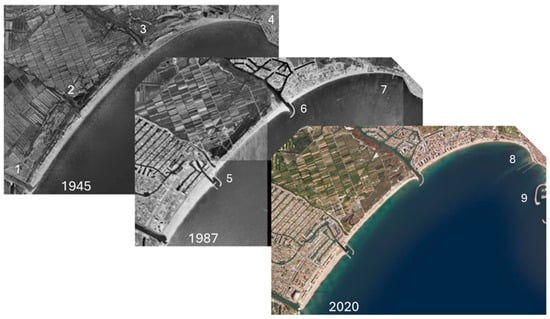
Figure 2.
Historical evolution of the coastline of the study area. In the 1945 photo, a pristine condition of the beach–dune system is observed. Numbers indicate the mouths of the Muga River (1), the Salins Channel (2), the former Grau River (3), and the Ginjolers stream (4). In the 1987 photo, the presence of protection jetties at the entrances to the Marinas of Empuriabrava (5) and Santa Margarida (6) is observed, as well as the groin between the Nova and Rastrell beaches (7). Finally, in the 2020 orto-photomap, we observe the disappearance of the groin and the construction of jetties at the mouth of the Ginjolers stream (8), as well as the breakwaters of the Port of Roses (9).
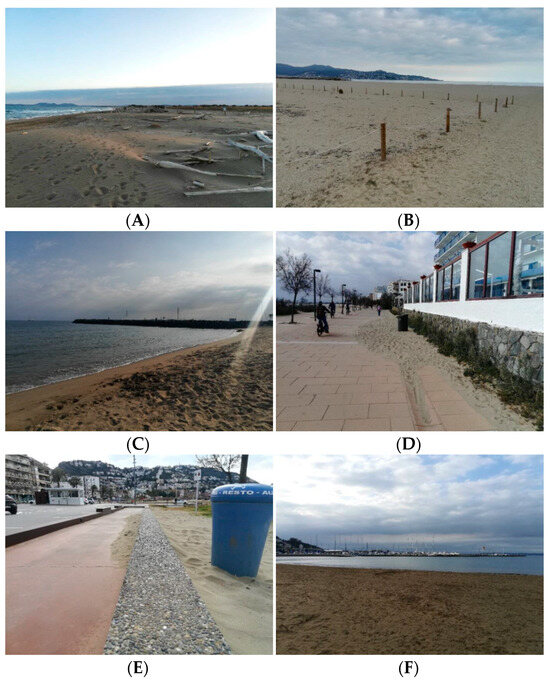
Figure 3.
Representative views of the different beaches in the study area. (A) On the natural beach of Can Comes, you can observe the presence of nebkha-type dunes, originating from the presence of wooden logs deposited during storms. (B) Empuriabrava beach, marked to prevent the trampling of the embryonic dunes and to protect the nests of the Kentish plover (Charadrius alexandrinus). (C) The natural beach of La Rovina, shown from a southerly direction, where you can see the breakwater at the entrance to the Marina of Roses. (D,E) Urban beaches of El Ristrell and La Punta, respectively, where you can observe the accumulations of sand above the promenade, produced by wind transport. (F) View of La Punta beach in an easterly direction, where in the background, you can see the breakwater of the Port of Roses.
As mentioned earlier, the studied beaches encompass various typologies. Both Can Comes beach and La Rovina beach exist within a natural environment, with the former situated within the natural park of “Aiguamolls de l’Empordà”. These beaches feature well-developed coastal dunes, both vegetated and mobile, and employ diverse protective measures, primarily because they are common nesting areas for the Kentish plover (Charadrius alexandrinus). In this context, López-Doriga and Jiménez [18] considered that although the coastal area of the Gulf of Roses is one of the low-lying coastal areas in Catalonia with a higher risk of flooding due to the relative sea level rise, the presence of relatively high beach profiles would result in relatively low flood extents. Empuriabrava beach is in an urban–tourist environment and is subject to anthropogenic pressure, necessitating protective measures to prevent the trampling of embryonic dunes and preserve bird nesting areas. The remaining beaches (Santa Margarida, El Salatar, El Rastrell, La Nova, and La Punta) are urban beaches within the municipality of Roses. These beaches lack dunes, and their landward boundary is the seaside promenade, displaying sand intrusion processes due to wind transport (Figure 3). In urban settings, it is crucial to implement legislative measures aimed at activating protective mechanisms to ensure the regeneration and stabilization of transitional spaces such as dune systems. This is imperative because human activities can significantly impact the viability of these systems [19,20].
Some of the beaches in the study area feature fences delineating dune environments, aiming to minimize human presence and ensure the morphodynamic evolution of the dunes. Additionally, these fences safeguard nesting areas for birds, which are prevalent in the natural environment of the Empordà marsh (Figure 1). In 2010, the Green Book of the State of the Coastal Zone in Catalonia (LVCC) [21] was published, which characterizes the state and evolution of the coastal zone in Catalonia between 1995 and 2004. At that time, most of the coastal protection structures had already been built and most of the major beach nourishment works had already been carried out, resulting in the evolution of the effect of these infrastructures on coastal dynamics.
1.3. Dynamic Characteristics: Waves and Sediment Drift
The Gulf of Roses has a fine and well-sorted material (430 μm ± 230) with erosion rates close to −2.2 m·y−1. Additionally, the report [21] concludes that the main beach problem is the loss of surface due to the impact of storms, particularly relevant for the beaches of La Punta and La Nova. On the other hand, there are accumulations of sediment on the beaches of Empuriabrava, La Rovina, and Can Comes. Parallel to the analysis provided by the LVCC [21], there are coastal regeneration [22] and stabilization [23] projects for the La Punta and La Nova beaches.
On the other hand, coastal dynamics drive coastline variations, primarily influenced by wave action. The study area’s location and the presence of rocky promontories, Cap de Creus and Montgrí Massif (Figure 1), mean that the ENE-SSE component (70–160°) significantly impacts the coastal drift of the examined beaches. Statistical analysis of wave conditions (Table 2) in the region reveals that significant wave height (Hs) is below 1 m 76% of the time, with a peak period (Tp) ranging between 5 and 6 s. The highest recorded Hs was 7.0 m in January 2020 during the Gloria storm. The most important storms affecting the study area have directions between ENE and ESE, concentrated between December and February. Over the study period from 2004 to 2020, four Class IV storms, according to storm classification [24], were documented, with Hs values exceeding 5.1 m and a return time of about 10 years. Additionally, one Class V storm, the “Gloria” storm, occurred in January 2020, with Hs values surpassing 6.0 m and a return time of approximately 50 years. Although the Mediterranean Sea is not considered to be influenced by tides, significant variations in the sea level have been found in studies of the coastline. For example, according to the tide gauge of the port of Barcelona, located 150 km from the Gulf of Roses, the average values of the sea level vary between −0.19 and +0.41 (Puertos del Estado; https://www.puertos.es/es-es/oceanografia/paginas/portus.aspx, accessed on 5 October 2024). Alongshore sediment transport, especially from waves originating in the second quadrant, mobilizes sediments from south to north along the coastline. According to the LVCC [21], the net rates of longitudinal transport estimated using the CERC model for the Gulf of Roses exhibit significant variation in magnitudes. These rates range from 81,900 m3·y−1 in the central area to 64,200 m3·y−1 in the southern zone and are only 3700 m3·y−1 in the northern zone.

Table 2.
Characterization matrix of wave conditions in the Gulf of Roses based on significant height (Hs) and peak period (Tp) data. Data extracted from the SIMAR model, node 2123146 (Longitude: 3.250 E; Latitude: 42.167 N) built from the Puertos del Estado buoy network for the period 2004–2020.
2. Materials and Methods
2.1. Multiannual Quantitative Analysis of the Variation in the Coastline
The quantitative analysis of the variations in the coastline during the period 2004–2020 was carried out using a Geographic Information System (GIS). The analysis was carried out using the following methodologies: (1) calculation by areas, forward and backwards, with the free software QGIS version 3.22, and (2) calculation of the rates of variation in the shoreline position by transect with the DSAS 4.0 extension (Digital Shoreline Analysis System) developed by the USGS [25] within ArcGIS ® v.9.2 software. In Figure 3, you will find the respective maps with the two types of analysis for each of the beaches studied.
Orthophotos from the Cartographic and Geological Institute of Catalonia (ICGC), from the years 2004, 2008, 2012, 2016, and 2020, with a resolution of 0.25 m·pixel−1, were used to digitize the coastline. Orthophotomaps have certain systematic errors, mainly associated with restitution processes and the definition of the coastline. The error associated with restitution is proportional to the working scale, and for a restitution scale of 1:2500, it would be approximately ±0.5 m. The error in the definition of the coastline is related to the selected elevation for defining the coastline and the slope of the considered coastal profile. In our study area, this horizontal indeterminacy would be less than ±2.5 m [21]. The accumulation of errors indicates a final precision in the position of the coastlines in this study of less than ±3.5 m. Orthophoto images were visualized using a WMS (Web Map Service) server. The year 2004 was selected as the initial date of the analysis because the last analysis prepared by the LVCC [21] was for the period 1997–2004.
The analysis was carried out individually for each of the beaches that make up the study area. For the physical limits of each beach, we followed the criteria of the LVCC [21] and selected the presence of natural physical limits, such as rivers, or artificial limits, such as the presence of ports or coastal protection structures. The scale of the ICGC orthophotomaps is 1:2500. Following the working methodology of the LVCC [21], the digitization of the coasts near the Fluvià and Muga mouths was ruled out.
2.1.1. Analysis by Areas
The digitization of polygons using QGIS makes it possible to determine the rates of advance or retreats based on the calculation of areas. The use of zones is very beneficial in determining the total sedimentary balance of a system. The digitization of the polygons was carried out with the help of masks to delimit the boundaries of each beach and to be able to digitize the polygons so that only the segments relative to the coast vary annually. For the calculation of surfaces, the field calculator inside the attribute table was used, and the areas of intersection between the polygon for the initial date and the final date were calculated. In this analysis, only the oldest coast was digitized, from 2004 in the present work, and that of 2020. Figure 4B shows an example of the areal analysis for La Punta beach.
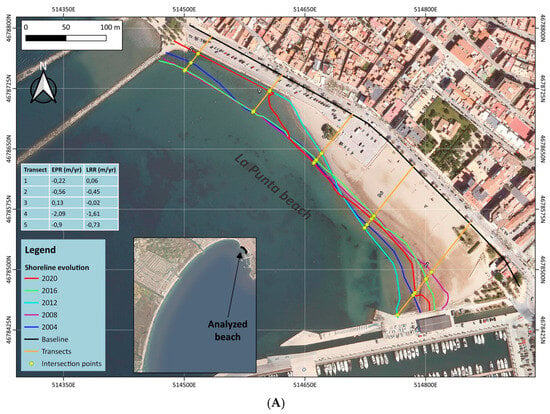
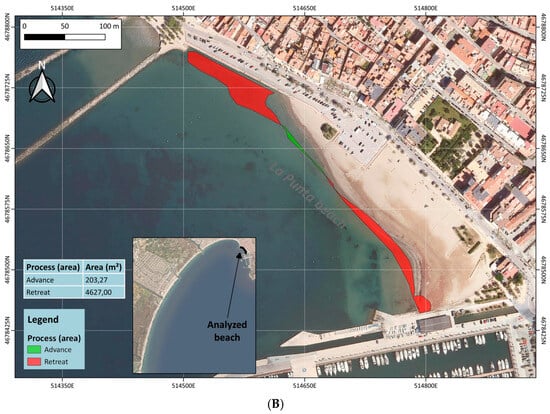
Figure 4.
Results of the two methods used to study the shoreline position. (A) Example of the DSAS analysis for La Punta beach. Orange lines indicate the transect location spaced every 100 m. (B) Example of the analysis carried out with QGIS software on the same beach. The red area is the receding (eroded) area, while the green area is the advanced area between 2004 and 2020.
From the data on the accretion and erosion surfaces, two parameters like those obtained in the analysis by transects were calculated, including the Areal End Point Rate (EPRa; m2·y−1) and the Normalized Areal End Point Rate (EPRna; m2·y−1·m−1 or m·y−1). The EPRa was calculated by means of the relationship between the total balance and the number of years between the dates considered, resulting in the surface area variation rate per year (m2·y−1). The EPRna consists of the EPRa normalized with respect to the length of the considered beach, resulting in the rate of variation in the surface per linear meter of beach and per year (m2·m−1·y−1).
2.1.2. Transect Analysis: The DSAS Extension
The DSAS 4.0 extension for ArcGIS [25] can be used to calculate the rates of variation and distances between different shorelines from transects. The operation of the extension is based on the following three steps: (1) define a reference line or baseline, from which the theoretical distances of the different annual positions of the shoreline will be calculated for the same transect, (2) digitize the shorelines for each of the years studied, and (3) establish the transects by statistical calculation. Statistically, the three main parameters that measure the evolution of the coastline are the NSM (Net Shoreline Movement); the EPR (End Point Rate), and the LRR (Linear Regression Rate). The NSM reports the distance between the oldest and youngest shorelines for each transect. The EPR is the annual rate of change in the position of two coastlines, i.e., the oldest and the most recent. It is a very useful method for coasts with a monotonous evolutionary behaviour and without significant changes in their trends, but it is rather limited for coasts with a dynamic behaviour since it does not allow for identifying inter-annual changes [25]. On the other hand, the LRR uses all available positions of the coasts within a time band. From these positions in the form of points, a linear regression line was created, whose slope is the evolutionary rate of that transect. See Figure 4A for an example of transect analysis for La Punta beach.
In this study, the presence of boardwalks was used as reference lines or baselines. The distance established between transects was 100 m. For the analysis of this work, the Linear Regression Rate (LRR) was used to characterize the evolutionary state of the beaches and to calculate the rates of advance and retreat. To represent the results in tabular form, the mean LRR value of all transects for each beach was averaged.
DSAS presents a whole set of statistical parameters associated with the analysis by transects. In addition to those indicated above, we also calculated the WLR (Weighted Linear Regression), the ECI (Confidence of the End Point Rate), the LSE and the WSE (Standard Error of the Estimate), the LCI and the WCI (Standard Error of the Slope with Confidence Interval), the LR2 and the WR2 (the R-squared statistic), the LMS (Least Median of Squares), the EPRuncy (the uncertainty associated with the EPR), and the LCI (the confidence interval associated with the LRR parameter).
2.2. Grain Size Analysis
For grain size analysis, 36 sampling stations were established, distributed along the 10 km of the study area. Sampling planning and station location were carried out with the help of GIS tools. The stations were distributed between 160 and 460 m apart, depending on the length of each beach, which resulted in a sample every 270 m. The sampling of the sand was carried out over 3 days during the month of February 2022. For each station, 2 samples were taken, one in the area closest to the berm, classified as a dry area, and another closer to the coast, classified as a wet beach. In total, 72 sediment samples were analysed to determine their granulometric characteristics and to identify their variation in space. The grain size distribution was analysed using a Coulter LS 230 particle analyser and mechanical sieving for samples with grain sizes greater than 2 mm. The Coulter LS 230 measures the volume percentages of particles between 0.04 and 2000 μm in size, which are the detection limits of the analyser. The analysis of fractions greater than 2000 μm was carried out by dry mechanical sieving of the samples, with meshes of 2000 μm, 2500 μm, 4000 μm, and 5000 μm. The values of the upper fraction were added to the lower fraction measured with the analyser. The statistical treatment and the different granulometric parameters were obtained by the moment’s method [26] using the program Gradistat v9.1 [27].
3. Results
3.1. Areal Evolution of Beaches
The study area experienced an overall net loss of −20,810 m2, with an areal beach gain of 33,828 m2 and a loss of 54,638 m2. Only Empuriabrava beach showed a net gain in surface area of 6148 m2. The net balance of Can Comes beach was closest to 0, with an EPRna of −0.006. The remaining beaches exhibited a negative net area balance. La Rovina beach suffered the most significant surface area loss of approximately 12,000 m2 between 2004 and 2020 (Table 3). The graph of EPRna values (Figure 5) clearly distinguishes two zones as follows: a zone of neutral or positive values (advance), which includes the beaches of Can Comes and Empuriabrava with a length of about 5 km, and a zone of negative values (erosion) in the rest, which shows a diversity of values.

Table 3.
Surfaces of accretion, erosion, and total balance from 2004 to 2020, for the studied beaches. The relationship between the total balance and the number of years between the dates under consideration (EPRa) and the EPRa normalized with respect to the length of the respective beach (EPRna) are also indicated.

Figure 5.
EPRan value graph (see Table 3) of the study area.
3.2. Evolution of the Shoreline
Because of the high morphological variability in the Fluvià and Muga River mouths, these areas were excluded from the transect analysis. Beaches with larger coastal perimeters were assigned a higher number of transects. Typically, in studies examining shoreline variations, the following statistical parameters provided by DSAS analysis are commonly utilized: Net Shoreline Movement (NSM), End Point Rate (EPR), and Linear Regression Rate (LRR).
The Can Comes and Empuriabrava beaches consistently exhibit positive values across all three parameters. These beaches, covering a total length of 5 km and encompassing 51 out of the 97 transects conducted in the study area, are also the least affected by human activities. Can Comes beach, located between the mouths of the Fluvià and Muga Rivers (Figure 1), is the longest, with 38 profiles and a length of approximately 4 km. It demonstrates an average NSM value of 2.94 m, with NSM values ranging from −17.55 m to 20.94 m, and positive values for EPR and LRR of 0.18 and 0.40 m·y−1, respectively (Table 3). Empuriabrava beach, located north of Can Comes beach and delimited between the mouth of the Muga River and the protective dike at the entrance to the Marina of Empuriabrava, demonstrates the highest positive values among all parameters (Table 3), with values of NSM = 7.61 m, EPR = 0.48 m·y−1, and LRR = 0.53 m·y−1.
The remaining six beaches exhibit negative values for all parameters (Table 4). The average NSM values range from −9.21 for La Punta beach to −1.58 for Salatar beach. La Punta beach has the most negative values for EPR and LRR of −0.58 m·y−1 and −0.43 m·y−1, respectively. It is important to note that certain EPR values are more negative than LRR values, as observed in El Salatar, El Rastrell, La Punta, and La Nova beaches. Conversely, beaches like Can Comes, Empuriabrava, La Rovina, and Santa Margarida exhibit an inverse relationship between these two parameters. Dolan et al. [25] argue that LRR values are typically lower than EPR values, as LRR is influenced by outliers and encompasses all present values. Figure 5 shows the correlation between EPR and LRR values from the 97 studied transects. There is a linear relationship in the data with a correlation coefficient of 0.85. The equation of the line indicates that the LRR values are slightly lower than the EPR values.

Table 4.
Summary of Net Shoreline Movement (NSM), End Point Rate (EPR), and Linear Regression Rate (LRR) of the studied beaches. For each parameter, we present the mean of all transects and their range (maximum–minimum).
The study area exhibits a clear trend in EPR and LRR values from south to north (Figure 6), with predominantly positive values for Can Comes and Empuriabrava beaches that transition to negative values towards the north (La Rovina, Santa Margalida, El Salatar, El Rastrell, La Nova, and La Punta beaches). The boundary between these two sectors is delimited by the entrance to the Marina of Empuriabrava.
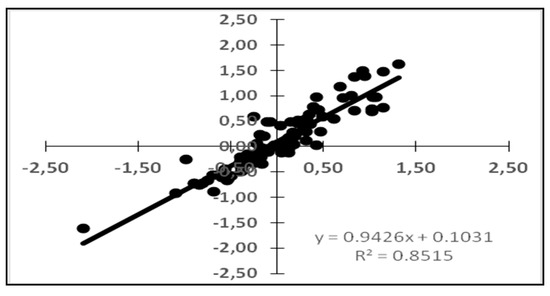
Figure 6.
Relationship between the End Point Rate (EPR) data on the horizontal axis and the Linear Regression Rate (LRR) data on the vertical axis.
The EPRna values are comparable to the EPR values obtained from the transect analysis. Figure 7 shows the relationship between these two values with a strong correlation coefficient of 0.82. In addition, the position of the regression line indicates that the values obtained through the study of surface variations (EPRna) are slightly lower than those obtained through the transect analysis (EPR). The most significant difference between the two indicators is observed in Can Comes beach, where values of −0.006 and 0.18 are recorded for EPRna and EPR, respectively.
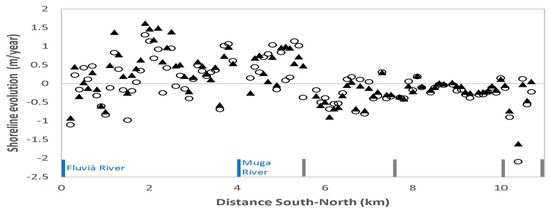
Figure 7.
Evolution of shoreline variation rates, EPR (open circles) and LRR (black triangles), along the study area. Blue transects, for river inputs, and grey bars, for jetties, are enumerated in ascending order based on their distance from the Fluvià River mouth.
3.3. Grain-Size Distribution
As explained in Section 2.2, a grain size analysis was conducted in the following distinct places for each of the 36 sampled profiles: a wet beach and a dry beach. The key granulometric parameters utilized in this study are presented in Table 5.

Table 5.
Values of the grain size parameters of the studied beaches. N = number of sampled profiles; Dist.: distance; Mean: mean in µm; SD: standard deviation; CV: coefficient of variation.
The sediments of the dry beach broadly exhibit higher mean and standard deviation (SD) values compared with those of the wet beach. This occurrence is considered typical since sediments on a dry beach are partially deposited during storms, whereas those on a wet beach accumulate as the beach regains its length during fair weather. Empuriabrava beach displays the highest mean and SD values in both the wet and dry zones. Conversely, La Punta beach exhibits the lowest mean and SD values for both the dry and wet locations (Table 5). The impact of sediment transport on grain size is evident in Figure 8, where the mean grain size and standard deviation of sediments from the wet beach are correlated. Generally, a proportional relationship is observed between these two parameters. We interpret this relationship as an indicator that sediments experiencing higher levels of transport have finer grain sizes and are better sorted.
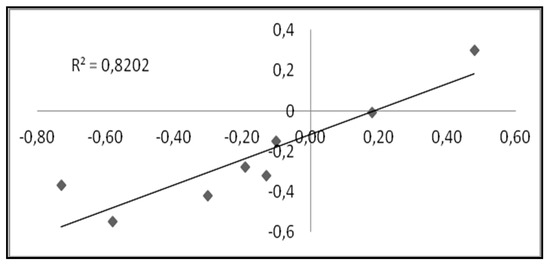
Figure 8.
Relationship between the EPR (horizontal x-axis) values obtained through the transect study and the EPRna (vertical y-axis) obtained through the areal study.
When examining the spatial evolution of the analysed samples for each beach at the two sampling stations (wet beach and dry beach), a general decrease in grain size due to sediment transport toward the north is noted. However, the beaches of Empuriabrava and La Rovina, situated in the central zone between kilometres 4 and 7, exhibit different behaviours. In the wet beach samples (Figure 9), sediments from Empuriabrava beach show an increase in grain size toward the north, reaching the most significant size at 1000 microns in the sample located just south of the breakwater at the entrance to the Marina of Empuriabrava. Conversely, in the dry beach samples (Figure 9), the coarsest sediments are found on La Rovina beach, which is positioned between the breakwaters at the entrances to the Marinas of Empuriabrava and Roses.
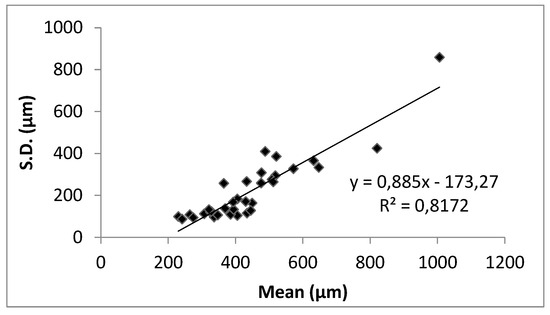
Figure 9.
Relationship graph between the mean grain size, mean (x-axis), and the standard deviation, SD (y-axis), for the 36 samples from the wet beaches. The general trend implies better-sorted sediments for smaller grain sizes.
Considering the mean values (Table 5), we can quantify the impact of sediment transport toward the north on the variation in grain size. Evaluating the maximum and minimum values of grain size from the Empuriabrava and La Punta beaches, and calculating the distances between them, we find that sediments exhibit a rate of grain size decrease due to transport of 84 μm·km−1. On the dry beach, this rate increases to 234 μm·km−1.
Distinct patterns in the spatial evolution of the grain size distribution are evident on every beach. Can Comes beach displays a subtle reduction in grain size in a serrated pattern, indicating varying volumes of sediment drifting northward. In contrast, Empuriabrava and La Rovina beaches exhibit the influence of anthropic structures, such as breakwaters at the entrances to Marinas of Empuriabrava and Roses. This influence leads to the presence of coarser grain sizes as one approaches these structures. Comparable, albeit less pronounced, processes are also noticeable on La Nova and La Punta beaches.
4. Discussion
The conjunction between the studies of the temporal and spatial changes in the shoreline and the grain size distribution allowed us to determine the factors, natural and/or anthropics, of the morphodynamic evolution of the northern area of the Gulf of Roses.
4.1. Areal vs. Transect Change Studies
The temporal variation in the short–medium term (2004–2020) of the coastline has was using the following methodologies: transects and areas. We primarily focused on three parameters obtained from both the area-based analysis (EPRna) and the transect-based analysis of coastline changes (EPR and LRR).
The EPR (End Point Rate) and LRR (Linear Regression Rate) parameters exhibited very similar values (Figure 5) and demonstrated a high correlation coefficient (r2: 0.8515). Some authors prefer to work with the LRR parameter, as it considers all the available data. The authors of [28,29] suggest that the strong correlation between these two parameters indicates that they both reflect the same processes influencing the evolution of a coastline. The two methodologies employed for morphological analysis can serve as valuable monitoring tools for coastal management to track variations in a coastline [28,30]. Area analysis requires more precise digitization of shorelines, while transect analysis interpolates spacing information between each transect. The main challenge with transect analysis lies in ensuring proper calibration based on the morphological characteristics of the beaches. Smaller beaches will necessitate smaller spacing distances for the analysis to achieve higher accuracy. Furthermore, area analysis can be complemented with the digitization of the sub-environments of emerged beaches to facilitate parallel geomorphological analysis [31].
4.2. Medium-Term Morphodynamic Evolution
The analysis of medium-term shoreline changes in the Gulf of Roses involved the utilization of four shorelines spanning 16 years (2004, 2008, 2012, and 2020). When examining shoreline evolution along 97 transects, 55 exhibit landward migrations with negative Net Shoreline Movement (NSM), while only 41 display a seaward shift with positive NSM. Given the parallel behaviour observed between the EPR and LRR indices (refer to Section 4.1), these indices demonstrated their maximum and minimum values at the same beaches. Consequently, Can Comes beach exhibits the highest values for EPR and LRR, measuring 1.31 and 1.62 m·y−1, respectively. These maximum values can be attributed to the presence of the La Muga (south) and Fluvià (north) Rivers, which serve as natural boundaries for the beach. Conversely, the lowest values for EPR and LRR coincide in the northern portion of the study area, specifically at La Punta beach, with measurements of −0.58 and −0.43 m·y−1, respectively.
Regarding the grain size distribution, a distinct pattern indicates a decrease in grain size as distance increases from the Fluvià River mouth (Figure 9). This sedimentological trend is particularly pronounced in samples obtained from the wet zone compared with those from the dry zone. Examining the relationship between the standard deviation (SD) and the mean of the samples from the wet zone (Figure 8), it is evident that lower means in the grain size distribution are associated with lower SD values. This suggests that sediments undergoing extensive transportation are more well-sorted and classified. Considering that the net sediment transport is directed towards the north, we can conclude that this transport occurs through different accretion bulges or sediment waves, as described by several authors [32,33,34]. These sediment waves are observable in the southernmost beaches of the study area, specifically Can Comes and Empuriabrava, both in the transect-based analysis (Figure 6 and Figure A1 in Appendix B) and in the analysis based on area variations (Figure A1 in Appendix B). These accretion waves have wavelengths ranging from 400 to 1500 m. At Can Comes beach, the grain size distribution (Figure 9) also exhibits undulations, but because of the different sampling distance of the sediment and transects, these waves were not compared between those present in the coastline and those of the grain sizes. Similar processes of heterogeneity in the longitudinal distribution of grain size have been described in certain natural areas such as the Ebro River Delta [35] or areas affected by artificial nourishment projects, such as the “Sand Motor” on the coast of Holland [36] or the coastal zone of Terschelling [37].
Can Comes beach is localized within a natural environment, as evident from its morphological equilibrium (Table 3 and Table 4). Its proximity to the sediment supply from the Fluvià River and its extensive surface area compared with other beaches are characteristics that help mitigate its vulnerability to coastal erosion. Moreover, the presence of dune and wetland systems on this beach enhances its capacity to accommodate storm events [5], making it a crucial element for morpho-sedimentological recovery following disturbances. Empuriabrava beach, located in an urban setting, exhibits the highest rates of accretion and the largest grain sizes in the study area. This can be attributed to a combination of factors, including its proximity to sediment contributions from the Muga River, the northward direction of longitudinal sediment transport, and the presence of a breakwater positioned at its northern boundary. The breakwater situated to the north of the beach serves as the first barrier in the study area, initiating the fragmentation of coastal drift. It is responsible for the accumulation of coarse sediment and the subsequent increase in accretion on Empuriabrava beach.
4.3. Effect of Anthropogenic Structures
Rovina beach, despite being situated in a natural environment and possessing dune and wetland systems (Section 1.1), has experienced high rates of erosion and emerged as the most heavily affected beach in terms of surface loss during the period between 2004 and 2020. The presence of two breakwaters enclosing the beach may worsen the retreat of the coastline. As depicted in Figure 10, there is a reduction in grain size between Empuriabrava and La Rovina. This decrease is attributed to the location of the breakwaters, which encourage the deposition of coarser material and disrupt the coastal drift [38,39,40,41]. The interrelationship between changes in shoreline position and grain size (morphodynamics) is presented in Figure 11, where the EPR values (m y−1) are related to the mean grain size (µm). The general trend shows that positive EPR (shoreline accretion) values are related to coarse grain sizes, while areas with fine grain sizes, showing coastal erosion tendencies, have negative EPR values. This type of correlation was previously described in [42] for the Gulf of Valencia; however, the study area in that study is very different, measuring 200 km, from our study area, which is 10 km.
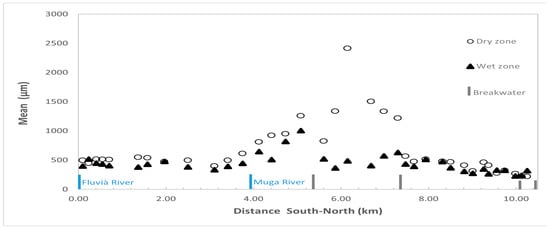
Figure 10.
Evolution of the mean grain size with respect to distance for sediment samples from the wet and dry beaches. The river mouths are marked in blue, and the presence of groins is marked in grey. The numbers are in ascending order according to the mouth of the Fluvià River.
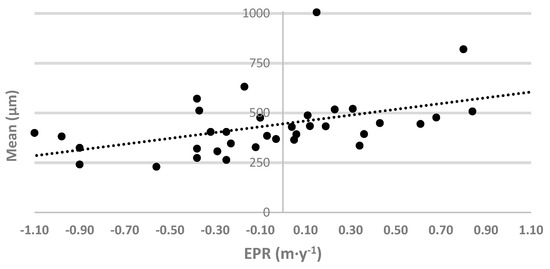
Figure 11.
Graph of the relationship between grain size and the evolutionary trend in the coastline, represented by EPR (m·y−1). The regression line shows the general relationship trend between the two variables.
As an example of the impact of anthropogenic structures on grain size evolution, the grain size between the south side and the north side of the structures shows an increase (gap) in grain size reduction. For instance, between Station 21 of Empuriabrava beach and Station 20 of La Rovina beach (Figure 1), there is a decrease from 1006 µm to 521 µm, respectively, resulting in a difference of 485 µm. The second significant gap is observed between Stations 15 and 14 of La Rovina and Santa Margarida (Figure 1), with mean grain sizes of 632 µm and 433 µm, respectively, resulting in a gap of 199 µm. Lastly, between Samples 3 and 4 of La Punta and Nova beaches, the gap decreases to 44 µm, with mean grain sizes of 230 µm and 274 µm, respectively.
The shoreline near the urban area of Roses is receding, with La Punta, La Nova, and Rastrell beaches being the most severely impacted by coastal erosion. These findings align with the trend reported by the LVCC [21] for the 1995–2004 period. These beaches have fine grain sizes due to their distance from the primary sediment entry points in the region and the presence of breakwaters that impede the transportation of coarser material. They are the beaches in the study area with the finest and most well-classified sediment.
In La Punta beach, anthropization and fine grain size can exacerbate its vulnerability to erosion. As described by [22], La Punta beach has been heavily damaged by storms, with a section of up to 55 m disappearing, while the beach has tilted towards the south, accumulating sediment on the breakwater of the Roses Harbour. The configuration of the breakwaters along the study area, the urbanization of the beaches, the arrangement of the local longitudinal transport of sediment, and the presence of storms make it very difficult for a beach like La Punta to recover and remain morpho-dynamically stable without periodic concentrated efforts.
5. Conclusions
This study shows the influence of anthropogenic factors and coastal segmentation on the morpho-sedimentological balance of the beaches in the northern Gulf of Roses. The analysis covers a 10 km stretch of shoreline, including eight distinct beaches within the study area. Urbanization of coastal zones restricts sediment dynamics and increases vulnerability to beach erosion, thereby diminishing the value of these beaches as a resource.
The morphological analysis allowed us to determine the rates of beach advancement and retreat and identify the most erosion-prone beaches and spatial trends in the evolution rates across the study area. Two methodologies for morphological analysis, transects and areas, were used and compared to assess their effectiveness in monitoring coastal variations for coastal management.
The analysis revealed an average yearly retreat rate of −0.11 m·y−1, ranging from 0.53 to −0.55 m·y−1. Furthermore, the results for the period of 2004–2020 indicate a total surface area loss of −20,810 m2 (−1300 m2·y−1). It is worth noting that sediment samples demonstrated a noticeable decrease in grain size towards the northern end of the swash zone, declining from 745 to 264 µm. Changes in shoreline position and granulometric properties reflect the impact of various man-made structures on the morphodynamic behaviour of each beach segment. The sedimentological analysis characterized the granulometric distribution along the studied beaches and linked it to the coastline configuration.
The jetties at the entrance to the Marina of Empuriabrava, located 5.2 km away and dividing the beaches of Empuriabrava and La Rovina, can be considered the starting point for the disruption of the littoral drift and sediment transport restriction. This results in the accumulation and preferential deposition of coarse-grained sediments on Empuriabrava beach, while erosion and a decrease in grain size occur on La Rovina beach to the north of the breakwater. This process of increasing grain size is also observed along Rovina beach, acting as a sediment source for the beaches towards Roses, which undergo erosion and loss of finer grains.
Changes in grain size towards the north can have implications for overall beach stability. Generally, coarser sediments offer greater resistance to erosion and are less easily transported by waves and currents, rendering beaches with coarser sediments more stable than those with finer sediments. Therefore, the observed reduction in grain size towards the north, as indicated by sediment samples, may suggest a higher susceptibility to erosion in that area. However, other factors such as the presence of anthropogenic structures and the local wave climate can also significantly influence beach stability and must be considered when assessing morphodynamic behaviour.
This study highlights the importance of sustainable and planned land use to ensure the resilience of the studied beaches as a resource and to mitigate increased vulnerability resulting from anthropogenic activity along the coast.
Author Contributions
Conceptualization, A.C., M.S., and M.G.; methodology, M.S., A.C., and M.G.; investigation, M.S. and A.C.; writing—original draft preparation, A.C., M.S., M.G., and J.L.C. All authors have read and agreed to the published version of the manuscript.
Funding
This research received no external funding. A.C. worked in the framework of the MOLLY (PID2021-124272OB-C21) research project funded by the Spanish Ministry of Science, Innovation, and Universities.
Data Availability Statement
The data presented in this study are available upon request from the corresponding author.
Conflicts of Interest
The authors declare no conflicts of interest.
Appendix A

Table A1.
Statistical parameters associated with the analysis by transects (DSAS), including the NSM (Net Shoreline Movement) and EPR values and their associated uncertainty (EPRuncy); the coefficient of determination (LR2); the standard error (LSE); and the confidence interval (LCI90) associated with the LRR parameter.
| Beach | Transect S-N | Distance | NSM | EPR | LRR | LR2 | LSE | LCI90 |
|---|---|---|---|---|---|---|---|---|
| Can Comes | 1 | 0 | −17.55 | −1.10 | −0.92 | 0.08 | 22.65 | 4.21 |
| 2 | 100 | 3.74 | 0.23 | 0.45 | 0.04 | 16.55 | 3.08 | |
| 3 | 200 | −2.50 | −0.16 | −0.34 | 0.02 | 18.04 | 3.35 | |
| 4 | 300 | 6.87 | 0.43 | 0.03 | 0.00 | 18.20 | 3.38 | |
| 5 | 400 | 1.96 | 0.12 | −0.12 | 0.00 | 20.25 | 3.77 | |
| 6 | 500 | 7.54 | 0.47 | 0.30 | 0.02 | 15.84 | 2.94 | |
| 7 | 600 | −5.10 | −0.32 | −0.15 | 0.00 | 20.28 | 3.77 | |
| 8 | 700 | −9.62 | −0.60 | −0.60 | 0.05 | 18.36 | 3.41 | |
| 9 | 800 | −13.50 | −0.84 | −0.75 | 0.10 | 16.39 | 3.05 | |
| 10 | 900 | −1.71 | −0.11 | 0.49 | 0.04 | 18.30 | 3.40 | |
| 11 | 1000 | 13.29 | 0.83 | 1.38 | 0.34 | 14.06 | 2.61 | |
| 12 | 1100 | 6.29 | 0.39 | 0.78 | 0.12 | 15.62 | 2.90 | |
| 13 | 1200 | −2.72 | −0.17 | 0.20 | 0.02 | 11.14 | 2.07 | |
| 14 | 1300 | −15.69 | −0.98 | −0.25 | 0.02 | 12.48 | 2.32 | |
| 15 | 1400 | −3.01 | −0.19 | 0.23 | 0.01 | 17.91 | 3.33 | |
| 16 | 1500 | 0.68 | 0.04 | 0.41 | 0.03 | 18.52 | 3.44 | |
| 17 | 1600 | 5.57 | 0.35 | 0.64 | 0.09 | 15.25 | 2.84 | |
| 18 | 1700 | 20.94 | 1.31 | 1.62 | 0.22 | 22.00 | 4.09 | |
| 19 | 1800 | 18.23 | 1.14 | 1.47 | 0.18 | 22.97 | 4.27 | |
| 20 | 1900 | 10.85 | 0.68 | 1.18 | 0.16 | 19.43 | 3.61 | |
| 21 | 2000 | 14.65 | 0.92 | 1.49 | 0.20 | 21.67 | 4.03 | |
| 22 | 2100 | −4.06 | −0.25 | 0.59 | 0.04 | 20.05 | 3.73 | |
| 23 | 2200 | 6.74 | 0.42 | 0.97 | 0.10 | 21.57 | 4.01 | |
| 24 | 2300 | 15.19 | 0.95 | 1.39 | 0.16 | 23.47 | 4.36 | |
| 25 | 2400 | −1.11 | −0.07 | 0.48 | 0.03 | 21.00 | 3.90 | |
| 26 | 2500 | 3.47 | 0.22 | 0.51 | 0.06 | 14.60 | 2.71 | |
| 27 | 2600 | −2.30 | −0.14 | 0.20 | 0.01 | 15.76 | 2.93 | |
| 28 | 2700 | −6.47 | −0.40 | −0.21 | 0.01 | 15.58 | 2.90 | |
| 29 | 2800 | 1.85 | 0.12 | 0.17 | 0.01 | 13.38 | 2.49 | |
| 30 | 2900 | 7.91 | 0.49 | 0.59 | 0.06 | 17.13 | 3.18 | |
| 31 | 3000 | 5.43 | 0.34 | 0.48 | 0.07 | 13.06 | 2.43 | |
| 32 | 3100 | 3.15 | 0.20 | 0.26 | 0.02 | 12.72 | 2.37 | |
| 33 | 3200 | 4.99 | 0.31 | 0.11 | 0.01 | 10.42 | 1.94 | |
| 34 | 3300 | 5.70 | 0.36 | 0.44 | 0.08 | 10.58 | 1.97 | |
| 35 | 3400 | −11.01 | −0.69 | −0.57 | 0.09 | 13.64 | 2.54 | |
| 36 | 3500 | 16.36 | 1.02 | 0.74 | 0.18 | 11.60 | 2.16 | |
| 37 | 3600 | 17.03 | 1.07 | 0.98 | 0.34 | 10.13 | 1.88 | |
| 38 | 3700 | 9.73 | 0.61 | 0.54 | 0.10 | 11.00 | 2.21 | |
| Empuriabrava | 1 | 3800 | −5.90 | −0.37 | −0.25 | 0.02 | 13.40 | 2.49 |
| 2 | 3900 | 16.31 | 1.02 | 0.69 | 0.09 | 15.65 | 2.91 | |
| 3 | 4000 | 18.26 | 1.14 | 0.76 | 0.10 | 16.31 | 3.04 | |
| 4 | 4100 | 2.75 | 0.17 | 0.28 | 0.10 | 6.17 | 1.15 | |
| 5 | 4200 | 1.42 | 0.09 | 0.06 | 0.00 | 11.18 | 2.08 | |
| 6 | 4300 | 13.46 | 0.84 | 0.71 | 0.13 | 13.23 | 2.46 | |
| 7 | 4400 | −2.48 | −0.16 | −0.03 | 0.00 | 12.25 | 2.28 | |
| 8 | 4500 | 16.53 | 1.04 | 0.97 | 0.38 | 9.16 | 1.70 | |
| 9 | 4600 | 12.74 | 0.80 | 1.00 | 0.57 | 6.34 | 1.18 | |
| 10 | 4700 | 11.27 | 0.71 | 0.96 | 0.41 | 8.31 | 1.55 | |
| 11 | 4800 | 5.00 | 0.31 | 0.54 | 0.12 | 10.50 | 1.95 | |
| 12 | 4900 | 7.13 | 0.45 | 0.72 | 0.19 | 10.93 | 2.04 | |
| 13 | 5000 | 2.43 | 0.15 | 0.48 | 0.06 | 14.00 | 2.61 | |
| La Rovina | 1 | 5100 | −5.67 | −0.35 | −0.29 | 0.08 | 7.51 | 1.40 |
| 2 | 5200 | −6.44 | −0.40 | −0.29 | 0.10 | 6.60 | 1.23 | |
| 3 | 5300 | 4.93 | 0.31 | 0.30 | 0.08 | 7.33 | 1.36 | |
| 4 | 5400 | −5.22 | −0.33 | −0.22 | 0.20 | 3.23 | 0.60 | |
| 5 | 5500 | −6.45 | −0.40 | −0.33 | 0.34 | 3.37 | 0.63 | |
| 6 | 5600 | 0.75 | 0.05 | −0.12 | 0.02 | 6.67 | 1.24 | |
| 7 | 5700 | −12.93 | −0.81 | −0.72 | 0.67 | 3.69 | 0.69 | |
| 8 | 5800 | 1.78 | 0.11 | −0.06 | 0.00 | 8.22 | 1.53 | |
| 9 | 5900 | −12.05 | −0.75 | −0.67 | 0.87 | 1.86 | 0.35 | |
| 10 | 6000 | 2.87 | 0.18 | 0.04 | 0.01 | 3.85 | 0.71 | |
| 11 | 6100 | 1.89 | 0.12 | −0.04 | 0.01 | 3.58 | 0.67 | |
| 12 | 6200 | −3.95 | −0.25 | −0.32 | 0.66 | 1.70 | 0.32 | |
| 13 | 6300 | −8.43 | −0.53 | −0.63 | 0.79 | 2.37 | 0.44 | |
| 14 | 6400 | −8.57 | −0.54 | −0.67 | 0.59 | 4.08 | 0.76 | |
| 15 | 6500 | −10.85 | −0.68 | −0.89 | 0.80 | 3.27 | 0.61 | |
| 16 | 6600 | −6.13 | −0.38 | −0.49 | 0.57 | 3.12 | 0.58 | |
| 17 | 6700 | −7.92 | −0.50 | −0.58 | 0.49 | 4.31 | 0.80 | |
| 18 | 6800 | −2.70 | −0.17 | −0.33 | 0.29 | 3.79 | 0.71 | |
| S. Margarida | 1 | 6900 | −1.61 | −0.10 | −0.07 | 0.01 | 6.09 | 1.13 |
| 2 | 7000 | 3.07 | 0.19 | 0.21 | 0.04 | 7.88 | 1.46 | |
| 3 | 7100 | −2.73 | −0.17 | −0.21 | 0.06 | 5.90 | 1.10 | |
| 4 | 7200 | 1.03 | 0.06 | −0.06 | 0.00 | 7.63 | 1.42 | |
| 5 | 7300 | −6.25 | −0.39 | −0.41 | 0.25 | 5.23 | 0.97 | |
| 6 | 7400 | −5.86 | −0.37 | −0.35 | 0.23 | 4.68 | 0.87 | |
| Salatar | 1 | 7500 | −0.62 | −0.04 | 0.00 | 0.00 | 2.24 | 0.42 |
| 2 | 7600 | −0.29 | −0.02 | 0.02 | 0.00 | 3.23 | 0.60 | |
| 3 | 7700 | −1.60 | −0.10 | −0.10 | 0.03 | 4.37 | 0.81 | |
| 4 | 7800 | −3.79 | −0.24 | −0.17 | 0.07 | 4.47 | 0.83 | |
| Rastrell | 1 | 7900 | −0.45 | −0.03 | 0.03 | 0.04 | 0.97 | 0.18 |
| 2 | 8000 | −3.10 | −0.19 | −0.06 | 0.03 | 2.36 | 0.44 | |
| 3 | 8100 | −2.66 | −0.17 | −0.07 | 0.05 | 2.20 | 0.41 | |
| 4 | 8200 | −4.58 | −0.29 | −0.23 | 0.74 | 1.02 | 0.19 | |
| 5 | 8300 | −14.43 | −0.90 | −0.73 | 0.12 | 14.35 | 2.67 | |
| La Nova | 1 | 8400 | −1.94 | −0.12 | −0.04 | 0.00 | 11.09 | 2.06 |
| 2 | 8500 | 2.47 | 0.15 | 0.12 | 0.01 | 10.10 | 1.88 | |
| 3 | 8600 | −3.97 | −0.25 | −0.17 | 0.17 | 2.74 | 0.51 | |
| 4 | 8700 | −1.76 | −0.11 | −0.06 | 0.06 | 1.69 | 0.31 | |
| 5 | 8800 | −3.75 | −0.23 | −0.20 | 0.44 | 1.62 | 0.30 | |
| 6 | 8900 | −4.59 | −0.29 | −0.22 | 0.24 | 2.79 | 0.52 | |
| 7 | 9000 | −4.80 | −0.30 | −0.23 | 0.33 | 2.41 | 0.45 | |
| 8 | 9100 | −6.01 | −0.38 | −0.25 | 0.44 | 2.06 | 0.38 | |
| La Punta | 1 | 9200 | −3.49 | −0.22 | 0.06 | 0.00 | 30.35 | 5.64 |
| 2 | 9300 | −9.00 | −0.56 | −0.45 | 0.11 | 9.39 | 1.75 | |
| 3 | 9400 | 2.01 | 0.13 | −0.02 | 0.00 | 7.41 | 1.38 | |
| 4 | 9500 | −33.34 | −2.09 | −1.61 | 0.32 | 17.20 | 3.20 | |
| 5 | 9600 | −14.43 | −0.90 | −0.73 | 0.12 | 14.35 | 2.67 |
Appendix B
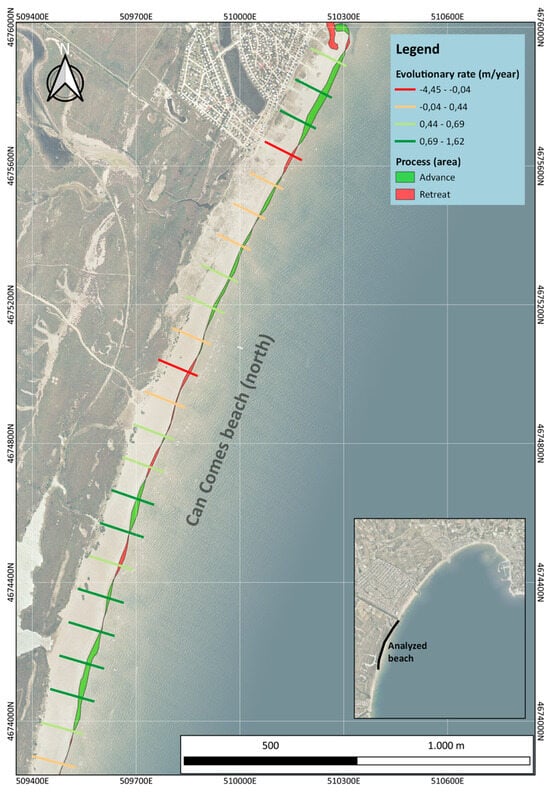
Figure A1.
View of the southern area of Can Comes beach. The image shows the study results carried out through transects and by areas. The results show how the deposition (in green) and erosion (in red) surfaces intersperse, giving rise to the sediment waves described in the text.
References
- Luijendijk, A.; Hagenaars, G.; Ranasinghe, R.; Baart, F.; Donchyts, G.; Aarninkhof, S. The State of the World’s Beaches. Sci. Rep. 2018, 8, 6641. [Google Scholar] [CrossRef]
- Bruun, P. Coast Erosion and the Development of Beach Profiles; US Beach Erosion Board: Fort Belvoir, VA, USA, 1954; Volume 44. [Google Scholar]
- Wright, L.D.; Thom, B.G. Coastal depositional landforms: A morphodynamic approach. Prog. Phys. Geogr. 1977, 1, 412–459. [Google Scholar] [CrossRef]
- Short, A.D.; Jackson, D.W.T. 2013. Beach morphodynamics. In Treatise on Geomorphology; Shroder, J., Sherman, D.J., Eds.; Academic Press: San Diego, CA, USA; Coastal Geomorphology: San Diego, CA, USA, 2013; Volume 10, pp. 106–129. [Google Scholar]
- Sigren, J.; Figlus, J.; Armitage, A. Coastal sand dunes and dune vegetation: Restoration, erosion, and storm protection. Shore Beach 2014, 82, 5–12. [Google Scholar]
- United Nations. Ocean Conference: Factsheet: People and Oceans. 2017. Available online: https://sustainabledevelopment.un.org/content/documents/Ocean_Factsheet_People.pdf (accessed on 5 October 2024).
- Bowman, D.; Guillen, J.; Lopez, L.; Pellegrino, V. Planview Geometry and morphological characteristics of pocket beaches on the Catalan coast (Spain). Geomorphology 2009, 108, 191–199. [Google Scholar] [CrossRef]
- Macau, F. L’Alt Empordà geometritzat per la Tramontana». Ann. L’institut D’estudis Empord. 1964, 5, 19–39. [Google Scholar]
- Bach i Plaza, J. Sedimentación holocena en el litoral emergido de L’Alt Empordà (NE de Catalunya). Acta Geològica Hispànica 1986–1987, 21–22, 195–203. [Google Scholar]
- Serra, J.; Verdaguer, A.; Julià, R.; Marquès, M.A. Caracterització geológica dels Aiguamolls de la Badia de Roses. Treb. Inst. Catalana D’historia Nat. 1994, 13, 21–78. [Google Scholar]
- Amblas, D.; Canals, M.; Urgeles, R.; Lastras, G.; Liquete, C.; Hughes-Clarke, J.E.; Casamor, J.L.; Calafat, A.M. Morphogenetic mesoscale analysis of the northeastern Iberian margin, NW Mediterranean Basin. Mar. Geol. 2006, 234, 3–20. [Google Scholar] [CrossRef]
- Liquete, C.; Canals, M.; Ludwig, W.; Arnau, P. Sediment discharge of the rivers of Catalonia, NE Spain, and the influence of human impacts. J. Hydrol. 2009, 366, 76–88. [Google Scholar] [CrossRef]
- Durán, R.; Canals, M.; Sanz, J.L.; Lastras, G.; Amblàs, D.; Micallef, A. Morphology and sediment dynamics of the northern Catalan continental shelf, northwestern Mediterranean Sea. Geomorphology 2014, 204, 1–20. [Google Scholar] [CrossRef]
- Jiménez, J.; Gracia, V.; Valdemoro, H.I.; Mendoza, E.T.; Sánchez-Arcilla, A. Managing erosion-induced problems in NW Mediterranean urban beaches. Ocean. Coast. Manag. 2011, 54, 907–918. [Google Scholar] [CrossRef]
- Bach i Plaza, J.B.; Llacer, P.; Buxó, R.; i Casas, F.B. El Territori d’Emporion I Les Seves Dades Paleoambientals. Empúries Rev. De Món Clàssic I Antig. Tardana 2005, 54, 25–32. Available online: https://raco.cat/index.php/Empuries/article/view/95677 (accessed on 5 October 2024).
- Ejarque, A.; Julià, R.; Reed, J.M.; Mesquita-Joanes, F.; Marco-Barba, J.; Riera, S. Coastal Evolution in a Mediterranean Microtidal Zone: Mid to Late Holocene Natural Dynamics and Human Management of the Castelló Lagoon, NE Spain. PLoS ONE 2016, 11, e0155446. [Google Scholar] [CrossRef]
- Bouzas Sabater, M.; Burch I Rius, J.; Julià Brugués, R.; Palahí Grimal, L.; Pons Mir, P.; Solà Subiranas, J. Changes and Transformations on the Coast Using the Example of Roses (Alt Empordà, Catalonia). Land 2023, 12, 2104. [Google Scholar] [CrossRef]
- López-Dóriga, U.; Jiménez, J.A. Impact of Relative Sea-Level Rise on Low-Lying Coastal Areas of Catalonia, NW Mediterranean, Spain. Water 2020, 12, 3252. [Google Scholar] [CrossRef]
- Guillén, J.; Stive, M.J.F.; Capobianco, M. Shoreline evolution of the Holland coast on a decadal scale. Earth Surf. Process. Landf. 1999, 24, 517–536. [Google Scholar] [CrossRef]
- Calafat, A.; Vírseda, S.; Lovera, R.; Lucena, J.R.; Bladé, C.; Rivero, L.; Ninot, J.M. Assessment of the Restoration of the Remolar Dune System (Viladecans, Barcelona): The Resilience of a Coastal Dune System. J. Mar. Sci. Eng. 2021, 9, 113. [Google Scholar] [CrossRef]
- GCGeneralitat de Catalunya. Llibre Verd de l’Estat de la Zona Costanera a Catalunya (LVCC). Barcelona. 2010. Available online: https://www.icgc.cat/Administracio-i-empresa/Serveis/Riscos-geologics/Dinamica-de-la-costa/Llibre-verd-de-l-Estat-de-la-zona-costanera-a-Catalunya-2010 (accessed on 5 October 2024). (In Catalan).
- Agustí i Vergés, J. Projecte de Reparació Simple de les Platges de La Punta i de La Nova a Roses a Conseqüència dels Desperfectes Provocats pels Temporals; Ajuntament de Roses: Girona, Spain, 2012. (In Catalan) [Google Scholar]
- Quera, J. Projecte Constructiu de L’espigó Transversal D’escullera, per a L’estabilització de la Platja de La Punta, En Compliment de les Obligacions de la Concessió del Port Esportiu de Roses; Ajuntament de Roses i Enigest: Girona, Spain, 2017; 119p. (In Catalan) [Google Scholar]
- Mendoza, E.T.; Jiménez, J.J.A.; Mateo, J. A coastal storms intensity scale for the Catalan Sea (NW Mediterranean). Nat. Hazards Earth Syst. Sci. 2011, 11, 2453–2462. [Google Scholar] [CrossRef]
- Thieler, E.R.; Himmelstoss, E.A.; Zichichi, J.L.; Ergul, A. Digital Shoreline Analysis System (DSAS) Version 4.0—An ArcGIS Extension for Calculating Shoreline Change; U.S. Geological Survey Open-File Report 2008–1278; U.S. Geological Survey: Reston, VA, USA, 2009.
- Folk, R.L. The Petrology of Sedimentary Rocks; Hemphill Publishing Co.: Austin, TX, USA, 1974; 182p. [Google Scholar]
- Blott, S.J.; Pye, K. Gradistat: A grain size distribution and statistics package for the analysis of unconsolidated sediments. Earth Surf. Process. Landf. 2001, 26, 1237–1248. [Google Scholar] [CrossRef]
- Dolan, R.; Fenster, M.S.; Holmes, S.J. Temporal analysis of shoreline recession and accretion. J. Coast. Res. 1991, 7, 723–744. [Google Scholar]
- Apostolopoulos, D.N.; Avramidis, P.; Nikolakopoulos, K.G. Estimating Quantitative Morphometric Parameters and Spatiotemporal Evolution of the Prokopos Lagoon Using Remote Sensing Techniques. J. Mar. Sci. Eng. 2022, 10, 931. [Google Scholar] [CrossRef]
- Anfuso, G.; Bowman, D.; Danese, C.; Pranzini, E. Transect based analysis versus area based analysis to quantify shoreline displacement: Spatial resolution issues. Environ. Monit. Assess. 2016, 188, 568. [Google Scholar] [CrossRef]
- Walker, I.J.; Davidson-Arnott, R.G.D.; Bauer, B.O.; Hesp, P.A.; Delgado-Fernandez, I.; Ollerhead, J.; Smyth, T.A.G. Scale-dependent perspectives on the geomorphology and evolution of beach-dune systems. Earth-Sci. Rev. 2017, 171, 220–253. [Google Scholar] [CrossRef]
- Durán, R.; Guillén, J.; Ruiz, A.; Jiménez, J.A.; Sagristà, E. Morphological changes, beach inundation and overwash caused by an extreme storm on a low-lying embayed beach bounded by a dune system (NW Mediterranean). Geomorphology 2016, 274, 129–142. [Google Scholar] [CrossRef]
- Vos, K.; Harley, M.D.; Splinter, K.D.; Simmons, J.A.; Turner, I.L. Sub-annual to multi-decadal shoreline variability from publicly available satellite imagery. Coast. Eng. 2019, 150, 160–174. [Google Scholar] [CrossRef]
- Warrick, J.A. Littoral Sediment from Rivers: Patterns, Rates and Processes of River Mouth Morphodynamics. Front. Earth Sci. 2020, 8, 355. [Google Scholar] [CrossRef]
- Guillén, J.; Jiménez, J. Process behind the Longshore Variation of the Sediment Grain Size in the Ebro Delta Coast. J. Coast. Res. 1995, 11, 205–218. [Google Scholar]
- Huisman, B.J.A.; de Schipper, M.A.; Ruessink, B.G. Sediment sorting at the Sand Motor at storm and annual time scales. Mar. Geol. 2016, 381, 209–226. [Google Scholar] [CrossRef]
- Guillén, J.; Hoekstra, P. Sediment distribution in the nearshore zone: Grain size evolution in response to shoreface nourishment (Island of Terschelling, The Netherlands). Estuar. Coast. Shelf Sci. 1997, 45, 639–652. [Google Scholar] [CrossRef]
- Carrión, N.; Calafat, A. Definition of the littoral cells of the Maresme coast (Barcelona). XI J. Geomorfol. Litoral Galicia 2022, 2022, 251–255. [Google Scholar]
- Anfuso, G.; Benavente, J.; Del Rio, L.; Gracia, F.J. An approximation to short-term evolution and sediment transport pathways along the littoral of Cadiz Bay (SW Spain). Environ. Geol. 2008, 56, 69–79. [Google Scholar] [CrossRef]
- Del Río, L.; Gracia, F.J.; Benavente, J. Shoreline change patterns in sandy coasts. A case study in SW Spain. Geomorphology 2013, 196, 252–266. [Google Scholar] [CrossRef]
- Pardo-Pascual, J.E.; Sanjaume, E. Beaches in Valencian Coast. In The Spanish Coastal Systems; Morales, J., Ed.; Springer: Cham, Switzerland, 2019. [Google Scholar] [CrossRef]
- Cabezas-Rabadán, C.; Pardo-Pascual, J.E.; Palomar-Vázquez, J. Characterizing the Relationship between the Sediment Grain Size and the Shoreline Variability Defined from Sentinel-2 Derived Shorelines. Remote Sens. 2021, 13, 2829. [Google Scholar] [CrossRef]
Disclaimer/Publisher’s Note: The statements, opinions and data contained in all publications are solely those of the individual author(s) and contributor(s) and not of MDPI and/or the editor(s). MDPI and/or the editor(s) disclaim responsibility for any injury to people or property resulting from any ideas, methods, instructions or products referred to in the content. |
© 2024 by the authors. Licensee MDPI, Basel, Switzerland. This article is an open access article distributed under the terms and conditions of the Creative Commons Attribution (CC BY) license (https://creativecommons.org/licenses/by/4.0/).