

Nb-Ta-Sn Oxides from Lithium-Beryllium-Tantalum Pegmatite Deposits of the Kolmozero–Voronja Belt, NW Russia: Implications for Tracing Ore-Forming Processes and Mineralization Signatures


Abstract
:1. Introduction
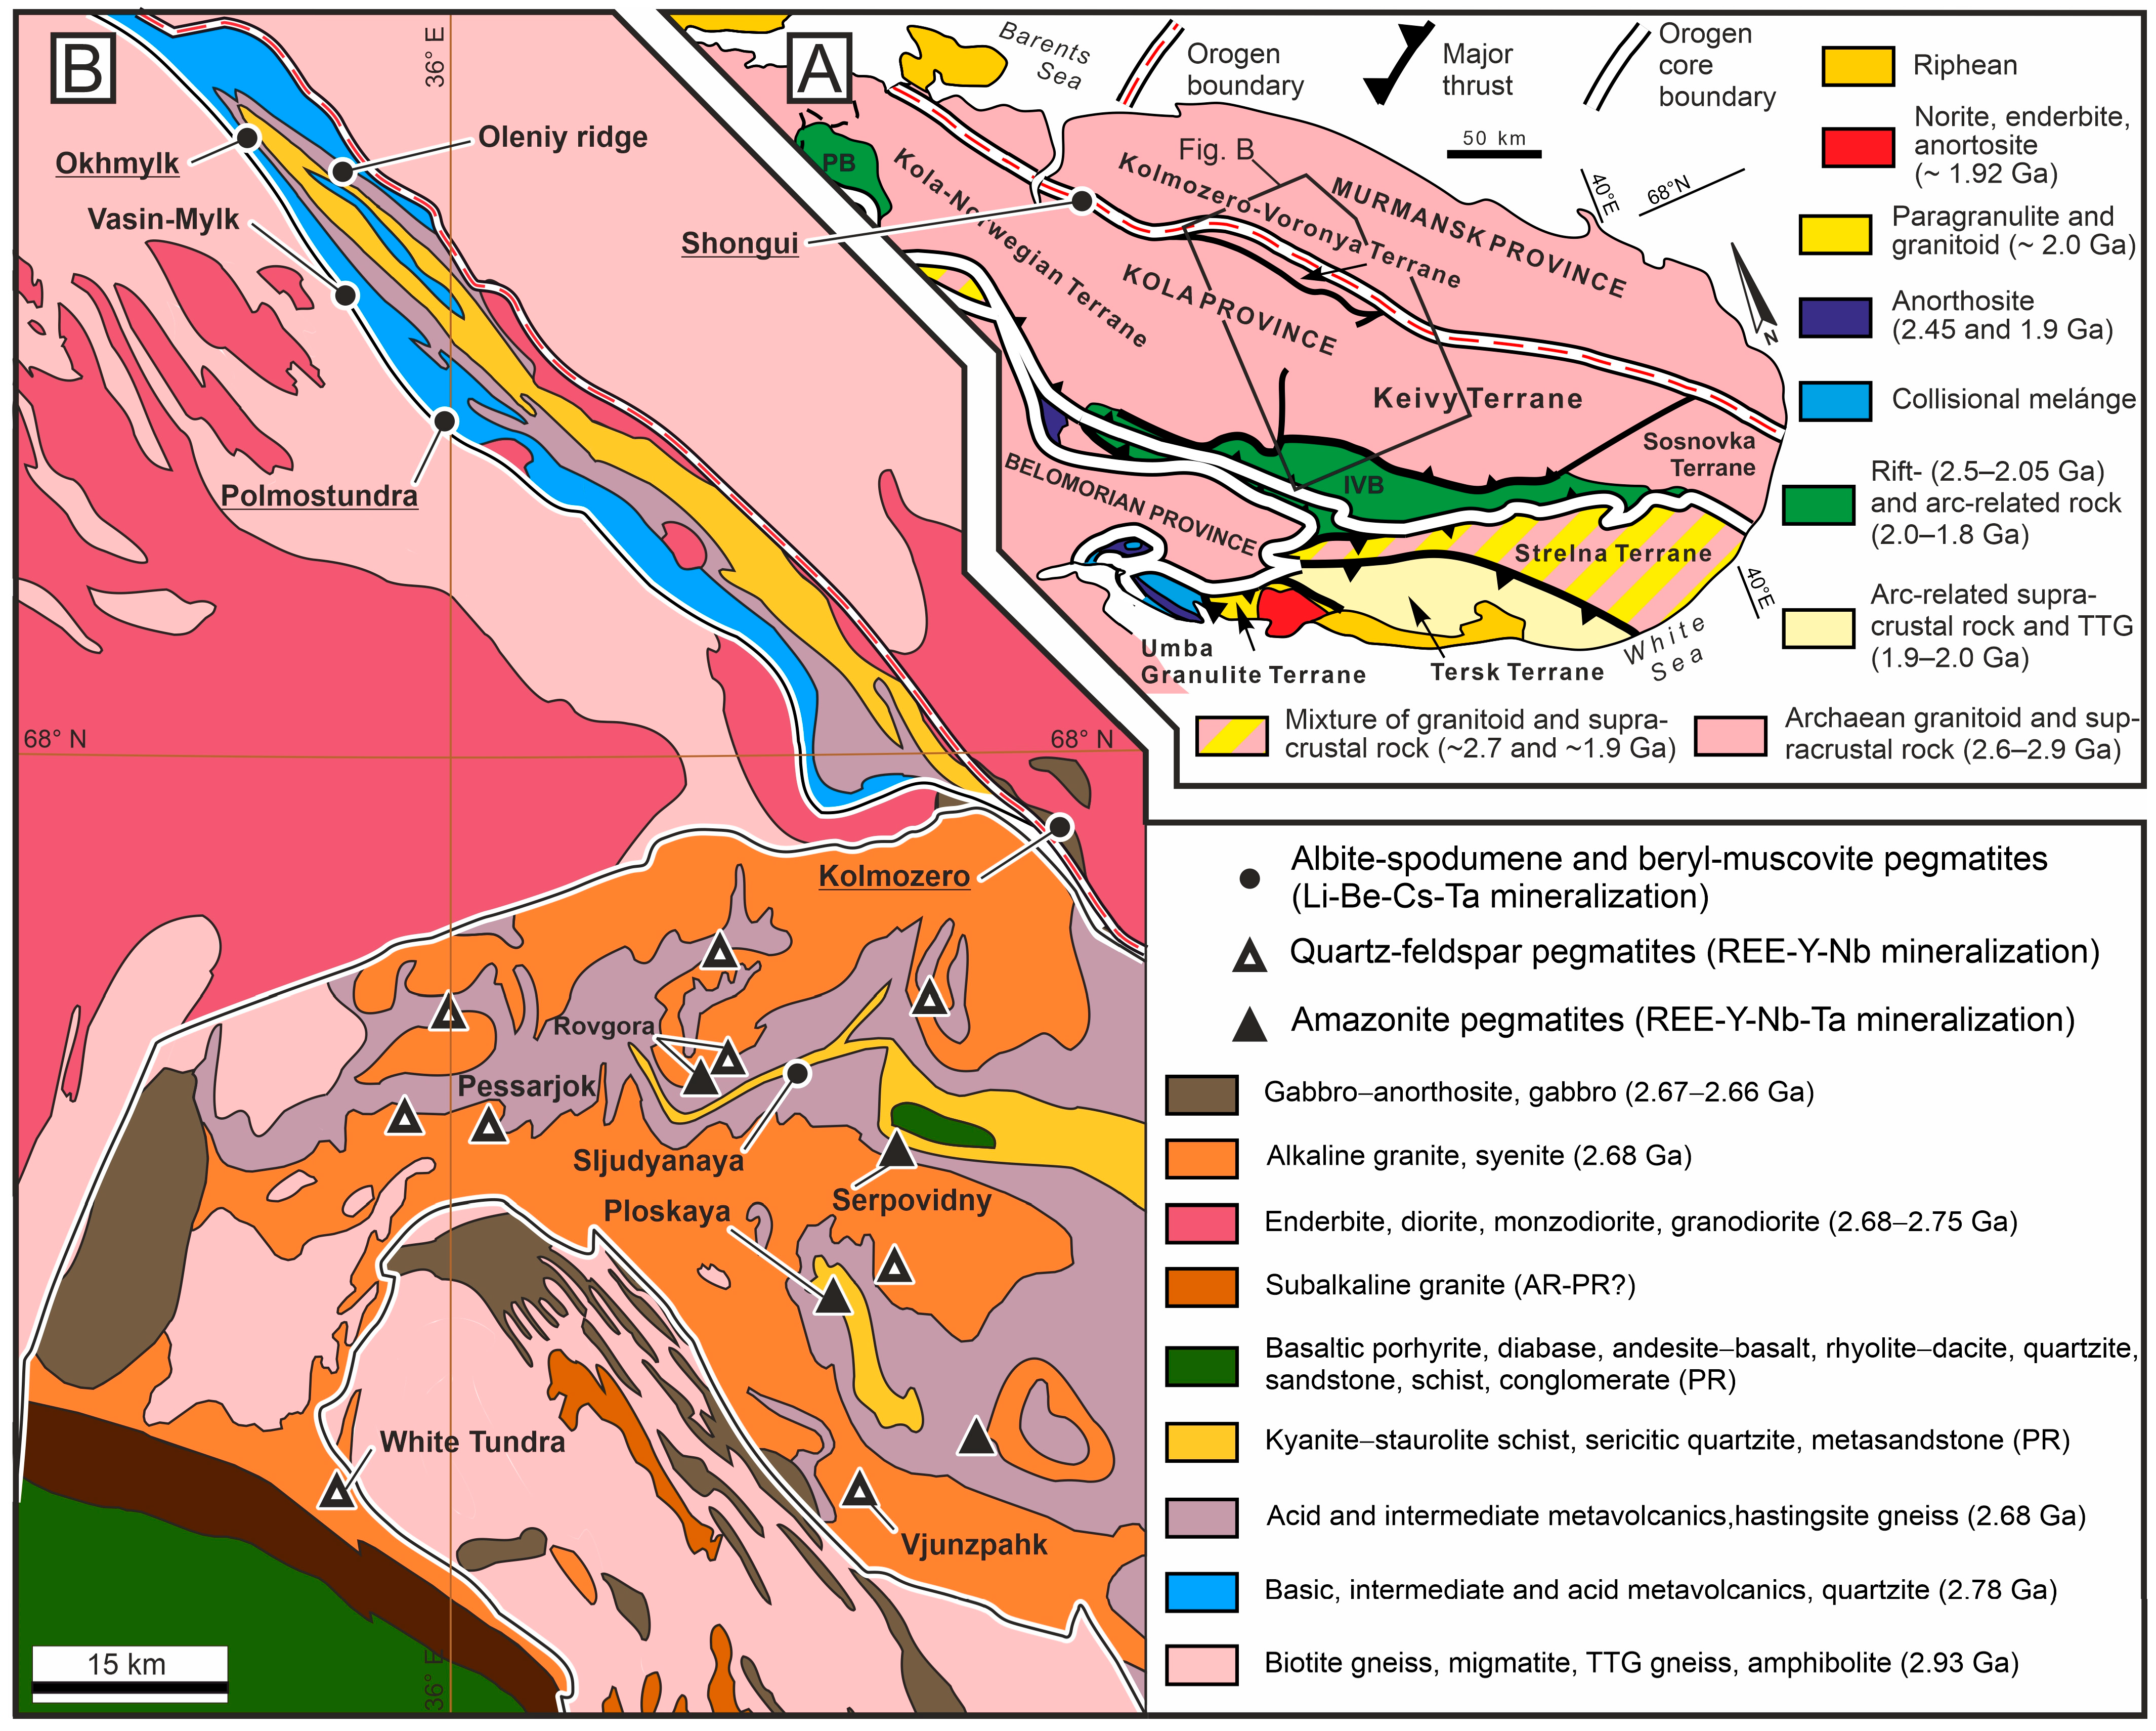
2. Geology of the Kola Rare-Metal Pegmatite Belt
3. Sampling and Methods
4. Results and Discussion
4.1. Zoning and Mineral Inclusions in CGM
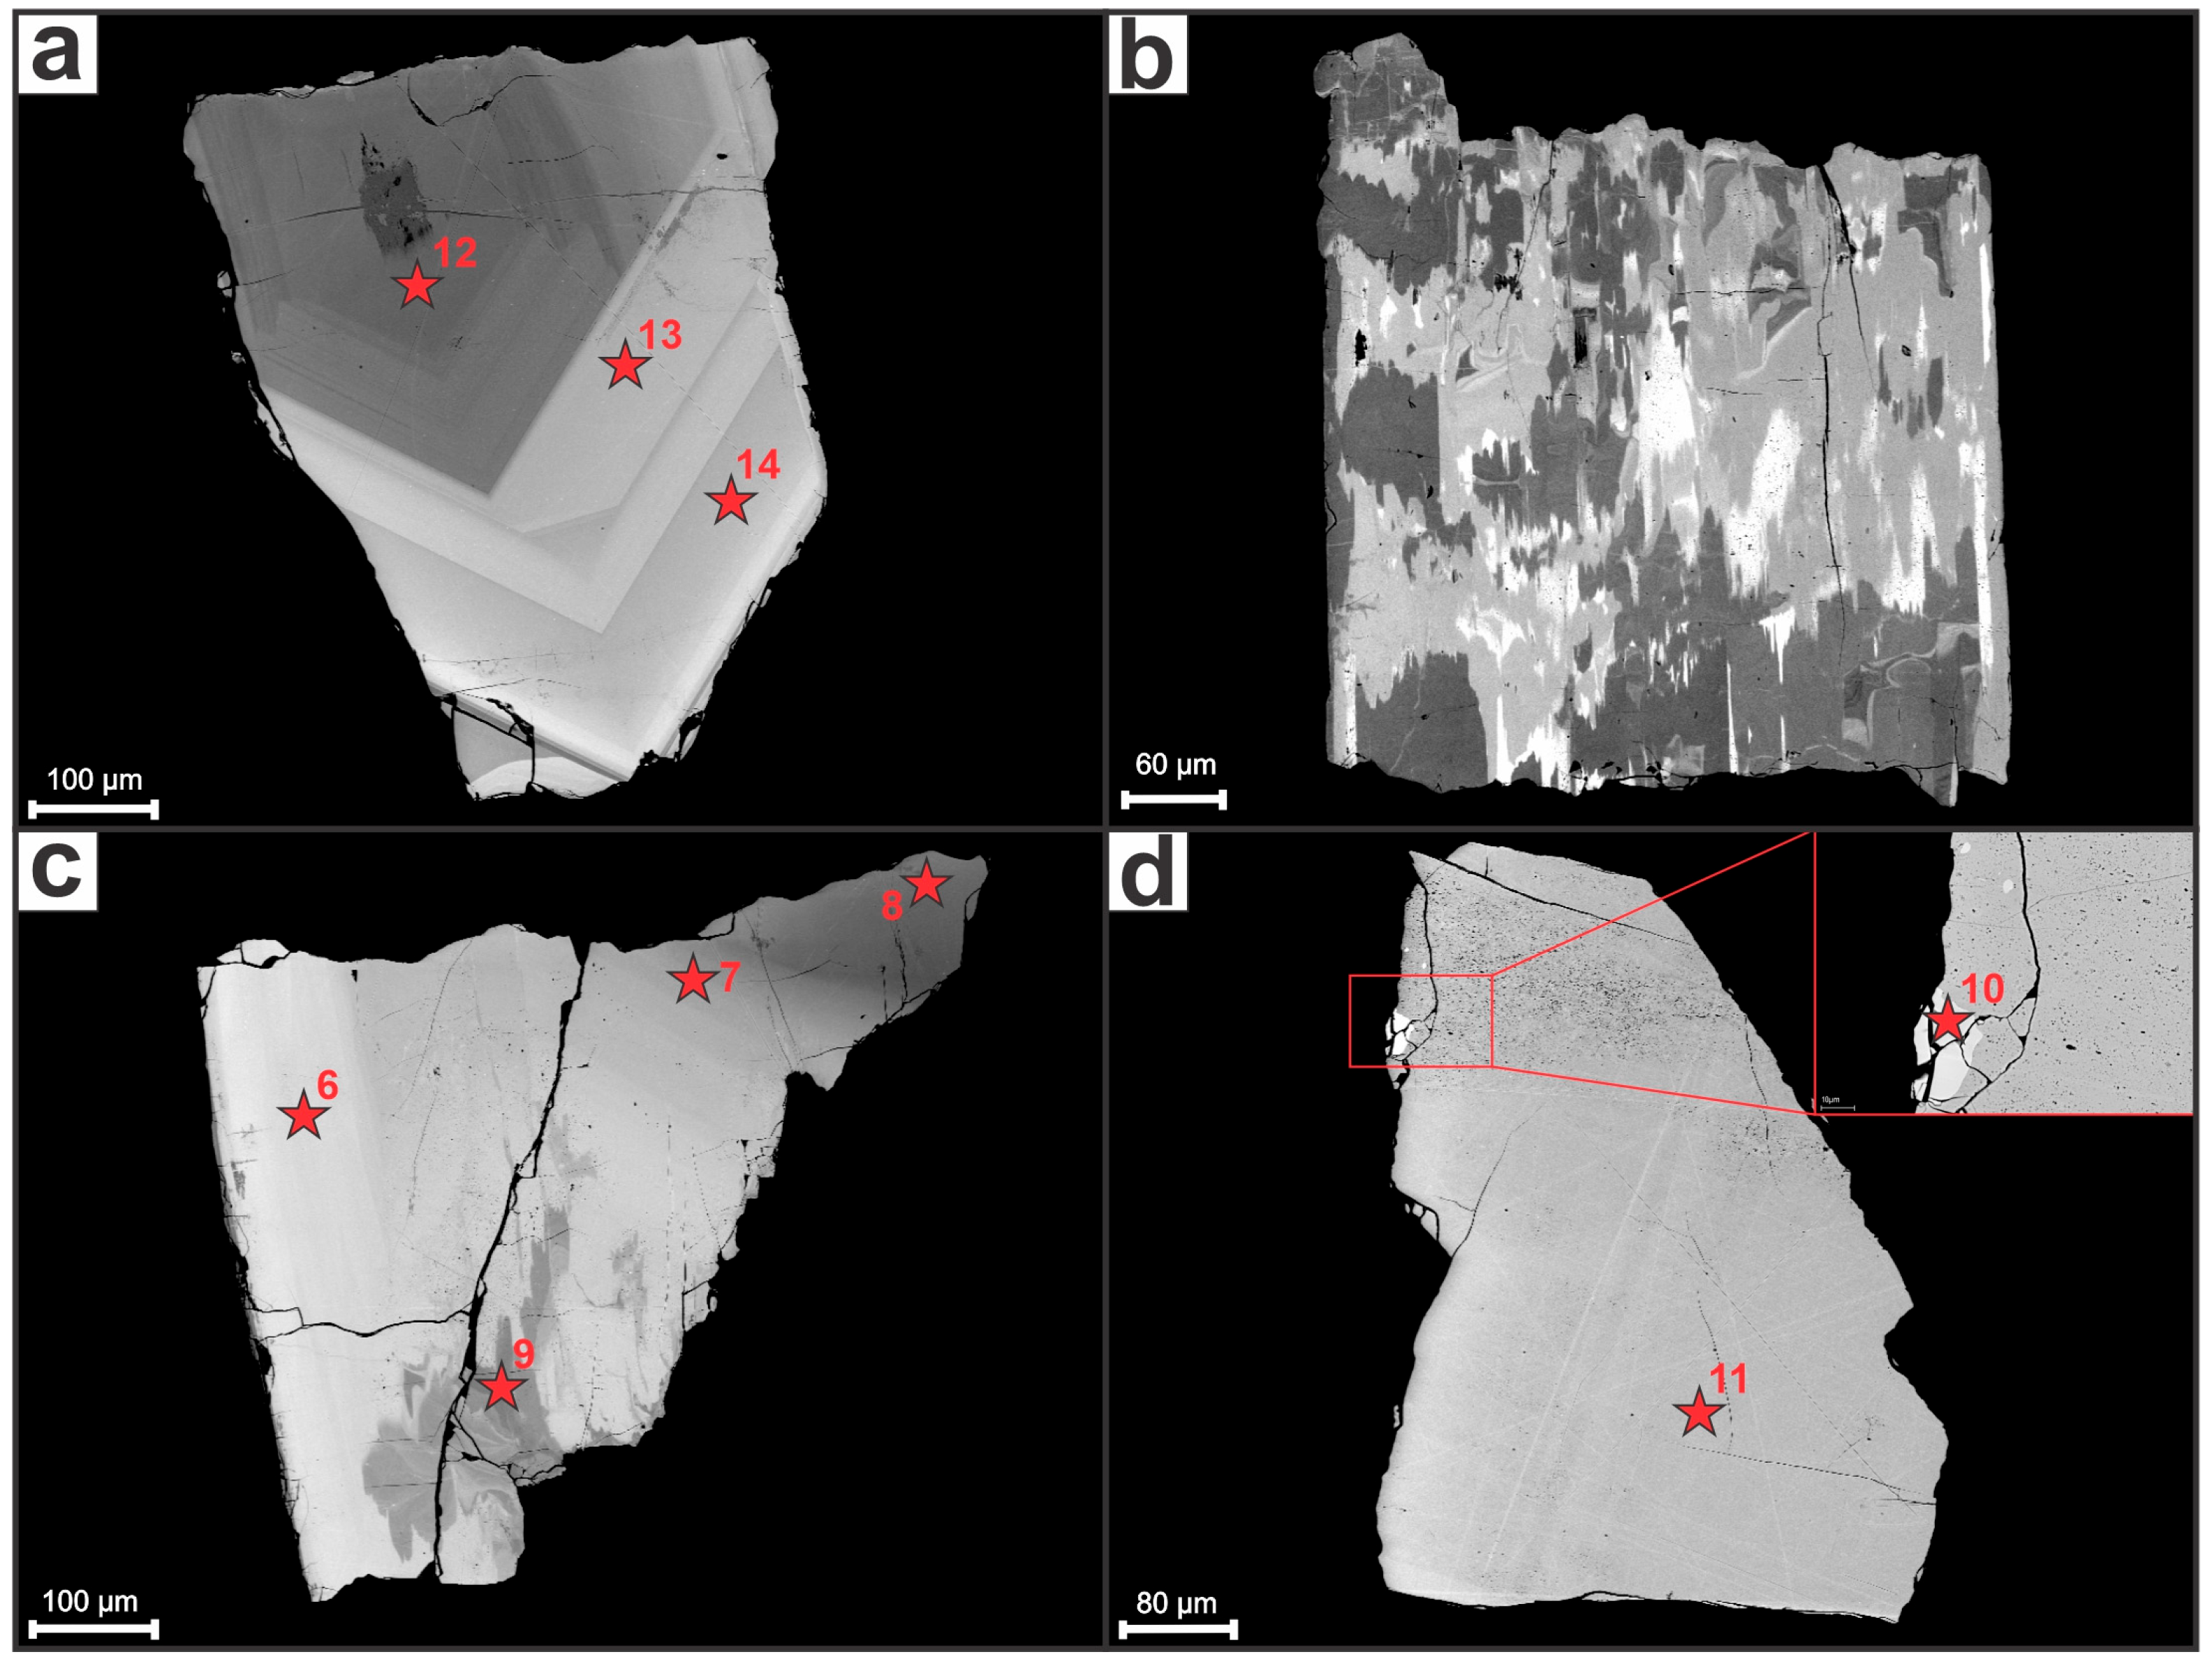
4.1.1. Kolmozero Deposit
4.1.2. Polmostundra Deposit
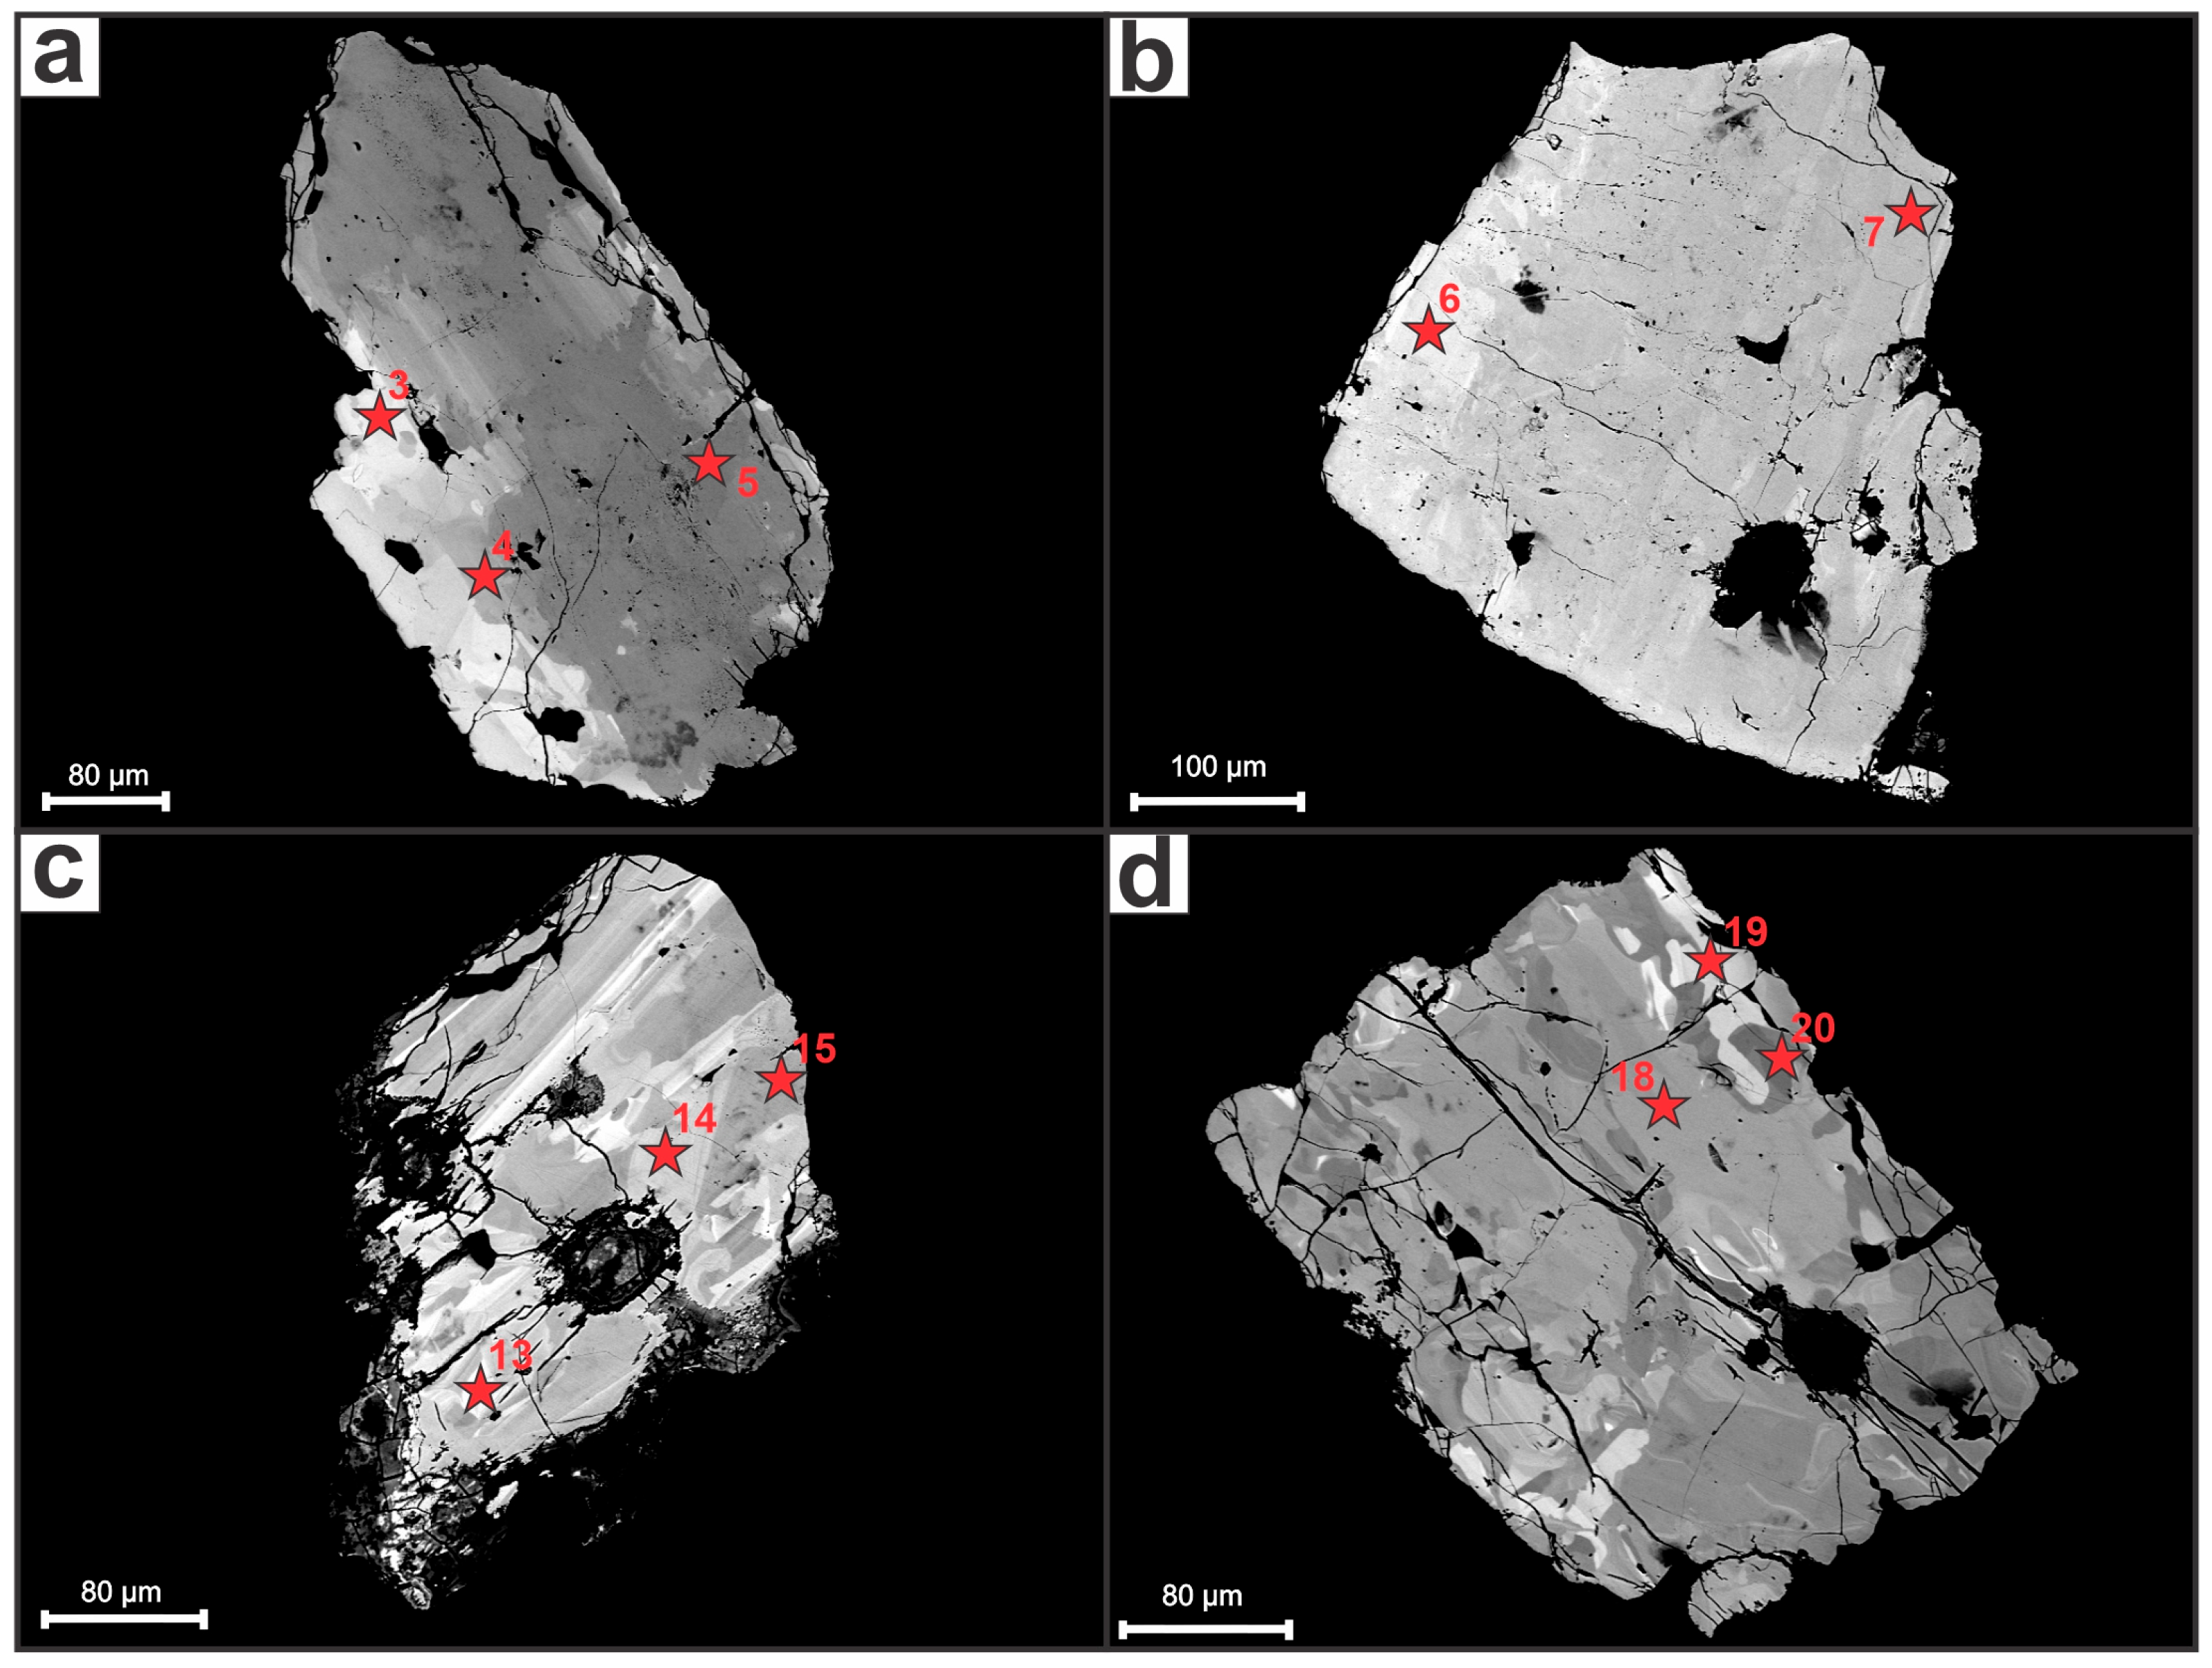
4.1.3. Okhmylk Deposit
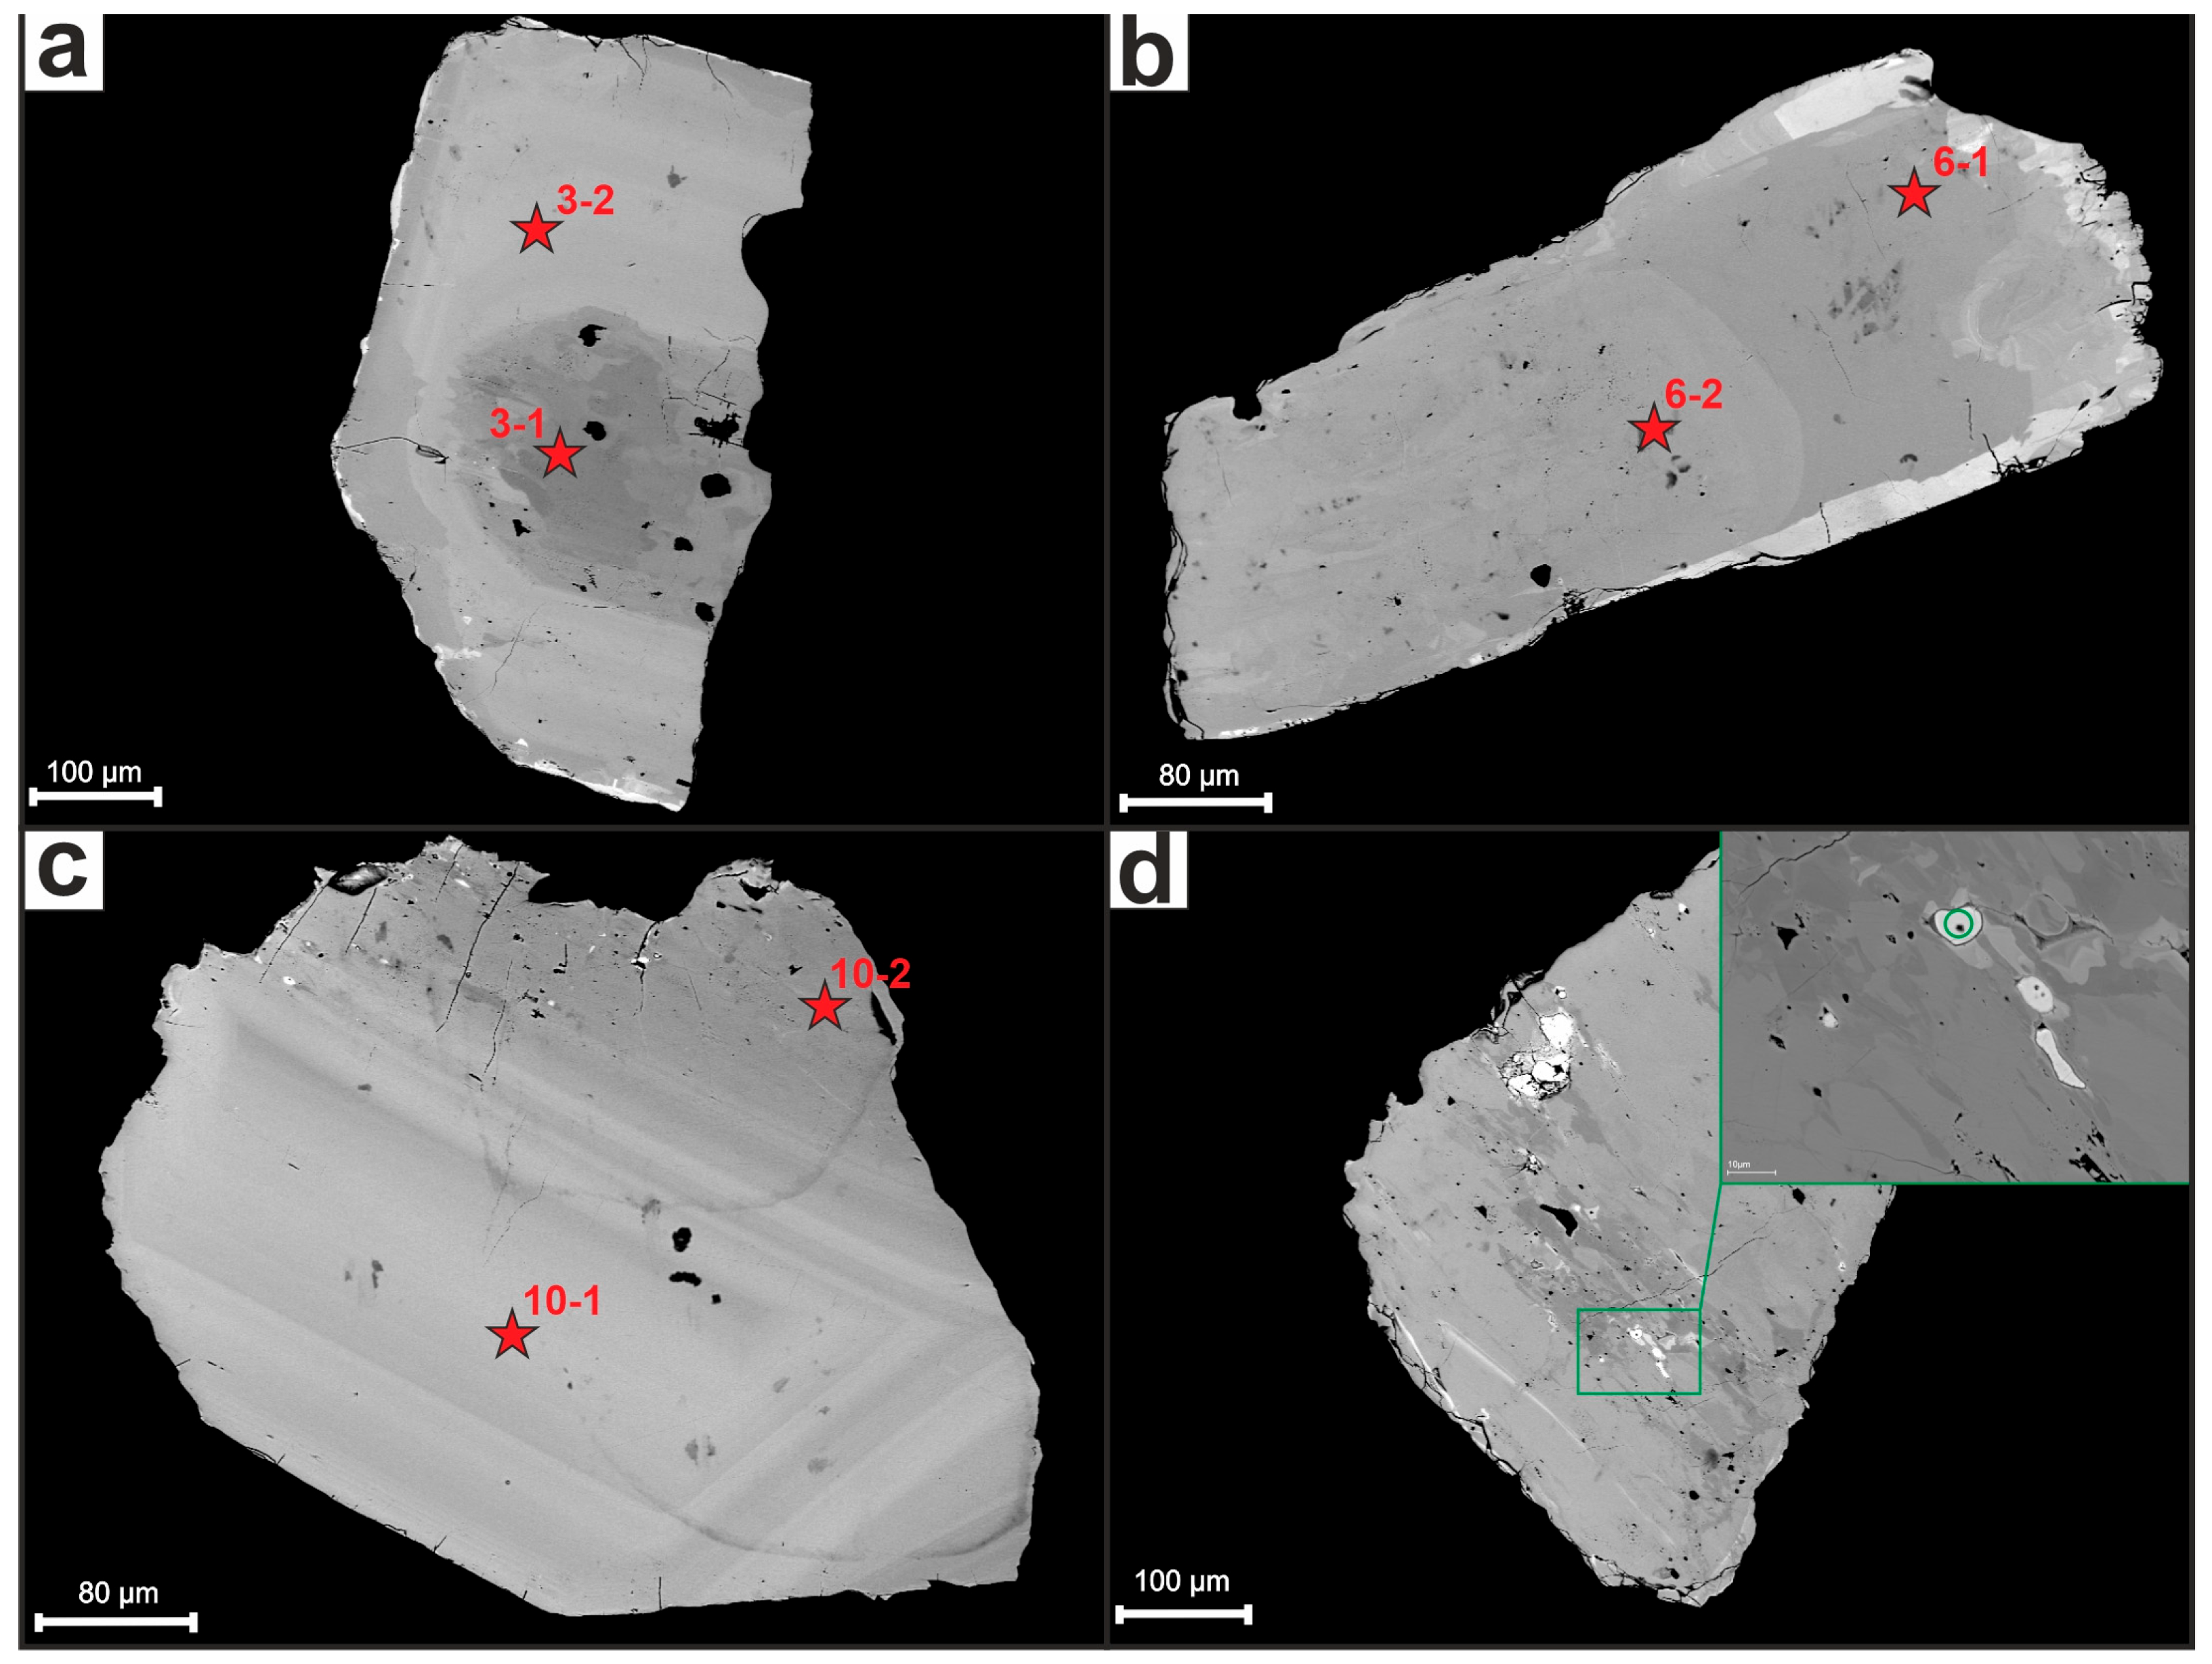
4.1.4. Shongui Deposit
4.2. Mineral Chemistry of CGM
4.2.1. Kolmozero Deposit
4.2.2. Polmostundra Deposit
4.2.3. Okhmylk Deposit
4.2.4. Shongui Deposit
4.3. Associated Pyrochlore Supergroup Minerals and Cassiterite
4.4. Implication for Ore Genesis and Grade
5. Conclusions
- CGM from high-grade Li pegmatite deposits from the Kolmozero–Voronja belt are characterized by several mineral species showing large variations in chemical compositions, mainly controlled by Nb-Ta fractionation. Textural patterns are extremely various (oscillatory, homogeneous, patchy, and mottled), and indicate the involvement of numerous magmatic and hydrothermal processes.
- Nb-Ta magmatic fractionation in CGM from low-grade and barren pegmatite deposits is insignificant.
- Fe-Mn fractionation is mainly controlled by precipitation of certain Fe minerals during pegmatite formation, and does not play an important role in the grade of the deposits.
- PSGM from high- to medium-grade lithium deposits are magmatic (Nb varieties) and early hydrothermal (Ta varieties), while in low-grade-to-barren pegmatites, the mineral crystallized at late hydrothermal stages (both Nb and Ta varieties). PSGM from beryllium deposits are early magmatic Ta varieties, and crystallized before CGM.
- Sn is concentrated in CGM from high- to medium-grade Li pegmatites, while it forms abundant hydrothermal cassiterite in low-grade and barren pegmatites.
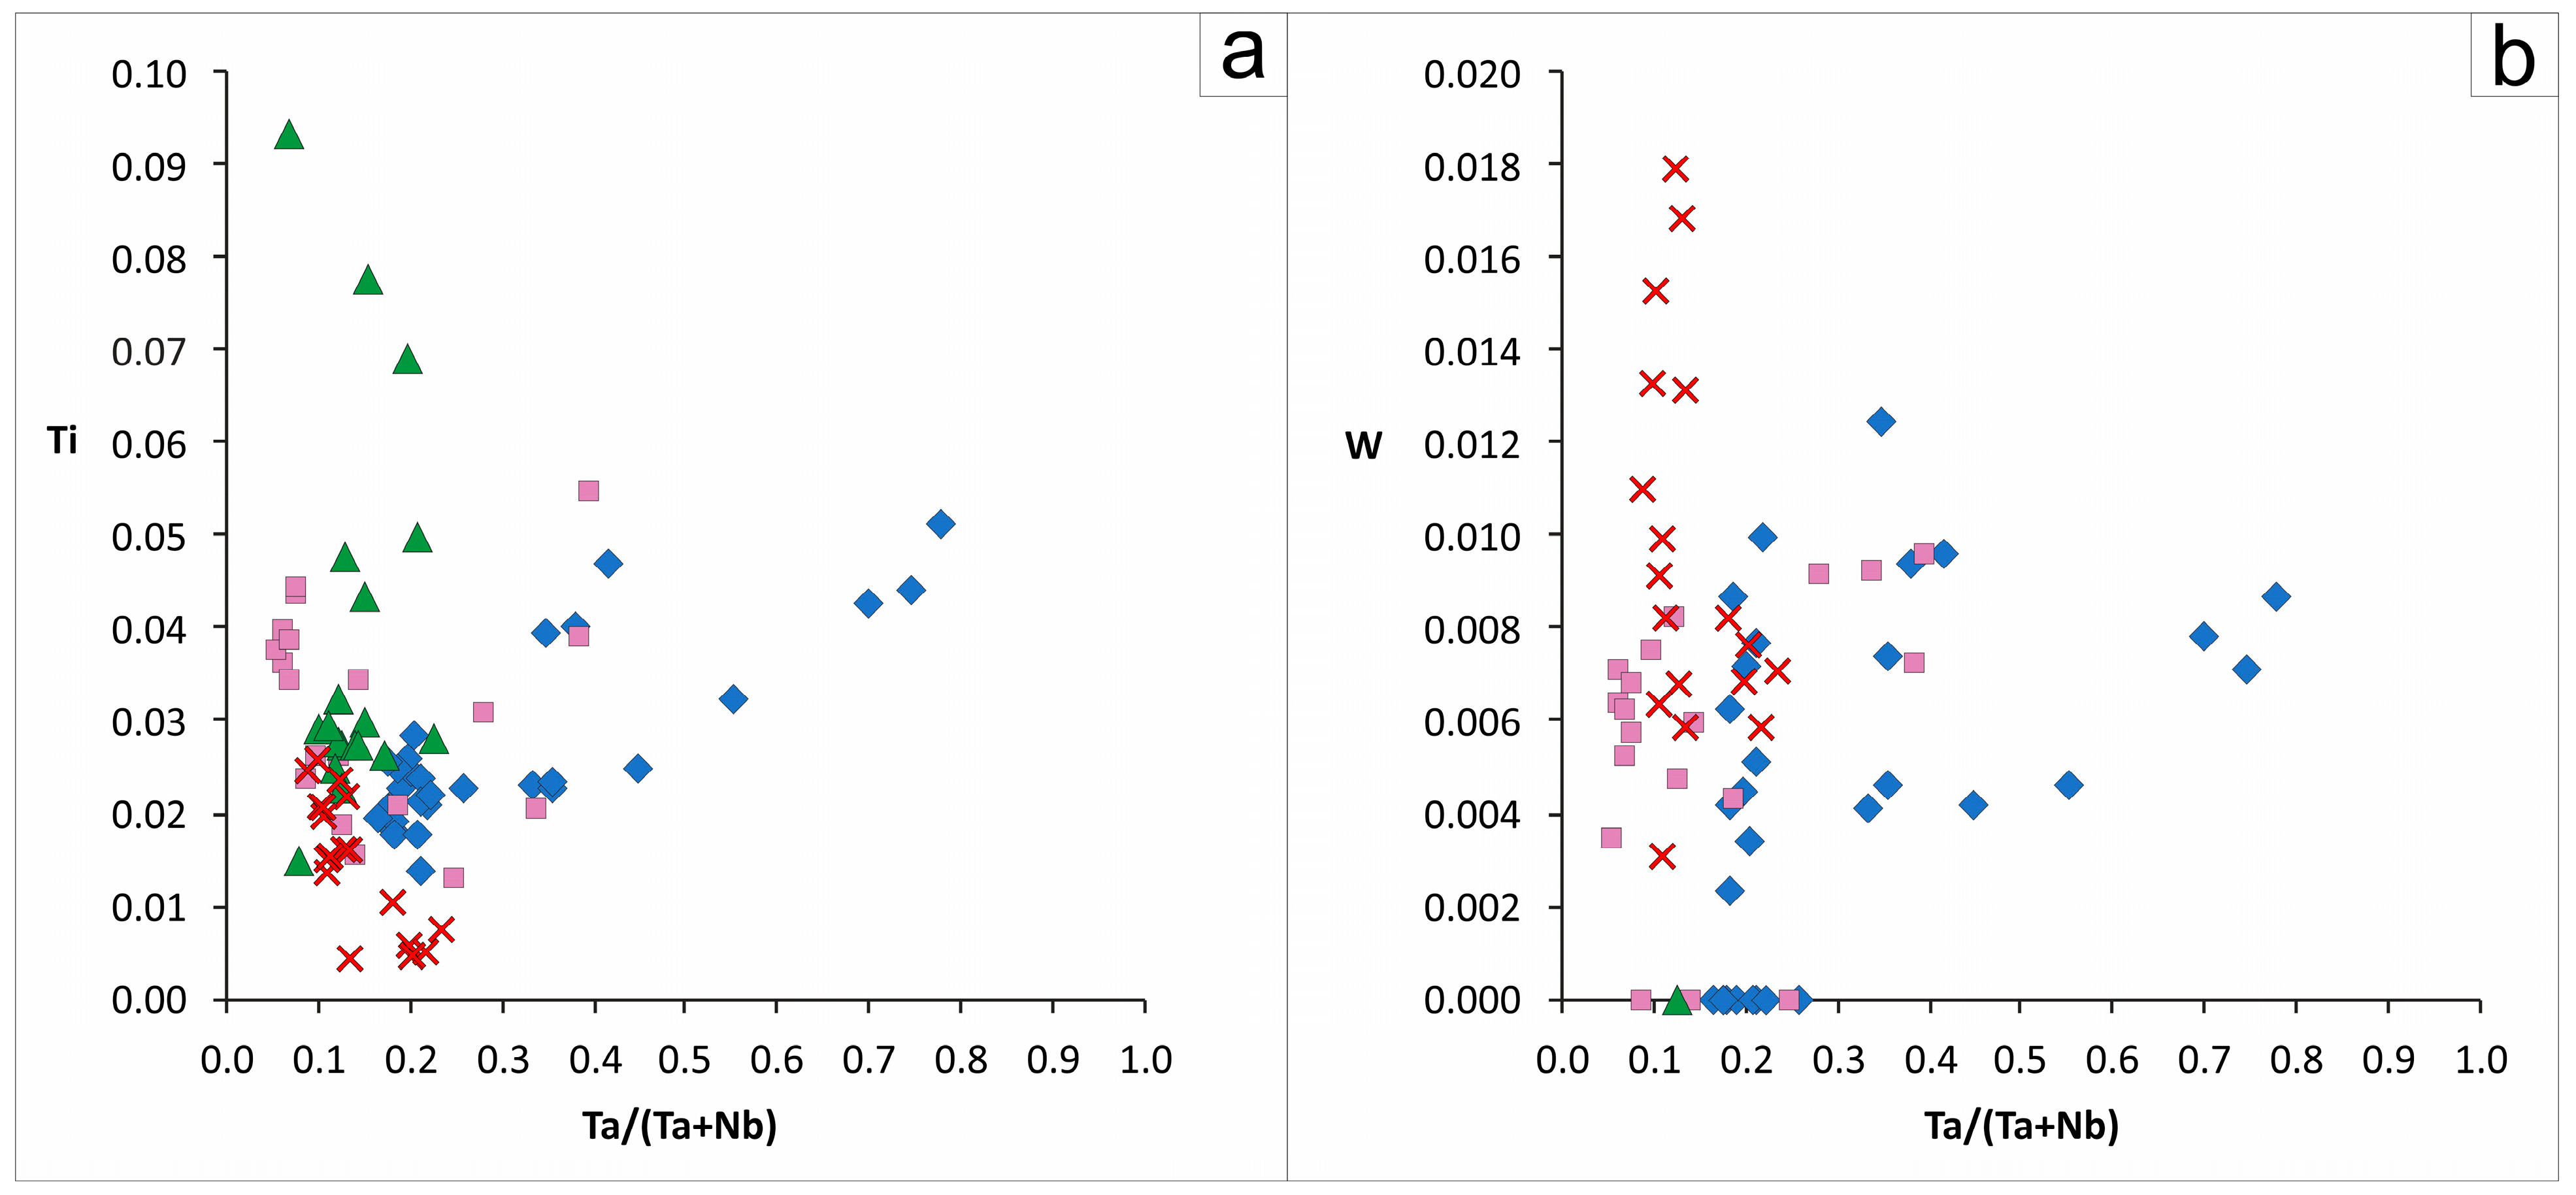
- Be-Ta pegmatites from the Kolmozero–Voronja belt are characterized by CGM with the lowest variations in fractionation ratios Ta/(Ta + Nb) and Mn/(Mn + Fe) and highest Ti contents.
Supplementary Materials
Author Contributions
Funding
Data Availability Statement
Acknowledgments
Conflicts of Interest
References
- Černý, P.; Ercit, T.S. Some recent advances in the mineralogy and geochemistry of Nb and Ta in rare-element granitic pegmatites. Bull. Mineral. 1985, 108, 499–532. [Google Scholar] [CrossRef]
- Černý, P.; Ercit, T.S. Mineralogy of niobium and tantalum: Crystal chemical relationships., paragenetic aspects and their economic implications. In Lanthanides, Tantalum and Niobium; Moller, P., Cerny, P., Saupe, F., Eds.; Springer: Berlin/Heidelberg, Germany, 1989; pp. 27–79. [Google Scholar]
- Raimbault, L. Composition of complex lepidolite-type granitic pegmatites and of constituent columbite-tantalite, Chedeville, Massif Central, France. Can. Mineral. 1998, 36, 563–583. [Google Scholar]
- Uher, P.; Černý, P.; Chapman, R.; Hatar, J.; Miko, O. Evolution of Nb. Ta-oxide minerals in the Prasiva granitic pegmatites, Slovakia; I, Primary Fe, Ti-rich assemblage. Can. Mineral. 1998, 36, 525–534. [Google Scholar]
- Lumpkin, G.R. Composition and Structural State of Columbite—Tantalite from the Harding Pegmatite, Taos Countv, New Mexico. Can. Mineral. 1998, 36, 585–599. [Google Scholar]
- Novák, M.; Uher, P.; Černý, P.; Siman, P. Compositional variations in ferrotapiolite+tantalite pairs from the beryl-columbite pegmatite at Moravany nad Váhom, Slovakia. Mineral. Petrol. 2000, 69, 295–306. [Google Scholar]
- Beurlen, H.; Da Silva, M.R.R.; Thomas, R.; Soares, D.R.; Olivier, P. Nb-Ta-(Ti-Sn) oxide mineral chemistry as tracer of rare-element granitic pegmatite fractionation in the Borborema Province, Northeastern Brazil. Miner. Depos. 2008, 43, 207–228. [Google Scholar] [CrossRef]
- Badanina, E.V.; Sitnikova, M.A.; Gordienko, V.V.; Melcher, F.; Gäbler, H.E.; Lodziak, J.; Syritso, L.F. Mineral chemistry of columbite-tantalite fromspodumene pegmatites of Kolmozero, Kola Peninsula (Russia). Ore Geol. Rev. 2015, 64, 720–735. [Google Scholar] [CrossRef]
- Zhou, Q.; Qin, K.; Tang, D. Mineralogy of columbite-group minerals from the rare-element pegmatite dykes in the East-Qinling orogen, central China: Implications for formation times and ore genesis. J. Asian Earth Sci. 2021, 218, 104879. [Google Scholar] [CrossRef]
- Zhang, A.C.; Wang, R.C.; Hu, H.; Zhang, H.; Zhu, J.C.; Chen, X.M. Chemical evolution of Nb-Ta oxides and zircon from the Koktokay No. 3 granitic pegmatite, Altai, northwestern China. Mineral. Mag. 2004, 68, 739–756. [Google Scholar] [CrossRef]
- Van Lichtervelde, M.; Salvi, S.; Beziat, D.; Linnen, R.L. Textural features and chemical evolution in tantalum oxides: Magmatic versus hydrothermal origins for Ta mineralization in the Tanco Lower Pegmatite, Manitoba. Can. Econ. Geol. 2007, 102, 257–276. [Google Scholar] [CrossRef]
- Llorens, T.; Moro, M.C. Microlite and Tantalite in the LCT Granitic Pegmatites of La Canalita, Navasfrías Sn–W District, Salamanca, Spain. Can. Mineral. 2010, 48, 375–390. [Google Scholar] [CrossRef]
- Martins, T.; Lima, A.; Simmons, W.B.; Falster, A.U.; Noronha, F. Geochemical fractionation of Nb-Ta oxides in Li-bearing pegmatites from the Barroso-Alvão pegmatite field, northern Portugal. Can. Mineral. 2011, 49, 777–791. [Google Scholar] [CrossRef]
- Melcher, F.; Graupner, T.; Gäbler, H.-E.; Sitnikova, M.; Henjes-Kunst, F.; Oberthür, T.; Gerdes, A.; Dewaele, S. Tantalum–(niobium–tin) mineralisation in African pegmatites and rare metal granites: Constraints from Ta–Nb oxide mineralogy, geochemistry and U–Pb geochronology. Ore Geol. Rev. 2015, 64, 667–719. [Google Scholar] [CrossRef]
- Melcher, F.; Graupner, T.; Gäbler, H.-E.; Sitnikova, M.; Oberthür, T.; Gerdes, A.; Badanina, E.; Chudy, T. Mineralogical and chemical evolution of tantalum–(niobium–tin) mineralisation in pegmatites and granites. Part 2: Worldwide examples (excluding Africa) and an overview of global metallogenetic patterns. Ore Geol. Rev. 2017, 89, 946–987. [Google Scholar] [CrossRef]
- González, T.L.; Polonio, F.G.; Moro, F.J.L.; Fernández, A.F.; Contreras, J.L.S.; Benito, M.C.M. Tin-tantalum-niobium mineralization in the Penouta deposit (NW Spain): Textural features and mineral chemistry to unravel the genesis and evolution of cassiterite and columbite group minerals in a peraluminous system. Ore Geol. Rev. 2017, 81, 79–95. [Google Scholar] [CrossRef]
- Sun, W.; Zhao, Z.; Mo, X.; Wei, C.; Dong, G.; Li, X.; Yuan, W.; Wang, T.; Yang, S.; Wang, B.; et al. Age and Composition of Columbite-Tantalite Group Minerals in the Spodumene Pegmatite from the Chakabeishan Deposit, Northern Tibetan Plateau and Their Implications. Minerals 2023, 13, 201. [Google Scholar] [CrossRef]
- Černý, P. Characteristics of pegmatite deposits of tantalum. In Lanthanides, Tantalum and Niobium; Möller, P., Černý, P., Saupé, F., Eds.; Springer: Berlin/Heidelberg, Germany, 1989; pp. 195–239. [Google Scholar]
- Spilde, M.N.; Shearer, C.K. A comparison of tantalum—Niobium oxide assemblages in two mineralogically distinct rare-element granitic pegmatites, Black Hills, South Dakota. Can. Mineral. 1992, 30, 719–737. [Google Scholar]
- Černý, P.; Němec, D. Pristine vs. contaminated trends in Nb,Ta-oxide minerals of the Jihlava pegmatite district, Czech Republic. Mineral. Petrol. 1995, 55, 117–129. [Google Scholar] [CrossRef]
- Linnen, R.L.; van Lichtervelde, M.; Černý, P. Granitic pegmatites as sources of strategic metals. Elements 2012, 8, 275–280. [Google Scholar] [CrossRef]
- Mitrofanov, F.P.; Lebedev, A.V. (Eds.) Multimedia Reference Book on Mineral Resources and the Mining Complex of the Murmansk Region: A Digital Information Resource; GI KSC RAS: Apatity, Russia, 2001. (In Russian) [Google Scholar]
- Mints, M.V.; Dokukina, K.A.; Filippova, I.B.; Konilov, A.N. East European Craton: Early Precambrian History and 3D Models of the Deep Structure of the Earth’s Crust; Geological Society of America (GSA): Boulder, CO, USA, 2015; 433p. [Google Scholar]
- Daly, J.S.; Balagansky, V.V.; Timmerman, M.J.; Whitehouse, M.J. The Lapland-Kola Orogen: Palaeoproterozoic collision and accretion of the northern Fennoscandian lithosphere. In European Lithosphere Dynamics; Memoir, 32; Gee, D.G., Stephenson, R.A., Eds.; Geological Society: London, UK, 2006; pp. 579–597. [Google Scholar]
- Belolipetsky, A.P.; Gaskelberg, V.G.; Gaskelberg, L.A.; Antonyuk, E.S.; Ilyin, Y.U.I. Geology and Geochemistry of Metamorphic Complexes of the Early Precambrian of the Kola Peninsula; Nauka: Leningrad, Russia, 1980; 240p. (In Russian) [Google Scholar]
- Vrevsky, A.B. Petrology and Geodynamic Modes of Development of the Archean Lithosphere (on the Example of the Northeastern Part of the Baltic Shield); Nauka: Leningrad, Russia, 1989; 143p. (In Russian) [Google Scholar]
- Glebovitsky, V.A. Early Precambrian of the Baltic Shield; Nauka: St. Petersburg, Russia, 2005; 711p. (In Russian) [Google Scholar]
- Hölttä, P.; Balagansky, V.; Garde, A.A.; Mertanen, S.; Peltonen, P.; Slabunov, A.; Sorjonen-Ward, P.; Whitehouse, M. Archean of Greenland and Fennoscandia. Episodes 2008, 31, 13–19. [Google Scholar] [CrossRef]
- McCaffrey, K.J.W.; Lonergan, L.; Wilkinson, J.J. Fractures. In Fluid Flow and Mineralization; Geological Society of London: London, UK, 1999; 337p. [Google Scholar]
- Morozova, L.N. Kolmozero lithium deposit of rare metal pegmatites: New data on rare element composition (Kola Peninsula). Lithosphere 2018, 18, 82–98. [Google Scholar] [CrossRef]
- Morozova, L.N.; Bazai, A.V. Spodumene from rare-metal pegmatites of the Kolmozerskoe lithium deposit (Kola Peninsula). Proc. Russ. Mineral. Soc. 2019, 148, 65–78. (In Russian) [Google Scholar]
- Morozova, L.N.; Sokolova, E.N.; Smirnov, S.Z.; Balagansky, V.V.; Bazai, A.V. Spodumene from rare-metal pegmatites of the Kolmozero lithium world-class deposit on the Fennoscandian shield: Trace elements and crystal-rich fluid inclusions. Mineral. Mag. 2021, 85, 149–160. [Google Scholar] [CrossRef]
- Zozulya, D.; Macdonald, R.; Bagiński, B. REE fractionation during crystallization and alteration of fergusonite-(Y) from Zr-REE-Nb-rich late- to post-magmatic products of the Keivy alkali granite complex, NW Russia. Ore Geol. Rev. 2020, 125, 103693. [Google Scholar] [CrossRef]
- Gordienko, V.V. Mineralogy, Geochemistry and Genesis of Spodumene Pegmatites; Nedra: Leningrad, Russia, 1970; 239p. (In Russian) [Google Scholar]
- Morozova, L.N.; Bayanova, T.B.; Bazai, A.V.; Lyalina, L.M.; Serov, P.A.; Borisenko, E.S.; Kunakkuzin, E.L. Rare-metal pegmatites of the Kolmozerskoe lithium deposit in the Arctic region of the Baltic Shield: New geochronological data. Bull. Kola Sci. Cent. Russ. Acad. Sci. 2017, 1, 43–52. (In Russian) [Google Scholar]
- Hanski, E.J.; Melezhik, V.A. Litho- and chronostratigraphy of the Palaeoproterozoic Karelian formations. In Reading the Archive of Earth’s Oxygenation; Melezhik, V.A., Ed.; Springer: Berlin/Heidelberg, Germany, 2013; Volume 2, pp. 39–110. [Google Scholar]
- Kudryashov, N.M.; Udoratina, O.V.; Kalinin, A.A.; Lyalina, L.M.; Selivanova, E.A.; Grove, M.J. U-Pb (SHRIMP-RG) age of zircon from rare-metal (Li, Cs) pegmatites of the Okhmylk deposit of the Kolmozero-Voron’ya greenstone belt (northeast of the Fennoscandian shield). J. Min. Inst. 2022, 255, 448–454. [Google Scholar] [CrossRef]
- Antonyuk, E.S. Structural-Mineral Complexes of Granite Pegmatite Veins, Materials on the Mineralogy of the Kola Peninsula; KFAN USSR: Apatity, Russia, 1962; pp. 134–142. (In Russian) [Google Scholar]
- Polkanov, A.A.; Gerling, E.K. Geochronology and geological evolution of the Baltic Shield and its folded framing. Tr. LAGED 1961, 12, 101–102. (In Russian) [Google Scholar]
- Černý, P.; Ercit, S. The classification of granitic pegmatites revisited. Can. Mineral. 2005, 43, 2005–2026. [Google Scholar] [CrossRef]
- Müller, A.; Romer, R.L.; Pedersen, R.B. The Sveconorwegian pegmatite province—Thousands of pegmatites without parental granites. Can. Mineral. 2017, 55, 283–315. [Google Scholar] [CrossRef]
- Webber, K.L.; Simmons, W.B.; Falster, A.U.; Hanson, S.L. Anatectic pegmatites of the Oxford County pegmatite field, Maine, USA. Can. Mineral. 2019, 57, 811–815. [Google Scholar] [CrossRef]
- Silva, D.; Groat, L.; Martins, T.; Linnen, R. Structural controls on the origin and emplacement of lithium-bearing pegmatites. Can. J. Mineral. Petrol. 2023, 61, 2300045. [Google Scholar] [CrossRef] [PubMed]
- Zhao, Z.; Yang, X.; Lu, S.; Lu, Y.; Sun, C.; Chen, S.; Chen, S.S.; Zhang, Z.Z.; Bute, S.I.; Zhao, L.L. Genesis of Late Cretaceous granite and its related Nb-Ta-W mineralization in Shangbao. Nanling Range: Insights from geochemistry of whole-rock and Nb-Ta minerals. Ore Geol. Rev. 2021, 131, 103975. [Google Scholar] [CrossRef]
- Alfonso, P.; Hamid, S.; Garcia-Valles, M.; Llorens, T.; López Moro, F.; Tomasa, O.; Calvo, D.; Guasch, E.; Anticoi, H.; Oliva, J.; et al. Textural and mineral-chemistry constraints on columbite-group minerals in the Penouta deposit: Evidence from magmatic and fluid-related processes. Mineral. Mag. 2018, 82 (Suppl. S1), 199–222. [Google Scholar] [CrossRef]
- Tindle, A.G.; Breaks, F.W. Columbite-tantalite mineral chemistry from rare-element granitic pegmatites: Separation Lakeh area, NW Ontario. Canada. Mineral. Petrol. 2000, 70, 165–198. [Google Scholar] [CrossRef]
- Černý, P. The Tanco rare-element pegmatite deposit, Manitoba: Regional context, internal anatomy, and global comparisons. In Rare-Element Geochemistry and Mineral Deposits; GAC Short Course Notes; Linnen, R.L., Samson, I.M., Eds.; Geological Association of Canada: St. John’s, NL, Canada, 2005; Volume 17, pp. 127–158. [Google Scholar]
- Chudík, P.; Uher, P.; Gadas, P.; Škoda, R.; Pršek, J. Niobium-tantalum oxide minerals in the Jezuitské Lesy granitic pegmatite, Bratislava Massif, Slovakia: Ta to Nb and Fe to Mn evolutionary trends in a narrow Be, Cs-rich and Li, B-poor dike. Mineral. Petrol. 2011, 102, 15–27. [Google Scholar] [CrossRef]
- Lahti, S.I. Zoning in columbite-tantalite crystals from the granitic pegmatites of the Eräjärvi area, southern Finland. Geochim. Cosmochim. Acta 1987, 51, 509–517. [Google Scholar] [CrossRef]
- Van Lichtervelde, M.; Linnen, R.L.; Salvi, S.; Beziat, D. The role of metagabbro rafts on tantalum mineralization in the Tanco granitic pegmatite, Manitoba. Can. Mineral. 2006, 44, 625–644. [Google Scholar] [CrossRef]
- Van Lichtervelde, M.; Holtz, F.; Melcher, F. The effect of disequilibrium crystallization on Nb-Ta fractionation: Contraints from crystallization experiments of tantalite-tapiolite. Am. Mineral. 2018, 103, 1401–1416. [Google Scholar] [CrossRef]
- London, D. Ore-forming processes within granitic pegmatites. Ore Geol. Rev. 2018, 101, 349–383. [Google Scholar] [CrossRef]
- Jahns, R.H.; Burnham, C.W. Experimental studies of pegmatite genesis: I, A model for the derivation and crystallization of granitic pegmatites. Econ. Geol. 1969, 64, 843–864. [Google Scholar] [CrossRef]
- Novák, M.; Černý, P.; Uher, P. Extreme variation and apparent reversal of Nb-Ta fractionaction in columbite-group minerals from the Scheibengraben beryl-columbite granitic pegmatite, Maršíkov, Czech Republic. Eur. J. Mineral. 2003, 15, 565–574. [Google Scholar] [CrossRef]
- Galliski, M.A.; Márquez-Zavalia, M.F.; Černý, P.; Martínez, V.A.; Capman, R. The Ta-Nb-Sn-Ti oxide mineral paragenesis from La Viquita, a spodumene bearing rare-element granitic pegmatite, San Luis, Argentina. Can. Mineral. 2008, 30, 379–393. [Google Scholar] [CrossRef]
- Wise, M.A.; Brown, C.D. Mineral chemistry, petrology and geochemistry of the Sebago granite–pegmatite system, southern Maine, USA. J. Geosci. 2010, 55, 3–26. [Google Scholar] [CrossRef]
- Zhu, Z.Y.; Wang, R.C.; Che, X.D.; Zhu, J.C.; Wei, X.L.; Huang, X. Magmatic–hydrothermal rare element mineralization in the Songshugang granite (northeastern Jiangxi. China): Insights from an electron-microprobe study of Nb–Ta–Zr minerals. Ore Geol. Rev. 2015, 65, 749–760. [Google Scholar] [CrossRef]
- Feng, Y.G.; Liang, T.; Yang, X.Q.; Zhang, Z.; Wang, Y.Q. Chemical evolution of Nb- Ta Oxides and Cassiterite in phosphorus-rich albite-spodumene pegmatites in the Kangxiwa-Dahongliutan pegmatite field, Western Kunlun Orogen, China. Minerals 2019, 9, 166. [Google Scholar] [CrossRef]
- Duan, Z.-P.; Jiang, S.-Y.; Su, H.-M.; Zhu, X.Y.; Zou, T. Nb-Ta oxides as recorders of hydrothermal activity in the Shihuiyao Rb-Nb-Ta-(Be-Li) deposit, Inner Mongolia, NE China. Ore Geol. Rev. 2022, 150, 105149. [Google Scholar] [CrossRef]
- Shchekina, T.I.; Gramenitskii, E.N. Geochemistry of Sc in the magmatic process: Experimental evidence. Geochem. Int. 2008, 46, 351–366. [Google Scholar] [CrossRef]
- Von Knorring, O.; Fadipe, A. On the mineralogy and geochemistry of niobium and tantalum in some granite pegmatites and alkali granites of Africa. Bull. Minéral. 1981, 104, 496–507. [Google Scholar] [CrossRef]
- Breiter, K.; Skoda, R.; Uher, P. Nb–Ta–Ti–W–Sn-oxide minerals as indicators of a peraluminous P- and F-rich granitic system evolution: Podlesí, Czech Republic. Mineral. Petrol. 2007, 91, 225–248. [Google Scholar] [CrossRef]
- Linnen, R.L.; Keppler, H. Columbite solubility in granitic melts: Consequences for the enrichment and fractionation of Nb and Ta in the Earth’s crust. Contrib. Mineral. Petrol. 1997, 128, 213–227. [Google Scholar] [CrossRef]
- Fiege, A.; Kirchner, C.; Holtz, F.; Linnen, R.L.; Dziony, W. Influence of fluorine on the solubility of manganotantalite (MnTa2O6) and manganocolumbite (MnNb2O6) in granitic melts—An experimental study. Lithos 2011, 122, 165–174. [Google Scholar] [CrossRef]
- Kaeter, D.; Barros, R.; Menuge, J.F. Metasomatic High Field Strength Element, Tin, and Base Metal Enrichment Processes in Lithium Pegmatites from Southeast Ireland. Econ. Geol. 2021, 116, 169–198. [Google Scholar] [CrossRef]
- Zhang, D.H.; Zhang, W.H.; Xu, G.J. The ore fluid geochemistry of F-rich silicate melt-hydrous fluid system and its metallogeny-the current status and problems. Earth Sci. Front. 2004, 11, 479–490. [Google Scholar]
- Seward, T.M.; Barnes, H.L. Metal transport by hydrothermal ore fluids. Geochem. Hydrotherm. Ore Depos. 1997, 3, 435–486. [Google Scholar]


| Deposit/Occurrence | Kolmozero | Polmostundra | Okhmylk | Shongui |
|---|---|---|---|---|
| Sample N | KL-GX-11 | POL-GX-3/5 | OKH-2/2 | SH-7 |
| Major and minor minerals (in vol.%) | quartz (50–60); feldspar (microcline + albite) (20–25); spodumene (15–20) | quartz (50–60); feldspar (microcline + albite) (25–30); lepidolite (8–10); spodumene (3–5) | quartz (50–60); feldspar (microcline + albite) (40–45); tourmaline (mainly schorl) (3–5); spodumene (1–2) | quartz (60–65); feldspar (mainly albite) (35–40) |
| Accessory minerals | garnet, apatite, magnetite, ilmenite | apatite, tourmaline, garnet, magnetite, rutile, ilmenite | apatite, magnetite, garnet | beryl, tourmaline, apatite, garnet, magnetite, |
| Nb-Ta-Sn oxides | CGM | CGM, pyrochlore/microlite | CGM, pyrochlore, cassiterite | CGM, pyrochlore |
| Wet chemistry (wt.%) | ||||
| SiO2 | 75.52 | 75.08 | 76.10 | 85.33 |
| TiO2 | <0.01 | <0.01 | 0.03 | 0.02 |
| Al2O3 | 14.81 | 12.75 | 12.10 | 7.33 |
| Fe2O3 | b.d. | 0.11 | b.d. | 0.09 |
| FeO | 2.69 | 1.89 | 1.57 | 1.67 |
| MnO | 0.11 | 0.065 | 0.04 | 0.18 |
| MgO | 0.17 | 0.08 | 0.12 | 0.24 |
| CaO | 0.1 | 0.11 | 0.23 | 0.20 |
| Na2O | 2.48 | 3.59 | 6.11 | 4.15 |
| K2O | 1.25 | 3.5 | 2.40 | 0.17 |
| Li2O | 2.27 | 0.55 | 0.138 | 0.005 |
| CO2 | 0.25 | 0.02 | <0.1 | <0.1 |
| F | 0.014 | 0.32 | 0.017 | 0.007 |
| Cl | 0.005 | 0.005 | 0.007 | 0.011 |
| P2O5 | 0.08 | 0.34 | 0.13 | 0.10 |
| ICP-MS (ppm) | ||||
| Li | 11,000 | 2200 | 800 | 29 |
| Be | 100 | 13 | 7 | 27 |
| Rb | 500 | 4300 | 600 | 11 |
| Nb | 49 | 50 | 80 | 23 |
| Sn | 30 | 31 | 4 | 1.8 |
| Cs | 30 | 2200 | 70 | 17 |
| Ta | 17 | 160 | 18 | 8.5 |
| W | 1.2 | 24 | 1.4 | 0.3 |
| Kolmozero | ||||||||||||||||||||
|---|---|---|---|---|---|---|---|---|---|---|---|---|---|---|---|---|---|---|---|---|
| Sample # | 6 | 7 | 8 | 9 | 10 | 11 | 12 | 13 | 14 | 19 | 20 | |||||||||
| MgO | 0.07 | 0.06 | 0.05 | 0.00 | 0.06 | b.d. | b.d. | b.d. | 0.07 | b.d. | b.d. | |||||||||
| Al2O3 | b.d. | b.d. | b.d. | b.d. | b.d. | 0.07 | b.d. | b.d. | b.d. | b.d. | b.d. | |||||||||
| SiO2 | 0.79 | 0.61 | 0.36 | 0.52 | 1.40 | 0.92 | 0.25 | 0.47 | 0.39 | 0.17 | 0.22 | |||||||||
| CaO | 0.06 | 0.05 | 0.05 | 0.05 | 0.14 | 0.05 | 0.19 | 0.09 | 0.04 | b.d. | b.d. | |||||||||
| TiO2 | 0.75 | 0.60 | 0.46 | 0.48 | 0.90 | 0.78 | 0.49 | 0.46 | 0.47 | 0.29 | 0.44 | |||||||||
| V2O5 | b.d. | b.d. | b.d. | b.d. | b.d. | b.d. | b.d. | b.d. | b.d. | 0.07 | 0.08 | |||||||||
| MnO | 7.44 | 7.79 | 8.66 | 8.45 | 2.78 | 8.18 | 8.54 | 11.20 | 7.98 | 11.11 | 11.08 | |||||||||
| FeO | 8.94 | 9.45 | 10.37 | 9.57 | 12.30 | 7.87 | 10.28 | 9.46 | 10.00 | 8.43 | 8.54 | |||||||||
| ZnO | 0.17 | 0.12 | 0.07 | 0.13 | 0.13 | 0.20 | b.d. | 0.11 | 0.13 | b.d. | b.d. | |||||||||
| ZrO2 | b.d. | b.d. | b.d. | b.d. | b.d. | b.d. | b.d. | b.d. | b.d. | b.d. | b.d. | |||||||||
| Nb2O5 | 16.68 | 26.22 | 42.85 | 34.02 | 11.85 | 13.89 | 56.78 | 40.56 | 41.87 | 54.20 | 52.83 | |||||||||
| SnO2 | b.d. | b.d. | b.d. | b.d. | 0.50 | 0.33 | b.d. | b.d. | b.d. | b.d. | b.d. | |||||||||
| Ta2O5 | 64.08 | 53.97 | 35.40 | 46.12 | 69.99 | 67.62 | 21.92 | 37.37 | 38.28 | 24.03 | 24.57 | |||||||||
| WO3 | 0.40 | 0.25 | 0.24 | 0.24 | 0.44 | 0.36 | b.d. | 0.27 | 0.43 | b.d. | 0.61 | |||||||||
| UO2 | b.d. | b.d. | b.d. | b.d. | b.d. | b.d. | b.d. | b.d. | b.d. | b.d. | b.d. | |||||||||
| Sc2O3 | ||||||||||||||||||||
| Total | 99.38 | 99.12 | 98.50 | 99.58 | 100.49 | 100.26 | 98.45 | 99.99 | 99.66 | 98.30 | 98.35 | |||||||||
| Zoning | p | p | p | p | r | h (porous) | o | o | o | h | h | |||||||||
| Formulae on basis of 6 oxygens | ||||||||||||||||||||
| Si | 0.059 | 0.044 | 0.024 | 0.036 | 0.106 | 0.070 | 0.015 | 0.031 | 0.026 | 0.011 | 0.014 | |||||||||
| Al | 0.000 | 0.000 | 0.000 | 0.000 | 0.000 | 0.006 | 0.000 | 0.000 | 0.000 | 0.000 | 0.000 | |||||||||
| Ti | 0.043 | 0.032 | 0.023 | 0.025 | 0.051 | 0.044 | 0.023 | 0.023 | 0.023 | 0.014 | 0.021 | |||||||||
| Fe2+ | 0.564 | 0.569 | 0.576 | 0.552 | 0.783 | 0.499 | 0.536 | 0.524 | 0.554 | 0.445 | 0.453 | |||||||||
| Mn | 0.476 | 0.475 | 0.488 | 0.493 | 0.179 | 0.526 | 0.451 | 0.628 | 0.448 | 0.595 | 0.595 | |||||||||
| Mg | 0.008 | 0.006 | 0.005 | 0.000 | 0.007 | 0.000 | 0.000 | 0.000 | 0.007 | 0.000 | 0.000 | |||||||||
| Zn | 0.010 | 0.006 | 0.004 | 0.007 | 0.007 | 0.011 | 0.000 | 0.005 | 0.006 | 0.000 | 0.000 | |||||||||
| Ca | 0.005 | 0.004 | 0.003 | 0.003 | 0.011 | 0.004 | 0.012 | 0.007 | 0.003 | 0.000 | 0.000 | |||||||||
| Nb | 0.569 | 0.853 | 1.288 | 1.060 | 0.408 | 0.477 | 1.599 | 1.214 | 1.254 | 1.548 | 1.514 | |||||||||
| Ta | 1.315 | 1.056 | 0.640 | 0.864 | 1.449 | 1.396 | 0.371 | 0.673 | 0.690 | 0.413 | 0.424 | |||||||||
| U | 0.000 | 0.000 | 0.000 | 0.000 | 0.000 | 0.000 | 0.000 | 0.000 | 0.000 | 0.000 | 0.000 | |||||||||
| Sn | 0.000 | 0.000 | 0.000 | 0.000 | 0.015 | 0.010 | 0.000 | 0.000 | 0.000 | 0.000 | 0.000 | |||||||||
| W | 0.008 | 0.005 | 0.004 | 0.004 | 0.009 | 0.007 | 0.000 | 0.005 | 0.007 | 0.000 | 0.010 | |||||||||
| V | 0.000 | 0.000 | 0.000 | 0.000 | 0.000 | 0.000 | 0.000 | 0.000 | 0.000 | 0.002 | 0.002 | |||||||||
| Sc | ||||||||||||||||||||
| Site A (Fe + Mn + Mg + Zn + Ca) | 1.062 | 1.060 | 1.075 | 1.055 | 1.002 | 1.051 | 0.999 | 1.163 | 1.018 | 1.040 | 1.048 | |||||||||
| Site B (Nb + Ta + Si + W + Sn + V + Ti) | 1.986 | 1.986 | 1.974 | 1.985 | 2.014 | 1.986 | 2.008 | 1.940 | 1.994 | 1.987 | 1.974 | |||||||||
| Ta/(Ta + Nb) | 0.698 | 0.553 | 0.332 | 0.449 | 0.780 | 0.745 | 0.188 | 0.357 | 0.355 | 0.211 | 0.219 | |||||||||
| Mn/(Mn + Fe) | 0.457 | 0.455 | 0.458 | 0.472 | 0.186 | 0.513 | 0.457 | 0.545 | 0.447 | 0.572 | 0.568 | |||||||||
| Sample # | Polmostundra | |||||||||||||||||||
| 3a | 3b | 7a | 7b | 7c | 9a | 9b | 10a | 10b | 10c | |||||||||||
| MgO | 0.11 | b.d. | 0.08 | b.d. | 0.10 | 0.15 | 0.11 | 0.09 | 0.13 | b.d. | ||||||||||
| Al2O3 | b.d. | b.d. | b.d. | b.d. | b.d. | b.d. | b.d. | b.d. | b.d. | b.d. | ||||||||||
| SiO2 | 0.18 | 0.10 | 0.69 | 0.51 | 0.17 | 0.10 | 0.17 | 0.65 | 0.39 | 0.08 | ||||||||||
| CaO | b.d. | b.d. | b.d. | b.d. | b.d. | b.d. | b.d. | b.d. | b.d. | b.d. | ||||||||||
| TiO2 | 0.41 | 1.01 | 0.77 | 0.41 | 0.76 | 0.78 | 0.57 | 1.07 | 0.63 | 0.88 | ||||||||||
| V2O5 | b.d. | b.d. | b.d. | b.d. | b.d. | b.d. | b.d. | 0.06 | b.d. | b.d. | ||||||||||
| MnO | 4.49 | 6.87 | 4.80 | 5.39 | 3.61 | 4.54 | 5.95 | 6.18 | 4.23 | 4.55 | ||||||||||
| FeO | 15.70 | 13.89 | 12.33 | 12.02 | 16.53 | 16.06 | 14.43 | 13.08 | 14.34 | 15.80 | ||||||||||
| ZnO | b.d. | b.d. | 0.16 | 0.11 | 0.11 | b.d. | b.d. | 0.13 | 0.10 | b.d. | ||||||||||
| ZrO2 | b.d. | b.d. | b.d. | b.d. | b.d. | b.d. | b.d. | b.d. | b.d. | b.d. | ||||||||||
| Nb2O5 | 61.84 | 67.68 | 38.57 | 42.83 | 60.60 | 68.52 | 62.35 | 36.04 | 47.08 | 68.73 | ||||||||||
| SnO2 | b.d. | b.d. | 0.45 | 0.31 | b.d. | b.d. | b.d. | 0.84 | 0.35 | b.d. | ||||||||||
| Ta2O5 | 14.90 | 8.90 | 39.75 | 36.11 | 16.76 | 8.22 | 14.55 | 39.17 | 30.12 | 8.13 | ||||||||||
| WO3 | 0.30 | 0.45 | 0.41 | 0.53 | 0.38 | 0.41 | 0.53 | 0.54 | 0.54 | 0.34 | ||||||||||
| UO2 | b.d. | b.d. | b.d. | b.d. | b.d. | b.d. | b.d. | b.d. | b.d. | b.d. | ||||||||||
| Sc2O3 | ||||||||||||||||||||
| Total | 97.92 | 98.89 | 98.01 | 98.23 | 99.03 | 98.77 | 98.66 | 97.86 | 97.90 | 98.52 | ||||||||||
| Zoning | h | h (reverse) | p | p | p | m | o | r | h | m | ||||||||||
| Formulae on basis of 6 oxygens | ||||||||||||||||||||
| Si | 0.011 | 0.006 | 0.047 | 0.034 | 0.011 | 0.006 | 0.010 | 0.044 | 0.025 | 0.005 | ||||||||||
| Al | 0.000 | 0.000 | 0.000 | 0.000 | 0.000 | 0.000 | 0.000 | 0.000 | 0.000 | 0.000 | ||||||||||
| Ti | 0.019 | 0.044 | 0.039 | 0.021 | 0.035 | 0.034 | 0.026 | 0.055 | 0.031 | 0.039 | ||||||||||
| Fe2+ | 0.801 | 0.683 | 0.700 | 0.670 | 0.840 | 0.788 | 0.730 | 0.747 | 0.783 | 0.777 | ||||||||||
| Mn | 0.232 | 0.342 | 0.276 | 0.305 | 0.186 | 0.226 | 0.305 | 0.357 | 0.234 | 0.227 | ||||||||||
| Mg | 0.010 | 0.000 | 0.008 | 0.000 | 0.009 | 0.013 | 0.010 | 0.009 | 0.012 | 0.000 | ||||||||||
| Zn | 0.000 | 0.000 | 0.008 | 0.005 | 0.005 | 0.000 | 0.000 | 0.007 | 0.005 | 0.000 | ||||||||||
| Ca | 0.000 | 0.000 | 0.000 | 0.000 | 0.000 | 0.000 | 0.000 | 0.000 | 0.000 | 0.000 | ||||||||||
| Nb | 1.706 | 1.799 | 1.183 | 1.291 | 1.664 | 1.818 | 1.704 | 1.113 | 1.389 | 1.827 | ||||||||||
| Ta | 0.247 | 0.142 | 0.733 | 0.655 | 0.277 | 0.131 | 0.239 | 0.727 | 0.535 | 0.130 | ||||||||||
| U | 0.000 | 0.000 | 0.000 | 0.000 | 0.000 | 0.000 | 0.000 | 0.000 | 0.000 | 0.000 | ||||||||||
| Sn | 0.000 | 0.000 | 0.012 | 0.008 | 0.000 | 0.000 | 0.000 | 0.023 | 0.009 | 0.000 | ||||||||||
| W | 0.005 | 0.007 | 0.007 | 0.009 | 0.006 | 0.006 | 0.008 | 0.010 | 0.009 | 0.005 | ||||||||||
| V | 0.000 | 0.000 | 0.000 | 0.000 | 0.000 | 0.000 | 0.000 | 0.001 | 0.000 | 0.000 | ||||||||||
| Sc | 0.000 | 0.000 | 0.000 | 0.000 | 0.000 | 0.000 | 0.000 | 0.000 | 0.000 | 0.000 | ||||||||||
| Site A (Fe + Mn + Mg + Zn + Ca) | 1.043 | 1.025 | 0.992 | 0.980 | 1.040 | 1.027 | 1.044 | 1.120 | 1.034 | 1.004 | ||||||||||
| Site B (Nb + Ta + Si + W + Sn + V + Ti) | 1.983 | 1.992 | 2.014 | 2.009 | 1.986 | 1.990 | 1.980 | 1.963 | 1.989 | 2.001 | ||||||||||
| Ta/(Ta + Nb) | 0.127 | 0.073 | 0.383 | 0.337 | 0.143 | 0.067 | 0.123 | 0.395 | 0.278 | 0.066 | ||||||||||
| Mn/(Mn + Fe) | 0.225 | 0.334 | 0.283 | 0.312 | 0.181 | 0.223 | 0.294 | 0.324 | 0.230 | 0.226 | ||||||||||
| Sample # | Okhmylk | |||||||||||||||||||
| 3 | 4 | 5 | 6 | 7 | 13 | 14 | 15 | 18 | 19 | |||||||||||
| MgO | b.d. | b.d. | b.d. | b.d. | b.d. | b.d. | b.d. | b.d. | b.d. | b.d. | ||||||||||
| Al2O3 | 0.04 | b.d. | b.d. | b.d. | 0.07 | b.d. | b.d. | b.d. | b.d. | b.d. | ||||||||||
| SiO2 | 0.26 | 0.16 | 0.10 | 0.13 | 0.14 | 0.23 | b.d. | 0.17 | 0.17 | 0.33 | ||||||||||
| CaO | b.d. | 0.06 | b.d. | b.d. | b.d. | b.d. | b.d. | b.d. | b.d. | b.d. | ||||||||||
| TiO2 | 0.09 | 0.35 | 0.56 | 0.52 | 0.58 | 0.10 | 0.22 | 0.09 | 0.12 | 0.15 | ||||||||||
| V2O5 | b.d. | b.d. | b.d. | b.d. | b.d. | b.d. | b.d. | b.d. | b.d. | b.d. | ||||||||||
| MnO | 15.47 | 16.14 | 12.98 | 7.85 | 10.77 | 16.06 | 17.65 | 17.52 | 15.59 | 14.56 | ||||||||||
| FeO | 3.92 | 3.47 | 8.00 | 12.83 | 8.30 | 3.17 | 1.85 | 1.53 | 3.96 | 4.26 | ||||||||||
| ZnO | b.d. | 0.02 | b.d. | b.d. | b.d. | b.d. | b.d. | b.d. | b.d. | b.d. | ||||||||||
| ZrO2 | b.d. | b.d. | b.d. | b.d. | b.d. | b.d. | b.d. | b.d. | b.d. | b.d. | ||||||||||
| Nb2O5 | 54.44 | 62.17 | 66.94 | 61.59 | 67.03 | 53.70 | 56.61 | 64.37 | 54.26 | 51.93 | ||||||||||
| SnO2 | b.d. | b.d. | b.d. | b.d. | b.d. | b.d. | b.d. | b.d. | b.d. | b.d. | ||||||||||
| Ta2O5 | 23.31 | 16.13 | 10.77 | 14.41 | 12.53 | 25.05 | 20.87 | 16.77 | 22.70 | 26.91 | ||||||||||
| WO3 | 0.47 | 0.84 | 0.73 | 1.15 | 0.86 | 0.36 | 0.50 | 0.38 | 0.42 | 0.43 | ||||||||||
| UO2 | 0.15 | b.d. | b.d. | b.d. | b.d. | n.a. | n.a. | n.a. | n.a. | n.a. | ||||||||||
| Sc2O3 | b.d. | 0.15 | 0.16 | 0.18 | 0.23 | 0.11 | 0.14 | 0.08 | 0.10 | 0.14 | ||||||||||
| Total | 98.14 | 99.49 | 100.24 | 98.66 | 100.51 | 98.77 | 97.84 | 100.92 | 97.32 | 98.71 | ||||||||||
| Zoning | p (rim) | p (interm) | p (core) | r | ce | p | p | p | p (core) | p (rim) | ||||||||||
| Formulae on basis of 6 oxygens | ||||||||||||||||||||
| Si | 0.016 | 0.010 | 0.006 | 0.008 | 0.008 | 0.014 | 0.000 | 0.010 | 0.011 | 0.021 | ||||||||||
| Al | 0.003 | 0.000 | 0.000 | 0.000 | 0.005 | 0.000 | 0.000 | 0.000 | 0.000 | 0.000 | ||||||||||
| Ti | 0.004 | 0.016 | 0.025 | 0.024 | 0.026 | 0.005 | 0.010 | 0.004 | 0.005 | 0.007 | ||||||||||
| Fe2+ | 0.205 | 0.175 | 0.389 | 0.644 | 0.411 | 0.167 | 0.097 | 0.077 | 0.209 | 0.226 | ||||||||||
| Mn | 0.821 | 0.824 | 0.639 | 0.399 | 0.540 | 0.855 | 0.933 | 0.888 | 0.833 | 0.783 | ||||||||||
| Mg | 0.000 | 0.000 | 0.000 | 0.000 | 0.000 | 0.000 | 0.000 | 0.000 | 0.000 | 0.000 | ||||||||||
| Zn | 0.000 | 0.000 | 0.000 | 0.000 | 0.000 | 0.000 | 0.000 | 0.000 | 0.000 | 0.000 | ||||||||||
| Ca | 0.000 | 0.004 | 0.000 | 0.000 | 0.000 | 0.000 | 0.000 | 0.000 | 0.000 | 0.000 | ||||||||||
| Nb | 1.543 | 1.694 | 1.760 | 1.672 | 1.795 | 1.526 | 1.597 | 1.742 | 1.547 | 1.491 | ||||||||||
| Ta | 0.397 | 0.264 | 0.170 | 0.235 | 0.202 | 0.428 | 0.354 | 0.273 | 0.389 | 0.465 | ||||||||||
| U | 0.002 | 0.000 | 0.000 | 0.000 | 0.000 | 0.000 | 0.000 | 0.000 | 0.000 | 0.000 | ||||||||||
| Sn | 0.000 | 0.000 | 0.000 | 0.000 | 0.000 | 0.000 | 0.000 | 0.000 | 0.000 | 0.000 | ||||||||||
| W | 0.008 | 0.013 | 0.011 | 0.018 | 0.013 | 0.006 | 0.008 | 0.006 | 0.007 | 0.007 | ||||||||||
| V | 0.000 | 0.000 | 0.000 | 0.000 | 0.000 | 0.000 | 0.000 | 0.000 | 0.000 | 0.000 | ||||||||||
| Sc | 0.000 | 0.004 | 0.004 | 0.005 | 0.006 | 0.003 | 0.004 | 0.002 | 0.003 | 0.004 | ||||||||||
| Site A (Fe + Mn + Mg + Zn + Ca) | 1.027 | 1.003 | 1.028 | 1.043 | 0.952 | 1.022 | 1.030 | 0.965 | 1.041 | 1.009 | ||||||||||
| Site B (Nb + Ta + Si + W + Sn + V + Ti) | 1.961 | 1.984 | 1.961 | 1.939 | 2.031 | 1.973 | 1.962 | 2.029 | 1.952 | 1.984 | ||||||||||
| Ta/(Ta + Nb) | 0.205 | 0.135 | 0.088 | 0.123 | 0.101 | 0.219 | 0.182 | 0.135 | 0.201 | 0.238 | ||||||||||
| Mn/(Mn + Fe) | 0.800 | 0.825 | 0.622 | 0.383 | 0.568 | 0.837 | 0.906 | 0.921 | 0.800 | 0.776 | ||||||||||
| Sample # | Shongui | |||||||||||||||||||
| 3-1 | 3-2 | 6-1 | 6-2 | 7-1 | 7-2 | 10-1 | 10-2 | |||||||||||||
| MgO | 0.07 | b.d. | b.d. | b.d. | b.d. | b.d. | 0.10 | b.d. | ||||||||||||
| Al2O3 | b.d. | b.d. | b.d. | b.d. | 1.72 | b.d. | b.d. | b.d. | ||||||||||||
| SiO2 | b.d. | b.d. | 0.10 | 0.09 | 0.30 | 0.13 | 0.22 | 0.12 | ||||||||||||
| CaO | b.d. | b.d. | b.d. | b.d. | b.d. | b.d. | b.d. | b.d. | ||||||||||||
| TiO2 | 2.12 | 1.05 | 0.50 | 0.60 | 0.61 | 0.60 | 1.50 | 1.69 | ||||||||||||
| V2O5 | b.d. | b.d. | b.d. | b.d. | b.d. | b.d. | b.d. | b.d. | ||||||||||||
| MnO | 6.13 | 6.67 | 8.06 | 7.91 | 10.20 | 7.29 | 6.39 | 8.82 | ||||||||||||
| FeO | 13.83 | 12.98 | 12.34 | 12.84 | 9.29 | 12.87 | 13.27 | 11.21 | ||||||||||||
| ZnO | 0.04 | b.d. | b.d. | b.d. | b.d. | b.d. | b.d. | b.d. | ||||||||||||
| ZrO2 | b.d. | b.d. | b.d. | b.d. | b.d. | b.d. | b.d. | b.d. | ||||||||||||
| Nb2O5 | 67.42 | 62.36 | 62.45 | 60.75 | 51.71 | 60.63 | 54.88 | 58.08 | ||||||||||||
| SnO2 | 0.20 | b.d. | b.d. | b.d. | b.d. | b.d. | b.d. | b.d. | ||||||||||||
| Ta2O5 | 8.04 | 15.53 | 15.04 | 16.21 | 24.96 | 16.84 | 22.49 | 17.64 | ||||||||||||
| WO3 | 0.30 | b.d. | b.d. | b.d. | b.d. | b.d. | b.d. | b.d. | ||||||||||||
| UO2 | b.d. | b.d. | b.d. | b.d. | b.d. | b.d. | b.d. | b.d. | ||||||||||||
| Sc2O3 | 0.40 | 0.20 | b.d. | b.d. | b.d. | b.d. | 0.25 | 0.36 | ||||||||||||
| Total | 98.55 | 98.79 | 98.48 | 98.39 | 98.80 | 98.35 | 99.08 | 97.93 | ||||||||||||
| Zoning | c | r | h | h | r | h | o | o | ||||||||||||
| Formulae on basis of 6 oxygens | ||||||||||||||||||||
| Si | 0.000 | 0.000 | 0.006 | 0.005 | 0.018 | 0.008 | 0.013 | 0.007 | ||||||||||||
| Al | 0.000 | 0.000 | 0.000 | 0.000 | 0.123 | 0.000 | 0.000 | 0.000 | ||||||||||||
| Ti | 0.093 | 0.048 | 0.023 | 0.027 | 0.028 | 0.027 | 0.069 | 0.077 | ||||||||||||
| Fe2+ | 0.676 | 0.655 | 0.620 | 0.646 | 0.472 | 0.652 | 0.680 | 0.571 | ||||||||||||
| Mn | 0.303 | 0.341 | 0.410 | 0.403 | 0.525 | 0.374 | 0.332 | 0.455 | ||||||||||||
| Mg | 0.006 | 0.000 | 0.000 | 0.000 | 0.000 | 0.000 | 0.009 | 0.000 | ||||||||||||
| Zn | 0.002 | 0.000 | 0.000 | 0.000 | 0.000 | 0.000 | 0.000 | 0.000 | ||||||||||||
| Ca | 0.000 | 0.000 | 0.000 | 0.000 | 0.000 | 0.000 | 0.000 | 0.000 | ||||||||||||
| Nb | 1.782 | 1.701 | 1.696 | 1.653 | 1.421 | 1.661 | 1.522 | 1.598 | ||||||||||||
| Ta | 0.128 | 0.255 | 0.246 | 0.265 | 0.413 | 0.278 | 0.375 | 0.292 | ||||||||||||
| U | 0.000 | 0.000 | 0.000 | 0.000 | 0.000 | 0.000 | 0.000 | 0.000 | ||||||||||||
| Sn | 0.005 | 0.000 | 0.000 | 0.000 | 0.000 | 0.000 | 0.000 | 0.000 | ||||||||||||
| W | 0.005 | 0.000 | 0.000 | 0.000 | 0.000 | 0.000 | 0.000 | 0.000 | ||||||||||||
| V | 0.000 | 0.000 | 0.000 | 0.000 | 0.000 | 0.000 | 0.000 | 0.000 | ||||||||||||
| Sc | 0.010 | 0.005 | 0.000 | 0.000 | 0.000 | 0.000 | 0.007 | 0.010 | ||||||||||||
| Site A (Fe + Mn + Mg + Zn + Ca) | 0.988 | 0.996 | 1.030 | 1.049 | 0.997 | 1.026 | 1.021 | 1.025 | ||||||||||||
| Site B (Nb + Ta + Si + W + Sn + V + Ti) | 2.008 | 2.004 | 1.970 | 1.951 | 1.879 | 1.974 | 1.979 | 1.975 | ||||||||||||
| Ta/(Ta + Nb) | 0.067 | 0.130 | 0.127 | 0.138 | 0.225 | 0.143 | 0.198 | 0.154 | ||||||||||||
| Mn/(Mn + Fe) | 0.310 | 0.342 | 0.398 | 0.384 | 0.526 | 0.364 | 0.328 | 0.443 | ||||||||||||
| Sample # | Polmostundra | |||||||||
|---|---|---|---|---|---|---|---|---|---|---|
| Pcl 1 | Pcl 2 | Pcl 3 | Pcl 4 | Pcl 5 | Pcl 6 | Pcl 7 | Pcl 8 | 3-4 | 3-5 | |
| Na2O | 4.77 | 5.18 | 5.26 | 5.43 | 4.71 | 5.22 | 4.57 | 5.20 | 3.04 | 2.57 |
| MgO | b.d. | b.d. | b.d. | b.d. | 0.06 | b.d. | b.d. | b.d. | n.a. | n.a. |
| Al2O3 | b.d. | b.d. | 0.04 | 0.03 | b.d. | b.d. | b.d. | b.d. | b.d. | b.d. |
| SiO2 | n.a. | n.a. | n.a. | n.a. | n.a. | n.a. | n.a. | n.a. | n.a. | n.a. |
| K2O | b.d. | b.d. | b.d. | b.d. | b.d. | b.d. | b.d. | b.d. | 0.25 | |
| CaO | 7.73 | 6.17 | 7.78 | 7.52 | 6.98 | 8.28 | 8.63 | 7.09 | 4.47 | 1.95 |
| TiO2 | b.d. | b.d. | b.d. | b.d. | b.d. | b.d. | b.d. | b.d. | n.a. | n.a. |
| MnO | b.d. | b.d. | 0.11 | b.d. | 0.22 | b.d. | 0.14 | 0.17 | n.a. | 0.18 |
| FeO | b.d. | b.d. | b.d. | b.d. | b.d. | b.d. | b.d. | b.d. | n.a. | n.a. |
| As2O3 | n.a. | n.a. | n.a. | n.a. | n.a. | n.a. | n.a. | n.a. | n.a. | n.a. |
| SrO | 2.78 | 1.76 | 1.09 | 1.36 | 0.88 | 1.15 | 1.29 | 2.01 | n.a. | n.a. |
| Y2O3 | n.a. | n.a. | n.a. | n.a. | n.a. | n.a. | n.a. | n.a. | 3.04 | n.a. |
| Nb2O5 | 1.97 | 2.18 | 1.26 | 2.52 | 2.27 | 2.00 | 2.63 | 2.36 | 2.11 | 2.22 |
| SnO2 | b.d. | 0.28 | 0.30 | 0.81 | 1.13 | 0.34 | 0.66 | 0.55 | n.a. | n.a. |
| Ta2O5 | 78.53 | 75.79 | 76.72 | 72.12 | 70.30 | 78.07 | 72.37 | 73.19 | 71.80 | 76.68 |
| WO3 | 0.70 | 1.20 | 0.68 | 1.03 | 0.96 | 0.96 | 1.11 | 1.02 | 8.80 | 6.51 |
| PbO | b.d. | 1.07 | 1.54 | 1.60 | 2.81 | 0.58 | 1.45 | 2.04 | 2.83 | 3.95 |
| ThO2 | 0.60 | b.d. | b.d. | b.d. | b.d. | b.d. | 0.31 | b.d. | 0.01 | b.d. |
| UO2 | b.d. | 2.55 | 2.25 | 5.80 | 7.24 | 1.02 | 3.51 | 4.58 | 4.84 | 3.37 |
| F | 2.36 | 1.59 | 1.94 | 1.73 | 1.22 | 2.28 | 1.93 | 2.09 | b.d. | |
| Total | 99.44 | 97.76 | 98.95 | 99.93 | 98.76 | 99.90 | 98.59 | 100.29 | 100.94 | 97.68 |
| O=F | 0.99 | 0.67 | 0.82 | 0.73 | 0.51 | 0.96 | 0.81 | 0.88 | n.a. | n.a. |
| H2Ocalc | 0.56 | 0.90 | 0.71 | 0.78 | 0.98 | 0.61 | 0.69 | 0.62 | 1.71 | 1.77 |
| Total | 99.00 | 97.99 | 98.85 | 99.99 | 99.23 | 99.54 | 98.47 | 100.03 | 102.65 | 99.45 |
| Formulae on basis of B = 2 cations | ||||||||||
| Na | 0.825 | 0.913 | 0.937 | 0.986 | 0.876 | 0.899 | 0.828 | 0.940 | 0.518 | 0.423 |
| K | 0.000 | 0.000 | 0.000 | 0.000 | 0.000 | 0.000 | 0.000 | 0.000 | 0.014 | |
| Ca | 0.738 | 0.600 | 0.766 | 0.754 | 0.718 | 0.788 | 0.863 | 0.708 | 0.421 | 0.177 |
| Mn | 0.000 | 0.000 | 0.008 | 0.000 | 0.018 | 0.000 | 0.011 | 0.013 | 0.013 | |
| Fe | ||||||||||
| Sr | 0.144 | 0.093 | 0.058 | 0.074 | 0.049 | 0.059 | 0.070 | 0.108 | ||
| As | ||||||||||
| Y | 0.31 | |||||||||
| Pb | 0.000 | 0.026 | 0.038 | 0.040 | 0.073 | 0.014 | 0.036 | 0.051 | 0.067 | 0.090 |
| Th | 0.012 | 0.000 | 0.000 | 0.000 | 0.000 | 0.000 | 0.007 | 0.000 | ||
| U | 0.000 | 0.051 | 0.046 | 0.121 | 0.155 | 0.020 | 0.073 | 0.095 | 0.095 | 0.064 |
| ∑A | 1.719 | 1.683 | 1.854 | 1.975 | 1.896 | 1.781 | 1.888 | 1.916 | 1.101 | 0.781 |
| Mg | 0.000 | 0.000 | 0.000 | 0.000 | 0.008 | 0.000 | 0.000 | 0.000 | ||
| Al | 0.000 | 0.000 | 0.004 | 0.003 | 0.000 | 0.000 | 0.000 | 0.000 | ||
| Si | ||||||||||
| Ti | 0.000 | 0.000 | 0.000 | 0.000 | 0.000 | 0.000 | 0.000 | 0.000 | ||
| Nb | 0.079 | 0.089 | 0.052 | 0.107 | 0.098 | 0.080 | 0.111 | 0.099 | 0.084 | 0.085 |
| Sn | 0.000 | 0.010 | 0.011 | 0.030 | 0.043 | 0.012 | 0.025 | 0.021 | ||
| Ta | 1.904 | 1.872 | 1.917 | 1.835 | 1.835 | 1.886 | 1.838 | 1.855 | 1.716 | 1.771 |
| W | 0.016 | 0.028 | 0.016 | 0.025 | 0.024 | 0.022 | 0.027 | 0.025 | 0.2 | 0.143 |
| ∑B | 2.000 | 2.000 | 2.000 | 2.000 | 2.000 | 2.000 | 2.000 | 2.000 | 2.000 | 1.999 |
| F | 0.666 | 0.457 | 0.564 | 0.512 | 0.370 | 0.641 | 0.570 | 0.616 | 0.000 | 0.000 |
| OH | 0.334 | 0.543 | 0.436 | 0.488 | 0.630 | 0.359 | 0.430 | 0.384 | 1.000 | 1.000 |
| Vacancy | 0.281 | 0.317 | 0.146 | 0.025 | 0.104 | 0.219 | 0.112 | 0.084 | 0.899 | 1.219 |
| Sample # | Okhmylk | Shongui | ||||||||
| 10 | 12 | 10a | 13 | 14 | 12a | 15 | 16 | 1 | 2 | |
| Na2O | n.a. | n.a. | n.a. | n.a. | n.a. | n.a. | n.a. | n.a. | 0.62 | 1.55 |
| MgO | b.d. | b.d. | b.d. | b.d. | b.d. | b.d. | b.d. | b.d. | 0.08 | 0.10 |
| Al2O3 | b.d. | b.d. | b.d. | b.d. | 0.03 | b.d. | b.d. | b.d. | 0.17 | 0.03 |
| SiO2 | 0.09 | b.d. | 0.13 | 0.16 | b.d. | b.d. | b.d. | b.d. | 5.81 | 6.41 |
| K2O | n.a. | n.a. | n.a. | n.a. | n.a. | n.a. | n.a. | n.a. | n.a. | n.a. |
| CaO | 15.76 | 15.43 | 14.88 | 15.99 | 15.74 | 15.38 | 15.63 | 15.12 | 16.18 | 15.76 |
| TiO2 | 0.20 | 0.20 | 0.24 | 0.22 | 0.20 | 0.26 | 0.15 | 0.23 | 4.25 | 2.64 |
| MnO | 0.35 | 6.28 | 0.67 | 0.37 | 0.31 | 0.78 | 0.58 | 0.65 | 0.60 | 0.44 |
| FeO | b.d. | b.d. | 0.15 | b.d. | b.d. | 0.22 | 0.28 | 0.25 | 1.33 | 0.68 |
| As2O3 | n.a. | n.a. | n.a. | n.a. | n.a. | n.a. | n.a. | n.a. | 3.75 | 1.98 |
| SrO | n.a. | n.a. | n.a. | n.a. | n.a. | n.a. | n.a. | n.a. | n.a. | n.a. |
| Y2O3 | n.a. | n.a. | 0.40 | 0.44 | 0.44 | 0.28 | 0.37 | 0.32 | n.a. | n.a. |
| Nb2O5 | 66.90 | 61.54 | 64.58 | 67.09 | 65.74 | 62.21 | 64.52 | 63.18 | 16.27 | 12.02 |
| SnO2 | b.d. | b.d. | n.a. | n.a. | n.a. | n.a. | n.a. | n.a. | 0.93 | 1.73 |
| Ta2O5 | 13.42 | 13.75 | 14.36 | 13.89 | 14.69 | 14.62 | 13.86 | 14.12 | 40.54 | 50.67 |
| WO3 | b.d. | b.d. | b.d. | b.d. | b.d. | b.d. | b.d. | b.d. | n.a. | n.a. |
| PbO | n.a. | n.a. | n.a. | n.a. | n.a. | n.a. | n.a. | n.a. | n.a. | n.a. |
| ThO2 | n.a. | n.a. | n.a. | n.a. | n.a. | n.a. | n.a. | n.a. | n.a. | n.a. |
| UO2 | n.a. | n.a. | b.d. | b.d. | b.d. | b.d. | b.d. | b.d. | 0.43 | 0.59 |
| F | b.d. | b.d. | b.d. | b.d. | b.d. | b.d. | b.d. | b.d. | b.d. | b.d. |
| Total | 96.72 | 97.20 | 95.41 | 98.16 | 97.13 | 93.75 | 95.39 | 93.88 | 90.96 | 94.60 |
| O=F | ||||||||||
| H2Ocalc | 2.56 | 2.34 | 2.50 | 2.58 | 2.54 | 2.42 | 2.48 | 2.44 | 2.62 | 2.31 |
| Total | 99.28 | 99.53 | 97.91 | 100.74 | 99.67 | 96.17 | 97.87 | 96.32 | 93.58 | 96.91 |
| Formulae on basis of B = 2 cations | ||||||||||
| Na | 0.08 | 0.20 | ||||||||
| K | ||||||||||
| Ca | 0.989 | 1.043 | 0.955 | 0.995 | 0.995 | 1.021 | 1.014 | 0.995 | 1.149 | 1.096 |
| Mn | 0.018 | 0.335 | 0.034 | 0.018 | 0.015 | 0.041 | 0.030 | 0.034 | 0.034 | 0.024 |
| Fe | 0.000 | 0.000 | 0.007 | 0.000 | 0.000 | 0.011 | 0.014 | 0.013 | 0.074 | 0.037 |
| Sr | ||||||||||
| As | 0.151 | 0.078 | ||||||||
| Y | 0.013 | 0.014 | 0.014 | 0.009 | 0.012 | 0.010 | ||||
| Pb | 0.000 | 0.000 | ||||||||
| Th | ||||||||||
| U | 0.000 | 0.000 | 0.000 | 0.000 | 0.000 | 0.000 | 0.000 | 0.006 | 0.009 | |
| ∑A | 1.007 | 1.378 | 1.009 | 1.027 | 1.024 | 1.082 | 1.070 | 1.052 | 1.494 | 1.439 |
| Mg | 0.000 | 0.000 | 0.000 | 0.000 | 0.000 | 0.000 | 0.000 | 0.000 | 0.008 | 0.010 |
| Al | 0.000 | 0.000 | 0.000 | 0.000 | 0.002 | 0.000 | 0.000 | 0.000 | 0.013 | 0.002 |
| Si | 0.005 | 0.000 | 0.008 | 0.009 | 0.000 | 0.000 | 0.000 | 0.000 | 0.525 | 0.567 |
| Ti | 0.009 | 0.009 | 0.011 | 0.010 | 0.009 | 0.012 | 0.007 | 0.011 | 0.212 | 0.129 |
| Nb | 1.772 | 1.755 | 1.748 | 1.762 | 1.754 | 1.742 | 1.765 | 1.754 | 0.487 | 0.353 |
| Sn | 0.000 | 0.000 | 0.025 | 0.045 | ||||||
| Ta | 0.214 | 0.236 | 0.234 | 0.219 | 0.236 | 0.246 | 0.228 | 0.236 | 0.730 | 0.894 |
| W | 0.000 | 0.000 | 0.000 | 0.000 | 0.000 | 0.000 | 0.000 | 0.000 | ||
| ∑B | 2.000 | 2.000 | 2.001 | 2.000 | 2.001 | 2.000 | 2.000 | 2.001 | 2.000 | 2.000 |
| F | 0.000 | 0.000 | 0.000 | 0.000 | 0.000 | 0.000 | 0.000 | 0.000 | 0.000 | 0.000 |
| OH | 1.000 | 1.000 | 1.000 | 1.000 | 1.000 | 1.000 | 1.000 | 1.000 | 1.000 | 1.000 |
| Vacancy | 0.993 | 0.622 | 0.991 | 0.973 | 0.976 | 0.918 | 0.930 | 0.948 | 0.506 | 0.561 |
| Sample # | 2 | 3 | 4 | 5 | 6 | 7 | 8 | 9 | 10 |
|---|---|---|---|---|---|---|---|---|---|
| MgO | b.d. | b.d. | b.d. | b.d. | b.d. | b.d. | b.d. | b.d. | b.d. |
| Al2O3 | 0.09 | 0.07 | 0.13 | 0.09 | b.d. | b.d. | b.d. | b.d. | 0.09 |
| SiO2 | 0.27 | 0.26 | 0.28 | 0.27 | 0.18 | 0.29 | 0.26 | 0.31 | 0.29 |
| TiO2 | b.d. | b.d. | b.d. | b.d. | b.d. | b.d. | b.d. | b.d. | b.d. |
| MnO | b.d. | b.d. | b.d. | b.d. | b.d. | b.d. | b.d. | b.d. | b.d. |
| FeO | 0.20 | 0.59 | 0.26 | 0.15 | b.d. | b.d. | b.d. | 0.22 | b.d. |
| ZrO2 | b.d. | b.d. | b.d. | b.d. | b.d. | b.d. | b.d. | b.d. | b.d. |
| Nb2O5 | b.d. | 0.65 | b.d. | 0.40 | 0.37 | b.d. | 0.12 | 0.26 | b.d. |
| SnO2 | 98.68 | 94.21 | 97.78 | 98.52 | 98.89 | 99.61 | 99.62 | 98.03 | 98.46 |
| Ta2O5 | 0.52 | 3.93 | 1.53 | 0.68 | 0.73 | b.d. | 0.55 | 0.83 | 0.50 |
| WO3 | b.d. | b.d. | b.d. | b.d. | b.d. | b.d. | b.d. | b.d. | b.d. |
| Total | 99.76 | 99.71 | 99.97 | 100.11 | 100.17 | 99.89 | 100.54 | 99.65 | 99.33 |
| Deposit/Occurrence | Kolmozero | Polmostundra | Okhmylk | Shongui |
|---|---|---|---|---|
| Sample N | KL-GX-11 | POL-GX-3/5 | OKH-2/2 | SH-7 |
| Mineralization signature | Li (±Nb, Ta) | Li-Cs (±Nb, Ta) | Li (±Nb, Ta) | Be (±Nb, Ta) |
| Ore grade (based on Li content) | High | Medium to low | Low to barren | Low to barren |
| CGM | columbite-(Fe) | columbite-(Fe) | columbite-(Fe) | columbite-(Fe) |
| columbite-(Mn) | columbite-(Mn) | columbite-(Mn) | ||
| tantalite-(Fe) | ||||
| tantalite-(Mn) | ||||
| Texture/zoning/pattern (in descending order) | oscillatory | homogeneous | irregular normal | progressive normal |
| homogeneous | mottled | patchy | oscillatory | |
| patchy | oscillatory | homogeneous | homogeneous | |
| sponge domains | patchy | irregular reverse | ||
| overgrowing Ta-rich rims | irregular reverse | overgrowing Ta-rich rims | ||
| Overall composition features: | ||||
| Ta/(Ta + Nb) | 0.16–0.70 | 0.05–0.39 | 0.09–0.24 | 0.07–0.23 |
| Mn/(Mn + Fe) | 0.45–0.63 | 0.12–0.33 | 0.29–0.92 | 0.31–0.55 |
| Ti (apfu) | 0.01–0.05 | 0.01–0.05 | 0–0.025 | 0.02–0.09 |
| W (apfu) | 0.002–0.012 | 0.0–0.009 | 0.003–0.018 | 0.0 |
| PSGM | calciopyrochlore (included in columbite-(Fe)) | fluoronatromicrolite (abundant individual grains of hydrothermal origin) | hydroxycalciopyrochlore (replaced columbite-(Mn)) | hydroxycalciomicrolite (included in columbite-(Fe)) |
| Cassiterite | No (0–0.5 wt.% of SnO2 in CGM) | No (0–0.84 wt.% of SnO2 in CGM) | abundant porous grains of hydrothermal origin (0.0 wt.% of SnO2 in CGM) | No (0–0.2 wt.% of SnO2 in CGM) |
| Main evolution trends for Nb-Ta-Sn oxides: | Calciopyrochlore → columbite-(Fe) → columbite-(Mn); columbite-(Fe) → tantalite-(Fe)/tantalite-(Mn). | Columbite-(Fe) → columbite-(Fe) with higher Ta/(Ta + Nb) → fluornatromicrolite → hydroxynatromicrolite with high Ta, U and Pb content. | Columbite-(Fe)/columbite-(Mn) → hydroxycalciopyrochlore → cassiterite. | Hydroxycalciomicrolite → columbite-(Fe) → columbite-(Fe) with higher Ta/(Ta + Nb). |
Disclaimer/Publisher’s Note: The statements, opinions and data contained in all publications are solely those of the individual author(s) and contributor(s) and not of MDPI and/or the editor(s). MDPI and/or the editor(s) disclaim responsibility for any injury to people or property resulting from any ideas, methods, instructions or products referred to in the content. |
© 2023 by the authors. Licensee MDPI, Basel, Switzerland. This article is an open access article distributed under the terms and conditions of the Creative Commons Attribution (CC BY) license (https://creativecommons.org/licenses/by/4.0/).
Share and Cite
Zozulya, D.; Morozova, L.N.; Kullerud, K.; Bazai, A. Nb-Ta-Sn Oxides from Lithium-Beryllium-Tantalum Pegmatite Deposits of the Kolmozero–Voronja Belt, NW Russia: Implications for Tracing Ore-Forming Processes and Mineralization Signatures. Geosciences 2024, 14, 9. https://doi.org/10.3390/geosciences14010009
Zozulya D, Morozova LN, Kullerud K, Bazai A. Nb-Ta-Sn Oxides from Lithium-Beryllium-Tantalum Pegmatite Deposits of the Kolmozero–Voronja Belt, NW Russia: Implications for Tracing Ore-Forming Processes and Mineralization Signatures. Geosciences. 2024; 14(1):9. https://doi.org/10.3390/geosciences14010009
Chicago/Turabian StyleZozulya, Dmitry, Lyudmila N. Morozova, Kåre Kullerud, and Ayya Bazai. 2024. "Nb-Ta-Sn Oxides from Lithium-Beryllium-Tantalum Pegmatite Deposits of the Kolmozero–Voronja Belt, NW Russia: Implications for Tracing Ore-Forming Processes and Mineralization Signatures" Geosciences 14, no. 1: 9. https://doi.org/10.3390/geosciences14010009
APA StyleZozulya, D., Morozova, L. N., Kullerud, K., & Bazai, A. (2024). Nb-Ta-Sn Oxides from Lithium-Beryllium-Tantalum Pegmatite Deposits of the Kolmozero–Voronja Belt, NW Russia: Implications for Tracing Ore-Forming Processes and Mineralization Signatures. Geosciences, 14(1), 9. https://doi.org/10.3390/geosciences14010009