1. Introduction
The utilization of shockwaves as a fracturing technique in geosciences is a sophisticated and environmentally friendly approach to subsurface exploration, drilling, and well completions. The main principle of this technique is using the high pressure resulting from the shockwave formation to fracture the geological formations with minimal collateral damage to surrounding structures. Unlike conventional fracturing methods, which often involve the introduction of huge quantities of fluids, shockwave fracturing provides a cleaner, more controlled alternative. It also significantly reduces the risk of unintended ecological impacts. It allows for more effective well completions, which as a result facilitates reaching resources like oil, gas, and geothermal energy, contributing to a deeper understanding of subsurface geology. Additionally, the reduced environmental impact of shockwave fracturing makes it a better candidate as an environmentally friendly fracturing technique and positions it as a progressive and responsible choice in geoscientific applications.
Despite the fact that the first reported experiment was in 1774, it was not until the 1950s when the topic gained the highest potential in experimental and theoretical research. The potential applications of the technology in other research and applications propelled this research [
1,
2,
3]. Wire explosion underwater results in non-ideal plasma, optical emissions, heat, and strong shockwaves (SWs) in terms of the GPa level [
4,
5,
6,
7,
8]. This method has several advantages over plasma blasting and other used techniques due to multiple reasons, including the generation of extremely high pressure, in addition to the uniform column of plasma provided by the water bath that enables the direct measurement of the non-ideal plasma conductivity [
9,
10,
11,
12,
13,
14].
Shockwaves with different loads and pressure levels may be reached by changing the electrical circuit parameters, stored energy, and load types [
15]. For that reason, quantifying the generated energy and pressure is essential to the field applications of this technology. Generating the optimal shockwave by applying the appropriate mode is a challenging process and is dependent on the specifications of the used equipment [
15,
16]. Underwater Electrical Wire Explosion (UEWE) undergoes multiple stages: the electrical current passing through the wire results in wire heating, wire melting, liquid wire material heating, vaporization, breakdown, and arc plasmas [
17].
There are five discharge types for fixed circuit parameters and stored energy. Han R. et al., 2007a were able to observe these five different discharge types by exploding 50 µm to 500 µm copper wires with lengths that range from 1 cm to 10 cm by depositing stored energy from 500 J to 2700 J in water [
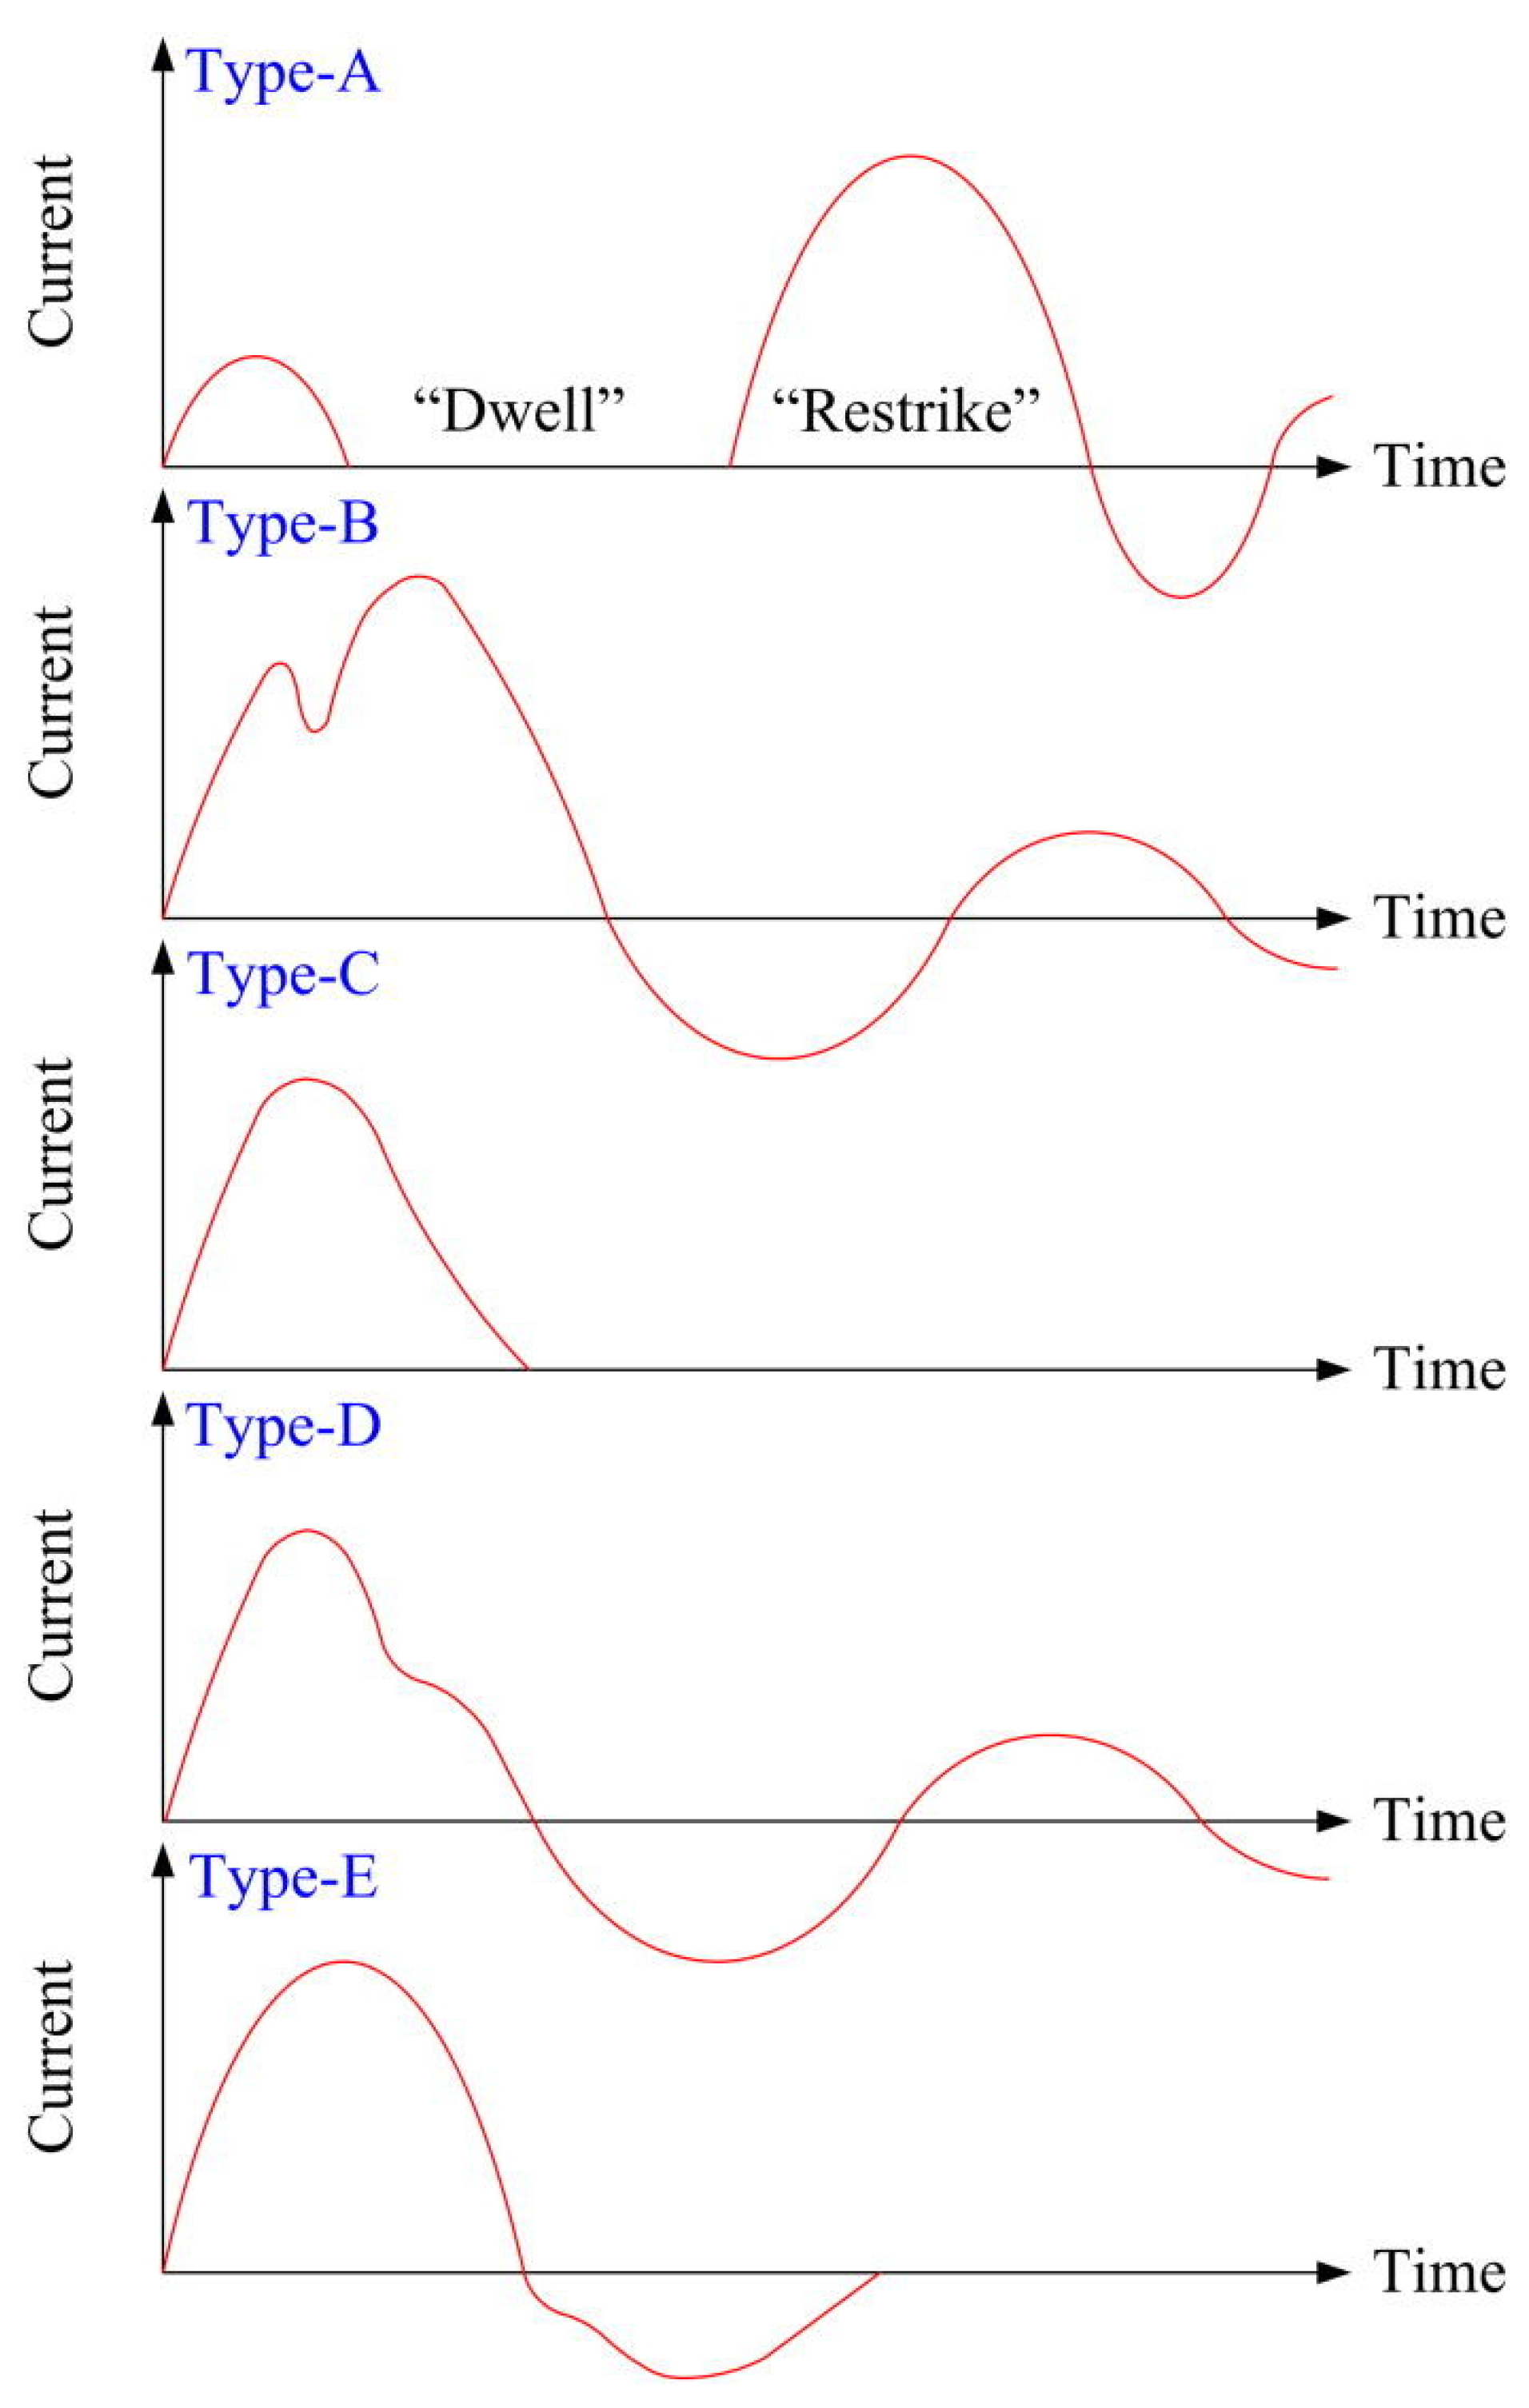
15]. They were able to correlate the deposited energy, wire length, and wire diameter with the discharge type. As shown in
Figure 1, they identified five different discharge types. They concluded that type A was observed when using fine and long wires and the main feature of this discharge type is a dwell followed by a restrike. By increasing the deposited energy and/or reducing the wire length, type B is observed as the dwell becomes shorter until the restrike occurs immediately and type A gradually develops into type B. The optimal mode is type C, where only one load is observed. Type D is similar to type B except that the explosion happens at the falling edge. Finally, in type E, there is no restrike, and it is usually observed with thick wires. It is worth noting that the discharge types do not depend only on the wire length and diameter [
15]. Different discharge types would be observed by using different deposited energies with the same wire length and diameter. In other words, the different discharge types may be achieved by increasing or decreasing the deposited energy using the same wire length and diameter.
Lee and Ford 1988 in a previous study showed that a linear relationship exists between the peak inductive voltage and the pressure of the shock front [
18]. This proves that higher mechanical energy can be generated by depositing more electrical energy before the voltage peak [
15]. Han et al.’s 2017b model showed that the deposited energy before the voltage peak might have a large influence on the shockwave front [
19]. However, further investigation is required to create a systematic and detailed relationship between the deposited energy, the maximum pressure, and the pressure distribution behind the shock front.
The total circuit conductance
and wire conductance
may be calculated as follows:
where
is the short circuit current cycle,
is the capacitance released by the capacitors,
and
are the wire length and diameter, respectively, and the circuit conductance is
[
20]. The measured voltage on the load of the wire
consists of the resistive voltage
and the inductive voltage of the exploding wire
.
and
are the current and the resistance of the exploding wire, respectively. We can calculate the measured voltage and the deposited energy using the following equations [
20]:
To have accurate calculations of the deposited energy, the voltage drop resistive component is calculated by subtracting the inductive voltage from the measured voltage as in Equation (5) [
19,
20].
Pulse plasma was used in many different fields such as mining, military, medicine, and the petroleum industry. Most of the previously mentioned applications use the shockwave generated as the main form of energy generated for the purpose of the application. The shockwave may be defined as a sharp change in the pressure in a very small travelling distance through the medium, while physicists define it as a type of disturbance propagation that moves with speed faster than local speed of sound in the medium [
21]. The first patent application for using the electrical discharge was in fracturing in 1992 by Kitzinger and Nantel under the name of the Plasma Blasting (PB) method [
22,
23]. Since then, many experimental and numerical studies and patents investigated the development of the PB technology, apparatus, and applications in rock fracturing and fragmentations in addition to cracking characteristics resulting from repetitive shocks [
23,
24,
25,
26,
27,
28,
29,
30,
31]. PB depends mainly on the electrical discharge, while on the other hand, our proposed method, UEWE, utilizes the wire explosion to generate more energy than the deposited energy.
Transitioning shockwave fracturing from the lab scale to field trial scale at this stage most likely will encounter technical and operational challenges. Examples of the technical challenges are equipment such as capacitors. Capacitors need substantial scaling and enhancement for field applications. Capacitors must not only be more efficient but also possess an extended lifespan to accommodate the increased frequency of charge and discharge cycles expected in field operations, compared to lab experiments. Additionally, monitoring systems require more developed equipment to meet the robust demands of field operations. From an operational perspective, a significant challenge lies in designing equipment capable of handling multiple fractures with several shots in a single run with predefined fracture spacing and orientation. These challenges require further research to precisely define all necessary parameters for field-scale applications. It is clear that a deeper understanding and further development are required in this early stage of the shockwave fracturing application.
Despite all the performed research, there is no defined relationship between the deposited energy, the maximum pressure, and the pressure distribution behind the shock front. Therefore, the objective of this paper is to develop a correlation between the optimum energy required to generate the shockwave and the used wire weight and diameter as independent factors. We also investigated the effect of the present water volume on the UEWE and finally drew the baseline for implementing the shockwave fracturing on cement and limestone samples with zero stress. First, we present the materials and methods. Afterwards, we present the results and discussion. Lastly, we state the conclusions and future work.
2. Materials and Methods
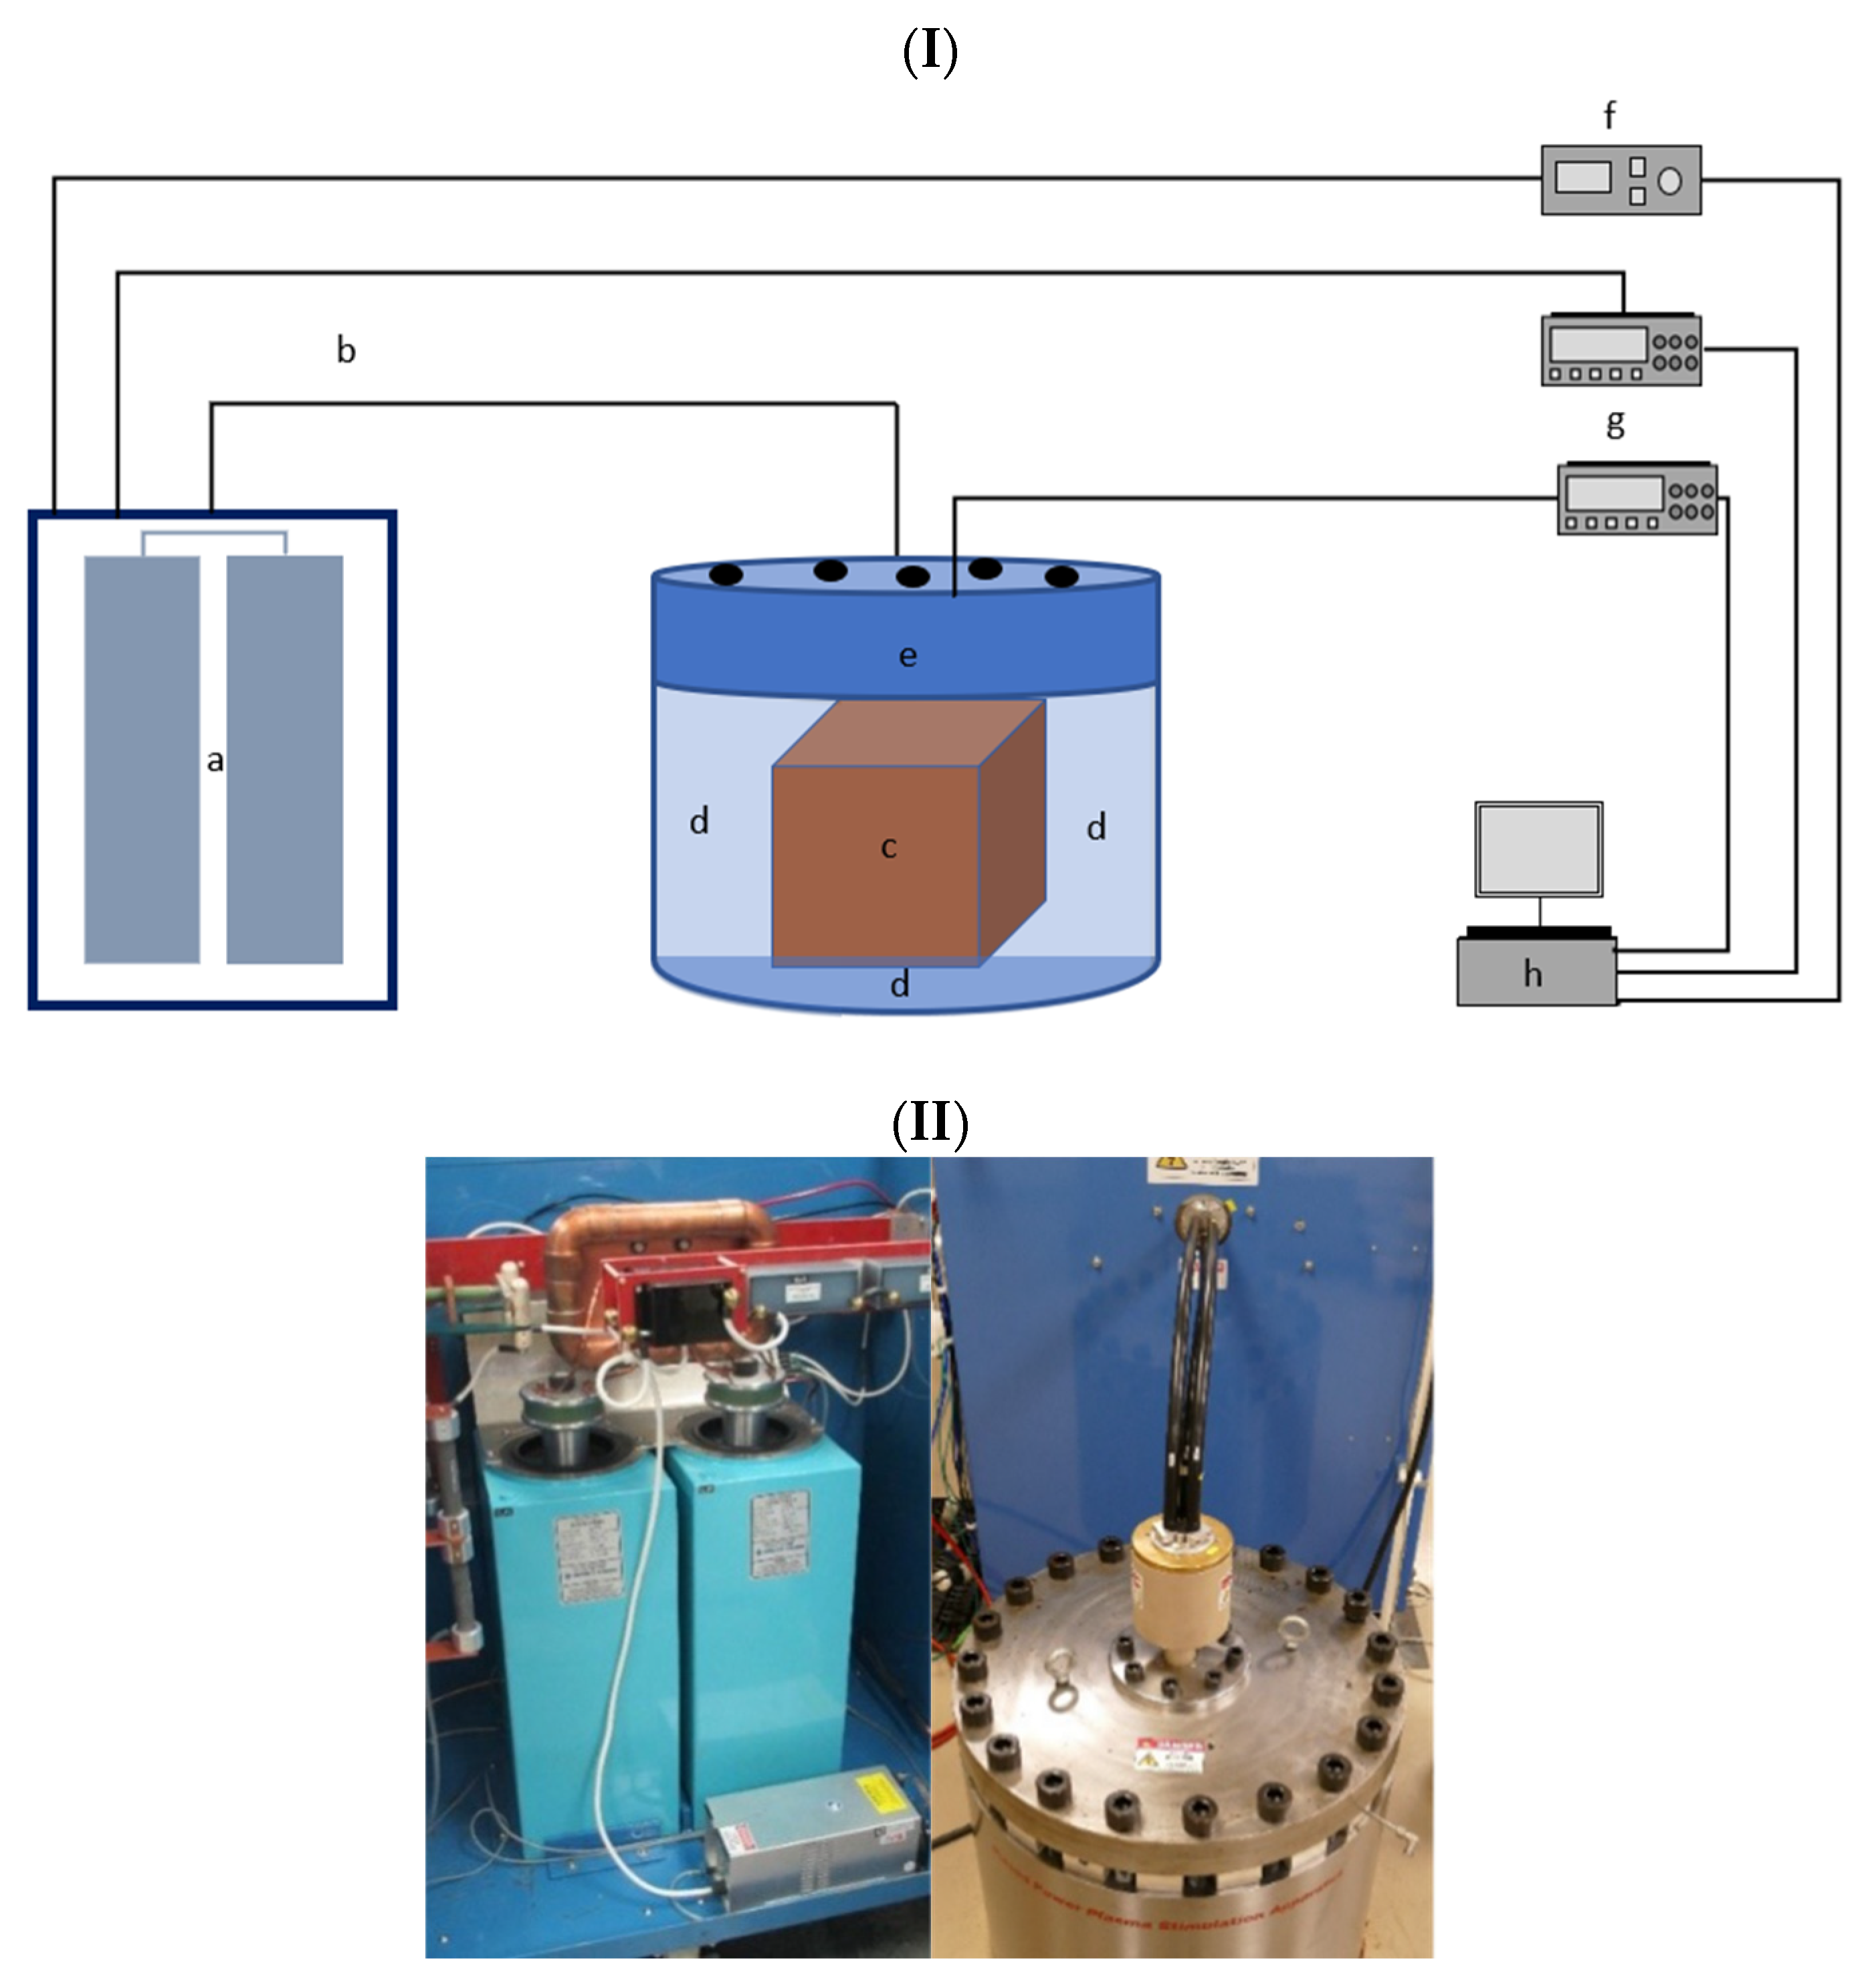
Figure 2 shows the schematic and pictures of the equipment setup designed for use in this study. This equipment consists of three main components: the electrical component, tri-axial cell, and the monitoring and control component that contains the control unit and the data recording unit. The electrical component has two coaxial capacitors, a high-voltage charging system, and spark gap switch. The main objective of this part of the setup is to store the desired amount of energy that will be used in the experiment in the capacitors. The stored energy is transferred to the sample wellbore through high-voltage cables, connected to two electrodes where the metal wire connects the gap between the electrodes. The tri-axial cell has a diameter of ~61 cm with a cap that is attached to the body of the tri-axial cell using 20 heavy-duty bolts. We implemented the application of the three principal stresses, the two horizontal stresses, and the vertical stress using hydraulically moving plates to best simulate the real field stress anisotropy and orientation. The tri-axial cell was designed to accommodate a ~36 cm cube sample. The recording system consists of pressure gauges, oscilloscopes, and a computer that gathers data wirelessly from the oscilloscopes.
The experimental work presented in this paper is divided into two main parts: water tank experiments and rock samples experiments. The water tank experiments focus on defining the minimum energy required to burn the wire and the effect of the wire on the output pressure level. However, we ran a number of experiments using PVC pipes as a representation of wellbore casing with different diameters to investigate the effect of the water volume around the wire. In all the experiments, a 2.54 cm ± 0.05 gap between the electrodes was maintained. In addition, the electrodes and the gap spacer between the electrodes were sealed using a non-conductive material to minimize and/or eliminate the energy loss along the electrodes.
Table 1 shows a summary of the experimental plan.
The main objective of the water tank experiments is to develop a correlation based on real data that should define the minimum energy required to burn a certain weight of an aluminum wire with respect to the wire diameter. We measured both wire weight and length before and after all the experiments. We used two sets of wire diameters, 1.5 mm (16 gauge) and 0.76 mm (22 gauge), to generate the correlation. Using the cement and formation samples, the goal was to define the number of shocks and/or the required minimum energy to fracture the samples and thus set the baseline for the future work. Research that will be published in the future will focus on defining a correlation between the minimum and maximum energy required to break different types of rock formations at different stresses.
The water tank used in the experiment is a ~41 cm cube as shown in
Figure 3a, and three Müller-Platte needle probes were used along with Müller voltage amplifier MVA 10 for pressure measurements. The pressure probes were placed at three different locations on the tank, in the vertical and the horizontal planes of the wire. The first and second pressure probes were on the top of the tank on the same plane as the top of the electrodes 12.7 cm (5 inches) above the wire; the first was located 18.3 cm (7.2 inches) from the electrodes, while the second was 8.89 cm (3.5 inches) from the electrodes, as shown in
Figure 3b. The third electrode was 2.32 cm (8 inches) from the wire on the same horizontal plane, as shown in
Figure 3c.
We used the same electrode parameters through all the experiments, to minimize the error. The electrodes’ total length was 27.94 cm with 13.97 cm inside the water tank or pipe case, and in case of the cement or formation sample, 19.05 cm of the electrodes was inside the sample borehole. As mentioned earlier, the only point of contact was the wire (the point that closed the electrical circle), and the rest of the electrodes were coated with a non-conductive material to ensure the efficient deposition of the discharged energy into the wire and to minimize the energy loss.
3. Results and Discussion
The volume of water around the electrodes is quite large in the water tank compared to the sample wellbore, which is a good representation of the wellbore compared to the sample borehole. We investigated the effect of the water volume by running multiple experiments with three different water volumes around the electrodes. We used 3.8 cm and 10 cm diameter pipes and a ~41 cm cube tank full of water. We used discharge energies of 1.5, 3, 4, and 8 kJ in different experiments to investigate the effect of water volume over a range of discharge energies. We kept all the wire parameters constant through all the experiments as follows: a wire diameter of 0.76 mm (22 gauge) and wire length of 56.4 cm. Each experiment was repeated two or three times to confirm the repeatability of the results. In case of the pipes, we filled the pipe with water and placed it in the empty tank.
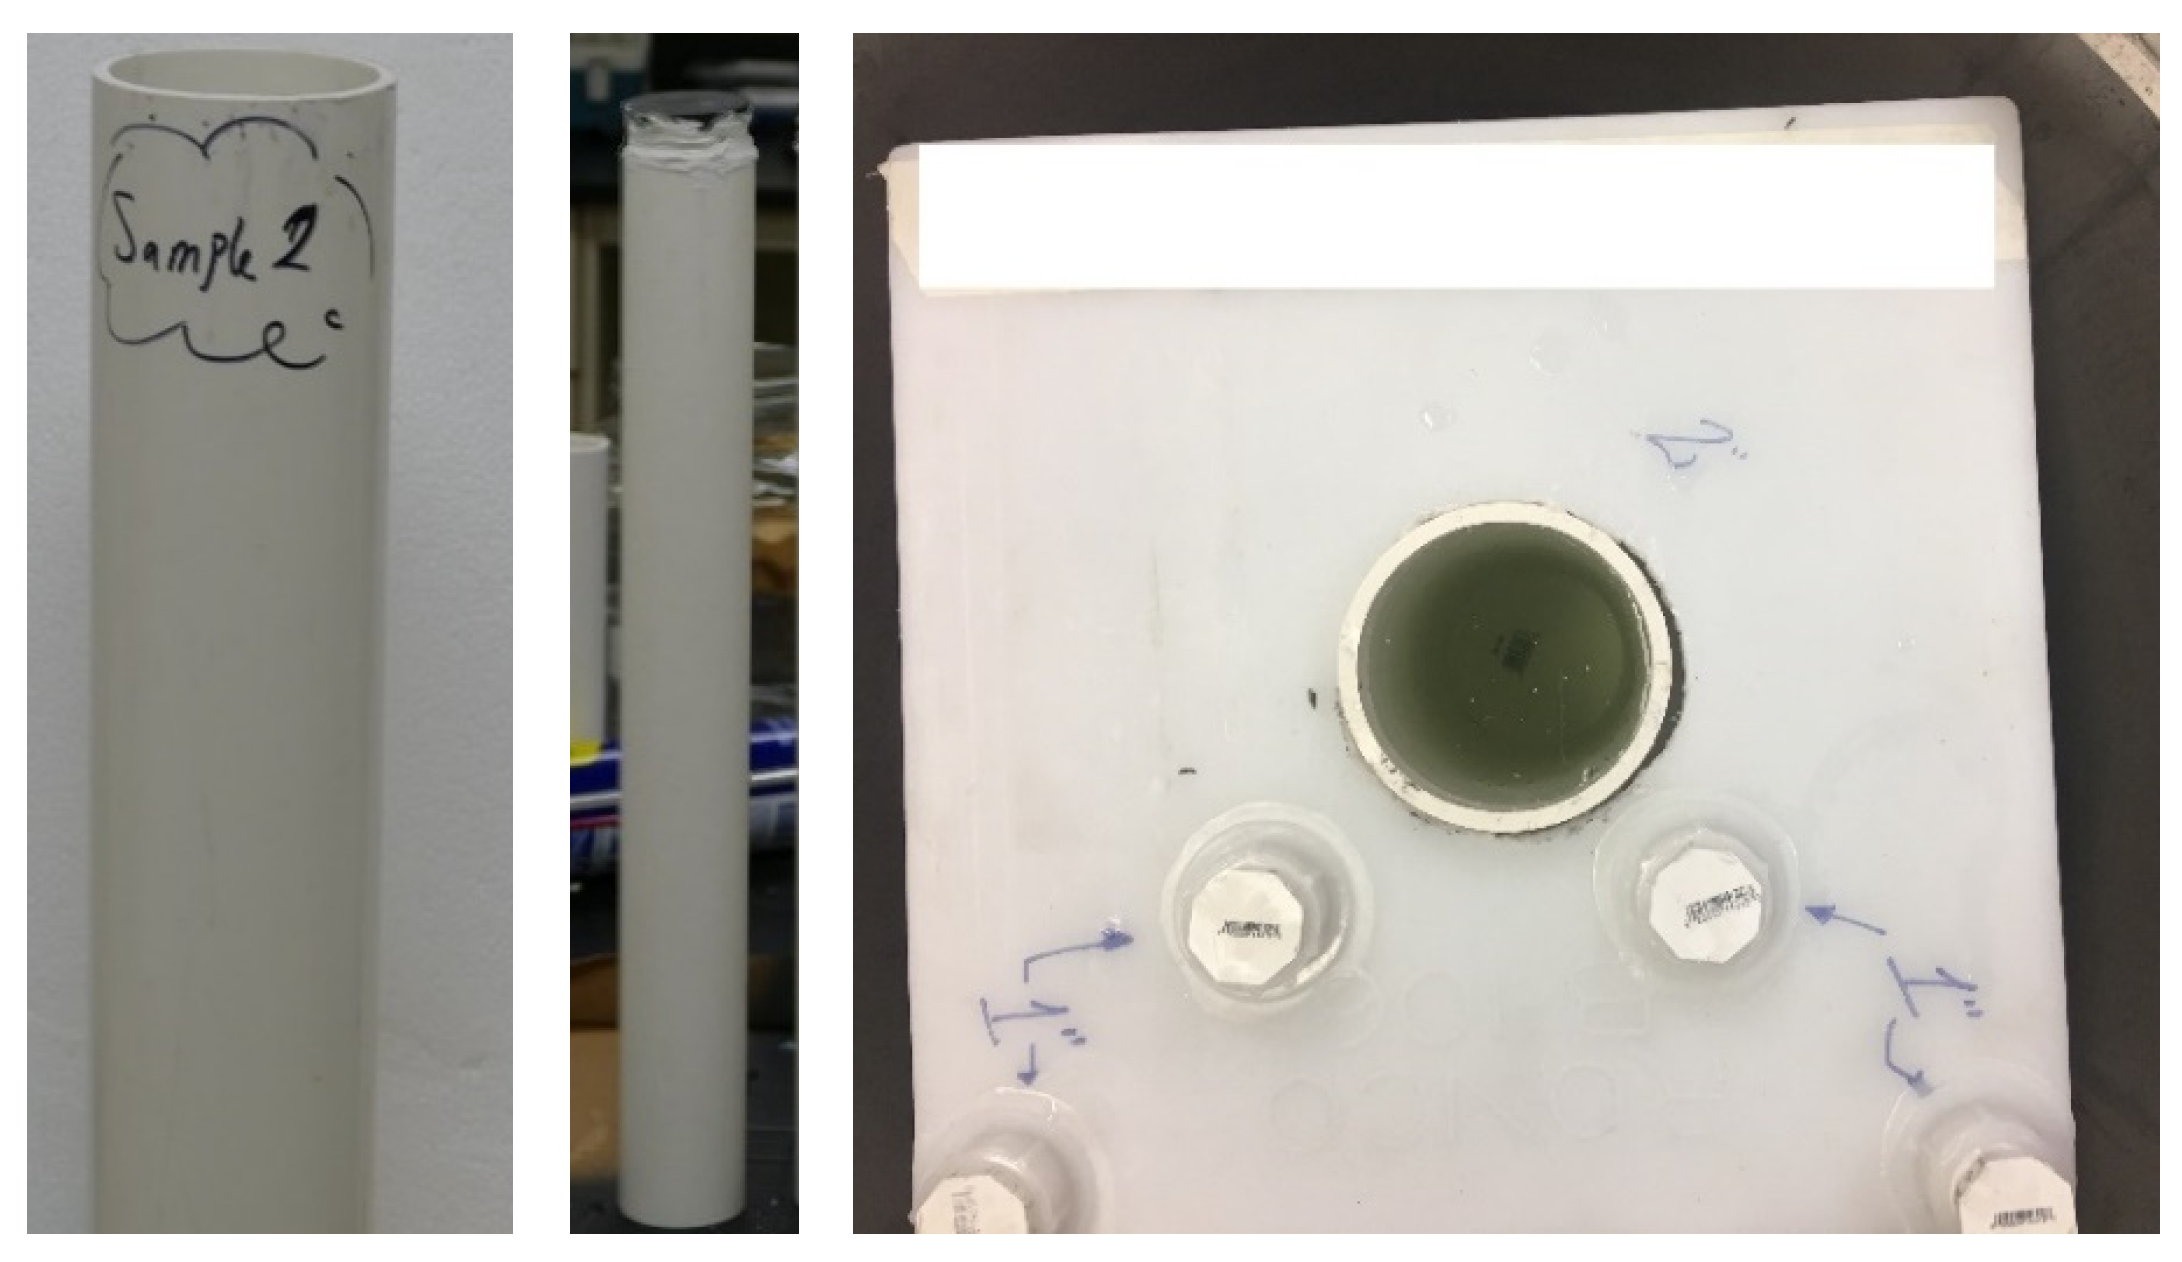
Figure 4 shows the setup of the 3.8 cm and 10 cm pipes and the 10 cm pipe’s positioning in the water tank. It was observed that there was no significant effect observed due to increasing the water volume from 1.82 L (0.48 gallon) to 68.14 L (18 gallon). The weight of the exploded wire and the current responses were the same in all cases, and there was no difference in all the experiments at the same level of discharged energy. From the previous set of experiments, we concluded that UEWE may be applied in the field without any concern or effect from the volume of the water present in the wellbore.
The second main objective of this work was to develop an equation/correlation for the minimum discharge energy required to burn a certain weight of aluminum. Using the deposited energy calculations mentioned in the literature, we could convert the discharge energy to the deposited energy of the used equipment. By depositing the calculated energy into the wire, we will ensure the maximization of the energy output from the wire explosion due to the conversion of all the extra energy to mechanical energy.
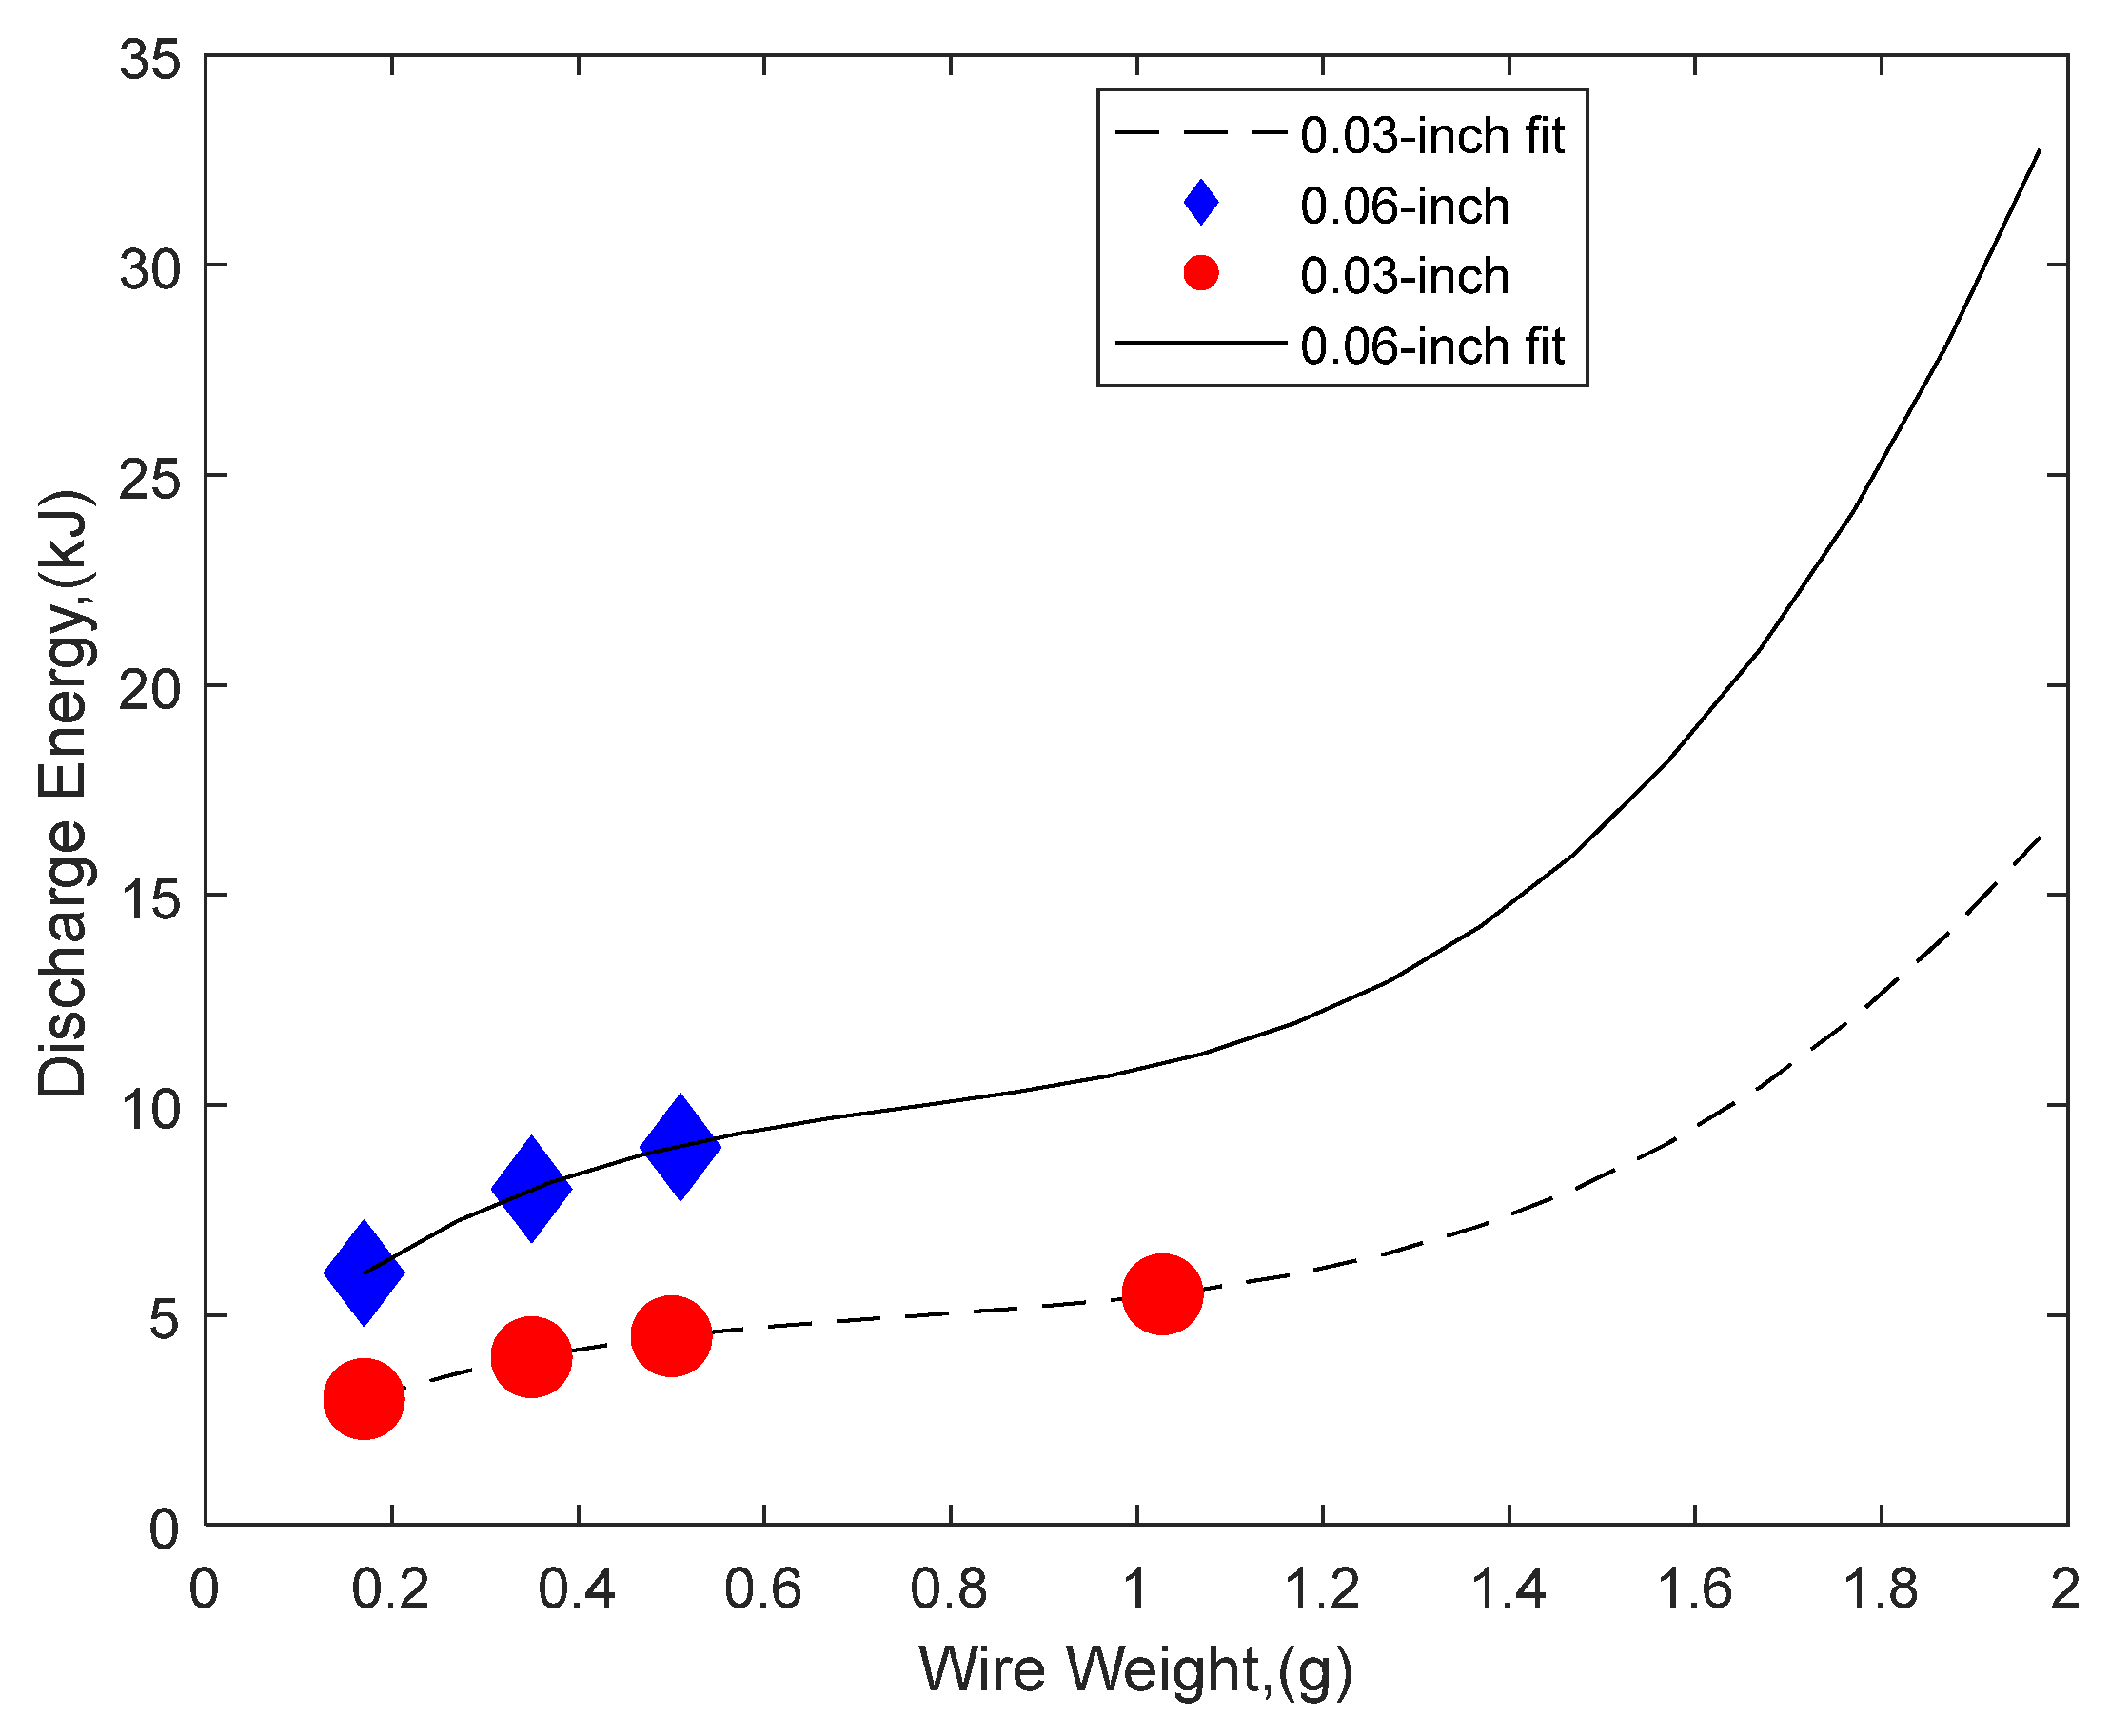
In this work, we included the wire diameter as an independent parameter in the equation, which will enable this correlation to be used for all high-purity aluminum wires (>99%). We experimentally defined the minimum discharge energy required to burn six different weights of aluminum wire: three weights of a 1.5 mm diameter wire and another three weights of a 0.76 mm diameter wire. We started with the 0.17 g wire weight and 1.5 kJ. We kept increasing the applied energy until the whole wire was burnt in the UEWE. This procedure was repeated with the other five wire weights. We plotted the results as in
Figure 5, showing the correlation developed by fitting the curve and extrapolating the results.
Figure 5 presents the experimental results for the 0.03-inch diameter wire in red circles and the results for the 0.06-inch wire diameter in blue rhombuses. The nonlinear least squares method was employed to identify the optimal fitting curve for both data sets. The optimal fit curve was ascertained by minimizing the sum of the squares of the residuals, which represents the difference between the observed value and the value predicted by the model. A third-degree polynomial was selected as the optimal fit to the experimental data, effectively balancing accuracy and avoiding overfitting. We cross-validated the model by performing a different experiment with a different weight of aluminum wire that was not used to fit the curve. This point was plotted as the fourth point on the 0.76 mm curve. This verified the effectiveness of the extrapolation and matched the minimum discharge energy from the correlation. Equation (6) shows the correlation that defines the minimum discharge energy required for completely burning the wire weight in UEWE.
where
is the deposited energy in kJ,
is the wire weight in grams, and
d is the wire diameter. The minimum energy required to burn the same weight is increased by doubling the wire diameter. Despite the fact that wire length increases by decreasing the wire diameter, the minimum energy required to burn the whole wire decreases. The wire explosion will require lower energy because the resistance increases by increasing the length and decreasing the diameter of the wire. The heating of the wire will be higher, and the vapor pressure resulting from the wire evaporation will be higher, resulting in a higher-pressure shockwave.
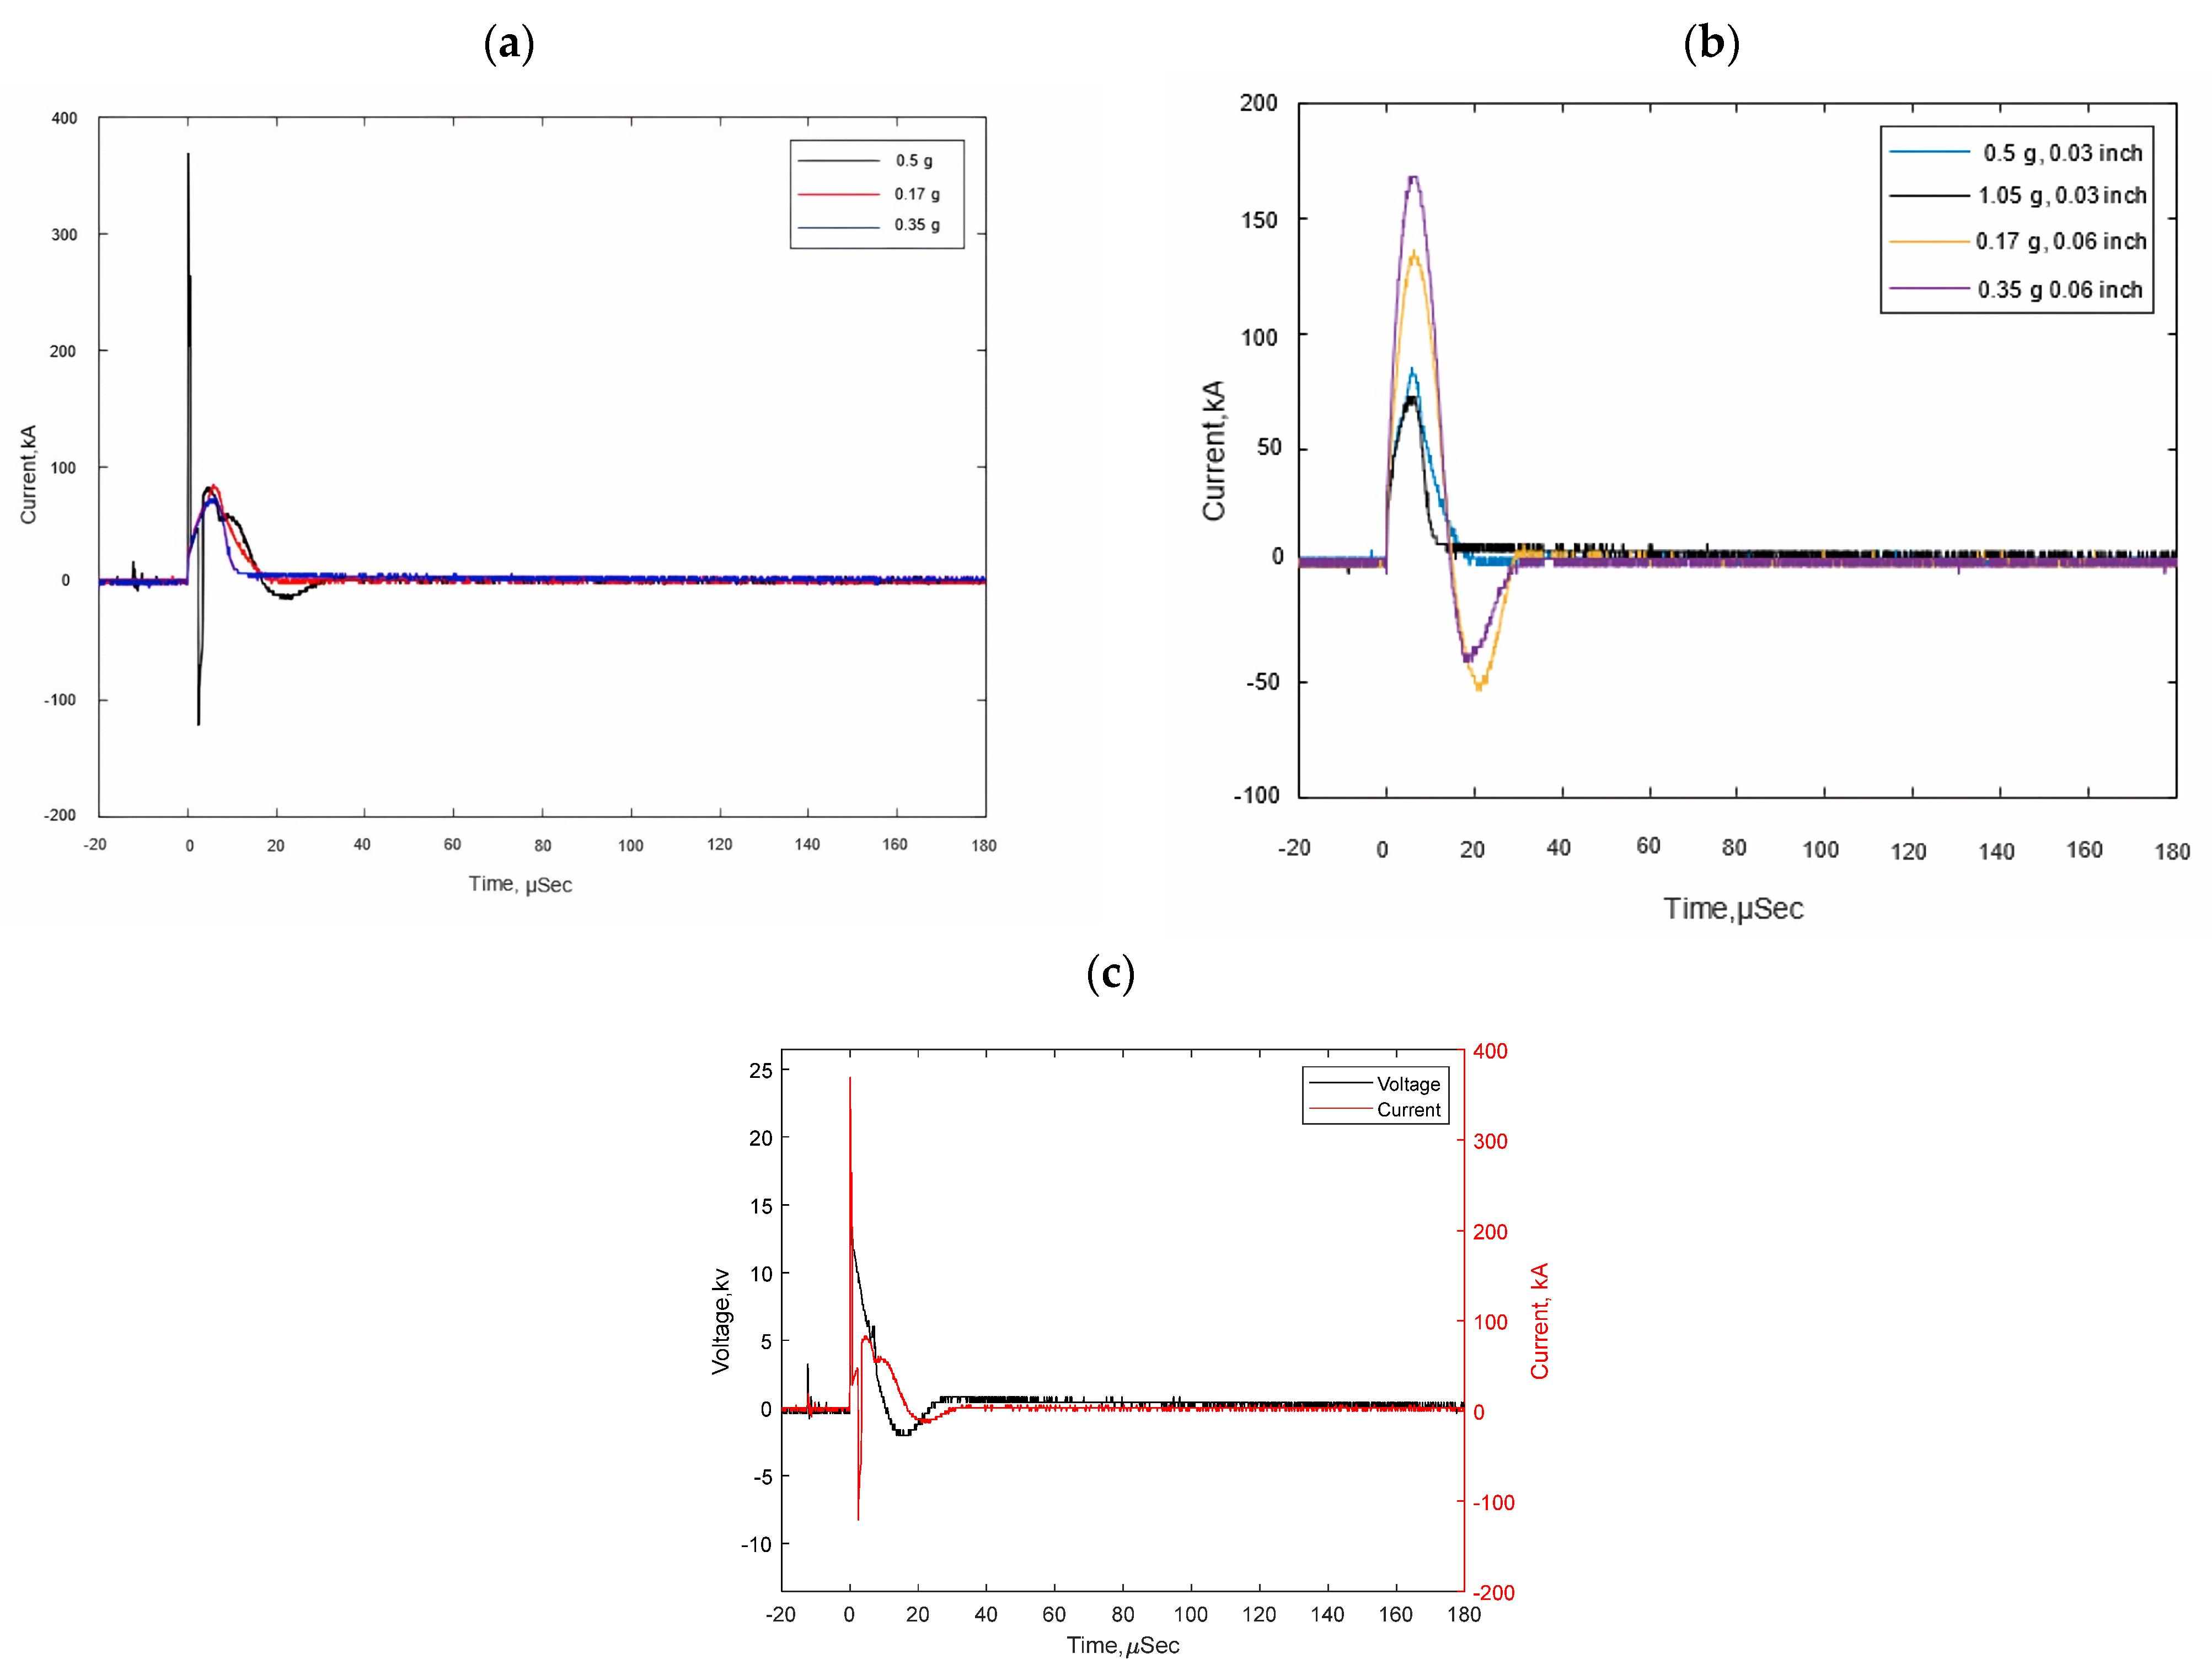
Figure 6a shows the current waveform for the 0.03-inch diameter aluminum wire at the minimum discharge energy required to burn the whole 0.17 g, 0.35 g, and 0.5 g wire weight. The plots show that the current waveform rises at the same rate in the case of the optimum minimum energy required for burning the whole wire. The current peak increased from ~70 kA to ~80 kA by increasing the discharge energy from 4.5 to 5.5 kJ. The 0.17 g plot has a different rising rate in the first 1–4 µs due to firing instability in the equipment; however, it did have the same peak as the other two experiments at the same time.
This indicates that even if the discharge was disturbed by the equipment firing sequence, it will not have a strong effect on the output energy because most of the energy deposition happens after the first voltage peak in the case of using the optimum energy required, as shown in
Figure 6c.
Figure 6b shows the current waveform for the 0.76 mm and 1.5 mm diameter aluminum wires at the minimum discharge energy required to burn the whole weight of 0.5 g and 1.05 g of the 0.03-inch diameter wire and 0.17 g and 0.35 g of the 0.06-inch diameter wire. This figure also confirms that the current waveform rises at the same rate in all the cases of the optimum minimum energy required for burning the whole wire. The only effect is that the current peak increases in the case of the 1.5 mm wire from 133.5 KA to 168.5 KA by increasing the discharge energy from 6 kJ to 8 kJ.
Han et al., 2017a reported that the increase in the wire diameter in the case of a copper wire changes the discharge type from type A to type B and then to type C. Although the wire parameters and the discharge energies were reported, it was not mentioned if all the wire was burnt or not [
15]. The assumption may not be valid in the case of there being any remaining wire, because the energy deposited is not optimum. The amount of burnt wire may be different each time the experiment is repeated. Therefore, the detailed reporting of the wire status after the experiment is very important, as is reporting the voltage and current.
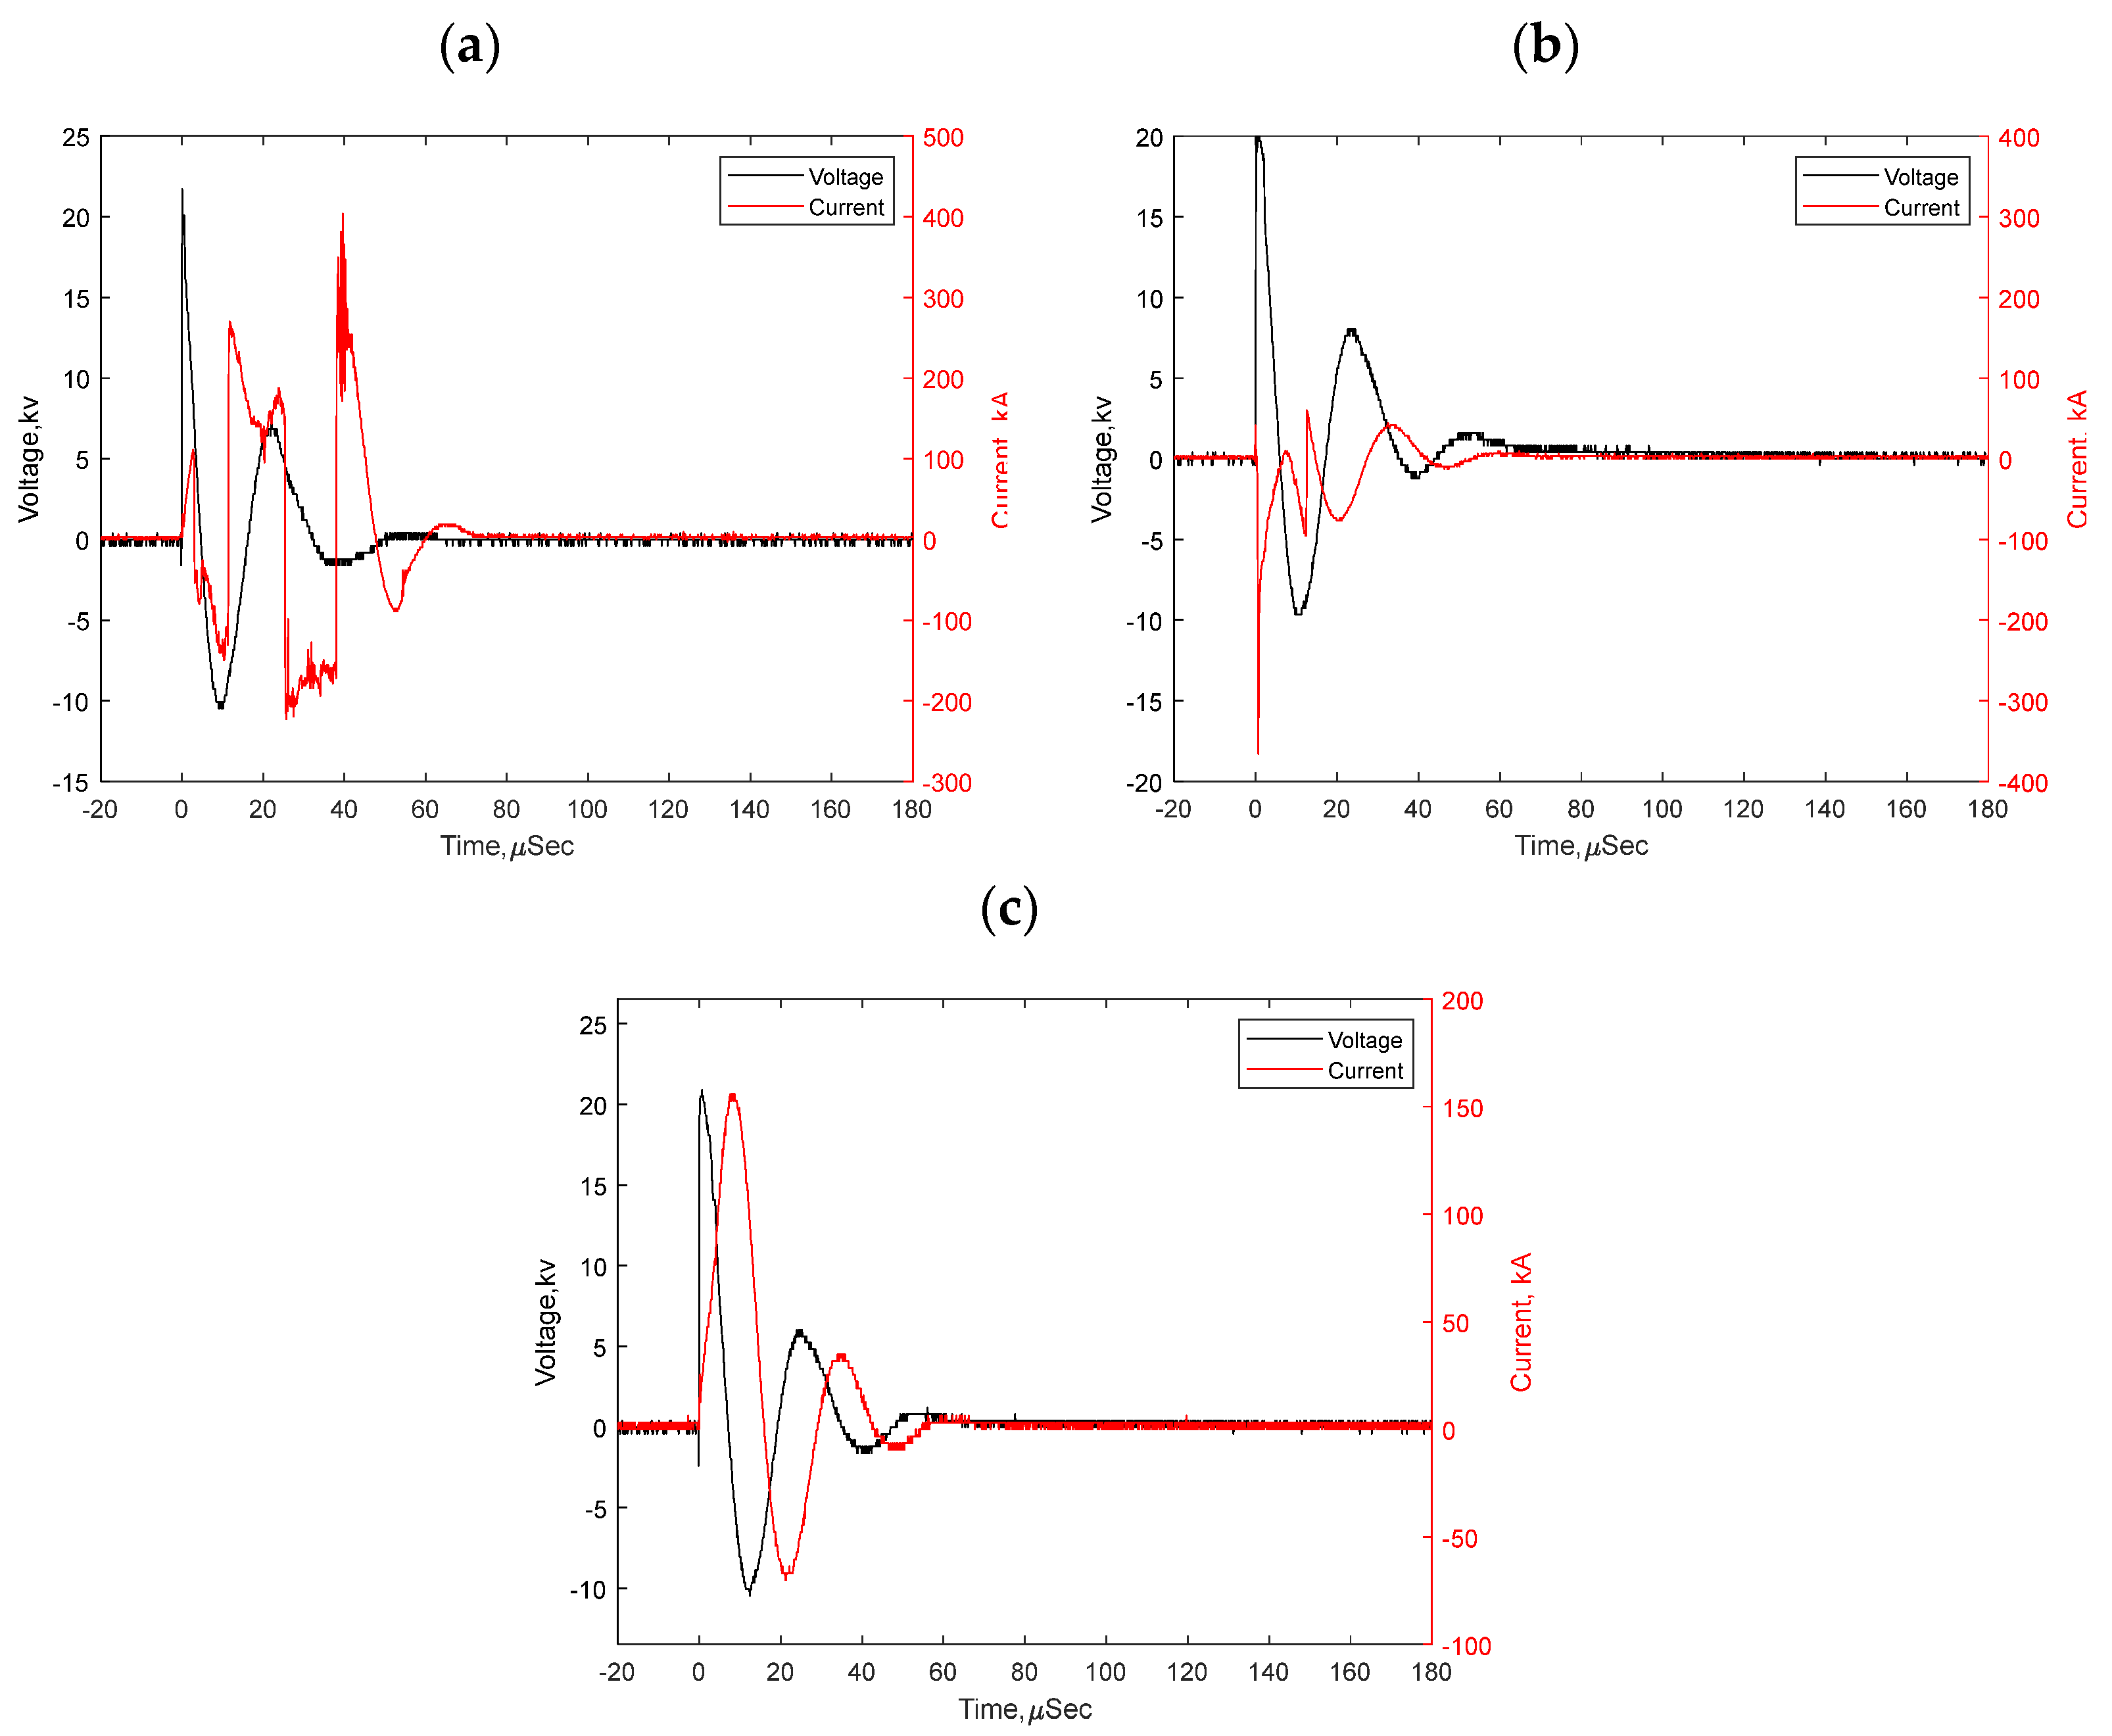
From the current waveform reported by Han et al., 2017a, it can be seen that the current peak occurred at a different time in each experiment when different wire diameters were used. On the other hand, we were able to have the current peak at the same time in all the experiments, even when different wire diameters were used. This supports our assumption that the optimum energy is a vital factor in investigating the current waveform response. By using a smaller wire diameter at the optimum minimum required energy for burning the whole wire length, we could control the change of the discharge type from type B to type C, as shown in
Figure 6b.
We validated the above assumption by using impure wires. We used the same wire length of 57.15 cm and wire diameter of 0.03-inch. The discharge energy was 8 kJ. As shown in
Figure 7, every time the experiment was repeated, we had a different current waveform response and different time for the current peak. The previous experiment was repeated 10 times. The remaining wire after each experiment was different and ranged from 20% to 80%. Three experiment responses are shown in
Figure 7.
The current peak increase in the case of the same current waveform rise rate using different discharge energies leads to a higher energy deposition into the wire. Also, using the optimum minimum required energy or higher energies prevents the premature breakdown of the wire, which leads to higher effectiveness in the energy deposition and energy output of the UEWE.
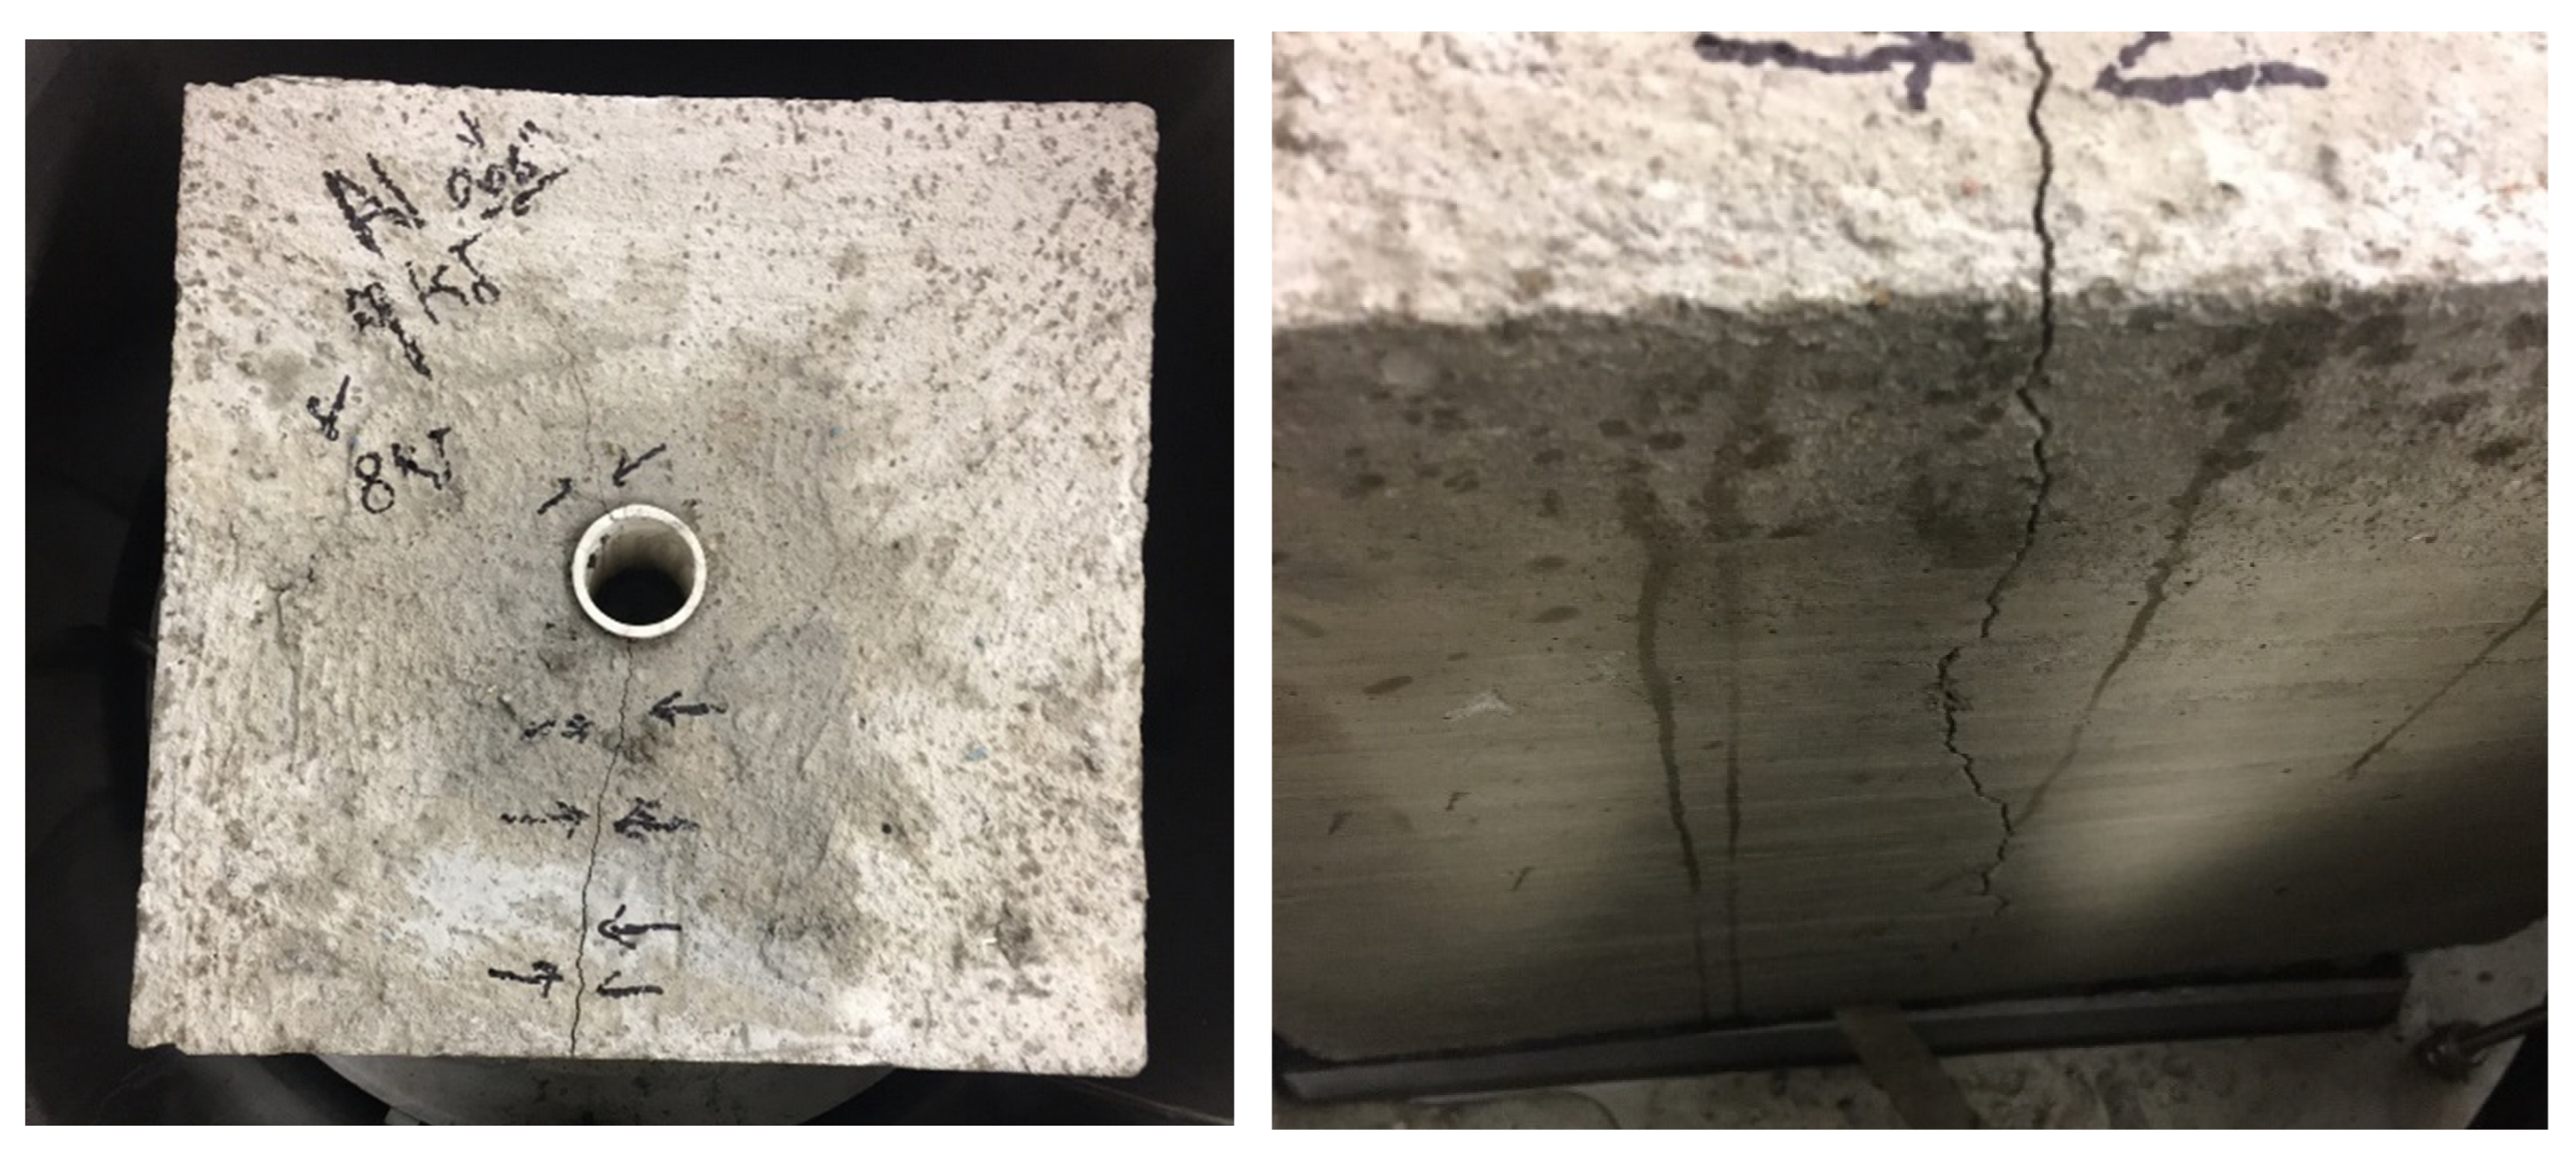
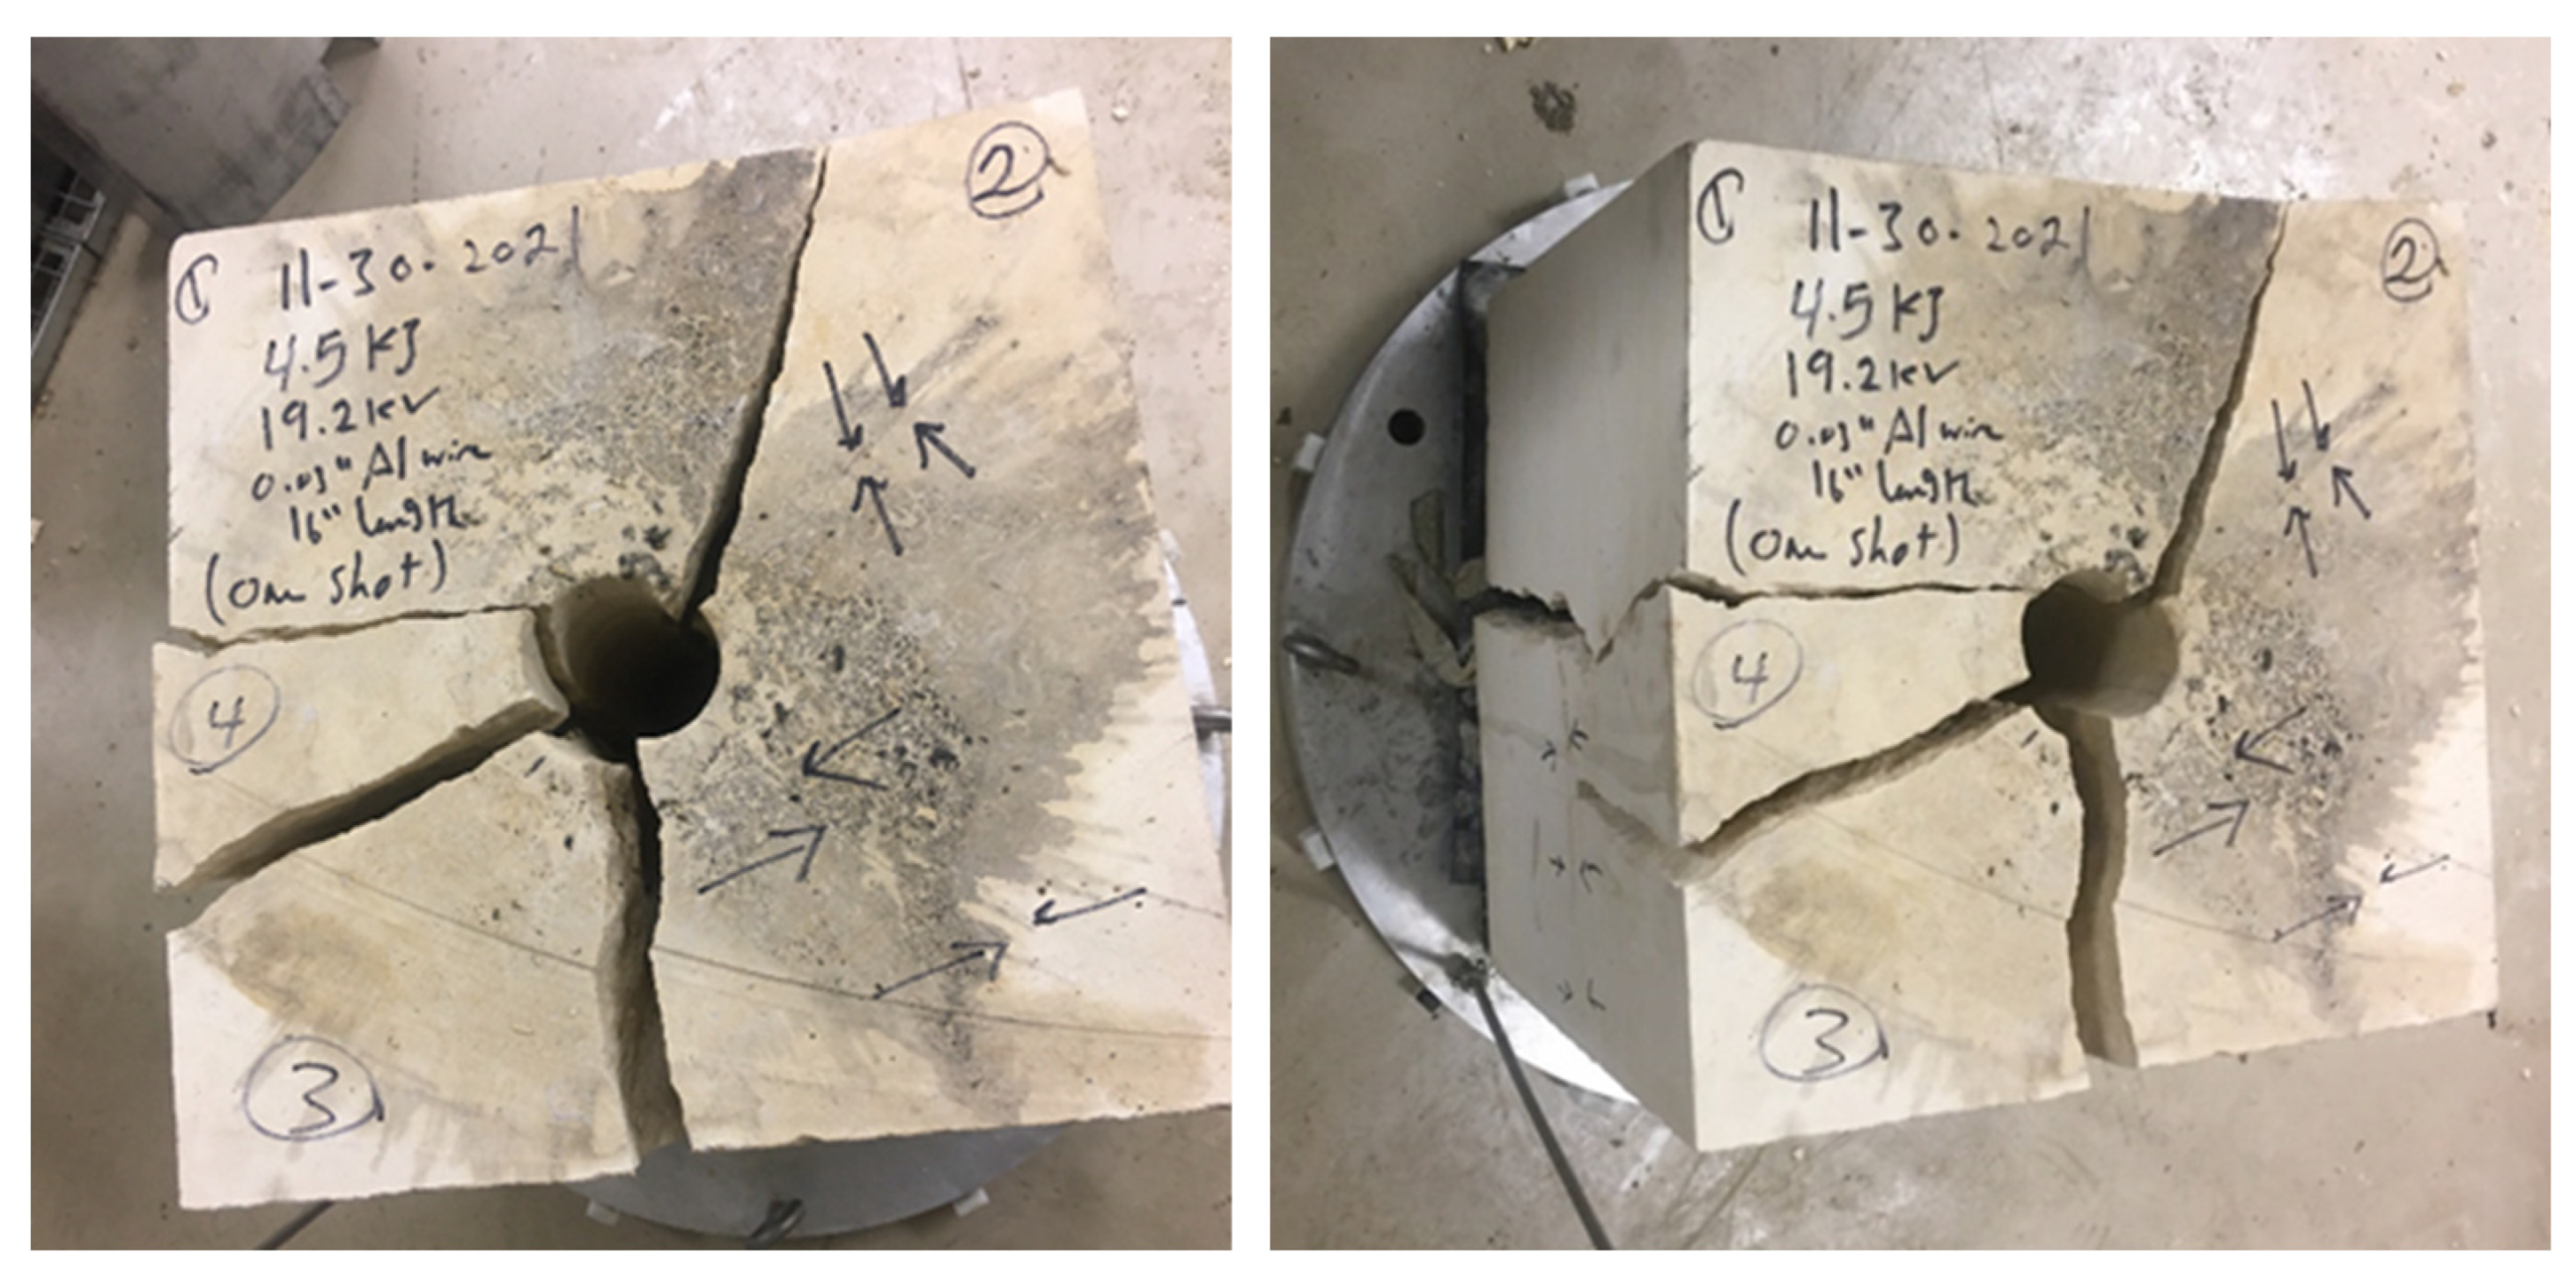
The final stage of this work was to implement the previous data and use them in fracturing cement and limestone samples under zero stress using the minimum energy required as a baseline for the current running set of experiments under higher stresses of up to 6.89 MPa minimum horizontal stress, which will be reported in future publications. A cement sample and a limestone sample were fractured as shown in
Figure 8 and
Figure 9, respectively. The cement sample was fractured using the 1.5 mm wire diameter, 0.5 g weight, and 9 kJ discharge energy. The limestone sample was fractured using the 0.76 mm wire diameter, 0.5 g weight, and 4.5 kJ discharge energy. The cement sample had two fractures: the first was a 12.7 cm length hair-line crack, and it is initiated from the wellbore and propagated all the way down to the end of the sample, as shown in
Figure 8.
The limestone sample had two hair-line cracks and four major cracks, as shown in
Figure 9. The cement sample had higher strength than the limestone, and the heterogeneity of the limestone contributed to the increase in the number of cracks in the limestone sample. Each experiment was repeated twice and the same results were obtained.
