1. Aim and Introduction
The aims of this project were twofold: firstly, to review the tectonic and structural setting of the Porgera Gold Mine; secondly, to construct a semi-regional 3D geological model around the Porgera Gold Mine utilizing new high-resolution LIDAR data combined with known stratigraphy and existing dip data and paleontological and palynological dating. The goal was to outline potential areas for further exploration. Given the remoteness of the area and, hence, the paucity of data, the 3D model in part relied on the tectonic understanding outlined below (
Figure 1 and
Figure 2). In particular, the existence of the Porgera Transfer (
Figure 2) and offsets across it proved to be important and are discussed herein.
The literature covering the tectonic evolution of Papua New Guinea (PNG) was thoroughly reviewed by Baldwin et al. [
1] and, concerning PNG mineralization, by Holm et al. [
2], and readers are referred to those papers for more information. Here, we are concerned with the tectonics in the Porgera region.
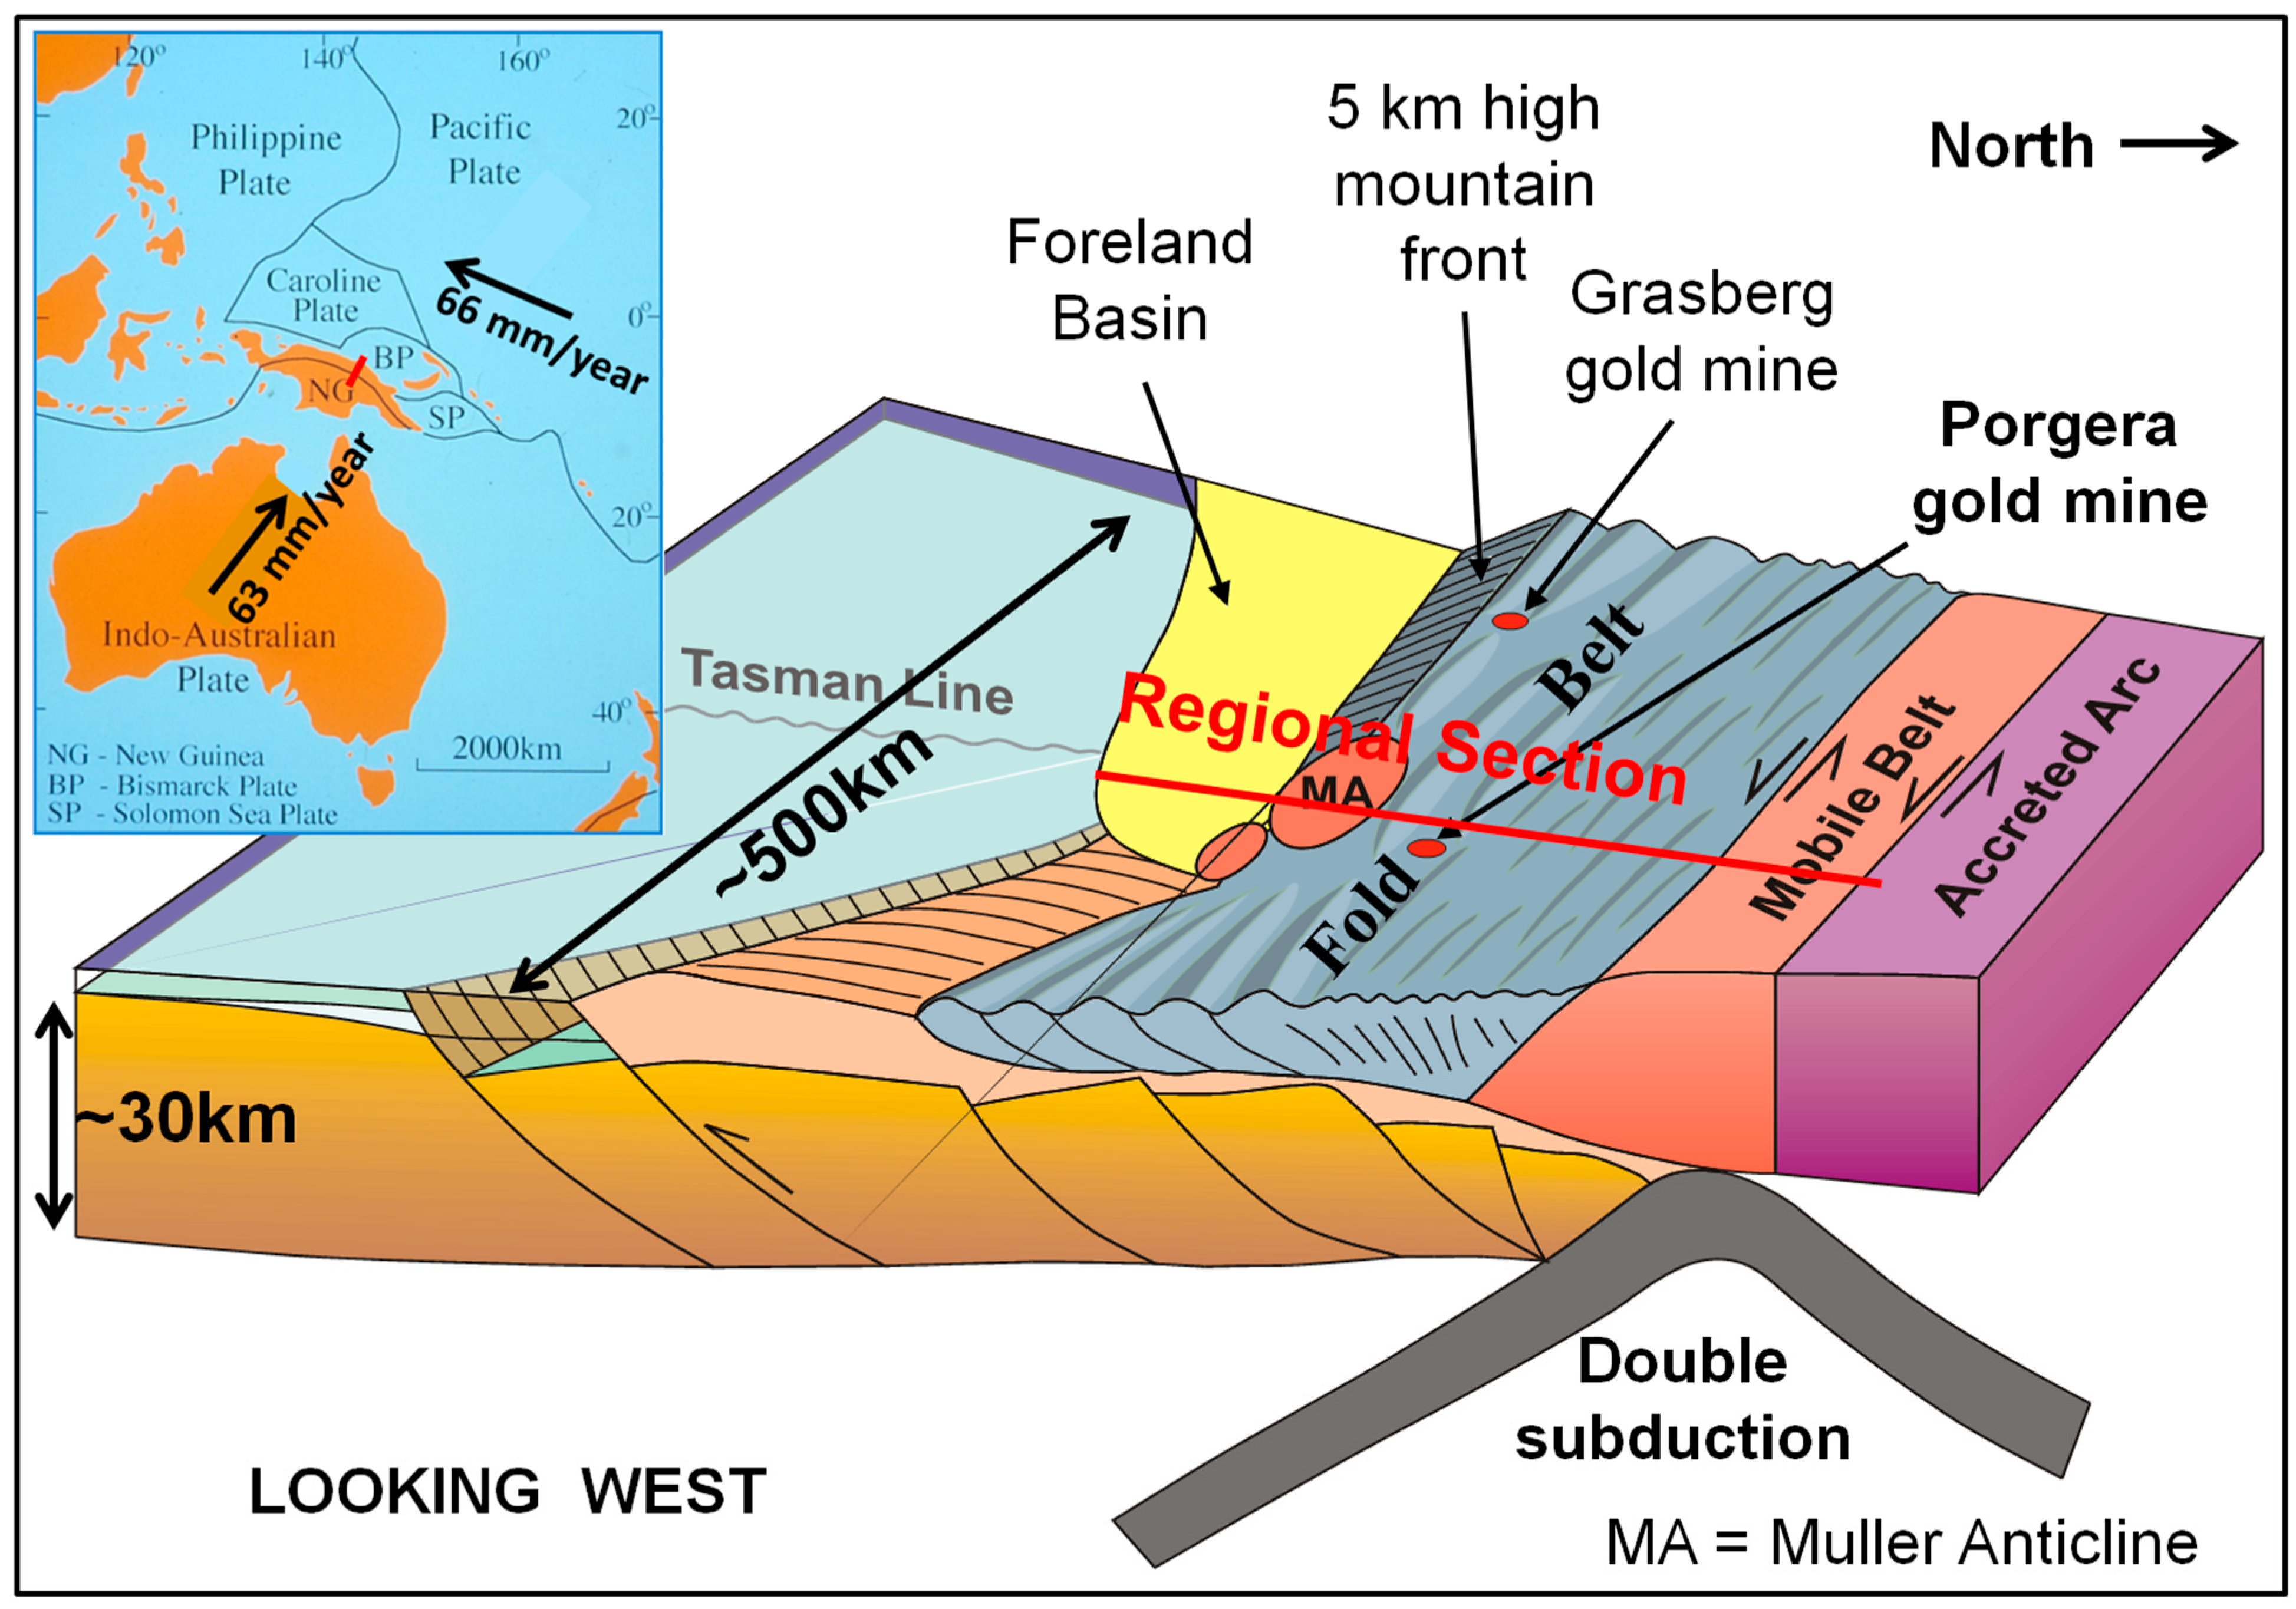
Figure 1.
Plate tectonic setting of New Guinea (inset) with plate vectors from Holm et al. [
2] and a block diagram illustrating the structure of the margin, after Hill and Hall [
3] (their Figure 13). The location of the regional section in Figure 4 is shown on both the block diagram and the inset as a red line.
The island of New Guinea lies along the northern margin of the Indo–Australian plate, where it is undergoing oblique convergence with the Pacific Plate (
Figure 1 inset). Southern New Guinea comprises relatively undeformed Australian crust that is bowed down in the west to form a foreland basin in front of the Fold Belt [
3]. The Fold Belt comprises a broad zone of folded and thrust Jurassic–Pliocene sediments that were deposited along the northern Australian margin. It is underlain by extensional faults formed during Jurassic rifting, some of which were reactivated during the Late Miocene to Pliocene compression (
Figure 1). The Fold Belt is bound to the north by the Mobile Belt (shown very schematically on
Figure 1), comprising distal sediments, ophiolites, igneous and metamorphic rocks. It is bound to the north by the Paleogene Melanesian arc that collided in the Middle Miocene, causing orogenesis of the margin.
Hill and Hall [
3] considered that the PNG margin underwent extension and rifting in the Early to Middle Jurassic, leading to a Late Jurassic breakup and deposition of thick Upper Jurassic Om Bed shales (
Figure 2). The Sepik Terrane (
Figure 2) drifted away from New Guinea until the Berriasian, ~140 Ma, when spreading commenced further north [
4]. Meanwhile, the PNG margin underwent passive margin subsidence and flooding which continued through the Cretaceous. In the latest Cretaceous, northward subduction commenced beneath the Sepik Terrane [
4], causing it to converge with the PNG margin during the Paleogene and dock in the Oligocene [
5] (see location on
Figure 2), inverting parts of the PNG margin [
6]. Late Oligocene to Early Miocene extension rapidly unroofed high-grade metamorphic rocks [
5] during the rifting and deposition of carbonates, which was recorded in the field and on seismic data, e.g., [
7]. The extension led to regional subsidence of the margin.
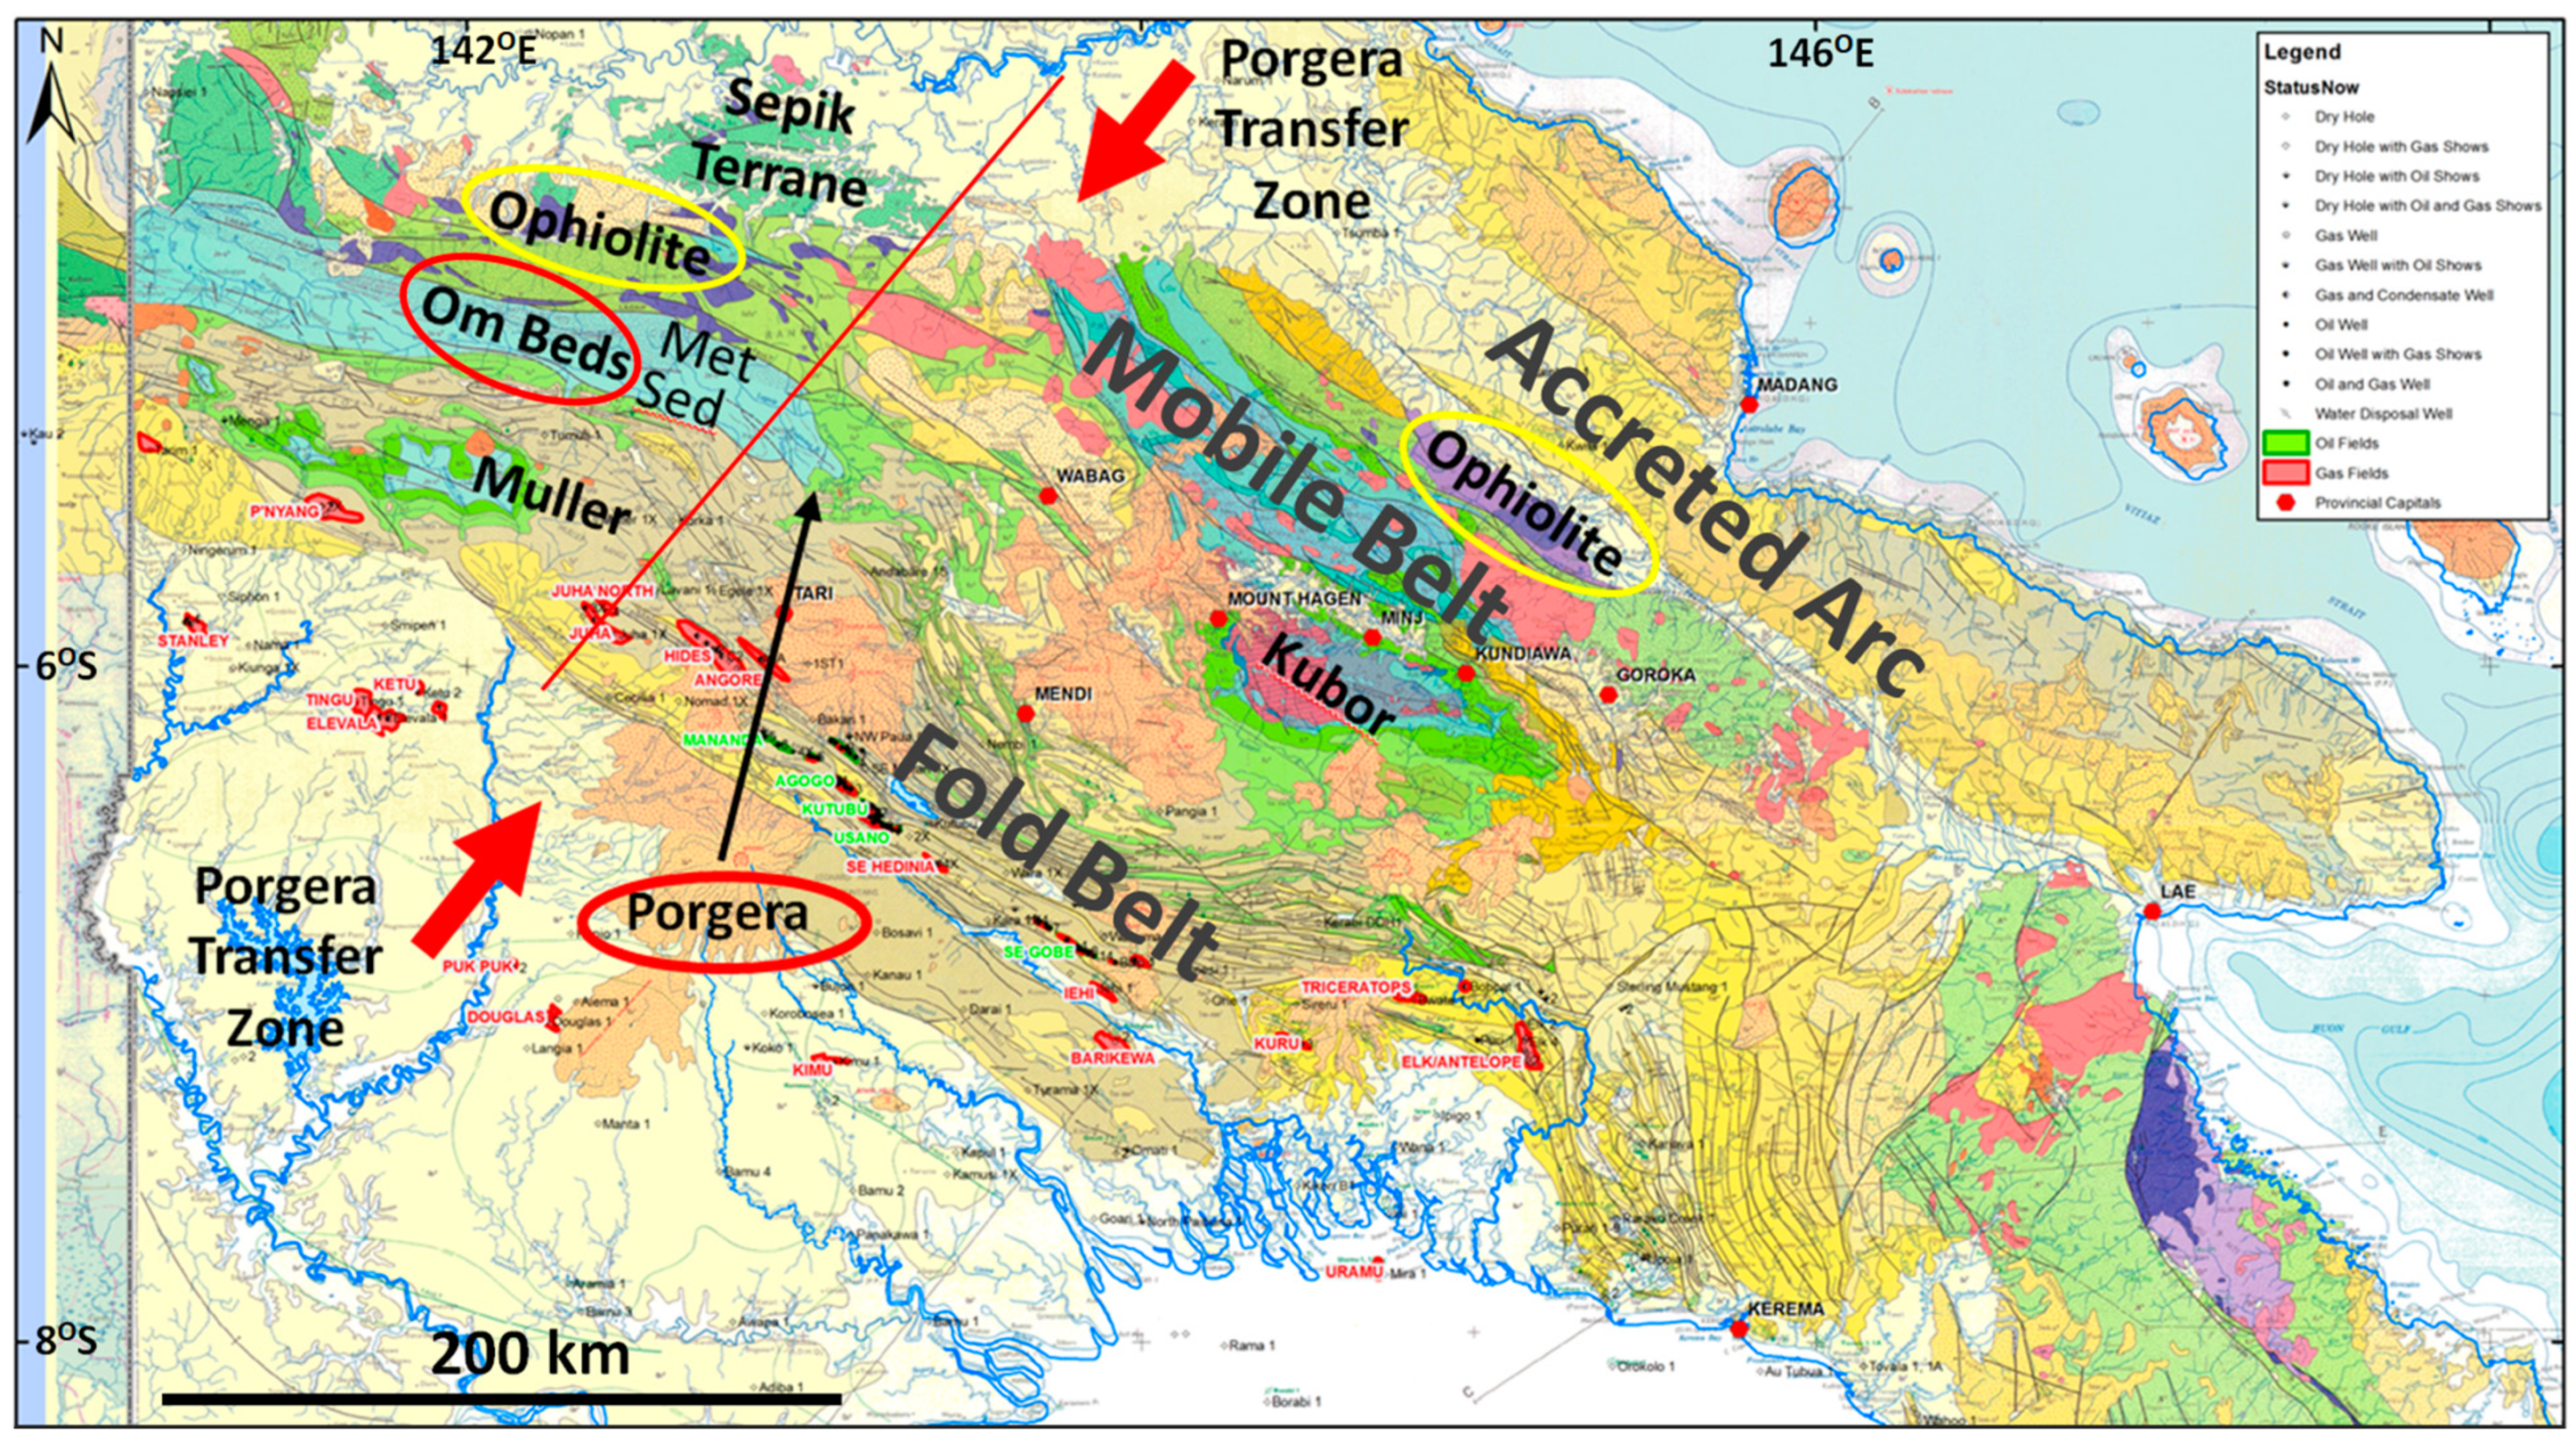
Figure 2.
Geological map of western PNG showing the location of the Porgera Transfer Zone and how it records offset of the ophiolites (purple) by over 50 km. The red line shows the location of the cross-section in Figure 4. Note the location of the Jurassic Om Beds that formerly filled the Om Basin. The map is based on the 1:1,000,000 geological map of PNG published by the BMR [
8]. In general, mauve is Triassic, blue is Jurassic, green is Cretaceous, pale brown and yellow are Tertiary (mainly Miocene), pale yellow is Pliocene to Recent, purple is ultramafics and pink is intrusives.
The ongoing rapid northward movement of the Australian Plate generated subduction to the south beneath the PNG margin in the Middle Miocene whilst there was continued subduction to the north remote from New Guinea, creating the Melanesian Arc. Along the PNG margin in the Middle Miocene, there was substantial volcanism associated with emplacement of the Maramuni Arc above the >800 km wide southward-subducting slab shown schematically in
Figure 1 and recorded on earthquake and tomographic data [
9,
10,
11]. The Melanesian Arc collided obliquely with the PNG towards the end of the Middle Miocene e.g., [
12] causing Late Miocene to Present orogenesis and compression.
The Maramuni Arc volcanism declined significantly with the onset of arc–continent collision. However, traversing the Fold Belt, there are some lines of volcanoes, such as the Bosavi lineament and the Pliocene volcanic stocks that trend younger to the south [
13]. Corbett [
14] and Hill et al. [
15] suggested that these lines were controlled by an underlying NNE-trending fabric in basement, within which there were local reactivated NNE-trending shear zones.
Alternatively, Holm et al. [
2,
16], in their Pocklington Trough model, proposed that the Sepik Terrane was >1000 km NE of the PNG margin in the Early Miocene and lay above the north-dipping Pocklington Trench. Northward subduction continued at the Pocklington Trench, thereby creating the Maramuni Arc above it, until the overlying Maramuni/Melanesian arc, including the Sepik terrane, collided with the PNG margin in the Middle Miocene. Holm et al. [
2] inferred that delamination of the north-dipping Pocklington slab resulted in adiabatic melting and emplacement of the ore-bearing intrusives.
The Porgera deposit is a 974-metric ton Au, low sulfidation, alkali epithermal gold deposit spatially associated with stocks of the mafic–alkalic Porgera Intrusive Complex (PIC) [
17]. In a transpressional orogenic setting linked to continent–island arc collision [
17], the PIC was emplaced at 6.0 ± 0.3 Ma [
18] into friable black mudstones of the Chim Formation of uppermost Cretaceous age [
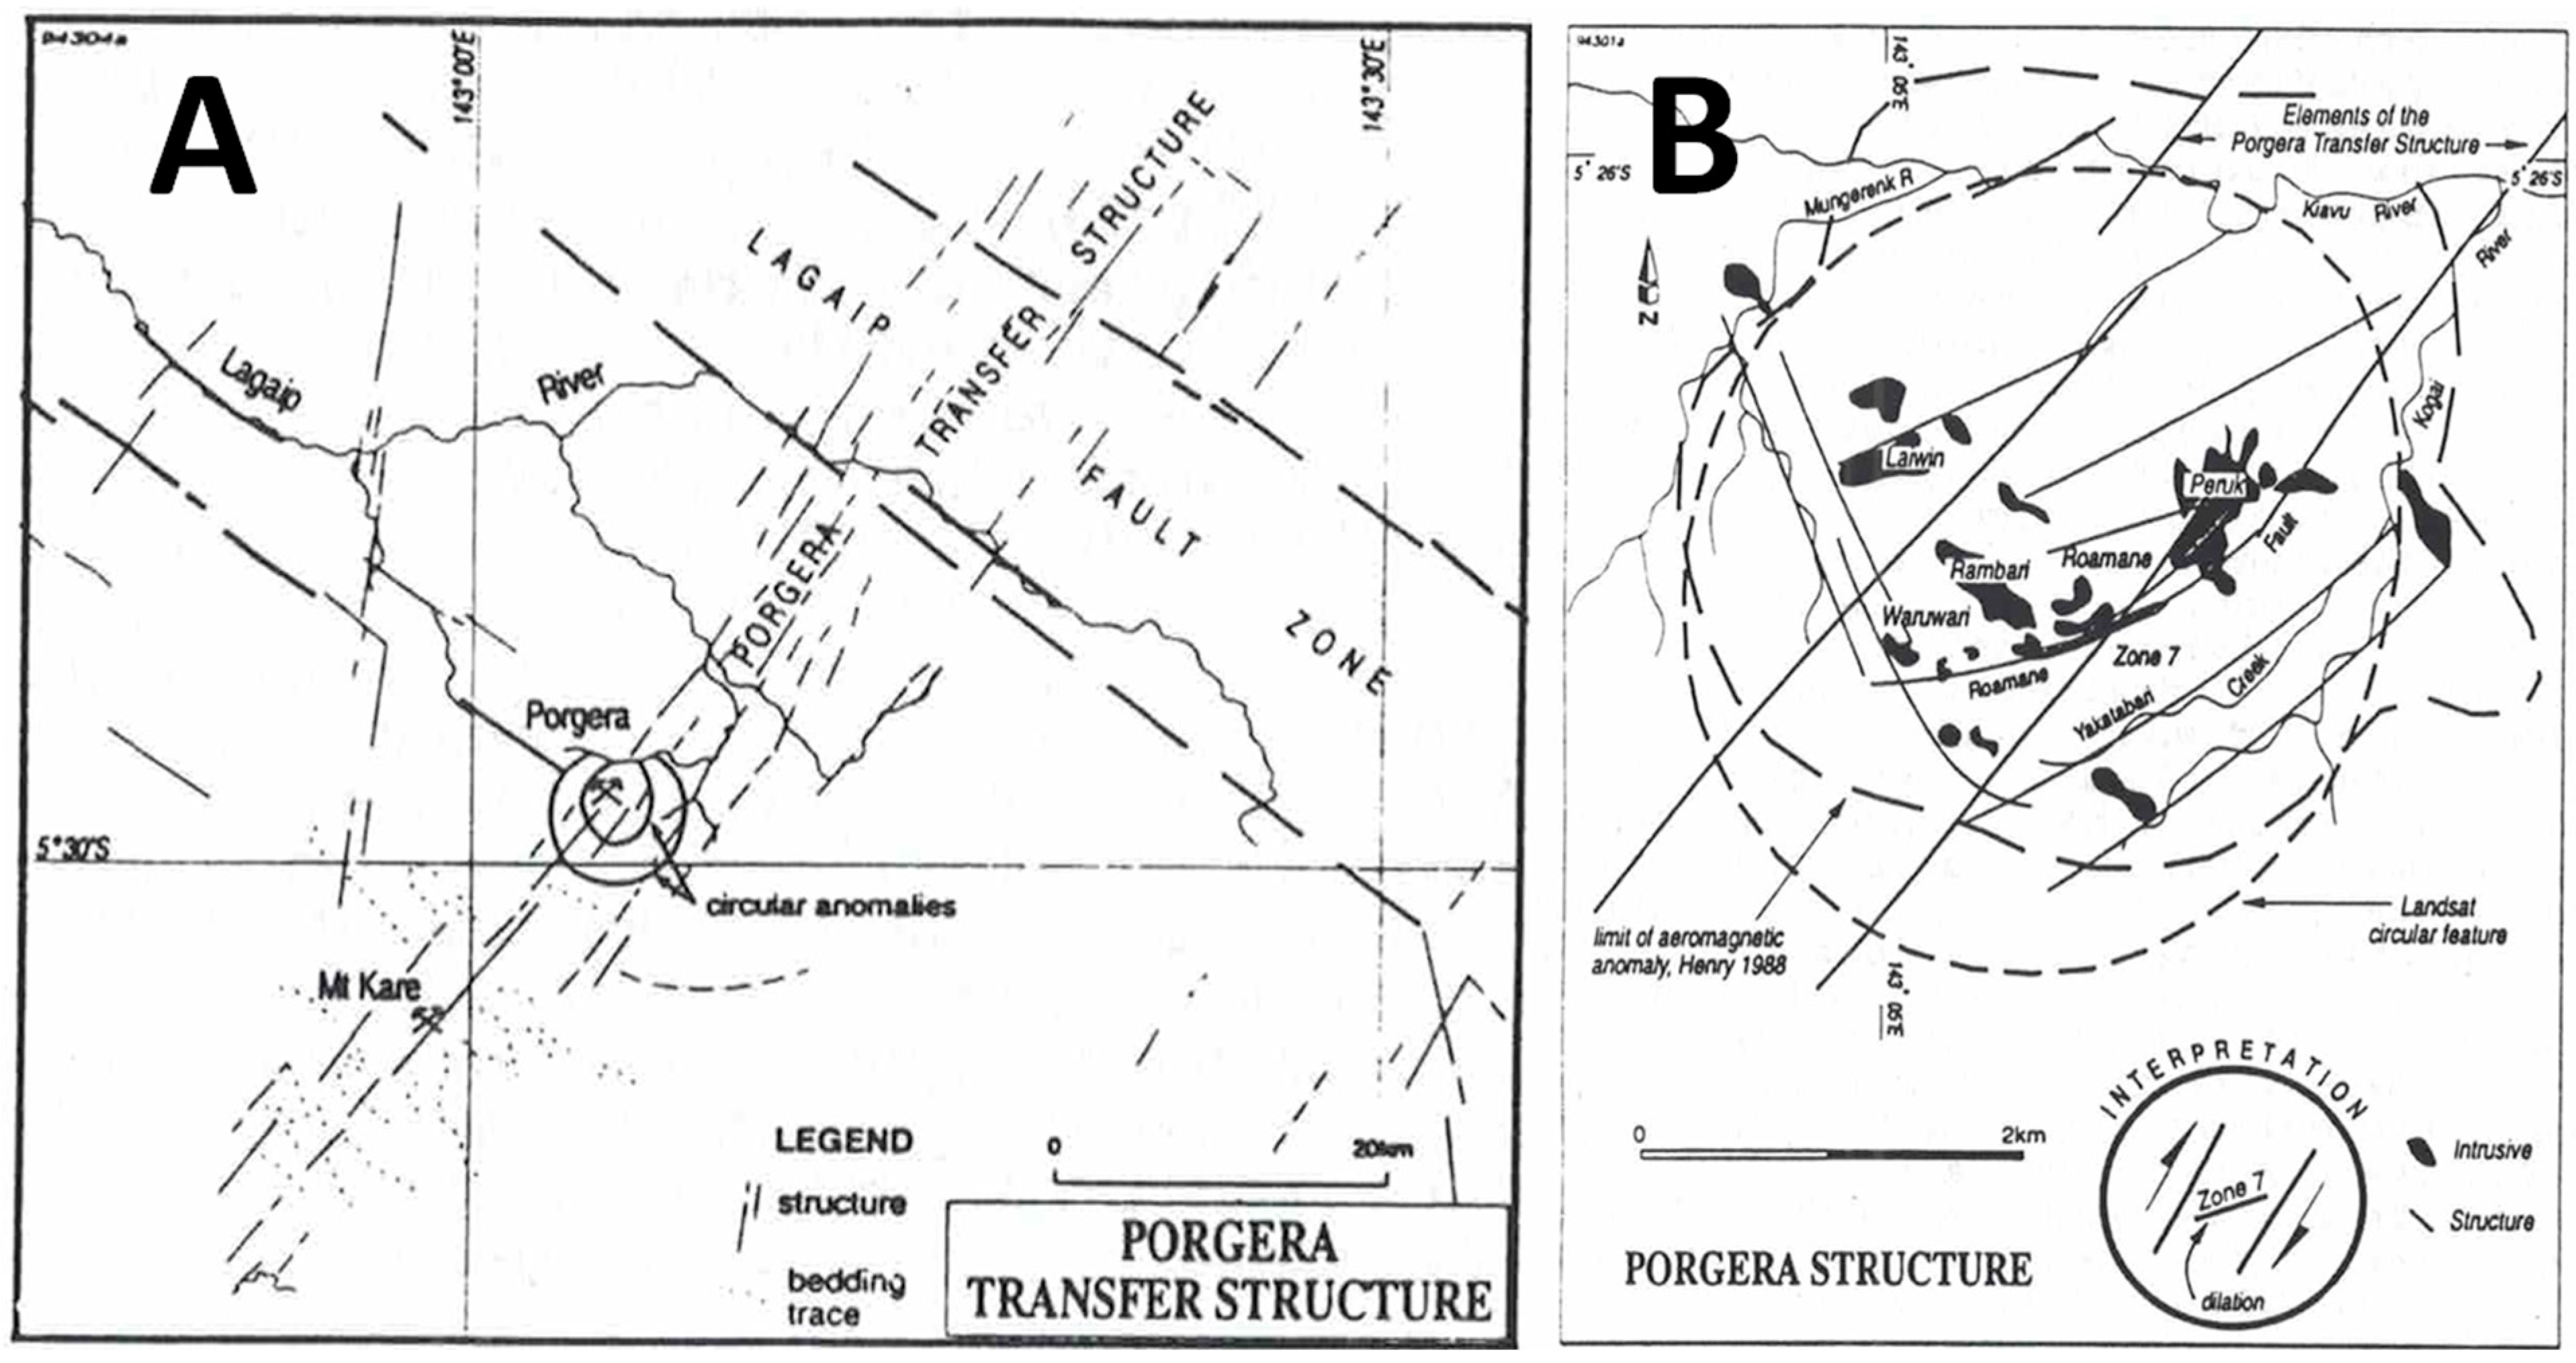
19]. Hay et al. [
17] suggested that a deep-seated arc–normal transfer structure, the Porgera Transfer Zone [
14], controlled intrusion emplacement through the creation of a localized extensional environment favourable for magma ascent (
Figure 2 and
Figure 3). Richards [
20] suggested a slightly different tectonic model in which arc continental collision resulted in small-volume partial melting of previously subduction-modified mantle in a back-arc environment. Richards [
20] stated that the Porgera deposit is exceptional in containing a large zone of very high-grade, fault-controlled gold mineralization caused by efficient channelling of fluids up the fault zone that combined via flash-boiling during seismic fault events over an extended vertical range. Peterson and Mavrogenes [
21] similarly attributed the high-grade gold enrichment at Porgera to pressure release due to fault failure.
2. Structural Setting
The Porgera Transfer Zone (PTZ) is readily apparent on a geological map (
Figure 2). It coincides with the eastern plunging nose of the basement-cored Muller Anticline and the plunging nose of the Jurassic syn-rift Om beds (
Figure 2). It aligns with the eastern edge of the Sepik Terrane and with a >50 km sinistral offset of the leading edge of the ophiolites (see [
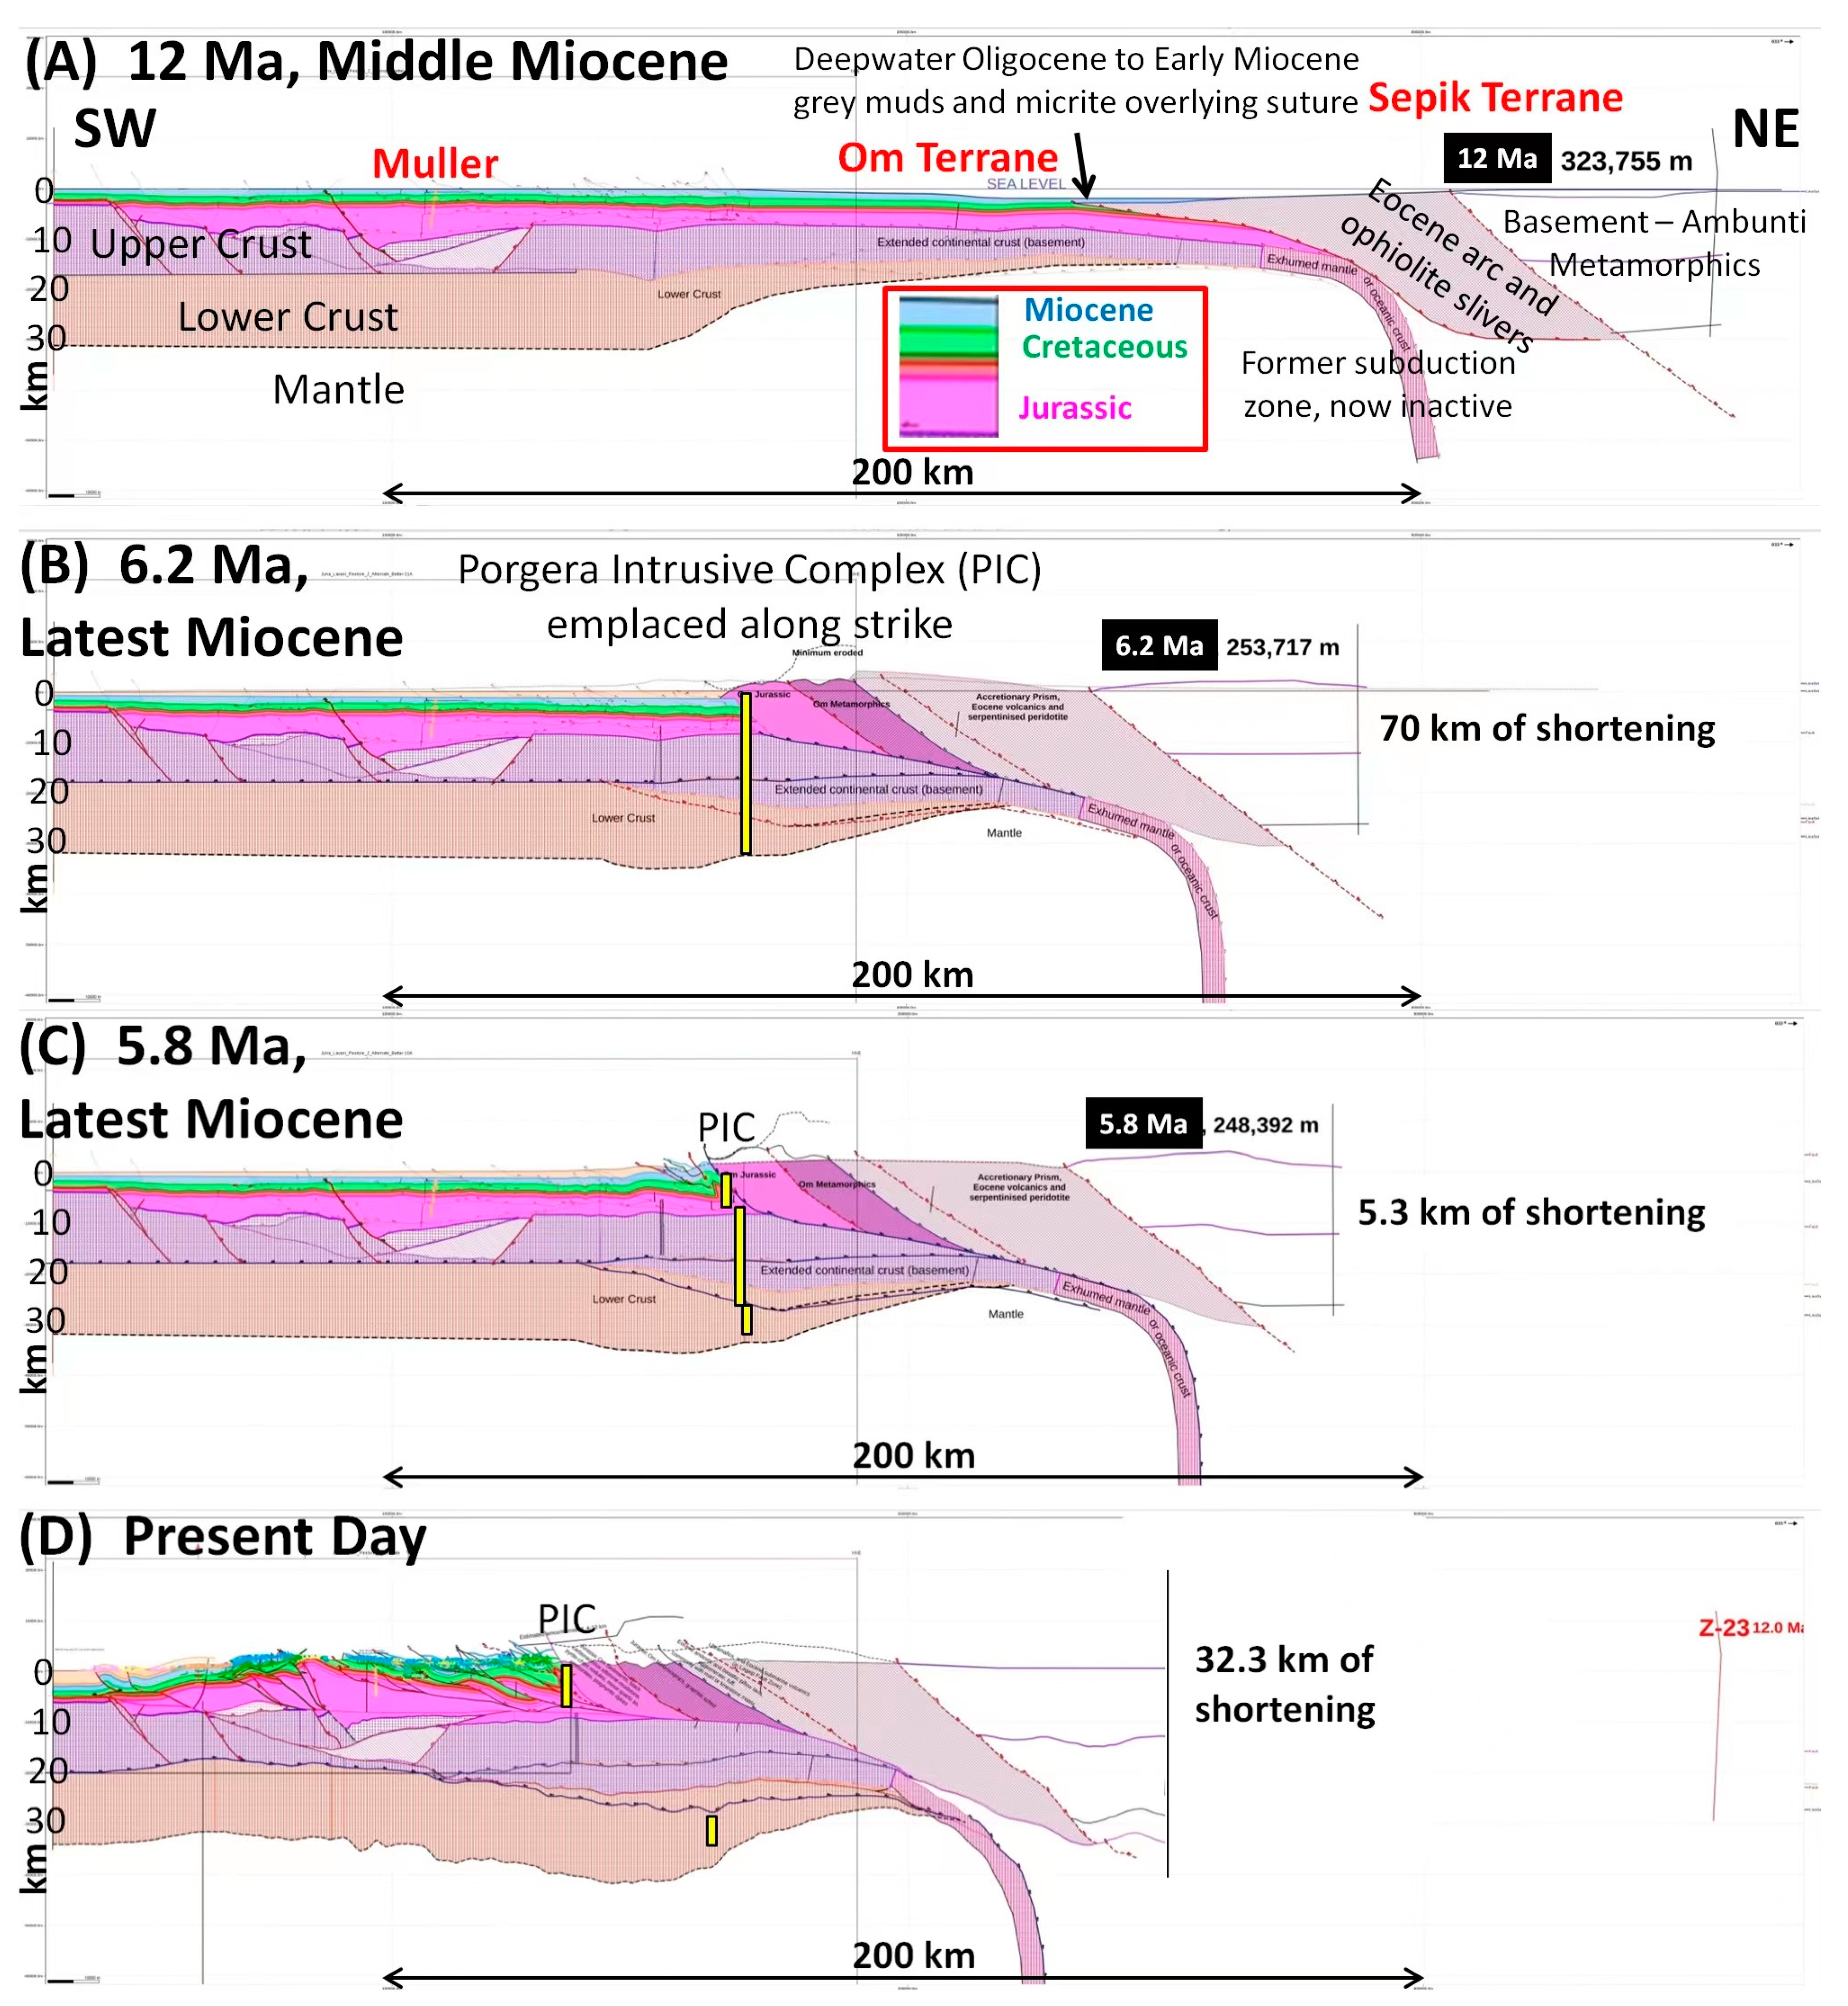
15] for more details), demonstrating its significance as a crustal-scale fault system. A regional cross-section was constructed from the Juha Anticline at the leading edge of the Fold Belt to the Sepik Terrane and was balanced and restored [
22]. The section is shown in
Figure 4, and its position is shown in
Figure 1 and
Figure 2, ~25 km west of the PTZ and parallel to it. In these sections, the Sepik Terrane comprises metamorphic basement and an Eocene accretionary prism (Eocene arc and ophiolite slivers) that docked with the PNG margin in the Oligocene [
5,
6].
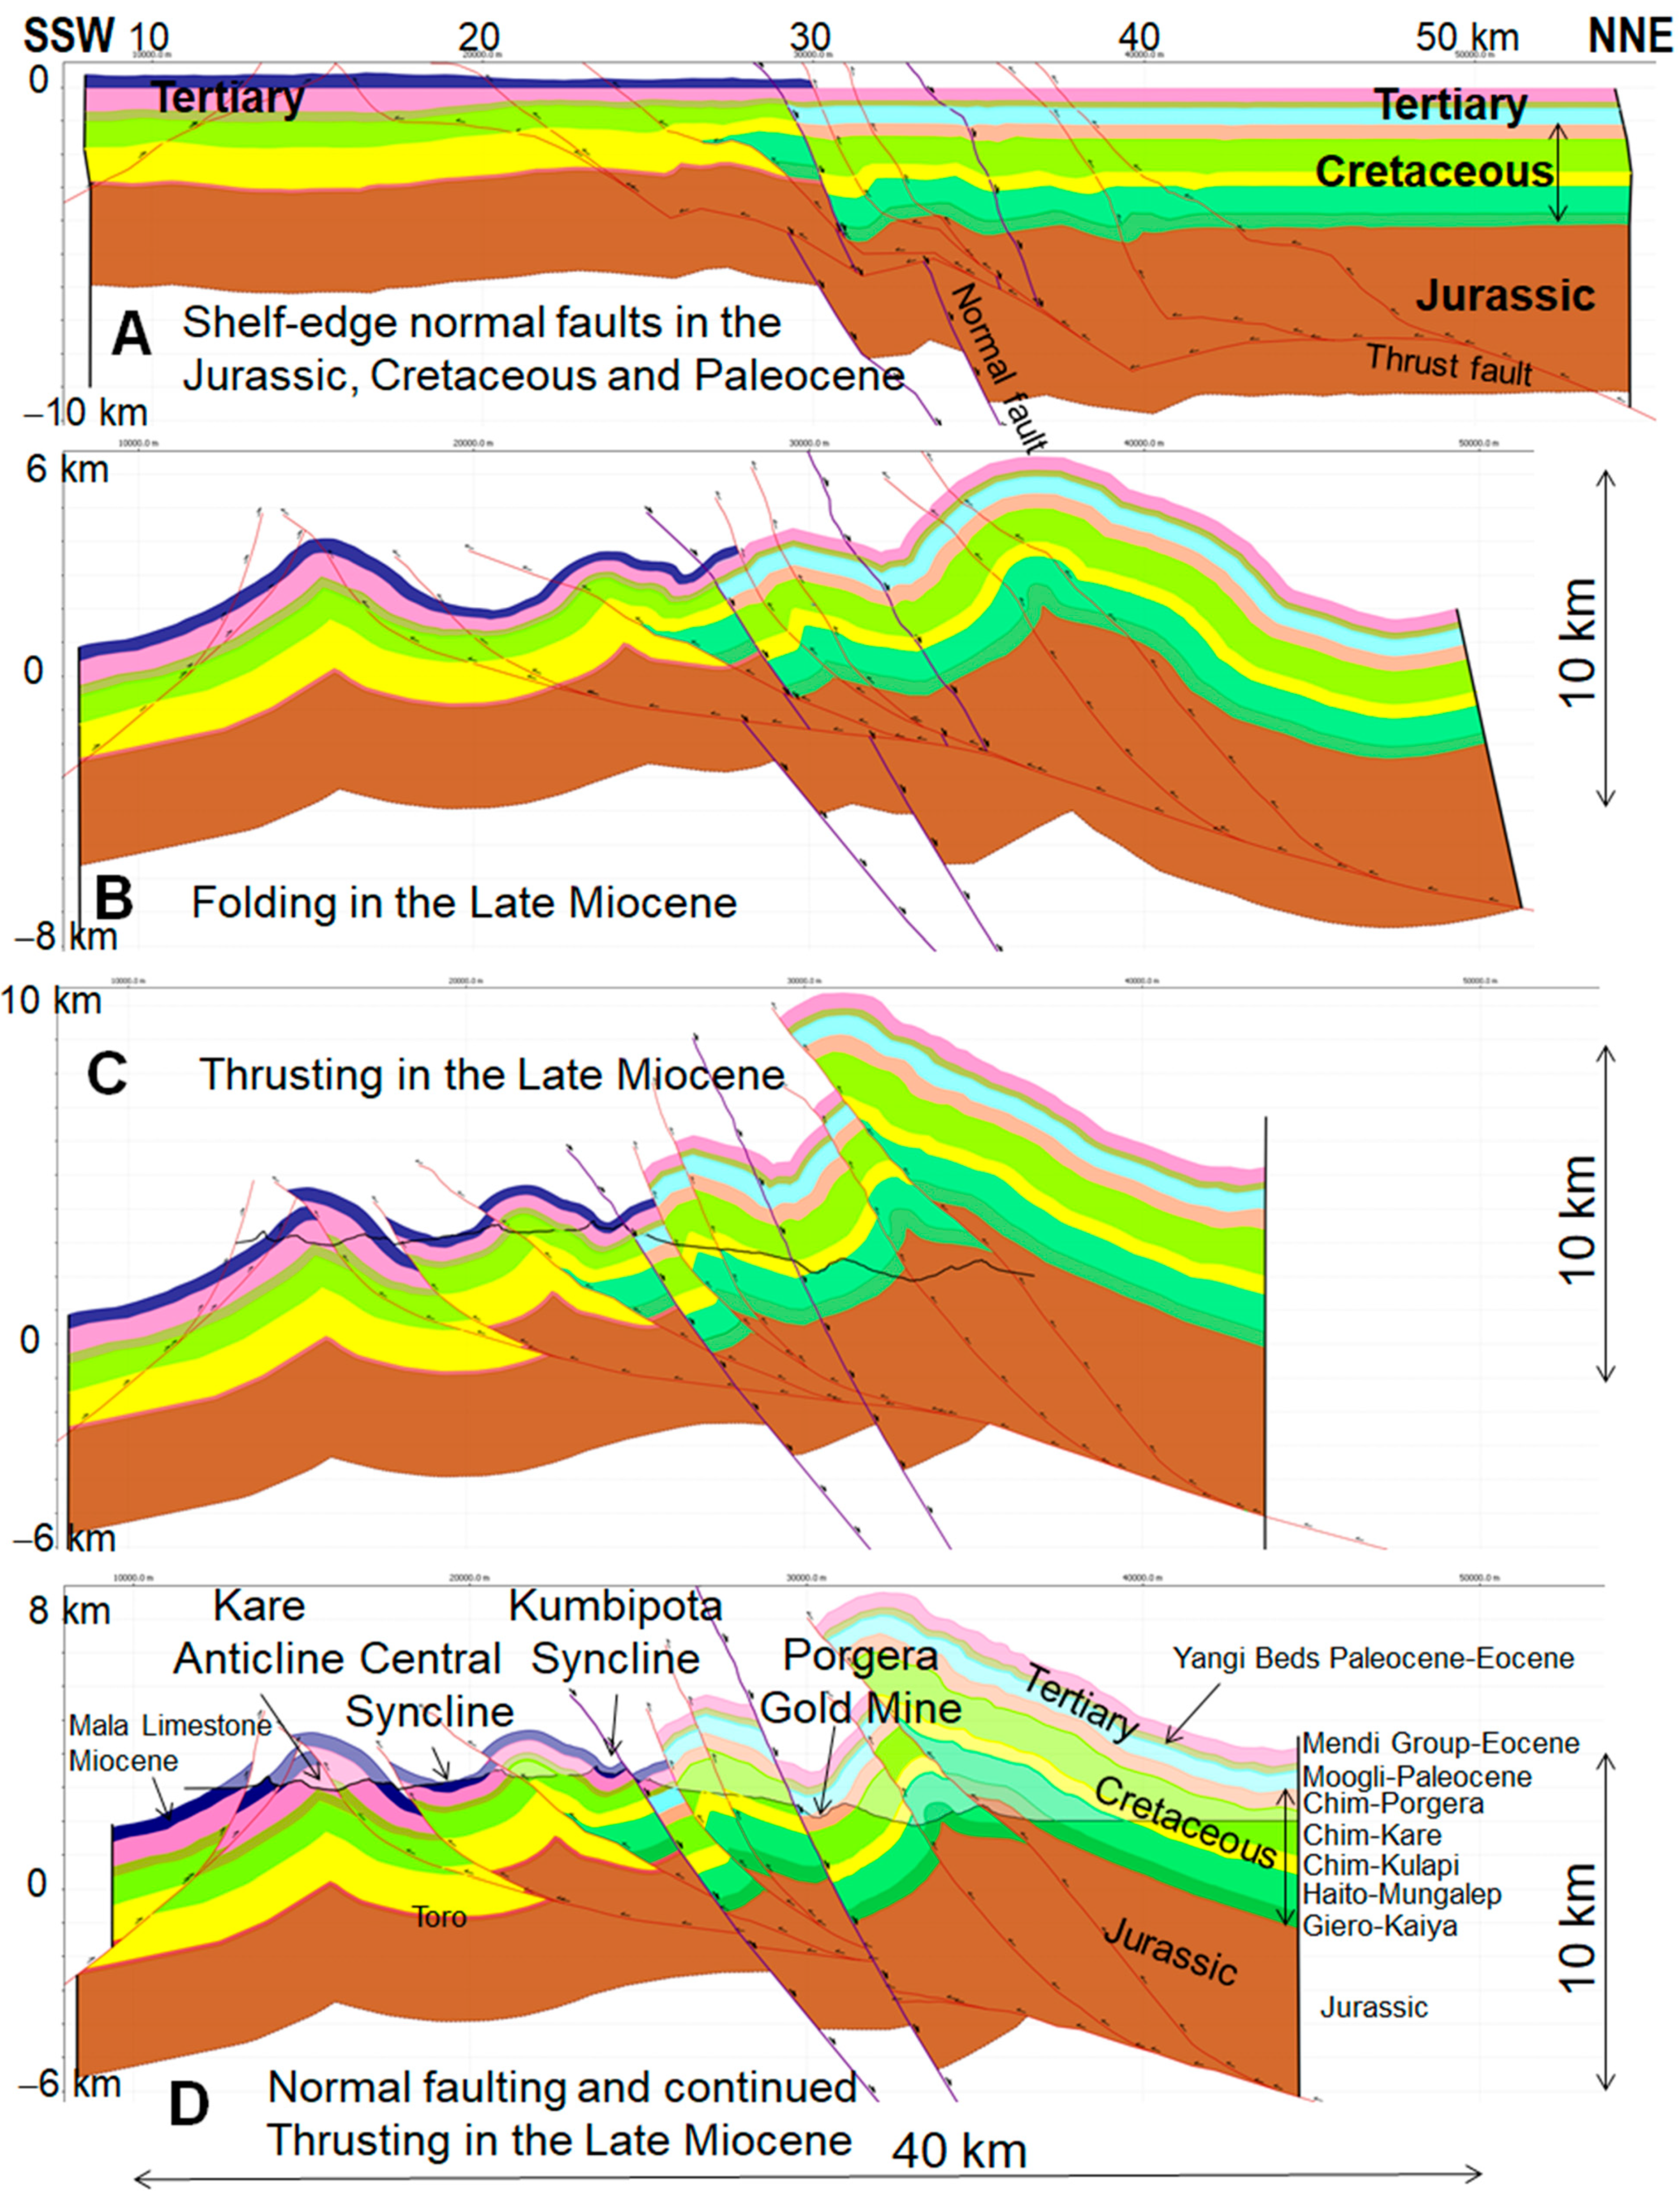
Section A shows the pre-compression geometry of the margin at ~12 Ma (
Figure 4). The section shows large extensional rift faults in the Jurassic beneath the Muller Anticline. Similar faults probably occur further north, including in the Porgera area, but they are unproven. The upper and lower crust are interpreted to thin towards the north as part of the Jurassic and Cretaceous rifting and break-up processes. The Cretaceous sequence is inferred to be relatively constant in thickness, but there may be extensional faults and growth sequences in the northern region above the thinned crust. The Miocene sequence is also relatively constant in thickness, consistent with the regional subsidence of the margin, but it thins to the north where it passes from reefal carbonates into deep-water mudstones. Importantly, some of these muds and micrites are interpreted to lie across the suture between the Ophiolites/Eocene volcanics of the Sepik Terrane and the PNG margin sediments. The Jurassic rift faults with growth sequences are significant, as they are considered to have been active in the Porgera area (see below).
Around 12 Ma, the Melanesian Arc collided with the northern edge of the Sepik Terrane and shunted it onto the PNG margin (Section B,
Figure 4). There was relatively little shortening within the Sepik Terrane itself, but from 12 Ma to 6.2 Ma, there was ~70 km of shortening of the PNG margin. This shortening was mainly within the Om Beds, the northern portion of which was substantially uplifted and eroded, exposing medium to high-grade metamorphic rocks at the surface. However, there was a similar amount of shortening and thickening of the crust beneath the Om Beds, here shown schematically as a triangle zone in basement. Please note that the PIC was emplaced along strike at ~6 Ma during maximum compression. It is here shown schematically as an intrusive from the mantle.
From 6.2 Ma to 5.8 Ma, during emplacement of the PIC, the section was shortened by a further 5.3 km, as shown in Section C. The thrusting would have dismembered the igneous pipe that fed the PIC, as shown schematically in Section C. From 5.8 Ma to the Present, there was a further 32.3 km of shortening within the PNG Fold Belt, as shown in section D and in more detail in Hill et al. [
22]. The igneous pipe that fed the PIC was probably further dismembered, and it is not shown in detail here.
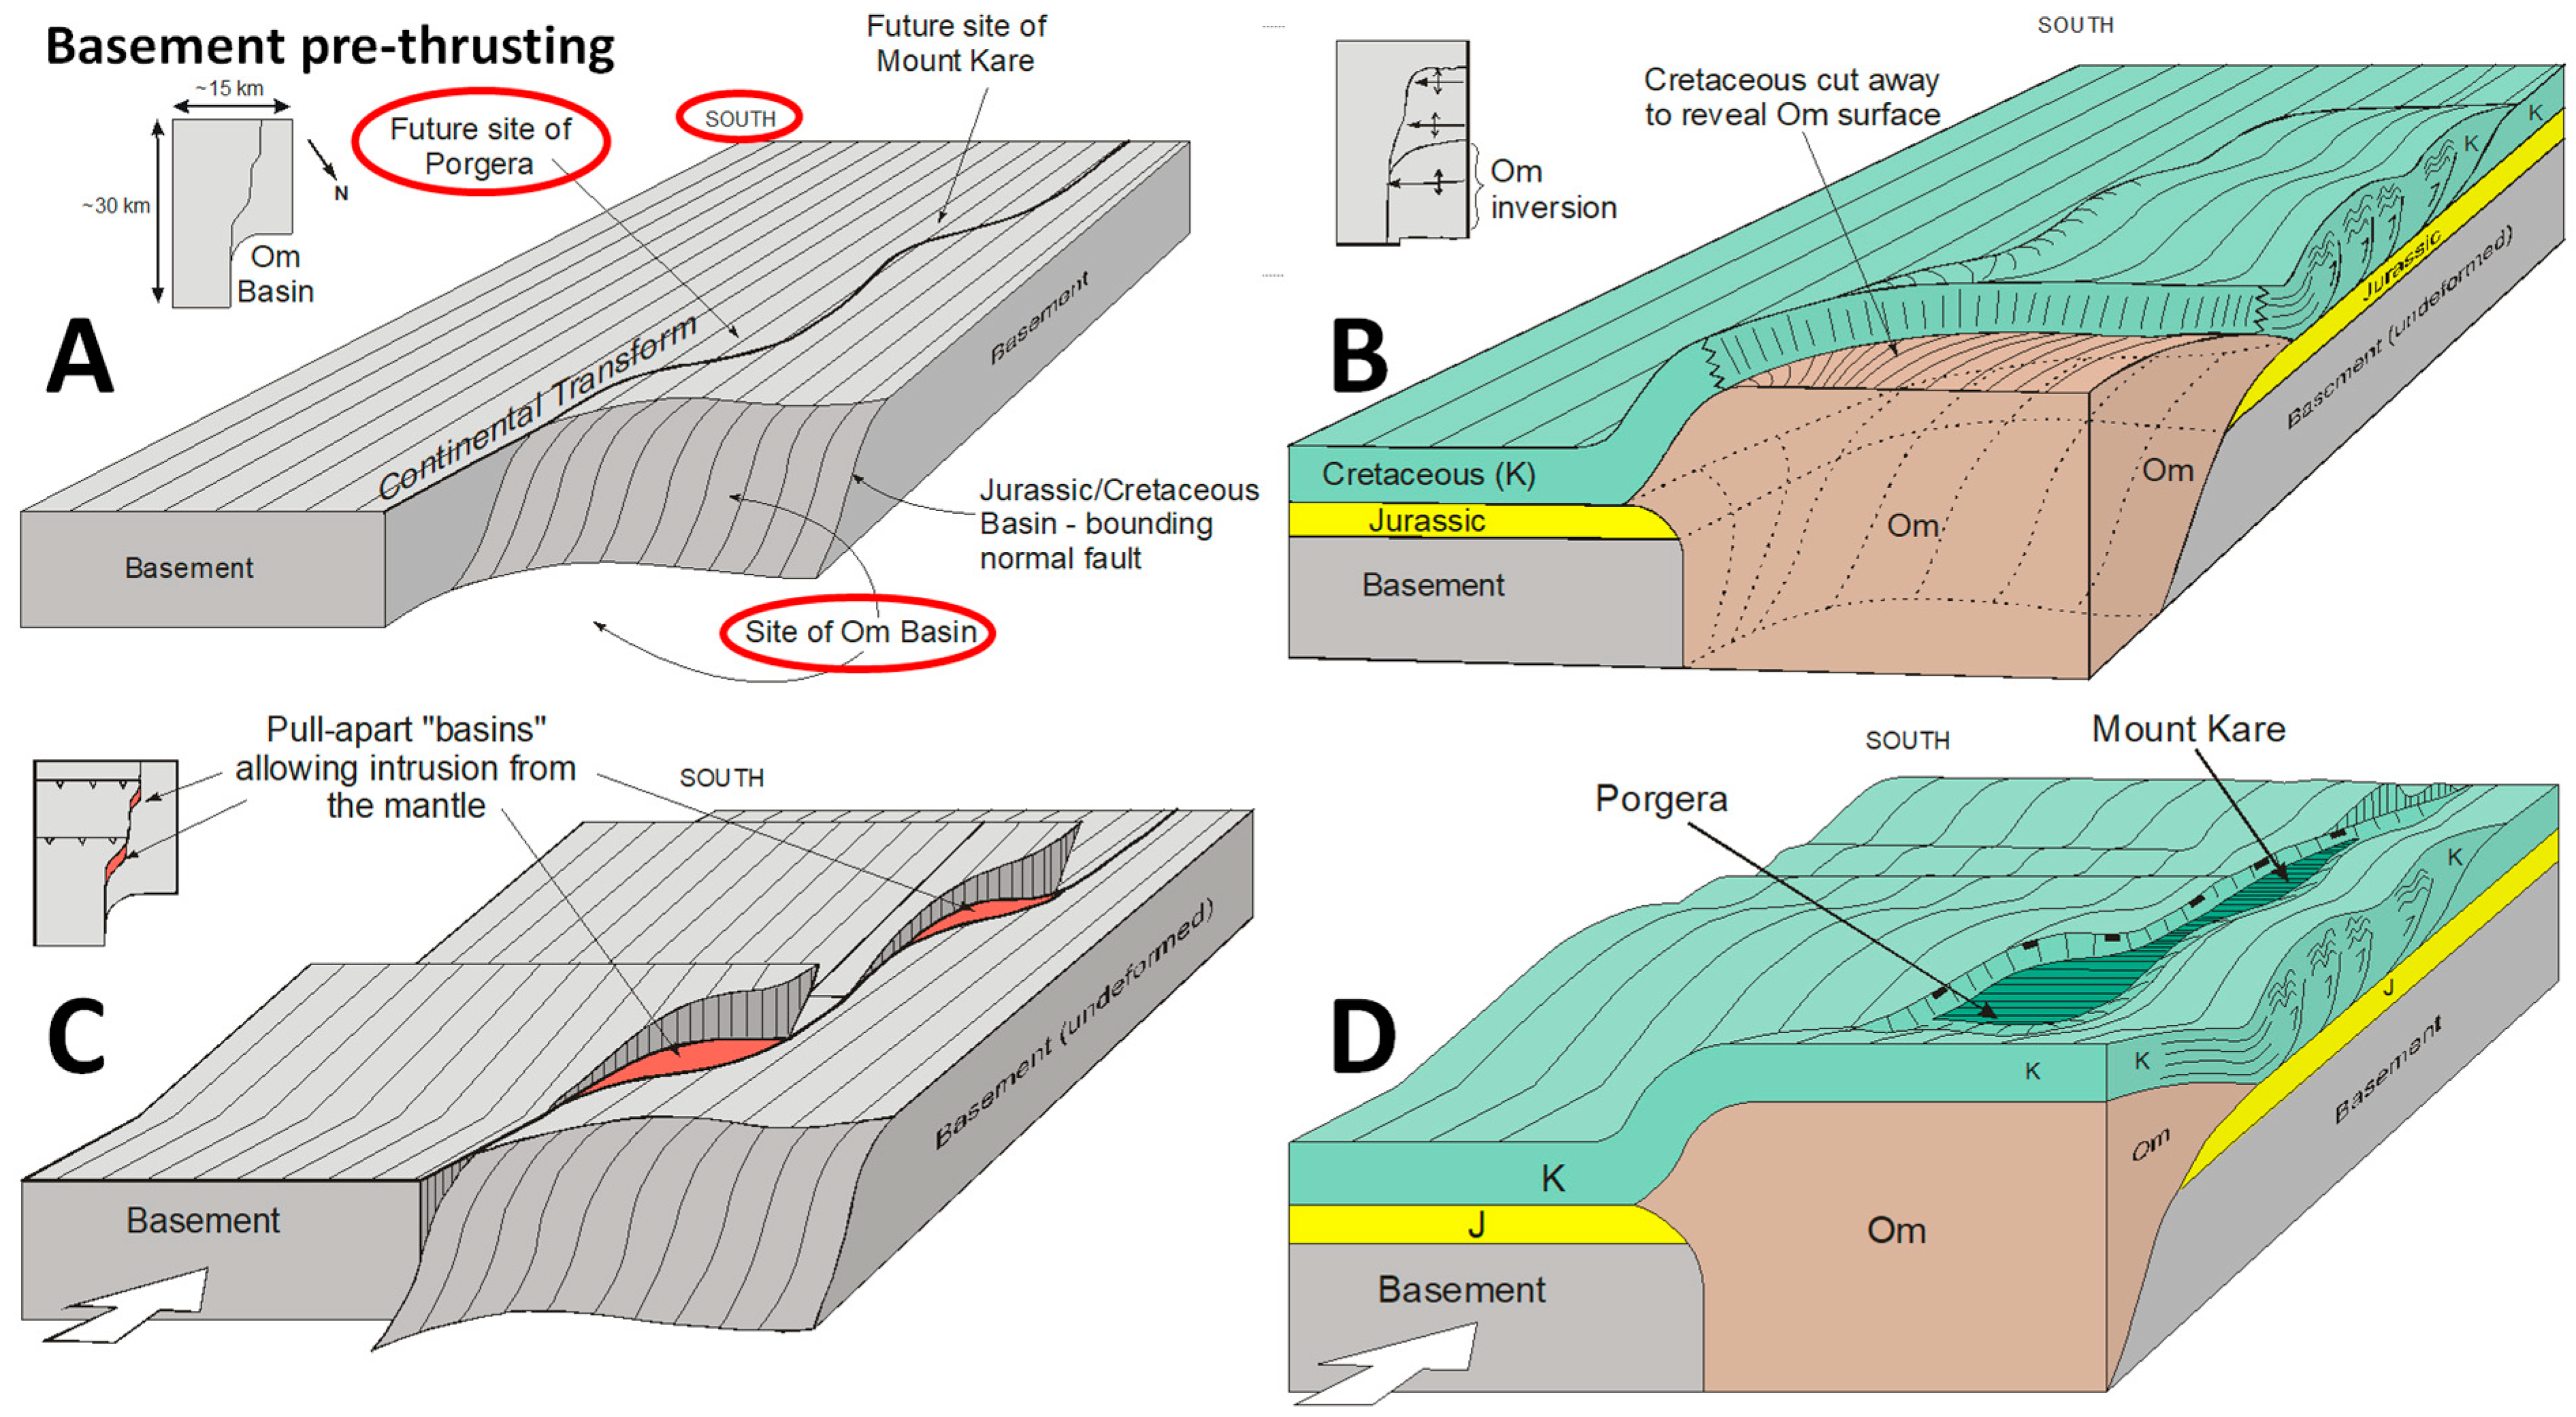
3. A Conceptual 3D Tectonic Model for Emplacement of the Porgera Intrusive Complex
Figure 4 shows that the PIC was emplaced during a time of maximum compression; thus, a model is needed to provide dilation so that the magma can ascend through the thickening crust. Hill [
23] suggested that this was caused by differential movement across the PTZ, reactivating an old basement fault zone (
Figure 5).
Figure 5A shows a 3D view and sketch-map of the continental crust (basement) looking to the south across the PTZ. During Jurassic rifting, the margin had a step-shape such that there was an embayment with oceanic crust in the Om region adjacent to normal-thickness or thinned crust to the east, which was a continental promontory. This is similar to the Jurassic oceanic crust of the Argo Abyssal Plain next to the continental promontory of the Exmouth Plateau on today’s NW Shelf of Australia. The Jurassic, Cretaceous and Paleogene/Miocene sediments were deposited across the margin, with substantial thickening of the Om Beds into the embayment. For simplicity, the Paleogene/Miocene sediments are not shown in
Figure 5B,D.
At the onset of compression in the Middle Miocene, it is inferred that the Om beds were inverted, causing thin-skinned compression of the Cretaceous and Tertiary sequence to the south, as shown in
Figure 5B. Probably at the same time, there was substantial shortening of the continental promontory to the east of the PTZ, as shown in basement in
Figure 5C. Small jogs or relays across the PTZ led to the local development of strike–slip pull-apart basins along it, allowing intrusive rocks from the mantle to ascend.
Figure 5D shows the combined effects of B and C. At the same time as folding and thrusting occurred both to the east and west of the PTZ, there was extensional collapse into the local pull-apart basins along it. The rising magma encountered shattered Mesozoic and Tertiary sediments within the collapse grabens, and gold was precipitated in the uppermost Cretaceous and Paleocene shales in fault-controlled deposits, e.g., [
20].
4. Cross-Sections and a 3D Model: Testing the Structural/Tectonic Hypothesis
In order to define potential new areas for exploration, a semi-regional 3D geological model of the area was constructed using existing geological data and a new high-resolution LIDAR dataset. The 3D geology model and associated cross-sections also allow testing of the conceptual tectonic model by seeking evidence for synchronous extension and compression.
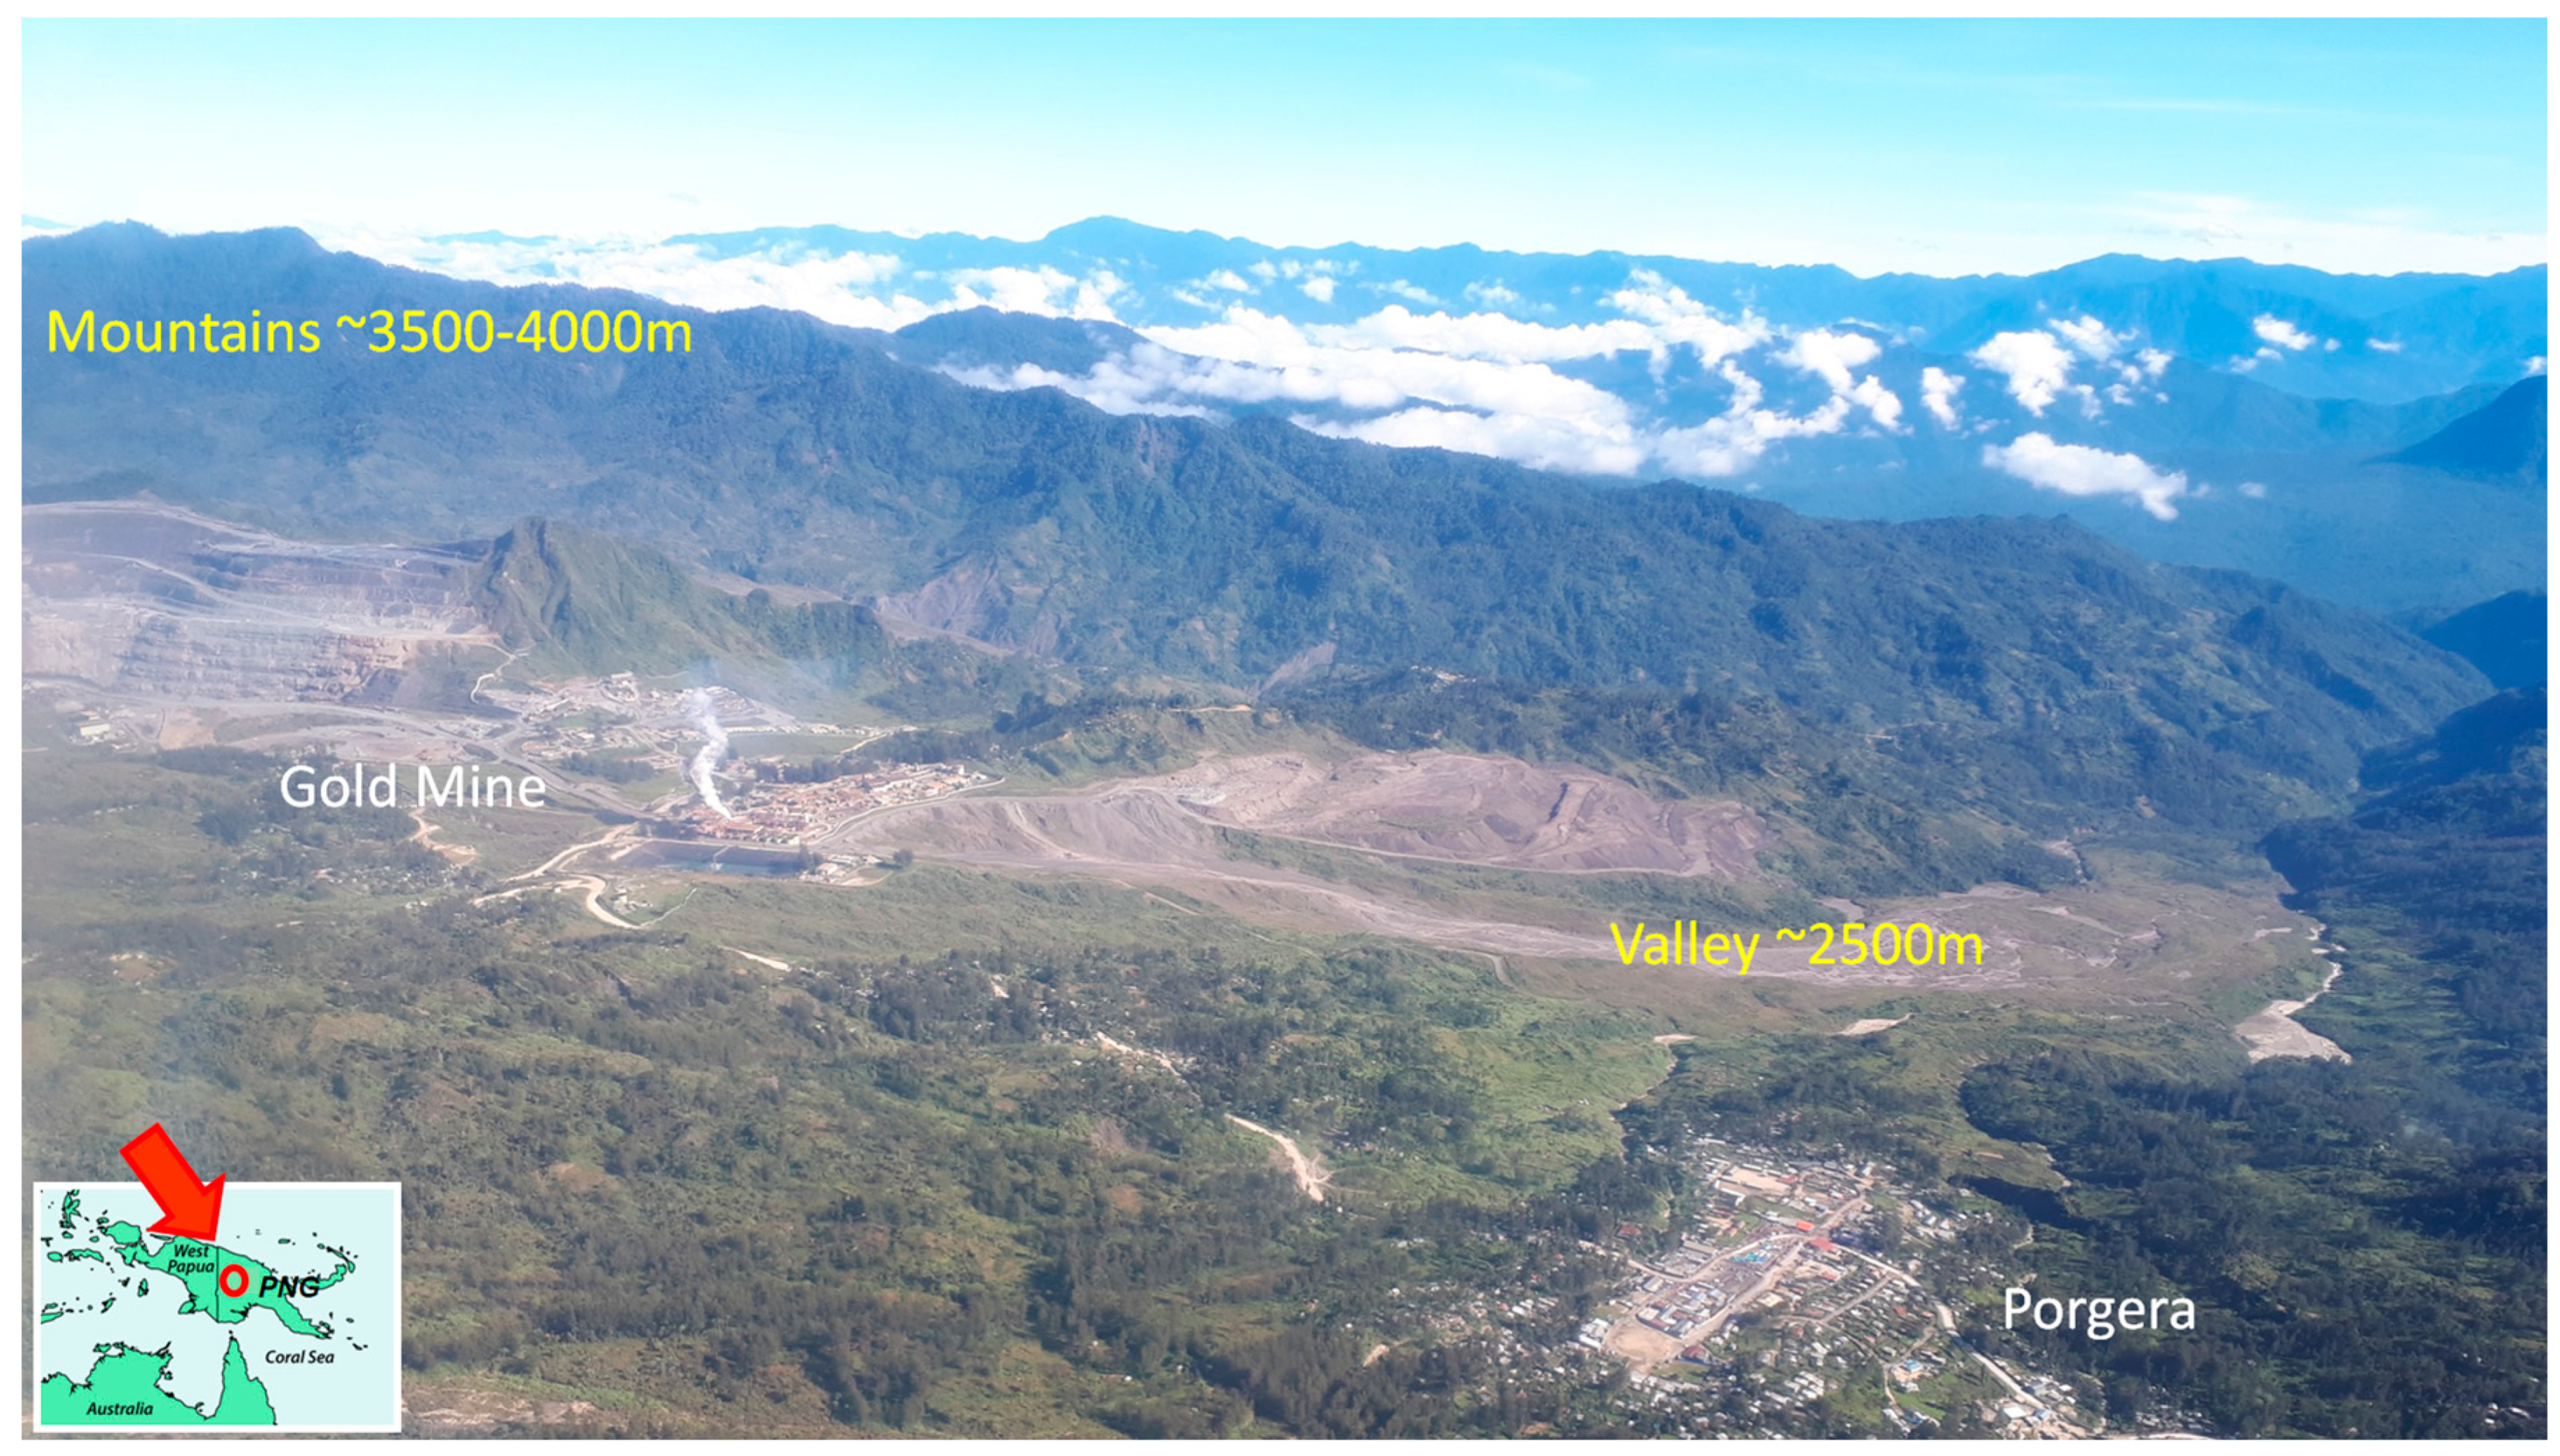
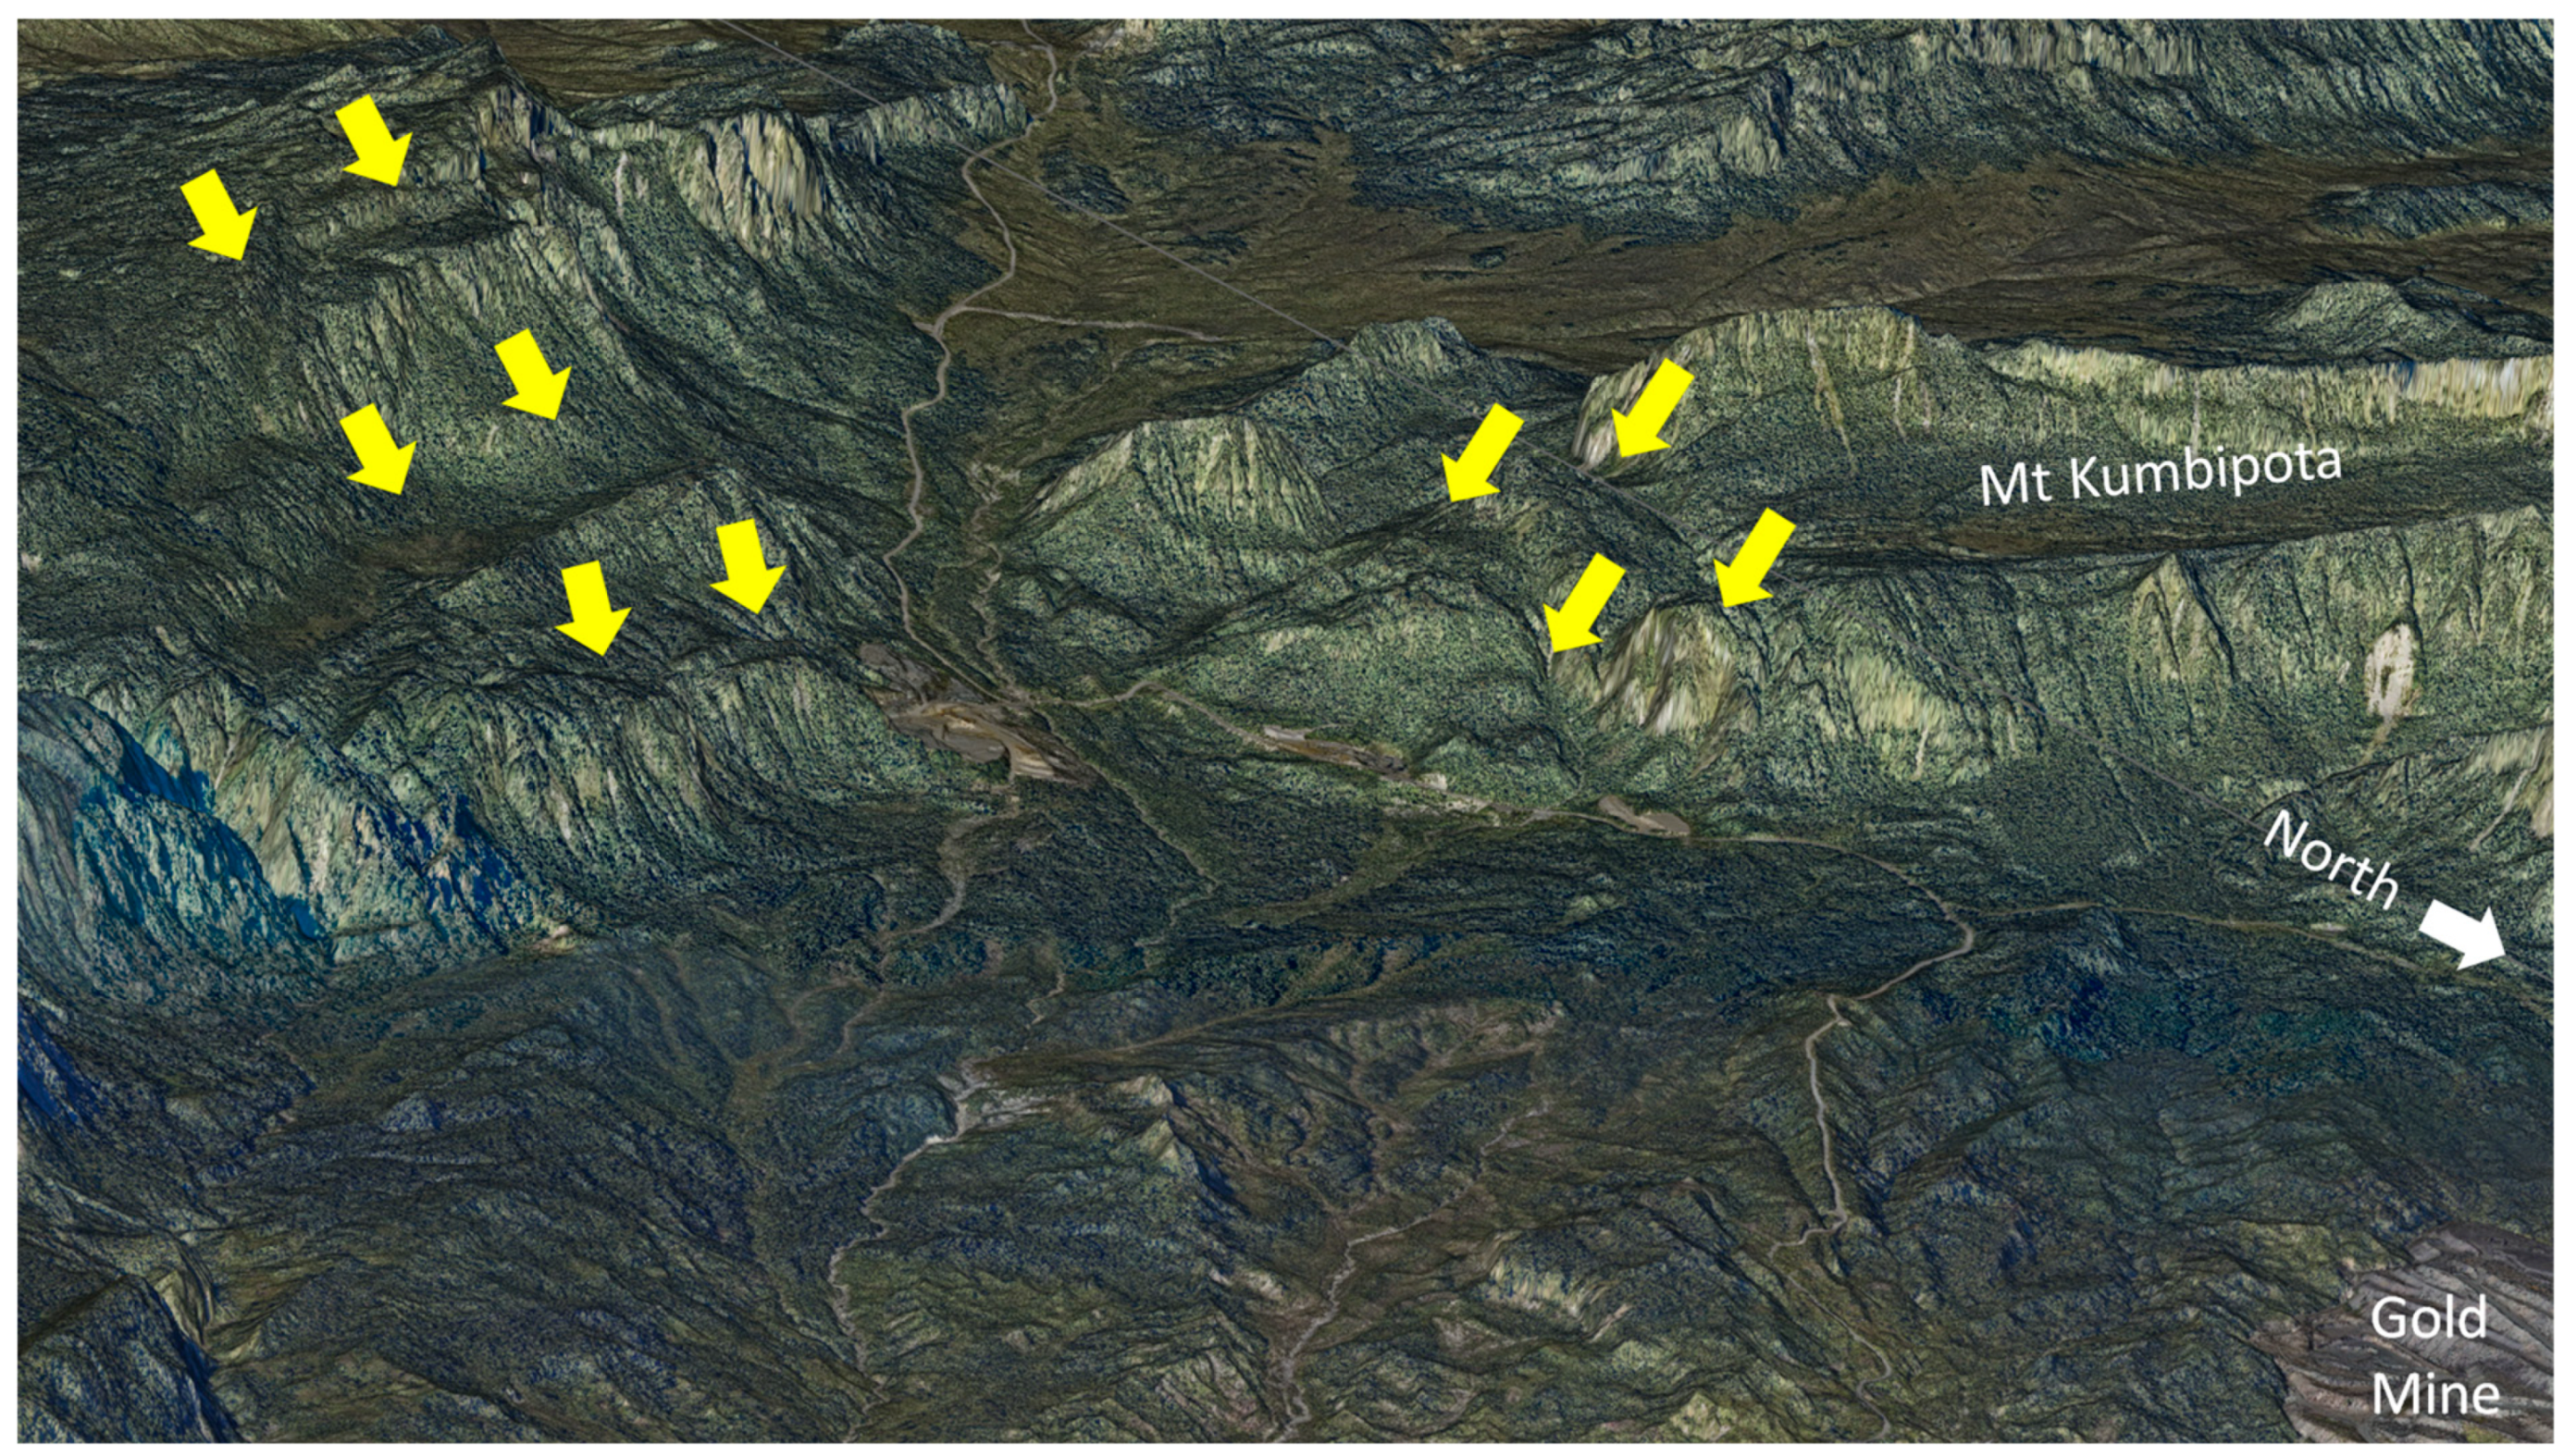
Within the Fold Belt, the Porgera Gold Mine lies in a valley at an elevation of ~2500 m surrounded by mountains at an elevation of 3500 m to almost 4000 m (
Figure 6). The terrain is mountainous with only one road and is heavily vegetated by either tropical forest or impenetrable, 2–3 m tall Kunai grass. Outcrop is generally scarce except in the cliffs and some creeks. Around the mine, there are many shallow boreholes that provide samples and stratigraphic sections [
24], but elsewhere, relatively few outcrops have been recorded, mainly by Thornton et al. [
25] and Davies [
26]. To improve mapping of the area, the Porgera JV acquired high-resolution LIDAR data and spectral imaging in a strip continuing for 25 km to the south of the mine (
Figure 7). The resolution on the LIDAR data is to less than one metre, and the datasets are vast.
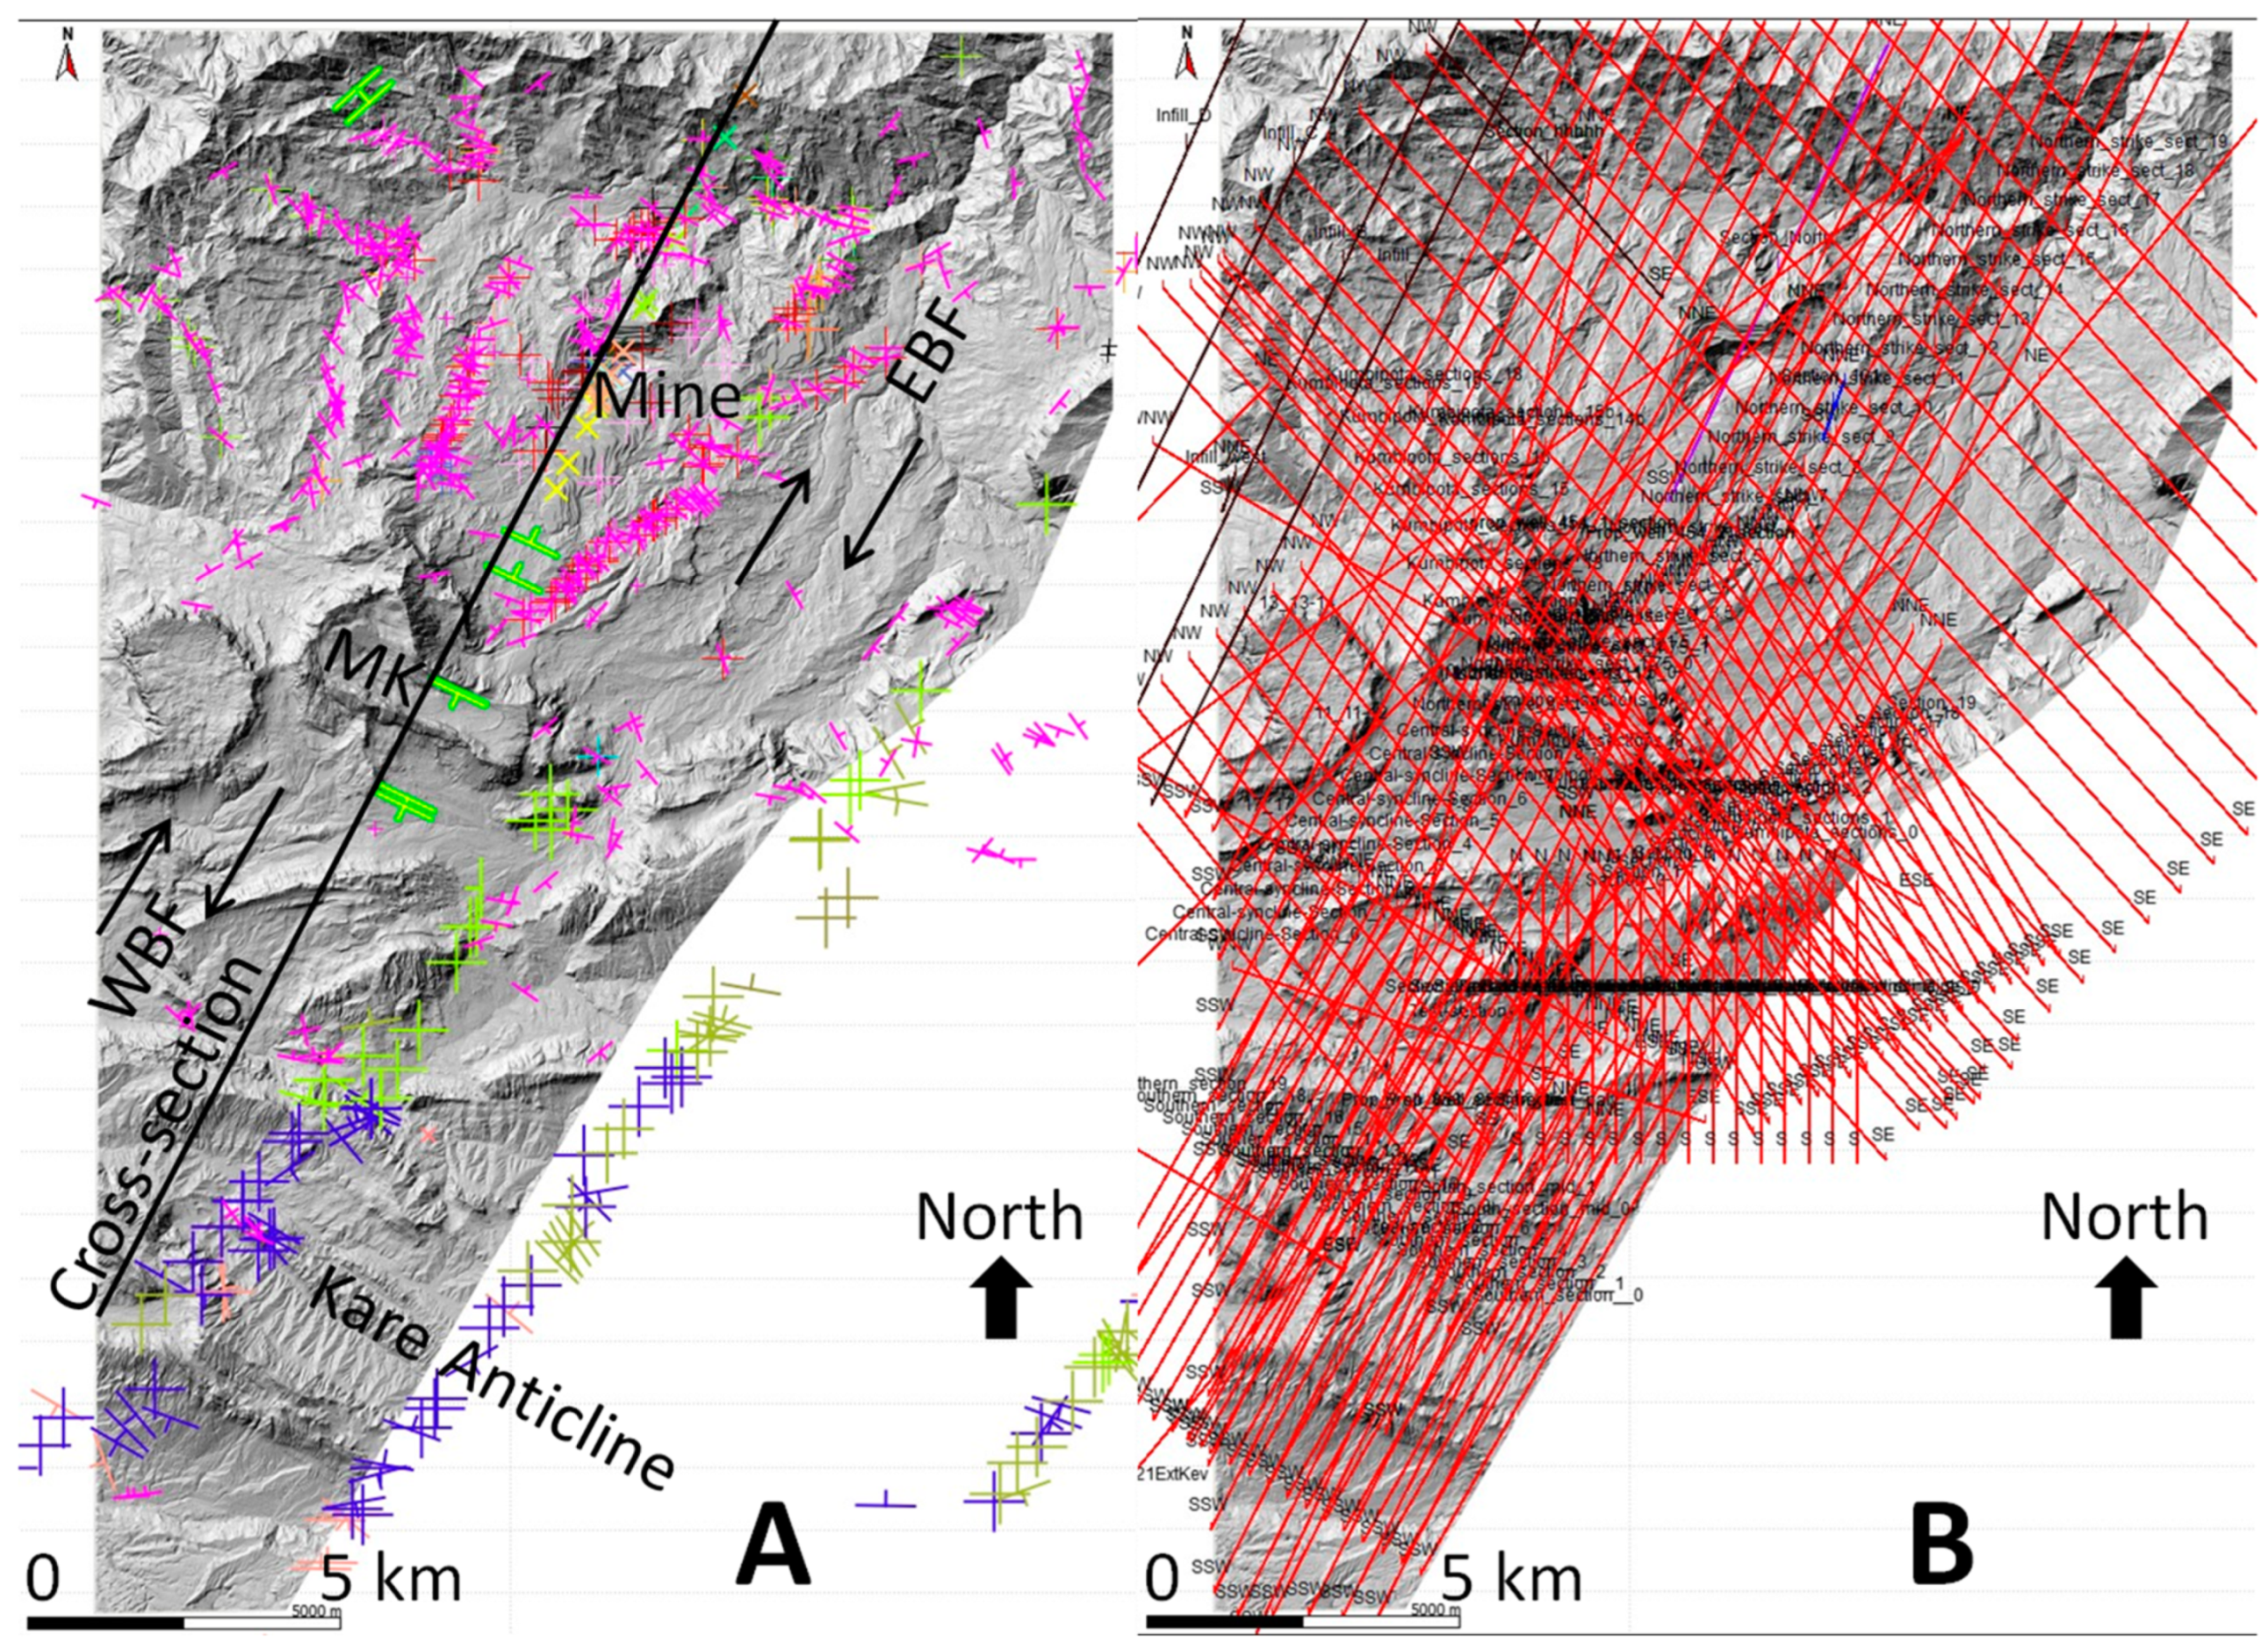
5. Methodology
All available field data for the area, including dips and dated outcrops [
25,
26,
27], were compiled into a spreadsheet and entered into the Move
TM structural modelling program (
Figure 7A). The LIDAR data were also entered into Move
TM (
Figure 7 and
Figure 8), as were available geological maps (e.g.,
Figure 8B,C) and a regional Satellite Radar Terrain Model (SRTM) to provide topography outside the LIDAR area, albeit at much lower resolution. Preliminary cross-sections were constructed in areas with the most surface geological data in order to determine the stratigraphic sections in the southern, central and northern areas, guided by the stratigraphy from Gunson et al. [
24] and Thornton et al. [
25]. It was found that the size of the age gap at the base Miocene unconformity decreased to the north to be largely absent in the Porgera area, as shown in
Section 6. Thus, different stratigraphic sections were used when modelling the southern, central and northern areas. The major structures in the LIDAR data were defined, such as the Eastern Boundary Fault (EBF), the Western Boundary Fault (WBF), the Kare Anticline, the Kumbipota Syncline and many others (
Figure 7A).
It was observed that many structures were oblique to the regional WNW–ESE fold trend, which is consistent with strike–slip offset. It was also observed that some of the large limestone cliffs recorded major slumps that are discussed further below. Thus, in order to build the 3D structural model, more than 120 cross-sections were constructed (
Figure 7B), mostly in the regional dip direction (NNE–SSW) but many in an oblique direction consistent with the orientation of structures. In areas away from the outcrop data, the stratigraphy was defined either by projecting from the better-defined sections or by correlating the major topographic features, particularly the large limestone cliffs. At all times, the cross-sections were corrected by checking their intersections with all other cross-sections.
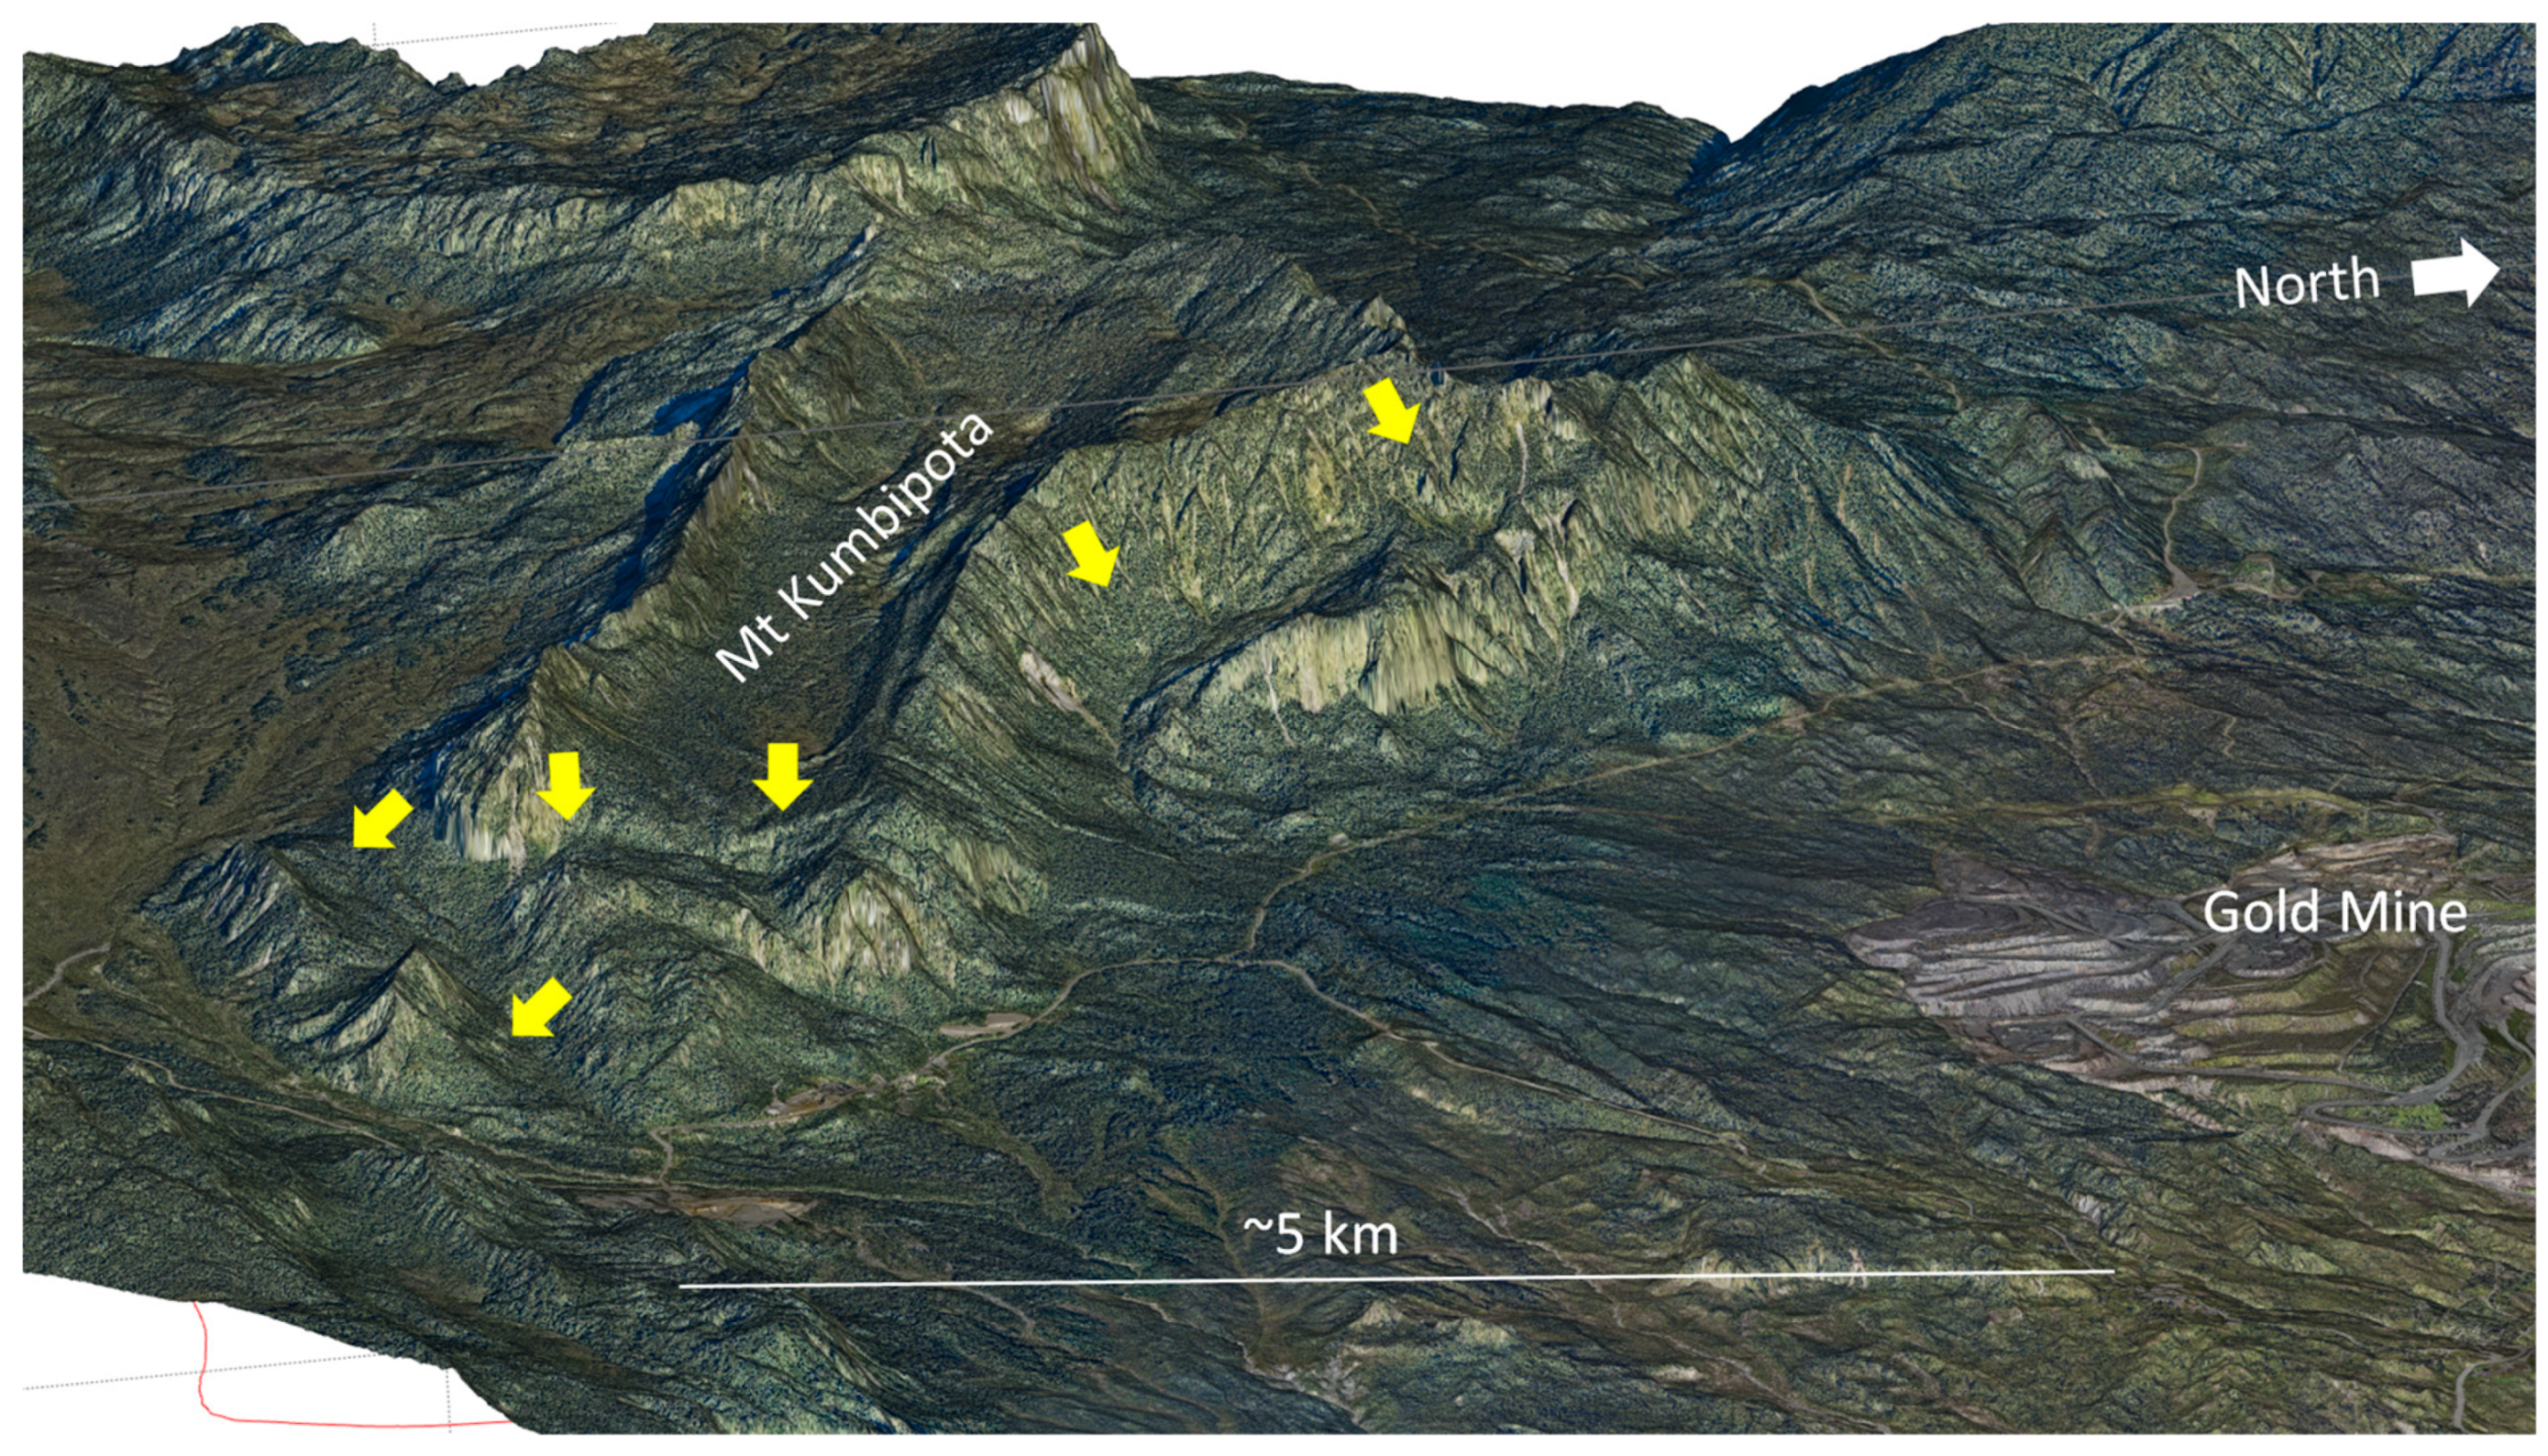
Three-dimensional images of the LIDAR data around the mine site (
Figure 8) serve to illustrate some of the methodology. The details of individual structures are visible (
Figure 8A), and in Move
TM, they were enhanced by zooming in and via analysis in all directions. Existing geological maps were projected onto the 3D topographic surface (
Figure 8B,C) to act as a guide, but in many places were found to be wildly different, including, for instance, in the top-left corner of
Figure 8B vs.
Figure 8C. Thus, a new and independent interpretation was created.
In some locations, particularly along the EBF (
Figure 7 and
Figure 8), numerous ‘slump’ structures were observed adjacent to the large limestone cliffs, as shown in
Figure 9 and
Figure 10. These structures are here interpreted to be extensional faults dropping down the limestone section into adjacent graben. Thus, in order to construct the 3D geology model, serial cross-sections were constructed at right-angles to the faults, defining their true extensional geometry. In the mine area, significant normal faults were defined with missing stratigraphy and with offsets recorded in boreholes as noted by Gunson [
27]. After most of the sections were constructed and correlated at all intersections, a regional section was constructed across the area in Move
TM, balanced, restored and then forward-modelled to check its validity and admissibility. Considerable adjustments were made at depth whilst still honouring the surface data. Finally, using the LIDAR data, the field data and micro-paleontological dating and our inferred stratigraphic sections, a 3D structural model of the area was constructed by interpolating between all of the >120 cross-sections (
Figure 7B), first constructing the faults and then the stratigraphic units. Care was taken to honour cross-cutting relationships where available, but almost all of this was interpretive.
6. Results—Balanced and Restored Cross-Section
A semi-regional section across the study area is presented in
Figure 11. A key feature of the section is the two normal faults, one through the mine and the other on the NE flank of Mount Kumbipota (
Figure 11D). The latter is a SE continuation of a fault bounding the southern edge of the Jurassic Om Beds (
Figure 2) and may be the basin-bounding fault suggested in
Figure 5A. The fault through the mine is here termed the ‘pit normal fault’, an oblique extensional fault with 1–2 km of extensional offset, along which the south-dipping and ore-bearing Roamane Fault is here considered to be a splay (not shown). The remaining faults are listric thrust faults interpreted to detach within the Jurassic section. The section is presented to show the evolution of the structure, but it was balanced and restored in reverse order using the fault-parallel-flow and simple-shear algorithms in Move
TM. First, the normal faults were restored as well as two small backthrusts in the SW of the section (
Figure 11C). Then, the thrust faults were restored (
Figure 11B), and finally, the section was unfolded using the fault-bend-fold algorithm (
Figure 11A). The final restored section contains minor kinks and anomalies from the restoration and could be improved, but it illustrates the evolution.
In
Figure 11, section A represents the configuration of the margin in Miocene times pre-deformation. It is unclear if the Miocene Mala Limestone continued to the north, perhaps in a shaley facies, as no Miocene rocks are preserved. The section shows growth to the NE in the Paleocene, Cretaceous and Jurassic across the Kumbipota normal fault, suggesting that this was a long-lived basin-bounding fault. With the onset of compression in the Late Miocene, the section was folded (
Figure 11B), perhaps involving inversion of the basin-bounding faults at depth, as suggested in
Figure 5B. The section was then cut by thrust-faults with the underlying basin-bounding fault probably acting as a barrier, causing considerable compression and uplift to the north (
Figure 8C). Finally, there was right-lateral movement across the Porgera Transfer that opened pull-apart basins as shown in
Figure 5C, with extensional faulting along the Kumbipota and Pit-Normal Faults (
Figure 11D), allowing emplacement of the Porgera Intrusive Complex (not shown). It is likely that stages B, C and D may have overlapped substantially, but they are here shown sequentially for simplicity.
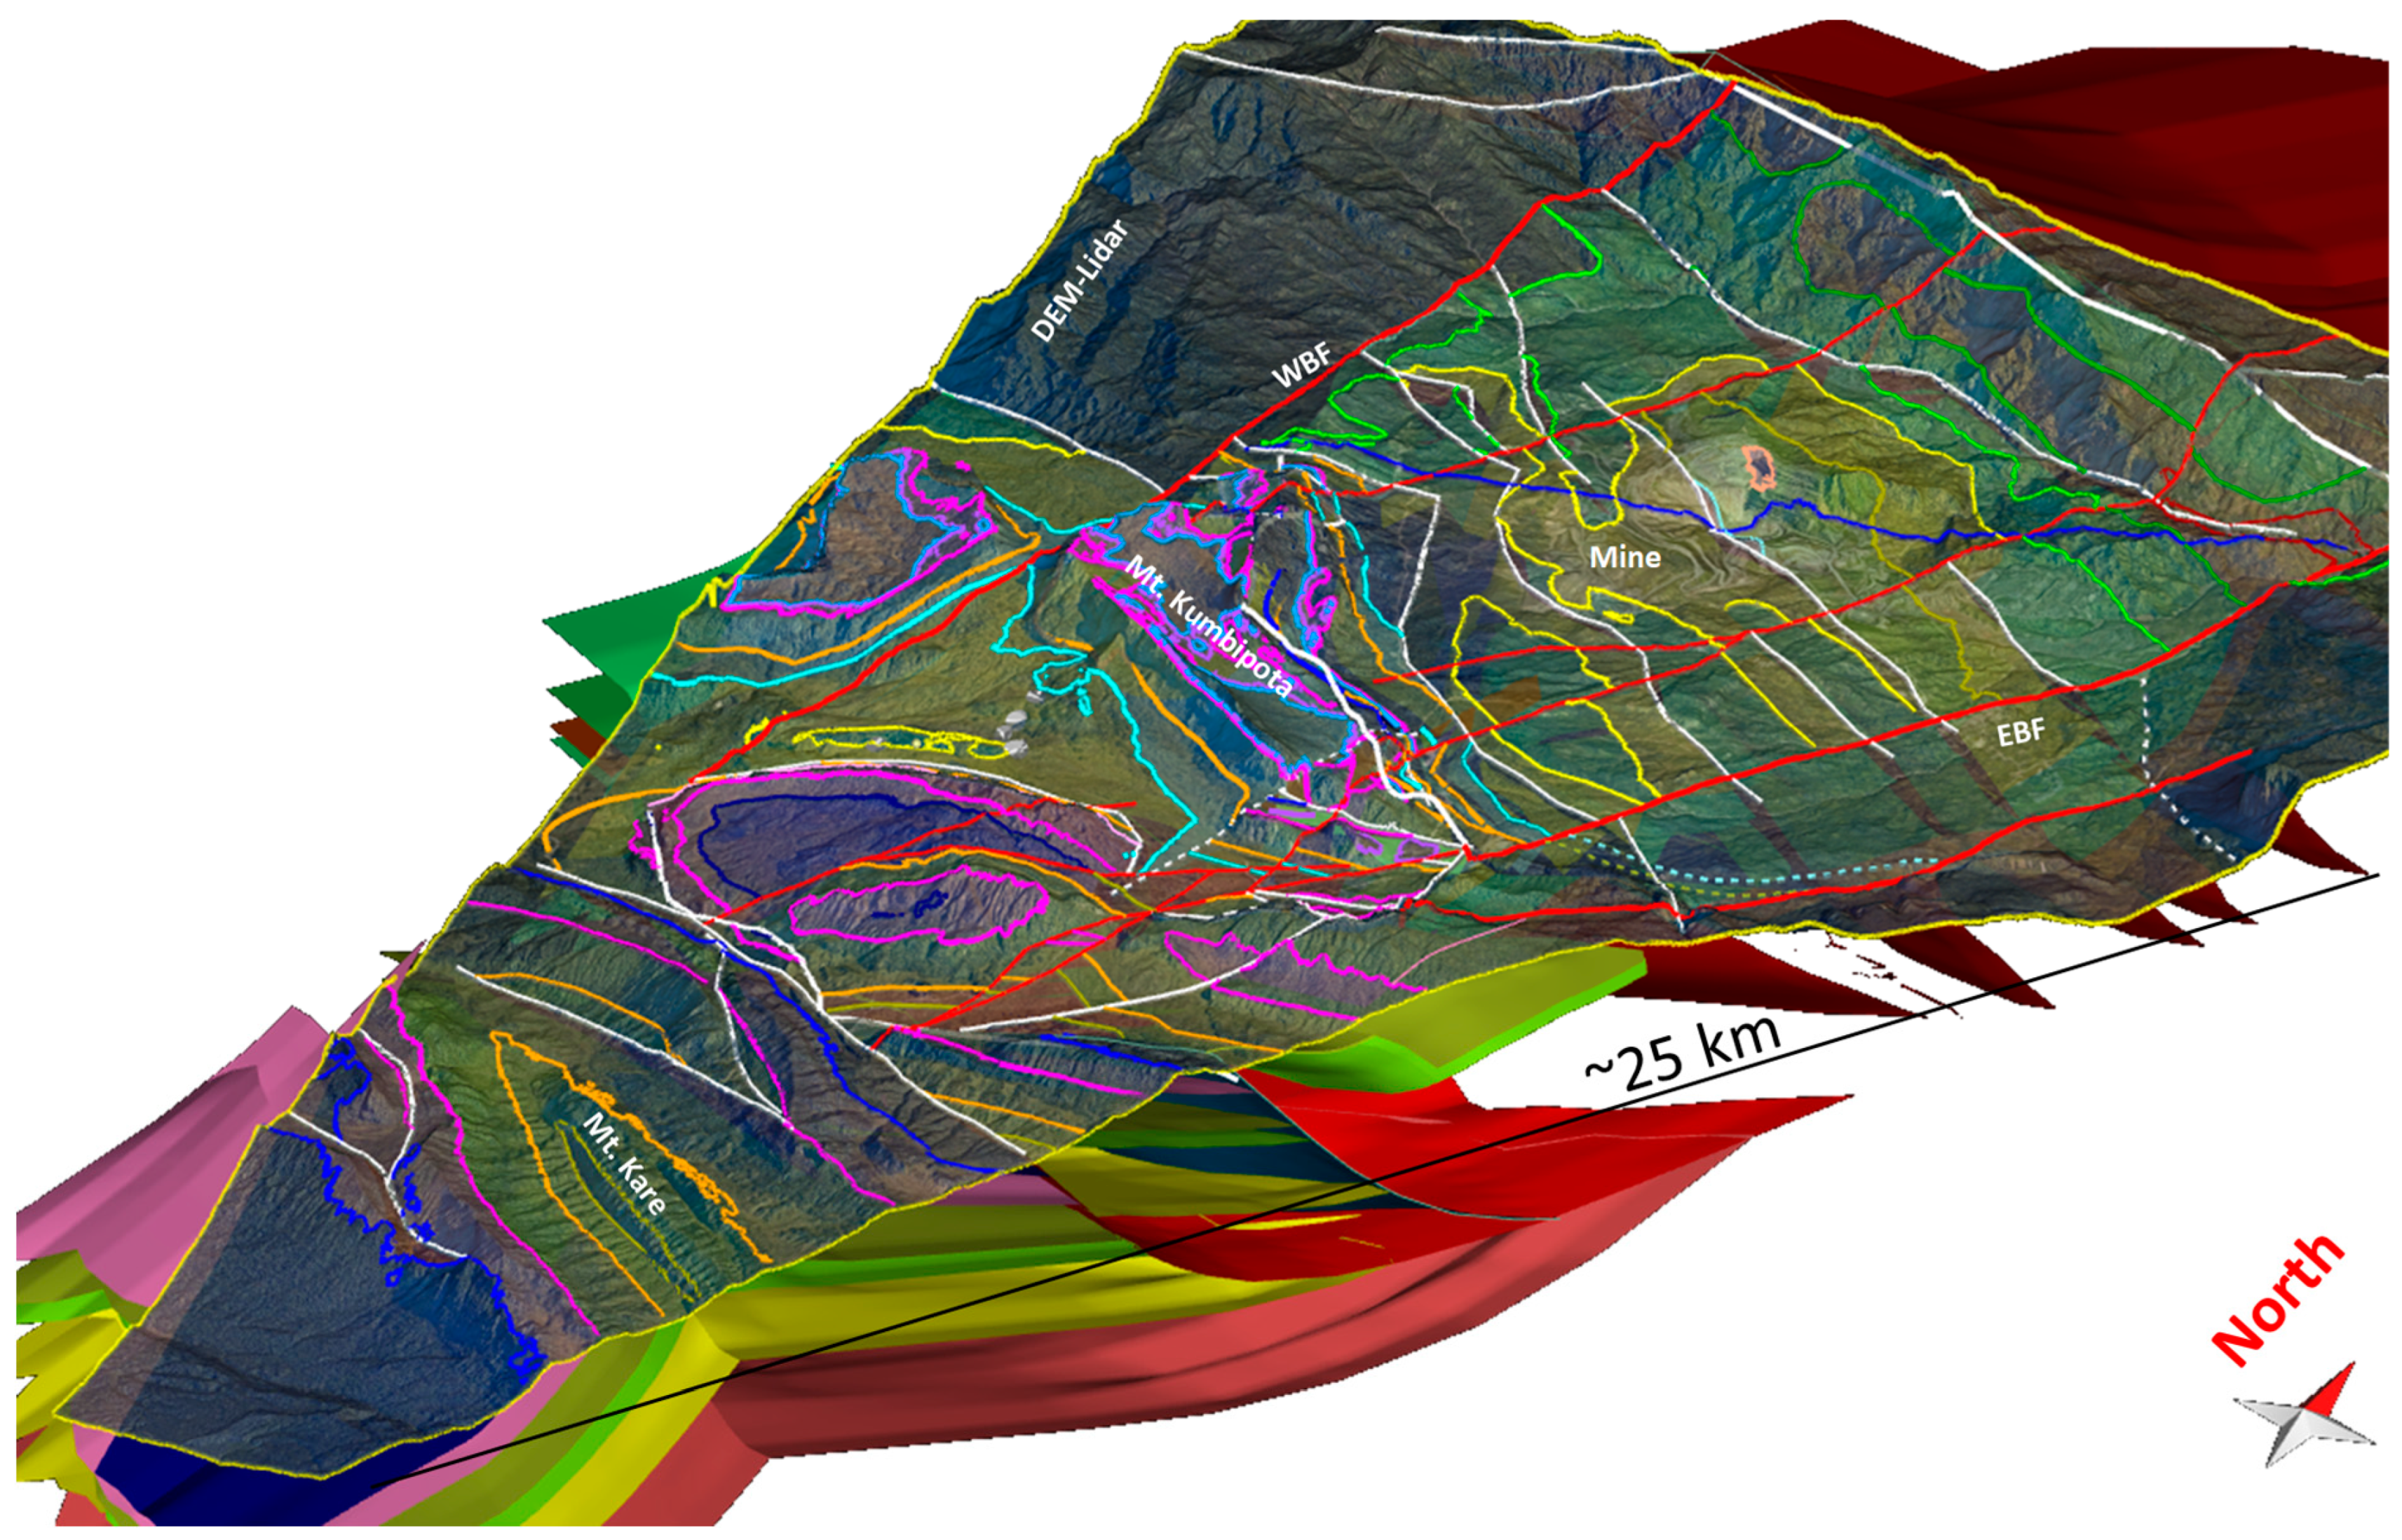
7. Results—3D Model
By interpolating between all the cross-sections shown in
Figure 7B, a semi-regional 3D geology model of the area was constructed, as shown in
Figure 12 and
Figure 13. In
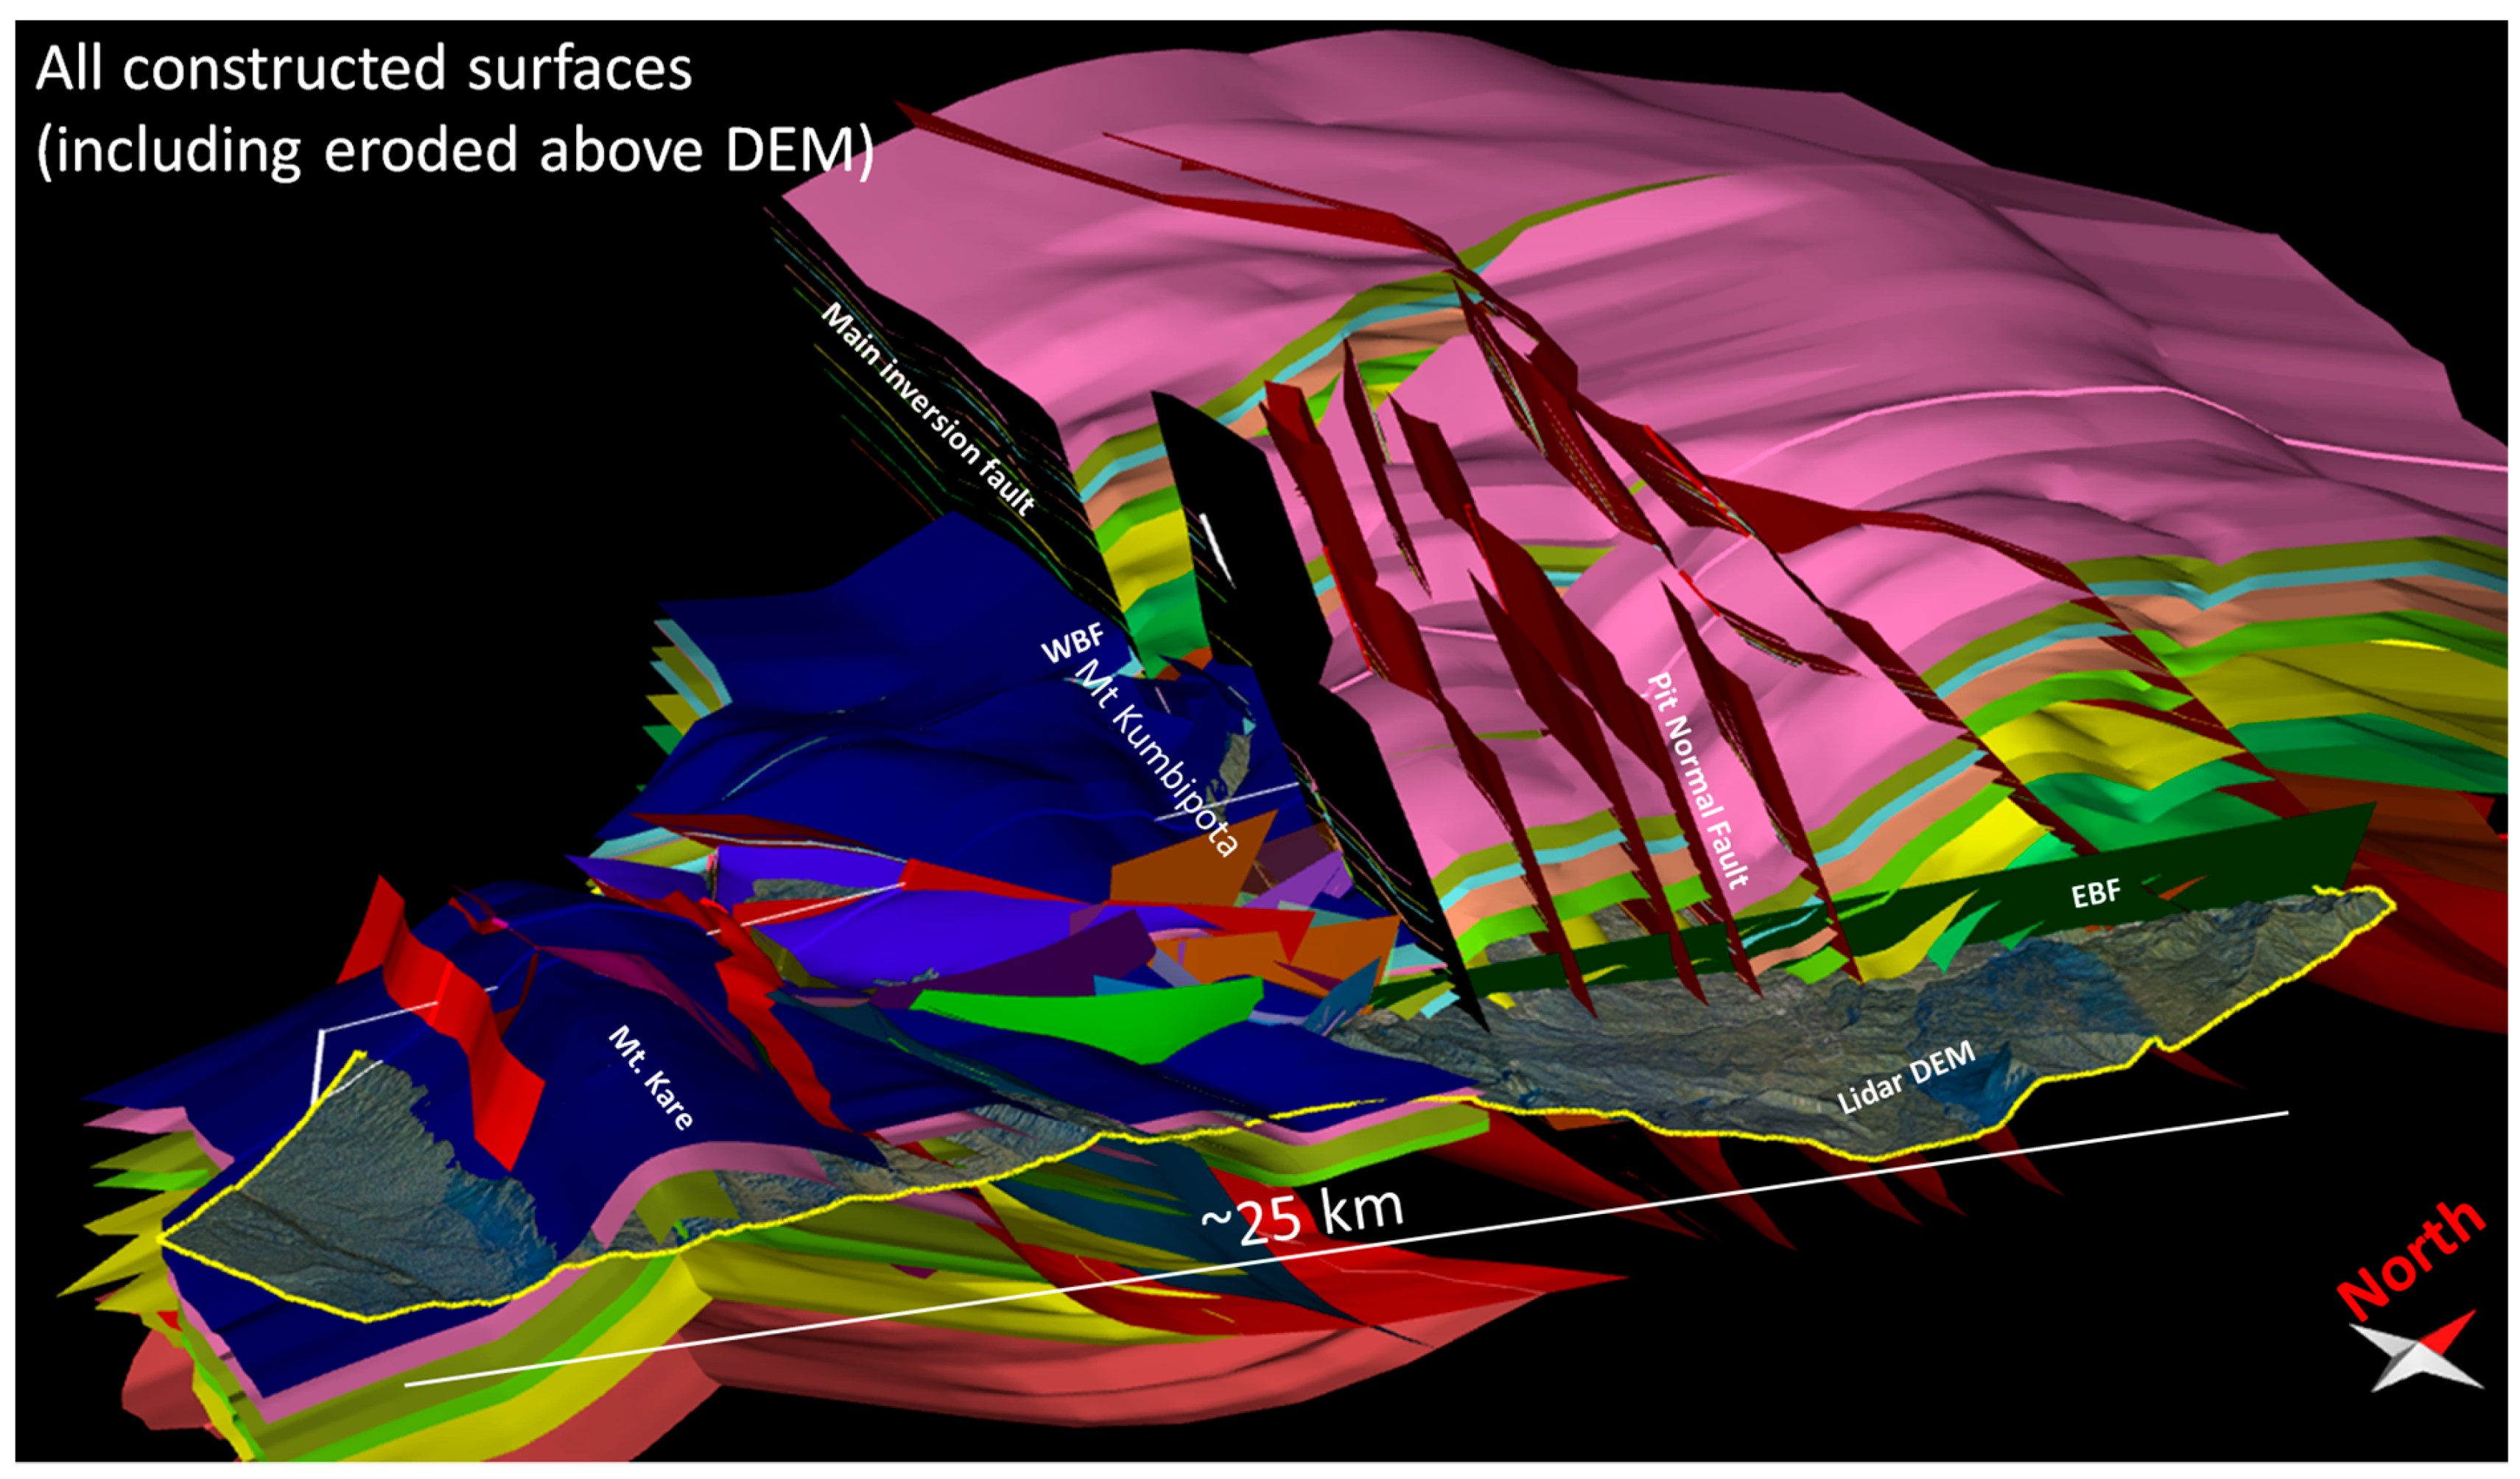
Figure 13, the faults are shown in red except for the EBF, which is shown in green. The model shows all the horizons reconstructed, including those eroded above the surface to try to give an understanding of the geology. The pink horizon is interpreted to be the top of the Eocene limestone and is present across the whole model. The yellow and green horizons correspond to members of the Upper Cretaceous Chim Formation.
One standout feature is that the NW corner of the model, located above the outcropping Jurassic Om Beds, was uplifted around 4–5 km and eroded, here interpreted to have occurred along the ‘Main Inversion Fault’ (
Figure 13) that continues to the NE of Mount Kumbipota (
Figure 8). The km-scale uplift is supported by new palynological and thermal data (Tmax/Ro) acquired as part of this study. To the south of the inversion fault, there are numerous low-angle thrust repeats, creating anticlines and elevated synclines such as the Mount Kare anticline and Mount Kumbipota syncline. At the western end of the Mount Kumbipota syncline is the Western Boundary Fault (WBF,
Figure 12 and
Figure 13), across which the top Eocene horizon drops down significantly on several large normal faults into the mine area. In
Figure 13, the WBF is not shaded in order to allow the bed offset to be seen. At the eastern end of the Mount Kumbipota syncline, there is an array of small normal faults in red, brown and green in
Figure 13 that represent those observed in
Figure 10 dropping down into a graben. It was observed that the EBF does not cut the Kare Anticline to the south, meaning that either displacement dies out to the south or it is transferred to the WBF on splays, as can be seen in the complex fault array between Mount Kumbipota and Mount Kare in
Figure 12 and
Figure 13.
Figure 12 shows the 3D model truncated at the ground surface to make a geological map on which the EBF can be seen terminating against the northern flank of the Mount Kare Anticline.
8. Discussion
Corbett [
14] suggested that many of the copper-gold deposits in Papua New Guinea were controlled by movements across underlying NNE-trending lineaments in the basement, which caused local dilation. He applied this to the Porgera deposit along the Porgera Transfer Zone, as shown in
Figure 3. Hill et al. [
15] and Gow et al. [
29] expanded on this notion, and Hill [
23] developed a conceptual 3D model for this tectonic evolution (
Figure 5). This study confirms the Porgera Transfer Zone as a significant crustal lineament across the country that was probably reactivated during Mesozoic and Tertiary tectonic events, including rifting, breakup and orogenesis. The progressive thrusting of the PNG margin from 12 Ma to the present shown in
Figure 4 illustrates that the Porgera Intrusive Complex was emplaced during the peak of compressional orogenesis and that the feed pipe was probably subsequently dismembered by further low-angle thrusts. The new regional LIDAR data has proven instrumental in not only mapping the area and constructing a semi-regional 3D model, but also in testing the hypothesis of dilation. It is clear from the images that there are significant zones of extension in pull-apart basins and graben associated with dextral offset across the Porgera Transfer Zone (
Figure 9,
Figure 10 and
Figure 11). If the extensional zones are found to coincide with significant magnetic and gravity anomalies, there is potential for new sub-surface copper-gold discoveries.
That being said, there is scope for alternative interpretations due to the paucity of the data and the difficulty of confirming these interpretations in the field due to ongoing social unrest and resultant security issues. The inferred stratigraphic sections need confirmation by measuring sections in the field and further dating of samples. The extensional faults interpreted in the LIDAR data, as shown in
Figure 9 and
Figure 10, could alternatively be landslides and slumps along active strike–slip faults. We consider this to be less likely, as the faults can be correlated in a coherent 3D structural model to be a negative flower structure, as recorded in many places in reflection seismic data, e.g., [
30]. In both cases, however, the downthrown blocks mask areas of exposed Cretaceous shales that may be mineralized, which needs testing via drilling.
It is stated above that the balanced section and 3D model could be a test of the conceptual 3D tectonic model proposed in
Figure 5. Recent surface sampling by co-authors Essy and Pokondepa in the region immediately south of the Kumbipota syncline (
Figure 11D) demonstrates that the uppermost Cretaceous units are absent there but present to the north of the syncline. This is consistent with the Kumbipota Fault being a growth fault down to the north and a continuation of the ‘main inversion fault’ shown in
Figure 13. Although this does not prove growth to the north in the Jurassic Om Beds, it is consistent with it. Drilling and stratigraphic sections within the mine area show significant normal fault offsets across the Pit Normal Fault (
Figure 13). In the balanced and restored section, this is shown to be consistent with having occurred at the same time as ongoing extension.
In terms of worldwide exploration, this study shows that in areas with good stratigraphic control, it is possible to construct a detailed semi-regional 3D geological model based upon field outcrops and/or detailed LIDAR or other remote sensing data that includes topography. In fold and thrust belts, such as in New Guinea or the Andes, it is important to look for local extensional faults associated with regional cross-cutting lineaments that may be favourable locations for intrusives and mineralization. Notably, in this study, only the bare-earth LIDAR data was used for interpretation, but many spectral bands are available. It is likely that a great deal more information and interpretation can be made by using all spectral bands.


