

Investigation of the Geological Structure of the Tramutola Area (Agri Valley): Inferences for the Presence of Geofluids at Shallow Crustal Levels

 , ,
, ,  ,
, 
 ,
, 
Abstract
1. Introduction
2. Geological Setting
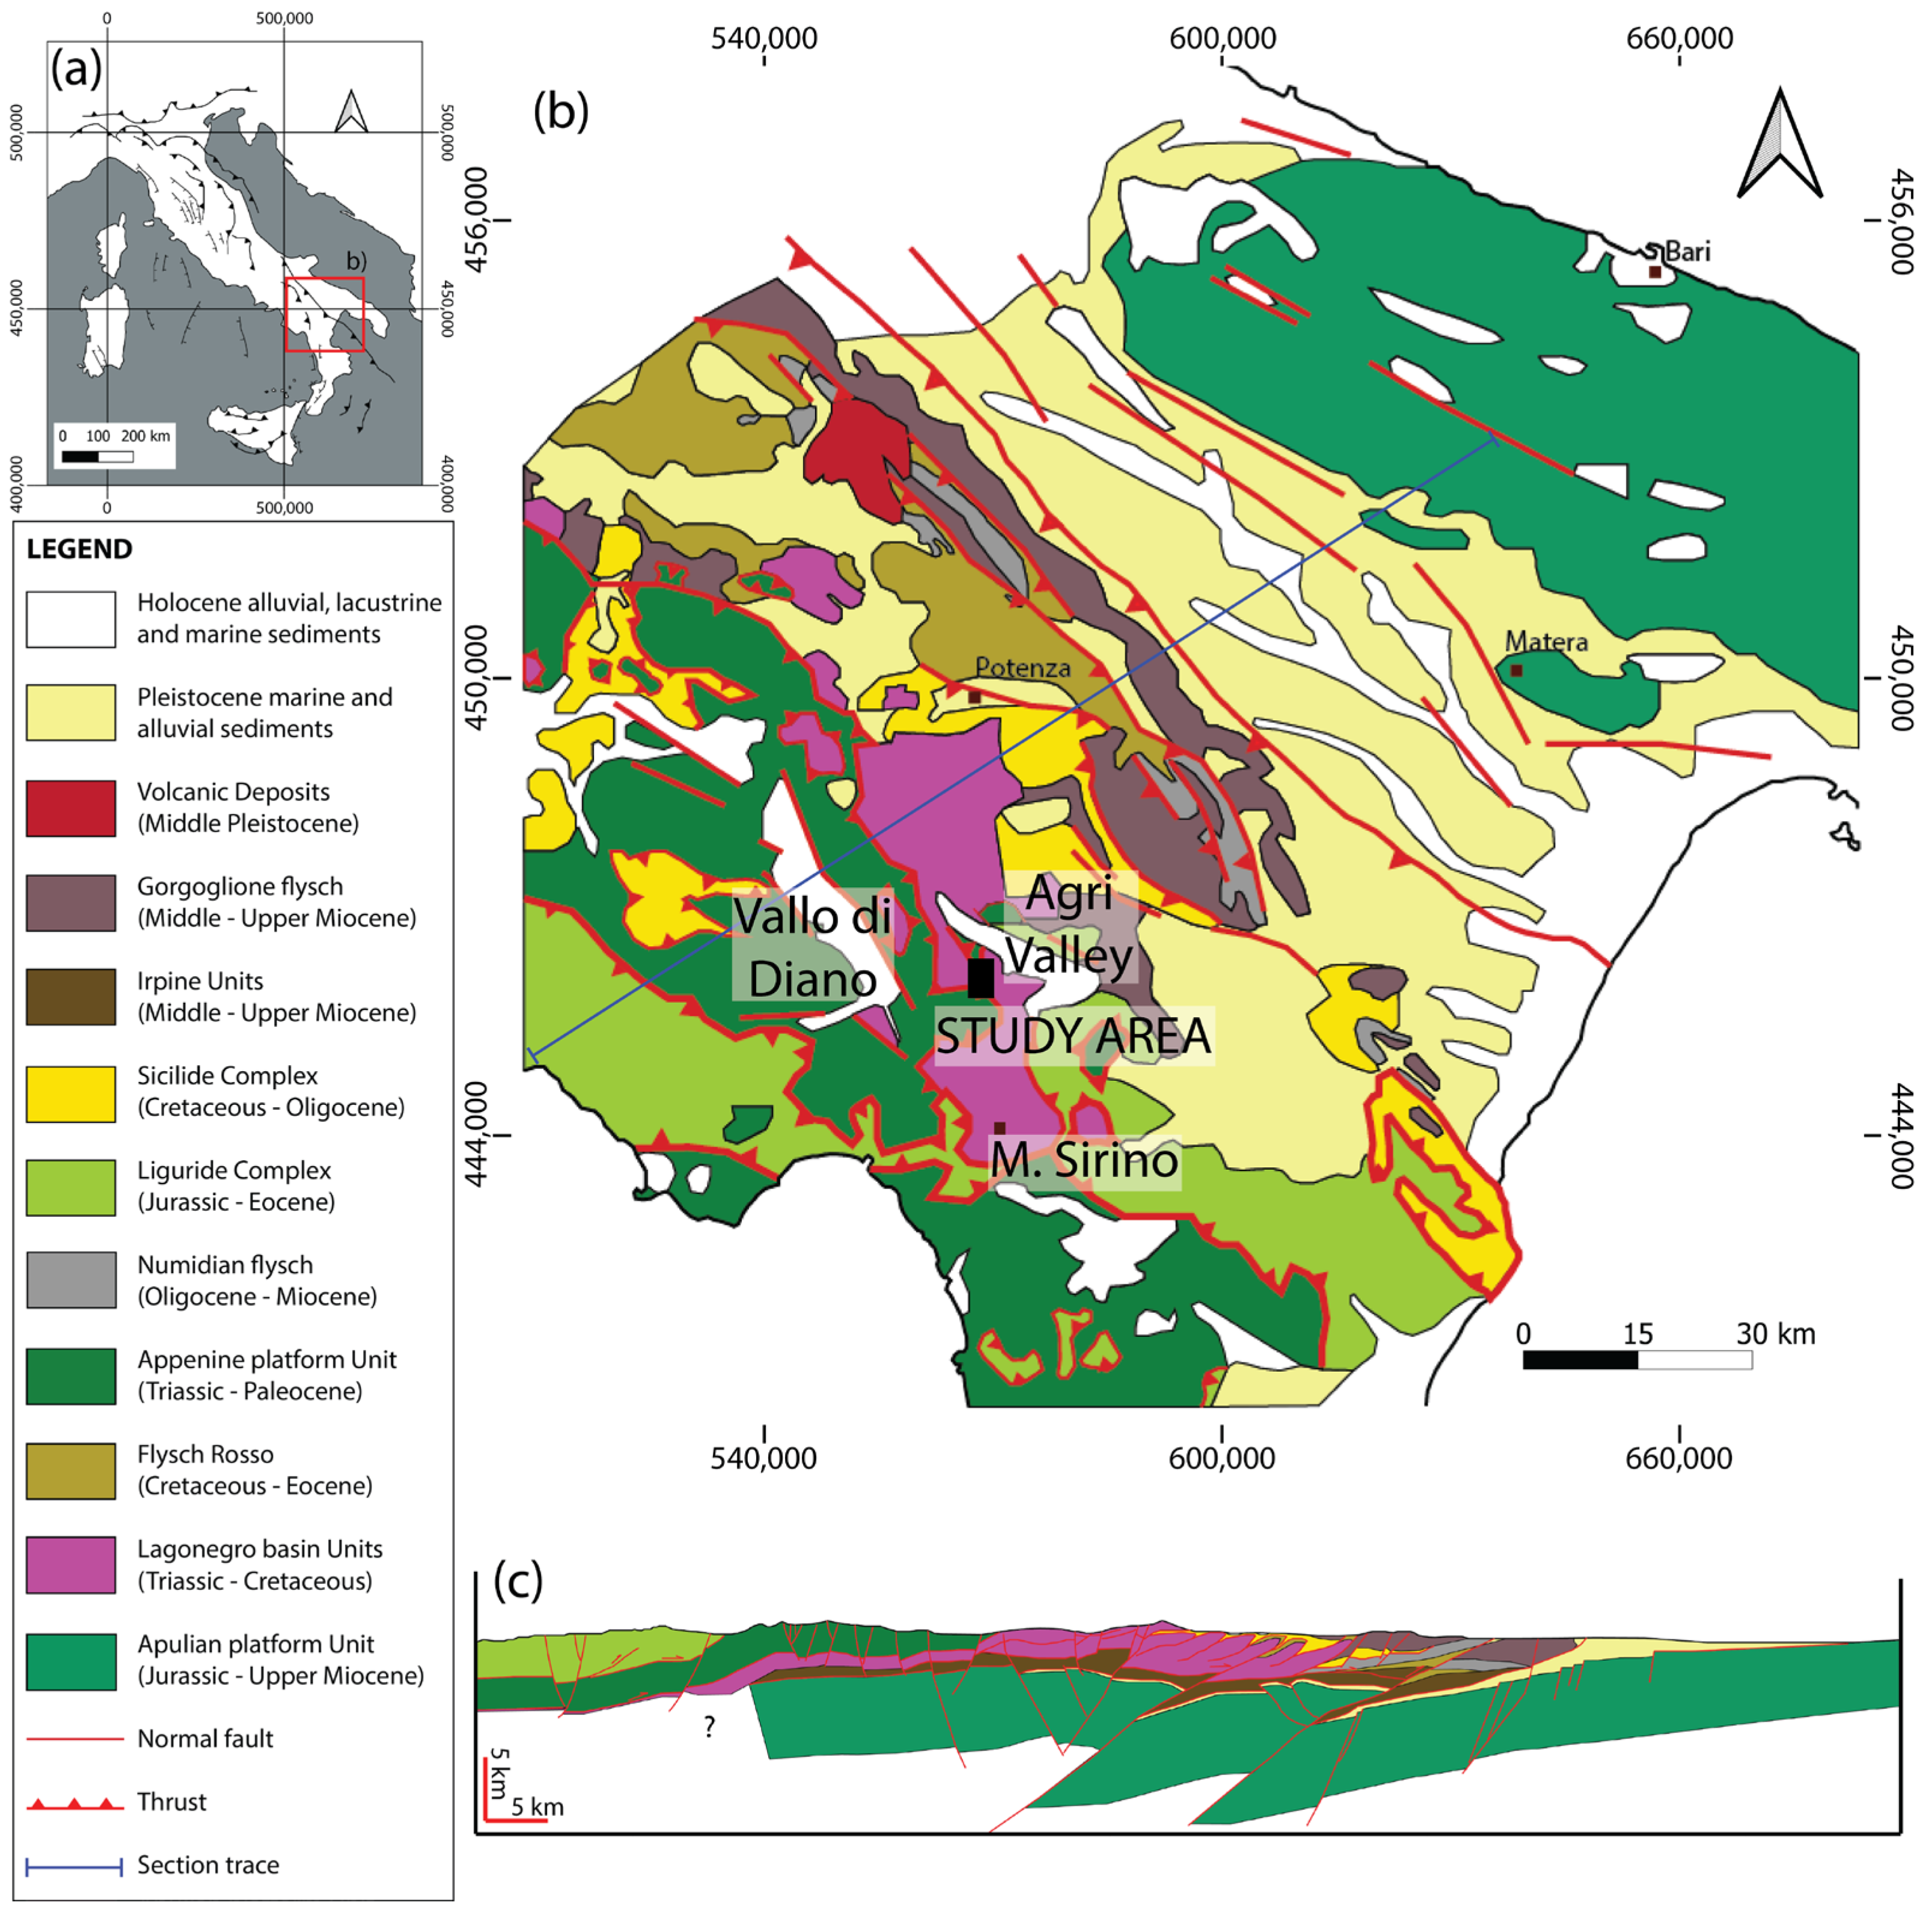
2.1. Southern Apennines

2.2. Geology of the High Agri Valley

3. Data and Methods
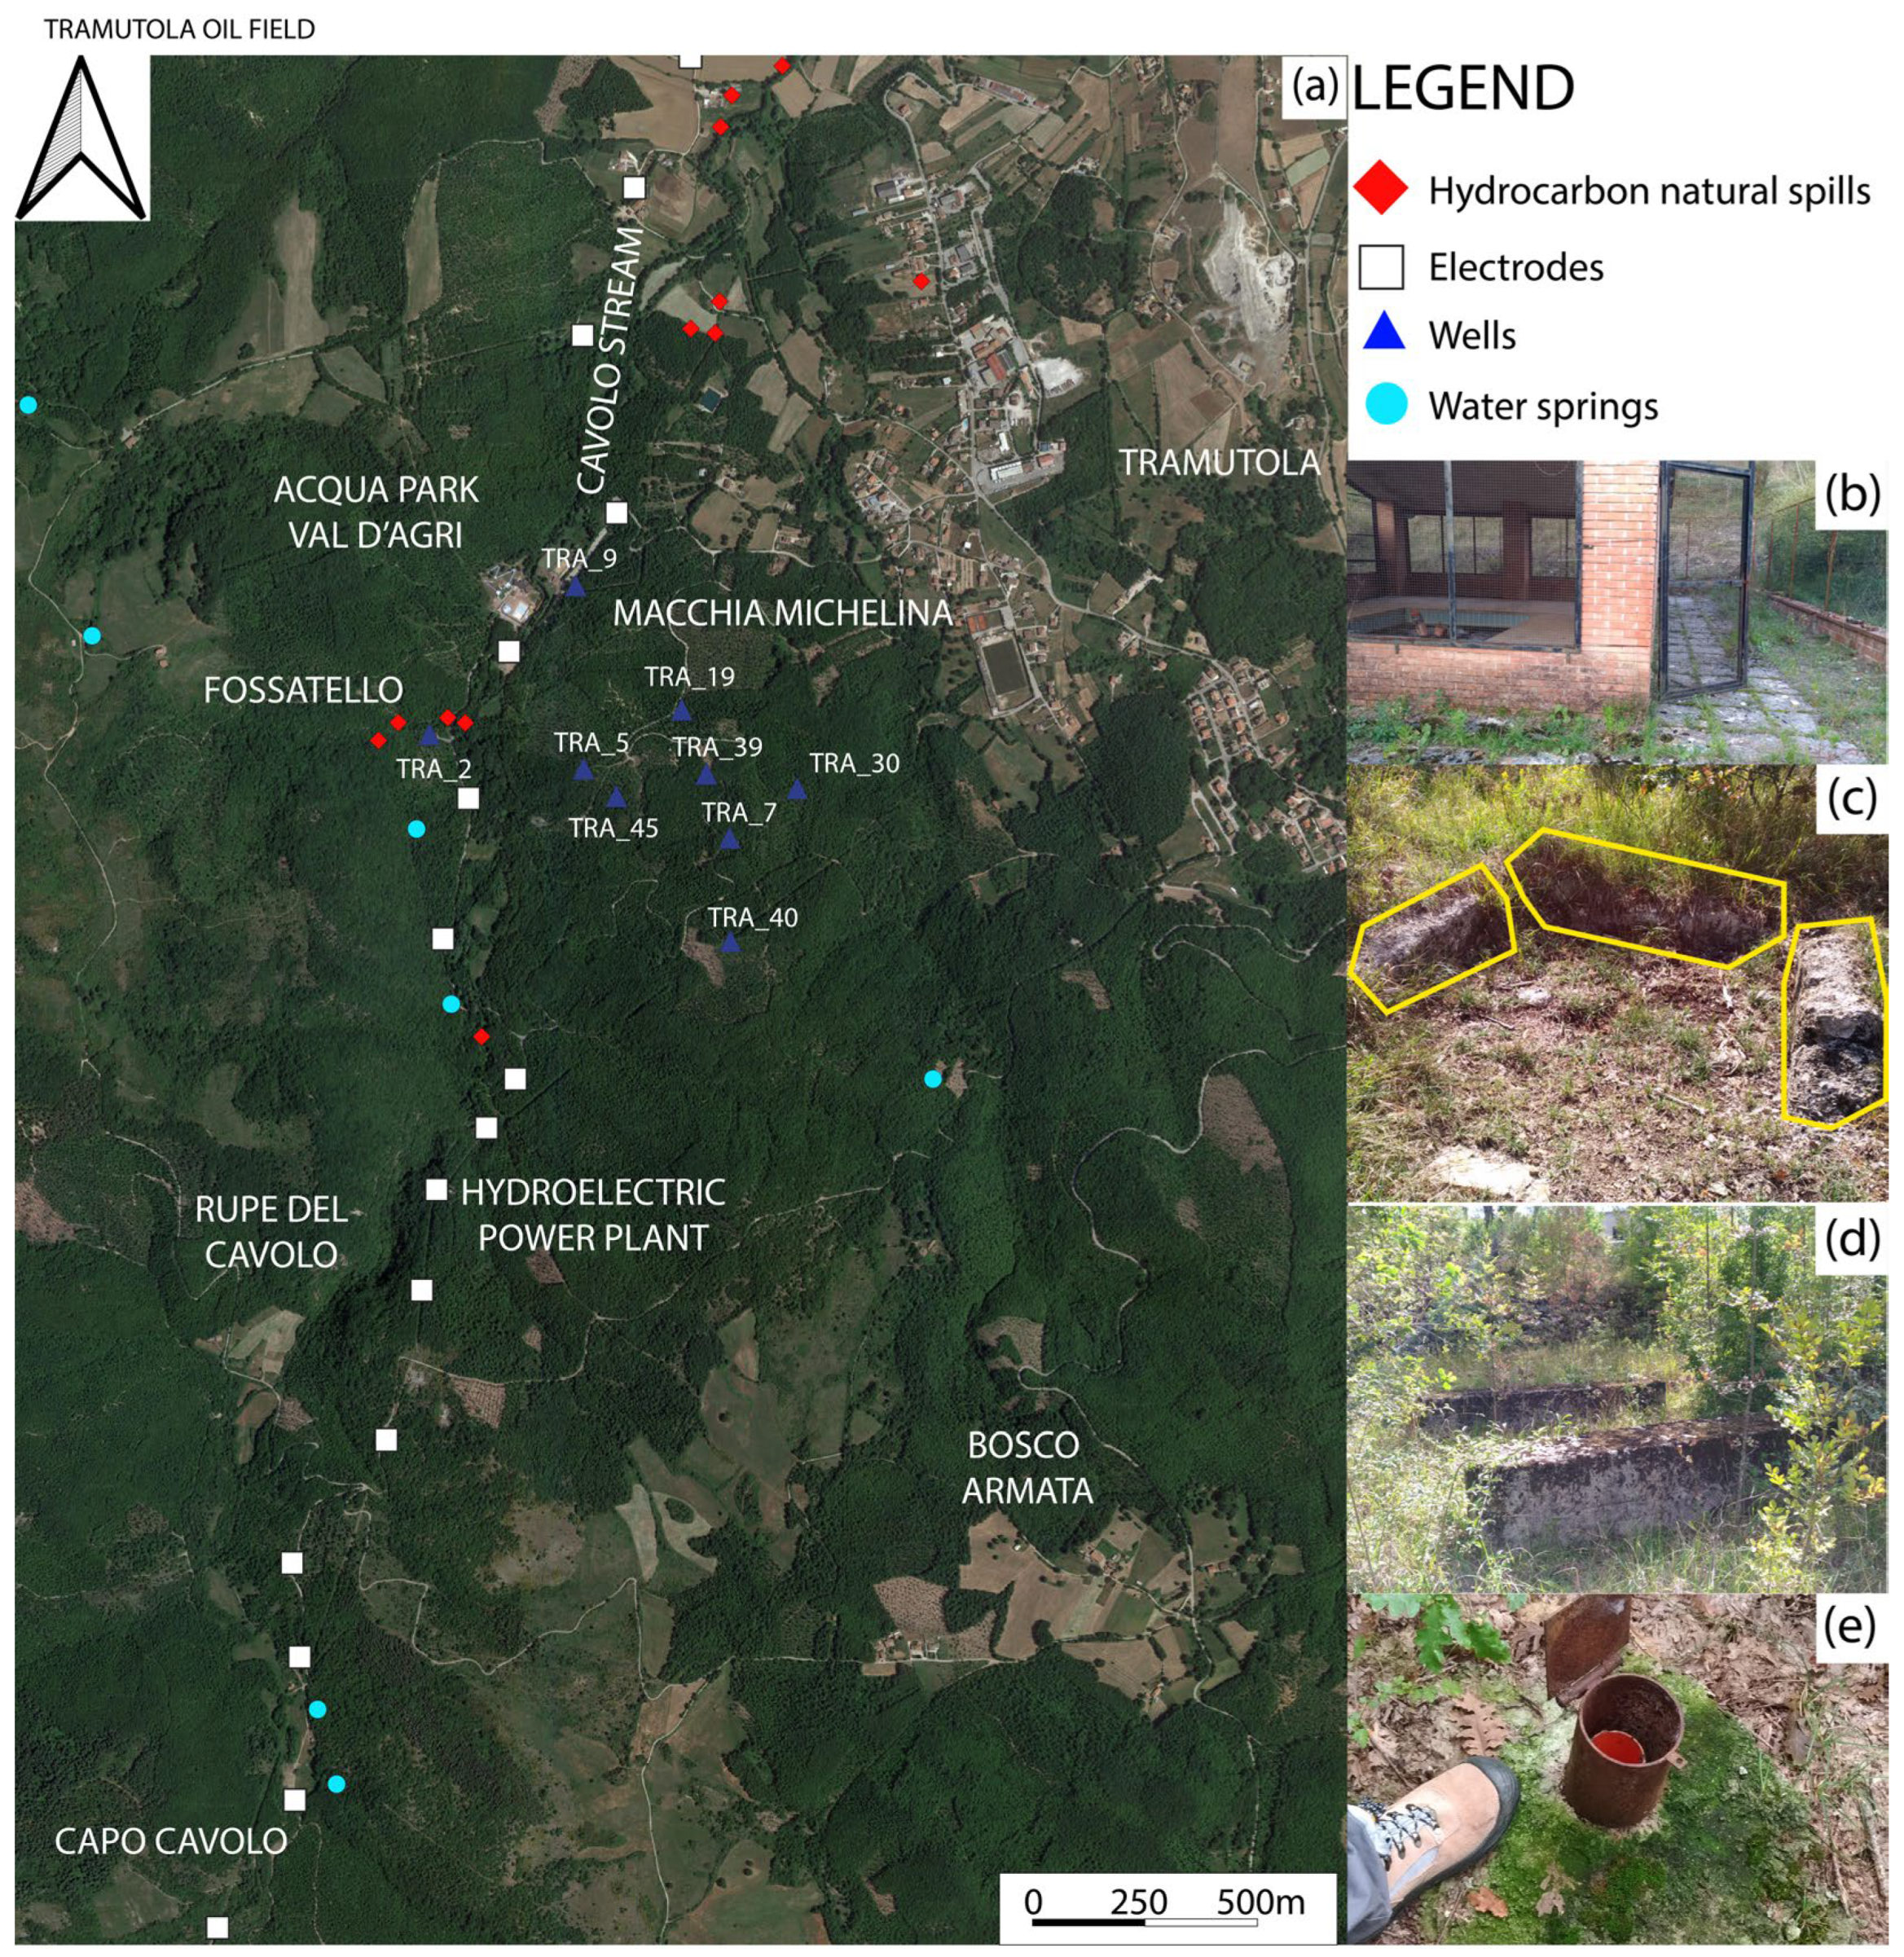
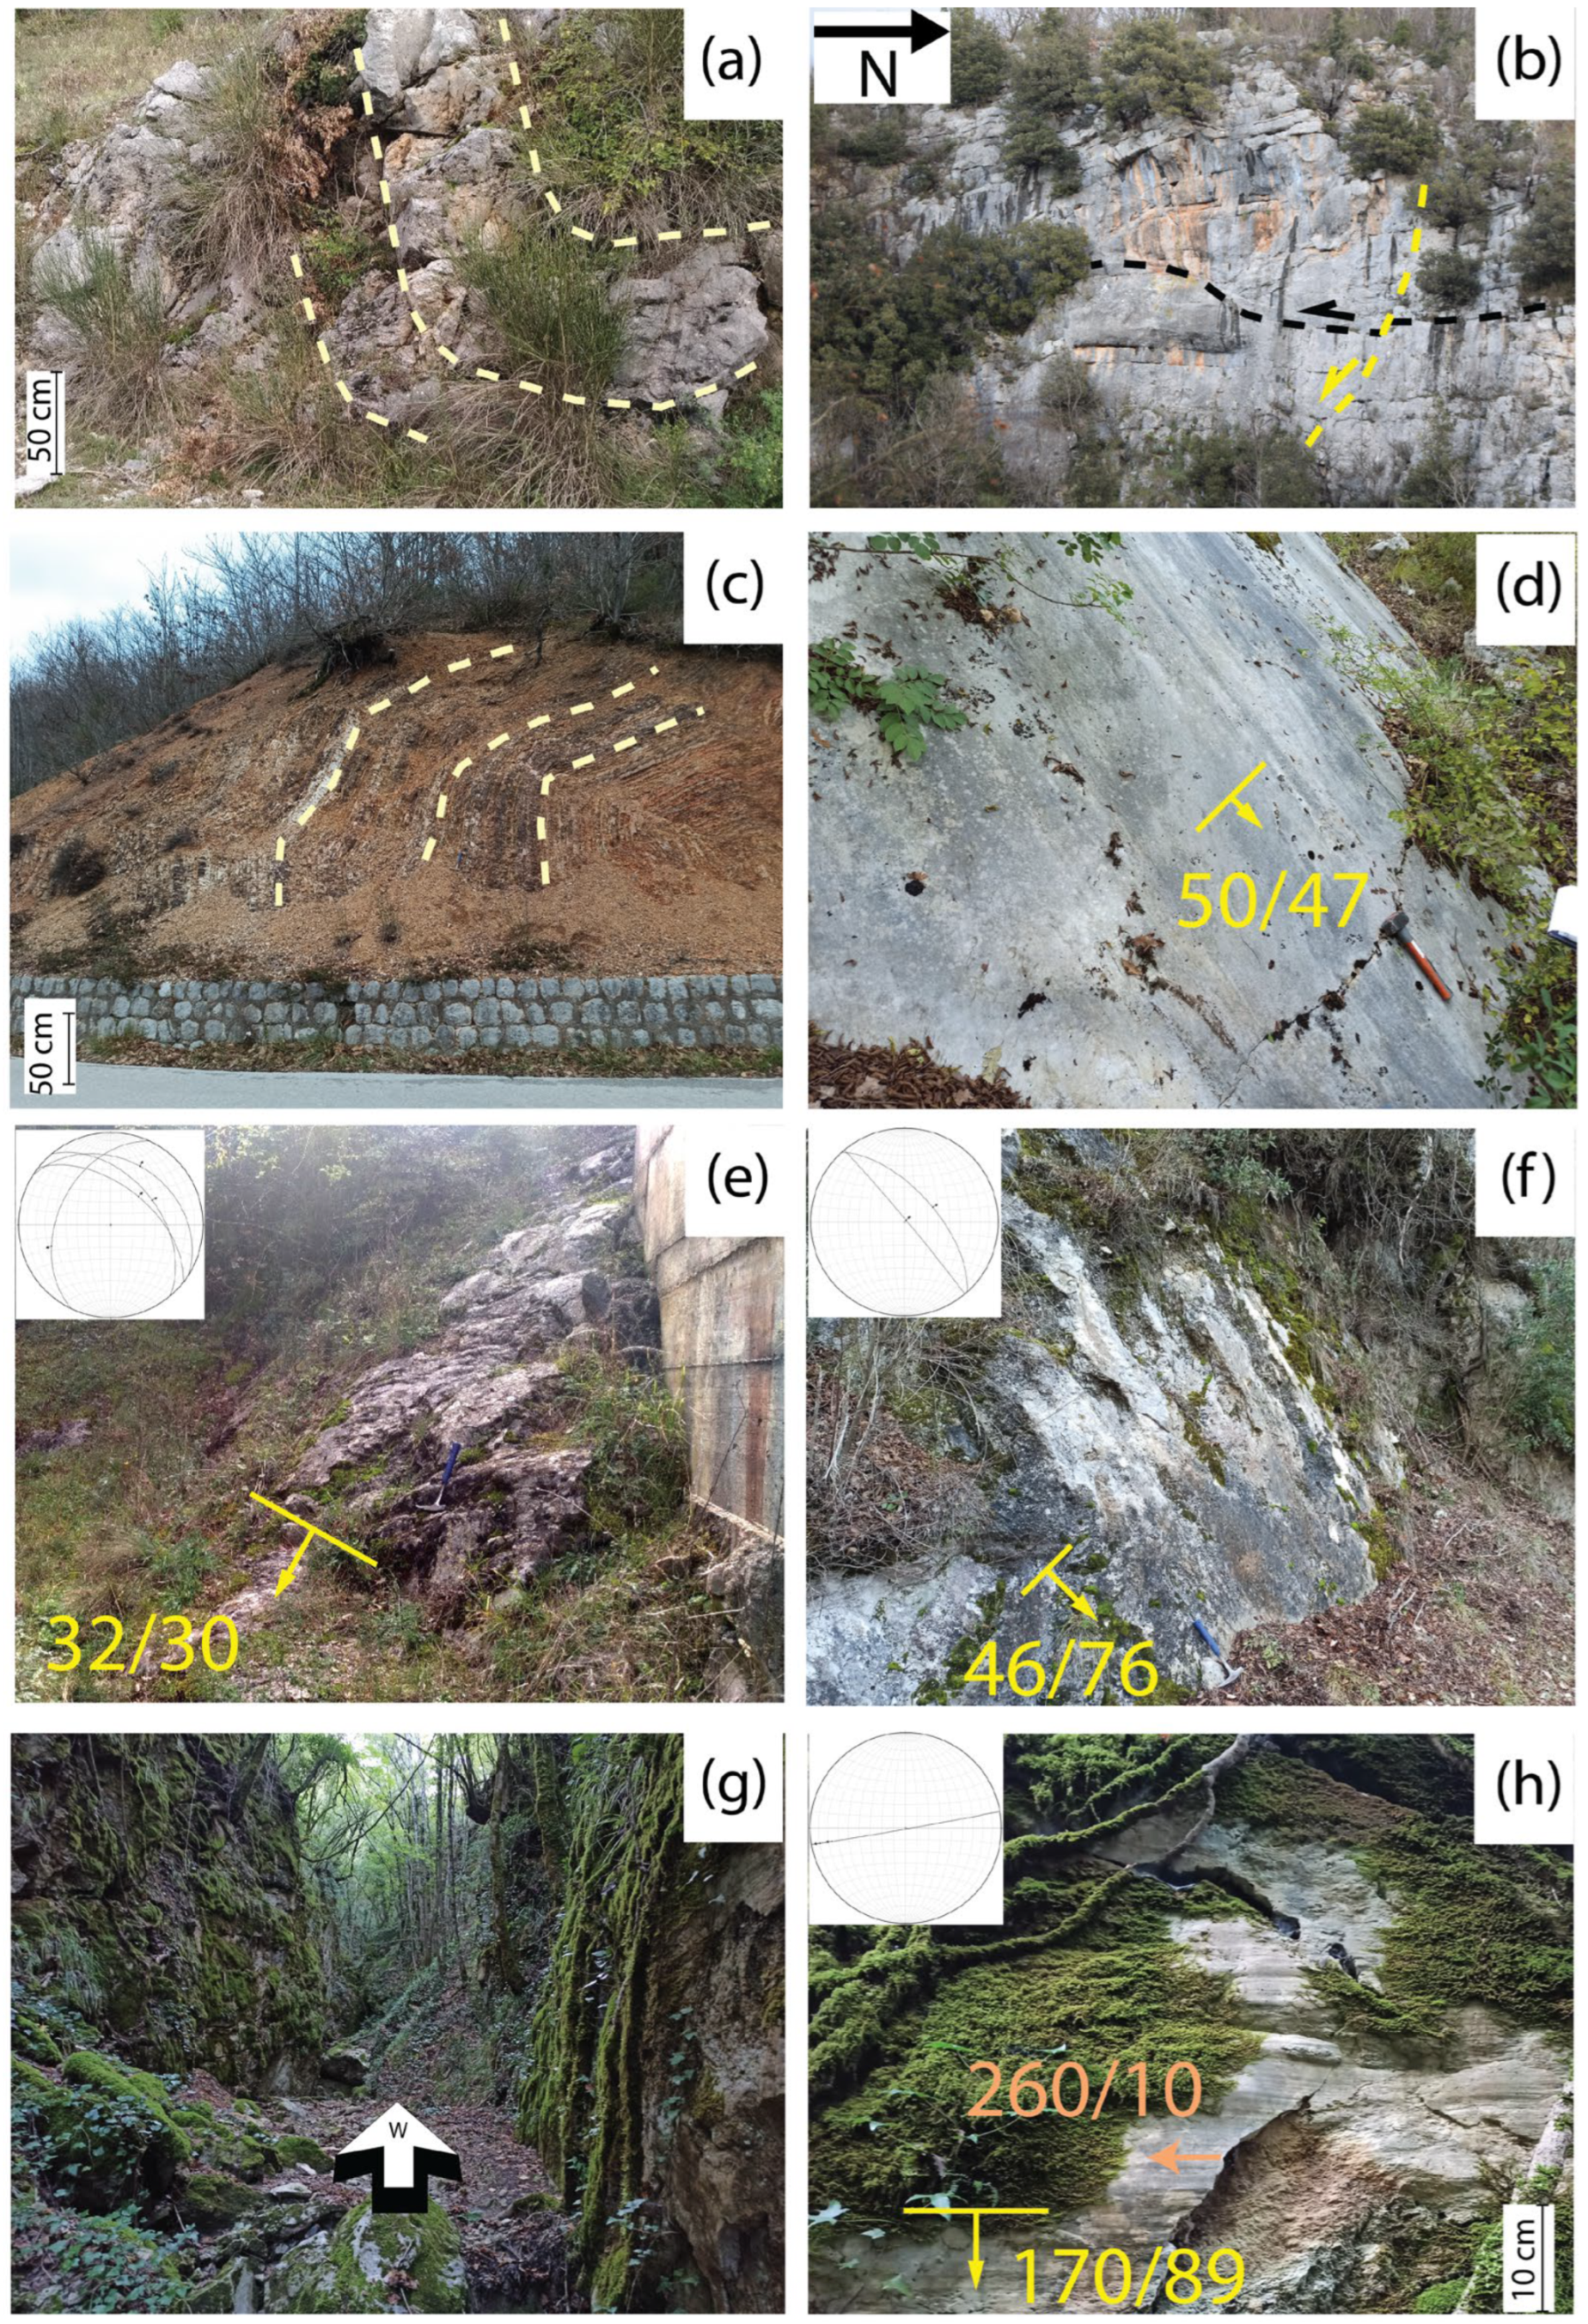
3.1. Field Analysis
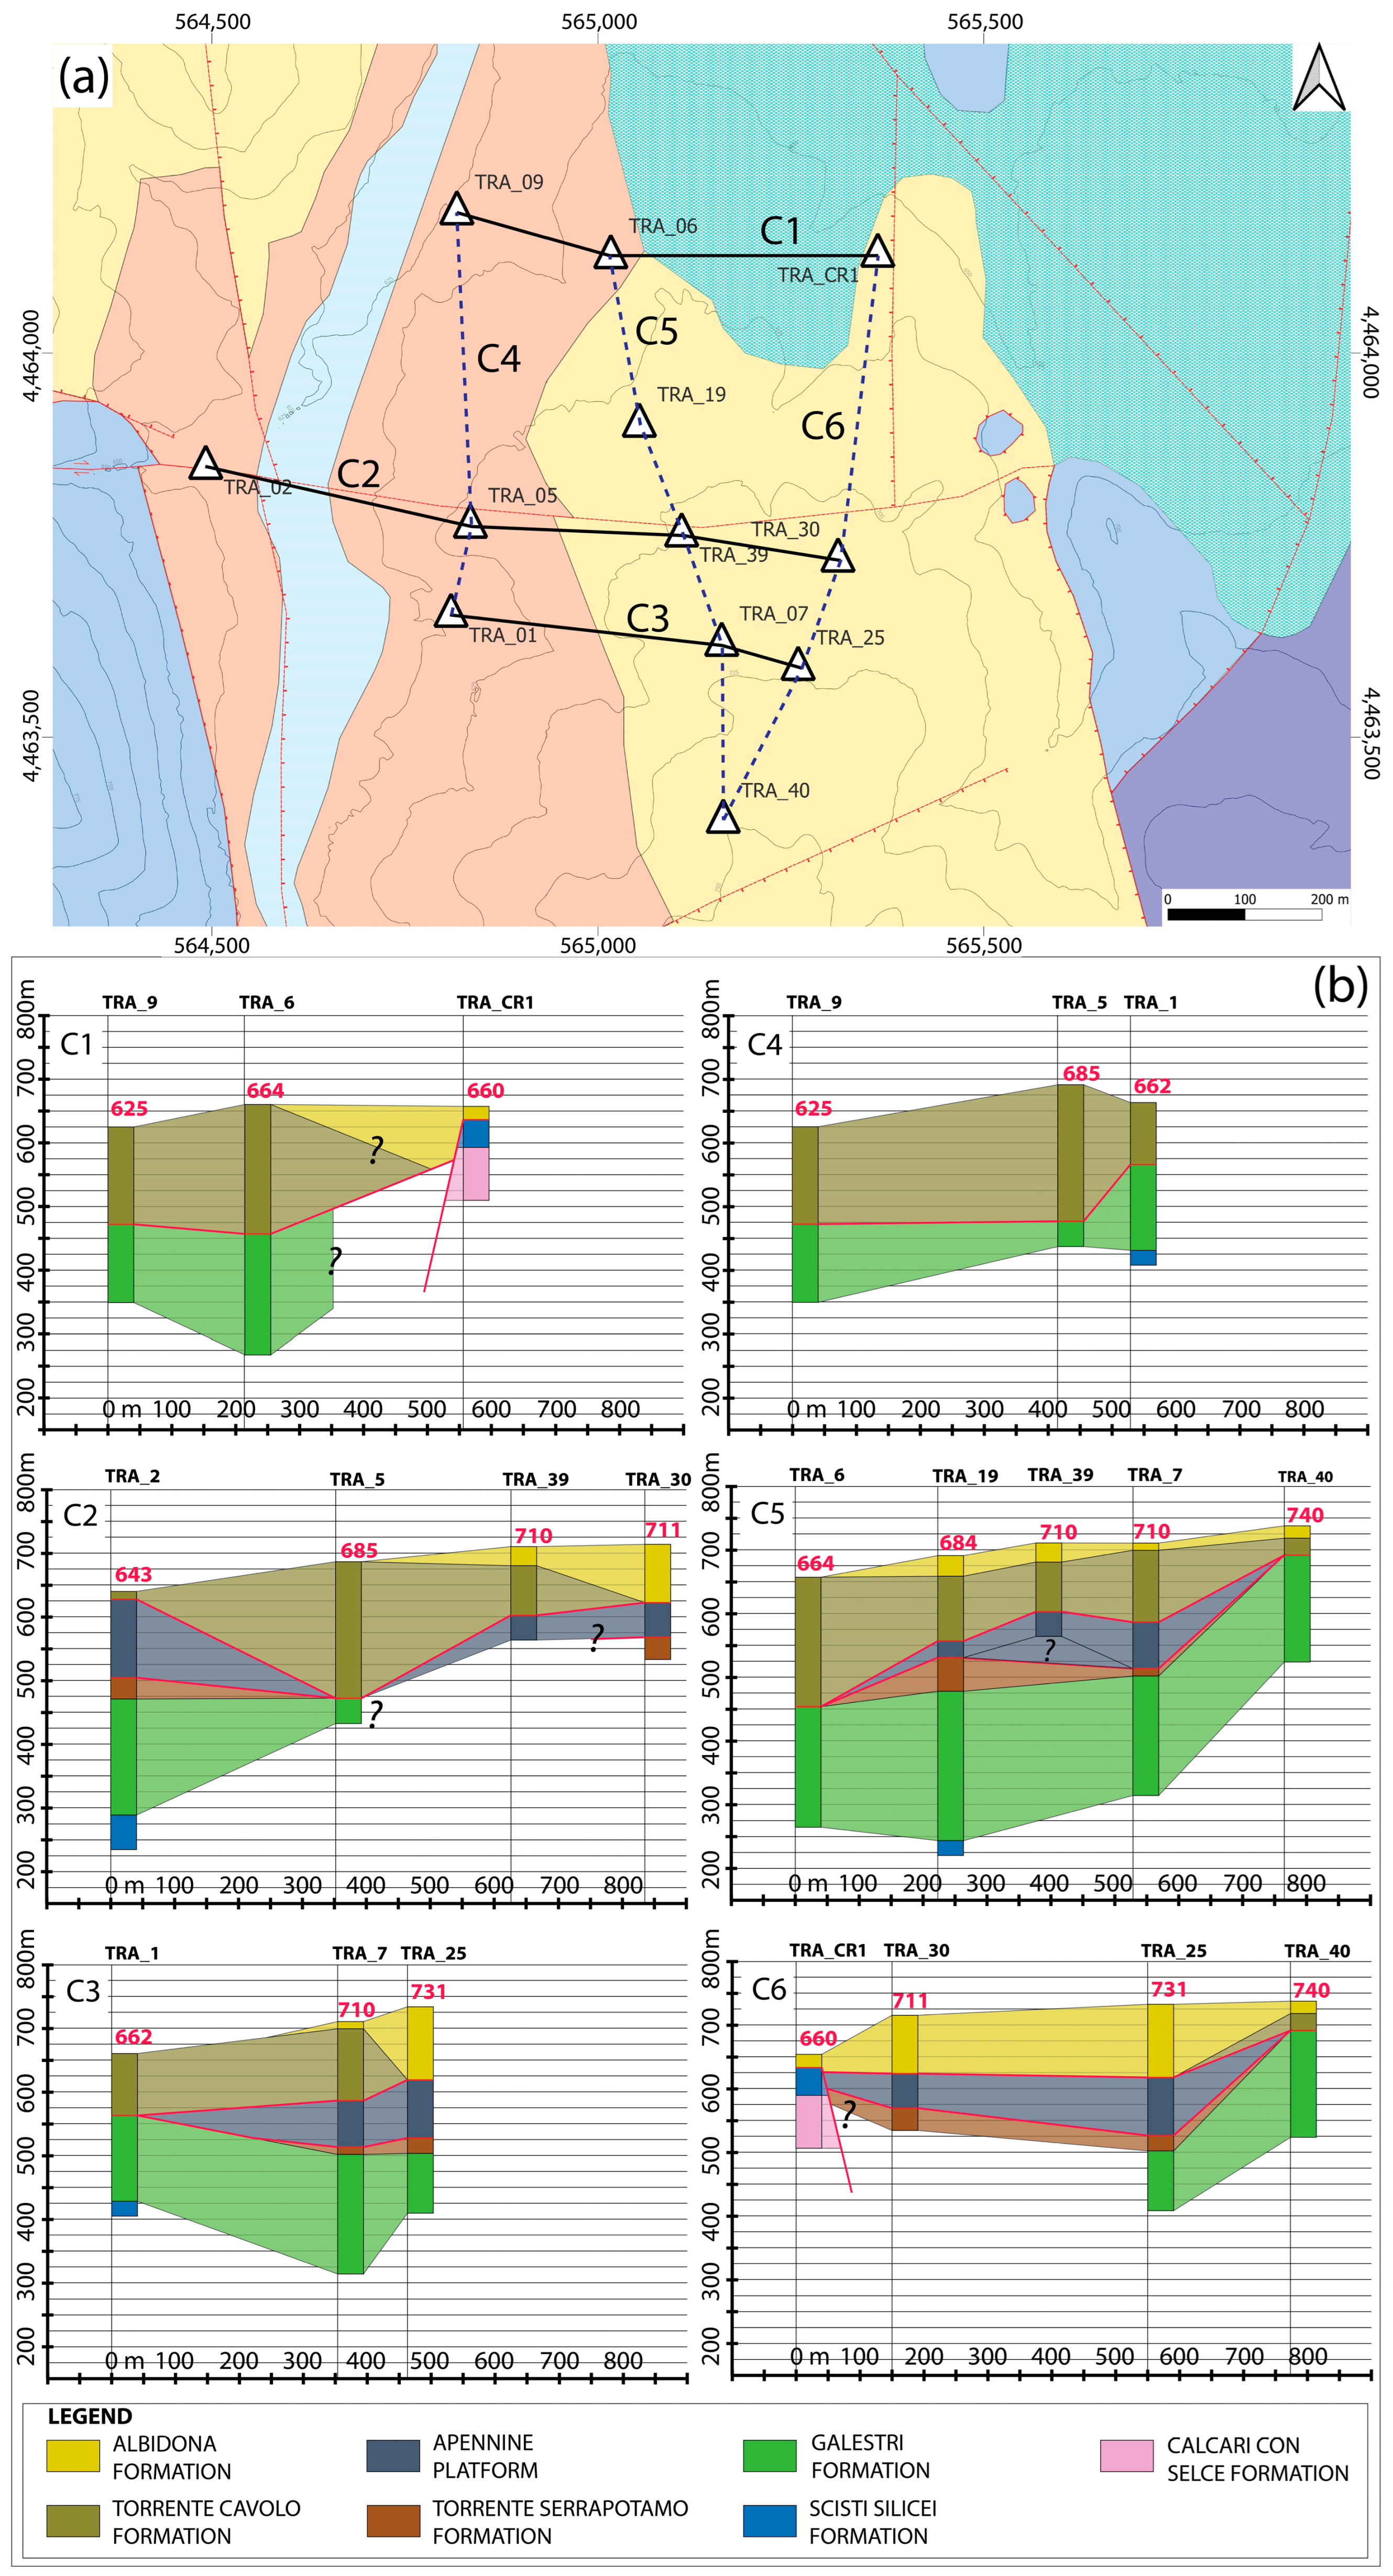
3.2. Well Scouting and Analysis of Well Logs
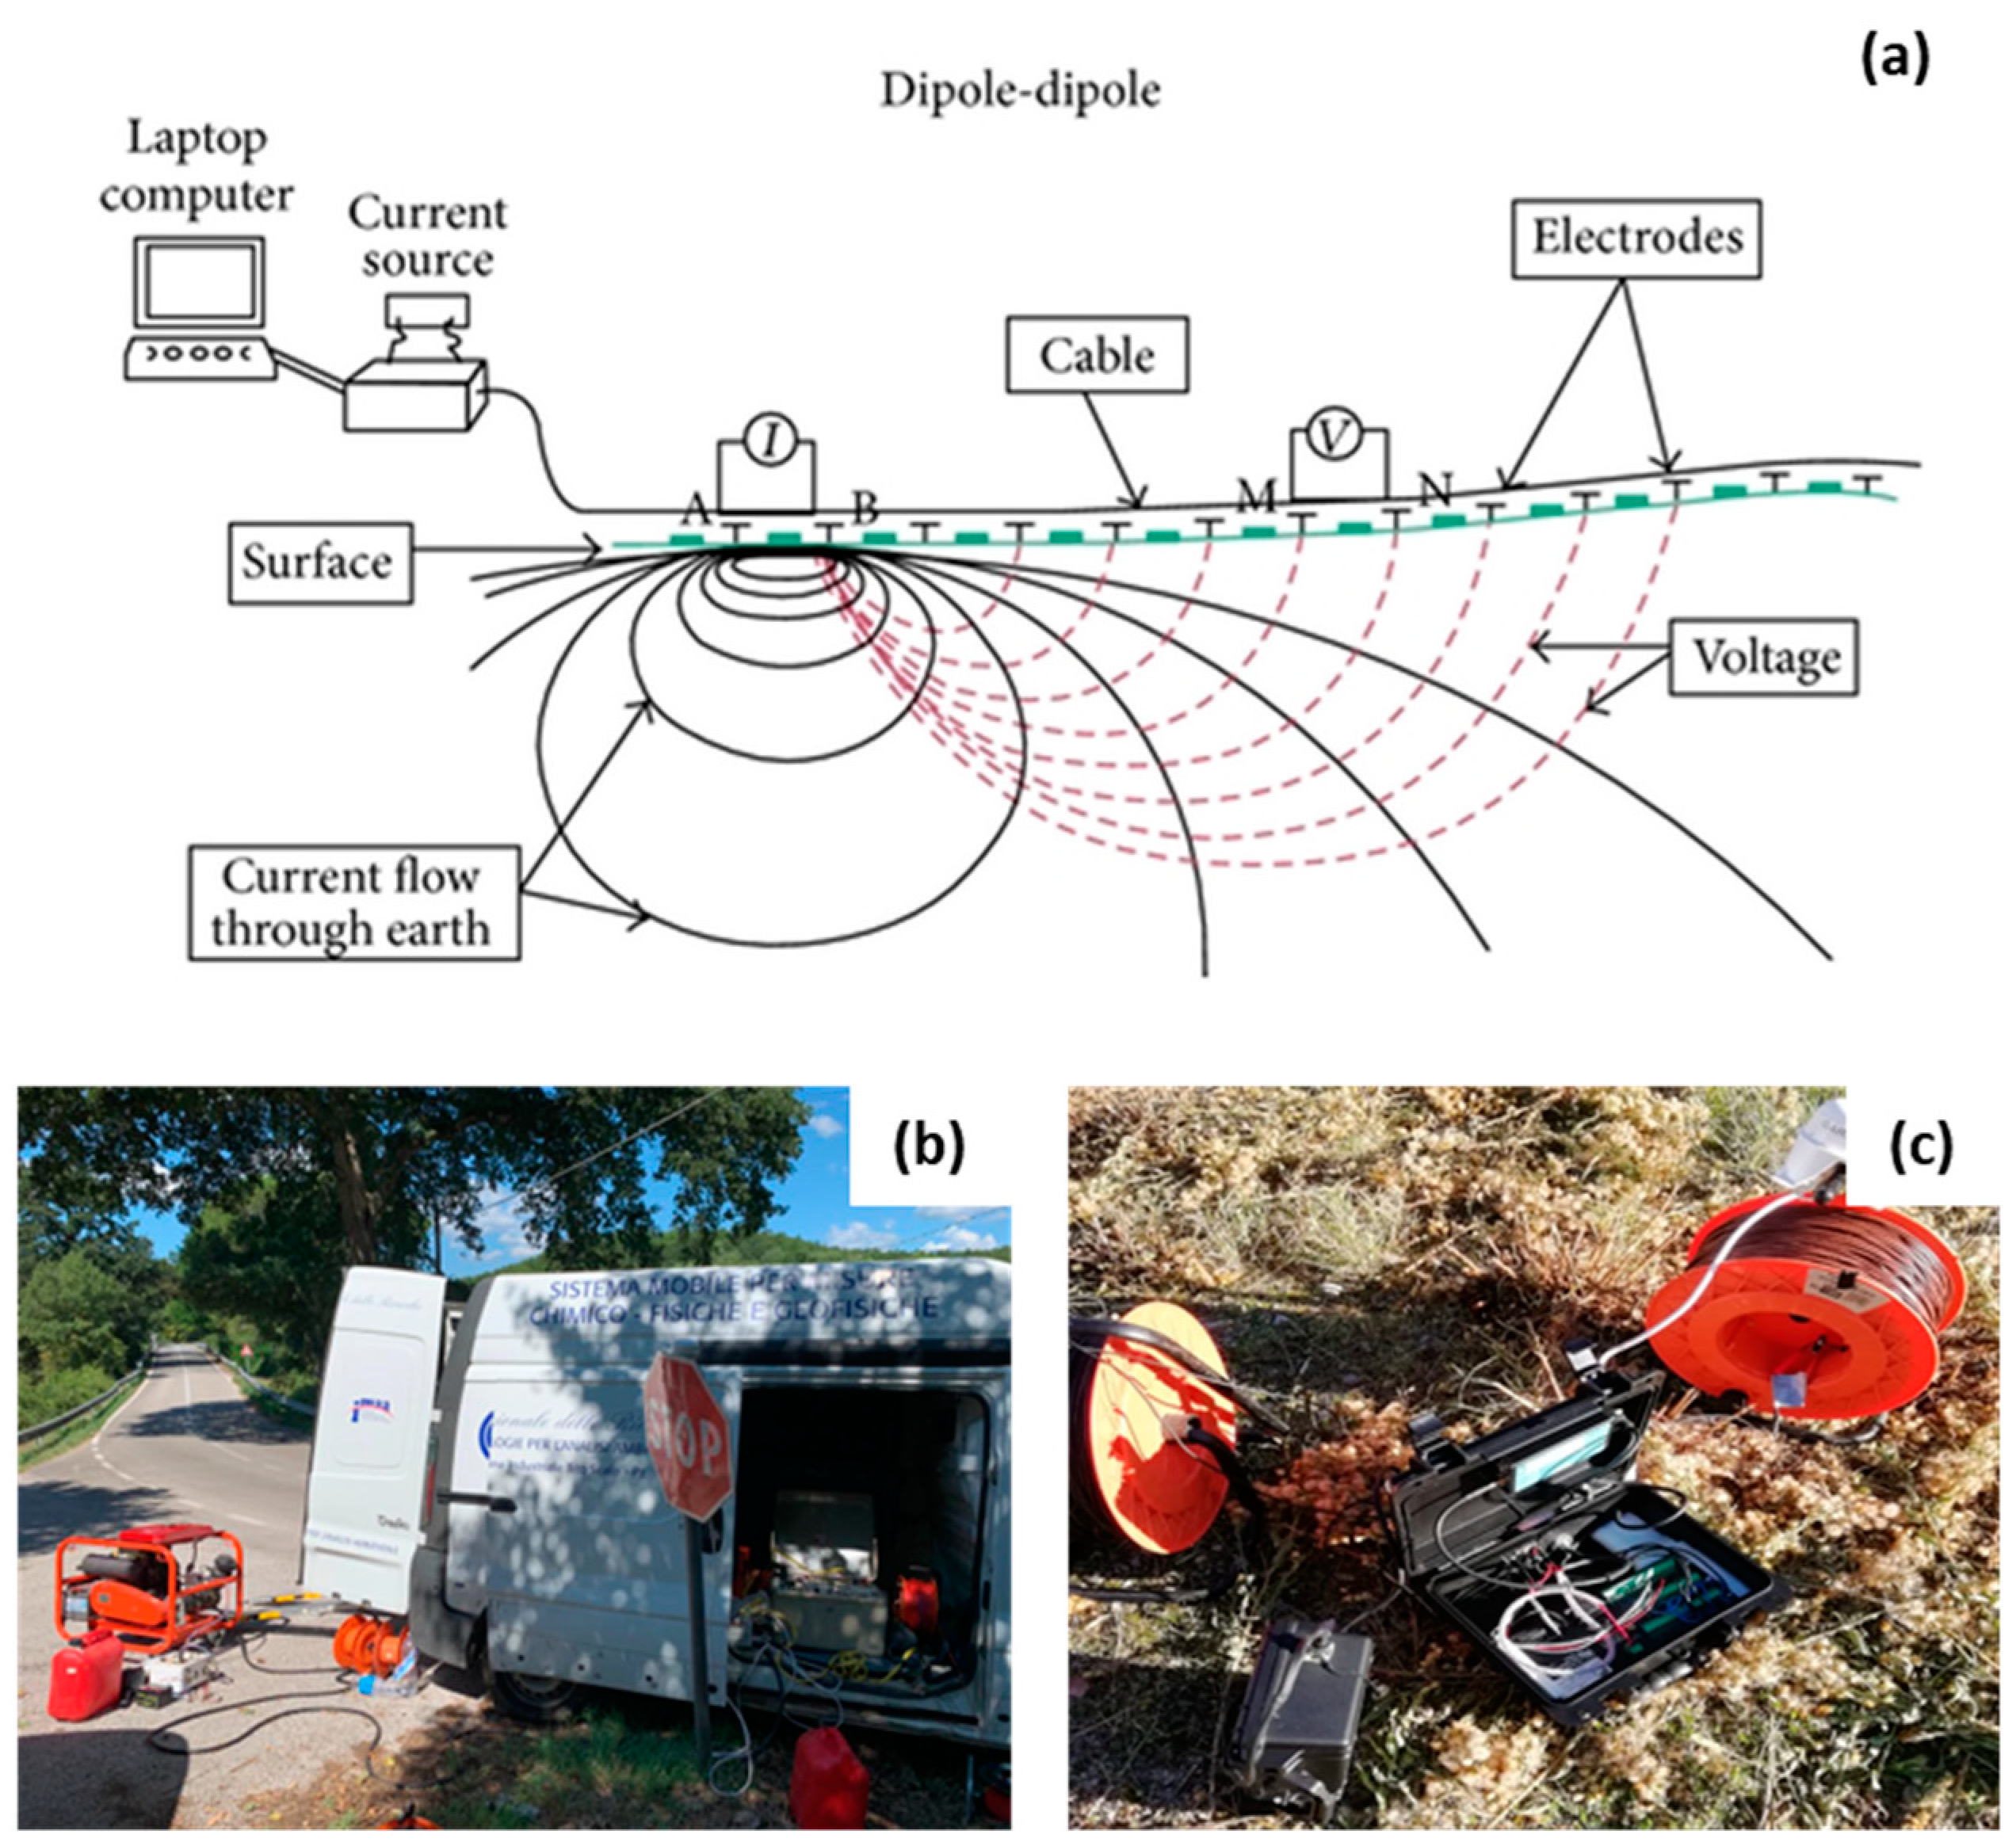
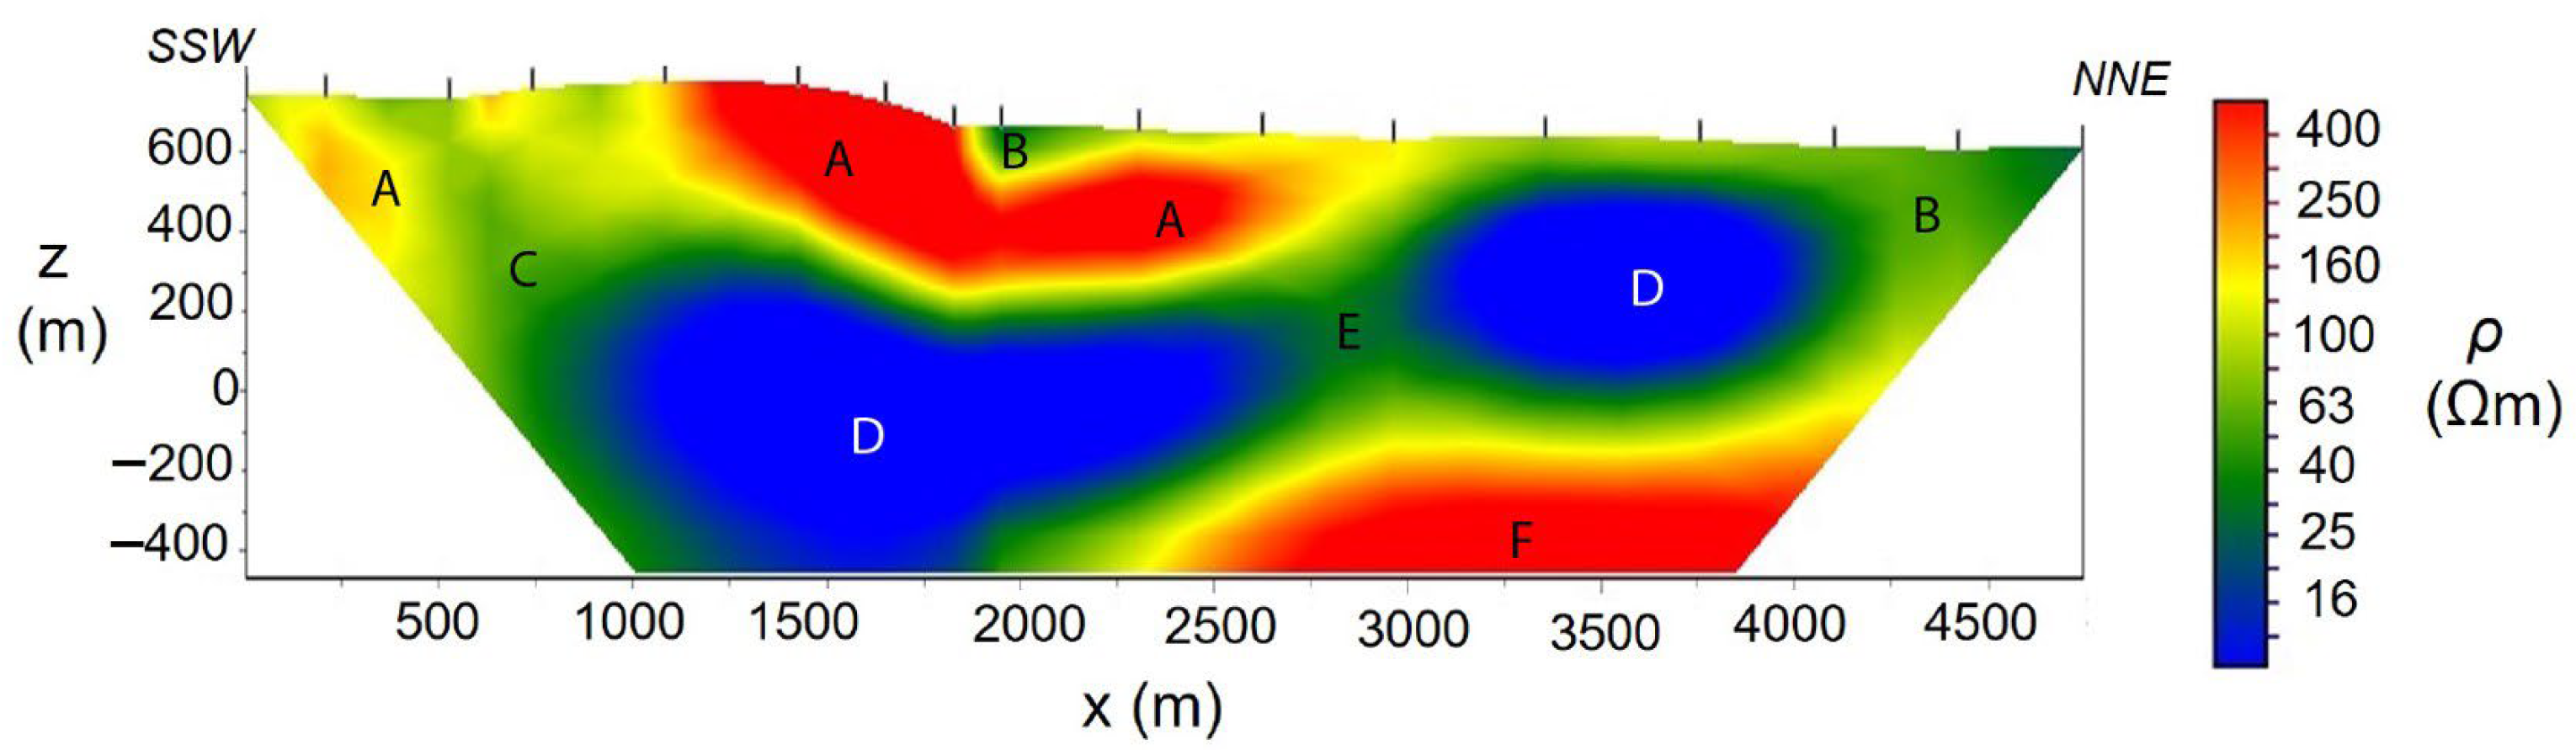
3.3. Deep Electrical Resistivity Investigation
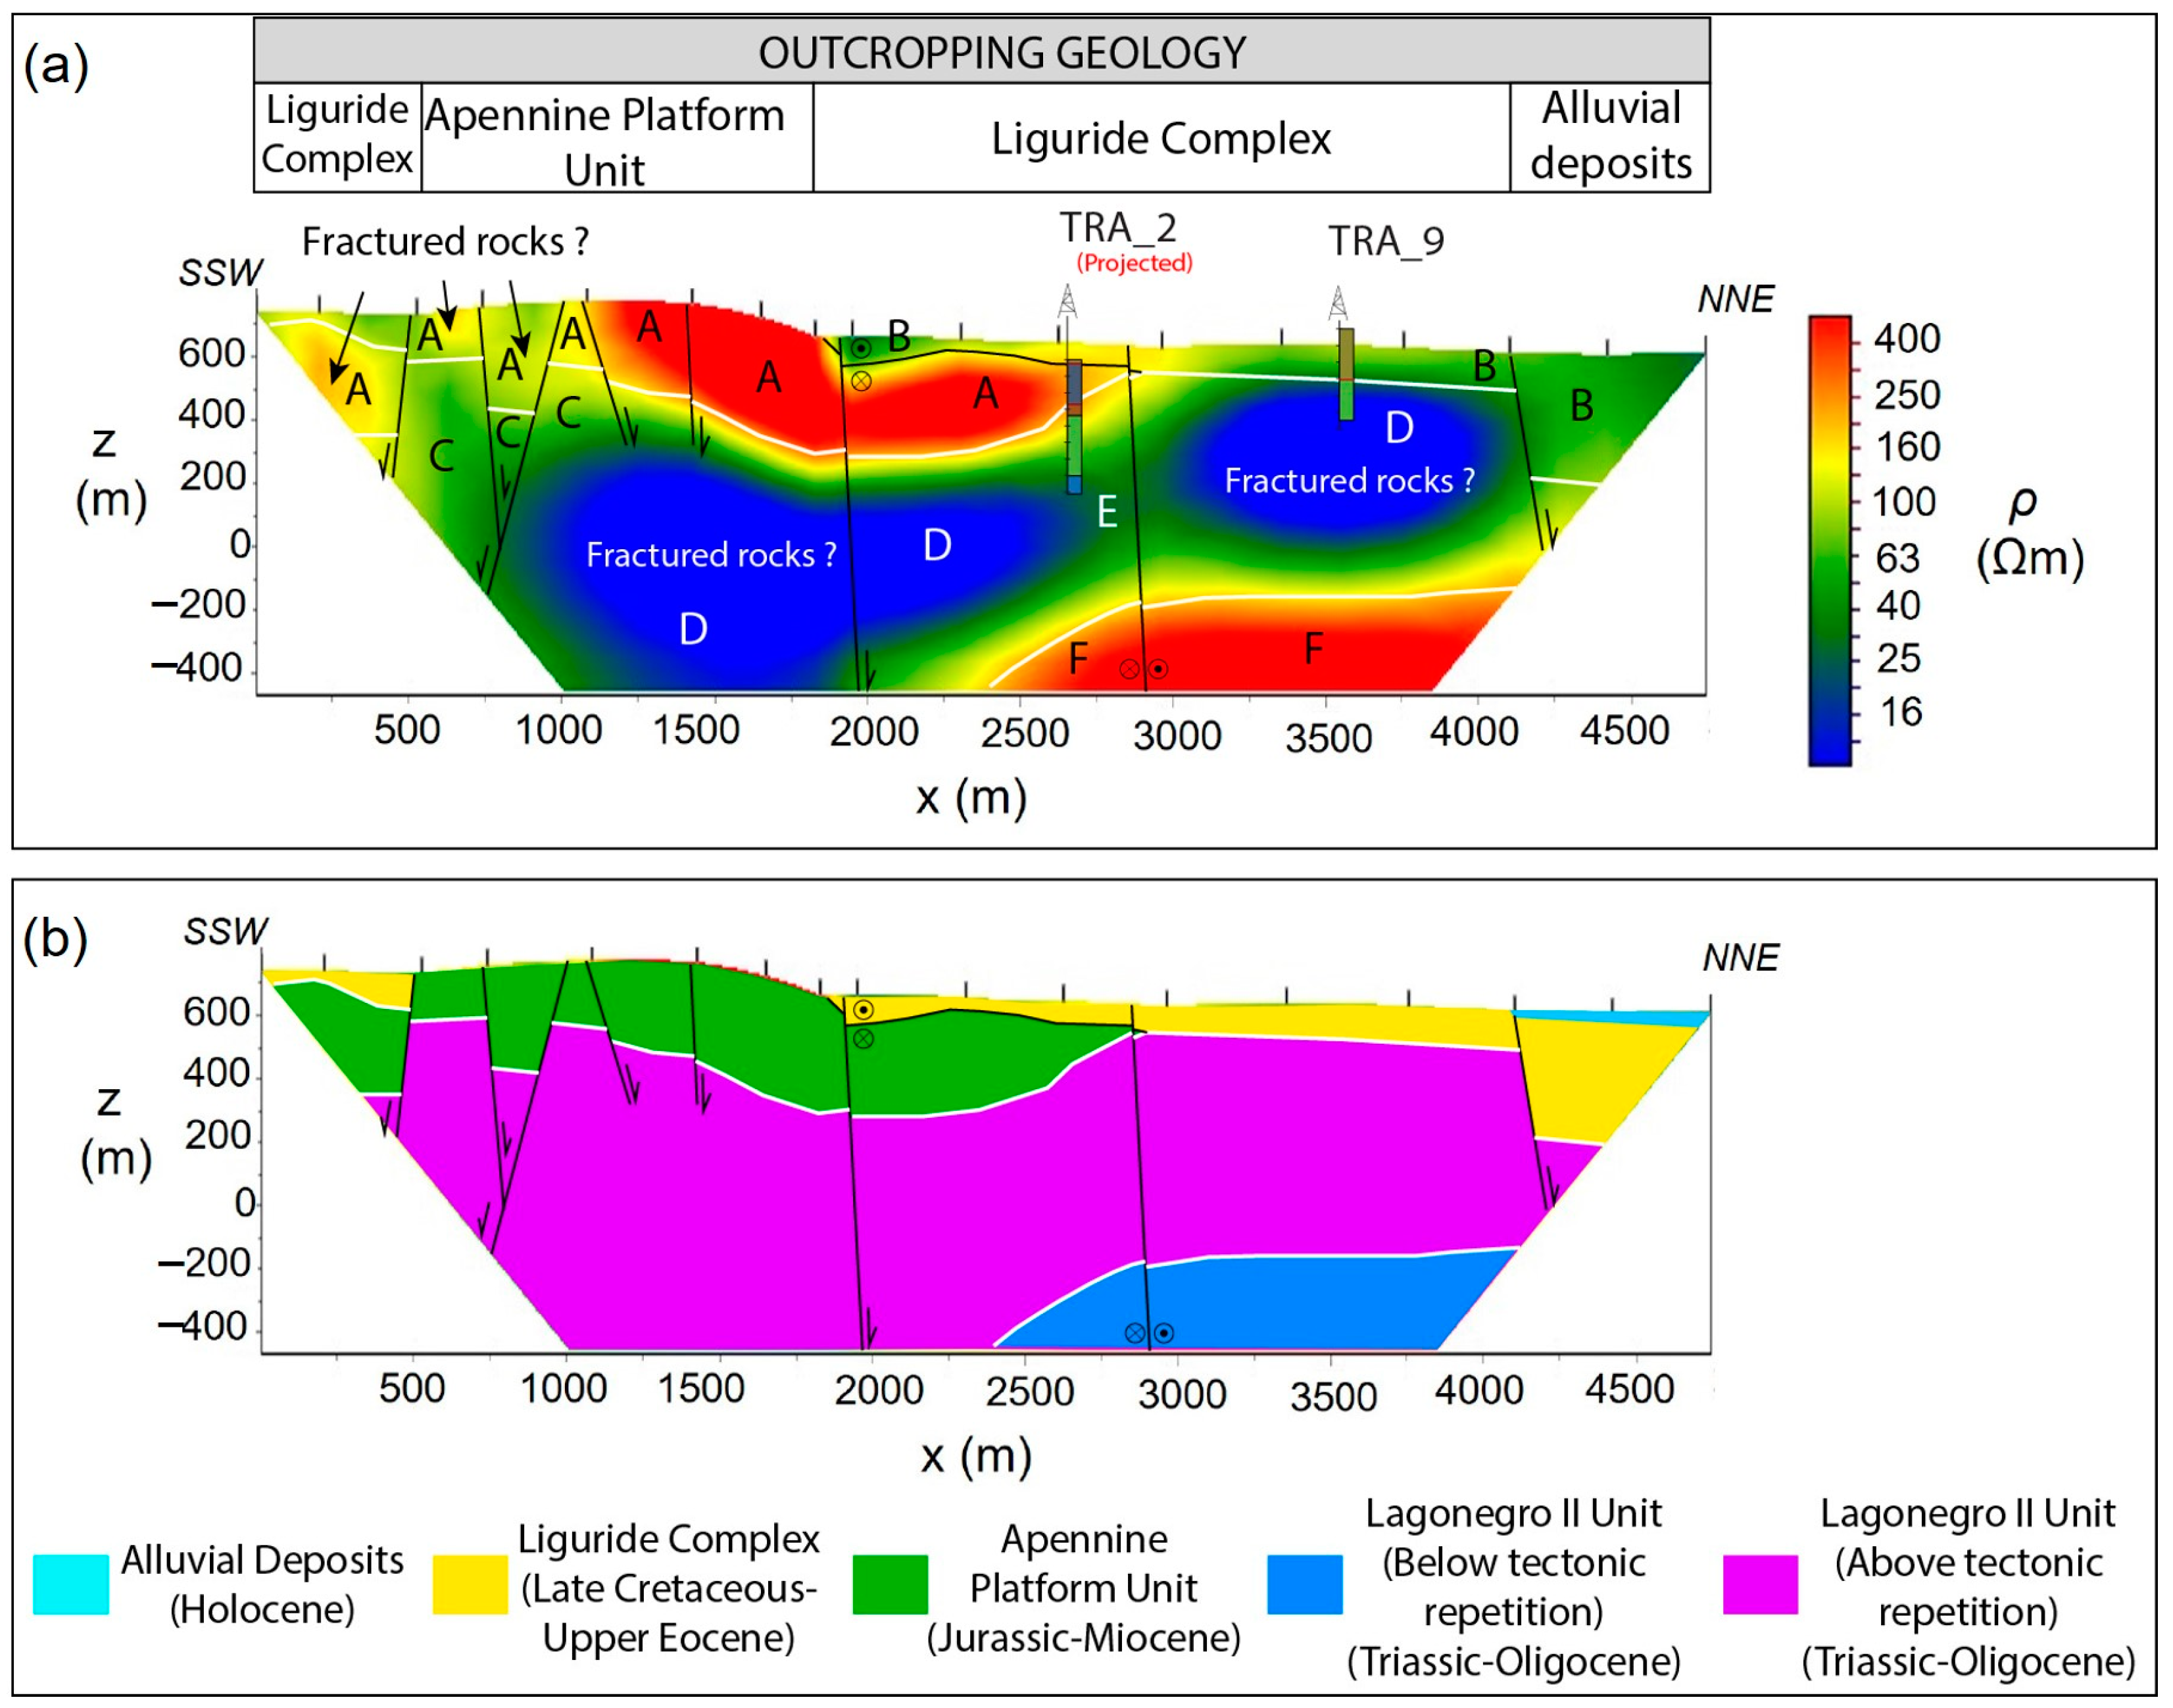
4. Results
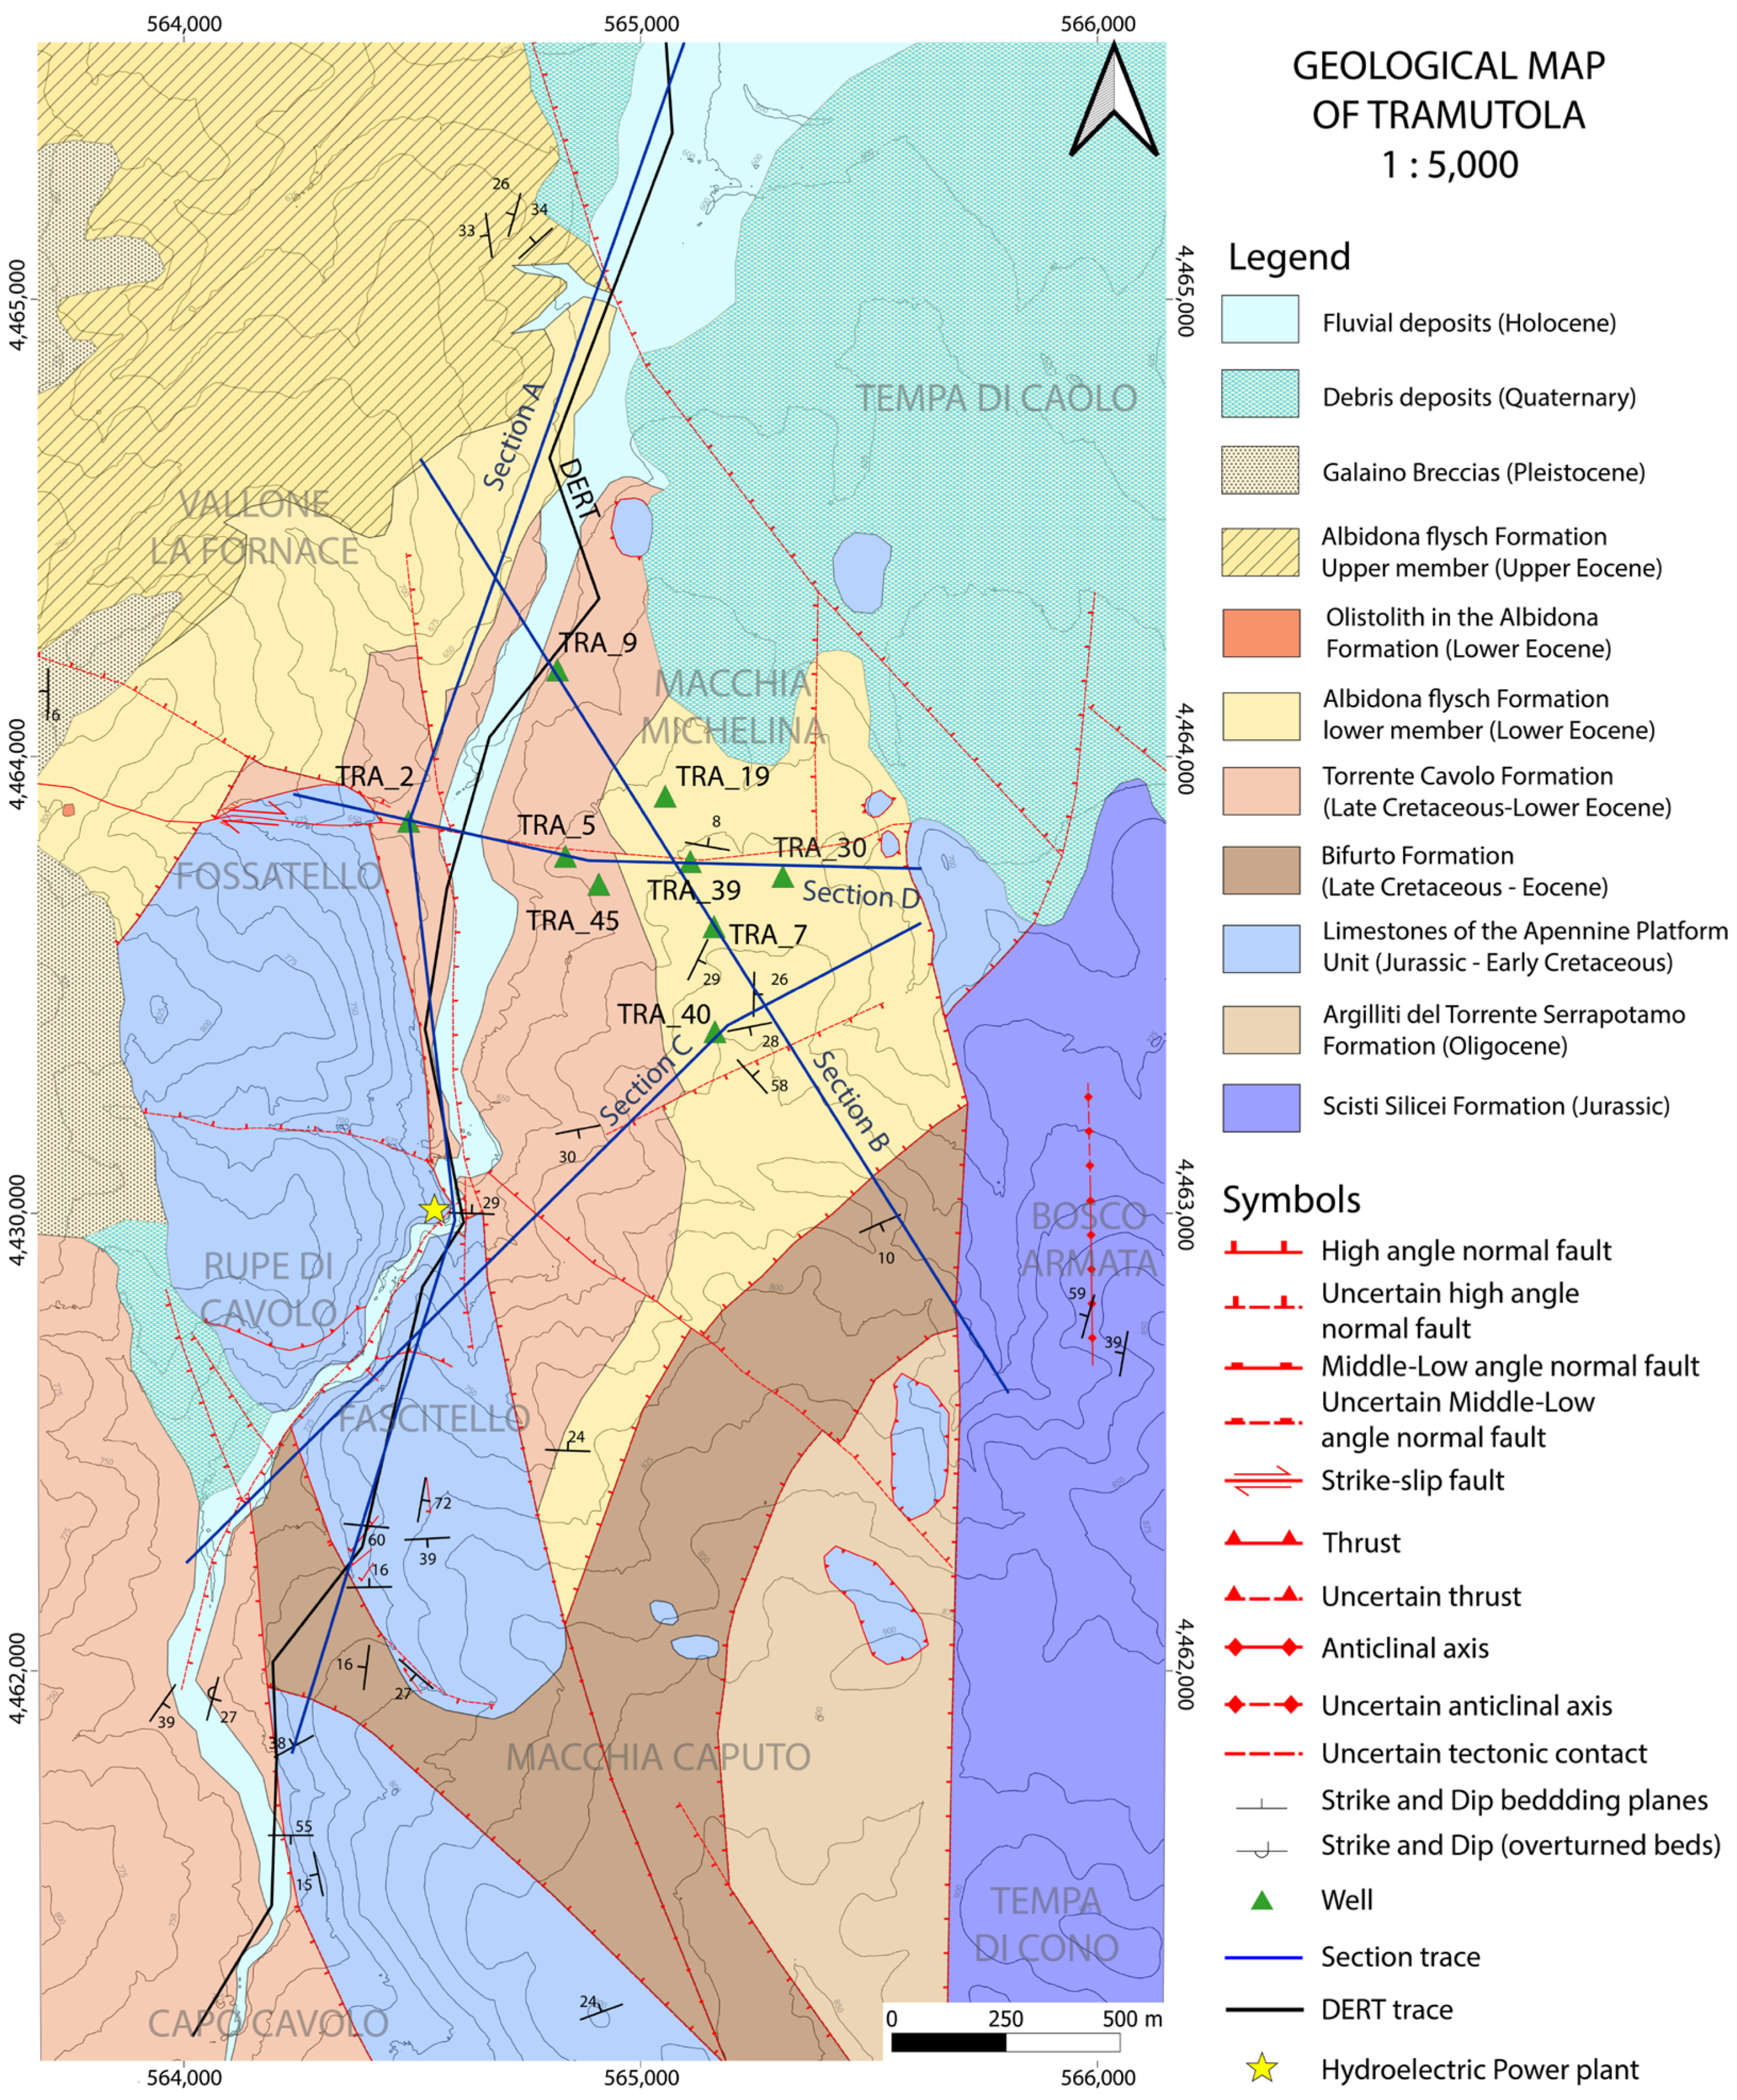
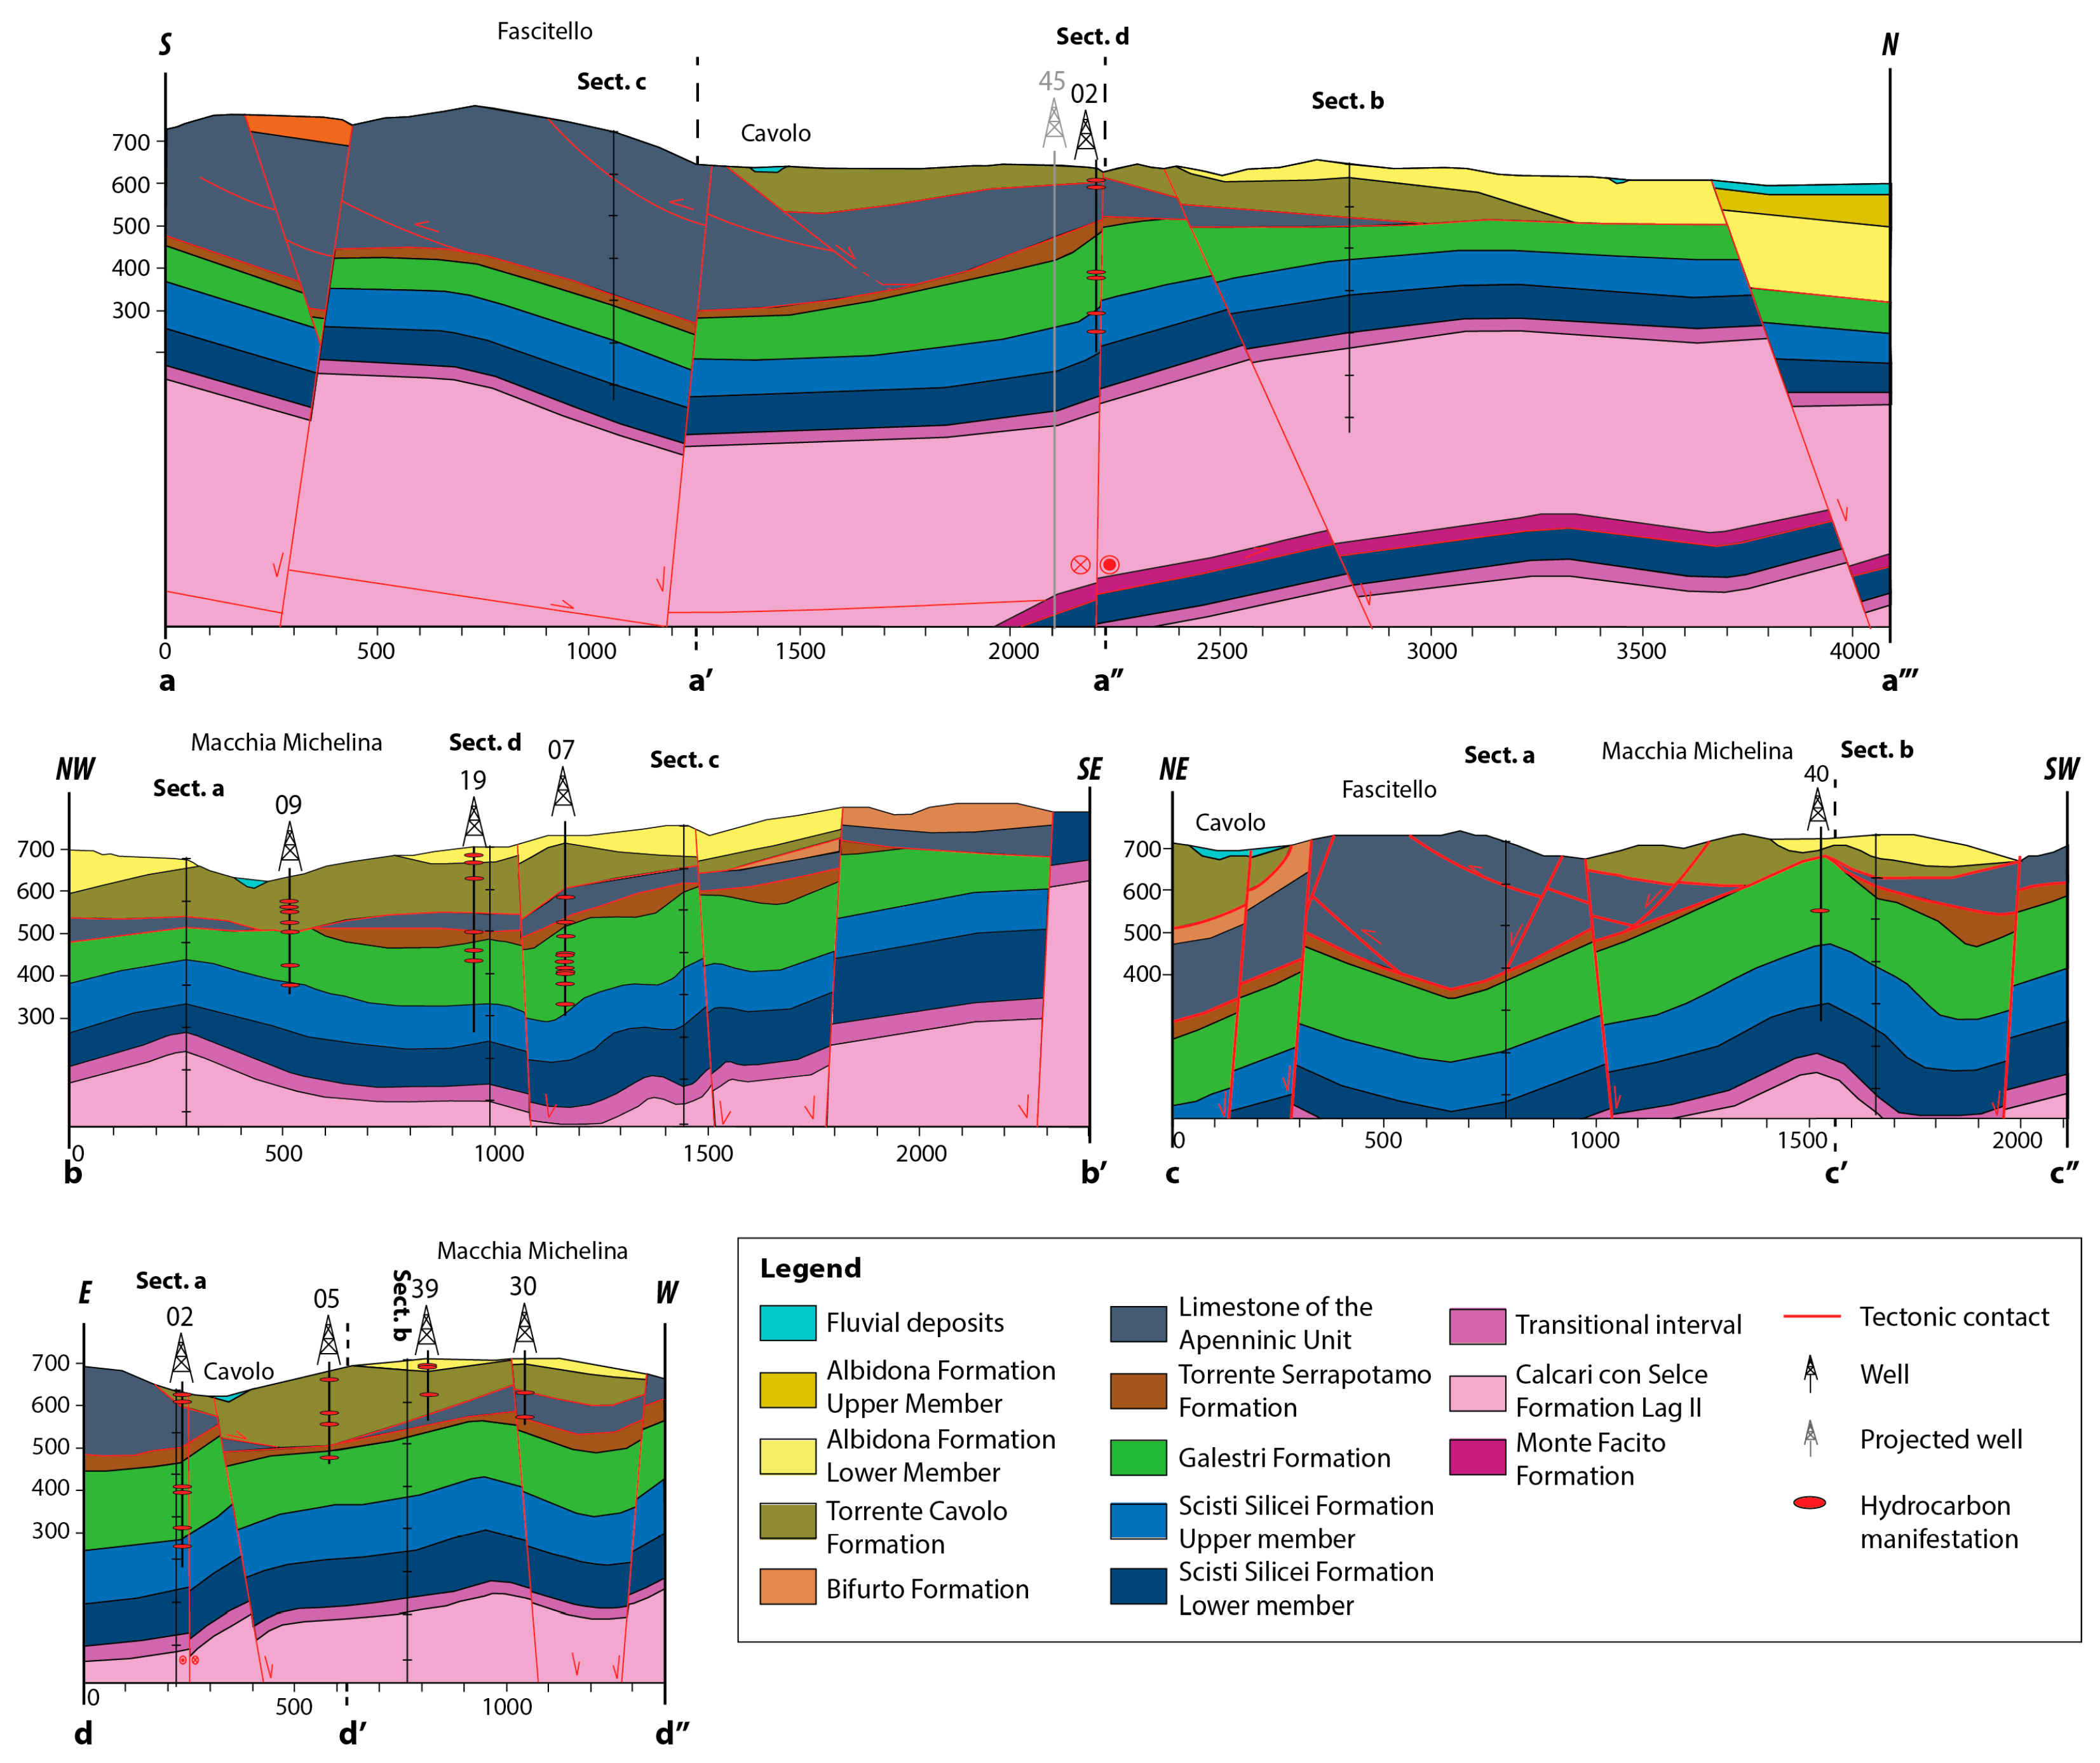
4.1. Stratigraphic and Structural Setting of the Study Area
4.1.1. Stratigraphic Setting of the Tramutola Area
4.1.2. Structural Setting
4.2. Interpretation of the Subsurface in the Study Area
4.2.1. Well Data
4.2.2. Geoelectrical Model of the Studied Area
5. Discussions
5.1. Synthesis of the Field and Subsurface Data
5.2. The Structure of the Apennine Platform
5.3. Inferences on Circulation of Deep Geofluids
6. Conclusions
- -
- Field geology, reinterpretation of old wells and a deep ERT survey allowed interpretation of the geological setting of the study area down to a 1 km depth and reconstruction of the geometry of the tectonic structures.
- -
- The western sector of the Agri Valley was affected by intense brittle–ductile deformation. In a first phase ductile and brittle deformation allowed the formation of contractional structures, followed by development of medium to low-angle faults derived by horizontal stretching.
- -
- In a second phase (during the Quaternary), different sets of high-angle normal faults offset the previous structures.
- -
- When placed in a wider context, the geological and structural data collected in the study area show that the carbonates of the Apennine Platform underwent significant tectonic thinning when compared with the typical successions exposed in the southern Apennines. Thinning was accomplished with the development of medium- to low-angle normal faults, which led to the boudinaging of the platform carbonates along the tectonic boundary between the Liguride Complex and the Lagonegro basin.
- -
- The DERT obtained in the present study allowed reconstruction of the presence of deep aquifers bounded with shallow and steeply dipping tectonic contacts.
- -
- The integration of surface and deep data suggested that the polyphase tectonic evolution recognized in the study area produced fault intersections that favored circulation and uprising of deep hypothermal fluids and, possibly, hydrocarbons.
Supplementary Materials
Author Contributions
Funding
Data Availability Statement
Acknowledgments
Conflicts of Interest
References
- Davídsdóttir, B. United nations sustainable development goals and geothermal development. In Proceedings of the SDG Short Course I on Sustainability and Environmental Management of Geothermal Resource Utilization and the Role of Geothermal in Combating Climate Change, Organized by UNU-GTP and LaGeo, Santa Tecla, El Salvador, 4–10 September 2016. [Google Scholar]
- Soldo, E.; Alimonti, C.; Scrocca, D. Geothermal Repurposing of Depleted Oil and Gas Wells in Italy. Proceedings 2020, 58, 9. [Google Scholar] [CrossRef]
- Watson, S.M.; Falcone, G.; Westaway, R. Repurposing Hydrocarbon Wells for Geothermal Use in the UK: The Onshore Fields with the Greatest Potential. Energies 2020, 13, 3541. [Google Scholar] [CrossRef]
- Santos, L.; Dahi Taleghani, A.; Elsworth, D. Repurposing abandoned wells for geothermal energy: Current status and future prospects. Renew. Energy 2022, 194, 1288–1302. [Google Scholar] [CrossRef]
- Molli, G.; Doveri, M.; Manzella, A.; Bonini, L.; Botti FMenichini, M.; Montanari, D.; Trumpy, E.; Ungari, A.; Vaselli, L. Surface-subsurface structural architecture and groundwater flow of the Equi Terme hydrothermal area, northern Tuscany Italy. Ital. J. Geosci. 2015, 134, 442–457. [Google Scholar] [CrossRef]
- Wellmann, F.; Caumon, G. Chapter One—3-D Structural geological models: Concepts, methods, and uncertainties. In Advances in Geophysics; Schmelzbach, C., Ed.; Elsevier: Amsterdam, The Netherlands, 2018; Volume 59, pp. 1–121. [Google Scholar] [CrossRef]
- Van Dijk, J.P.; Affinito, V.; Atena, R.; Caputi, A.; Cestari, A.; D’Elia, S.; Giancipoli, N.; Lanzellotti, M.; Lazzari, M.; Oriolo, N.; et al. Cento Anni di Ricerca Petrolifera. L’Alta Val d’Agri (Basilicata, Italia meridionale). In Proceedings of the 1º Congresso dell’Ordine dei Geologi di Basilicata, “Ricerca, Sviluppo ed Utilizzo delle Fonti Fossili: Il Ruolo del Geologo”, Potenza, Italy, 30 November 2012; pp. 29–77. [Google Scholar]
- Crema, C. Il petrolio nel territorio di Tramutola (Potenza). Boll. Soc. Geol. It. 1902, 21, 36–38. [Google Scholar]
- Bonarelli, G. Possibilità petrolifere nel territorio di Tramutola in Basilicata. G. Geol. 1932, 7, 25–46. [Google Scholar]
- Agip. Relazione sui Risultati delle Ricerche Petrolifere Eseguite dall’Agip nel Permesso di Tramutola (Potenza). 5p. 1940. Available online: https://www.videpi.com/videpi/cessati/relazione.asp?titolo=858&relazione=2227 (accessed on 10 January 2022).
- Cazzini, F.F. The history of the upstream oil and gas industry in Italy. In History of the European Oil and Gas Industry; Craig, J., Gerali, F., MacAulay, F., Sorkhabi, R., Eds.; Geological Society Special Publications: London, UK, 2018; Volume 465, pp. 243–274. [Google Scholar]
- Francalanei, G.P.; Visintin, V. Ubicazione e Previsioni di un Sondaggio Profondo nel Permesso “Tramutola”; AGIP Mineraria, Ufficio Geologico Regionale: Naples, Italy, 1958; p. 5. [Google Scholar]
- Aronica, F. Manifestazioni di Idrocarburi nell’Italia Meridionale; Con Schede Descrittive; AGIP Mineraria, Ufficio Geologico Regionale: Naples, Italy, 1959; p. 11. [Google Scholar]
- Mazzoli, S.; Corrado, S.; De Donatis, M.; Scrocca, D.; Butler, R.W.H.; Di Bucci, D.; Naso, G.; Nicolai, C.; Zucconi, V. Time and spacevariability of “thin-skinned” and “thick-skinned” thrust tectonics in the Apennines (Italy). Atti Accad. Naz. Lincei. Rendiconti. Cl. Sci. Fis. Mat. Nat. 2000, 11, 5–39. [Google Scholar]
- Menardi Noguera, A.; Rea, G. Deep structure of the Campanian-Lucanian arc (southern Apennines). Tectonophysics 2000, 324, 239–265. [Google Scholar] [CrossRef]
- Morandi, S.; Ceraglioli, E. Integrated interpretation of seismic and resistivity images across the Val d’Agri graben (Italy). Ann. Geophys. 2002, 45, 259–271. [Google Scholar] [CrossRef]
- Dell’Aversana, P. Integration loop of ‘global offset’ seismic, continuous profiling magnetotelluric and gravity data. First Break 2003, 21, 32–41. [Google Scholar] [CrossRef]
- Shiner, P.; Beccacini, A.; Mazzoli, S. Thin-skinned versus thick-skinned structural models for Apulian carbonate reservoirs: Constraints from the Val d’Agri Fields, S Apennines, Italy. Mar. Pet. Geol. 2004, 21, 805–827. [Google Scholar] [CrossRef]
- Turrini, C.; Renninson, P. Structural Style from the Southern Apennines’ Hydrocarbon Province—An Integrated View. In Thrust Tectonics and Hydrocarbon Systems; AAPG Memoir; McClay, K.R., Ed.; American Association of Petroleum Geologists: Tulsa, OK, USA, 2004; Volume 82, pp. 558–578. [Google Scholar]
- Megna, A.; Candela, S.; Mazzoli, S.; Santini, S. An analytical model for the geotherm in the Basilicata oil fields area (southern Italy). Ital. J. Geosci. 2014, 133, 204–213. [Google Scholar] [CrossRef]
- Balasco, M.; Giocoli, A.; Piscitelli, S.; Romano, G.; Siniscalchi, A.; Stabile, T.A.; Tripaldi, S. Magnetotelluric investigation in the High Agri Valley (southern Apennine, Italy). Nat. Hazards Earth Syst. Sci. 2015, 15, 843–852. [Google Scholar] [CrossRef]
- Balasco, M.; Cavalcante, F.; Romano, G.; Serlenga, V.; Siniscalchi, A.; Stabile, T.A.; Lapenna, V. New insights into the High Agri Valley deep structure revealed by magnetotelluric imaging and seismic tomography (Southern Apennine, Italy). Tectonophysics 2021, 808, 228817. [Google Scholar] [CrossRef]
- Nicolai, C.; Gambini, R. Structural architecture of the Adria Structural architecture of the Adria platform-and-basin system. Boll. Soc. Geol. Ital. 2007, 7, 21–37. [Google Scholar]
- Casero, P. Structural setting of petroleum exploration plays in Italy. Spec. Vol. Ital. Geol. Soc. IGC 2004, 32, 189–199. [Google Scholar]
- Mazzoli, S.; Ascione, A.; Buscher, J.T.; Pignalosa, A.; Valente, E.; Zattin, M. Low-angle normal faulting and focused exhumation associated with late Pliocene change in tectonic style in the southern Apennines (Italy). Tectonics 2014, 33, 1802–1818. [Google Scholar] [CrossRef]
- Prosser, G.; Palladino, G.; Avagliano, D.; Coraggio, F.; Bolla, E.M.; Riva, M.; Catellani, D.E. Stratigraphic and Tectonic Setting of the Liguride Units Cropping Out along the Southeastern Side of the Agri Valley (Southern Apennines, Italy). Geosciences 2021, 11, 125. [Google Scholar] [CrossRef]
- Candela, S.; Mazzoli, S.; Megna, A.; Santini, S. Finite element modelling of stress field perturbations and interseismic crustal deformation in the Val d’Agri region, southern Apennines, Italy. Tectonophysics 2015, 657, 245–259. [Google Scholar] [CrossRef]
- Maschio, L.; Ferranti, L.; Burrato, P. Active extension in Val d’Agri area, Southern Apennines, Italy: Implications for the geometry of the seismogenic belt. Geophys. J. Int. 2005, 162, 591–609. [Google Scholar] [CrossRef]
- Burrato, P.; Valensise, G. Rise and Fall of a Hypothesized Seismic Gap: Source Complexity in the Mw 7:0 16 December 1857 Southern Italy Earthquake. Bull. Seismol. Soc. Am. 2008, 98, 139–148. [Google Scholar] [CrossRef]
- Valoroso, L.; Improta, L.; De Gori, P.; Chiarabba, C. Upper crustal structure, seismicity and pore pressure variations in an extensional seismic belt through 3D and 4D Vp and Vp/Vs models: The example of the Val d’Agri area (southern Italy). J. Geophys. Res. 2011, 116, B07303. [Google Scholar] [CrossRef]
- Stabile, T.A.; Giocoli, A.; Lapenna, V.; Perrone, A.; Piscitelli, S.; Telesca, L. Evidence of Low-Magnitude Continued Reservoir-Induced Seismicity Associated with the Pertusillo Artificial Lake (Southern Italy). Bull. Seismol. Soc. Am. 2014, 104, 1820–1828. [Google Scholar] [CrossRef]
- Improta, L.; Bagh, S.; De Gori, P.; Valoroso, L.; Pastori, M.; Piccinini, D.; Chiarabba, C.; Anselmi, M.; Buttinelli, M. Reservoir structure and wastewater-induced seismicity at the Val d’Agri oilfield (Italy) shown by three-dimensional Vp and Vp/Vs local earthquake tomography. J. Geophys. Res. Solid Earth 2017, 122, 9050–9082. [Google Scholar] [CrossRef]
- Bello, S.; Lavecchia, G.; Andrenacci, C.; Ercoli, M.; Cirillo, D.; Carboni, F.; Barchi, M.R.; Brozzetti, F. Complex trans-ridge normal faults controlling large earthquakes. Sci. Rep. 2022, 12, 10676. [Google Scholar] [CrossRef] [PubMed]
- Cello, G.; Invernizzi, C.; Mazzoli, S.; Tondi, E. Fault properties and fluid flow patterns from Quaternary faults in the Appennines, Italy. Tectonophysics 2001, 336, 63–78. [Google Scholar] [CrossRef]
- Italiano, F.; Martelli, M.; Martinelli, G.; Nuccio, P.M.; Paternoster, M. Significance of earthquake-related anomalies in fluids of Val D’Agri (southern Italy). Terra Nova 2001, 13, 249–257. [Google Scholar] [CrossRef]
- Colangelo, G.; Heinicke, J.; Lapenna, V.; Martinelli, G.; Mucciarelli, M. Investigating correlations of local seismicty with anomalous geoelectrical, hydrogeological and geochemical signals jointly recorded in Basilicata Region (Southern Italy). Ann. Geophys. 2007, 50, 527–538. [Google Scholar] [CrossRef]
- Storz, H.; Storz, W.; Jacobs, F. Electrical resistivity tomography to investigate geological structures of the earth’s upper crust. Geophys. Prospect. 2000, 48, 455–471. [Google Scholar] [CrossRef]
- Suzuki, K.; Toda, S.; Kusunoki, K.; Fujimitsu, Y.; Mogi, T.; Jomori, A. Case studies of electrical and electromagnetic methods applied to mapping active faults beneath the thick quaternary. Eng. Geol. 2000, 56, 29–45. [Google Scholar] [CrossRef]
- Tamburriello, G.; Balasco, M.; Rizzo, E.; Harabaglia, P.; Lapenna, V.; Siniscalchi, A. Deep electrical resistivity tomography and geothermal analysis of Bradano foredeep deposits in Venosa area (Southern Italy): Preliminary results. Ann. Geophys. 2008, 203, 2012. [Google Scholar] [CrossRef]
- Balasco, M.; Galli, P.; Giocoli, A.; Gueguen, E.; Lapenna, V.; Perrone, A.; Piscitelli, S.; Rizzo, E.; Romano, G.; Siniscalchi, A.; et al. Deep geophysical electromagnetic section across the middle Aterno Valley (central Italy): Preliminary results after the April 6, 2009 L’Aquila earthquake. Boll. Geofis. Teor. Appl. 2011, 52, 443–455. [Google Scholar] [CrossRef]
- Pucci, S.; Civico, R.; Villani, F.; Ricci, T.; Delcher, E.; Finizola, A.; Sapia, V.; De Martini, P.M.; Pantosti, D.; Barde-Cabusson, S.; et al. Deep electrical resistivity tomography along the tectonically active Middle Aterno Valley (2009 L’Aquila earthquake area, central Italy). Geophys. J. Int. 2016, 207, 967–982. [Google Scholar] [CrossRef]
- Gresse, M.; Vandemeulebrouck, J.; Byrdina, S.; Chiodini, G.; Revil, A.; Johnson, T.C.; Ricci, T.; Vilardo, G.; Mangiacapra, A.; Lebourg, T.; et al. Three-dimensional electrical resistivity tomography of the Solfatara Crater (Italy): Implication for the multiphase flow structure of the shallow hydrothermal system. J. Geophys. Res. Solid Earth 2017, 122, 8749–8768. [Google Scholar] [CrossRef]
- Carrier, A.; Fischanger, F.; Gance, J.; Cocchiararo, G.; Morelli, G.; Lupi, M. Deep electrical resistivity tomography for the prospection of low- to medium-enthalpy geothermal resources. Geophys. J. Int. 2019, 219, 2056–2072. [Google Scholar] [CrossRef]
- Rizzo, E.; Giampaolo, V.; Capozzoli, L.; Grimaldi, S. Deep electrical resistivity tomography for the hydrogeological setting of Muro Lucano Mounts Aquifer (Basilicata, Southern Italy). Geofluids 2019, 2019, 6594983. [Google Scholar] [CrossRef]
- Troiano, A.; Isaia, R.; Di Giuseppe, M.G.; Tramparulo, F.D.A.; Vitale, S. Deep Electrical Resistivity Tomography for a 3D picture of the most active sector of Campi Flegrei caldera. Sci. Rep. 2019, 9, 15124. [Google Scholar] [CrossRef]
- Porras, D.; Carrasco, J.; Carrasco, P.; González, P.J. Imaging extensional fault systems using deep electrical resistivity tomography: A case study of the Baza fault, Betic Cordillera, Spain. J. Appl. Geophys. 2022, 202, 104673. [Google Scholar] [CrossRef]
- Rizzo, E.; Giampaolo, V.; Capozzoli, L.; De Martino, G.; Romano, G.; Santilano, A.; Manzella, A. 3D deep geoelectrical exploration in the Larderello geothermal sites (Italy). Phys. Earth Planet. Inter. 2022, 329–330, 106906. [Google Scholar] [CrossRef]
- Rizzo, E.; Colella, A.; Lapenna, V.; Piscitelli, S. High-resolution images of the fault-controlled High Agri Valley basin (Southern Italy) with deep and shallow electrical resistivity tomographies. Phys. Chem. Earth 2004, 29, 321–327. [Google Scholar] [CrossRef]
- Rizzo, E.; Giampaolo, V. New deep electrical resistivity tomography in the High Agri Valley basin (Basilicata, Southern Italy). Geomat. Nat. Hazards Risk 2019, 10, 197–218. [Google Scholar] [CrossRef]
- Improta, L.; Iannaccone, G.; Capuano, P.; Zollo, A.; Scandone, P. Inferences on the upper crustal structure of Southern Apennines (Italy) from seismic refraction investigations and sub-surface data. Tectonophysics 2000, 317, 273–297. [Google Scholar] [CrossRef]
- Mazzoli, S.; Barkam, S.; Cello, G.; Gambini, R.; Mattioni, L.; Shiner, P.; Tondi, E. Reconstruction of continental margin architecture deformed by the contraction of the Lagonegro basin, Southern Apennines, Italy. J. Geol. Soc. 2001, 158, 309–319. [Google Scholar] [CrossRef]
- Patacca, E.; Scandone, P. Geology of the Southern Apennines. Boll. Soc. Geol. Ital. 2007, 7, 75–119. [Google Scholar]
- Patacca, E.; Scandone, P. Il contributo degli studi stratigrafici di superficie e sottosuolo alla conoscenza dell’Appennino Capano-Lucano. In Proceedings of the 1º Congresso dell’Ordine dei Geologi di Basilicata, “Ricerca, Sviluppo ed Utilizzo delle Fonti Fossili: Il Ruolo del Geologo”, Potenza, Italy, 30 November–2 December 2012; pp. 97–153. [Google Scholar]
- Malinverno, A.; Ryan, W.B. Extension in the Thyrrhenian sea and shortening in the Apennines as a results of arc migration driven by sinking of the lithosphere. Tectonics 1986, 5, 227–245. [Google Scholar] [CrossRef]
- Gueguen, E.; Doglioni, C.; Fernandez, M. On the post-25 Ma geodynamic evolution of the western Mediterranean. Tectonophysics 1998, 298, 259–269. [Google Scholar] [CrossRef]
- Rosenbaum, G.; Lister, G.S. Neogene and Quaternary rollback evolution of the Tyrrhenian Sea, the Apennines, and the Sicilian Maghrebides. Tectonics 2004, 23, TC1013. [Google Scholar] [CrossRef]
- Mattei, M.; Cifelli, F.; D’Agostino, N. The evolution of the Calabrian Arc: Evidence from paleomagnetic and GPS observations. Earth Planet. Sci. Lett. 2007, 263, 259–274. [Google Scholar] [CrossRef]
- Doglioni, C.; Harabaglia, G.; Martinelli, F.; Mongelli, F.; Zito, G. A geodynamic model of the Southern Apennines accretionary prism. Terra Nova 1996, 8, 540–547. [Google Scholar] [CrossRef]
- Petrullo, A.V.; Agosta, F.; Prosser, G.; Rizzo, E. Cenozoic tectonic evolution of the northern Apulian carbonate platform (southern Italy). Ital. J. Geosci. 2017, 136, 296–311. [Google Scholar] [CrossRef]
- Bucci, F.; Novellino, R.; Tavarnelli, E.; Prosser, G.; Guzzetti, G.; Cardinali, M.; Gueguen, E.; Guglielmi, P.; Adurno, I. Frontal collapse during thrust propagation in mountain belts: A case study in the Lucanian Apennines, Southern Italy. J. Geol. Soc. 2014, 171, 571–581. [Google Scholar] [CrossRef]
- Giano, S.I.; Lapenna, V.; Piscitelli, S.; Schiattarella, M. Electrical imaging and self-potential surveys to study the geological setting of the Quaternary slope deposits in the Agri high valley (Southern Italy). Ann. Geofis. 2000, 43, 409–419. [Google Scholar]
- Piedilato, S.; Prosser, G. Thrust sequences and evolution of the external sector of a fold and thrust belt: An example from the Southern Apennines (Italy). J. Geodyn. 2005, 39, 386–402. [Google Scholar] [CrossRef]
- Bonardi, G.; Amore, F.O.; Ciampo, G.; De Capoa, P.; Miconnet, P.; Perrone, V. Il complesso Liguride. Auct.: Stato delle conoscenze e problemi aperti sulla sua evoluzione pre-appenninica ed i suoi rapporti con l’Arco Calabro. Mem. Soc. Geol. It. 1988, 41, 17–35. [Google Scholar]
- Scandone, P.; Sgrosso, I. Flysch con Inocerami nella valle del Cavolo presso Tramutola (Lucania). Boll. Soc. Nat. Napoli 1964, 73, 166–175. [Google Scholar]
- Vezzani, L. Distribuzione, facies e stratigrafia della formazione del saraceno (Albiano-Daniano) nell’area compresa tra il mare Jonio ed il torrente Frido. Geol. Romana 1968, 7, 229–275. [Google Scholar]
- Vezzani, L.; Festa, A.; Ghisetti, F.C. Geology and Tectonic Evolution of the Central-Southern Apennines, Italy; Geological Society of America: Boulder, CO, USA, 2010. [Google Scholar]
- Baruffini, L.; Lottaroli, F.; Torricelli, S.; Lazzari, D. Stratigraphic revision of the Eocene Albidona Formation in the type locality (Calabria, southern Italy). Riv. Ital. Paleontol. Stratigr. 2000, 106, 73–98. [Google Scholar]
- Scandone, P.; Bonardi, G. Synsedimentary tectonics controlling deposition of mesozoic and tertiary carbonatic sequences of areas surrounding Vallo di Diano. Mem. Soc. Geol. It. 1968, 7, 1–10. [Google Scholar]
- D’Argenio, B.; Pescatore, T.; Scandone, P. Structural pattern of the Campania-Lucania Apennines. Quad. Ric. Sci. 1975, 90, 313–327. [Google Scholar]
- D’Argenio, B.; Pescatore, T.; Scandone, P. Schema geologico dell’Appennino Meridionale (Campania e Lucania). Atti del Conv. Moderne vedute sulla geologia dell’Appennino. Accad. Naz. Dei Lincei 1973, 182, 49–72. [Google Scholar]
- Palladino, G.; Parente, M.; Prosser, G.; Di Stasio, A. Tectonic control on the deposition of the Lower Miocene sediments of the Monti della Maddalena ridge (Southern Apennines): Synsedimentary extensional deformation in a foreland setting. Boll. Soc. Geol. It. 2008, 127, 317–335. [Google Scholar]
- Scandone, P. Studi di geologia Lucana: Carta dei terreni della serie calcareo-silico marnosa e note illustrative. Boll. Soc. Nat. Napoli 1972, 81, 225–300. [Google Scholar]
- Carta Geologica d’Italia 1972, Foglio 199 Potenza, Poligrafica e Cartevalori, Ercolano (Napoli), Scale 1:100,000; Servizio Geologico d’Italia: Florence, Italy, 1969.
- Butler, R.W.H.; Mazzoli, S.; Corrado, S.; De Donatis, M.; Di Bucci, D.; Gambini, R.; Naso, G.; Nicolai, D.; Scrocca, D.; Shiner, P.; et al. Applying thick-skinned tectonic models to the Apennine thrust belt of Italy-Limitations and implications. In Thrust Tectonics and Hydrocarbon Systems; AAPG, Memoir; McClay, K.R., Ed.; American Association of Petroleum Geologists: Tulsa, OK, USA, 2004; Volume 82, pp. 647–667. [Google Scholar]
- Mazzoli, S.; Aldega, L.; Corrado, S.; Invernizzi, C.; Zattin, M. Pliocene-quaternary thrusting, syn-orogenic extension and tectonic exhumation in the Southern Apennines (Italy): Insights from the Monte Alpi area. In Styles of Continental Contraction: Geological Society of America Special Paper; Mazzoli, S., Butler, R.W.H., Eds.; Geological Society of America: Boulder, CO, USA, 2006; Volume 414, pp. 55–77. [Google Scholar] [CrossRef]
- Schiattarella, M. Quaternary tectonics of the Pollino Ridge, Calabria-Lucania boundary, southern Italy. Geol. Soc. Spec. Publ. 1998, 135, 341–354. [Google Scholar] [CrossRef]
- Brozzetti, F. The Campania-Lucania Extensional Fault System, southern Italy: A suggestion for a uniform model of active extension in the Italian Apennines. Tectonics 2011, 30. [Google Scholar] [CrossRef]
- Carbone, S.; Catalano, S.; Lentini, F.; Monaco, C. Carta Geologica del Bacino del Fiume Agri. Scala 1:50,000; Cartografia SELCA: Firenze, Italy, 1991. [Google Scholar]
- Servizio Geologico d’Italia. Note Illustrative della Carta Geologica d’Italia Alla Scala 1:100,000, Fogli 199 e 210 “Potenza e Lauria”. 1971. Available online: http://sgi.isprambiente.it/geologia100k/mostra_pdf.aspx?pdffile=210.pdf. (accessed on 10 January 2022).
- Servizio Geologico d’Italia; ISPRA. Carta Geologica d’Italia Alla Scala 1:50,000, Foglio 506 “Sant’Arcangelo”. 2005. Available online: https://www.isprambiente.gov.it/Media/carg/506_SANT_ARCANGELO/Foglio.html (accessed on 10 January 2022).
- Servizio Geologico d’Italia; ISPRA. Carta Geologica d’Italia Alla Scala 1:50,000, Foglio 505 “Marsico Nuovo”. 2012. Available online: https://www.isprambiente.gov.it/Media/carg/489_MARSICO_NUOVO/Foglio.html (accessed on 10 January 2022).
- Servizio Geologico d’Italia, ISPRA. Carta Geologica d’Italia Alla Scala 1:50,000, Foglio 505 “Moliterno”. 2014. Available online: https://www.isprambiente.gov.it/Media/carg/505_MOLITERNO/Foglio.html (accessed on 10 January 2022).
- Bonarelli, G. Relazione Geologica. Parte II. “Programma di Ulteriori Studi e Ricerche”. 1932; Available online: https://www.researchgate.net/publication/268130832_Cento_Anni_di_Ricerca_Petrolifera_l%27Alta_Val_d%27Agri_Basilicata_Italia_meridionale (accessed on 1 October 2022).
- Balasco, M.; Lapenna, V.; Rizzo, E.; Telesca, L. Deep Electrical Resistivity Tomography for Geophysical Investigations: The State of the Art and Future Directions. Geosciences 2022, 12, 438. [Google Scholar] [CrossRef]
- Chibueze Okpoli, C. Application of 2D Electrical Resistivity Tomography in Landfill Site: A Case Study of Iku, Ikare Akoko, Southwestern Nigeria. J. Geol. Res. 2013, 2013, 895160. [Google Scholar] [CrossRef]
- Scandone, P.; Sgrosso, I. Sulla paleogeografia della Penisola Sorrentina dal Cretacico superiore al Miocene. Boll. Soc. Natur. Napoli 1965, 74, 159–177. [Google Scholar]
- Dietrich, D.; Scandone, P. The position of the basic and ultrabasic rocks in the tectonic units of the Southern Apennines. Atti Accad. Pontaniana Napoli 1972, 21, 61–75. [Google Scholar]
- Bonardi, G.; Ciampo, G.; Perrone, V. La formazione di Albidona nell’ Appennino calabro-lucano: Ulteriori dati stratigrafici e relazioni con le unità esterne appenniniche. Boll. Soc. Geol. Ital. 1985, 104, 539–549. [Google Scholar]
- Grimaldi, S.; Summa, G. Caratteri idrogeologici ed idrogeochimici del settore meridionale dei Monti della Maddalena (Appennino Meridionale). G. Geol. Appl. 2005, 2, 348–356. [Google Scholar] [CrossRef]
- Mazzoli, S.; Di Bucci, D. Critical displacement for normal fault nucleation from en-échelon vein arrays in limestones: A case study from the southern Apennines (Italy). J. Struct. Geol. 2003, 25, 1011–1020. [Google Scholar] [CrossRef]
- Mazzoli, S.; Invernizzi, C.; Marchegiani, L.; Mattioni, L.; Cello, G. Brittle-Ductile Shear Zone Evolution and Fault Initiation in Limestones, Monte Cugnone (Lucania), Southern Apennines, Italy; Special Publications; Geological Society: London, UK, 2004; Volume 224, pp. 353–373. [Google Scholar] [CrossRef]
- Novellino, R.; Prosser, G.; Spiess, R.; Viti, C.; Agosta, F.; Tavarnelli, E.; Bucci, F. Dynamic weakening along incipient low-angle normal faults in pelagic limestones (Southern Apennines, Italy). J. Geol. Soc. 2015, 172, 283–286. [Google Scholar] [CrossRef]
- Marquardt, D.W. An algorithm for least-squares estimation of nonlinear parameters. J. Soc. Ind. Appl. Math. 1963, 11, 431–441. [Google Scholar] [CrossRef]
- Mazzoli, S. Structural analysis of the Mesozoic Lagonegro Units in SW Lucania (Southern Italian Apennines). Studi Geol. Camerti 1992, 12, 117–146. [Google Scholar]
- Jouniaux, L.; Zamora, M.; Reuschlé, T. Electrical conductivity evolution of non-saturated carbonate rocks during deformation up to failure. Geophys. J. Int. 2006, 167, 1017–1026. [Google Scholar] [CrossRef]
- D’Ecclesiis, G.; Polemio, M. Condizioni di emergenza di alcune tra le principali scaturigini della Basilicata. Geol. Romana 1994, 30, 105–112. [Google Scholar]
- D’Ecclesiis, G.; Polemio, M.; Sdao, F. Le sorgenti dell’alta valle del F. Agri (Italia meridionale): Caratteri idrogeologici e idrochimici. Acque Sotter. 1998, 59, 9–16. [Google Scholar]


Disclaimer/Publisher’s Note: The statements, opinions and data contained in all publications are solely those of the individual author(s) and contributor(s) and not of MDPI and/or the editor(s). MDPI and/or the editor(s) disclaim responsibility for any injury to people or property resulting from any ideas, methods, instructions or products referred to in the content. |
© 2023 by the authors. Licensee MDPI, Basel, Switzerland. This article is an open access article distributed under the terms and conditions of the Creative Commons Attribution (CC BY) license (https://creativecommons.org/licenses/by/4.0/).
Share and Cite
Olita, F.; Giampaolo, V.; Rizzo, E.; Palladino, G.; Capozzoli, L.; De Martino, G.; Prosser, G. Investigation of the Geological Structure of the Tramutola Area (Agri Valley): Inferences for the Presence of Geofluids at Shallow Crustal Levels. Geosciences 2023, 13, 83. https://doi.org/10.3390/geosciences13030083
Olita F, Giampaolo V, Rizzo E, Palladino G, Capozzoli L, De Martino G, Prosser G. Investigation of the Geological Structure of the Tramutola Area (Agri Valley): Inferences for the Presence of Geofluids at Shallow Crustal Levels. Geosciences. 2023; 13(3):83. https://doi.org/10.3390/geosciences13030083
Chicago/Turabian StyleOlita, Fabio, Valeria Giampaolo, Enzo Rizzo, Giuseppe Palladino, Luigi Capozzoli, Gregory De Martino, and Giacomo Prosser. 2023. "Investigation of the Geological Structure of the Tramutola Area (Agri Valley): Inferences for the Presence of Geofluids at Shallow Crustal Levels" Geosciences 13, no. 3: 83. https://doi.org/10.3390/geosciences13030083
APA StyleOlita, F., Giampaolo, V., Rizzo, E., Palladino, G., Capozzoli, L., De Martino, G., & Prosser, G. (2023). Investigation of the Geological Structure of the Tramutola Area (Agri Valley): Inferences for the Presence of Geofluids at Shallow Crustal Levels. Geosciences, 13(3), 83. https://doi.org/10.3390/geosciences13030083