

Natural H2 Emissions in Colombian Ophiolites: First Findings
by

Alejandra Carrillo Ramirez
1,2, 
Felipe Gonzalez Penagos
3,
German Rodriguez
3 and
Isabelle Moretti
2,* 1
Facultad de Minas, Universidad Nacional de Colombia, Medellín 050034, Colombia
2
UPPA-LFCR, Rue de l’Université, 64013 Pau, France
3
Atlas Research Group, Bogota 77152, Colombia
*
Author to whom correspondence should be addressed.
Geosciences 2023, 13(12), 358; https://doi.org/10.3390/geosciences13120358
Submission received: 26 September 2023
/
Revised: 16 November 2023
/
Accepted: 17 November 2023
/
Published: 22 November 2023
Abstract
:The exploration of natural H2 or white hydrogen has started in various geological settings. Ophiolitic nappes are already recognized as one of the promising contexts. In South America, the only data available so far concerns the Archean iron-rich rocks of the Mina Gerais in Brazil or the subduction context of Bolivia. In Colombia, despite government efforts to promote white hydrogen, data remain limited. This article introduces the initial dataset obtained through soil gas sampling within the Cauca-Patia Valley and Western Cordillera, where the underlying geology comprises accreted oceanic lithosphere. In this valley, promising areas with H2 potential were identified using remote sensing tools, in particular vegetation anomalies. The Atmospherically Resistant Vegetation Index (ARVI) appears to be well adapted for this context and the field data collection confirmed the presence of H2 in the soil in all pre-selected structures. The valley undergoes extensive cultivation, mainly for sugar cane production. While H2 emissions lead to alterations in vegetation, unlike reports from other countries, they do not result in its complete disappearance. Soil gas measurements along the thrusts bordering the Cauca Valley also show high H2 content in the fault zones. In the valley, the presence of sedimentary cover above the ophiolites which are presumably the H2 generating rocks, which addresses the possible presence of reservoirs and seals to define potential plays. Drawing parallels with the Malian case, it could be that the intrusive element could serve as seals.
1. Introduction
1.1. Natural H2 within the New Energy Mix
Within the context of the race to decarbonize the world energy mix, the dihydrogen, which we will call hydrogen or H2, has a growing role both as an energy vector but also as energy source. Natural H2 is present in the subsurface from where it could be produced and not manufactured. Exploration for natural hydrogen underway in several countries including Australia, USA, Spain, and France [1]. Production has been a reality in Mali, West Africa, for a decade but remains unfortunately limited due to security and political issues [2]. The expectations regarding natural H2 are high since the expected price for this carbon-free H2 is lower than the cost for green hydrogen which is manufactured through water electrolysis. However, given that natural H2 is a natural resource, its production relies on appropriate regulations and various issues need to be addressed regarding its implementation. Knowledge on H2 generation/migration/accumulation processes is progressing but acquisition of significant new data needs to continue. The advantages and disadvantages of natural H2, its environmental impact, and its renewability must be evaluated globally on a case-by-case basis. Life Cycle Analyses significantly hinge on specific actions taken, but overall, it is expected to be more favorable than the production of green hydrogen through electrolysis [3]. The goal of this paper is to contribute to the global knowledge on natural hydrogen by sharing new information and data from Colombia. In this country, which is rich in oil, coal, and other natural resources, natural H2 is an emerging topic of interest for geologists as well as regulators alike, especially in areas off the grid. After briefly reviewing of the ongoing changes in the Colombian sub-surface legislation, we will discuss the H2 natural systems known in other countries and present the first finding on a similar system in the Cauca-Patia Valley of Colombia.
1.2. Natural H2 a New Resource Recognized by the Law in Colombia
To promote a just energy transition and diversify the country energy matrix, Colombia’s national development plan, approved for 2022–2026, includes tax benefits of natural hydrogen as a non-conventional renewable energy source (FNCER in Spanish). This initiative aims to encourage the exploration and production of natural resources for production and development of previously unproductive land. Areas without in situ resources or that are non-connected to the grid are particularly targeted for the exploration of these low-carbon resources. This regulatory framework has given the Colombian Ministry of Mines and Energy the power to authorize interested parties to develop natural hydrogen and related natural gas projects. The Ministry is also responsible for determining the guidelines, requirements, technical, economic, financial, and legal conditions for the granting and executing such authorization.
2. Natural H2 Systems within the Colombian Geological Context
2.1. H2 Prospectivity in Colombia
The rocks that generate H2 in subsurface started to be rather well known and could be classified following [4] in 4 categories: oceanic and mantellic rocks (H2-GR1), iron-rich sediments and intrusive rocks (H2-GR2), radioactive rocks (H2-GR3), and organic-rich source rocks, especially coal (H2-GR4). In the first three cases, the H2 comes from water (redox reactions or radiolysis, respectively), and in the last category, from organic matter. In ophiolitic contexts such as Oman or New Caledonia, the main H2 generating rock category is H2-GR1 [5]. In southern and western Australia, and within the Mina Gerais in Brazil, the oxidation of Banded Iron Formation (BIF) is likely the major source of H2 [6,7]. In South Africa and in Canada, H2-GR3 [8,9]) has been proposed. In the Songliao Basin in China, or in the Cooper Basin in Australia, the authors favor H2-GR4 [10,11]. Some other reactions may generate H2 but do not look currently the most promising in terms of volume in the zones of active H2 exploration and production.
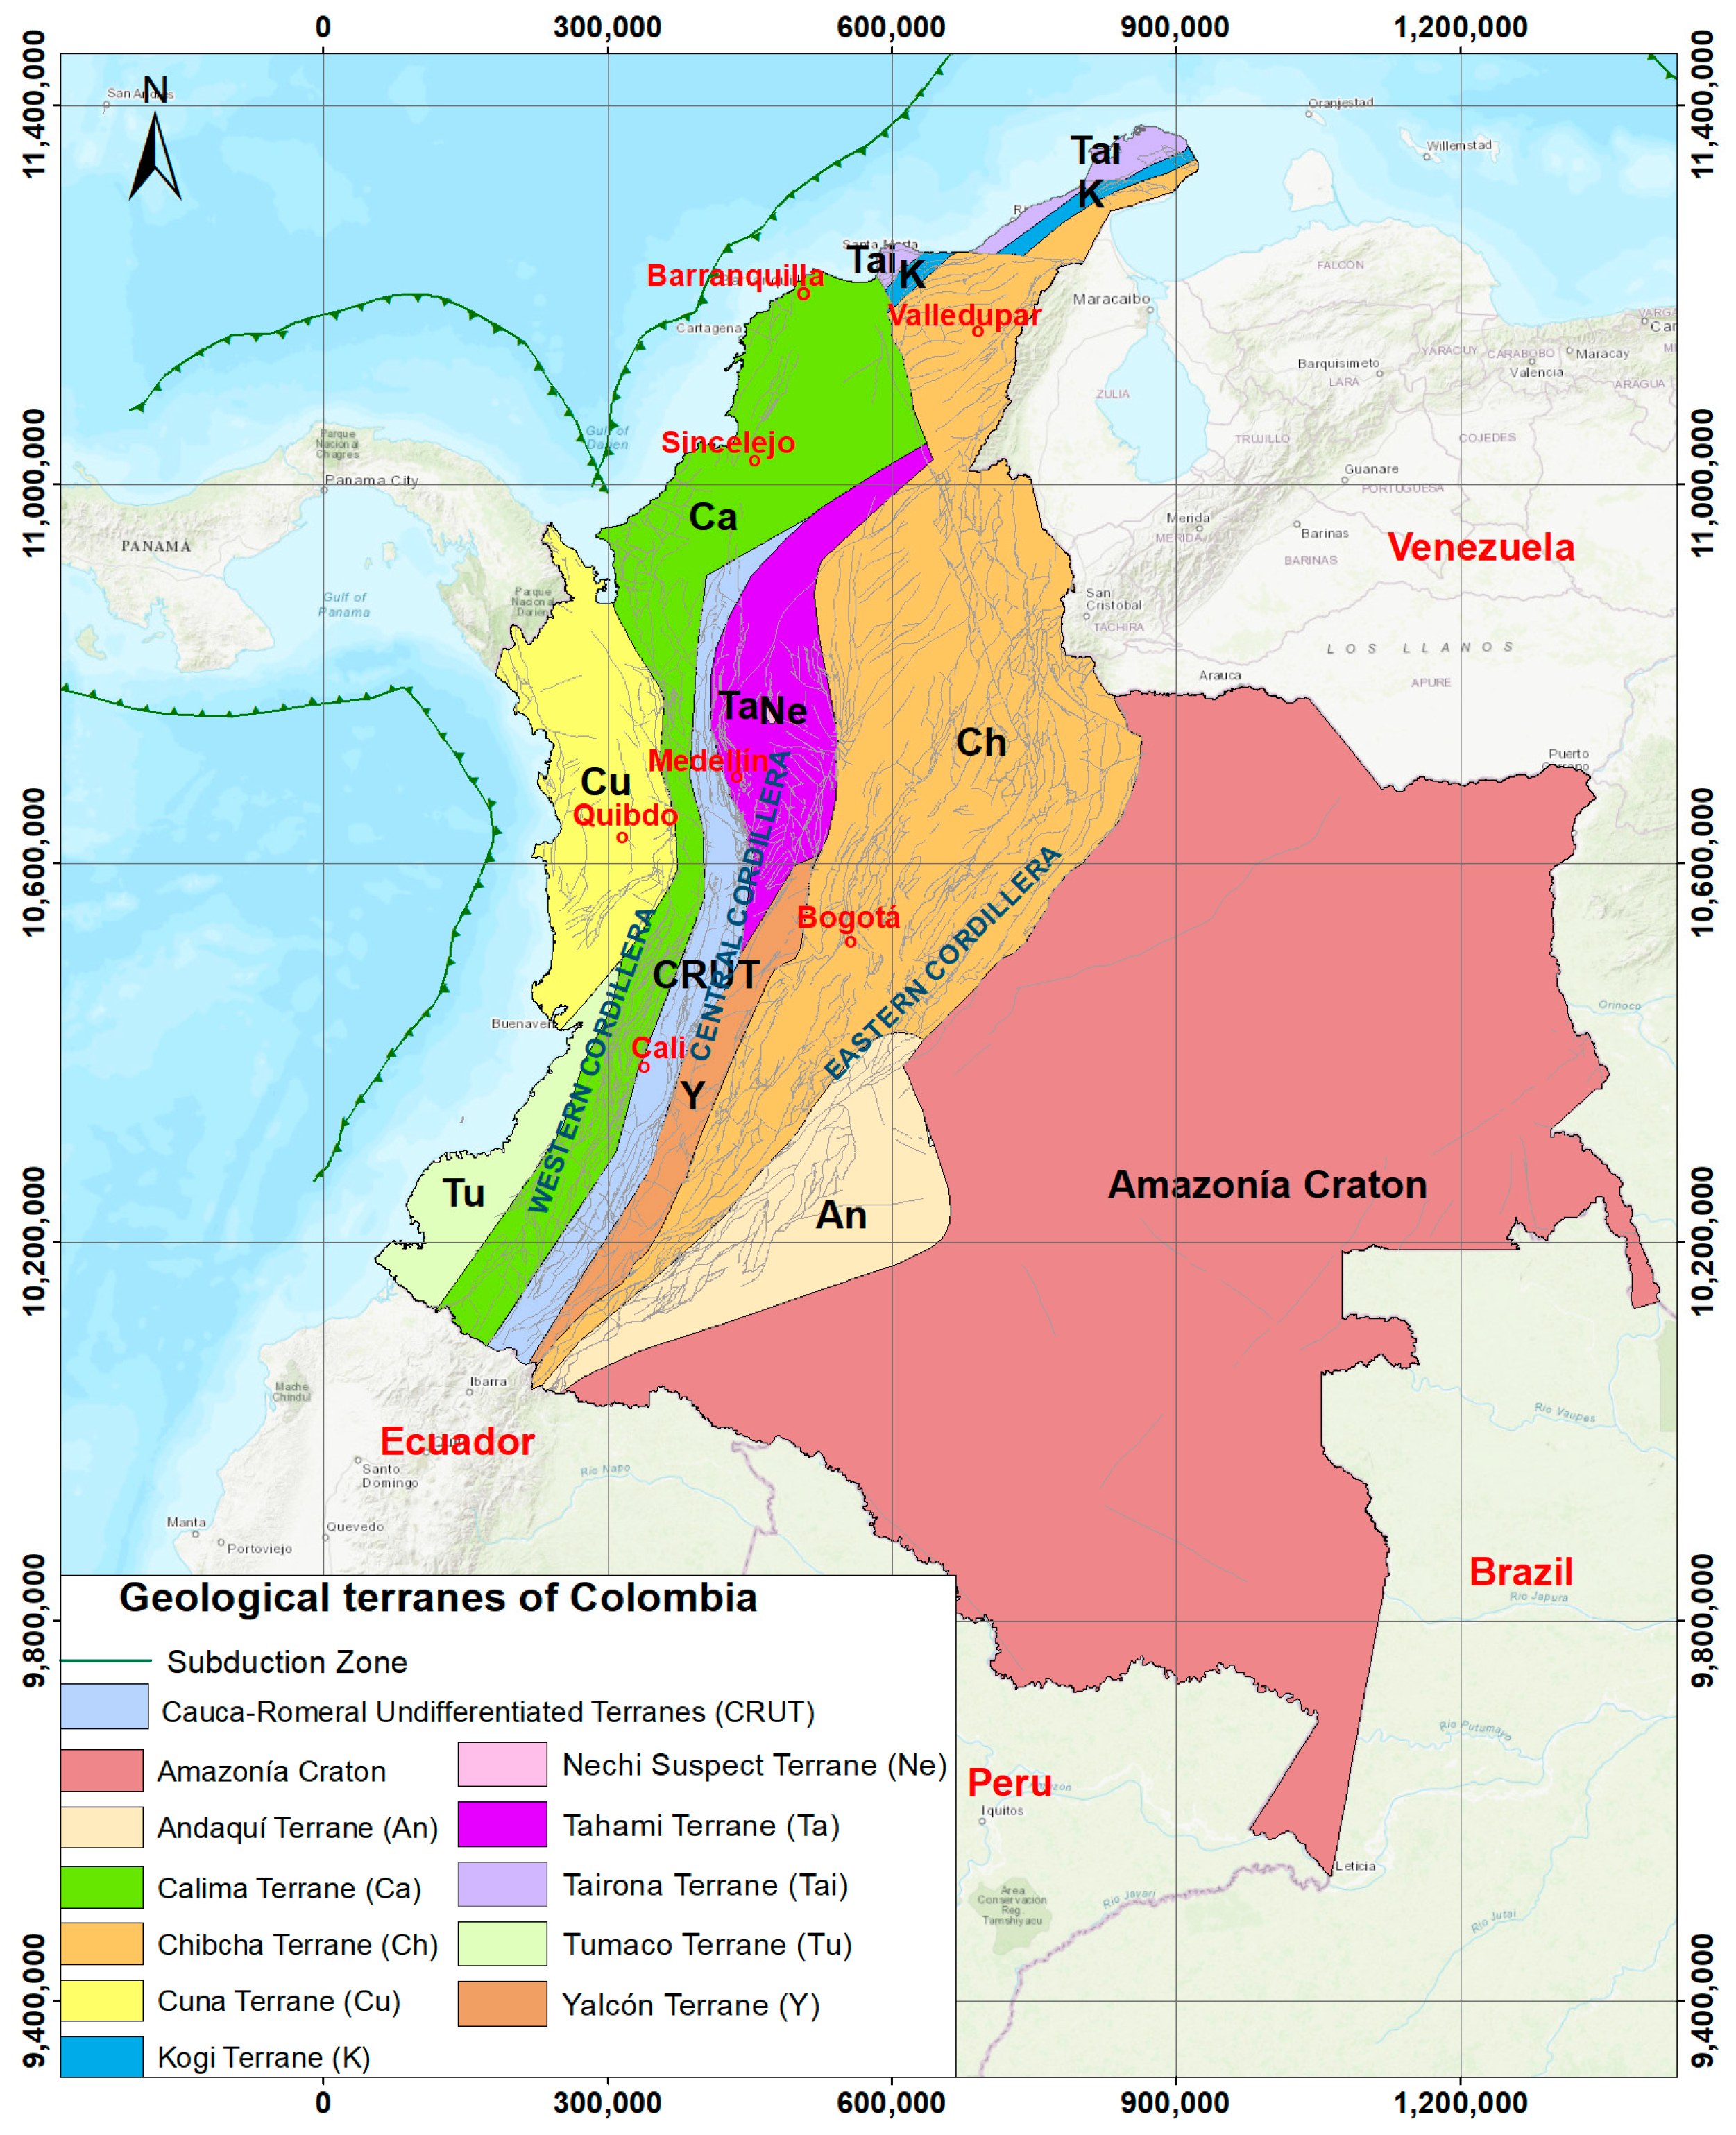
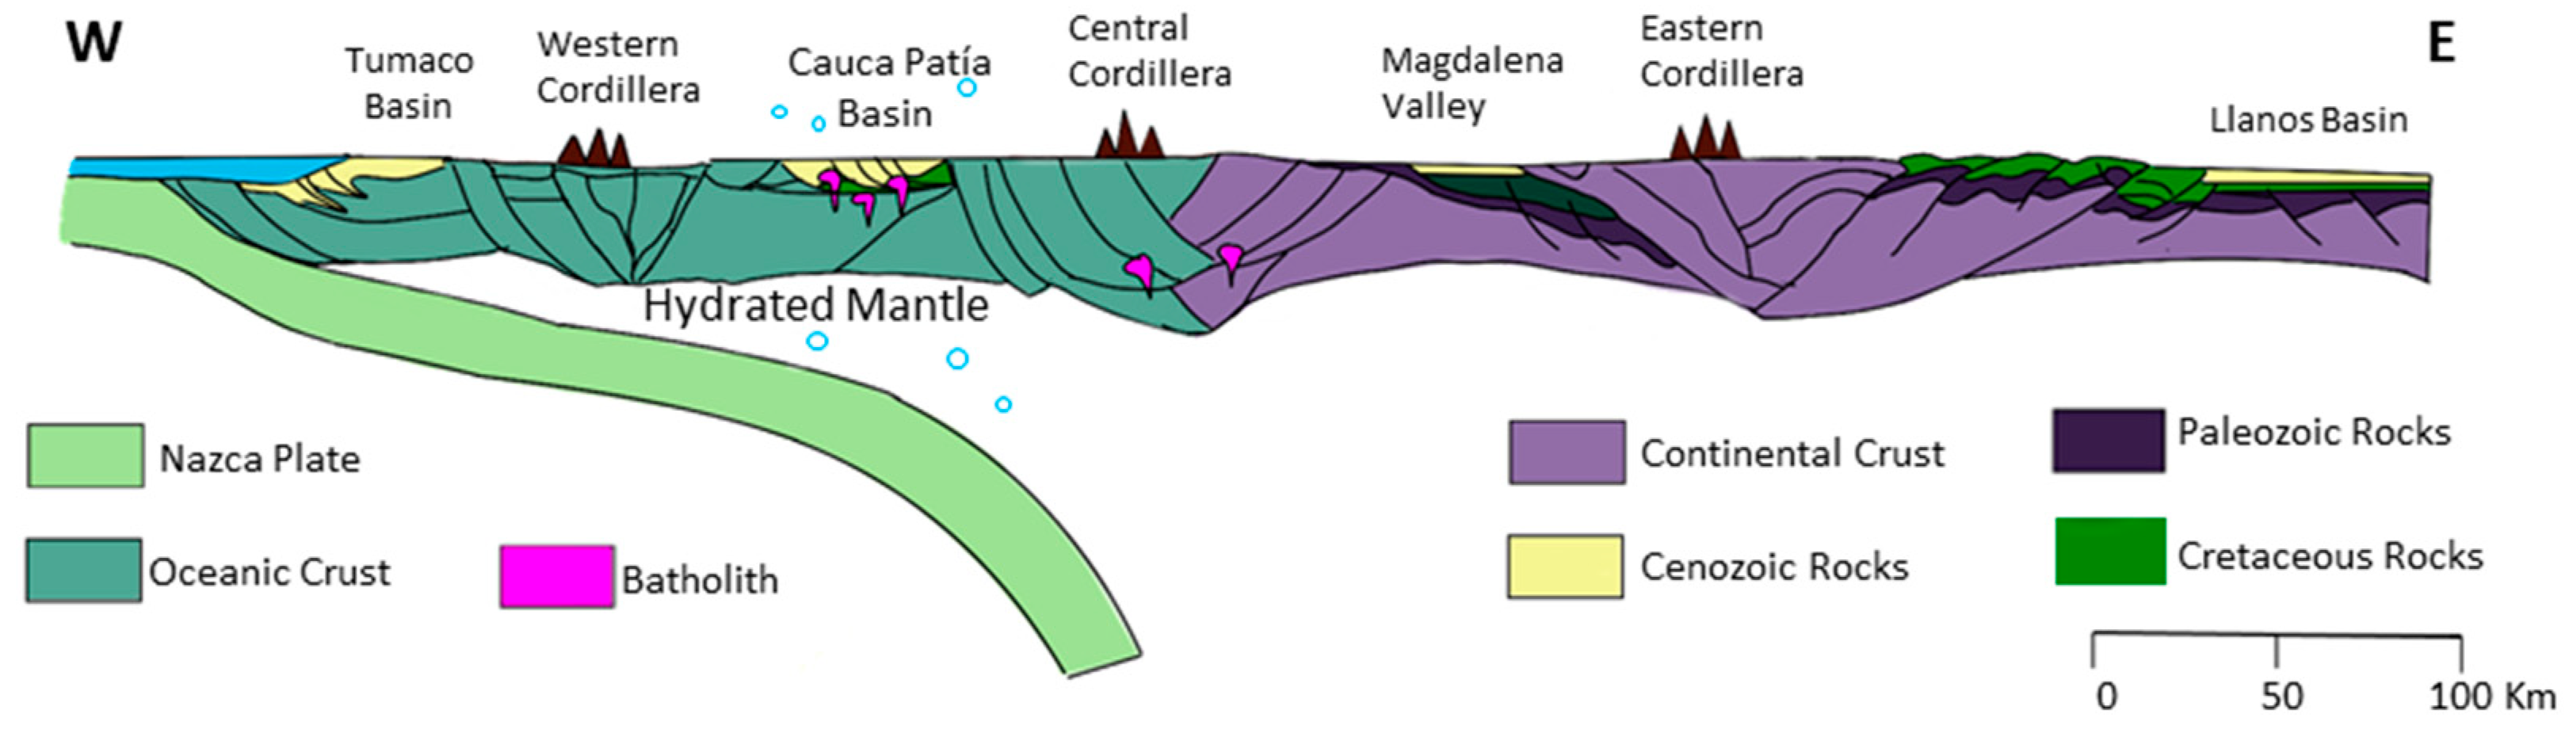
In Colombia, due to the accretion of oceanic terranes during the subduction along the Pacific coast (Figure 1), at least three of the H2 Generating Rocks are present: ophiolites, coal, and the iron-rich facies. Figure 2 shows a schematic cross-section from the Pacific to the Amazonian Craton through the various geological provinces of Colombia where the search for H2 could be targeted.
Columbian geology is complex and characterized by active tectonics with two subduction zones. To the west along the Pacific coast, the Nasca plate is subducting, and to the north, the oblique subduction of the Caribbean plate is taking place toward the south-southeast (Figure 1). The roughly N–S oriented main reliefs consist of the Eastern Cordillera, an inversed Mesozoic back arc basin, and the Central and Western Cordillera which are accreted terranes and contain ophiolitic series (Figure 2). To the east, the Llanos Basin is the foreland of the Eastern Cordillera thrust belt. It contains a large part of the Colombian oil resources [13] and references therein. The Magdalena Valley between the Eastern and Central Cordillera is also an oil and gas (O&G) province [14]. Westward, the Cauca-Patia Valley is in another geological context where accretional material and ophiolites are dominant. Despite some exploration efforts and acquisition of subsurface data, the Cauca-Patia Valley has never been successful for O&G; however, the valley could be promising regarding natural H2.
Figure 2.
Schematic E–W cross-section showing structural features of central part of Colombia at the level of Cali. The vertical exaggeration is about 1.5. Westward, oceanic terranes related to the various accretions could be prospective H2 provinces due to the presence of ophiolitic nappes. The mantellic wedge between the Nazca plate and South America may also play a role. The Cauca-Patia Basin is the area studied in this paper. This conceptual cross-section is based on the work of [15] for the western part and for the eastern part from [16].

2.2. Serpentinization and H2 Generation
The oceanic lithosphere generates H2 during its alteration by hot water. The main reactions could be summarized as follow:
Olivine + water => serpentinite + magnetite + brucite + H2
Orthopyroxene + water => serpentine + magnetite + H2 + silicon dioxide
Orthopyroxene + water => serpentine + magnetite + H2 + silicon dioxide
These reactions are widely described in detail in the literature [4,17,18] and references therein. To sum up, olivine oxidizes to serpentinite, water is reduced, and H2 is released. The global reaction takes place in several stages: oxidation of olivine generates magnetite, itself rich in Fe2+, which is then oxidized. This reaction has been first described in the Mid Oceanic Ridge (MOR) [19], the kinetic of this reaction has been studied and happen to be optimal around 300–340 °C but started before [20]. The olivine content is usually high in the mantle part of the oceanic lithospheres, low in the basalts of the upper oceanic crust and intermediary in the gabbros of the lower oceanic crust. As a result, the H2 content in the hydrothermal vents is rather high in the slow spreading center where the mantle reaches the sea bottom [21]. When the oceanic lithosphere is getting colder and moves away from the MOR, the serpentinization process is usually not complete and additional H2 could be generated when the Pression and Temperature (PT) conditions are becoming optimal again. These various steps of serpentinization have been described and even dated in Turkey [22].
In Oman, as in New Caledonia, a blocked subduction induces the thrusting of an oceanic lithosphere above sedimentary rocks. High H2 content has been measured in various bubbling sources, over 70% in Oman [23]. The gas however is often a blend between H2, N2, and CH4 [5,24]. Onshore, the reactant is supposed to be rain water, but when in the MOR, it is sea water [25,26]. The temperature and depth of the onshore serpentinization could be questioned. If the 300 °C suggested for the MOR corresponds to a depth of about 10 km in a regular continental geothermal gradient, alternative reactions such as the alteration of magnetite may be efficient to generate H2 at lower temperature [27]. In this case, hydrogen could be generated in the first kilometers of the curst. Since ophiolites, and more generally, pieces of accreted oceanic lithosphere are present in Colombia, we first focused our study on determining if H2 could be generated there by any of the processes listed above.
2.3. H2 Exploration Workflow
The H2 systems, encompassing generation, migration, and accumulation, are not yet fully understood, but it has been noted by various authors that H2 gas seeps are rather numerous and can be used to start the natural H2 exploration [28,29,30]. The emissions of H2 have an impact on vegetation, and this effect can be discerned through satellite imagery or by employing the vegetation index derived from Landsat images [31]. Mapping these emissions facilitates the precise targeting of field acquisitions. A methodology, outlined by the mapping of H2-generating rocks, examination of vegetation anomalies, and a review of existing datasets, has been detailed [4] and implemented in the Cauca-Patia Valley.
In this article, we first present the geological setting of the studied area with existing data on the oceanic lithosphere involved in the terranes of west Colombia. The pre-fieldwork study conducted on the identification of vegetation anomalies will then be described. Next, we present the soil gas survey results and assess the potential for natural H2 resources of the Cauca-Paita Valley.
3. Pre-Field Trip: Colombian Ophiolites of the Cauca Valley
3.1. The Accreted Ophiolites of the Western Part of Colombia
Western Colombia is composed of terranes accreted to the Amazonian craton during several geological periods from the Neoproterozoic to the Miocene. These terranes were named after pre-Columbian ethnic groups to avoid confusion with names of Colombian formations, groups, or geological provinces [12]. The main oceanic terranes, Mesozoic in age, are the Calima and Cuna terranes which have been accreted to South America during the Paleocene and Oligocene [32]. In addition, northward, in the Caribbean Basin, rocks of oceanic origin are also present [33], which are considered to be part of the Tairona terrane [32].
Western Colombia can be divided into several structural complexes arranged as parallel strips bounded by fault zones. From east to west, we find the Quebradagrande Complex, the Arquía Complex, both of which are part of the Eastern Cordillera, the Amaime Complex, which is the basement of the Cauca Paitia Valley, the Western Cordillera Complex, and the Chocó Complex, which is part of the Cuna Terrane (Figure 1). Each of these complexes has a different geological origin and evolution. The Quebradagrande Complex represents remnants of deposits that originated between the northwestern edge of South America and the Amaime–Chaucha volcanic arc, as well as fragments of oceanic crust from the Proto-Caribbean. The Arquía Complex is a tectonic mixture of blocks from different origins, produced by shearing between the Cretaceous Caribbean-Colombian Igneous Province and the western margin of Colombia during the Cretaceous. The Amaime Complex is composed of fragments from the Amaime–Chaucha volcanic arc, oceanic plateau basalts, and volcanic sedimentary rocks that were accreted diagonally to the western edge of Colombia during the Late Cretaceous. The Amaine Fm is dated from 90.6 Myr ± 2.5 Myr [34]. The Western Cordillera Complex corresponds to a portion of the Caribbean plate that thickened (oceanic plateau) and began to accrete to the western margin of Colombia starting from the Paleocene [35].
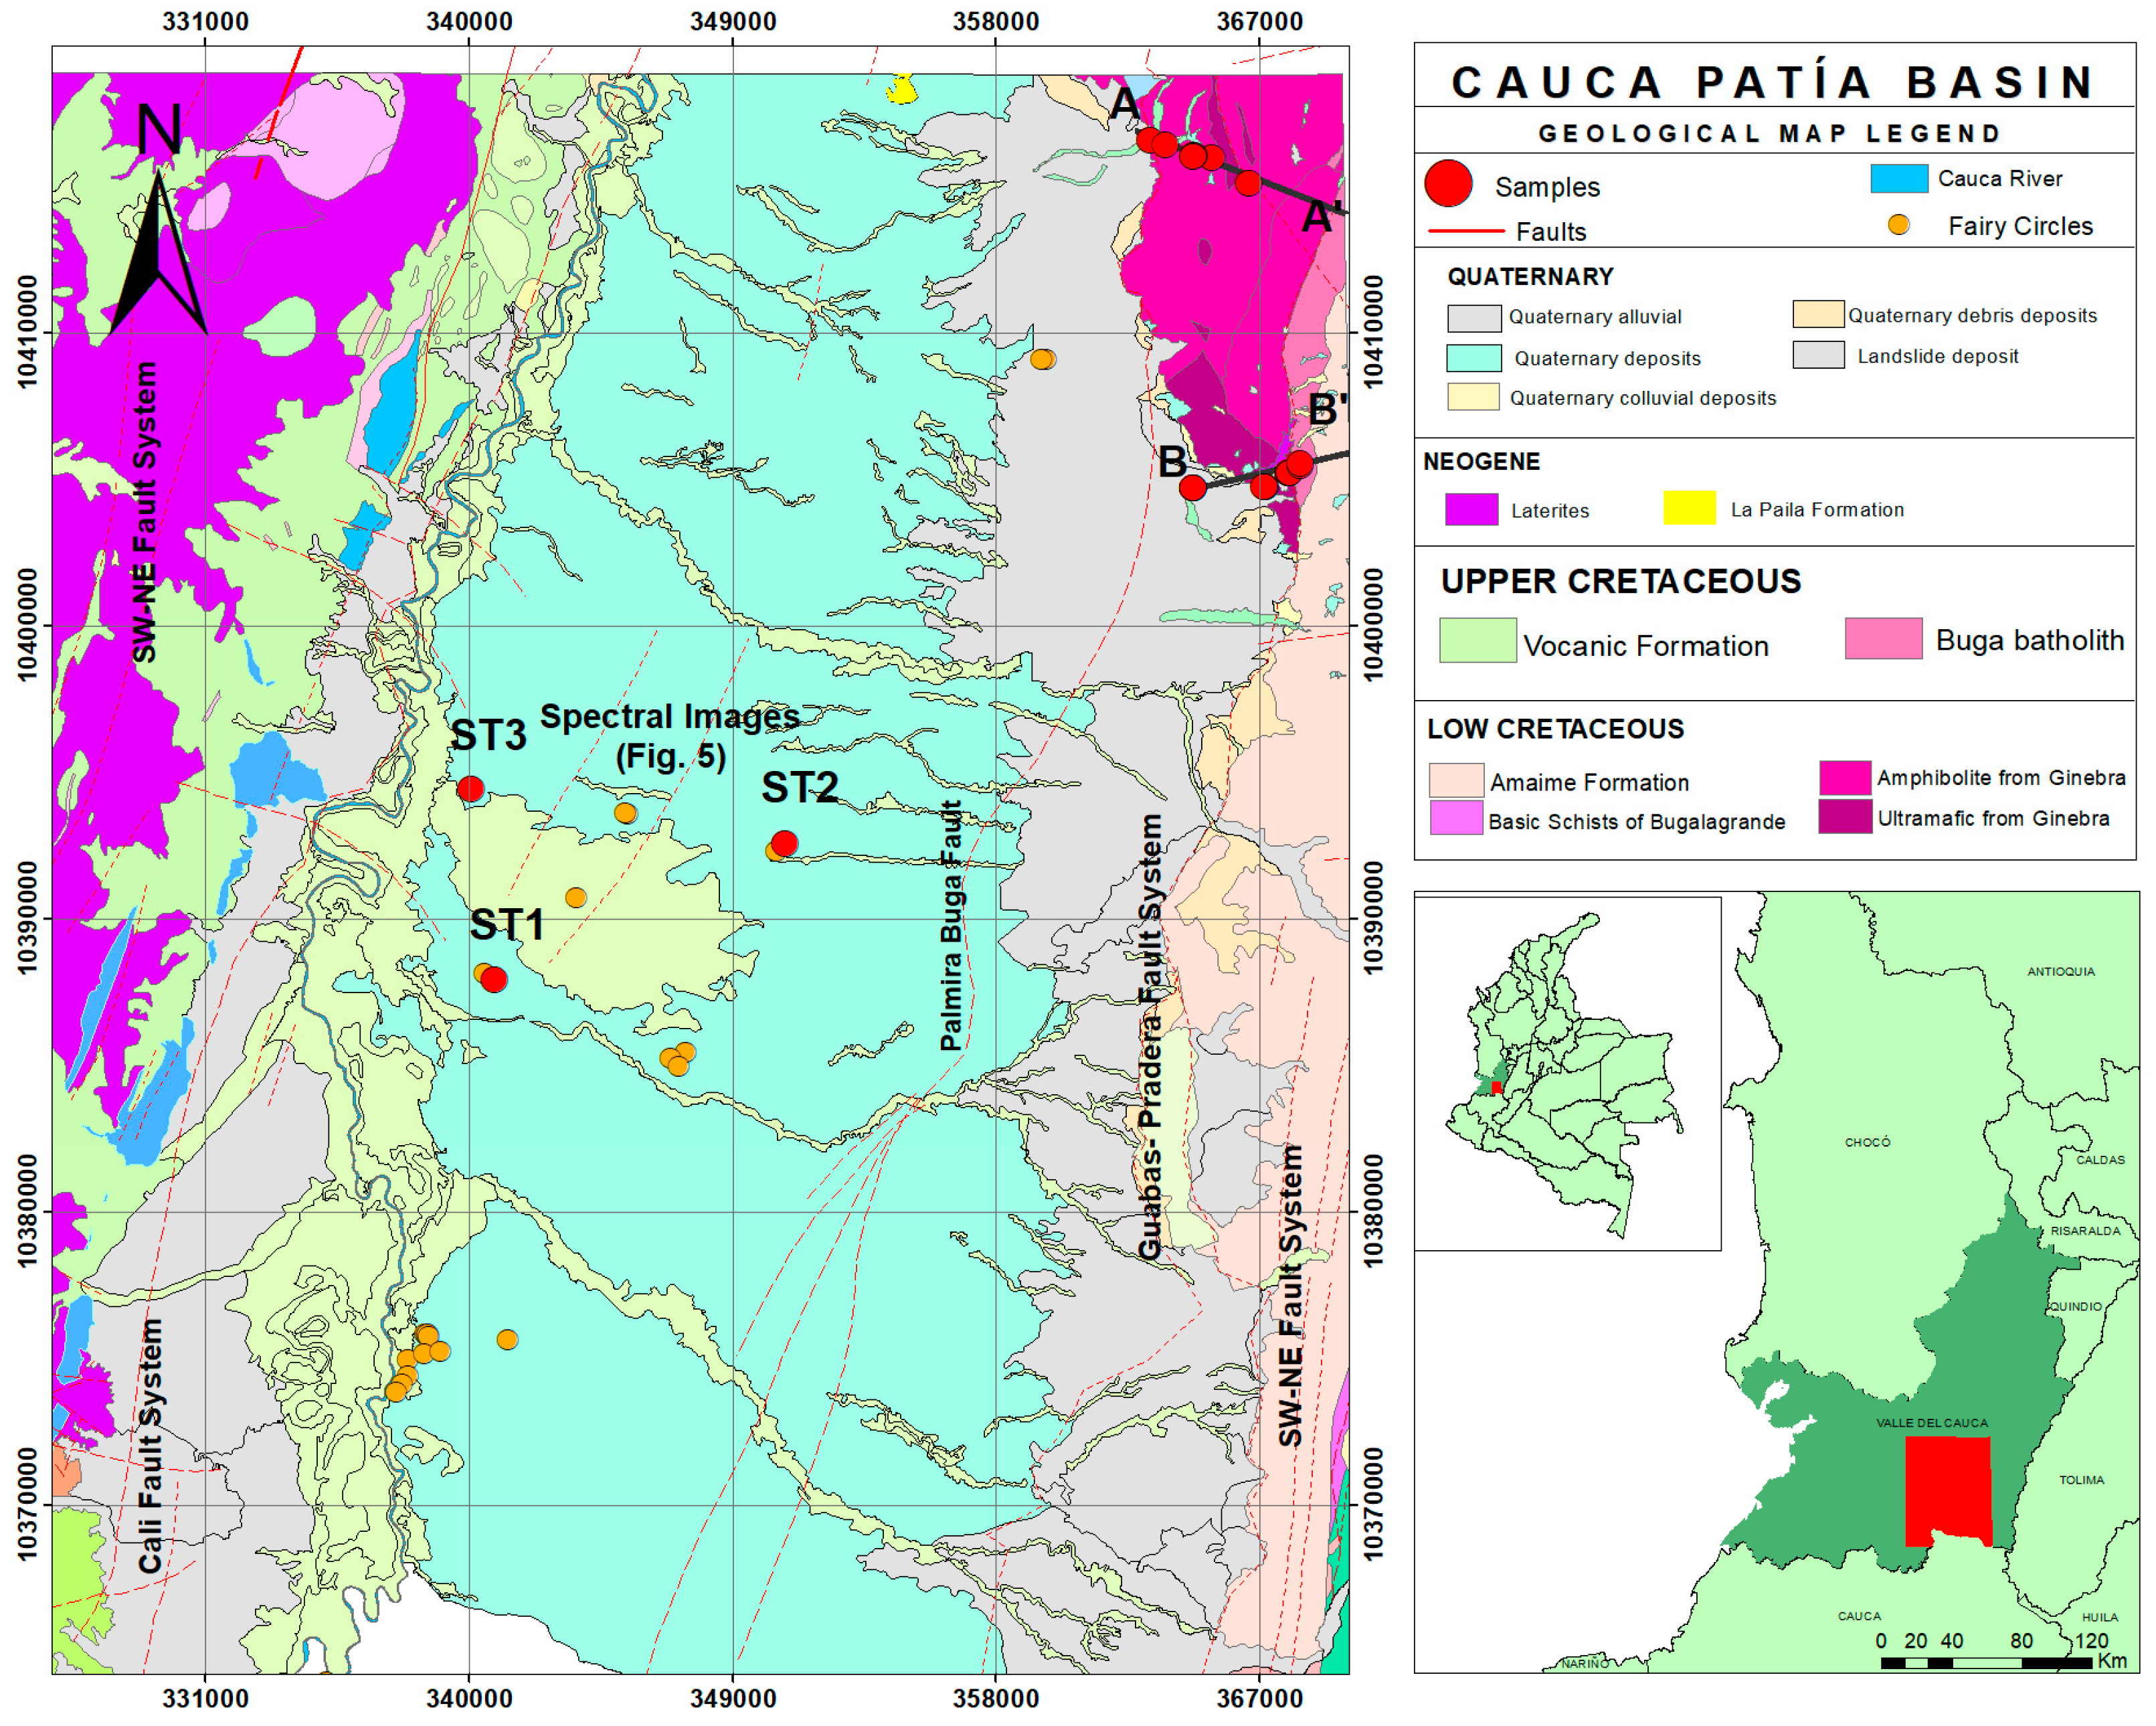
The Colombian geodynamic framework has allowed the accretion of ophiolitic rocks over time. The focal point of interest for this study is the Ginebra Ophiolitic Massif, as defined by [36]. This constitutes a block of ultramafic and mafic rocks of the Jurassic to the Lower Cretaceous age. Located on the western flank of the Central Cordillera, it is bounded to the east by the Guabas–Pradera faults and on the west by the Palmira–Buga faults [37]. These ophiolites are composed of three primary rock groups: amphibolites, gabroic rocks, and ultramafic rocks. Amphibolites are found at the southern and southwestern limits of the Ginebra Ophiolitic Massif and are primarily composed of hornblende and plagioclase. Gabbroic rocks encompass troctolites, gabbronorites, gabbros, and hornblende gabbros. The ultramafic peridotitic bodies, including harzburgites, lherzolites, and wehrlites, along with pyroxenites, are situated in the central and southern portions of the Ginebra Ophiolitic Massif [38].
The Buga Batholith is an intrusive igneous body located in Western Colombia. It covers an area of 200 km2 and is considered one of the oldest in the region with an age of 90.6 ± 1.3 Ma [39], which is contemporaneous of the Amaime Fm [34]. It outcrops in the municipalities of Buga, San Pedro, and Tuluá in the Valle del Cauca department and intrudes two main units: the Ginebra Ophiolitic Massif and the basalts of the Amaime Formation [40]. According to [34], three distinct facies are defined within this unit of holocrystalline phaneritic rocks. The first facies is composed of leucocratic tonalites, which contain medium-to-coarse crystals of quartz and plagioclase, with mafic minerals, predominantly biotite. The second facies consists of mesocratic tonalites, which contain medium-sized crystals with quartz, plagioclase, hornblende, and biotite occurring in similar proportions. The third facies corresponds to melanocratic diorites, quartz-diorites, and tonalites, which are composed of medium to fine-sized crystals of amphiboles and biotite.
Another unit corresponding to the study area is the Amaime Formation, named by [41]. This Amaime Formation is a set of basic volcanic rocks found on the western flank of the Central Cordillera in the Valle del Cauca department [37]. These rocks consist of a series of massive toleitic basalts with abundant pillow lava horizons located to the west of the Cauca–Almaguer fault [42,43]. These basalts have a porphyritic texture and a more predominant aphanitic texture. Additionally, they exhibit a degree of crystallinity ranging from glassy to holocrystalline [42].
Finally, there are the alluvial deposits of the Quaternary system, which contain sands, silts and clays deposited in river channels, terraces, and flood plains. These deposits are unconsolidated, heterometric, and heterogeneous with variable thicknesses and are generally unstratified [43].
3.2. Remote Sensing Approach of the Cauca-Paita Valley
Anomalies of vegetation that could be related to gas escape were identified in Cauca-Patia Basin through satellite imagery from various providers, such as the U.S. Geological Survey (USGS), the National Aeronautics and Space Administration (NASA), and the European Space Agency (ESA), which offer high spatial resolution. These anomalies correspond to small depressions in the soil, also known as fairy circle or Sub-Circular Depressions (SCD) in the literature [31]. They have been previously studied in Russia [28], the United States [29], and Brazil [44]. For this article, the term “fairy circles” has been used for the studied Colombian structures, as it is more illustrative and because the areas of vegetation anomalies do not exhibit depressed areas or if so, only very subtle ones.
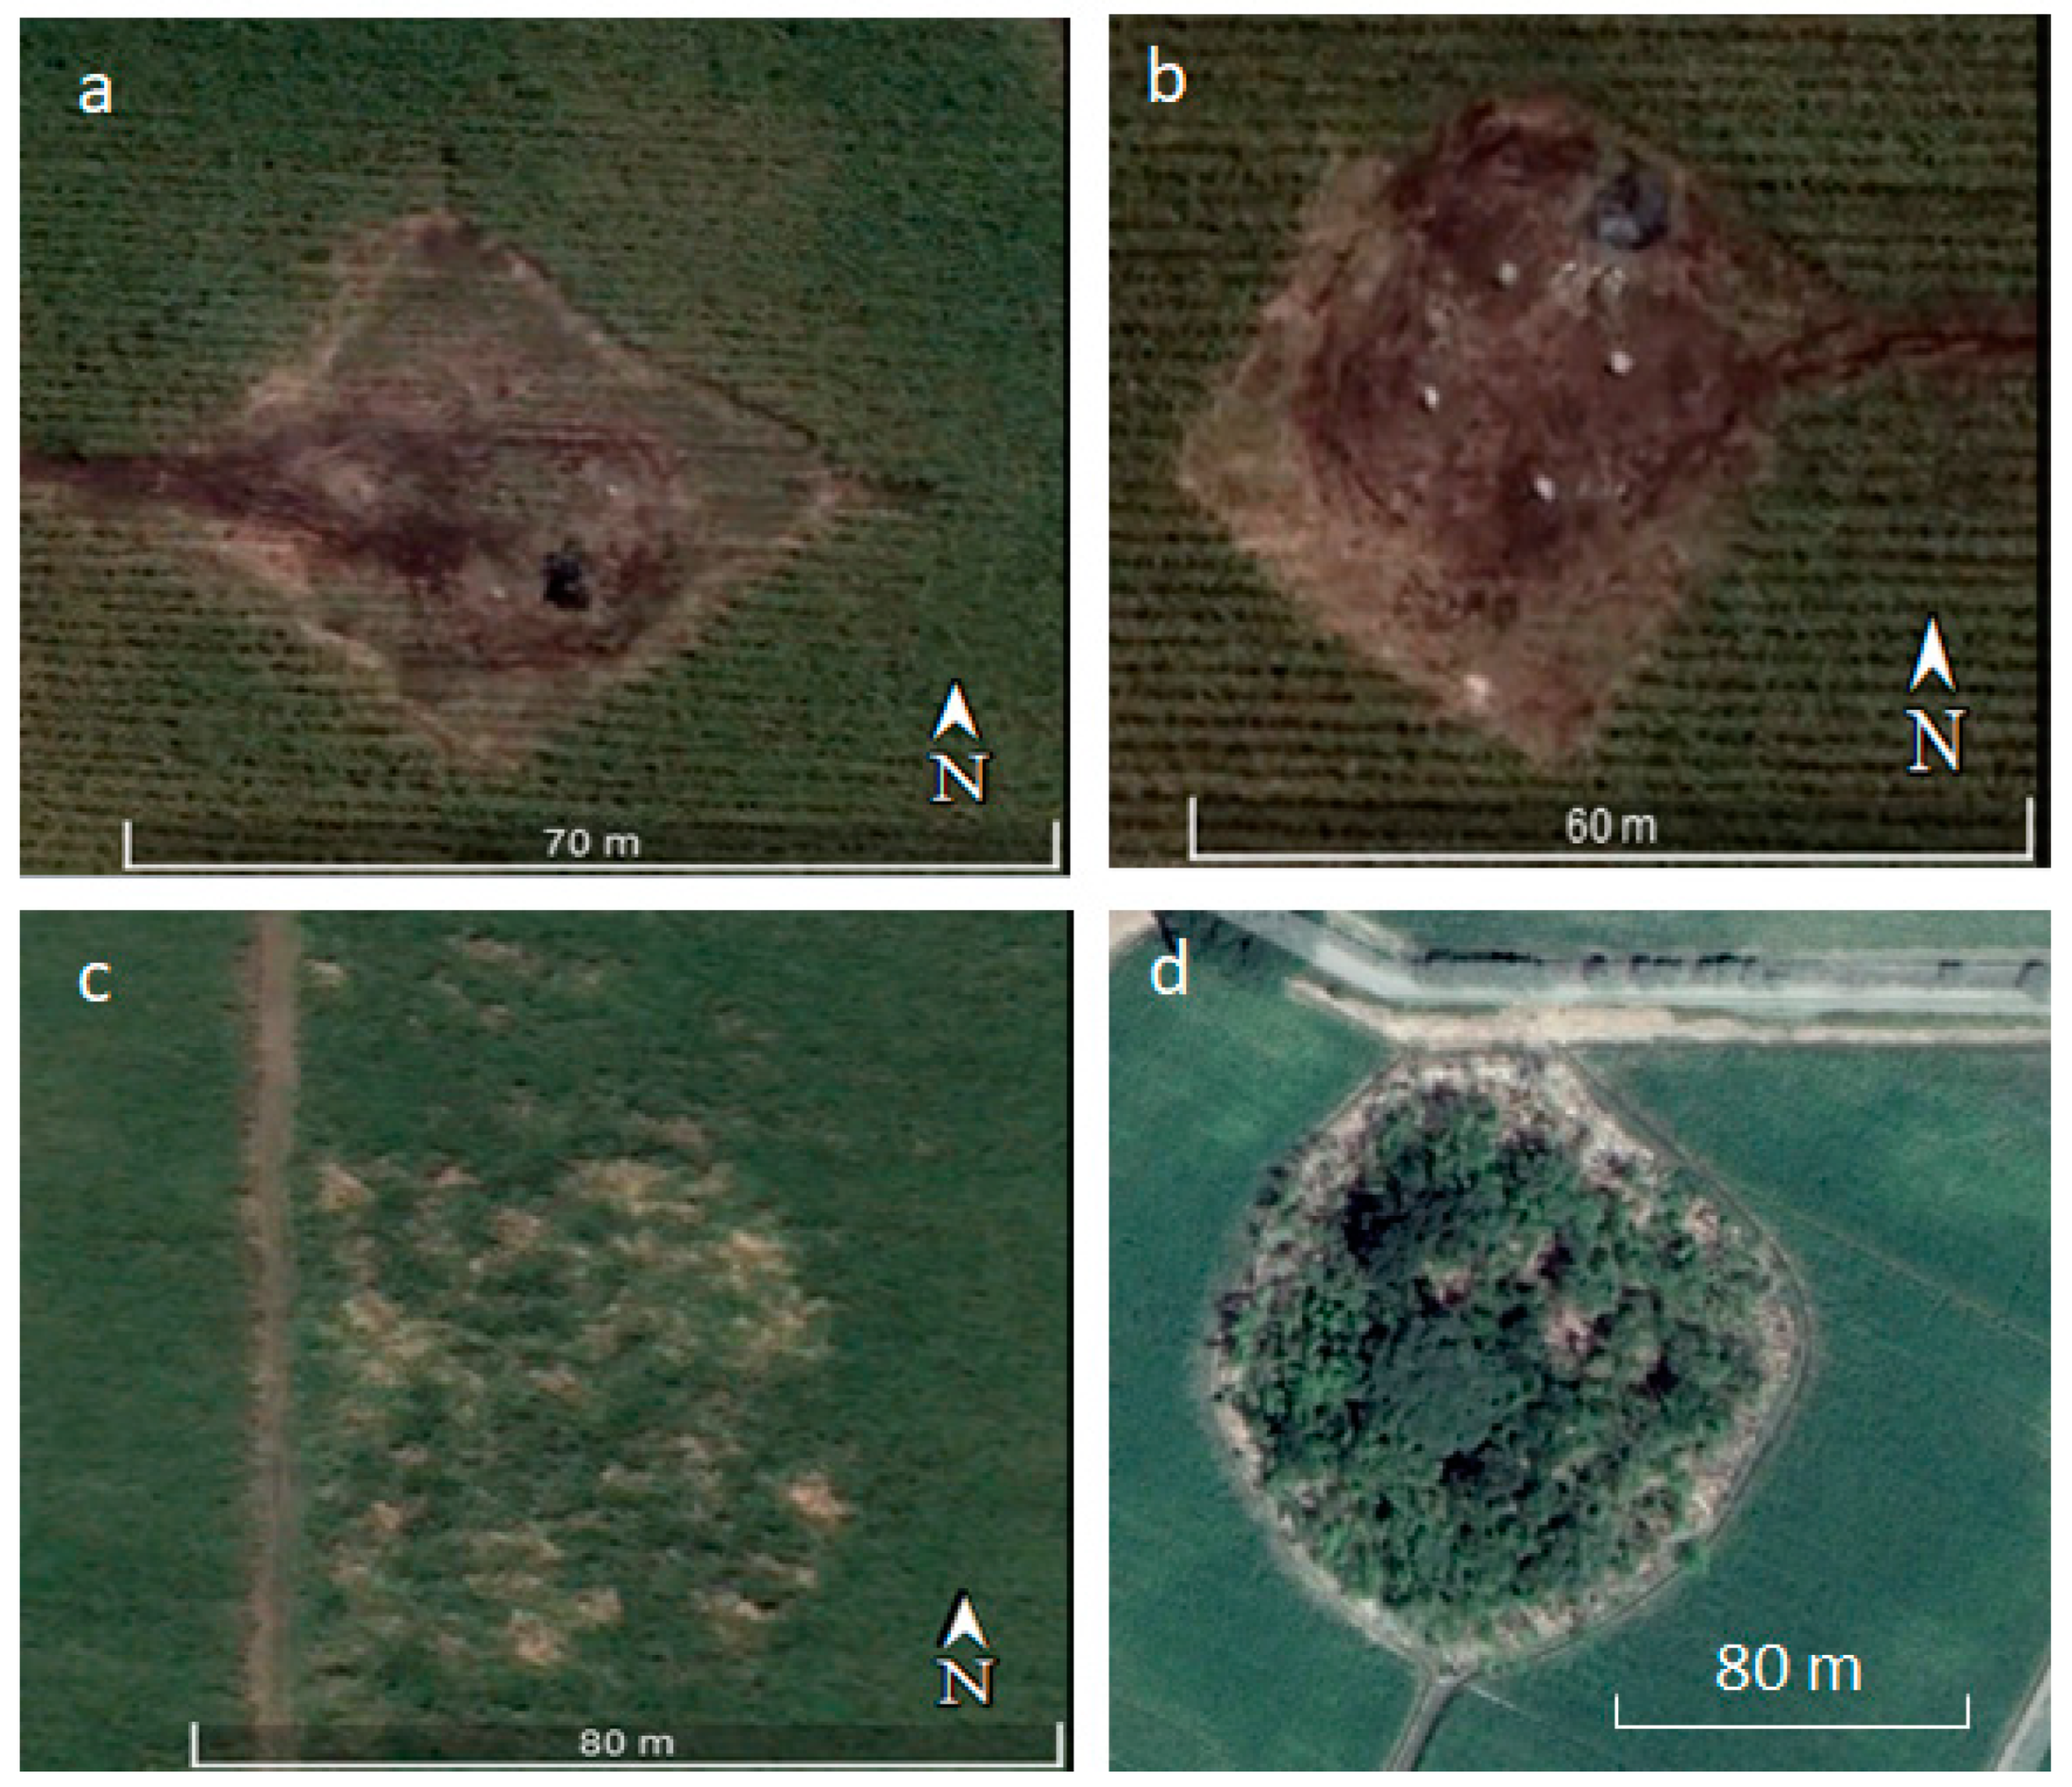
In the Cauca-Patía Valley, 23 fairy circles have been identified (location on Figure 3 and satellite image Figure 4), ranging in size from 10 to 60 m2. Some of these circles are located in sugarcane fields. The pattern is different from that of other fairy circles around the world: vegetation grows within these fairy circles. We note different configurations: (1) in some sugarcane fields, the height of the canes is slightly less than that of the canes outside the circles (Figure 4a–c), and (2) there is something else, planted or naturally grown within the circle (Figure 4d). The images show a combination of reduced vegetation in a relatively circular area and a rectangular or square area framing a depression. The fairy circles looked relatively circular, but the farmer clearly does not try to cultivate the area around. They may have known from the previous years that it was not useful.
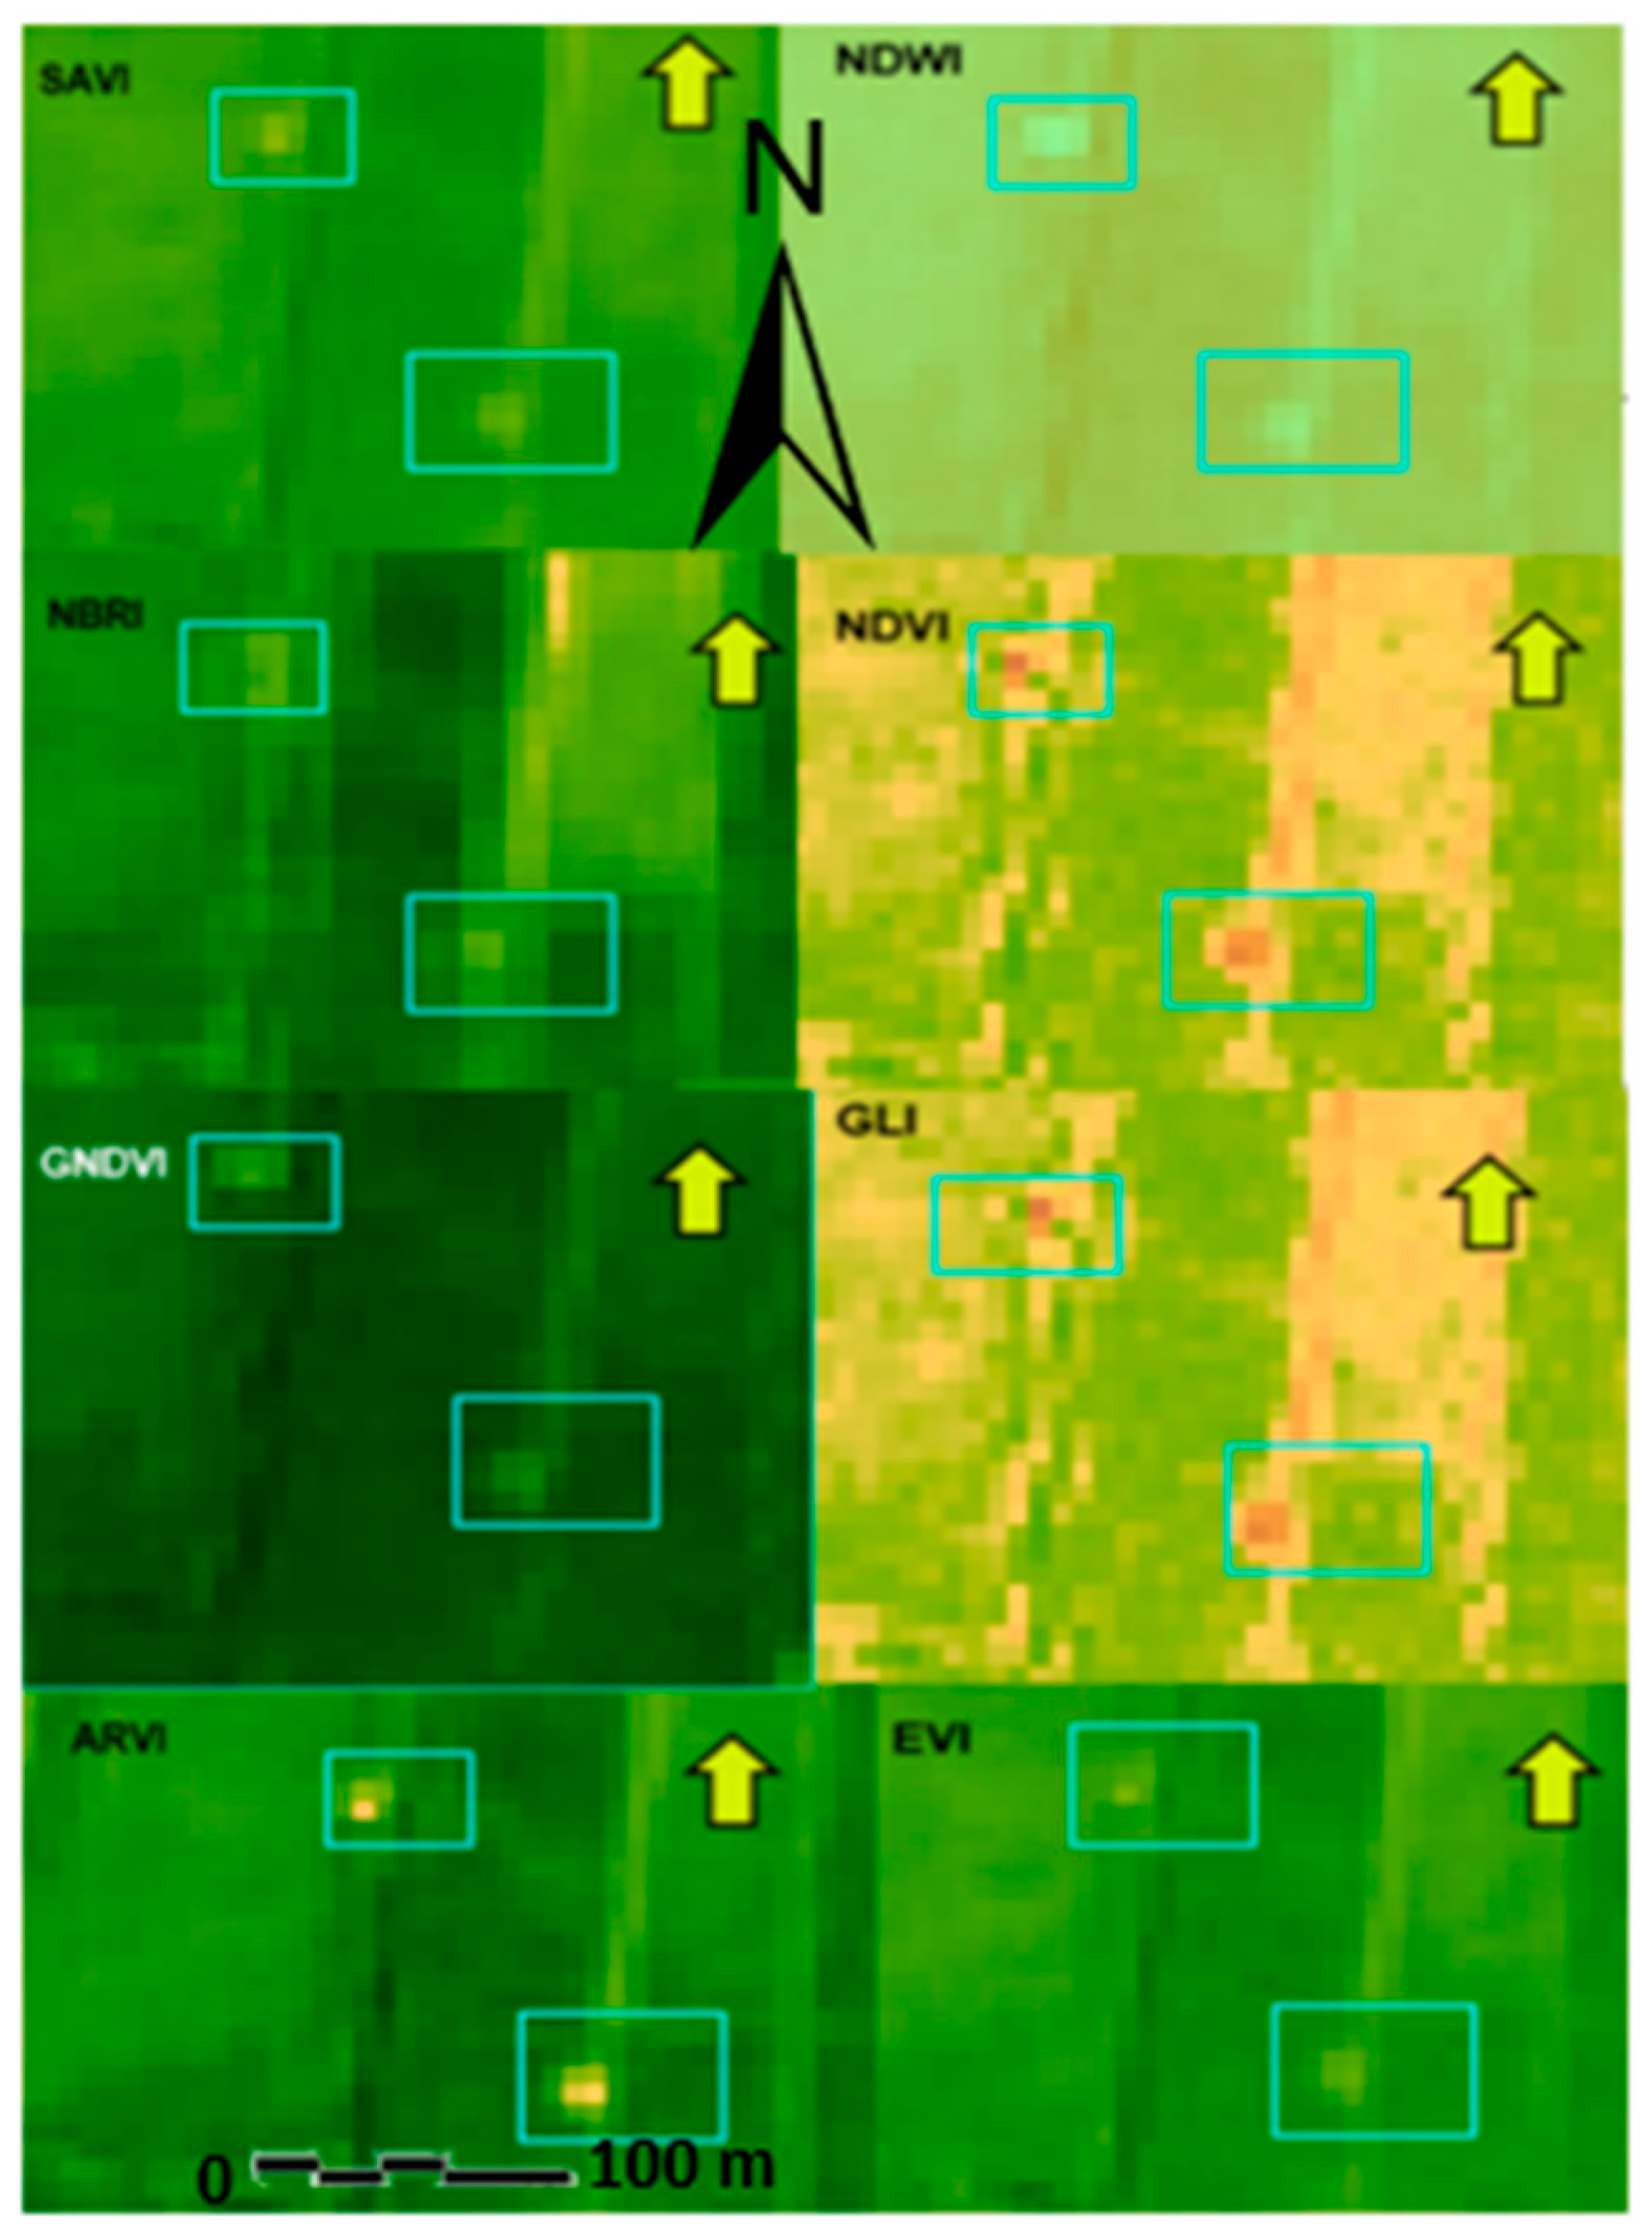
These fairy circles are rather small, but they are also clearly visible on Google Earth satellite images. They are less visible on the Landsat image because the resolution of our dataset is of 30 m. We use of the multispectral data attempting to get an automatic detection of the gas micro-seepage areas (Figure 5). The method which has been proposed to date was based on the vegetation indexes, such as the soil adjusted vegetation index (SAVI) computed from Landsat infra-red data [4,31]. We have used Sentinel-2 to get a better resolution (10–13 m instead of 30). We also extended the computed parameters as shown below and synthetized Table 1.
The Normalized Difference Vegetation Index (NDVI) is an important multispectral index for tracking the physiological dynamics of key plant features such as biomass, nitrogen levels, and leaf area. It is the most widely used remote sensing vegetation index and is based on different ratios of reflected energy in the near-infrared reflectance and red proportion of the light spectrum. It has been used to predict crop yield in the field and its relationship with yield under conditions of drought, heat, and biotic stress has been demonstrated [45].
The Atmospherically Resistant Vegetation Index (ARVI) is a multispectral vegetation index used to monitor and measure biomass, vegetation density, and crop health. The main advantage of ARVI lies in its ability to better correct for atmospheric effects compared to NDVI. ARVI’s atmospheric resistance is achieved through a self-correction process for the atmospheric effect in the red channel. It uses the difference in radiance between the blue and red channels to correct the red channel’s radiance. This allows for more accurate vegetation measurements in areas with varying atmospheric conditions. Simulations utilizing radiative transfer calculations in arithmetic and natural surface spectra, under diverse atmospheric conditions, show that ARVI has a similar dynamic range to NDVI but is, on average, four times less sensitive to atmospheric effects than NDVI. This makes ARVI particularly useful in regions with high atmospheric variability and in studies that require precise measurements [46].
The Greenness Normalized Difference Vegetation Index (GNDVI) is a multispectral vegetation index used to measure the amount of vegetation in a given area. Unlike NDVI, GNDVI is based on reflectance in the green band (G) rather than the red band (R). The idea behind this modification is that the green band is less sensitive to environmental and atmospheric effects, allowing for more precise vegetation measurements. GNDVI has been successfully used to monitor and predict crop yield under various environmental conditions, such as drought, heat, and biotic stress. Additionally, GNDVI is less sensitive to the effects of direct sunlight and humidity compared to other indices [47].
The Short-Wave Infrared and Near-Infrared Burned Area Index (NBRI) is a multispectral vegetation index used for the detection and monitoring of burned areas. Its calculation is based on the B8a near-infrared and B11 short-wave infrared bands, normalized using the same spectral bands. NBRI relies on the premise that burned areas exhibit distinct spectral characteristics compared to green areas, making it a valuable tool for highlighting these regions in satellite images. It has been successfully employed in detecting burned areas in forests and natural environments and is considered a valuable tool for wildfire monitoring and management. Furthermore, NBRI is less sensitive to environmental and atmospheric effects compared to other vegetation indices, enabling more accurate measurements of burned areas [48].
The Green Leaf Index (GLI) is a measure of reflectance in the blue, green, and red bands within the visible spectrum, and is used to assess the total chlorophyll content of leaves. It is highly correlated with maize nitrogen content and has long been used to monitor whether crops have sufficient nitrogen. By quantifying visible color differences related to nitrogen content, the GLI could serve as an additional factor to amplify nitrogen-based differences between crops. Blue reflectance has also been used to detect differences in chlorophyll concentrations or other carotenoids related to nitrogen and water stress. It is included in the calculation of the Enhanced Vegetation Index (EVI), which has proven effective in distinguishing between soil and vegetation, suggesting that blue reflectance might be more sensitive to stress affecting vegetation cover rather than color [49].
The Enhanced Vegetation Index (EVI) is a multispectral vegetation index used to monitor and measure biomass, vegetation density, and crop health. It was developed to extend sensitivity to high leaf biomass while minimizing the impact of aerosols and background uncertainty sources. EVI has been successfully used to monitor and predict crop yields under different environmental conditions, such as drought, heat, and biotic stress. Additionally, EVI has been employed to differentiate between soil and vegetation, making it particularly useful in remote sensing studies and vegetation cover monitoring. Overall, EVI is considered one of the most accurate and reliable vegetation indices available for crop improvement and vegetation monitoring studies [50].
Based on this analysis, soil gas measurements were planned for the accessible vegetation anomalies in the valley and the faults near Ginebra (see Figure 3).
4. Soil Gas Measurements
The data of the soil gas measurement are presented Table 2. Due to the hardness of the soils, or rocks near the faults, it was not possible to drill down to the standard 80/100 cm. The “depth” column indicates the depth at which the gas was pumped. The hours have been also noted for future work. In this study, sufficient time in the field was not allocated to collect time series to evaluate the gas-content variations around a full day period. Consequently, the soil gas data at each sampling location represent only a one-time sampling event. At first glance, one may note that H2 is present in all the selected zones. The highest concentrations of hydrogen were along the fault zone and elevated concentrations of H2 content were also detected in the fairy circles.
4.1. Zones of Vegetation Anomalies
Due to access difficulties and time constraints, gas was only measured in 3 of the 13 structures identified by remote sensing. As shown in Table 2, values exceed 200 ppm ST1 and ST2. Overall, the values are more homogeneous that the ones published in other SCD’s (Namibia or Brazil) and much higher than those for Australia [51]. The methane content is neglectable, lower than 1%, and the CO2 content is rather variable with a maximum value of 25%. This fairy circle (SCD-1) is located on a farm where various animals including horses and cows are present.
4.2. Soil Gas Measurement on the Fault Zones
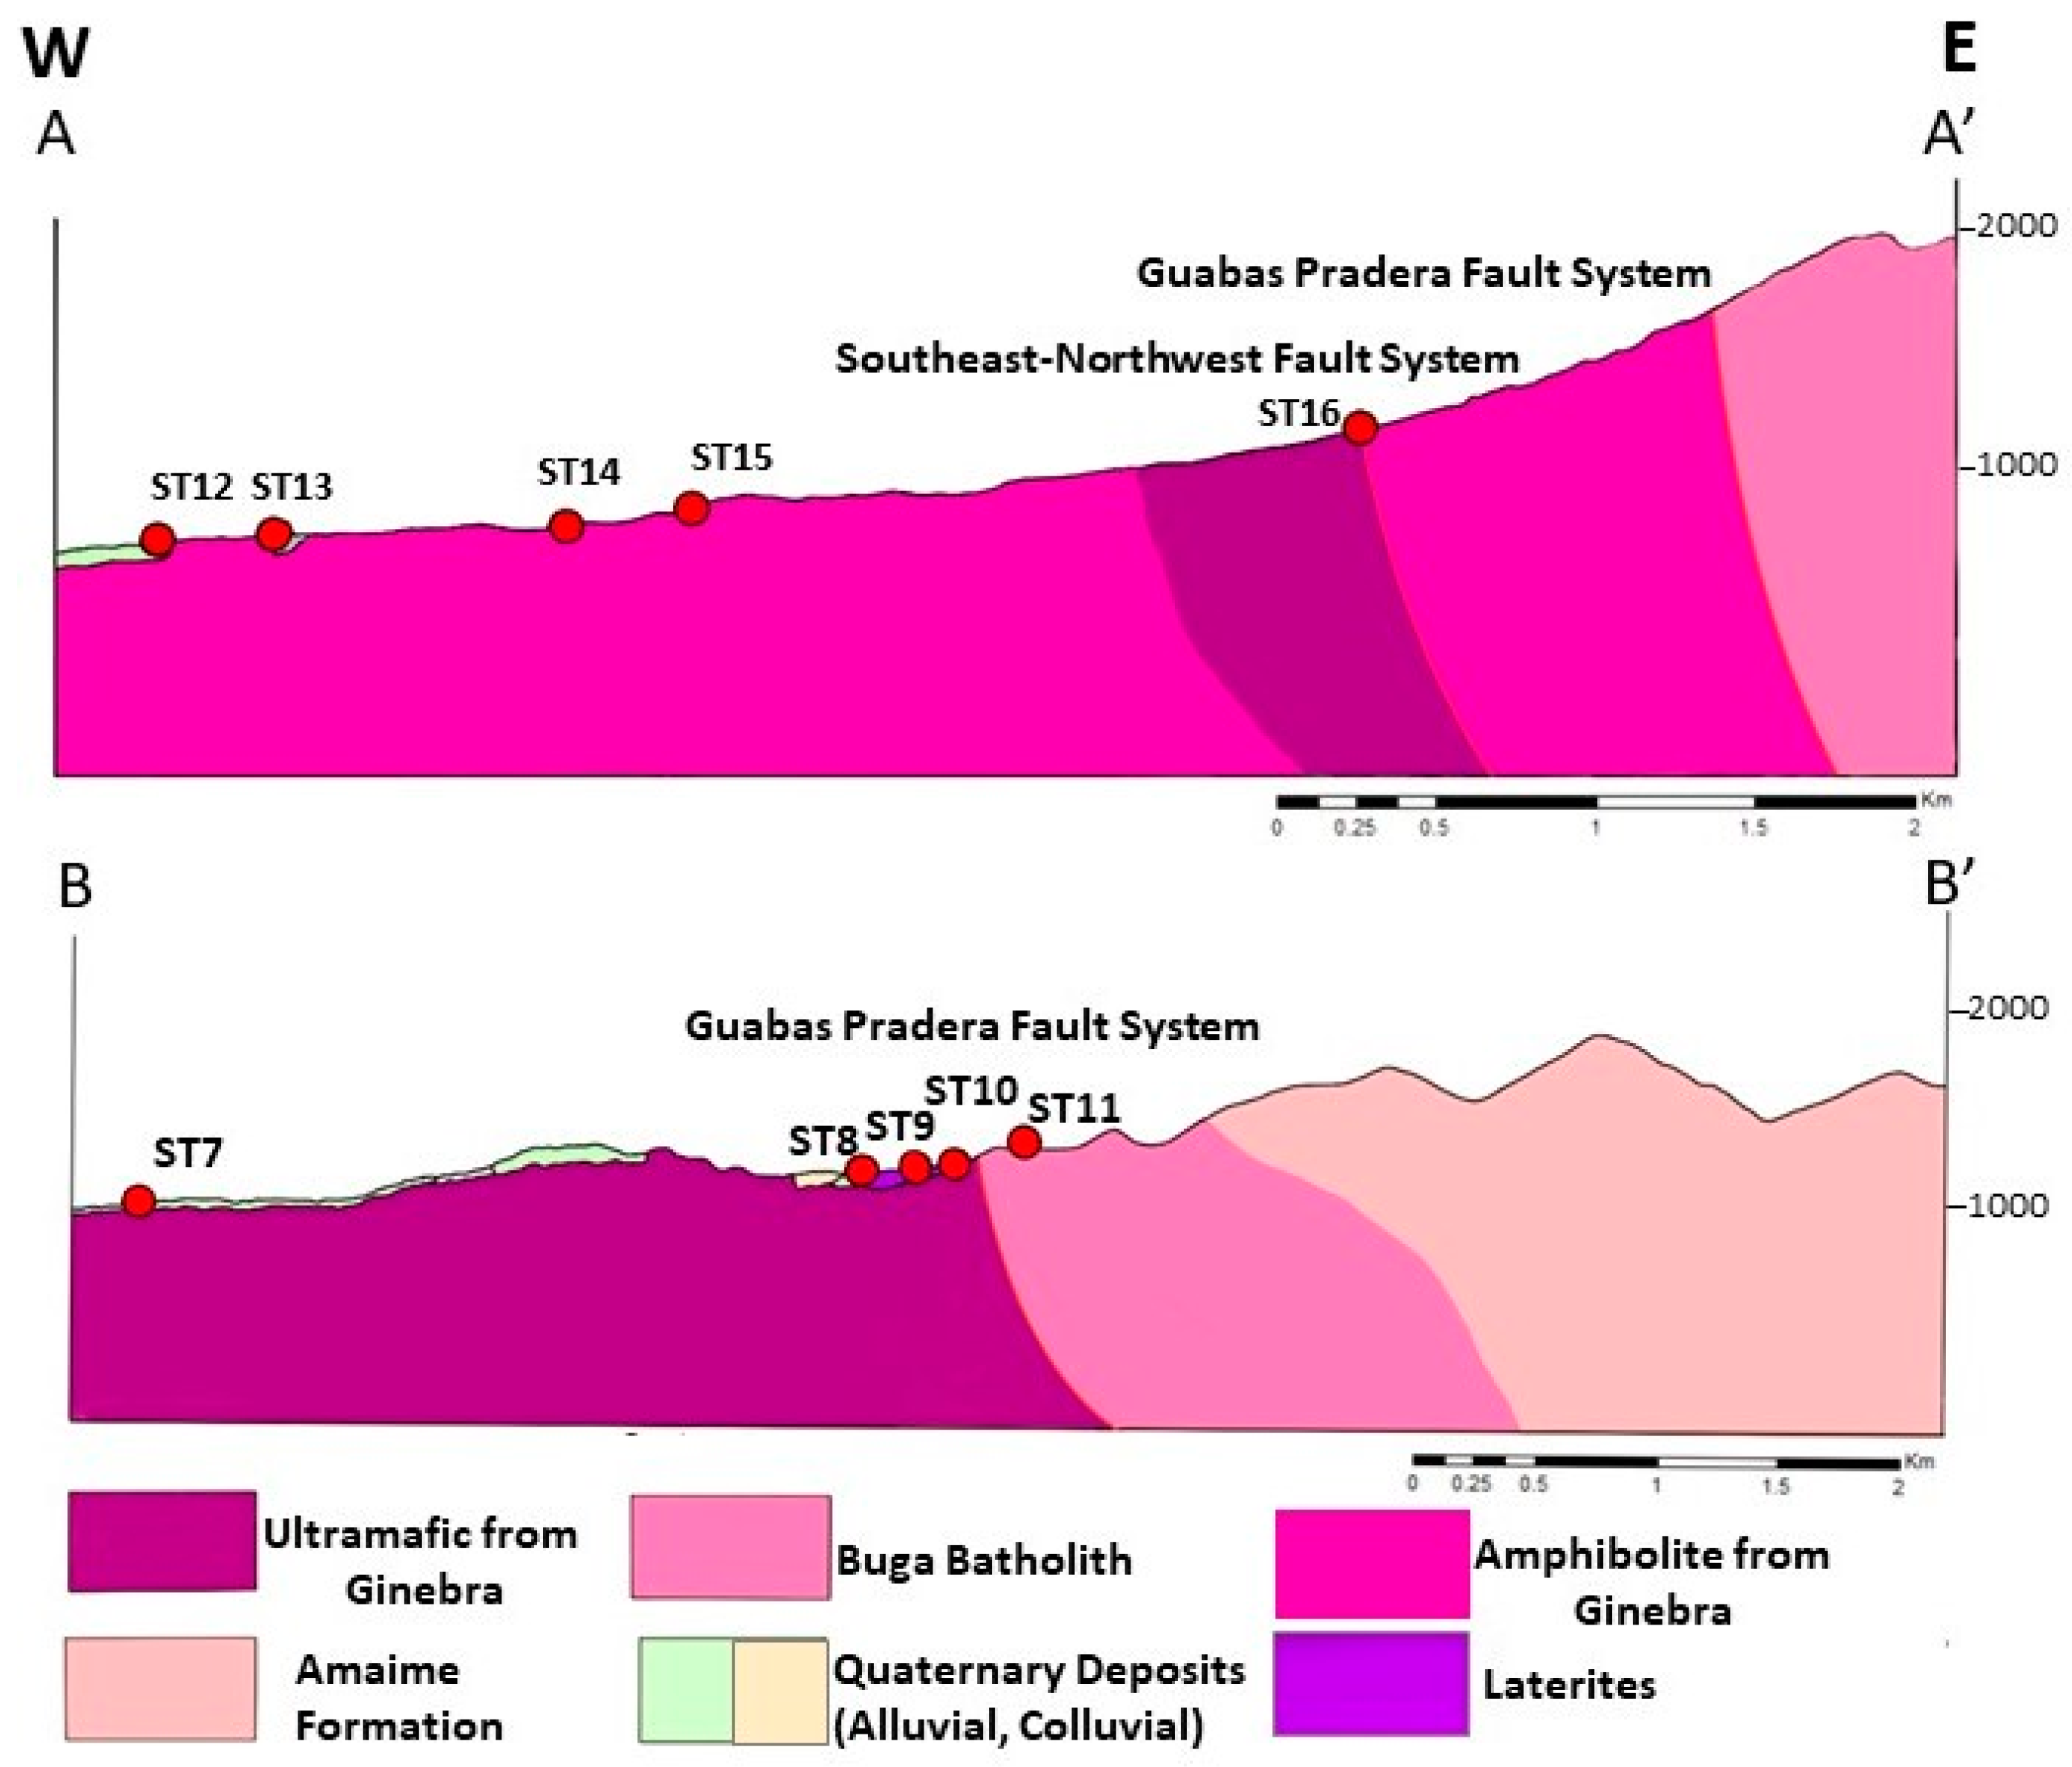
Two cross-sections have been realized to measure the gas near the fault system that border the Mesozoic ultramafic body of Ginebra. The stations H2_ST4 to 11 are in the southern B-B’ section and the ST12 to ST16 are in session C-C’. We tested the presence of H2 within the fault zone, considering that it could be a migration pathway for gases generated at greater depths. We also aimed to measure the disparity between the hanging wall and the footwall, specifically between the valley where a sedimentary layer overlays the ophiolites and the ultramafic body itself. Table 2 provides the presented values, and the H2 content along the section is illustrated in Figure 6.
As shown in Table 2, it was sometimes very difficult to drill within the rock and some of the data have been collected very near the surface. In that case, from our experience, the H2 content is often rather low due to the quantity of air in the shallow soil. However, as for the zones of vegetation anomalies, H2 presence was detected in all soil gas samples with concentration varying from 6 to 330 ppm. The methane content remains null, and the CO2 was also variable reaching a maximum of 13%. H2S levels were very low, always between 1 and 2 ppm) and the CO content was also low but varied from 0 to 22 ppm.
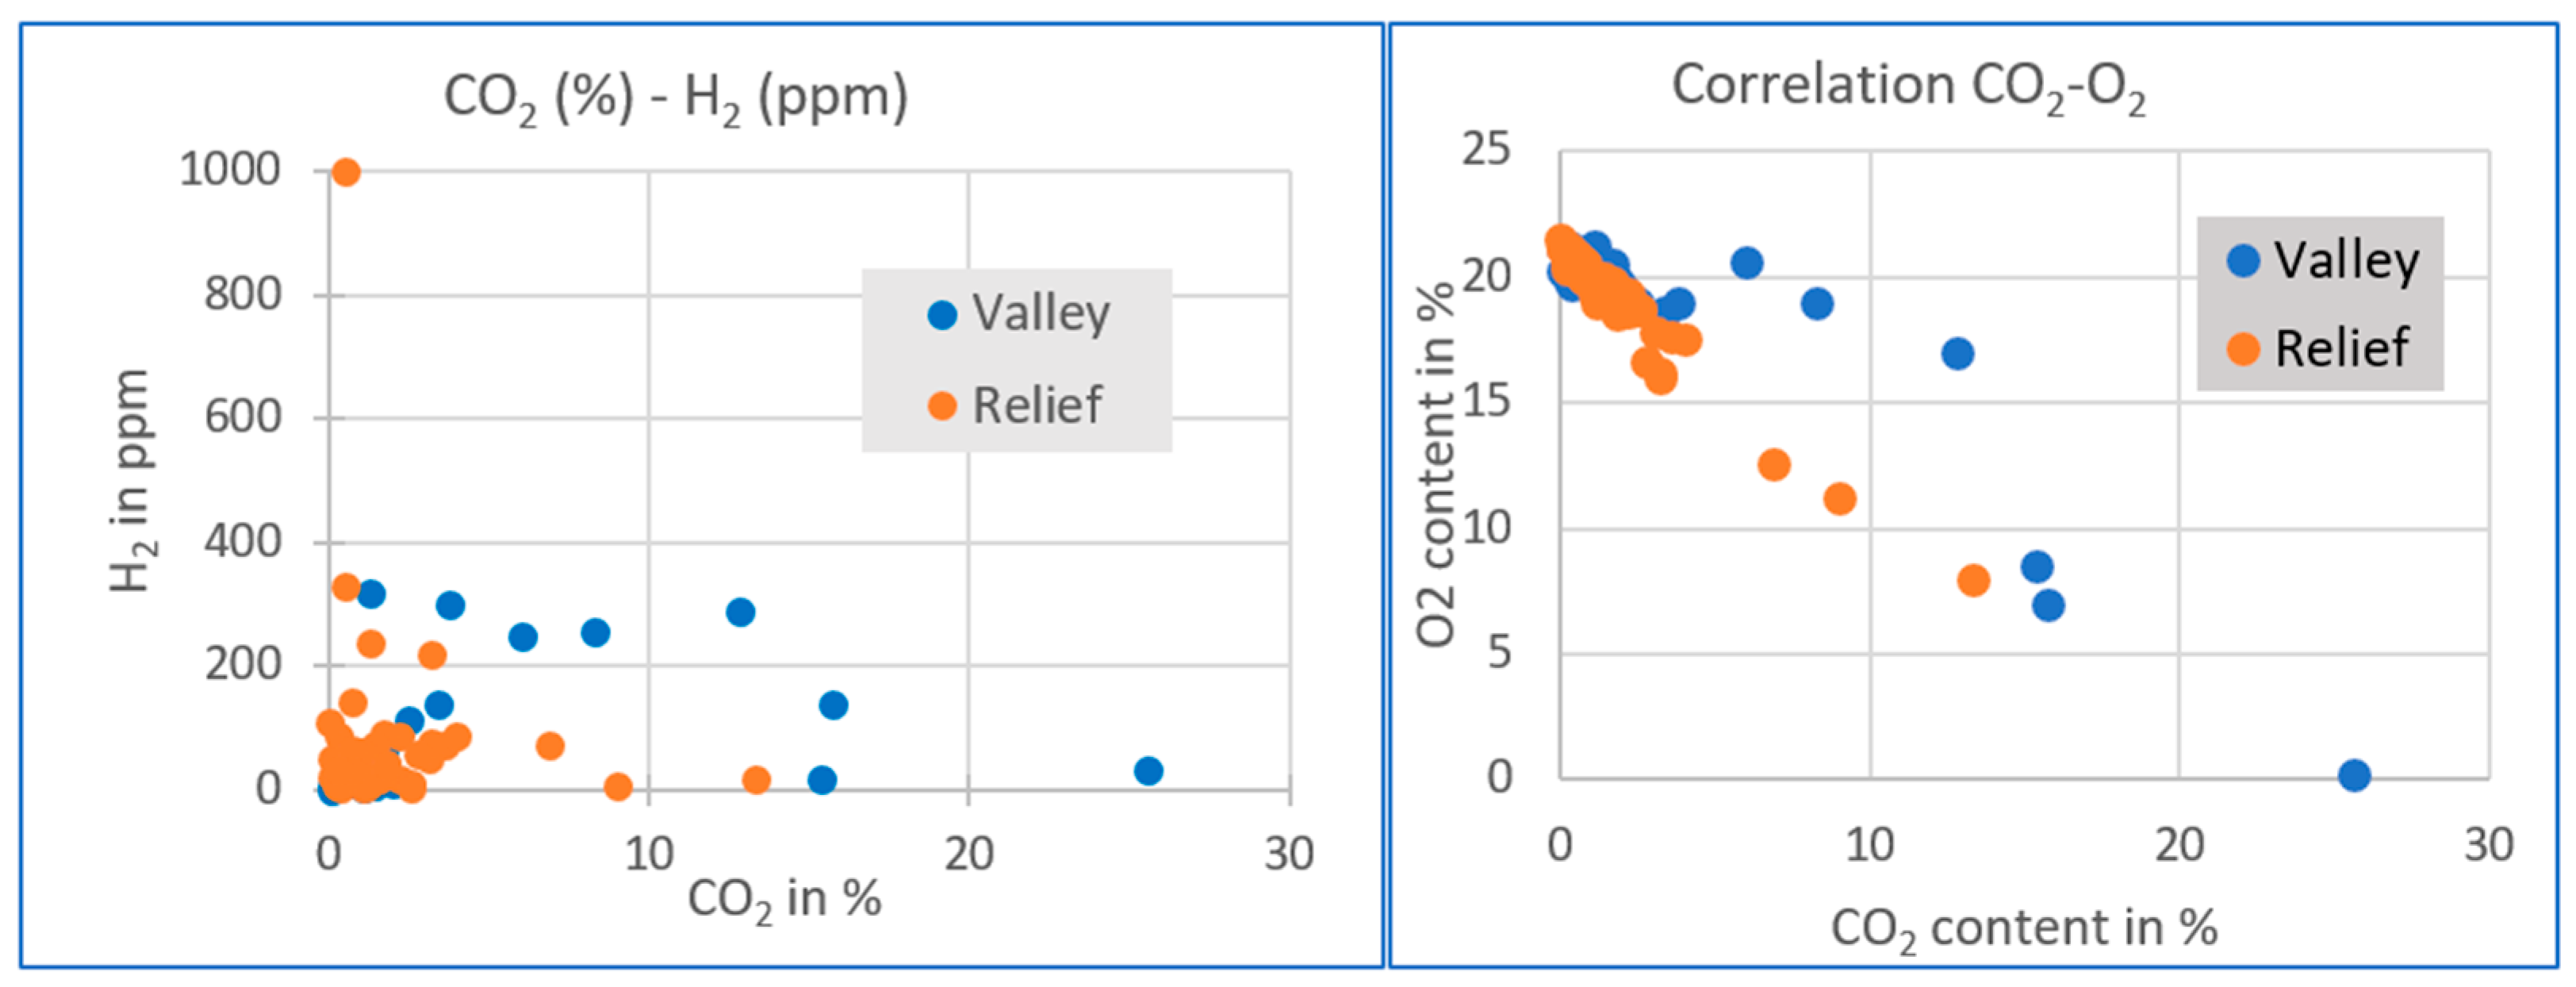
There is no correlation between the CO2 and the H2 concentrations (Figure 7) and in the absence of methane, one may note a direct correlation between the CO2 and the O2 contents. In only two cases, both in the SCD-1, the sum O2 + CO2 exceed 24% resulting in a deficit in nitrogen. However, the Bio GA does not analyze all gases in the field, in particular nitrogen; so, the value “balance” in Table 2, often interpreted as nitrogen, is just inferred from the sum of all other gas concentrations.
5. Discussions and Conclusions
5.1. Sub Circular Depressions and Gas Escape
The relationship between the vegetation anomalies and the H2 escape is a research topic still subject to debate. Some researchers consider that the H2 explorationists give too much importance to this subject, others believe it forms the foundational basis for initiating the definition of a play [4]. There is truth in both points of view and the quantitative values of H2 in the soil may be affected by many processes [52]. Once again, in Colombia, by selecting the area for soil gas analysis based on the presence of H2 potential generating rocks and vegetation anomalies, we found relatively high H2 content in the shallow soil. The second preselected zone, near Ginevra, was the ophiolites thrust sheets; a geological context where H2 is expected to be present. We can therefore consider that our understanding of hydrogen systems is now reasonably established for the initial basin selection stage in order to be quick and efficient [4]. Just as oil seeps do not indicate potential drilling locations, H2 gas surface emanations do not indicate where and if there could be underground commercial accumulation of natural hydrogen. Mapping of the SCD and the H2-GRs form a starting basis for further exploration.
However, the vegetation anomalies in this humid tropical zone of Colombia are slightly different from previous observations in Brazil [6,44], in Namibia [31] and in Australia [51,53]. These last three zones are rather dry with a tropical to Mediterranean climate, and they are located in the southern hemisphere at 16°, 20°, and 31° South, respectively. During the rainy season, the SCD could be full of water, but the area is very dry for most of the year, making agriculture almost impossible. Trees do not grow in the SCD, and perhaps they are dead like in Russian or North American SCD’s [28,29]. The Cauca-Patia Valley is at the opposite in the wet equatorial zone, at 5° N of latitude, about 1000 m above sea level. The valley is highly cultivated, with sugarcane plantations covering the entire valley. In this context, gas emanations affect the plants, especially the sugarcane crops, but without killing them. Additionally, as illustrated in Figure 4, there are instances where the observed anomaly is simply another plants, particularly bamboo in our case. We have not carried out a soil survey and this is not our area of expertise, but these observations deserve an explanation. What makes soil containing a high H2 content or H2-consuming microorganisms less suitable for sugarcane but compatible with the growth of bamboo?
These observations also weaken the “absence of vegetation ⇔ H2 related SCD” link observed elsewhere. It would seem that we should be systematically looking for abnormal vegetation, and so indexes linked to infra-red datasets (Landsat, Sentinel, and other programs) rather than only the absence of such vegetation which could be easily mapped using Google Earth satellite images.
5.2. Potential of the Cauca-Paita Valley
This work demonstrates that H2 emanations exist in the Cauca-Paita Valley and has provided solid evidence of the existence of a hydrogen system in the region and more generally in Colombia.
Through analogy with other countries, like Oman, New Caledonia, and the Philippines [5], we consider that ophiolites, geological formations present in and around the basin, are likely the primary source of hydrogen in this region. An alternative will be the Buga Batholite alteration, the facies of this batholith is biotite-rich and its alteration may generate H2 as suggested in the case of the Rhine Graben [54]. However, we cannot disregard the influence of the mantle wedge just below the oceanic lithosphere involved in the accretion (see Figure 2). In the Pyrenees, the H2 emanations are considered to be sourced by a mantle wedge located only a few kilometers below the surface and which is currently being altered by serpentinization [55]. In that Pyrenean case, the migration pathway is supposed to be the deeply rooting faults and the targeted reservoirs are compressive structures below a salt layer which could be the seal, which is a classical pattern for a foreland. However, often the known H2 generating rock is not so deep; in Oman and New Caledonia, the ophiolites are outcropping, and it is unclear if reservoirs may exist within the thrust sheets. The setting of the Cauca-Paita Valley seems more favorable for H2 accumulations since in the valley the sedimentary formations covering the ophiolites may contain reservoir rocks. Structural traps may exist due to compression, and alongside these, stratigraphic traps can also be encountered. Through analogy in the Magdalena Valley or in the Llanos Basin, the facies variation within the tertiary deposits results in stratigraphic traps [56].
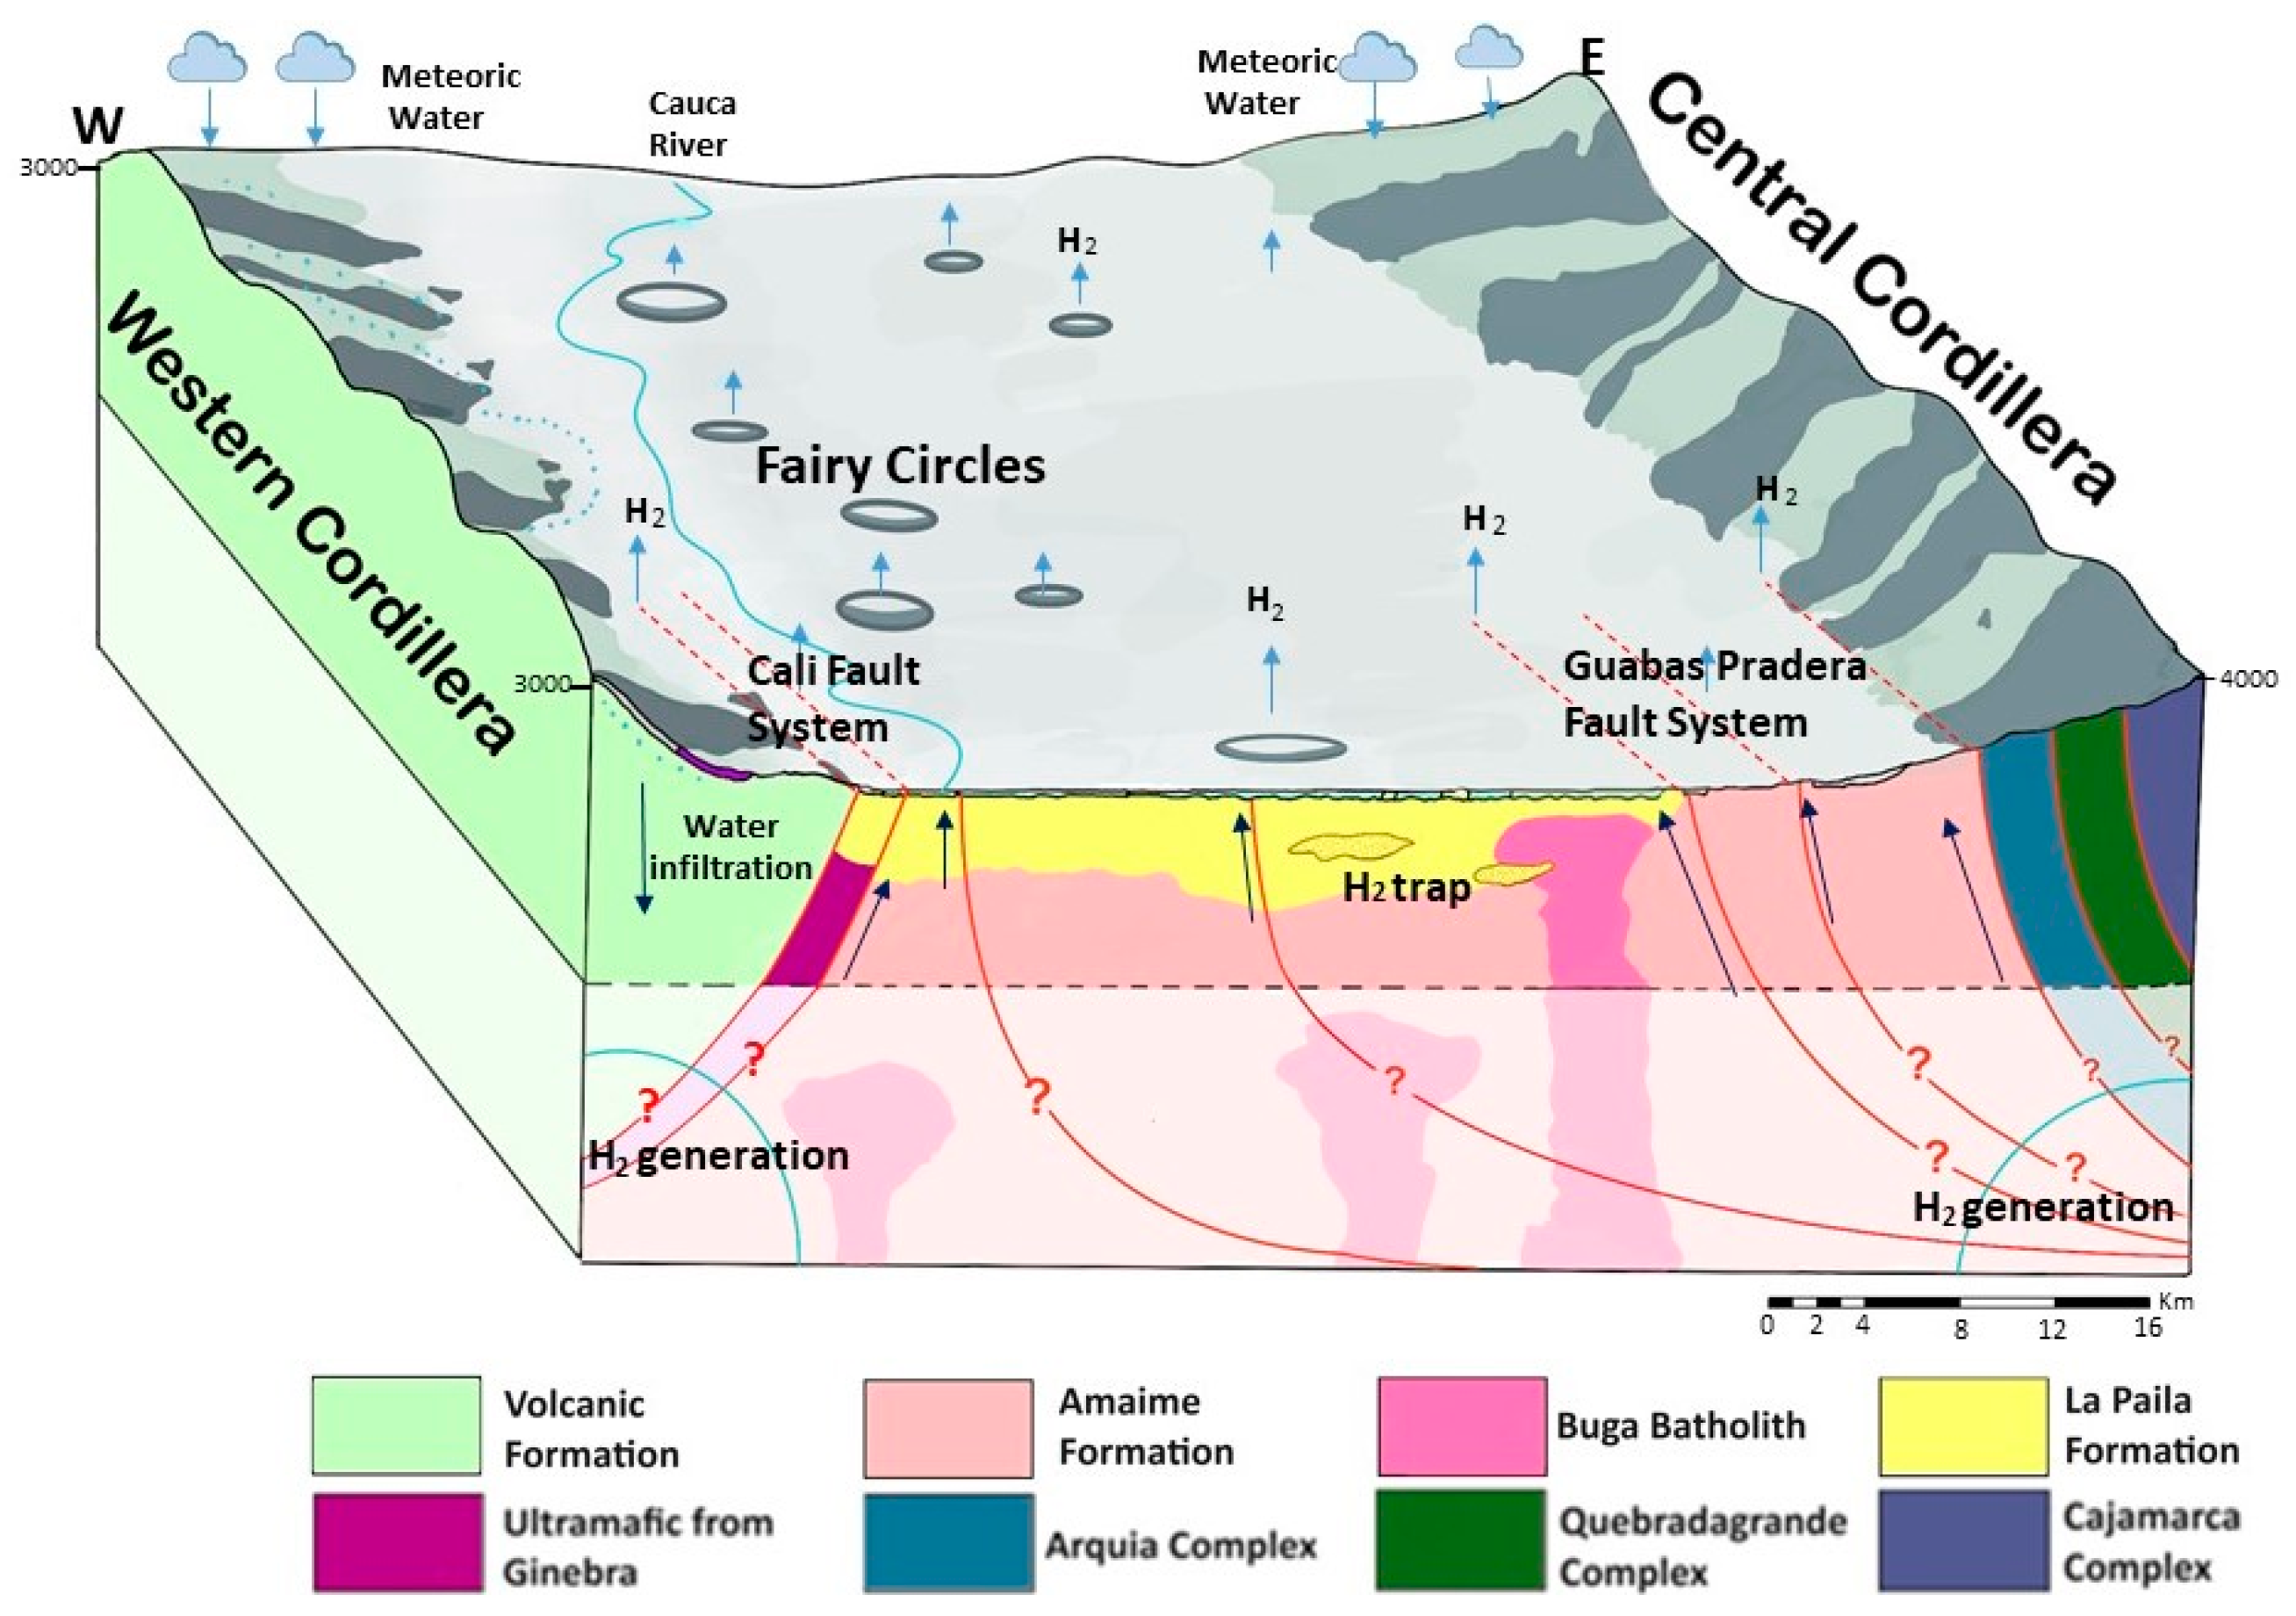
Figure 8 synthetizes our current view of the H2 system within the Valley. Meteoric water infiltration in the relief results in a downward circulation of the water that reacts with the ophiolites or other iron-rich rocks such as the intrusion at a depth large enough to allow fast reactions. It could be classical serpentinization or magnetic oxidation at low temperature as proposed by [27]. The generated H2 migrates through the faults or in a dissolved phase within the aquifers. It could be trapped in the valley in case of presence of reservoir and seal. H2 which is not trapped continues to migrate to the surface and results in the measured emanations within the fairy circles. The presence of seals is not sufficiently constrained within the Valley system, but in Mali, intrusions of dolerite sills provide an excellent seal of H2 reservoirs [57]. Thus, a similar case could be proposed as sketched on Figure 8.
5.3. Conclusions
Whilst this research is still preliminary, we provide the first evidence of natural hydrogen emissions in the Colombian accreted terranes. There are hydrogen emissions on the faults bordering the Cauca-Paita Valley and microseepages within the valley itself.
This confirmation marks a significant milestone in understanding the geological and geochemical processes in this region and its potential in holding H2 resources as a new primary carbon-free energy source.
Future work should focus on data acquisition to image the subsurface in the valley in an attempt to identify possible reservoirs, seals, and traps. A better knowledge of the iron content of the various ultramafic rocks will also provide more quantitative data and if the results were inconclusive, to our understanding, would not represent a negative factor for continued exploration. A study of the ground water and its gas dissolved phase should also provide useful and relevant data as it has been carried out in Kosovo [22]
Globally for Colombia, the presence of natural hydrogen emissions in the Cauca-Patia basin suggests that there could be new carbon-free energy resources in this region, which currently lacks conventional fossil fuel reserves.
Author Contributions
The intuition that the Cauca-valley could have H2 resource emerged from discussion between all authors. This paper synthetizes the A.C.R. master work. G.R. provided some of the data. The remote sensing analysis has been done by A.C.R. The soil gas measurements by A.C.R., F.G.P. and I.M. I.M. and A.C.R. prepared the first version of the paper. All authors have read and agreed to the published version of the manuscript.
Funding
The field acquisition has been funded by Atlas Research. The work done in France by UPPA.
Data Availability Statement
All gas data collected are in the Table 2.
Acknowledgments
Alejandra’s Master thesis has been conducted at the National University under the supervision of Marion Weber. The field trips were carried out with the Juan Carlos Molano and Ariel Cadena. We would like to thank Philippe Dubreuilh, Gabriel Pasquet, and Vincent Roche, as well as the two anonymous reviewers for a careful review of the preliminary version of this manuscript.
Conflicts of Interest
The authors declare no conflict of interest.
References
- Rigollet, C.; Prinzhofer, A. Natural Hydrogen: A New Source of Carbon-Free and Renewable Energy That Can Compete With Hydrocarbons. First Break 2022, 40, 78–84. [Google Scholar] [CrossRef]
- Diallo, A.; Cissé, C.S.T.; Lemay, J.; Brière, D.J. La découverte de l’hydrogène naturel par Hydroma, un «Game Changer» pour la transition énergétique. Ann. Mines-Réalités Ind. 2022, 2022, 154–160. [Google Scholar] [CrossRef]
- Brandt, A. Greenhouse gas intensity of natural hydrogen produced from subsurface geologic accumulations. Joule 2023, 7, 1818–1831. [Google Scholar] [CrossRef]
- Lévy, D.; Roche, V.; Pasquet, G.; Combaudon, V.; Geymond, U.; Loiseau, K.; Moretti, I. Natural H2 exploration: Tools and workflows to characterize a play. Sci. Technol. Energy Transit. 2023, 78, 27. [Google Scholar] [CrossRef]
- Vacquand, C.; Deville, E.; Beaumont, V.; Guyot, F.; Sissmann, O.; Pillot, D.; Arcilla, C.; Prinzhofer, A. Reduced gas seepages in ophiolitic complexes: Evidences for multiple origins of the H2-CH4-N2 gas mixtures. Geochim. Cosmochim. Acta 2018, 223, 437–461. [Google Scholar] [CrossRef]
- Moretti, I.; Prinzhofer, A.; Françolin, J.; Pacheco, C.; Rosanne, M.; Rupin, F.; Mertens, J. Long term monitoring of natural hydrogen superficial emissions in a Brazilian cratonic environment. Sporadic large pulses versus daily periodic emissions. Int. J. Hydrogen Energy 2021, 46, 3615–3628. [Google Scholar] [CrossRef]
- Geymond, U.; Ramanaidou, E.; Lévy, D.; Ouaya, A.; Moretti, I. Can Weathering of Banded Iron Formations Generate Natural Hydrogen? Evidence from Australia, Brazil and South Africa. Minerals 2022, 12, 163. [Google Scholar] [CrossRef]
- Sherwood Lollar, B.; Onstott, T.C.; Lacrampe-Couloume, G.; Ballentine, C.J. The contribution of the Precambrian continental lithosphere to global H2 production. Nature 2014, 516, 379–382. [Google Scholar] [CrossRef]
- Truche, L.; Joubert, G.; Dargent, M.; Martz, P.; Cathelineau, M.; Rigaudier, T.; Quirt, D. Clay minerals trap hydrogen in the Earth’s crust: Evidence from the Cigar Lake uranium deposit, Athabasca. Earth Planet. Sci. Lett. 2018, 493, 186–197. [Google Scholar] [CrossRef]
- Horsfield, B.; Mahlstedt, N.; Weniger, P.; Misch, D.; Vranjes-Wessely, S.; Han, S.; Wang, C. Molecular hydrogen from organic sources in the deep Songliao Basin, P.R. China. Int. J. Hydrogen Energy 2022, 47, 16750–16774. [Google Scholar] [CrossRef]
- Boreham, C.J.; Edwards, D.S.; Feitz, A.J.; Murray, A.P.; Mahlstedt, N.; Horsfield, B.; Boreham, C.J.; Edwards, D.S.; Feitz, A.J.; Murray, A.P.; et al. Modelling of hydrogen gas generation from overmature organic matter in the Cooper Basin, Australia. APPEA J. 2023, 63, S351–S356. [Google Scholar] [CrossRef]
- Restrepo, J.J.; Toussaint, J.F. The geology of Colombia. Chapter 3: Tectonostratigraphic terranes in colombia: An update first part: Continental terranes. In The Geology of Colombia, Volume 1 Proterozoic—Paleozoic; Gómez, J., Mateus–Zabala, D., Eds.; Servicio Geológico Colombiano: Bogotá, Colombia, 2020. [Google Scholar] [CrossRef]
- Gonzalez-penagos, F.; Moretti, I.; Guichet, X. Fluid Flow Modeling in the Llanos Basin, Colombia. In Petroleum Systems Analysis—Case Studies: AAPG Memoir; AbuAli, M.A., Moretti, I., Bolås, H.M.N., Eds.; The American Association of Petroleum Geologists: Washington, DC, USA, 2017; Volume 114, pp. 191–217. [Google Scholar]
- Moretti, I.; Charry, G.R.; Morales, M.M.; Mondragon, J.C. Integrated exploration workflow in the South Middle Magdalena Valley (Colombia). J. S. Am. Earth Sci. 2010, 29, 187–197. [Google Scholar] [CrossRef]
- Lopez-Ramos, E. Origin of a Double Forearc Basin: The Example of the Tumaco—Manglares Basin, Northwestern Southamerica. CT&F—Cienc. Tecnol. Futuro 2020, 10, 67–92. [Google Scholar] [CrossRef]
- Bayona, G.; Cortés, M.; Jaramillo, C.; Ojeda, G.; Aristizabal, J.J.; Reyes-Harker, A. An integrated analysis of an orogen– sedimentary basin pair: Latest Cretaceous—Cenozoic evolution of the linked Eastern Cordillera orogen and the Llanos Foreland Basin of Colombia. Geol. Soc. Am. Bull. 2008, 120, 1171–1197. [Google Scholar] [CrossRef]
- Marcaillou, C.; Muñoz, M.; Vidal, O.; Parra, T.; Harfouche, M. Mineralogical evidence for H2 degassing during serpentinization at 300 °C/300 bar. Earth Planet. Sci. Lett. 2011, 303, 281–290. [Google Scholar] [CrossRef]
- McCollom, T.M.; Klein, F.; Moskowitz, B.; Berquó, T.S.; Bach, W.; Templeton, A.S. Hydrogen generation and iron partitioning during experimental serpentinization of an olivinepyroxene mixture. Geochim. Cosmochim. Acta 2020, 282, 55–75. [Google Scholar] [CrossRef]
- Charlou, J.L.; Donval, J.P.; Fouquet, Y.; Jean-baptiste, P.; Holm, N. Geochemistry of high H2 and CH4 vent fluids issuing from ultramafic rocks at the Rainbow hydrothermal field (36°14′ N, MAR). Chem. Geol. 2002, 191, 345–359. [Google Scholar] [CrossRef]
- Klein, F.; Bach, W.; McCollom, T.M. Compositional controls on hydrogen generation during serpentinization of ultramafic rocks. Lithos 2013, 178, 55–69. [Google Scholar] [CrossRef]
- Cannat, M.; Rommevaux-Jestin, C.; Fujimoto, H. Melt supply variations to a magma-poor ultra-slow spreading ridge (Southwest Indian Ridge 61° to 69° E): Melt supply variations. Geochem. Geophys. Geosyst. 2003, 4. [Google Scholar] [CrossRef]
- Lévy, D.; Callot, J.P.; Moretti, I.; Duttine, M.; Dubreuil, B.; de Parseval, P.; Boudouma, O. Successive phases of serpentinization recorded in the ophiolite of Sivas (Turkey), from oceanic crust accretion to post-obduction alteration. BSGF 2022, 193, 12. [Google Scholar] [CrossRef]
- Zgonnik, V.; Beaumont, V.; Larin, N.; Pillot, D.; Deville, E. Diffused flow of molecular hydrogen through the Western Hajar mountains, Northern Oman. Arab. J. Geosci. 2019, 12, 71. [Google Scholar] [CrossRef]
- Deville, E.; Prinzhofer, A. The origin of N2-H2-CH4-rich natural gas seepages in ophiolitic context: A major and noble gases study of fluid seepages in New Caledonia. Chem. Geol. 2016, 440, 139–147. [Google Scholar] [CrossRef]
- Combaudon, V.; Moretti, I.; Kleine, B.I.; Stefánsson, A. Natural hydrogen emissions in Iceland and comparison with the Mid-Atlantic Ridge. Int. J. Hydrogen Energy 2022, 47, 10217–10227. [Google Scholar] [CrossRef]
- Pasquet, G.; Hassan, R.H.; Sissmann, O.; Varet, J.; Moretti, I. An Attempt to Study Natural H2 Resources across an Oceanic Ridge Penetrating a Continent: The Asal–Ghoubbet Rift (Republic of Djibouti). Geosciences 2021, 12, 16. [Google Scholar] [CrossRef]
- Geymond, U.; Briolet, T.; Combaudon, V.; Sissmann, O.; Martinez, I.; Duttine, M.; Moretti, I. Reassessing the role of magnetite during natural hydrogen generation. Front. Earth Sci. 2023, 11, 1169356. [Google Scholar] [CrossRef]
- Larin, N.; Zgonnik, V.; Rodina, S.; Deville, E.; Prinzhofer, A.; Larin, V.N. Natural Molecular Hydrogen Seepage Associated with Surficial, Rounded Depressions on the European Craton in Russia. Nat. Resour. Res. 2015, 24, 369–383. [Google Scholar] [CrossRef]
- Zgonnik, V.; Beaumont, V.; Deville, E.; Larin, N.; Pillot, D.; Farrell, K.M. Evidence for natural molecular hydrogen seepage associated with Carolina bays (surficial, ovoid depressions on the Atlantic Coastal Plain, Province of the USA). Prog. Earth Planet. Sci. 2015, 2, 31. [Google Scholar] [CrossRef]
- Moretti, I.; Brouilly, E.; Loiseau, K.; Prinzhofer, A.; Deville, E. Hydrogen Emanations in Intracratonic Areas: New Guide Lines for Early Exploration Basin Screening. Geosciences 2021, 11, 145. [Google Scholar] [CrossRef]
- Moretti, I.; Geymond, U.; Pasquet, G.; Aimar, L.; Rabaute, A. Natural hydrogen emanations in Namibia: Field acquisition and vegetation indexes from multispectral satellite image analysis. Int. J. Hydrogen Energy 2022, 47, 35588–35607. [Google Scholar] [CrossRef]
- Toussaint, J.F.; Restrepo, J.J. The geology of Colombia. Chapter 7: Tectonostratigraphic terranes in colombia: An update second part: Oceanic terranes. In The Geology of Colombia, Volume 2 Mesozoic; Gómez, J., Pinilla–Pachon, A.O., Eds.; Servicio Geológico Colombiano: Bogotá, Colombia, 2020. [Google Scholar] [CrossRef]
- Weber, M.; Cardona, A.; Paniagua, F.; Cordani, U.; Sepúlveda, L.; Wilson, R. The Cabo de la Vela Mafic-Ultramafic Complex, Northeastern Colombian Caribbean region: A record of multistage evolution of a Late Cretaceous intra-oceanic arc. Geol. Soc. London, Spéc. Publ. 2009, 328, 549–568. [Google Scholar] [CrossRef]
- Nivia, A. Geología y Geocronología del Batolito de buga y el Macizo Ofiolítico de Ginebra, Colombia. 2017. Conference: XVI Congreso Colombiano de Geología at: Santa Marta—Magdalena (Colombia). Available online: https://www.researchgate.net/publication/319631780 (accessed on 20 September 2023).
- Moreno, M.; Pardo, A. Stratigraphical and sedimentological constraints on western colombia: Implications on the evolution of the Caribbean plate. Am. Assoc. Pet. Geol. Mem. 2003, 79, 891–924. [Google Scholar]
- McCourt, W.J.; Aspden, J.A.; Brook, M. New geological and geochronological data from the colombian andes: Continental growth by multiple accretion. J. Geol. Soc. Lond. 1984, 141, 831–845. [Google Scholar] [CrossRef]
- Nivia, A. Mapa geológico departamento del Valle del Cauca escala 1:250000, memoria explicativa 2001. 2001. Available online: https://www.researchgate.net/publication/275971711_Mapa_Geologico_Departamento_del_Valle_del_Cauca_Escala_1250000_Memoria_Explicativa_2001 (accessed on 20 September 2023).
- Ossa, C.; Concha, A.H. Petrogénesis de las rocas del macizo ofiolítico de Ginebra entre las veredas la honda (Ginebra) y el diamante (Buga) en el departamento del Valle del Cauca. 2007. Available online: https://dialnet.unirioja.es/servlet/revista?codigo=19929 (accessed on 20 September 2023).
- Tapias, J.G.; Ramírez, N.E.M.; Gutiérrez, F.A.A.; Hernández, J.A.C. Catálogo de dataciones radiométricas de colombia en arcgis y google earth. 2015. Servicio Geológico Colombiano, Publicaciones Geológicas Especiales. Available online: https://www2.sgc.gov.co/MGC/Documents/Compilando/04_Gomez-et-al-2015_Catalogo-de-dataciones-radiometricas.pdf (accessed on 20 September 2023).
- Palomino, M. Caracterización petrográfica del Batolito de Buga en la Cordillera Central, Valle del Cauca. 2017. Available online: https://repositorio.uniandes.edu.co/server/api/core/bitstreams/3d70fc54-a922-4b8a-baa4-14d11eae79bf/content (accessed on 20 September 2023).
- McCourt, W.J.; Verdugo, G. Mapa Geológico de Colombia, Plancha 300, Cali; Bogotá Ingeominas: Ingeominas, Bogotá, 1985. [Google Scholar]
- Barbosa, G. República de Colombia, Ministerio de Minas y Energía. Instituto de investigación e información geocientífica, minero-ambiental y nuclear ingeominas. Memorias mapa geológico del departamento del Cauca. 2003. Available online: https://recordcenter.sgc.gov.co/B4/13010040019624/documento/pdf/0101196241101000.pdf (accessed on 20 September 2023).
- ANH. Available online: https://www.anh.gov.co/en/hidrocarburos/informacion-geologica-y-geofisica/estudios-integrados-y-modelamientos/ (accessed on 20 September 2023).
- Prinzhofer, A.; Moretti, I.; Françolin, J.; Pacheco, C.; D’Agostino, A.; Werly, J.; Rupin, F. Natural hydrogen continuous emission from sedimentary basins: The example of a Brazilian H2-emitting structure. Int. J. Hydrogen Energy 2019, 44, 5676–5685. [Google Scholar] [CrossRef]
- Hassan, M.A.; Yang, M.; Rasheed, A.; Yang, G.; Reynolds, M.; Xia, X.; Xiao, Y.; He, Z. A rapid monitoring of NDVI across the wheat growth cycle for grain yield prediction using a multi-spectral UAV platform. Plant Sci. 2019, 282, 95–103. [Google Scholar] [CrossRef]
- Kaufman, Y.J.; Tanre, D. Atmospherically resistant vegetation index (ARVI) for EOS-MODIS. IEEE Trans. Geosci. Remote Sens. 1992, 30, 261–270. [Google Scholar] [CrossRef]
- Posada-Asprilla, W.; Medina-Sierra, M.; Cerón-Muñoz, M. Estimación de la calidad y cantidad de pasto kikuyo (Cenchrus clandestinum (Hochst. ex Chiov.) Morrone) usando imágenes multiespectrales. Rev. UDCA Actual. Divulg. Científica 2019, 22. [Google Scholar] [CrossRef]
- Ávila Vélez, E.F. Propuesta metodológica para cuantificar áreas afectadas por incendios forestales utilizando imágenes satelitales sentinel-2. caso de studio páramo del almorzadero, Colombia. 2019. Available online: https://www.academia.edu/44443374/Propuesta_metodol%C3%B3gica_para_cuantificar_%C3%A1reas_afectadas_por_incendios_forestales_utilizando_im%C3%A1genes_satelitales_Sentinel_2_Caso_de_estudio_p%C3%A1ramo_del_Almorzadero_Colombia (accessed on 20 September 2023).
- Becker, T.; Nelsen, T.S.; Leinfelder-Miles, M.; Lundy, M.E. Differentiating between nitrogen and water deficiency in irrigated maize using a uav-based multi-spectral camera. Agronomy 2020, 10, 1671. [Google Scholar] [CrossRef]
- Boegh, E.; Soegaard, H.; Broge, N.; Hasager, C.; Jensen, N.; Schelde, K.; Thomsen, A. Airborne multispectral data for quantifying leaf area index, nitrogen concentration, and photosynthetic efficiency in agriculture. Remote Sens. Environ. 2002, 81, 179–193. [Google Scholar] [CrossRef]
- Frery, E.; Langhi, L.; Maison, M.; Moretti, I. Natural hydrogen seeps identified in the North Perth Basin, Western Australia. Int. J. Hydrogen Energy 2021, 46, 31158–31173. [Google Scholar] [CrossRef]
- McMahon, C.J.; Roberts, J.J.; Johnson, G.; Edlmann, K.; Flude, S.; Shipton, Z.K. Natural hydrogen seeps as analogues to inform monitoring of engineered geological hydrogen storage. In Enabling Secure Subsurface Storage in Future Energy Systems; Miocic, J.M., Heinemann, N., Alcalde, J., Edlmann, K., Schultz, R.A., Eds.; Special Publications, 528; Geological Society: London, UK, 2022. [Google Scholar] [CrossRef]
- Frery, E.; Langhi, L.; Markov, J. Natural hydrogen exploration in Australia—State of knowledge and presentation of a case study. APPEA J. 2022, 62, 223–234. [Google Scholar] [CrossRef]
- Murray, J.; Clément, A.; Fritz, B.; Schmittbuhl, J.; Bordmann, V.; Fleury, J.M. Abiotic hydrogen generation from biotite-rich granite: A case study of the Soultz-sous-Forêts geothermal site. France. Appl. Geochem. 2020, 119, 104631. [Google Scholar] [CrossRef]
- Lefeuvre, N.; Truche, L.; Donzé, F.V.; Ducoux, M.; Barré, G.; Fakoury, R.A.; Calassou, S.; Gaucher, E.C. Native H2 exploration in the western Pyrenean foothills. G-Cubed 2021, 22, e2021GC009917. [Google Scholar] [CrossRef]
- Caballero, V.M.; Rodríguez, G.; Naranjo, J.F.; Mora, A.; De La Parra, F. From facies analysis, stratigraphic surfaces, and depositional sequences to stratigraphic traps in the Eocene—Oligocene record of the southern Llanos and northern Magdalena Basin. In The Geology of Colombia, Volume 3 Paleogene—Neogene; Gómez, J., Mateus–Zabala, D., Eds.; Publicaciones Geológicas Especiales 37; Servicio Geológico Colombiano: Bogotá, Colombia, 2020; 48p. [Google Scholar] [CrossRef]
- Maiga, O.; Deville, E.; Laval, J.; Prinzhofer, A.; Diallo, A.B. Trapping processes of large volumes of natural hydrogen in the subsurface: The emblematic case of the Bourakebougou H2 field in Mali. Int. J. Hydrogen Energy 2023. [Google Scholar] [CrossRef]
Figure 1.
Geological terranes of Colombia and main domains, modified from [12].
Figure 1.
Geological terranes of Colombia and main domains, modified from [12].

Figure 3.
Map of the Cauca-Patia Valley studied area with the locations of the cross-sections. The red dots are the locations of soil gas measurements, the orange points are the location of the vegetation anomalies where soil gas measurement have not been performed. Initial data from map 300 from the Geological Service of Colombia. Projection WGS84.

Figure 4.
Four of the vegetation anomalies in the Cauca-Patia Basin (a–c) are located in sugar cane field; (d) is the ST3, the circle is full of bamboo.
Figure 4.
Four of the vegetation anomalies in the Cauca-Patia Basin (a–c) are located in sugar cane field; (d) is the ST3, the circle is full of bamboo.

Figure 5.
Eight Spectral Filters in the Cauca-Paita Valley highlighting the vegetation anomalies. See text and Table 1 for acronym definitions. Yellow arrows indicate the North.
Figure 5.
Eight Spectral Filters in the Cauca-Paita Valley highlighting the vegetation anomalies. See text and Table 1 for acronym definitions. Yellow arrows indicate the North.

Figure 6.
Schematic cross-sections A-A’ and B-B’ with the measurement points. The H2-ST4 to 6 are located south of section B-B’ near point 8. The hydrogen (GA) concentration surpasses 1000 ppm at the H2_ST9 on the eastern border of a laterite outcrop. Due to the lack of subsurface data, the fault dip evolution versus depth is unknown.

Figure 7.
Correlation between various gases based on Table 2 data. The group “Valley” corresponds to the data within the vegetation anomalies zones and the group “Relief” represents the data on the two cross-sections.
Figure 7.
Correlation between various gases based on Table 2 data. The group “Valley” corresponds to the data within the vegetation anomalies zones and the group “Relief” represents the data on the two cross-sections.

Figure 8.
Schematic model of the Cauca-Patia Valley H2 system. Below the dashed line, everything is speculative. The generation zones are likely below the two cordilleras and lateral migration, especially through fault zones, results in H2 presence in the valley.
Figure 8.
Schematic model of the Cauca-Patia Valley H2 system. Below the dashed line, everything is speculative. The generation zones are likely below the two cordilleras and lateral migration, especially through fault zones, results in H2 presence in the valley.


Table 1.
Vegetation indexes: spectral band used and calculation.
| Vegetation Index | Spectral Bands | Calculation | Range of Values | Interpretation |
|---|---|---|---|---|
| NDVI (Normalized Difference Vegetation Index) | NIR and R | (NIR − R)/(NIR + R) | −1 to 1 | High values indicate the presence of vegetation |
| SAVI (Soil-Adjusted Vegetation Index) | NIR and R | (NIR − R)/(NIR + R + L) × (1 + L) | −1 to 1 | High values indicate the presence of vegetation, even on soils with high reflectance |
| NDWI (Normalized Difference Water Index) | NIR and SWIR | (NIR − SWIR)/(NIR + SWIR) | 0 to 1 | High values indicate the presence of water |
| GLI (Green Leaf Index) | B, G, and R | (NIR + R + B + G)/4 | 0 to 1 | High values indicate the presence of chlorophyll |
| EVI (Enhanced Vegetation Index) | NIR, R, B, and G | 2.5 × (NIR − R)/(NIR + 6 × R − 7.5 × B + 1) | −1 to 1 | High values indicate the presence of leaf biomass |
| ARVI (Atmospherically Resistant Vegetation Index) | NIR and R | (NIR − R)/(NIR + R) − (NIR − SWIR)/(NIR + SWIR) | −1 to 1 | High values indicate the presence of vegetation, even under adverse atmospheric conditions |
| GNDVI (Greenness Normalized Difference Vegetation Index) | G and R | (G − R)/(G + R) | −1 to 1 | High values indicate the presence of vegetation, even under adverse atmospheric conditions |
| NBRI (Near-Infrared and Shortwave Infrared Burned Area Index) | NIR and SWIR | (NIR − SWIR)/(NIR + SWIR) | 0 to 1 | High values indicate the presence of burned areas |
Table 2.
Soil gas measurement, BIOGAS 5000 (GA).
| Station | Sample | Date 2022 | Hour | Depth (cm) | O2 (%) | CH4 (%) | CO2 (%) | H2 ppm | CO ppm | H2S ppm | BAL (%) |
|---|---|---|---|---|---|---|---|---|---|---|---|
| H2_ST1 scd | 1 | 12/10 | 10:10 | 40 | 20.2 | 0 | 0.1 | 1 | 1 | 1 | 79.7 |
| 2 | 12/10 | 10:22 | 40 | 19.9 | 0 | 0.3 | 22 | 1 | 1 | 79.9 | |
| 3 | 12/10 | 10:25 | 80 | 19.7 | 0 | 0.4 | 14 | 1 | 2 | 80 | |
| 4 | 12/10 | 10:35 | 80 | 8.5 | 0 | 15.4 | 18 | 3 | 2 | 76 | |
| 5 | 12/10 | 10:36 | 80 | 0.2 | 0 | 25.6 | 33 | 1 | 2 | 74.2 | |
| 6 | 12/10 | 10:47 | 80 | 18.6 | 0 | 3.4 | 137 | 17 | 2 | 79.8 | |
| 7 | 12/10 | 10:51 | 80 | 19.4 | 0 | 1.3 | 320 | 8 | 7 | 79.6 | |
| 8 | 12/10 | 10:56 | 80 | 17 | 0 | 12.8 | 289 | 7 | 2 | 79.3 | |
| 9 | 12/10 | 11:00 | 60 | 19.9 | 0 | 0.7 | 54 | 2 | 1 | 79.7 | |
| 10 | 12/10 | 11:07 | 80 | 19 | 0 | 8.3 | 255 | 5 | 2 | 79.3 | |
| 11 | 12/10 | 11:14 | 80 | 19.9 | 0 | 1.8 | 40 | 3 | 1 | 79.4 | |
| 12 | 12/10 | 11:18 | 75 | 7 | 0 | 15.7 | 140 | 8 | 2 | 78 | |
| 13 | 12/10 | 11:23 | 80 | 19 | 0 | 3.8 | 300 | 11 | 2 | 79.2 | |
| 14 | 12/10 | 11:27 | 80 | 19 | 0 | 2.5 | 112 | 4 | 1 | 78.9 | |
| 15 | 12/10 | 11:31 | 30 | 20.5 | 0 | 0.4 | 40 | 11 | 1 | 79.2 | |
| H2_ST2 scd | 1 | 12/10 | 16:11 | 40 | 21.1 | 0 | 0.4 | 29 | 8 | 0 | 78.5 |
| 2 | 12/10 | 16:17 | 50 | 20.6 | 0 | 6 | 250 | 4 | 1 | 78.4 | |
| 3 | 12/10 | 16:19 | 40 | 21.2 | 0 | 0.2 | 30 | 1 | 0 | 78.6 | |
| 4 | 12/10 | 16:27 | 30 | 21.2 | 0 | 1.1 | 14 | 3 | 1 | 78.6 | |
| 5 | 12/10 | 16:30 | 30 | 21.1 | 0 | 0.1 | 8 | 2 | 1 | 78.7 | |
| 6 | 12/10 | 16:34 | 30 | 21.1 | 0 | 0,2 | 7 | 1 | 1 | 78.8 | |
| 7 | 12/10 | 16:38 | 25 | 20.6 | 0 | 1.1 | 2 | 1 | 1 | 78.4 | |
| H2_ST3 scd | 1 | 12/10 | 13:52 | 80 | 20.7 | 0 | 0.9 | 19 | 5 | 0 | 78.4 |
| 2 | 12/10 | 13:56 | 80 | 20.2 | 0 | 0.9 | 24 | 15 | 1 | 78.6 | |
| 3 | 12/10 | 14:00 | 50 | 20.5 | 0 | 1 | 13 | 1 | 0 | 78.5 | |
| 4 | 12/10 | 14:03 | 80 | 20.5 | 0 | 1 | 10 | 1 | 0 | 78.5 | |
| 5 | 12/10 | 14:06 | 40 | 20.7 | 0 | 0.7 | 11 | 1 | 0 | 78.6 | |
| 6 | 12/10 | 14:09 | 50 | 20.1 | 0 | 1.2 | 60 | 17 | 1 | 78.7 | |
| 7 | 12/10 | 14:13 | 70 | 20 | 0 | 1.4 | 7 | 3 | 1 | 78.6 | |
| 8 | 12/10 | 14:16 | 80 | 19.6 | 0 | 2 | 9 | 4 | 1 | 78.4 | |
| 9 | 12/10 | 14:19 | 80 | 20.5 | 0 | 1.7 | 64 | 7 | 1 | 78.6 | |
| 10 | 12/10 | 14:23 | 80 | 20.3 | 0 | 1 | 10 | 1 | 1 | 78.6 | |
| H2_ST4 | 1 | 13/10 | 9:30 | 40 | 16.2 | 0.1 | 3.2 | 220 | 10 | 1 | 80.5 |
| 2 | 13/10 | 9:40 | 40 | 19.4 | 1 | 1.3 | 239 | 4 | 1 | 79.3 | |
| 3 | 13/10 | 9:41 | 40 | 19 | 0 | 1.2 | 22 | 2 | 1 | 79.8 | |
| 4 | 13/10 | 9:48 | 20 | 18.5 | 0 | 1.8 | 42 | 6 | 1 | 79.6 | |
| 5 | 13/10 | 9:55 | 10 | 20.6 | 0 | 0.2 | 7 | 2 | 1 | 79.3 | |
| 6 | 13/10 | 10:00 | 15 | 20.3 | 0 | 0.2 | 22 | 8 | 1 | 79.4 | |
| 7 | 13/10 | 10:04 | 15 | 20 | 0 | 0.8 | 29 | 16 | 1 | 79.3 | |
| 8 | 13/10 | 10:09 | 80 | 18.6 | 0 | 2.2 | 18 | 7 | 1 | 79.3 | |
| 9 | 13/10 | 10:16 | 25 | 20 | 0 | 0.7 | 22 | 5 | 1 | 79.3 | |
| H2_ST5 | 1 | 13/10 | 10:54 | 40 | 20.3 | 0 | 0.6 | 15 | 3 | 1 | 79.1 |
| 2 | 13/10 | 10:59 | 40 | 18.7 | 0 | 2.6 | 10 | 3 | 1 | 78.8 | |
| H2_ST6 | 1 | 13/10 | 11:12 | 40 | 20.6 | 0 | 0.5 | 29 | 5 | 1 | 79 |
| 2 | 13/10 | 11:16 | 25 | 20.7 | 0 | 0.2 | 12 | 1 | 1 | 79.1 | |
| 3 | 13/10 | 11:19 | 30 | 20.5 | 0 | 0.8 | 35 | 13 | 1 | 79 | |
| H2_ST7 | 1 | 13/10 | 11:27 | 70 | 19.3 | 0 | 2.2 | 88 | 22 | 1 | 78.9 |
| 2 | 13/10 | 11:30 | 50 | 20.6 | 0 | 0.7 | 142 | 10 | 1 | 79 | |
| H2_ST8 | 1 | 13/10 | 11:42 | 25 | 17.6 | 0 | 3.6 | 72 | 4 | 1 | 78.8 |
| 2 | 13/10 | 11:44 | 25 | 17.5 | 0 | 4 | 87 | 16 | 1 | 78.8 | |
| 3 | 13/10 | 11:47 | 40 | 19.8 | 0 | 1.7 | 90 | 7 | 1 | 78.9 | |
| 4 | 13/10 | 11:51 | 45 | 17.8 | 0 | 3.1 | 52 | 4 | 1 | 78.8 | |
| H2_ST9 | 1 | 13/10 | 13:21 | 20 | 21.1 | 0 | 0.1 | 20 | 2 | 0 | 78.9 |
| 2 | 13/10 | 13:24 | 20 | 20.9 | 0 | 0.5 | 330 | 9 | 1 | 78.8 | |
| 3 | 13/10 | 13:28 | 30 | 20.8 | 0 | 0.5 | >1000 | 11 | 2 | 78.9 | |
| 4 | 13/10 | 13:36 | 40 | 20.6 | 0 | 0.7 | 22 | 3 | 1 | 78.8 | |
| H2_ST10 | 1 | 13/10 | 13:59 | 25 | 21.1 | 0 | 0.1 | 50 | 15 | 1 | 78.8 |
| 2 | 13/10 | 14:05 | 30 | 19.2 | 0 | 1.6 | 17 | 4 | 1 | 79.2 | |
| H2_ST11 | 1 | 13/10 | 14:26 | 30 | 20 | 0 | 1.4 | 72 | 8 | 1 | 78.8 |
| 2 | 13/10 | 14:49 | 20 | 21.1 | 0 | 0.3 | 86 | 2 | 1 | 78 | |
| 3 | 13/10 | 14:59 | 35 | 21.5 | 0 | 0 | 110 | 2 | 0 | 78.5 | |
| H2_ST12 | 1 | 14/10 | 9:08 | 40 | 20.8 | 0.1 | 0.3 | 47 | 13 | 1 | 79 |
| 2 | 14/10 | 9:12 | 30 | 20.2 | 0.1 | 0.9 | 38 | 13 | 1 | 79 | |
| 3 | 14/10 | 9:18 | 40 | 20.7 | 0 | 0.3 | 33 | 2 | 1 | 79.1 | |
| 4 | 14/10 | 9:20 | 35 | 20.3 | 0 | 0.5 | 13 | 9 | 1 | 79.2 | |
| H2_ST13 | 1 | 14/10 | 9:36 | 30 | 18.7 | 0.1 | 2.6 | 4 | 1 | 1 | 78.8 |
| 2 | 14/10 | 9:39 | 35 | 20.1 | 0 | 0.8 | 17 | 7 | 1 | 79 | |
| H2_ST14 | 1 | 14/10 | 9:47 | 15 | 20.5 | 0 | 0.3 | 10 | 1 | 1 | 79.2 |
| 2 | 14/10 | 9:52 | 20 | 20.6 | 0 | 0.4 | 4 | 2 | 1 | 79.1 | |
| 3 | 14/10 | 9:54 | 30 | 19.3 | 0 | 1.1 | 4 | 1 | 1 | 79.6 | |
| H2_ST15 | 1 | 14/10 | 10:30 | 35 | 16 | 0.1 | 3.2 | 77 | 10 | 1 | 81.9 |
| 2 | 14/10 | 10:35 | 30 | 16.6 | 0 | 2.8 | 58 | 4 | 1 | 80.4 | |
| 3 | 14/10 | 10:39 | 30 | 18.6 | 0 | 1.8 | 38 | 5 | 1 | 79.5 | |
| 4 | 14/10 | 10:39 | 30 | 12.6 | 0 | 6.9 | 74 | 5 | 1 | 80.4 | |
| 5 | 14/10 | 10:41 | 45 | 8 | 0 | 13.3 | 17 | 3 | 1 | 79.4 | |
| 6 | 14/10 | 10:49 | 35 | 20.1 | 0 | 1 | 60 | 7 | 1 | 78.9 | |
| 7 | 14/10 | 10:52 | 40 | 19.7 | 0 | 1.2 | 8 | 2 | 1 | 79.1 | |
| H2_ST16 | 1 | 14/10 | 12:19 | 40 | 20.3 | 0.1 | 0.7 | 65 | 7 | 1 | 79 |
| 2 | 14/10 | 12:22 | 80 | 11.2 | 0 | 9 | 6 | 0 | 1 | 79.8 | |
| 3 | 14/10 | 12:25 | 70 | 20 | 0 | 0.7 | 33 | 3 | 1 | 79.1 | |
| 4 | 14/10 | 12:28 | 50 | 20.4 | 0 | 0.3 | 31 | 2 | 1 | 79.2 |
Disclaimer/Publisher’s Note: The statements, opinions and data contained in all publications are solely those of the individual author(s) and contributor(s) and not of MDPI and/or the editor(s). MDPI and/or the editor(s) disclaim responsibility for any injury to people or property resulting from any ideas, methods, instructions or products referred to in the content. |
© 2023 by the authors. Licensee MDPI, Basel, Switzerland. This article is an open access article distributed under the terms and conditions of the Creative Commons Attribution (CC BY) license (https://creativecommons.org/licenses/by/4.0/).
Share and Cite
MDPI and ACS Style
Carrillo Ramirez, A.; Gonzalez Penagos, F.; Rodriguez, G.; Moretti, I. Natural H2 Emissions in Colombian Ophiolites: First Findings. Geosciences 2023, 13, 358. https://doi.org/10.3390/geosciences13120358
AMA Style
Carrillo Ramirez A, Gonzalez Penagos F, Rodriguez G, Moretti I. Natural H2 Emissions in Colombian Ophiolites: First Findings. Geosciences. 2023; 13(12):358. https://doi.org/10.3390/geosciences13120358
Chicago/Turabian StyleCarrillo Ramirez, Alejandra, Felipe Gonzalez Penagos, German Rodriguez, and Isabelle Moretti. 2023. "Natural H2 Emissions in Colombian Ophiolites: First Findings" Geosciences 13, no. 12: 358. https://doi.org/10.3390/geosciences13120358
Note that from the first issue of 2016, this journal uses article numbers instead of page numbers. See further details here.