Abstract
Discontinuum Bonded Block Modeling (BBM) represents a potential tool for support design, as these models can reproduce both the rock fracturing process and the influence of reinforcement on unsupported ground. Despite their strengths, discontinuum models are seldom used for mining design due to their computationally intensive nature. This study is an application of an integrated 3D continuum–2D discontinuum approach, in which the mine-wide stress distribution process is modeled using a continuum software, and the local deformation behavior in response to a strain path from the continuum model is simulated with a 2D discontinuum software. In June 2017, two multi-point borehole extensometers were installed in a longwall chain pillar to record ground displacements as a function of the longwall face position. The data from one of the extensometers were employed to calibrate a panel-scale FLAC3D model. The boundary conditions along the pillar slice containing the extensometer were extracted from the FLAC3D model and applied to a 2D BBM, and the input parameters were modified to match the extensometer data. The calibrated BBM was able to reproduce the unsupported rib deformation and depth of the fracturing well. Subsequently, a few support schemes were tested to demonstrate how the incorporation of support might affect rib deformation.
1. Introduction
Scientific research to improve the performance of coal pillar ribs, particularly through the use of ground support, has been ongoing for several decades [1,2,3,4,5,6,7]. More recent endeavors by National Institute of Occupational Safety and Health (NIOSH) researchers have focused on minimizing rib hazard using numerical and/or empirical approaches [8,9,10,11] and novel techniques like seismic monitoring [12] and photogrammetry [13]. Despite these advances in our knowledge of pillar damage mechanisms and the rock–support interaction, rib-failure-related fatalities in underground coal mines have continued to occur. For example, among incidents classified as “fall of face, rib or pillar”, the average fatality rate was 1.3 per year for the 1996–2012 period, and about 40–50 injuries occurred every year from 2013 to 2017 [14]. These ongoing issues reflect the fact that there is a gap in our knowledge base that must be bridged before robust support guidelines can be formulated.
Coal rib control techniques in the US can be broadly sub-divided as follows [9]: (1) installing intrinsic support in the form of bolts with/without mesh and (2) installing external rib support systems in the form of mesh (steel or synthetic), props, pillar banding, etc. As indicated by Mohamed et al. [9], the design of both intrinsic and external support systems is based on local practices and site-specific experience. Some rough guidelines for rib support design are available for Australian coal mines [5], but no design parameters for support systems have been established for US coal mines [9]. Other methods of stabilizing coal mine entries through the use of artificial waste-rock-filled pillars (e.g., [15]) exist but are not the focus of the current study.
With recent advancements in numerical modeling methods and computational power, complex ground control problems are increasingly being studied using numerical approaches. Continuum models, which represent the ground as an equivalent continuous material and whose behavior is governed by constitutive relationships between stress and strain, are popular tools for analyzing large-scale damage processes [8,11]. For instance, Shabanimashcool and Li [16,17] used a caving algorithm in FLAC3D to replicate observed roof bolt loads and pillar loads due to longwall face advance at the Svea Nord coal mine in Svalbard, Norway. Zhang et al. [18] utilized FLAC3D to study the stress changes in longwall pillars with various sizes. Basarir et al. [19] studied the stress changes around entries due to the approach of the longwall face for a Turkish lignite mine. Esterhuizen et al. [20] used FLAC3D to simulate the abutment stresses in chain pillars for three different case studies. In all of these studies, the coal pillars were modeled using either the strain-softening Mohr–Coulomb constitutive model or the softening Hoek–Brown model. A recently developed rock yield criterion that is based on the fundamental fracturing process of brittle rocks, called the progressive S-shaped yield criterion, has alternatively been used to model rock pillars [21]. Subsequently, the criterion was applied to a coal mine case study [22] and was shown to reproduce the yield and deformation measured at the site well.
Despite their widespread application, a major limitation of continuum models is that they tend to significantly underestimate the reinforcement effect of installed support on ground behavior [23,24,25,26]. The issue is attributed to the enforcement of continuous strain distribution (or the inability of elements to detach) within these models. As an alternative, Sinha and Walton [26] tested the discontinuum bonded block model (BBM) approach; in this approach, a material space is represented by polygonal blocks, and the parameters of the blocks and contacts (interfaces between blocks) control the macroscopic behaviors of the models. It was found that BBMs can reproduce realistic behavioral differences between unsupported and supported ground conditions that are consistent with previous empirical observations.
Modeling coal rib damage and the influence of rock support in the BBM has gained popularity in recent years [27,28,29,30]. For example, Sunkpal et al. [29] investigated the effects of mining depth, mining height, and supports on coal mine rib stability, while Sunkpal et al. [30] proposed a probabilistic approach to quantify rib stability and support requirements by combining the BBM and Random Set Theory. Previously, the authors of [27] employed the BBM approach to simulate the observed rib damage in a longwall chain pillar in the West Cliff Mine (Australia). In that study, the blocks were inelastic (i.e., blocks can yield) and they were elongated along the pillar height in order to allow for fractures to form preferentially along the cleat direction. After being calibrated to the displacement and stress data from one site in the mine, the support in the model was modified to match the support pattern at an adjacent site, and pillar displacements similar to those recorded at this adjacent site were obtained. It was concluded that the elongated BBM approach is not only capable of reproducing observed pillar damage phenomena, but also the ground–support interaction mechanism, and it therefore has the potential to be used as a support design tool.
Discontinuum models are computationally expensive, and it is typically impractical to develop a 3D entry-scale model with a reasonable runtime, let alone a panel-scale model. Consequently, most prior BBM studies were restricted to 2D or 2.5D (e.g., 1–2 m thick models) [31,32,33,34,35] with simplified boundary conditions (e.g., purely vertical loading). In reality, underground structures like coal pillars are subjected to complex load paths that consist of both vertical and shear components [36,37] that are heterogeneously distributed across their cross sections. To simulate smaller-scale damage processes and larger-scale stress redistribution processes, the method of coupling continuum and discontinuum models has been considered in the literature [38,39,40,41]. As an alternative to full coupling, Sinha and Walton [37] recently proposed an integrated 3D continuum–2D discontinuum modeling approach, in which the mine-wide 3D stress distribution process was simulated using a continuum model (e.g., FLAC3D), and the local deformational behavior of a structure of interest subjected to the strain path obtained from the FLAC3D model was simulated using a 2D BBM. There are three major advantages of this approach: (1) the restriction of the discontinuum modeling to 2D ensures that individual model run-times remain low enough for practical use (e.g., on the order of a couple of days), (2) the essential influences of the complex load path that the structure under consideration is subjected to are accounted for, and (3) the inability of continuum models to replicate the effect of support on ground behavior is overcome as the local stability and support design analysis is conducted using the 2D BBM. Of course, the calibration of the FLAC3D model and the BBM against field-measured attributes is necessary in order to ensure that any predictions of the effect of support on ground behavior can be considered reasonable approximations of reality.
The potential application of the integrated modeling approach is further demonstrated in this study by simulating the damage evolution observed in a longwall chain pillar in a Western US mine (referred to as Mine A). In June 2017, two multipoint extensometers were installed in a chain pillar (one from the entry and one from the cross-cut) and the deformations were subsequently monitored as the longwall face approached and crossed the instrumented location. Extensometers were specifically chosen over other monitoring approaches/equipment, like stress cells (e.g., [42]), tomography (e.g., [43]), and acoustic emissions (e.g., [44]), because extensometers can directly measure ground deformations that are comparable with the model results and are also low-cost and relatively simple to install. Based on a borehole log from the site, a FLAC3D model was developed and calibrated to match the extensometer measurements. Subsequently, a slice of the coal pillar containing the extensometer in the cross-cut was modeled using an inelastic BBM with boundary conditions derived from the calibrated FLAC3D model. Ultimately, the simulated response of the pillar to the addition of support was tested, as might be carried out in the context of a practical design analysis.
2. Site Description, Monitoring, and Panel-Scale FLAC3D Model Setup
2.1. Description of the Site and Instrumentation
The longwall mine under consideration is located in Montana and extracts coal from the Mammoth seam. The surface topography is mountainous, with the depth of operation varying between 91 m and 250 m. The authors are not aware of any regional structures in the mining area. Within a panel, mining progresses with the development of three entries (or 2 chain pillars), followed by the retreat of the longwall face using a shearer and powered roof supports at the face. Additional supports are placed in the tailgate entries to maintain their structural integrity [45].
Two six-anchor multipoint extensometers were installed horizontally at the mid-height of one of the chain pillars when the longwall face was operating in the next panel (Figure 1). The instrumented panel was ~360 m wide and ~6500 m long. At the instrumented site, the overburden depth was ~250 m, the height of the coal seam was ~3.5 m, the entry and cross-cut widths were ~5.5 m, and the pillars dimensions were 62 m × 22 m. No intrinsic rib supports were used in any part of this panel.
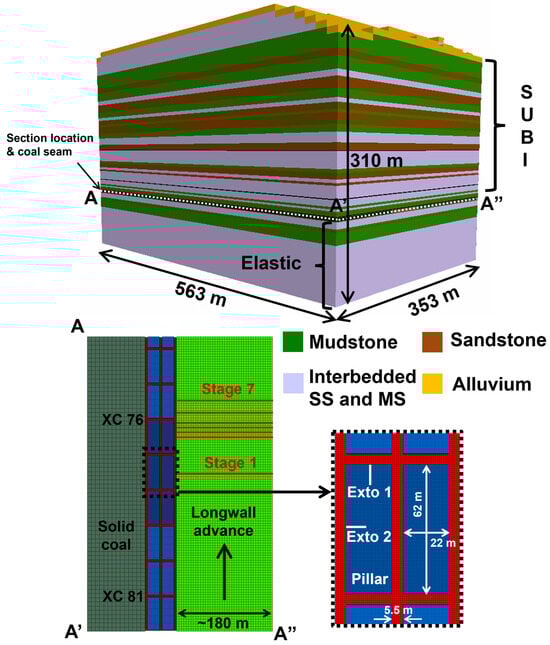
Figure 1.
FLAC3D model setup showing the different lithologies, dimensions, extensometer locations, and model stages. The location of the mined coal seam is indicated by white dotted lines. SS = sandstone, MS = mudstone, Exto = extensometer.
2.2. FLAC3D Model Setup
Based on a borehole log located close to the instrumented location (within 50 m) and a surface topography map, a FLAC3D model was developed that extended a half panel into the coal to be extracted, 111 m in the opposite direction (into solid unmined coal), and 3–4 chain pillars on either side of the instrumented pillar (Figure 1). A distance of 111 m was determined to be sufficient for the stresses to return to their in situ levels based on the empirical load transfer distance (LTD) equation of Peng and Chiang [46]:
The dimensions were chosen to permit the use of a finer mesh size in the pillar under consideration while still maintaining a model runtime of less than one week to allow for the iterative model calibration to be completed. The zones were ultimately graded away from the instrumented pillar to reduce the total number of model zones (Figure 1). The overall dimensions of the model are shown in Figure 1.
For the site under consideration, reliable rock mechanics data such as in situ stress measurements and the strength and deformation properties of the roof and floor lithologies or coal seam were not available. Consequently, all of these parameters had to be estimated. The roof layers were simulated using the strain-softening ubiquitous joint constitutive (SUBI) model [47] with the parameters taken from a paper by Tulu et al. [48] that provides practical estimates of SUBI input parameters for various coal measure rocks. The layers below the coal seam were modeled as elastic, as heaving issues or floor damage were not observed at the site. Discontinuum interfaces were also placed on either side of the coal seam to allow for the coal seam to slip relative to the immediate roof and floor layers. Slippage along lithological boundaries is probably important at the entry scale but is unlikely to have any major effect on the stress distribution process at the panel scale [20,49]. The presence of ubiquitous joints in the roof does, however, partially account for failure and slippage along bedding planes in the overburden. All entries in Mine A were supported by passive rockbolts, but these were not explicitly included in the global model since rockbolts have minimal impacts on rock deformation in continuum models [26].
Roller boundary conditions were placed along the model bottom and along all of the lateral edges, while the top boundary was left unconstrained, as it represents the actual ground surface. In the absence of site-specific horizontal stress data, a horizontal to vertical stress ratio (k) of 1 was ultimately used based on the following considerations: (1) The location of the mine on the World Stress Map [50] is near the midpoint between a normal faulting regime and a thrust faulting regime, which suggests that the vertical and horizontal stresses should be similar. (2) Mark [51] analyzed stress measurements from 17 Western US coal mines and found that the maximum horizontal stress was significantly lower than in the Eastern US and that it was approximately equal to the vertical stress in most cases.
In the FLAC3D model, once the in situ stresses were initialized, the entry was excavated, and the model was brought to an initial state of equilibrium. After this, the position of the longwall face was advanced in seven stages (Figure 1), and the model was brought to mechanical equilibrium after every stage. To advance the longwall face and simulate the strain-hardening response of gob, the mined portion of the coal was replaced by a strain-softening Mohr–Coulomb material whose cohesion was updated continuously as a function of the critical plastic shear strain [20].
2.3. Extensometer Data and Model Considerations
The seven locations of the longwall face used in the seven model stages are based on the extensometer measurements (see Figure 2). The outermost head of the extensometer in the cross-cut/XC (Extensometer 1) started detecting movements when the longwall face crossed the instrumented location (XC 77) on 7 September. The displacements then increased rapidly between 9 September and 11 September from 5 mm to 120 mm, at which point the extensometer was damaged (Figure 2a). During this time, the longwall face advanced from XC 76 to slightly beyond the midpoint between XC 75 and 76; this longwall position, which bounds the extent of reliable extensometer data, is the seventh stage in the FLAC3D model. Figure 3 shows the state of the ribs at the location of Extensometer 1 on 29 September. The rib had collapsed completely, and the extensometer heads are visible in the photo. The spalling and buckling of thin coal slabs are readily evident from this figure, and the damage in the upper part of the coal seam appears to be more severe than that in the lower part of the seam.
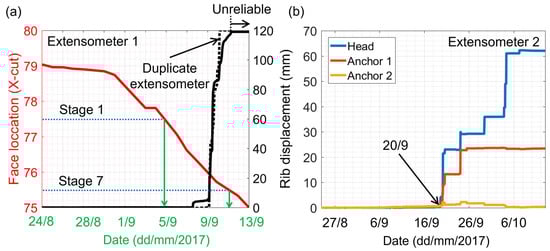
Figure 2.
(a) Face position and displacements measured by the outermost anchor of the extensometer located in XC 77 (Extensometer 1) as a function of date; the extensometer data used for calibration are in solid black, while the data from an additional redundant extensometer located at the same position are shown by the dotted black line. (b) Displacements measured by the outermost (head) and two adjacent anchors of the extensometer located in the entry between XC 77 and XC 78 (Extensometer 2) as a function of date. The head is 0.2 m long, and Anchors 1 and 2 of Extensometer 2 are located 0.3 m and 0.9 m from the end of the head. Anchors 1 and 2 of Extensometer 1 are spaced differently and located at 0.2 m and 0.5 m from the end of the head.
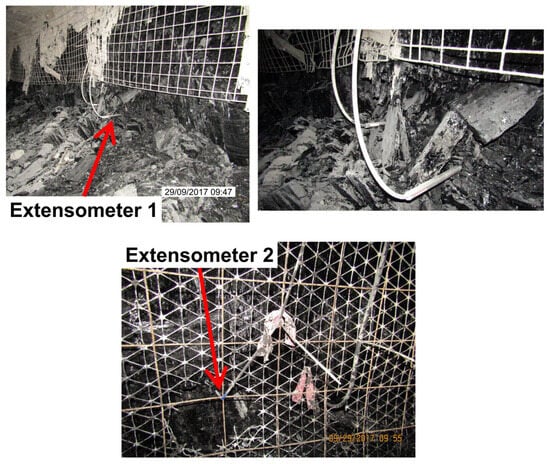
Figure 3.
Condition of the rib at the instrumented locations (Extensometers 1 and 2) on 29 September.
Interestingly, no deformation was recorded by Extensometer 2 until 20 September, when the longwall face had advanced by an additional 2 XCs (Figure 2b). Less damage manifestation in the entry (Figure 3) can be attributed to both the XC-parallel face cleats at the site (leading to anisotropy) and the greater distance from the longwall face. During subsequent field visits, the authors observed pronounced damage in the XCs, but less damage in the entries throughout the mine. This suggests that excavation orientation with respect to cleats is an important factor controlling the integrity of the coal ribs. The XCs are oriented parallel to the face cleats at this mine because such a design choice allows for the longwall face to be oriented parallel to the face cleats, which improves the minability of the coal.
Extending the model boundary by five additional XCs such that the input parameters could be constrained by both Extensometer 1 and 2 data would be desirable, but such a model was found to be computationally very expensive. More importantly, since the damage in the entry and XC are dependent on the cleat orientation, simply extending the model bounds may not be sufficient, and an anisotropic rock yield criterion or a modification to the isotropic progressive S-shaped yield criterion would be necessary to simulate the damage at both of these locations. For the purposes of the current study, however, the boundary was restricted to 120 m beyond the Stage 7 longwall face position, and calibration was conducted using the Extensometer 1 data. Although two extensometers were installed at the same location for redundancy (Figure 3), the data from only one of them (i.e., Extensometer 1) were used for calibration, as both of extensometers recorded nearly identical displacements (Figure 2a). Naturally, the use of an isotropic yield criterion in the FLAC3D model led to more yield in the entries than what occurred in reality, and to compensate for this behavior, relatively strong coal parameters had to be used during the calibration process.
The other longwall face locations for Stages 1–6 were selected to span the timeframe when Extensometer 1 was not detecting any movements to when the extensometer was completely damaged. Note that there are some temporary delays in the deformation between 9 September and 11 September (Figure 2a), which could be related to either intermittent pauses in production or transient (i.e., time-dependent) crack propagation and dilation phenomena. The “face location” curve in Figure 2a does not include any short-term production pauses, as this curve was interpolated from discrete data points provided by the mine (i.e., a continuous face position record was not available; longwall face positions may have been recorded after every working shift). Since the extensometer was recording the displacements continuously in real time, and the longwall face positions are only approximate, it would not be appropriate to advance the longwall face in the FLAC3D model by small increments and then compare the model results against the entire deformation curve. This is why only seven stages were considered; the model input parameters were ultimately constrained by matching the deformations at the rib surface to those measured by Extensometer 1 for each of these stages.
3. FLAC3D Model Setup, Calibration, and Results
Broadly speaking, there are three groups of parameters that had to be constrained in the FLAC3D model—the progressive S-shaped parameters for coal, the gob parameters, and the overburden properties. Unlike the coal parameters that could be constrained independently, the last two groups had to be calibrated together as they mutually interact to control the surface subsidence and loading on the chain pillars. Accordingly, the gob parameters and overburden parameters were calibrated first to ensure realistic chain pillar loading, followed by the calibration of the coal parameters. In general, the coal parameters had negligible effects on the subsidence profile, and therefore, the preliminary progressive S-shaped parameters determined in Section 3.1 were used during the gob and overburden parameter calibration. Later, the preliminary coal parameters were modified until the displacements from Extensometer 1 could be reproduced.
3.1. Progressive S-Shaped Criterion and Preliminary Coal Pillar Parameters
The progressive S-shaped yield criterion consists of three major thresholds: (1) Yield threshold, (2) Peak threshold, and (3) Residual threshold. All three thresholds can be sub-divided into a low-confinement (spalling) section and a high-confinement (shearing) section (Figure 4). The low-confinement section of the Yield threshold is commonly known as the Crack Initiation threshold, while the low- and high-confinement sections of the Peak threshold are commonly known as the Spalling Limit and Crack Damage thresholds [52], respectively. In this study, the yield criterion was slightly modified from Sinha and Walton [21], in that the requirement that all high-confinement sections should coincide at a particular confining stress was omitted. Such a modification was introduced based on Sinha et al. [53], which shows that the effective Yield threshold does not necessarily bend upward for coal. Therefore, the bi-linear shape of the Yield threshold was replaced by a straight line, which evolved to a bi-linear Peak threshold and then degraded to a Residual threshold. The high-confinement section of the Residual threshold was assigned the same friction angle value as that of the high-confinement section of the Peak threshold. Figure 4 illustrates the yield criterion in a σ1−σ3 space.
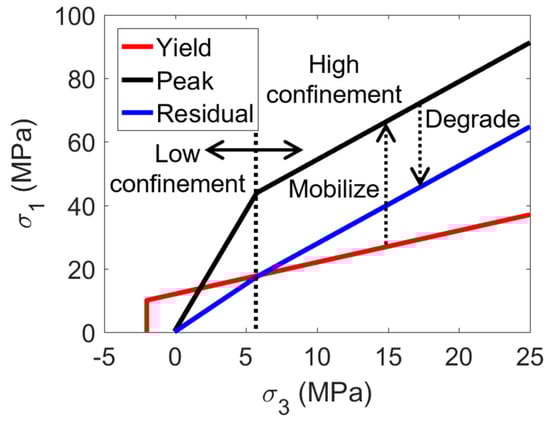
Figure 4.
Progressive S-shaped yield criterion with modified Yield threshold. The black dotted line divides the low and confinement segments of the yield criterion.
To determine a preliminary set of coal parameters that could be directly applied to the pillars in the panel-scale model, hypothetical pillar models with W/H = 2, 4, 6, and 8 geometries were loaded in compression up to failure, and the peak strengths were compared against the empirical Mark-Bieniawski pillar strength equation [54]. Since the pillar at Mine A was long, these hypothetical FLAC3D models were made to be only one element thick to mimic a plane strain condition (Figure 5a). Interfaces were placed on either side of the coal seam, and the same zone size as the one in the instrumented pillar in the panel-scale FLAC3D model was used. The loading was conducted via two elastic beams (the elastic modulus, E, and Poisson’s ratio, ν, of 8 GPa and 0.25, respectively), the bottom surface was fixed, and a very slow velocity of 5 × 10⁻⁸ m/step was applied to the top surface to simulate a pseudo-static loading condition. The different W/H models had the same height of 2.5 m, but the width was varied to match the corresponding ratio. The interfaces at the top and bottom of the pillar had zero tensile strength, 0.1 MPa cohesive strength, and a friction angle of 25° [20] in both of these hypothetical pillar models and in the panel-scale FLAC3D model.
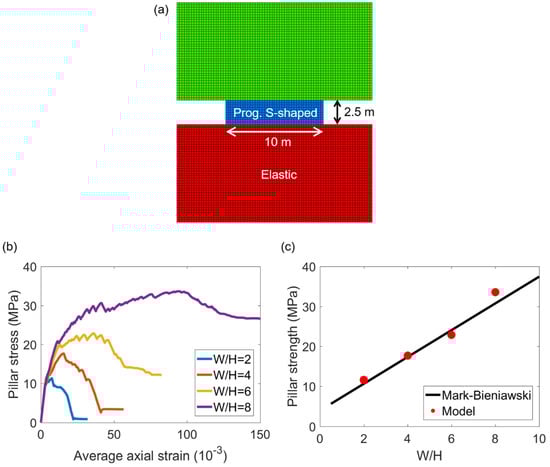
Figure 5.
(a) Model geometry for W/H = 4, (b) stress–strain curves for W/H = 2–8, and (c) peak pillar strengths for W/H = 2–8 compared to Mark-Bieniawski pillar strength equation.
Following a manual iterative back analysis process, a set of progressive S-shaped criterion parameters was identified that could reproduce the transition from brittle behavior for W/H = 2 to ductile behavior for W/H = 8 (Figure 5b [20,55]) and also matched the target peak pillar strengths (Figure 5c). When computing the peak strengths per the Mark-Bieniawski equation, the length was set to infinite to approximate the plane strain assumption in the hypothetical FLAC3D models. Note that although the pillar at Mine A had a L/W (length to width) ratio of ~3, the progressive S-shaped yield criterion parameters obtained herein are still applicable to the panel-scale model, as the effect of length on the peak strength becomes negligible beyond an L/W ratio of 3 [56,57]. The preliminary coal parameters from this initial calibration are listed in Table 1.

Table 1.
Progressive S-shaped yield criterion for coal obtained from hypothetical FLAC3D pillar models.
3.2. Gob and Overburden Parameters
A gob is an aggregate of broken rocks, which hardens in a hyperbolical manner when subjected to an increasing load [58]. The dramatic increase in the load carrying capacity as a function of strain arises from the reduction in the void space and an increase in the surficial contacts between broken rock fragments that allow for better stress transfer. When the longwall face advances, the immediate roof layers before the face collapse and form the gob. The portion of the gob closest to the longwall face is loose and has the lowest load carrying capacity, while the portions of the gob away from the face are compact, and in the limit, should carry loads equivalent to the in situ stress [59,60]. The ability of the gob to carry larger loads is also observed as one traverses the panel across its width; closer to the chain pillar, the gob is relatively loose (less gob loading/strain due to stress transfer to the chain pillars), while towards the panel center, it is relatively compact (less arching away from the pillars).
A gob has been historically modeled in FLAC3D using three different approaches: (1) The gob elements are elastic, and their elastic modulus is varied as a function of the axial strain to reproduce the expected hyperbolic behavior (e.g., [48]). (2) The gob elements are modeled using the double-yield constitutive model, where the cap pressures are defined as a function of the plastic volumetric strain (e.g., [49]). (3) The gob is modeled as a strain-softening material with the cohesion being varied as a function of the critical plastic shear strain to obtain a hardening response (e.g., [20]). The third approach was employed in this study.
In this approach, the friction angle and tensile strength of all gob elements are set to zero and the cohesive strength (half of the major principal stress the element can carry) is defined for various critical plastic shear strain values that conform to a specific hyperbolic stress–strain curve. During each solution cycle, all stress components except for the vertical stress are initialized to zero such that the elements are loaded in uniaxial compression and the plastic shear strain develops only due to inelastic deformation in the vertical direction (e.g., due to direct overburden loading). When defining the evolution of cohesion, it must be recognized that the total strain in each element consists of both elastic and plastic components.
In terms of the overburden, Tulu et al. [48] provides a matrix and ubiquitous joint parameters for three rock types—sandstone, limestone, and shale—and each rock type is further sub-divided on the basis of uniaxial compressive strength (UCS). The parameters were either directly chosen from the paper or linearly interpolated/extrapolated if the UCS (and associated parameter set) to be tested was not explicitly listed in the study by Tulu et al. [48]. These parameters were not modified during the calibration process. Note that care was taken to ensure that the strengths assigned in the models were consistent with the following strength relationships that would typically be expected: sandstone (SS) > interbedded SS and MS > mudstone (MS).
To constrain the gob and overburden parameters, an attempt was made to reproduce a subsidence profile that is typical of Mine A. The mine was able to provide subsidence contours for five previous panels (Panels 1–5) but had no data for the panel under consideration (Panel 6), as the mine usually performs a. subsidence analysis after the completion of every five panels. On the subsidence map, four cross sections were drawn immediately next to the instrumented site in the adjacent panel (Panel 5), and the average distance from the panel edge where the magnitude of subsidence was 0.3 m (1 ft), 0.6 m (2 ft), 0.91 m (3 ft), 1.22 m (4 ft), 1.52 m (5 ft), and 1.83 m (6 ft) was identified. These numbers correspond to the contours on the map, and since the survey was conducted via aerial mapping, the subsidence precision was limited to 0.3 m (1 ft). The cross sections were restricted to the half of Panel 5 that was closer to the solid coal, analogous to the method of measuring the subsidence along Section A’A” in Figure 1.
During the calibration process, it was observed that the gob parameters influenced the load transfer distance and the maximum subsidence at the model’s top surface (softer gob resulted in larger maximum subsidence). The overburden parameters mainly controlled the shape of the subsidence profile, with weaker overburden layers resulting in sharper drops in the subsidence along the panel edge.
Figure 6 compares the subsidence values in the calibrated model to those obtained from the subsidence map. Despite testing a variety of weaker overburden parameters, a sharper decline in the subsidence profile (as indicated in the subsidence map) could not be attained. The inability to fully match the slope of the subsidence profile could be related to the simplified overburden geometry employed in the FLAC3D model, the geological structures, the differences in the topography above Panels 5 and 6, or other unknown factors. In particular, only one set of SUBI properties was assigned to each rock type in the model, but in reality, different layers of a given rock type (e.g., mudstone) could have different properties. In the absence of mechanical data on pertinent rock, further increases in the model’s complexity to more precisely match the subsidence profile were not deemed justified. Despite the imperfect match obtained regarding the exact subsidence trough, the maximum subsidence slopes were similar, and most importantly, the subsidence plateau at the panel center of ~1.8 m observed in the field was well reproduced in the calibrated model (Figure 6). The corresponding overburden and gob parameters are listed in Table 2 and Table 3, respectively.
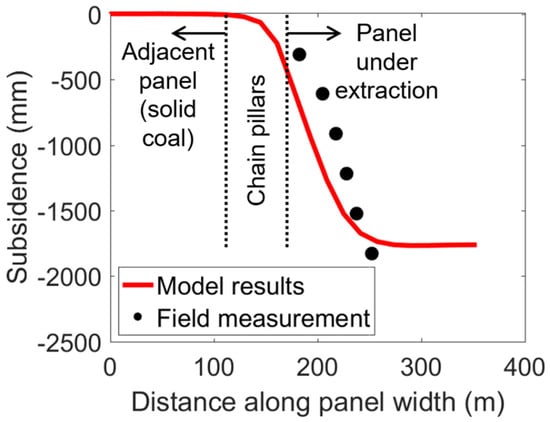
Figure 6.
Comparison of model results and field measurements for subsidence.
Table 2.
Properties of overburden layers. MS = mudstone and SS = sandstone. Properties were extrapolated/interpolated from [48].
Table 3.
Table of cohesion for gob elements.
The total stress–strain relationship defined by the gob parameters in Table 3 is shown in Figure 7. It is evident that the gob in the calibrated FLAC3D model is much softer than the “Sandstone” and “Shale” gob curves estimated by Pappas and Mark [58] using laboratory compression tests on a rock fragment gob analog. Such a large difference occurred because the gob in this study was modeled using zone elements with a height equivalent to that of the coal seam. In other words, if the height of the caved region is considered to be three times the mining height (a reasonable assumption based on [61]), then the total deformation due to gob compaction is compositely modeled using one seam height element in the current FLAC3D model (i.e., one-third of the height but three times the strain corresponds to an equivalent total displacement). Other studies have extended the gob to a few meters into the roof (e.g., [48]), but this was difficult to implement because the zone sizes in the gob and roof are different. Since displacements are dependent on the heights of the zone elements for a given strain, a softer gob was necessary to allow for the surface to subside by 1.8 m. For example, if the strain is 0.1, then the corresponding deformations for 2.5 m and 7.5 m of gob will be 250 mm and 750 mm, respectively.
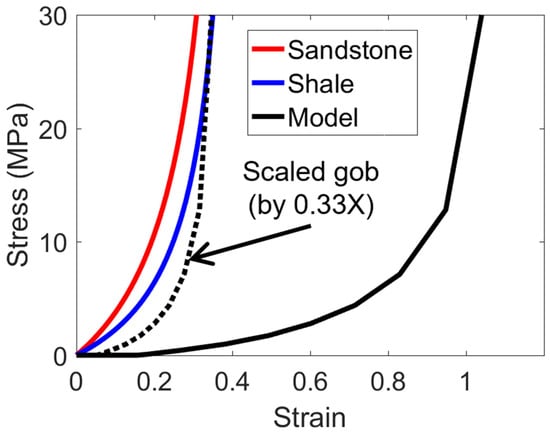
Figure 7.
Modeled gob compared to “sandstone” and “shale” laboratory gob curves from Pappas and Mark [58].
Interestingly, if the strain of the modeled gob curve is scaled by a factor of 0.33, which is analogous to having three gob elements stacked on top of one another (or a caving height of three times the mining height), then the curve moves close to the “Shale” curve from Pappas and Mark [58]. This is not surprising, given that there are several mudstone layers and interbedded mudstone and sandstone layers present in the overburden (Figure 1).
3.3. Calibration of the Coal Parameters and Associated Results
With the overburden and gob parameters constrained, the next task was to adjust the coal pillar parameters obtained in Section 3.1 to match the displacements measured by Extensometer 1 (Figure 2). Each model took about 4–5 days to complete on a machine with an 8-core 3.6 GHz Intel i9-9900K processor and 64 GBs of RAM. During model calibration, the right side of the progressive S-shaped criterion was kept unchanged, as these parameters did not significantly impact the progression of the low confinement damage along the pillar periphery. Changes were made iteratively to the cohesion of the Yield threshold, the friction angle of the Peak threshold, the friction angle of the Residual threshold, and the dilation angle. Table 4 lists the final calibrated coal pillar parameters, and Figure 8 shows the model-predicted displacements. It can be seen that the model was able to reproduce the start (Stage 5) and the end (Stage 7) of the main displacement increase very well. In the early stages (Stages 2–5), the extensometer shows a ~5 mm movement but the model shows ~0 mm; though this may seem like a mismatch, the model is quite consistent with the “duplicate extensometer” data in Figure 2a. A slight mismatch in displacements (~8 mm) also occurred at Stage 6, but this difference was not practically significant given the uncertainty in the position of the longwall face on different measurement dates and the overall brittleness of the deformation process.
Table 4.
Progressive S-shaped yield criterion for Mine A.
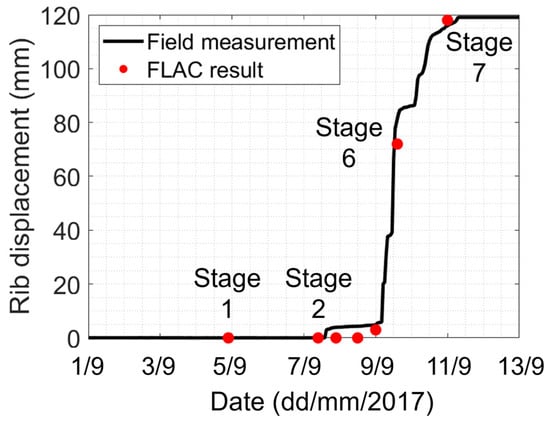
Figure 8.
Comparison of model results and field measurements for rib displacements.
In terms of the model parameters, significantly higher strengths with respect to those obtained in Section 3.1 (see Table 1) were required to achieve the observed displacement trends. The most prominent changes were in the Yield threshold cohesion (left side), the Residual threshold (left side) friction angle, and the dilation angle values. A larger Yield threshold cohesion and a larger Residual threshold friction angle suggest the need for delayed damage initiation and a greater ability for the confined coal to carry a load post-yield, respectively. A larger dilation angle, on the other hand, relates to greater inelastic deformation within the yielded elements and is mathematically explained by the following equation [62]:
where and are the maximum and minimum plastic strain increments, and is the dilation angle. The function 1/() is strictly increasing for [0°, 90°], meaning that for larger dilation angle values, more extension in is obtained per increment of compression in , or vice versa.
Before presenting any discussion on why changes in the coal parameters were required, the concepts of the “depth of yield” and “depth of collapsed area” in the FLAC3D model need to be introduced. Figure 9b shows the critical plastic shear strains in the FLAC3D model at Stage 7, and Figure 9c shows the rib displacement as a function of distance into the pillar for Extensometer 1. The Residual threshold is attained in the FLAC3D model at a value of 0.045, and the corresponding contour could be interpreted as approximately corresponding to the edge of the collapsed region (1 m). The point where becomes minimal/negligible (1.5 m) is the edge of the yielded region. From this figure, it is clear that the damage is much more localized in the field when compared to the FLAC3D model. The FLAC3D plastic strain was also more pronounced in the upper parts of the pillar, as was observed at Mine A (Figure 3).
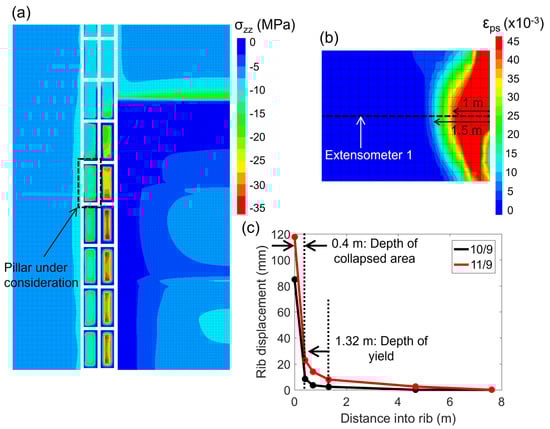
Figure 9.
(a) Vertical stress contour at Stage 7 along a horizontal section passing through the middle of the coal seam. (b) Critical plastic shear strain in the rib under consideration at Stage 7. (c) Rib displacement versus distance into the rib from Extensometer 1.
The increase in the coal strength properties and the inability of the FLAC3D model to reproduce the “depth of yield” and “depth of collapsed area” can be explained using physical principles. An isotropic rock yield criterion cannot simulate the preferential fracture development in anisotropic rock, and since the calibration goal was to match the deformations in the XC, a large yield occurred in the entries as well. The greater entry yield transferred more stresses onto the chain pillars located ahead of the longwall face, thereby necessitating the use of stronger Yield threshold parameters to delay the initiation of damage. This is illustrated using vertical stress contours along a section passing through the middle of the coal seam (Figure 9a)—note the “blue” regions that correspond to the limited load transfer through the pillars. Also note how the vertical stress increases away from the solid coal and the chain pillars, which is consistent with the previous discussion on gob loading.
The Residual threshold friction angle controls how far yielding progresses into the pillar, and this had to be raised to 30° to restrict the spatial extent of the damaged region. The dilation angle also had to be increased to 30° to increase the inelastic minimum plastic strain component (or lateral deformation). A number of different combinations of these two parameters were tested, but a better match against the target displacements and “depth of yield” could not be attained. This mainly occurred because of a competing feedback loop between the dilation angle and the Residual threshold—a larger dilation angle led to a larger “depth of yield” (also refer to figure 15 in [63]) and deformations at the rib surface, and a stronger Residual threshold decreased the “depth of yield” and the surficial deformations. Understandably, the displacements at locations deeper within the rib are overestimated, and it is due to this reason that the comparison against the data from other anchors is excluded.
Overall, it is not surprising that the FLAC3D model was unable to reproduce the localized, highly dilatant discontinuum behavior that was observed at Mine A (Figure 3), given that other authors have previously identified this drawback of continuum models. Lorig and Varona [23] note that “Numerical models, especially continuum models, are not usually capable of realistically simulating the disaggregation of the rock mass as it deforms”, and Corkum et al. [64] state that “Observed tunnel displacements in brittle rocks are far greater than would be predicted by plasticity theory/shear failure analysis methods, even using the highest possible dilation values (e.g., 45°). As a result, continuum numerical models based on plasticity theory are unable to match observed displacements. This is a significant limitation, particularly for the design of ground support systems and components”.
It was also hypothesized that part of the difficulty in matching the overall depth of collapse (~0.4 m; Figure 9c) is the size of the model zones (0.25 m) relative to this depth. The pillar under consideration was discretized by zones that are already smaller than most previous panel-scale studies (e.g., [19,20,49,65,66,67,68]); in total, the current FLAC3D model had 4.3 million zones (relative to the 1 million zone threshold deemed as “practical” by Klemetti et al. [65,68]). A secondary reason as to why the FLAC3D model over-predicted the “depth of collapsed area” could be that the Residual threshold does not correspond to the collapsed material, and a critical plastic shear strain larger than 0.045 may be more suitable for interpretation. In any case, it is important to recall that the ultimate goal of this model is to obtain a reasonable approximation of the loading path close to the pillar boundaries to be applied to a 2D discontinuum model. As will be shown in Section 4, it might be sufficient to only apply an approximate strain path from a FLAC3D model, even if the actual extent of the damaged rock mass is not fully reproduced.
4. The Integrated Modeling Approach—Setup and Results
4.1. Bonded Block Model (BBM) Setup for Mine A
Following the calibration of the FLAC3D model, an integrated 3D continuum–2D discontinuum approach was employed to develop a local pillar model of Mine A. A slice of the pillar containing Extensometer 1 was modeled in UDEC under a strain path derived from the panel-scale FLAC3D model. Figure 10 shows the overall BBM setup—the model has two continuum sections on either side of the 5.5 m wide Voronoi section. A 5.5 m discontinuum section is sufficient in this case as the depth of yield does not extend beyond 2 m (Figure 9c). The continuum portion on the right side corresponds to half of the entry width at Mine A. About 12 m of the roof and 9 m of the floor were also included, such that the pillar can deform relative to the host rock without any constraint. Further increasing the thicknesses of the host layers is not necessary to achieve accurate model results for the pillar, as will be demonstrated later in this subsection.
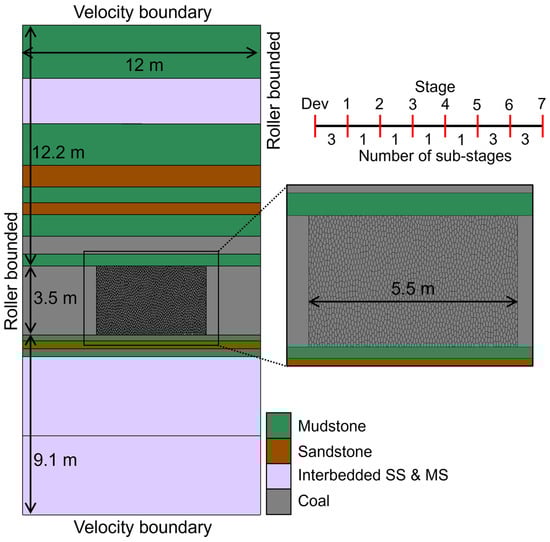
Figure 10.
BBM geometry and setup. The number of substages within each stage is indicated in the figure.
Each Voronoi block had an average edge length of 0.05 m (an effective block width is ~0.07–0.08 m), which was elongated in the vertical direction by a factor of two to mimic cleat planes (similar to [27]) and discretized using multiple constant-strain triangular zones. A strain-softening constitutive model was assigned to all zones in the BBM such that damage near the pillar periphery is explicitly represented by contact failure, while finer-scale damage occurring deeper within the pillar is approximated by a combination of contact failure and zone yield.
The model sequencing follows the methodology of Sinha and Walton [37] and is briefly described below:
- In situ stresses corresponding to those in the FLAC3D model at the instrumented location were applied to the entire BBM, and the model was brought to mechanical equilibrium. Next, the entry was excavated, and the unbalanced forces were relaxed in 10 stages using UDEC’s built-in ZONK function. This gradual relaxation is necessary in order to avoid unrealistic yielding/fracturing along the entry due to a sudden increase in the unbalanced forces in the model.
- In order to apply the same load path to the BBM as was experienced by the calibrated FLAC3D pillar section, a strain-controlled loading approach was adopted. In particular, the vertical displacements at gridpoints corresponding to the top and bottom boundaries of the BBM were recorded for each of the seven stages, segmented into multiple sub-stages, and then applied to the BBM via a velocity boundary condition. The segmentation was performed to avoid applying a large displacement to the BBM in one step, which could result in unrealistic fracturing. The number of sub-stages was based on the displacement difference between two consecutive stages (when the difference was large, a larger number of sub-stages was used). To segment a stage, the difference in displacement from the previous stage to the stage of interest was split equally into the required number of sub-stages. Ultimately, 13 total sub-stages were considered in the final BBM such that the average vertical displacement increase along the loading boundaries did not exceed 1 mm between any two sub-stages. A roller boundary was assigned to the vertical edges of the model in order to simplify the loading procedure.
- Instead of applying the displacement differences as a velocity in the BBM, it was scaled up by 10 times so that the model would need to be stepped for only 1/10th of a second of model time (~30,000 solution steps) instead of 1 s to apply the appropriate displacements. Once the model was stepped by 0.1 s, the boundaries were fixed, and then stepping continued until mechanical equilibrium was attained. This loading mechanism was repeated for all seven stages (including the 13 sub-stages).
A continuum version of the UDEC model (i.e., no BBM section and continuum coal properties inherited from FLAC3D) was also run with this loading procedure and compared to the FLAC3D model (Figure 11). The general consistency in the yielded elements and vertical stress at Stage 7 confirms that the loading methodology is appropriate, meaning the inclusion of additional host rock layers and the consideration of horizontal movements along the model boundaries and/or variation in the out-of-plane stresses is not necessary. This outcome is expected as the section under consideration is farther away from the longwall face, and the right boundary of the UDEC model is the midpoint of the entry, where deformations are mostly vertical.
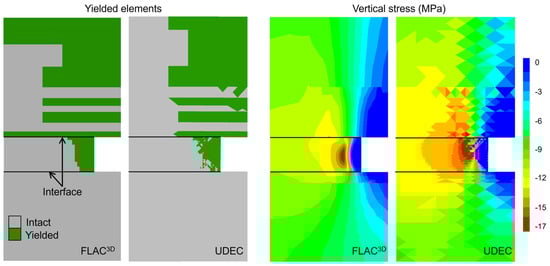
Figure 11.
Comparison of FLAC3D model and continuum UDEC model at Stage 7.
While there are 13 sub-stages in the BBM, model calibration was conducted only for the seven stages considered in the FLAC3D model. This is because the displacements in the FLAC3D model increased from Stages 1 to 7, meaning that the BBM was also loaded per a monotonically increasing displacement boundary condition. Since the FLAC3D model did not account for any pause in longwall production, the BBM simulated a scenario where the longwall face was advancing continuously from sub-stages 1 to 13. In reality, there were intermittent production halts that resulted in breaks in the deformation curve recorded by Extensometer 1 (Figure 2a). Due to the discrepancy between the actual and modeled loading conditions at the different measurement points, it was only appropriate to compare the displacements at the face positions used during the FLAC3D model calibration.
4.2. Model Calibration and Results of Unsupported BBM
An inelastic BBM requires the definition of two groups of parameters—(1) zone parameters: the elastic modulus, Poisson’s ratio, peak and residual cohesions, peak and residual friction angles, peak and residual tensile strengths, and critical plastic shear strain from peak to residual, and (2) contact parameters: normal (jkn) and shear stiffnesses (jks), peak and residual cohesions (cpeak and cres), peak and residual friction angles (φpeak and φres), and peak and residual tensile strengths (σt,peak and σt,res). The key difference between the two groups is that the drop from the peak to residual strength can be controlled by the critical plastic shear strain parameter for the zones but it is instantaneous for the contacts.
A manual back-analysis approach was conducted, whereby the input parameters were systematically modified through trial and error until the BBM rib displacements matched those recorded by Extensometer 1. The general calibration approach used has been discussed by the authors in a previous study [27]. Figure 12 compares the rib displacements from the calibrated BBM and the field measurements, while Table 5 lists the calibrated parameters. The model was able to capture the rapid rise in displacement after Stage 5, but slightly overestimated the displacements at Stage 7. It was found to be difficult to constrain the displacements at Stage 7 without affecting the data–model fit at Stage 6. The authors believe that this is related to the size of the Voronoi blocks chosen (block width of ~0.07–0.08 m) relative to the deformation being targeted in the calibration.
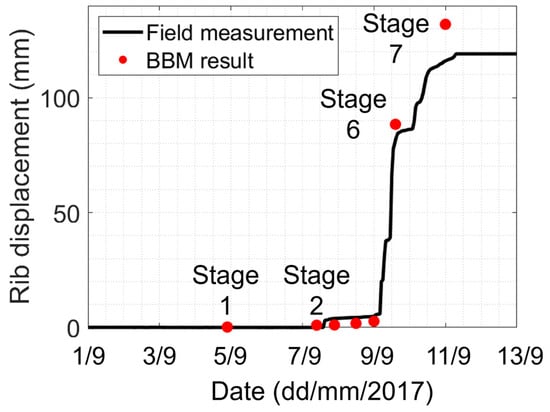
Figure 12.
Comparison of model rib displacements and field measurements.
Table 5.
Calibrated BBM parameters.
Figure 13 shows how the fractures and displacement distributions evolved with continued loading in the BBM. At Stage 5, there were some fractures along the top and bottom corners of the pillar, and peak displacements were limited to ≤20 mm at the center. At Stage 6, the spatial extent of the “>10 mm” contour widened, and a single fracture was noted to propagate towards the pillar bottom. Such axial cracks are typical in excavations undergoing spalling [52]. At Stage 7, extensive damage in the form of axial cracking along the entire height of the pillar occurred with slab separation. Of course, the thicknesses of the spalled slabs at Mine A are relatively smaller than those in Figure 13, but it is not feasible to develop an excavation-scale BBM with block sizes on the order of one centimeter. The separation of blocks in this case is therefore a representation of the total dilatancy occurring across a specific thickness of spalled coal. Choosing very large block sizes will naturally lead to incorrect results, and a balance must be established between the computational requirement of a BBM and the mechanism being modeled. In the current BBM, there are five blocks across the detaching slab (Figure 13), and this is believed to be acceptable. As a point of comparison, Garza-Cruz et al. [34] used 4–6 cm edge length tetrahedral blocks to model rock beds that were 0.3–0.5 m thick; if the width of the blocks was 7–8 cm (typically ~50% larger than the nominal edge length), then the number of elements across the bed thickness was 4–7. Additionally, Itasca suggests using at least four zone elements across the thickness of a beam [69]; the failed slab is considered as a beam, and Voronoi blocks are considered instead of zone elements, so this criterion is also satisfied with five blocks across the slab.
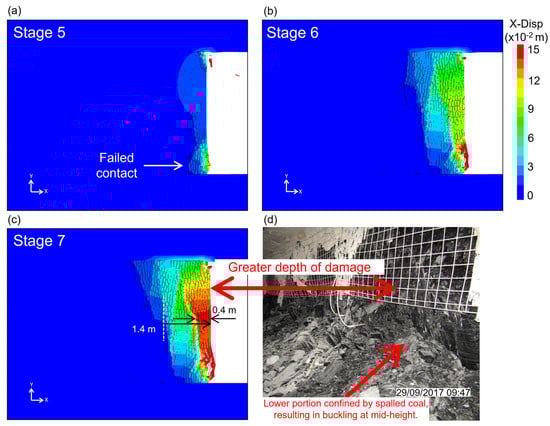
Figure 13.
Progression of failure and increase in deformation from (a–c) Stages 5–7, (d) State of the coal rib on 29/09/2017.
The width of the detaching slab at the pillar mid-height in Stage 7 is about ~0.4 m wide (Figure 13), and the section of the BBM showing elevated movements, otherwise a proxy for “depth of yield”, is ~1.5 m, both of which are consistent with the field observations (Figure 9c). Figure 13 shows greater damage and disaggregation in the upper portions of the rib and some buckling at the mid-height. Similarly, the model at Stage 7 exhibits a larger depth of fracturing in the upper portions of the rib, although no visible buckling is noted. It is useful to recall that the rib photograph in Figure 13 was taken on 29 September when the longwall face advanced past XC 71. Stage 7 corresponds to 11 September when the longwall face was between XC 75 and 76. It is interpreted that the rib had not collapsed on 11 September, which is supported by the fact that Extensometer 1 was still operational, and the outermost anchor had not yet attained its maximum movement of 120 mm at this point. The buckling of the rib in Figure 13 could therefore be a consequence of the collapse post 11 September and the geometrical constraint provided to the bottom portion of the rib by the spalled coal (Figure 13). Overall, the results are promising and illustrate the capabilities of BBMs to simulate large-strain discontinuum processes like spalling in anisotropic rock.
To determine the effective unconfined coal mass strength represented by the calibration model, a UCS simulation was run with the parameters listed in Table 5. The model, 1.75 m wide and 3.5 m high, was carved out of the BBM in Figure 10 and subjected to a constant velocity of 0.01 m/sec along the top boundary. Figure 14 shows the stress–strain curve and the fracture state at the end of the model run. A peak strength of 18.4 MPa was obtained, implying that the calibration to field observations required unconfined strength in between the CI and CD thresholds (refer Table 3 and Table 4). The CI and CD generally correspond to the long-term and short-term in situ strengths of brittle rock, respectively; because the loading in the rib was rapid (i.e., due to longwall face advance), a strength in between the CI and CD is reasonable in this case.
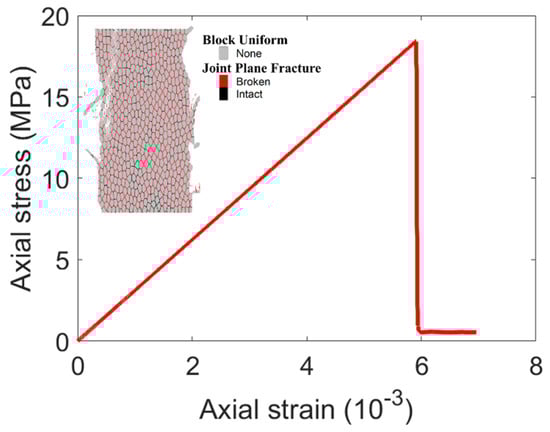
Figure 14.
UCS simulation of coal BBM.
4.3. Effect of Rockbolts on Rib Behavior
With the unsupported BBM calibrated to the extensometer measurements, the influence of support on the rib displacements was tested using this model. Specifically, the support patterns consisted of (1) one 1.2 m long rockbolt that was 16 mm in diameter, installed at the mid-height of the pillar, and (2) two 1.2 m long rockbolts that were 16 mm in diameter, installed 1 m away from the host units and spaced at 1.5 m. Additional simulations were completed where the rockbolt in the one-bolt case was translated to the upper and lower portions of the rib to better understand its positional influence.
In terms of the structural setup, each rockbolt was sub-divided into 24 segments such that there was at least one node in each block [34,70,71]. A 20 mm long steel faceplate was also attached to the rockbolt end as a liner structural element, with an E of 200 GPa and ν of 0.3, and a rock-to-faceplate friction angle of 25°. The rockbolt properties were selected from Sinha [71] and they are listed in Table 6. It is known that entry relaxation in brittle geomaterials like coal occurs very close to the development face [8], and therefore, the rockbolt was installed in the BBM after full equilibrium was achieved in the entry excavation stage. Note that the intent of this analysis is not to optimize support design at Mine A, but rather to demonstrate a procedure that future studies could use to develop site-specific BBMs and test multiple support combinations to optimize support (including the consideration of cost) at the site.
Table 6.
Rockbolt structural element input properties [71].
4.3.1. Effect of Support Density
Figure 15 shows the simulated rib displacements in the one-bolt and two-bolt BBMs. With the incorporation of one bolt, the displacements dropped from 132 mm to 22 mm (an 83% drop) at Stage 7 at the pillar mid-height. The displacements further dropped to 11 mm in the two-bolt case, with higher values concentrated along the outer edges of the rib. Fracturing and bulking of the coal mass is dramatically reduced across the entire height of the rib, as illustrated by the failed contacts in Figure 15. This is expected, as rockbolts reinforce the coalmass through the keying of failed Voronoi blocks, thereby preventing the deconfinement and propagation of fractures deeper into the solid coal. The efficacy of bolts is also high because the rockbolts are long and are able to penetrate through the fractured rib into the solid intact coal [6,72]. Sinha and Walton [27] explained this behavior using Euler’s Buckling Theory which states that the critical buckling load is proportional to the (beam width)3; as the beam thickness increases (due to pinning by rockbolts), the critical buckling load increases. The current BBMs also show that rockbolts are effective in suppressing fracture propagation. For example, in the two-bolt case, the fractures initiating from the host units (roof and floor) were impeded to the limit that only distributed contact fractures formed in the rib segment in between the two bolts (Figure 15b). For both sets of models, the axial strain and axial load in the rockbolts spiked, where fractures intersected the structural elements (Figure 15a,b).
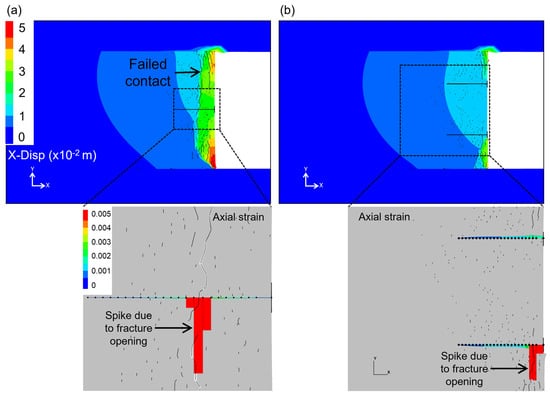
Figure 15.
BBM displacements at Stage 7 with addition of (a) one rockbolt and (b) two rockbolts.
Although we have no field data for reinforced ribs at Mine A (unlike the West Cliff Mine in [27]) to allow us to draw definitive conclusions, the fact that the West Cliff Mine BBM and the BBM in the current study employed the same rockbolt parameters and encountered similar loading conditions means that the bolt-induced displacement reductions in the two cases can be compared. With respect to the differences in the depths of mining at Mine A and the West Cliff Mine (480 m) and the specific loading conditions, it should be noted that in both BBMs, the unsupported lateral displacement at the mid-height of the pillar was ~0.1 m, and the damage was the most pronounced in upper part of the pillar. Since the depth at the West Cliff BBM is nearly double that of Mine A, it can be expected that the marginal benefit of added support would be larger in Mine A (tangential stress at rib boundary is lower in Mine A). In the West Cliff mine case, the rib deformation dropped from 116 mm to 59 mm at the end of the headgate loading phase with the installation of two 16 mm diameter, 1.2 m long grouted rebars. At Mine A, due to limited headgate loading on the chain pillar (some stress transfered to the solid coal face; see Figure 9a) and the lower depth of mining, the predicted support behavior is interpreted to be reasonable. Previous studies by the authors have demonstrated the realism of rock–support interaction behaviors predicted by BBMs [27,37]. There are also numerous numerical [73,74,75,76] and empirical [6,77] studies in the literature that have findings that are consistent with significant drops in the rib and roof deformations due to the installation of rockbolts.
A one-to-one comparison with more recent studies such as those by Sunkpal and Sherizadeh [28] and Sunkpal et al. [29] is not possible here because those studies only considered development loading with an idealized geo-mining setup. In addition, there is a difference in how anisotropy in coalmass is accounted for in the current study versus in the recent studies. For example, Sunkpal and Sherizadeh [28] incorporated two fracture sets in a “Brick Bonding pattern” to mimic cleat and bedding planes. Unlike the elongated block approach, the efficacy of the “Brick Bonded” approach in reproducing an anisotropic ground response and a rock–support interaction remains to be established using real mining case studies. Nonetheless, the authors identified some results in these recent works that are relevant to the current study: (1) A bow-shaped fracture pattern was observed by Sunkpal et al. [29], similar to the failure pattern in the one-bolt case. However, the damage profile is more asymmetric in the unsupported model, as also observed in the field. (2) Increasing the rockbolt density stabilized the rib by reducing fracture propagation. In the three-bolt case in the study by Sunkpal et al. [29], damage was restricted to the outer edges of the rib, as shown in Figure 15b. (3) The reduction in displacement with the addition of rockbolts demonstrated by Sunkpal et al. [29] was lower, which was likely due to the lower driving force (i.e., development loading only) and limited fracture opening for the passive rockbolts to act against. Specifically, the displacement for their 250 m depth case dropped from ~18 mm at the rib surface to ~13 mm and ~11 mm with two and three bolts, respectively. It was hypothesized that if the mining-induced load was increased, the fracturing/bulking of the rib would increase, allowing for the passive rockbolts to have an even larger stabilizing effect. This is supported by the empirical study of Mohamed et al. [77] where increases in the mining depth (proxy for load increase) leads to lower rib factor of safety, thereby requiring more support to maintain stability.
4.3.2. Effect of Rockbolt Position
This sub-section explores the effect of the rockbolt position on the overall rib damage process. Relative to the one-bolt case, two setups were tested initially—a rockbolt located 1 m from the roof (Figure 16a) and a rockbolt located 1 m from the floor (Figure 16c).
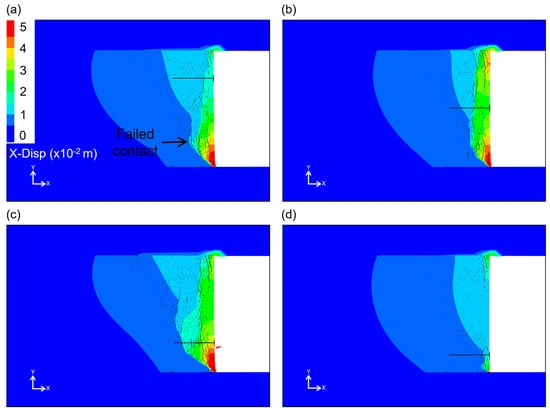
Figure 16.
BBM displacements at Stage 7 with addition of one rockbolt in (a) upper half of the rib, (b) mid-height of the rib (same as in Figure 15a), (c) lower half of the rib, and (d) lower than in (c).
For the roof case, the depth of fracturing and bulking was significantly reduced in the upper portions of the rib compared to Figure 16b. Some modest influence is noted in the middle portion as well. This result was expected, as fracturing in the BBM initiated from the roof and (especially) the floor (Figure 13a) and the suppression of fracture generation/growth from either end have the potential to stabilize the central portion of the rib. The rockbolt did not have much effect on the bottom portion, leading to more fracturing and bulking.
The behavior of the floor case was more interesting and counterintuitive (Figure 16c) in that there was an increase in the fracture depth in the bottom half despite the rockbolt being installed in the bottom half of the rib. Sinha and Walton [37] presented similar observations in the context of a granite pillar case study, where the depth of fracturing along one of the pillar edges was larger in a three-bolt case in comparison to an unsupported case. This was explained by the stiffening of the fractured zone by the rockbolt, allowing for the damage to propagate deeper into the rib. In that same study, when the outer bolts were moved closer to the host units (i.e., outward), the fracture depth was reduced. With that in mind, a separate variation of the floor case was simulated, where the rockbolt was translated to 0.5 m from the floor (Figure 16d). This had a dramatic influence on the overall depth of damage and bulking along the rib, which is consistent with the findings of Sinha and Walton [37]. The effect is more prominent here due to the anisotropic nature of the rock mass (i.e., elongated blocks) that permitted the rockbolt to bind the layers more effectively and suppress the initiation/growth of fractures from the floor. The effective suppression of fracture growth close to the source and the dominance of fracturing in the bottom half of the rib (Figure 13a) explains the notable stabilization observed in the upper portions of the rib (Figure 16d).
5. Conclusions
This study presents an application of a 3D continuum–2D discontinuum modeling approach to simulate the damage in a Western US longwall chain pillar with the goal of demonstrating its applicability to the design of rib support schemes. While the use of 3D continuum models in a panel-scale analysis is common, the application of a realistic loading path to 2D discontinuum models to study damage and the rock–support interaction in heterogeneous, anisotropic rock in a coal mine context is more novel. Two multi-point borehole extensometers were installed in a chain pillar in June 2017, and the rib deformations were monitored as functions of the adjacent longwall face position. The deformation measurements from one of these extensometers and the subsidence profile from the adjacent panel were employed for the calibration of a panel-scale FLAC3D (continuum) model, followed by the extraction of the boundary deformations along the pillar slice containing the extensometer for application to a 2D Bonded Block Model (BBM). The BBM was calibrated to the extensometer data using an iterative back-analysis approach. A sensitivity analysis was conducted, where the support density and location were modified to understand how the incorporation of support might affect rib deformation. The following observations were made:
- The FLAC3D model could reproduce the rib deformations very well but failed to match the depth of fracturing.
- The BBM, in contrast, exhibited a close correspondence with both the deformation and the depth of fracturing. This suggests that a perfect replication of the observed depth of yield is not necessary to obtain a reasonable approximation of the boundary conditions to be applied to the BBM.
- The inclusion of one rockbolt at the rib mid-height reduced the fracturing and bulking significantly, while the use of two rockbolts stabilized the rib to an extent where only distributed fracturing occurred in the central portion of the rib. The behaviors of the rockbolts were generally interpreted to be realistic based on a comparison against the literature.
- Some other interesting behaviors were noted during the analysis of the rockbolt position, and it was concluded that the specific rockbolt location can affect the extent of damage (making the damage profile more anisotropic across the rib height) and magnitude of bulking along the rib.
Overall, the integrated 3D continuum–2D discontinuum modeling approach shows potential to be used as a support design tool. As mentioned, a perfect calibration of the global model is not necessary, but care should be taken to calibrate the local model to the field behavior before employing it for predictive purposes. The use of extensometers to monitor coal pillar ribs is highly recommended, as the data can directly serve as calibration targets for the local model while providing valuable information regarding the structural health of the pillar.
Author Contributions
Conceptualization, S.S. and G.W.; methodology, S.S. and G.W.; software, S.S.; formal analysis, S.S.; writing—original draft preparation, S.S.; writing—review and editing, S.S. and G.W.; funding acquisition, G.W. All authors have read and agreed to the published version of the manuscript.
Funding
This research was funded by the National Institute for Occupational Safety and Health (NIOSH), grant number 200-2016-90154.
Data Availability Statement
The data used in this study are available upon request from the main author.
Acknowledgments
The research conducted for this study was funded by the National Institute for Occupational Safety and Health (NIOSH) under grant number 200-2016-90154. The author would like to extend their gratitude for the financial support. The modeling effort for this study was conducted using educational licenses of UDEC provided by Itasca Consulting, Ltd. The author appreciates Itasca’s support in this capacity. Sincere thanks is extended to Gabriel Esterhuizen for helping with the gob modeling code.
Conflicts of Interest
The authors declare no conflict of interest.
References
- Horino, F.G.; Duvall, W.I.; Brady, B.T. The Use of Rock Bolts or Wire Rope to Increase the Strength of Fractured Model Pillars; U.S. Bureau of Mines Report of Investigation, RI-7568; US Department of the Interior, Bureau of Mines: Washington, DC, USA, 1971; pp. 1–24.
- Guana, M. Angle bolts control rib side at No. 4 Mine, Brockwood, Alabama. In Proceedings of the SME-AIME Fall Meeting and Exhibit, Salt Lake City, UT, USA, 19–21 October 1983. Preprint number 83–310. [Google Scholar]
- Dolinar, D.R.; Tadolini, S.C. Entry Stabilization Using Rib Bolting Procedures; U.S. Bureau of Mines Report of Investigation, RI-9366; US Department of the Interior, Bureau of Mines: Washington, DC, USA, 1991; pp. 1–13.
- Smith, W.C. Rib Stability: Practical Considerations to Optimize Rib Design; US Department of the Interior, Bureau of Mines: Washington, DC, USA, 1992. [Google Scholar]
- Colwell, M.; Mark, C. Analysis and design of rib support (ADRS)—A rib support design methodology for Australian collieries. In Proceedings of the 24th International Conference on Ground Control in Mining, Morgantown, WV, USA, 2–4 August 2005; Volume 24, pp. 12–22. [Google Scholar]
- Colwell, M.G. A Study of the Mechanics of Coal Mine Rib Deformation and Rib Support as a Basis for Engineering Design. Ph.D. Thesis, University of Queensland, Gatton, Australia, 2006. [Google Scholar]
- Guana, M.; Mark, C. Protecting underground coal miners from rib falls. In Proceedings of the 30th International Conference on Ground Control in Mining, Morgantown, WV, USA, 26–28 July 2011; Volume 30, pp. 126–134. [Google Scholar]
- Mohamed, K.M.; Tulu, I.B.; Klemetti, T. Numerical simulation of deformation and failure process of coal-mass. In Proceedings of the 49th US Rock Mechanics/Geomechanics Symposium, American Rock Mechanics Association, San Francisco, CA, USA, 29 June–1 July 2015. Paper No. 363. [Google Scholar]
- Mohamed, K.M.; Murphy, M.M.; Lawson, H.E.; Klemetti, T. Analysis of the current rib support practices and techniques in U.S. coal mines. Int. J. Min. Sci. Technol. 2016, 26, 77–87. [Google Scholar] [CrossRef]
- Zhang, P.; Mohamed, K.M.; Trackemas, J. Coal rib failure and support in longwall gate entries. In Proceedings of the 51th US Rock Mechanics/Geomechanics Symposium, San Francisco, CA, USA, 25–28 June 2017. Paper No. 886. [Google Scholar]
- Sears, M.M.; Rusnak, J.; Van Dyke, M.; Rashed, G.; Mohamed, K.M.; Sloan, M. Coal rib response during bench mining: A case study. Int. J. Min. Sci. Technol. 2018, 28, 107–113. [Google Scholar] [CrossRef]
- Slaker, B.; Gangrade, V.; Murphy, M.M.; Winfield, J. Seismic data interpretation of a development pillar at a steeply dipping underground limestone mine. In Proceedings of the 52nd US Rock Mechanics/Geomechanics Symposium, Seattle, WA, USA, 17–20 June 2018. Paper No. 194. [Google Scholar]
- Slaker, B.; Mohamed, K.M. A practical application of photogrammetry to performing rib characterization measurements in an underground coal mine using a DSLR camera. Int. J. Min. Sci. Technol. 2017, 27, 83–90. [Google Scholar] [CrossRef]
- MSHA. Mining Industry Accident, Injuries, Employment and Production Statistics and Reports. 1 March 2019. Available online: https://arlweb.msha.gov/ACCINJ/accinj.htm (accessed on 15 May 2019).
- Gao, Y.; Liu, D.; Zhang, X.; He, M. Analysis and optimization of entry stability in underground longwall mining. Sustainability 2017, 9, 2079. [Google Scholar] [CrossRef]
- Shabanimashcool, M.; Li, C.C. A numerical study of stress changes in barrier pillars and a border area in a longwall coal mine. Int. J. Coal Geol. 2013, 106, 39–47. [Google Scholar] [CrossRef]
- Shabanimashcool, M.; Li, C.C. Numerical modelling of longwall mining and stability analysis of the gates in a coal mine. Int. J. Rock Mech. Min. Sci. 2012, 51, 24–34. [Google Scholar] [CrossRef]
- Zhang, G.; Liang, S.; Tan, Y.; Xie, F.; Chen, S.; Jia, H. Numerical modeling for longwall pillar design: A case study from a typical longwall panel in China. J. Geophys. Eng. 2015, 15, 121–134. [Google Scholar] [CrossRef]
- Basarir, H.; Oge, I.F.; Aydin, O. Prediction of the stresses around main and tail gates during top coal caving by 3D numerical analysis. Int. J. Rock Mech. Min. Sci. 2015, 76, 88–97. [Google Scholar] [CrossRef]
- Esterhuizen, E.; Mark, C.; Murphy, M.M. Numerical model calibration for simulation coal pillars, gob and overburden response. In Proceedings of the 29th International Conference on Ground Control in Mining, Morgantown, WV, USA, 27–29 July 2010; pp. 46–57. [Google Scholar]
- Sinha, S.; Walton, G. A progressive S-shaped yield criterion and its application to the study of rock pillar behavior. Int. J. Rock Mech. Min. Sci. 2018, 105, 98–109. [Google Scholar] [CrossRef]
- Sinha, S.; Walton, G. Modeling behaviors of a coal pillar rib using the progressive S-shaped yield criterion. J. Rock Mech. Geotech. Eng. 2020, 12, 484–492. [Google Scholar] [CrossRef]
- Lorig, L.J.; Varona, P. Guidelines for numerical modelling of rock support for mines. In Proceedings of the 7th International Symposium on Ground Support in Mining and Underground Construction, Australian Centre for Geomechanics, Perth, Australia, 13–15 May 2013; pp. 81–105. [Google Scholar]
- Bahrani, N.; Hadjigeorgiou, J. Influence of stope excavation of drift convergence and support behavior: Insights from 3D continuum and discontinuum models. Rock Mech. Rock Eng. 2018, 51, 2395–2413. [Google Scholar] [CrossRef]
- Renani, H.R.; Martin, C.D.; Hudson, R. Back analysis of rock mass displacements around a deep shaft using two- and three- dimensional continuum modeling. Rock Mech. Rock Eng. 2016, 49, 1313–1327. [Google Scholar] [CrossRef]
- Sinha, S.; Walton, G. Understanding continuum and discontinuum models of rock-support interaction for excavations undergoing stress-induced spalling. Int. J. Rock Mech. Min. Sci. 2019, 123, 104089. [Google Scholar] [CrossRef]
- Sinha, S.; Walton, G. Modeling the behavior of a coal pillar rib using bonded block models with emphasis on ground-support interaction. Int. J. Rock Mech. Min. Sci. 2021, 148, 104965. [Google Scholar] [CrossRef]
- Sunkpal, M.; Sherizadeh, T. Exploring the Deformation Mechanics of Coal Ribs Using the Distinct Element Modeling Approach. Rock Mech. Rock Eng. 2022, 55, 2879–2898. [Google Scholar] [CrossRef]
- Sunkpal, M.; Sherizadeh, T.; Guner, D. Evaluating the Effect of Overburden Depth, Mining Height, and Support Density on Coal Rib Damage Using DEM Modeling. Geosciences 2023, 13, 77. [Google Scholar] [CrossRef]
- Sunkpal, M.; Sherizadeh, T.; Guner, D. Quantifying coal rib stability and support requirements using bonded block modeling and reliability analysis based on the random set theory. Int. J. Rock Mech. Min. Sci. 2023, 163, 105332. [Google Scholar] [CrossRef]
- Bai, Q.; Tu, S.; Zhang, C.; Zhu, D. Discrete element modeling of progressive failure of wide coal roadway from water-rich roofs. Int. J. Coal Geol. 2016, 167, 215–229. [Google Scholar] [CrossRef]
- Farahmand, K.; Vazaios, I.; Diederichs, M.S.; Vlachopoulos, N. Investigating the scale-dependency of the geometrical and mechanical properties of a moderately jointed rock using a synthetic rock mass (SRM) approach. Comput. Geotech. 2018, 95, 162–179. [Google Scholar] [CrossRef]
- Yang, X.; Wang, E.; Wang, Y.; Gao, Y.; Wang, P. A study of the large deformation mechanism and control techniques for deep soft rock roadways. Sustainability 2018, 10, 1100. [Google Scholar] [CrossRef]
- Garza-Cruz, T.; Bouzeran, L.; Pierce, M.; Jalbout, A.; Ruest, M. Evaluation of ground support design at Eleonore Mine via Bonded Block Modelling. In Proceedings of the 9th International Symposium on Ground Support in Mining and Underground Construction, Perth, Australia, 23–25 October 2019; pp. 41–356. [Google Scholar]
- Bai, Q.; Tu, S. Numerical observations of the failure of a laminated and jointed roof and the effective of different support schemes: A case study. Environ. Earth Sci. 2020, 79, 1–8. [Google Scholar] [CrossRef]
- Garza-Cruz, T.V.; Pierce, M.; Board, M. Effect of shear stresses on pillar stability—A back-analysis of the Troy Mine experience to forward predict pillar performance at Montanore. In Proceedings of the 52nd US Rock Mechanics/Geomechanics Symposium, Seattle, WA, USA, 17–20 June 2018. Paper No. 1158. [Google Scholar]
- Sinha, S.; Walton, G. Integration of three-dimensional continuum model and two-dimensional bonded block model for studying the damage process in a granite pillar at the Creighton Mine, Sudbury, Canada. J. Rock Mech. Geotech. Eng. 2021, 13, 275–288. [Google Scholar] [CrossRef]
- Potyondy, D.O.; Cundall, P.A. A bonded-particle model for rock. Int. J. Rock Mech. Min. Sci. 2004, 41, 1329–1364. [Google Scholar] [CrossRef]
- Cai, M.; Kaiser, P.K.; Morioka, H.; Minami, M.; Maejima, T.; Tasaka, Y.; Kurose, H. FLAC/PFC coupled numerical simulation of AE in large-scale underground excavations. Int. J. Rock Mech. Min. Sci. 2007, 44, 550–564. [Google Scholar] [CrossRef]
- Saiang, D. Stability analysis of the blast-induced damage zone by continuum and coupled continuum–discontinuum methods. Eng. Geol. 2010, 116, 1–11. [Google Scholar] [CrossRef]
- Zhang, F.; Dontsov, E.; Mack, M. Fully coupled simulation of a hydraulic fracture interacting with natural fractures with a hybrid discrete-continuum method. Int. J. Numer. Anal. Methods Geomech. 2017, 41, 1430–1452. [Google Scholar] [CrossRef]
- Babcock, C.O. Equations for the analysis of Borehole Pressure Cell data. In Proceedings of the 27th U.S. Symposium on Rock Mechanics (USRMS), Tuscaloosa, Alabama, 23–25 June 1986. [Google Scholar]
- Westman, E.; Luxbacher, K.; Schafrik, S. Passive seismic tomography for three-dimensional time-lapse imaging of mining-induced rock mass changes. Lead. Edge 2012, 31, 338–345. [Google Scholar] [CrossRef]
- Ezersky, M.; Eppelbaum, L. Geophysical monitoring of underground constructions and its theoretical basis. Int. J. Georesources Environ. 2017, 3, 56–72. [Google Scholar] [CrossRef][Green Version]
- Barczak, T.M. Longwall tailgates: The technology for roof support has improved but optimization is still not there. In Proceedings of the Longwall USA, International Exhibition and Conference, Pittsburgh, PA, USA, 3–5 June 2003; pp. 105–130. [Google Scholar]
- Peng, S.S.; Chiang, H.S. Longwall Mining; Wiley: New York, NY, USA, 1984. [Google Scholar]
- Itasca. FLAC3D Version 5.0: Theory and Background; Itasca Consulting Group: Minneapolis, MN, USA, 2016. [Google Scholar]
- Tulu, I.B.; Esterhuizen, G.S.; Mohamed, K.M.; Klemetti, T.M. Verification of a calibrated longwall model with field measurements. In Proceedings of the 51st US Rock Mechanics/Geomechanics Symposium, San Francisco, CA, USA, 25–28 June 2017. Paper No. 238. [Google Scholar]
- Li, W.; Bai, J.; Peng, S.; Wang, X.; Xu, Y. Numerical modeling for yield pillar design: A case study. Rock Mech. Rock Eng. 2015, 48, 305–318. [Google Scholar] [CrossRef]
- Heidbach, O.; Rajabi, M.; Reiter, K.; Ziegler, M. World Stress Map 2016. GFZ Data Service. 2016. Available online: https://dataservices.gfz-potsdam.de/wsm/showshort.php?id=escidoc:1680899 (accessed on 1 August 2023).
- Mark, C. Horizontal stress and its effects on longwall ground control. Min. Eng. 1991, 43, 1356–1360. [Google Scholar]
- Diederichs, M.S. The 2003 Canadian Geotechnical Colloquium: Mechanistic interpretation and practical application of damage and spalling prediction criteria for deep tunnelling. Can. Geotech. J. 2007, 44, 1082–1116. [Google Scholar] [CrossRef]
- Sinha, S.; Walton, G.; Kim, B.H. Difficulties in determining the Crack Initiation (CI) thresholds for three different rock types. In Proceedings of the 54th US Rock Mechanics/Geomechanics Symposium, Golden, CO, USA, 28 June–1 July 2020. Paper No. 1074. [Google Scholar]
- Mark, C.; Iannacchione, A.T. Coal pillar mechanics: Theoretical models and field measurements compared. In Proceedings of the Workshop on Coal Pillar Mechanics and Design, Pittsburgh, PA, USA, 7 June 1992. [Google Scholar]
- Das, M.N. Influence of width/height ratio on post-failure behaviour of coal. Int. J. Min. Geol. Eng. 1986, 4, 79–87. [Google Scholar] [CrossRef]
- Dolinar, D.R.; Esterhuizen, G.S. Evaluation of the effect of length on the strength of slender pillars in limestone mines using numerical modeling. In Proceedings of the 26th International Conference on Ground Control in Mining, Morgantown, WV, USA, 31 July–2 August 2007; pp. 304–313. [Google Scholar]
- Sinha, S.; Walton, G. Numerical analyses of pillar behaviors with variation in yield criterion, dilatancy, rock heterogeneity and length to width ratio. J. Rock Mech. Geotech. Eng. 2019, 11, 46–60. [Google Scholar] [CrossRef]
- Pappas, D.M.; Mark, C. Behavior of Simulated Gob Material; U.S. Bureau of Mines: Pittsburgh, PA, USA, 1993; RI 9458. [Google Scholar]
- Abbasi, B.; Chugh, Y.P.; Gurley, H. An analysis of the possible fault displacements associated with a retreating longwall face in Illinois. In Proceedings of the 48th U.S. Rock Mechanics/Geomechanics Symposium, Minneapolis, MN, USA, 1–4 June 2014. Paper No. 7632. [Google Scholar]
- Peng, S.S. Longwall Mining; CRC Press: Boca Raton, FL, USA, 2019. [Google Scholar]
- Su, D.W.H. Finite Element Modeling of Subsidence induced by underground coal mining: The influence of material nonlinearity and shearing along existing planes of weakness. In Proceedings of the 10th International Conference on Ground Control in Mining, Morgantown, WV, USA, 10–12 June 1991; pp. 287–300. [Google Scholar]
- Vermeer, P.A.; De Borst, R. Non-associated plasticity for soils, concrete and rock. Heron 1984, 29. [Google Scholar] [CrossRef]
- Zhao, X.G.; Cai, M.; Cai, M. Considerations of rock dilation on modeling failure and deformation of hard rocks—A case study of the mine-by test tunnel in Canada. J. Rock Mech. Geotech. Eng. 2010, 2, 338–349. [Google Scholar]
- Corkum, A.G.; Lorig, L.J.; DeGagne, D.O. Continuum representation of brittle rock failure bulking-induced displacements around tunnels. In Proceedings of the 46th US Rock Mechanics/ Geomechanics Symposium, Chicago, IL, USA, 24–27 June 2012. Paper No. 176. [Google Scholar]
- Klemetti, T.M.; Van Dyke, M.A.; Compton, C.S.; Tulu, I.B.; Tuncay, D.; Wickline, J. Longwall gateroad yield pillar response and model verification–A case study. In Proceedings of the 53rd US Rock Mechanics/Geomechanics Symposium, New York, NY, USA, 23–26 June 2019. Paper No. 1553. [Google Scholar]
- Feng, G.; Wang, P.; Chugh, Y.P. Stability of gate roads next to an irregular yield pillar: A case study. Rock Mech. Rock Eng. 2019, 52, 2741–2760. [Google Scholar] [CrossRef]
- Basarir, H.; Sun, Y.; Li, G. Gateway stability analysis by global-local modeling approach. Int. J. Rock Mech. Min. Sci. 2019, 113, 31–40. [Google Scholar] [CrossRef]
- Klemetti, T.M.; Van Dyke, M.A.; Tulu, I.B.; Tuncay, D. A case study of the stability of a non-typical bleeder entry system at a US longwall mine. Int. J. Min. Sci. Technol. 2020, 30, 25–31. [Google Scholar] [CrossRef]
- Kim, B. (National Institute for Occupational Safety and Health, Spokane, Washington, United States). Personal Communication, 2020.
- Bouzeran, L.; Furtney, J.; Pierce, M.; Hazzard, J.; Lemos, J.V. Simulation of ground support performance in highly fractured and bulked rock masses with advanced 3DEC bolt model. In Proceedings of the Eighth International Conference on Deep and High Stress Mining, Perth, Australia, 28–30 March 2017; pp. 667–680. [Google Scholar]
- Sinha, S. Advancing Continuum and Discontinuum Models of Brittle Rock Damage and Rock-Support Interaction. Ph.D. Thesis, Colorado School of Mines, Golden, CO, USA, 2020. [Google Scholar]
- Galvin, J.M. Ground Engineering-Principles and Practices for Underground Coal Mining; Springer: Berlin/Heidelberg, Germany, 2016. [Google Scholar]
- Gao, F.; Stead, D.; Kang, H. Simulation of roof shear failure in coal mine roadways using an innovative UDEC Trigon approach. Comput. Geotech. 2014, 61, 33–41. [Google Scholar] [CrossRef]
- Gao, F.; Stead, D.; Kang, H. Numerical simulation of squeezing failure in a coal mine roadway due to mining-induced stresses. Rock Mech. Rock Eng. 2015, 48, 1635–1645. [Google Scholar] [CrossRef]
- Kang, H.P.; Lin, J.; Fan, M.J. Investigation on support pattern of a coal roadway within soft rocks—A case study. Int. J. Coal Geol. 2015, 140, 31–40. [Google Scholar] [CrossRef]
- Wu, W.D.; Bai, J.B.; Wang, X.Y.; Yan, S.; Wu, S.X. Numerical study of failure mechanisms and control techniques for a gob-side yield pillar in the Sijiazhuang coal mine, China. Rock Mech. Rock Eng. 2019, 52, 1231–1245. [Google Scholar] [CrossRef]
- Mohamed, K.; Van Dyke, M.; Rashed, G.; Sears, M.M.; Kimutis, R. Preliminary rib support requirements for solid coal ribs using a coal pillar rib rating (CPRR). Int. J. Min. Sci. Technol. 2021, 31, 15–22. [Google Scholar] [CrossRef]


Disclaimer/Publisher’s Note: The statements, opinions and data contained in all publications are solely those of the individual author(s) and contributor(s) and not of MDPI and/or the editor(s). MDPI and/or the editor(s) disclaim responsibility for any injury to people or property resulting from any ideas, methods, instructions or products referred to in the content. |
© 2023 by the authors. Licensee MDPI, Basel, Switzerland. This article is an open access article distributed under the terms and conditions of the Creative Commons Attribution (CC BY) license (https://creativecommons.org/licenses/by/4.0/).