
A Chlorophyll Biomass Time-Series for the Distributed Biological Observatory in the Context of Seasonal Sea Ice Declines in the Pacific Arctic Region


Abstract
:1. Introduction
2. Materials and Methods
3. Results
3.1. DBO 1
3.2. DBO 2
3.3. DBO 3
3.4. DBO 4
3.5. DBO 5
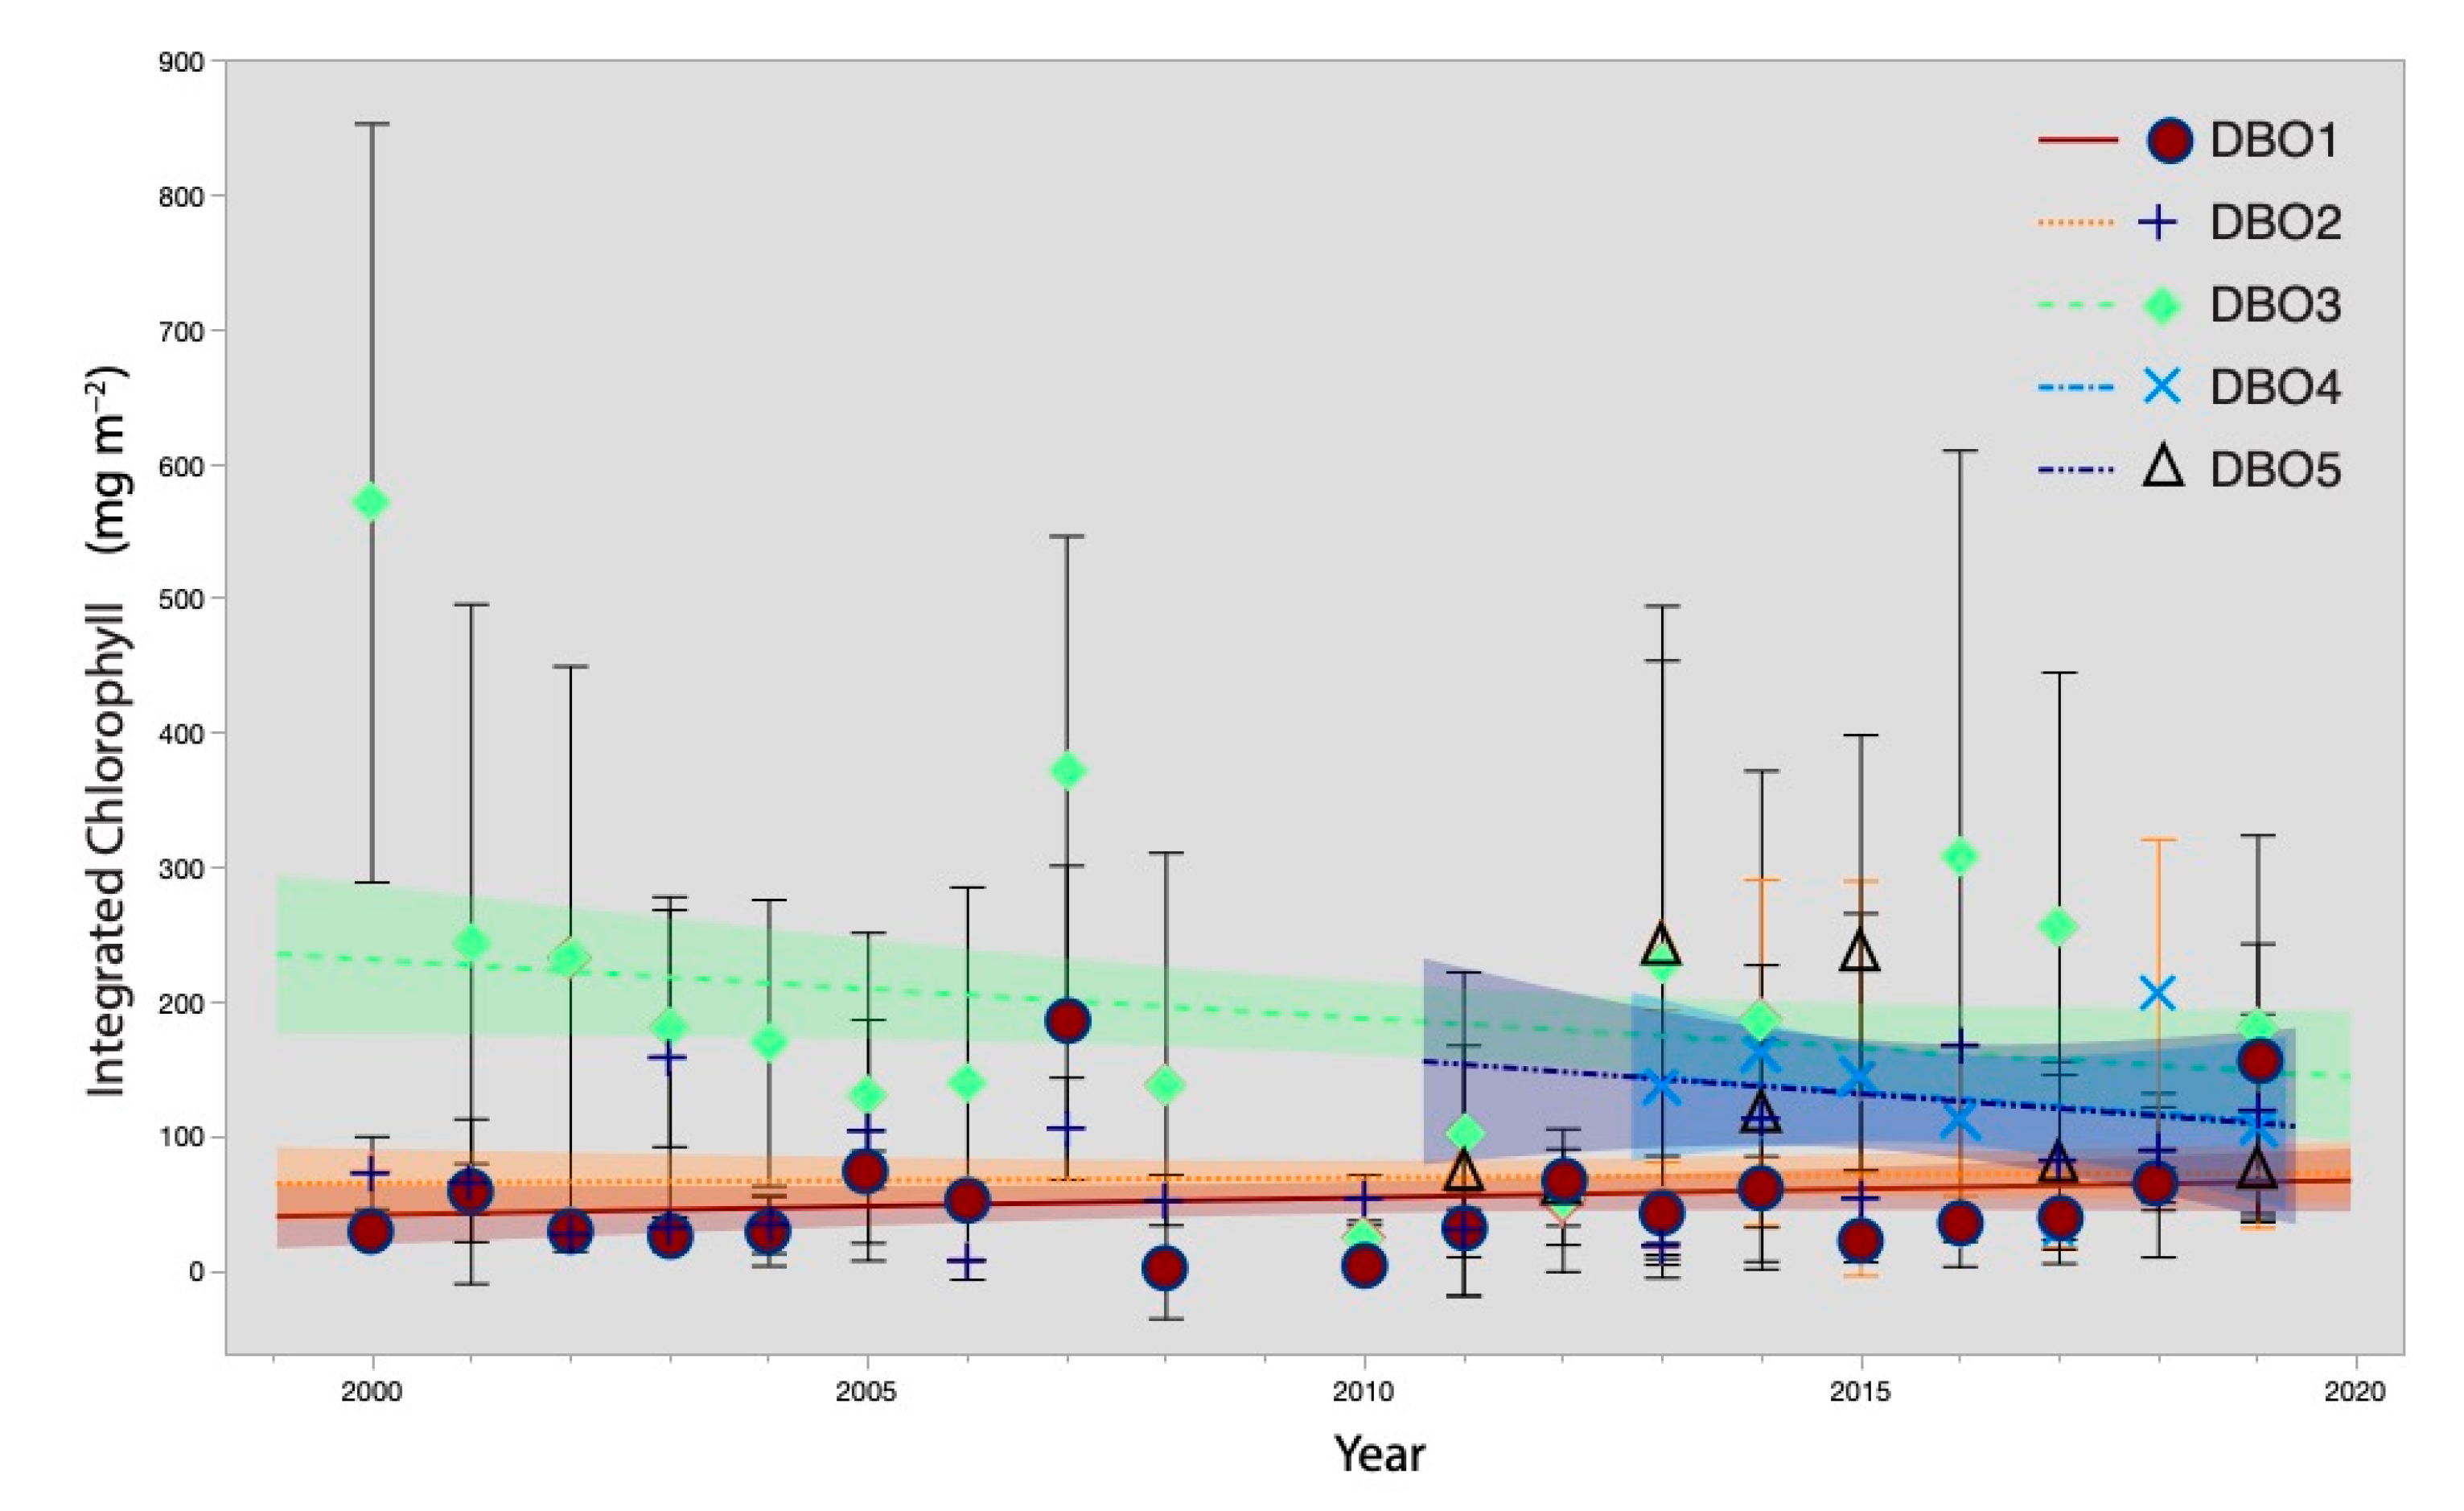
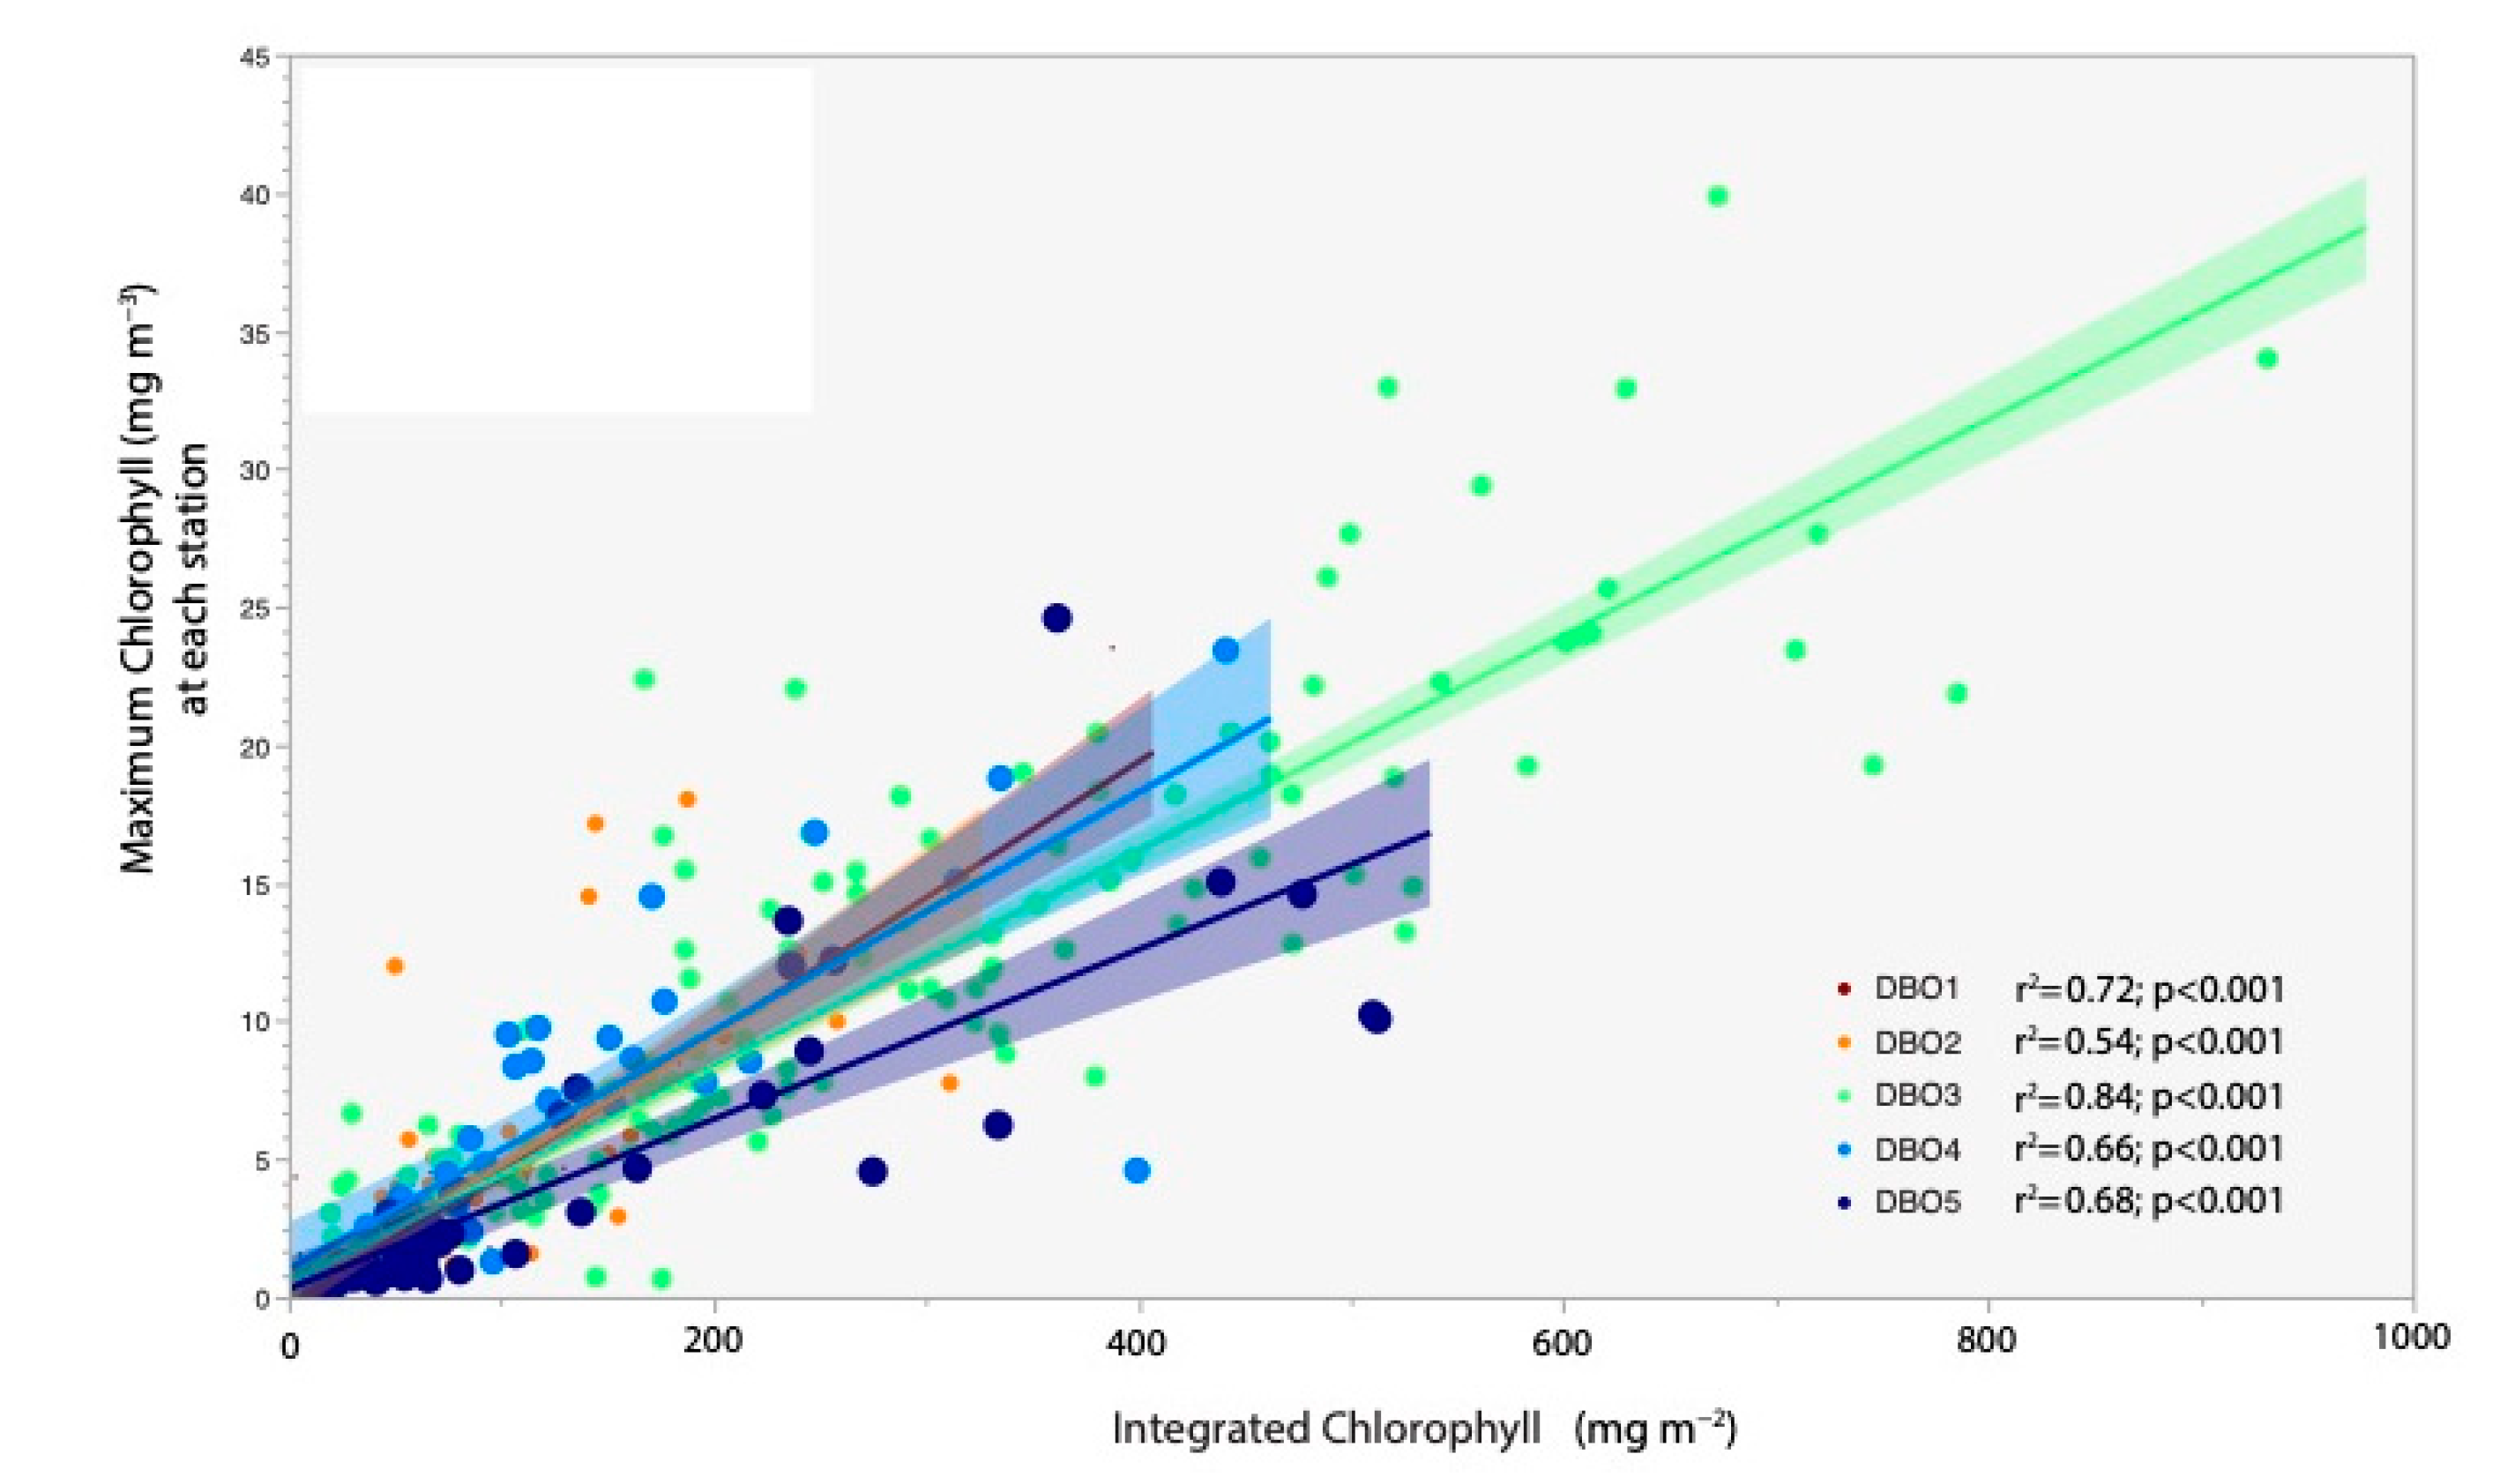
3.6. Time-Series Synthesis of All DBO Stations Sampled
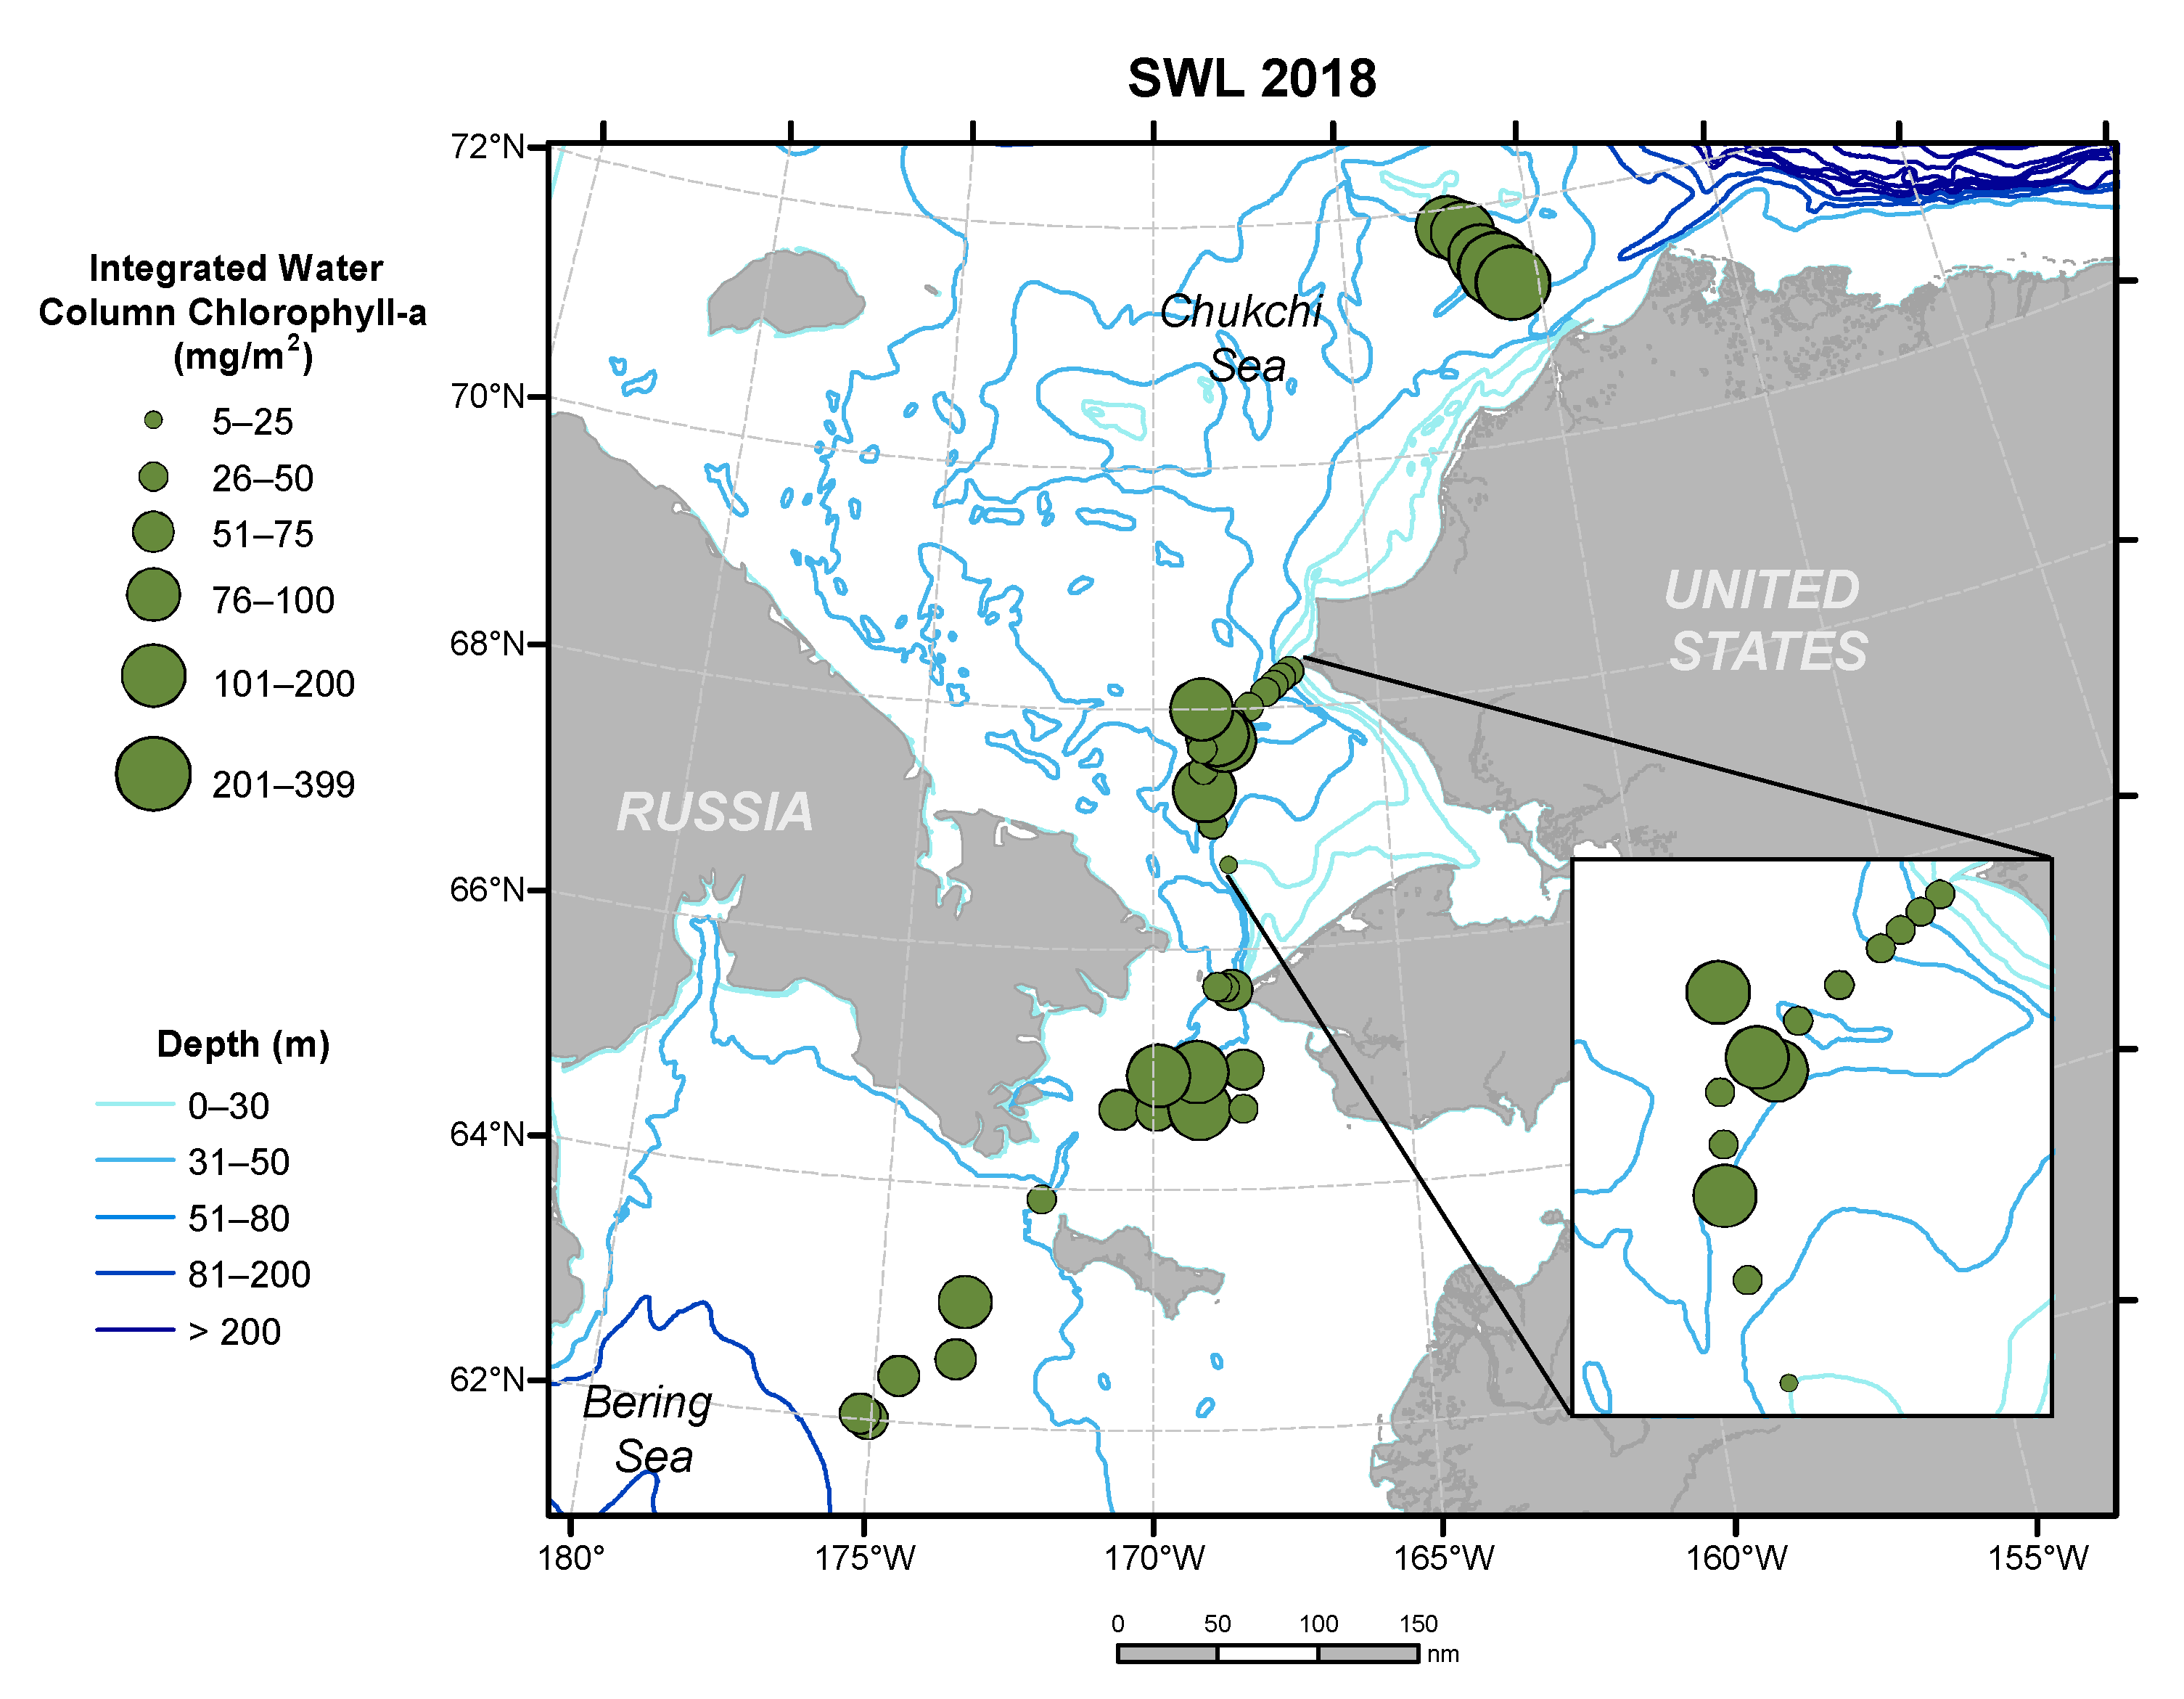
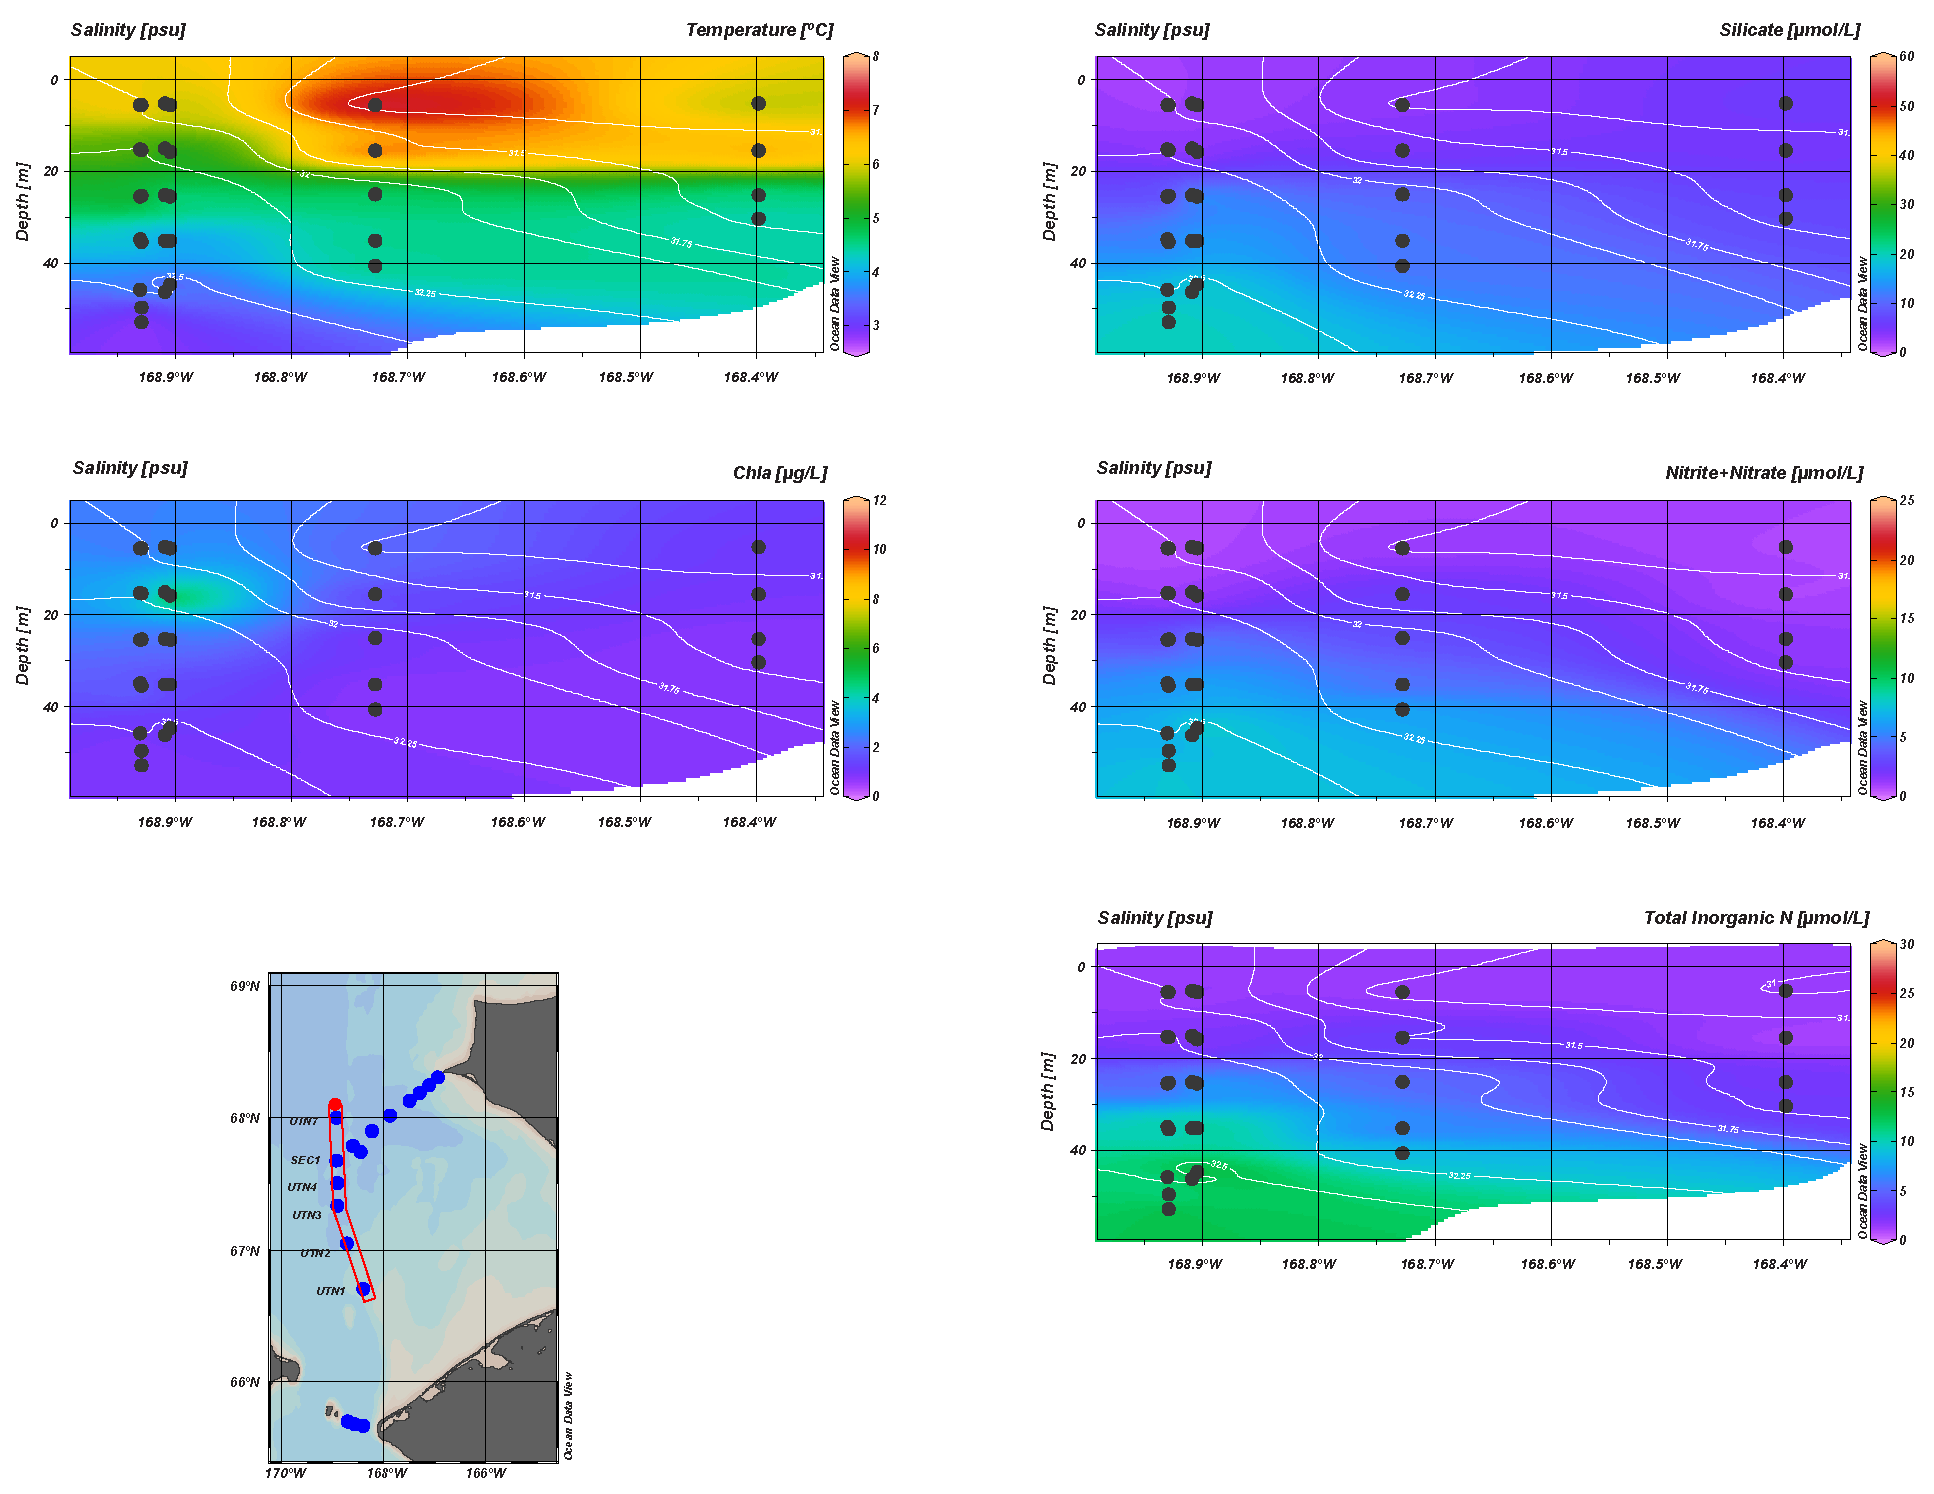
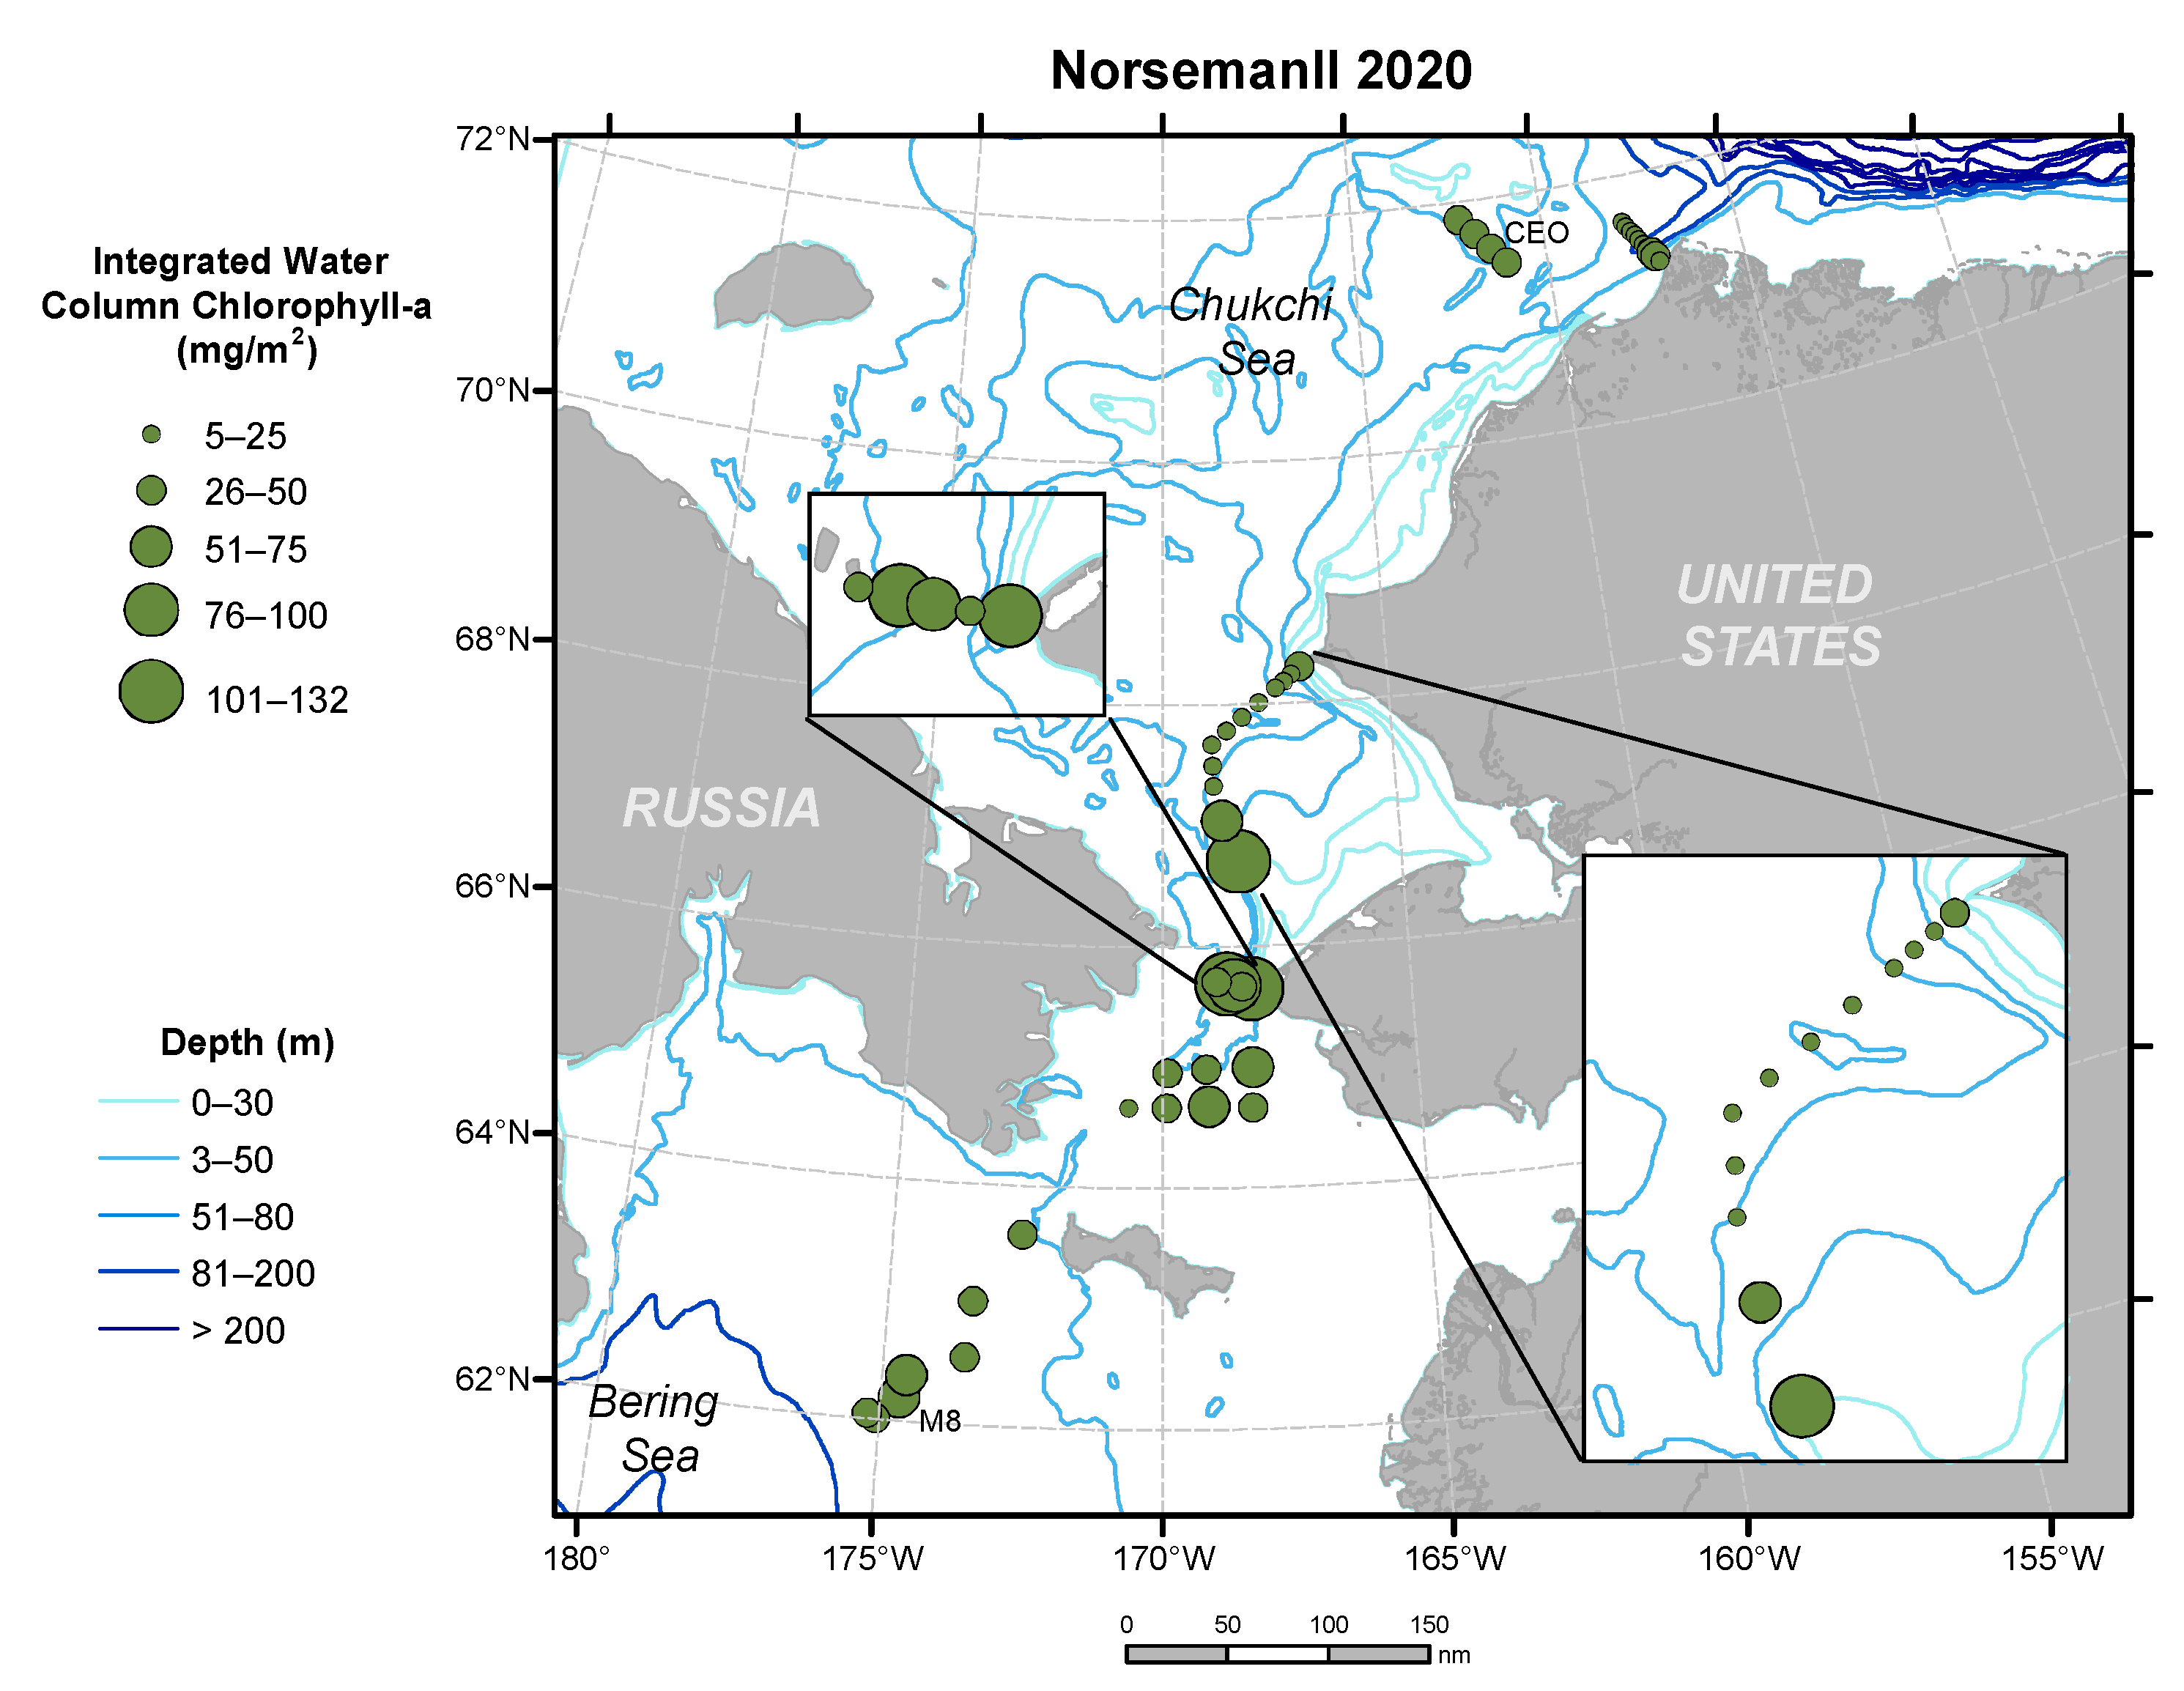
3.7. Chlorophyll-a Concentrations from October 2020 Cruise
4. Discussion
Author Contributions
Funding
Data Availability Statement
Acknowledgments
Conflicts of Interest
References
- Arrigo, K.R.; van Dijken, G.; Pabi, S. Impact of a shrinking arctic ice cover on marine primary production. Geophys. Res. Lett. 2008, 35, L19603. [Google Scholar] [CrossRef]
- Slagstad, D.; Wassmann, P.F.J.; Ellingsen, I. Physical constrains and productivity in the future arctic ocean. Front. Mar. Sci. 2015, 2, 85. [Google Scholar] [CrossRef]
- Ardyna, M.; Arrigo, K.R. Phytoplankton dynamics in a changing arctic ocean. Nat. Clim. Chang. 2020, 10, 892–903. [Google Scholar] [CrossRef]
- Ardyna, M.; Babin, M.; Gosselin, M.; Devred, E.; Rainville, L.; Tremblay, J.-É. Recent Arctic Ocean sea ice loss triggers novel fall phytoplankton blooms. Geophys. Res. Lett. 2014, 41, 6207–6212. [Google Scholar] [CrossRef]
- Fernández-Méndez, M.; Katlein, C.; Rabe, B.; Nicolaus, M.; Peeken, I.; Bakker, K.; Flores, H.; Boetius, A. Photosynthetic production in the Central Arctic Ocean during the record sea-ice minimum in 2012. Biogeosciences 2015, 12, 3525–3549. [Google Scholar] [CrossRef]
- Brown, Z.W.; Lowry, K.E.; Palmer, M.A.; van Dijken, G.L.; Mills, M.M.; Pickart, R.S.; Arrigo, K.R. Characterizing the subsurface chlorophyll a maximum in the Chukchi Sea and Canada Basin. Deep. Sea Res. Part II Top. Stud. Oceanogr. 2015, 118, 88–104. [Google Scholar] [CrossRef]
- Waga, H.; Hirawake, T. Changing occurrences of fall blooms associated with variations in phytoplankton size structure in the pacific arctic. Front. Mar. Sci. 2020, 7, 209. [Google Scholar] [CrossRef]
- Moore, S.E.; Grebmeier, J.M. The Distributed Biological Observatory: Linking physics to biology in the Pacific Arctic Region. Arctic 2018, 71, 1–7. [Google Scholar] [CrossRef]
- Grebmeier, J.M.; Moore, S.E.; Cooper, L.W.; Frey, K.E. The Distributed Biological Observatory: A change detection array in the pacific arctic—An introduction. Deep. Sea Res. Part II Top. Stud. Oceanogr. 2019, 162, 1–7. [Google Scholar] [CrossRef]
- Giesbrecht, K.E.; Varela, D.E.; Wiktor, J.; Grebmeier, J.M.; Kelly, B.; Long, J.E. A decade of summertime measurements of phytoplankton biomass, productivity and assemblage composition in the Pacific Arctic Region from 2006 to 2016. Deep. Sea Res. Part II Top. Stud. Oceanogr. 2019, 162, 93–113. [Google Scholar] [CrossRef]
- Frey, K.E.; Kinney, J.C.; Stock, L.V.; Osinski, R. Observations of declining primary production in the western Bering Strait. Oceanography 2022, 35. [Google Scholar] [CrossRef]
- Cooper, L.W.; Grebmeier, J.M.; Larsen, I.L.; Egorov, V.G.; Theodorakis, C.; Kelly, H.P.; Lovvorn, J.R. Seasonal variation in sedimentation of organic materials in the St. Lawrence island polynya region, Bering sea. Mar. Ecol. Prog. Ser. 2002, 226, 13–26. [Google Scholar] [CrossRef]
- Cooper, L.W.; Janout, M.A.; Frey, K.E.; Pirtle-Levy, R.; Guarinello, M.L.; Grebmeier, J.M.; Lovvorn, J.R. The relationship between sea ice break-up, water mass variation, chlorophyll biomass, and sedimentation in the northern Bering Sea. Deep. Sea Res. Part II Top. Stud. Oceanogr. 2012, 65–70, 141–162. [Google Scholar] [CrossRef]
- Grebmeier, J.M.; Bluhm, B.A.; Cooper, L.W.; Danielson, S.L.; Arrigo, K.R.; Blanchard, A.L.; Clarke, J.T.; Day, R.H.; Frey, K.E.; Gradinger, R.R.; et al. Ecosystem characteristics and processes facilitating persistent macrobenthic biomass hotspots and associated benthivory in the Pacific Arctic. Prog. Oceanogr. 2015, 136, 92–114. [Google Scholar] [CrossRef]
- Cooper, L.; Whitledge, T.E.; Grebmeier, J.; Weingartner, T. The nutrient, salinity, and stable oxygen isotope composition of Bering and Chukchi Seas waters in and near the Bering Strait. J. Geophys. Res. Earth Surf. 1997, 102, 12563–12573. [Google Scholar] [CrossRef]
- Frey, K.E.; Comiso, J.C.; Stock, L.V.; Young, L.N.C.; Cooper, L.W.; Grebmeier, J.M. A comprehensive satellite-based assessment across the Pacific Arctic Distributed Biological Observatory shows widespread late-season sea surface warming and sea ice declines with variable influences on primary productivity. PLoS ONE, 2022; in review. [Google Scholar]
- Welschmeyer, N.A. Fluorometric analysis of chlorophyll a in the presence of chlorophyll b and pheopigments. Limnol. Oceanogr. 1994, 39, 1985–1992. [Google Scholar] [CrossRef]
- Schlitzer, R. Data Analysis and Visualization with Ocean Data View. 2021. Available online: https://epic.awi.de/id/eprint/37570/ (accessed on 8 August 2022).
- Lewis, K.M.; van Dijken, G.L.; Arrigo, K.R. Changes in phytoplankton concentration now drive increased Arctic Ocean primary production. Science 2020, 369, 198. [Google Scholar] [CrossRef] [PubMed]
- Woodgate, R.A. Increases in the Pacific inflow to the Arctic from 1990 to 2015, and insights into seasonal trends and driving mechanisms from year-round Bering Strait mooring data. Prog. Oceanogr. 2018, 160, 124–154. [Google Scholar] [CrossRef]
- Cooper, L.; Magen, C.; Grebmeier, J. Changes in the oxygen isotope composition of the Bering Sea contribution to the Arctic Ocean are an independent measure of increasing freshwater fluxes through the Bering Strait. PLoS ONE 2022, in press.


| Year | Station | DBO 1 Maximum Chlorophyll (mg m−3) | Depth of Maximum Chlorophyll (m) | Integrated Chlorophyll (mg m−2) over Water Column |
|---|---|---|---|---|
| 2019 | SLIP1 | 2.34 | 25.7 | 78.6 |
| SLIP2 | 2.95 | 35.6 | 113.5 | |
| SLIP3 | 3.30 | 25.7 | 109.0 | |
| SLIP5 | 9.44 | 25.9 | 296.6 | |
| SLIP4 | 8.52 | 26.0 | 183.4 | |
| 2018 | SLIP1 | 2.37 | 25.2 | 58.1 |
| SLIP2 | 3.33 | 25.3 | 74.7 | |
| SLIP3 | 1.30 | 50.1 | 58.0 | |
| SLIP5 | 1.18 | 25.2 | 50.1 | |
| SLIP4 | 2.16 | 24.8 | 81.6 | |
| 2017 | SLIP1 | 0.66 | 49.8 | 28.6 |
| SLIP2 | 1.71 | 49.3 | 45.7 | |
| SLIP3 | 0.72 | 35.0 | 22.7 | |
| SLIP5 | 1.33 | 35.3 | 32.2 | |
| SLIP4 | 2.06 | 35.3 | 52.4 | |
| 2016 | SLIP1 | 1.22 | 35.5 | 32.7 |
| SLIP2 | 1.49 | 35.4 | 38.4 | |
| SLIP3 | 1.24 | 67.0 | 37.7 | |
| SLIP5 | 1.10 | 35.6 | 34.7 | |
| SLIP4 | 1.11 | 67.5 | 35.5 | |
| 2015 | SLIP1 | 0.54 | 35.9 | 27.2 |
| SLIP2 | 0.90 | 34.9 | 33.4 | |
| SLIP3 | 0.46 | 25.2 | 18.1 | |
| SLIP5 | 0.39 | 60.7 | 12.1 | |
| SLIP4 | 0.53 | 68.0 | 13.7 | |
| 2014 | SLIP1 | 0.96 | 50.1 | 39.6 |
| SLIP2 | 1.09 | 50.1 | 44.7 | |
| SLIP3 | 1.01 | 34.4 | 37.1 | |
| SLIP5 | 1.84 | 50.3 | 94.0 | |
| SLIP4 | 5.76 | 25.2 | 81.3 | |
| 2013 | SLIP1 | 0.96 | 51.8 | 37.2 |
| SLIP2 | 1.23 | 34.4 | 31.6 | |
| SLIP3 | 0.43 | 67.8 | 12.1 | |
| SLIP5 | 1.79 | 35.5 | 45.3 | |
| SLIP4 | 1.79 | 14.6 | 112.6 | |
| 2012 | SLIP1 | 2.91 | 35.5 | 54.9 |
| SLIP2 | 3.73 | 24.4 | 82. 9 | |
| SLIP3 | 2.34 | 35.0 | 68.9 | |
| SLIP5 | 0.68 | 34.7 | 17.7 | |
| SLIP4 | 4.92 | 35.2 | 89.2 | |
| 2011 | SLIP1 | 3.69 | 34.3 | 62.7 |
| SLIP2 | 5.84 | 5.8 | 58.3 | |
| SLIP3 | 0.84 | 25.3 | 20.8 | |
| SLIP5 | 0.42 | 59.8 | 14.0 | |
| SLIP4 | 0.44 | 34.9 | 17.7 | |
| 2010 | SLIP1 | 0.14 | 51.1 | 4.7 |
| SLIP2 | 0.07 | 78.5 | 2.7 | |
| SLIP3 | 0.20 | 24.68 | 4.6 | |
| SLIP5 | 0.10 | 61.2 | 2.6 | |
| SLIP4 | 0.08 | 67.3 | 3.1 | |
| 2008 | SLIP1 | 1.58 | 26.1 | 4.7 |
| SLIP2 | 1.01 | 41.0 | 2.7 | |
| SLIP3 | 1.26 | 41.0 | 4.7 | |
| SLIP5 | 4.40 | 26.0 | 2.6 | |
| SLIP4 | 0.63 | 51.2 | 3.1 | |
| 2007 | SLIP1 | 17.36 | 39.5 | 144.0 |
| SLIP2 | 23.56 | 29.5 | 387.1 | |
| SLIP3 | 5.80 | 30.8 | 172.8 | |
| SLIP5 | 4.72 | 30.6 | 128.9 | |
| SLIP4 | 5.08 | 36.4 | 92.2 | |
| 2006 | SLIP1 | 1.29 | 50.3 | 53.1 |
| SLIP2 | ||||
| SLIP3 | 1.33 | 50.6 | 44.0 | |
| SLIP5 | ||||
| SLIP4 | 6.48 | 40.6 | 67.7 | |
| 2005 | SLIP1 | 2.43 | 41.1 | 55.4 |
| SLIP2 | 2.10 | 41.4 | 8.6 | |
| SLIP3 | 2.36 | 41.2 | 4.0 | |
| SLIP5 | 2.39 | 30.7 | 59.7 | |
| SLIP4 | 2.81 | 31.1 | ||
| 2004 | SLIP1 | 0.62 | 70.5 | 23.6 |
| SLIP2 | 3.17 | 40.7 | 55.4 | |
| SLIP3 | 0.20 | 69.6 | 8.6 | |
| SLIP5 | 0.18 | 49.0 | 4.0 | |
| SLIP4 | 2.40 | 40.5 | 59.7 | |
| 2003 | SLIP1 | 0.94 | 39.4 | 21.6 |
| SLIP2 | 0.24 | 2.4 | 8.9 | |
| SLIP3 | 2.07 | 34.9 | 40.4 | |
| SLIP5 | 1.34 | 31.8 | 33.9 | |
| SLIP4 | 2.10 | 31.4 | 33.9 | |
| 2002 | SLIP1 | 0.59 | 51.8 | 26.1 |
| SLIP2 | 0.44 | 51.0 | 18.9 | |
| SLIP3 | 1.90 | 32.2 | 37.1 | |
| SLIP5 | 4.60 | 36.2 | 53.4 | |
| SLIP4 | 0.90 | 31.4 | 27.6 | |
| 2001 | SLIP1 | 2.75 | 31.1 | 46.9 |
| SLIP2 | 5.08 | 24.9 | 91.5 | |
| SLIP3 | 4.56 | 23.5 | 66.4 | |
| SLIP5 | 2.21 | 26.0 | 45.3 | |
| SLIP4 | 4.12 | 22.8 | 57.3 | |
| 2000 | SLIP1 | 1.06 | 25.0 | 37.7 |
| SLIP2 | 1.07 | 25.0 | 37.8 | |
| SLIP3 | 0.90 | 25.6 | 40.8 | |
| SLIP5 | 0.45 | 60.0 | 22.5 | |
| SLIP4 | 0.51 | 25.0 | 21.0 |
| Year | Station | DBO 1 Maximum Chlorophyll mg m−3) | Depth of Maximum Chlorophyll (m) | Integrated Chlorophyll (mg m−2) |
|---|---|---|---|---|
| 2019 | BCL6a | 2.59 | 34.5 | 86.8 |
| BCL-6c/DBO 2.0 | 2.38 | 43.1 | 78.2 | |
| UTBS-5/DBO 2.1 | 2.67 | 4.9 | 82.4 | |
| UTBS-2/DBO 2.2 | 3.25 | 5.7 | 76.7 | |
| UTBS-2a/DBO 2.3 | 2.85 | 6 | 65.7 | |
| UTBS-1/DBO 2.5 | 10.04 | 4.5 | 257.5 | |
| UTBS-4/DBO 2.4 | 17.2 | 4.7 | 143.8 | |
| DBO 2.7 | ||||
| 2018 | BCL6a | 0.92 | 25.4 | 29.2 |
| BCL-6c/DBO 2.0 | 3.42 | 4.9 | 59.6 | |
| UTBS-5/DBO 2.1 | 1.78 | 41.7 | 60.5 | |
| UTBS-2/DBO 2.2 | 6.88 | 5.1 | 141.5 | |
| UTBS-2a/DBO 2.3 | 1.94 | 24.5 | 46.1 | |
| UTBS-1/DBO 2.5 | 6.20 | 5.4 | 136.9 | |
| UTBS-4/DBO 2.4 | 6.10 | 5.4 | 126.9 | |
| DBO 2.7 | 1.10 | 1.1 | 52.4 | |
| 2017 | BCL6a | 0.90 | 24.9 | 34.7 |
| BCL-6c/DBO 2.0 | 0.97 | 5.3 | 26.3 | |
| UTBS-5/DBO 2.1 | 3.68 | 5.3 | 43.4 | |
| UTBS-2/DBO 2.2 | 5.12 | 15.3 | 67.7 | |
| UTBS-2a/DBO 2.3 | 4.80 | 33.4 | 110.7 | |
| UTBS-1/DBO 2.5 | 2.01 | 5.4 | 34.2 | |
| UTBS-4/DBO 2.4 | 2.89 | 5.0 | 46.6 | |
| DBO 2.7 | 12.5 | 35.1 | 239.0 | |
| 2016 | BCL6a | 2.40 | 44.4 | 47.0 |
| BCL-6c/DBO 2.0 | 1.10 | 42.3 | 21.9 | |
| UTBS-5/DBO 2.1 | 0.77 | 14.7 | 25.0 | |
| UTBS-2/DBO 2.2 | 1.70 | 24.8 | 31.7 | |
| UTBS-2a/DBO 2.3 | 1.60 | 4.9 | 30.9 | |
| UTBS-1/DBO 2.5 | 0.90 | 24.9 | 24.7 | |
| UTBS-4/DBO 2.4 | 2.05 | 34.7 | 42.0 | |
| DBO 2.7 | 2.38 | 44.4 | 47.0 | |
| 2015 | BCL6a | |||
| BCL-6c/DBO 2.0 | 1.29 | 5.3 | 35.9 | |
| UTBS-5/DBO 2.1 | 4.20 | 14.9 | 85.16 | |
| UTBS-2/DBO 2.2 | ||||
| UTBS-2a/DBO 2.3 | 1.84 | 5.2 | 48.8 | |
| UTBS-1/DBO 2.5 | 2.1 | 14.9 | 43.5 | |
| UTBS-4/DBO 2.4 | ||||
| DBO 2.7 | ||||
| 2014 | BCL6a | 14.18 | 1.0 | 39.4 |
| BCL-6c/DBO 2.0 | ||||
| UTBS-5/DBO 2.1 | 0.99 | 42.1 | 34.1 | |
| UTBS-2/DBO 2.2 | 5.92 | 35.3 | 160.3 | |
| UTBS-2a/DBO 2.3 | 3.18 | 14.8 | ||
| UTBS-1/DBO 2.5 | 6.04 | 44.0 | 103.2 | |
| UTBS-4/DBO 2.4 | 2.97 | 4.6 | 154.5 | |
| DBO 2.7 | ||||
| 2013 | BCL6a | |||
| BCL-6c/DBO 2.0 | ||||
| UTBS-5/DBO 2.1 | 0.48 | 15.8 | 16.8 | |
| UTBS-2/DBO 2.2 | 0.59 | 34.9 | 17.4 | |
| UTBS-2a/DBO 2.3 | ||||
| UTBS-1/DBO 2.5 | 0.36 | 4.4 | 22.3 | |
| UTBS-4/DBO 2.4 | 0.74 | 15.6 | 11.8 | |
| DBO 2.7 | ||||
| 2012 | BCL6a | 0.79 | 49.2 | 22.9 |
| BCL-6c/DBO 2.0 | ||||
| UTBS-5/DBO 2.1 | 0.54 | 41.8 | 11.8 | |
| UTBS-2/DBO 2.2 | 3.64 | 40.5 | 82.3 | |
| UTBS-2a/DBO 2.3 | ||||
| UTBS-1/DBO 2.5 | 3.14 | 24.8 | 51.5 | |
| UTBS-4/DBO 2.4 | 1.858 | 35.1 | 49.85 | |
| DBO 2.7 | ||||
| 2011 | BCL6a | 1.04 | 35.0 | 38.3 |
| BCL-6c/DBO 2.0 | ||||
| UTBS-5/DBO 2.1 | 4.04 | 5.3 | 50.8 | |
| UTBS-2/DBO 2.2 | 1.14 | 15.2 | 31.6 | |
| UTBS-2a/DBO 2.3 | ||||
| UTBS-1/DBO 2.5 | 1.77 | 5.4 | 35.4 | |
| UTBS-4/DBO 2.4 | 1.29 | 15.5 | 23.8 | |
| DBO 2.7 | ||||
| 2010 | BCL6a | 0.77 | 50.4 | 22.6 |
| BCL-6c/DBO 2.0 | ||||
| UTBS-5/DBO 2.1 | 1.24 | 35.2 | 31.3 | |
| UTBS-2/DBO 2.2 | 3.09 | 4.4 | 49.23 | |
| UTBS-2a/DBO 2.3 | ||||
| UTBS-1/DBO 2.5 | 5.76 | 15.1 | 55.9 | |
| UTBS-4/DBO 2.4 | 2.09 | 45.0 | 76.8 | |
| DBO 2.7 | ||||
| 2008 | BCL6a | |||
| BCL-6c/DBO 2.0 | ||||
| UTBS-5/DBO 2.1 | 0.70 | 31.2 | 31.3 | |
| UTBS-2/DBO 2.2 | 49.2 | |||
| UTBS-2a/DBO 2.3 | ||||
| UTBS-1/DBO 2.5 | 2.12 | 6.5 | 55.9 | |
| UTBS-4/DBO 2.4 | 1.24 | 21.0 | 76.8 | |
| DBO 2.7 | ||||
| 2007 | BCL6a | |||
| BCL-6c/DBO 2.0 | ||||
| UTBS-5/DBO 2.1 | 2.15 | 30.0 | 81.9 | |
| UTBS-2/DBO 2.2 | 5.24 | 10.7 | 150.0 | |
| UTBS-2a/DBO 2.3 | 6.2 | 1.8 | ||
| UTBS-1/DBO 2.5 | 3.63 | 2.1 | 86.9 | |
| UTBS-4/DBO 2.4 | ||||
| DBO 2.7 | ||||
| 2006 | BCL6a | |||
| BCL-6c/DBO 2.0 | ||||
| UTBS-5/DBO 2.1 | 0.35 | 35.5 | 8.4 | |
| UTBS-2/DBO 2.2 | ||||
| UTBS-2a/DBO 2.3 | ||||
| UTBS-1/DBO 2.5 | ||||
| UTBS-4/DBO 2.4 | 0.34 | 5.1 | 8.7 | |
| DBO 2.7 | ||||
| 2005 | BCL6a | |||
| BCL-6c/DBO 2.0 | ||||
| UTBS-5/DBO 2.1 | 1.38 | 11.0 | 32.2 | |
| UTBS-2/DBO 2.2 | 1.78 | 10.8 | 40.1 | |
| UTBS-2a/DBO 2.3 | ||||
| UTBS-1/DBO 2.5 | 9.48 | 5.8 | 204.2 | |
| UTBS-4/DBO 2.4 | 14.56 | 10.6 | 140.6 | |
| DBO 2.7 | ||||
| 2004 | BCL6a | |||
| BCL-6c/DBO 2.0 | ||||
| UTBS-5/DBO 2.1 | 0.59 | 46.2 | 20.8 | |
| UTBS-2/DBO 2.2 | 4.12 | 5.8 | 65.9 | |
| UTBS-2a/DBO 2.3 | ||||
| UTBS-1/DBO 2.5 | 1.53 | 10.5 | 20.8 | |
| UTBS-4/DBO 2.4 | 0.80 | 6.0 | 32.1 | |
| DBO 2.7 | ||||
| 2003 | BCL6a | |||
| BCL-6c/DBO 2.0 | ||||
| UTBS-5/DBO 2.1 | 1.368 | 1.3 | 32.0 | |
| UTBS-2/DBO 2.2 | 9.64 | 15.6 | 108.8 | |
| UTBS-2a/DBO 2.3 | ||||
| UTBS-1/DBO 2.5 | 7.80 | 17.7 | 310.6 | |
| UTBS-4/DBO 2.4 | 18.08 | 21.4 | 187.1 | |
| DBO 2.7 | ||||
| 2002 | BCL6a | |||
| BCL-6c/DBO 2.0 | ||||
| UTBS-5/DBO 2.1 | 0.64 | 21.5 | 20.0 | |
| UTBS-2/DBO 2.2 | 0.92 | 5.9 | 27.4 | |
| UTBS-2a/DBO 2.3 | ||||
| UTBS-1/DBO 2.5 | 1.25 | 11.0 | 28.8 | |
| UTBS-4/DBO 2.4 | 0.84 | 15.2 | 33.8 | |
| DBO 2.7 | ||||
| 2001 | BCL6a | |||
| BCL-6c/DBO 2.0 | ||||
| UTBS-5/DBO 2.1 | 0.37 | 43.0 | 12.0 | |
| UTBS-2/DBO 2.2 | 4.32 | 3.6 | 100.6 | |
| UTBS-2a/DBO 2.3 | ||||
| UTBS-1/DBO 2.5 | 12.04 | 0.9 | 49.5 | |
| UTBS-4/DBO 2.4 | 4.48 | 5.8 | 109.1 | |
| DBO 2.7 | ||||
| 2000 | BCL6a | |||
| BCL-6c/DBO 2.0 | ||||
| UTBS-5/DBO 2.1 | 1.50 | 25.0 | 54.5 | |
| UTBS-2/DBO 2.2 | 1.91 | 25.0 | 64.85 | |
| UTBS-2a/DBO 2.3 | ||||
| UTBS-1/DBO 2.5 | 1.63 | 35 | 113.3 | |
| UTBS-4/DBO 2.4 | 3.18 | 25.3 | 61.1 | |
| DBO 2.7 |
| Year | Station | DBO 3 Maximum Chlorophyll (mg m−3) | Depth of Maximum Chlorophyll (m) | Integrated Chlorophyll (mg m−2) over Water Column |
|---|---|---|---|---|
| 2019 | UTN-1 | 2.59 | 34.5 | 86.8 |
| UTN-2 | 2.38 | 43.1 | 78.2 | |
| UTN-3 | 2.67 | 4.9 | 82.4 | |
| UTN-4 | 3.25 | 5.7 | 76.7 | |
| UTN-6 | 2.85 | 6.0 | 65.7 | |
| SEC-8/DBO 3.1 | 1.87 | 15.7 | 40.7 | |
| SEC-7/DBO 3.2 | 1.47 | 15.5 | 50.2 | |
| SEC-6/DBO 3.3 | 1.07 | 5.8 | 38.5 | |
| SEC-5/DBO 3.4 | 1.71 | 25.3 | 61.9 | |
| SEC-4/DBO 3.5 | 12.6 | 15.3 | 234.7 | |
| SEC-3/DBO 3.6 | 3.58 | 33.7 | 119.8 | |
| SEC-2/DBO 3.7 | 3.18 | 46.8 | 108.6 | |
| SEC-1/DBO 3.8 | 5.68 | 35.5 | 220.2 | |
| UTN-7 | 6.24 | 53.7 | 181.3 | |
| 2018 | UTN-1 | 1.16 | 5.1 | 23.5 |
| UTN-2 | 1.97 | 5.4 | 35.5 | |
| UTN-3 | 11.6 | 15.6 | 188.2 | |
| UTN-4 | 1.62 | 15 | 40.2 | |
| UTN-6 | 7.60 | 15.6 | 150.3 | |
| SEC-8/DBO 3.1 | 1.64 | 5.6 | 30.6 | |
| SEC-7/DBO 3.2 | 1.20 | 15.3 | 32.0 | |
| SEC-6/DBO 3.3 | 1.43 | 15.2 | 35.2 | |
| SEC-5/DBO 3.4 | 0.99 | 5.4 | 28.5 | |
| SEC-4/DBO 3.5 | 1.34 | 15.3 | 45.2 | |
| SEC-3/DBO 3.6 | 1.53 | 16.5 | 36.6 | |
| SEC-2/DBO 3.7 | 4.16 | 25.3 | 106.4 | |
| SEC-1/DBO 3.8 | 1.11 | 5.4 | 34.0 | |
| UTN-7 | 3.78 | 15.4 | 145.9 | |
| 2017 | UTN-1 | 5.04 | 29.4 | 75.9 |
| UTN-2 | 7.44 | 4.8 | 167.3 | |
| UTN-3 | 12.64 | 5.2 | 364.7 | |
| UTN-4 | 10.76 | 25.2 | 206.5 | |
| UTN-6 | 18.12 | 25.3 | 479.0 | |
| SEC-8/DBO 3.1 | 1.40 | 24.7 | 28.9 | |
| SEC-7/DBO 3.2 | 1.53 | 25.0 | 43.4 | |
| SEC-6/DBO 3.3 | 1.38 | 43.2 | 49.1 | |
| SEC-5/DBO 3.4 | 2.21 | 45.3 | 61.5 | |
| SEC-4/DBO 3.5 | 22.34 | 45.9 | 541.6 | |
| SEC-3/DBO 3.6 | 20.48 | 25.3 | 442.7 | |
| SEC-2/DBO 3.7 | 15.08 | 15.3 | 251.0 | |
| SEC-1/DBO 3.8 | 8.04 | 34.7 | 379.0 | |
| UTN-7 | 26.12 | 25.2 | 488.3 | |
| 2016 | UTN-1 | 1.28 | 24.9 | 26.7 |
| UTN-2 | 6.44 | 4.5 | 164.4 | |
| UTN-3 | 24.08 | 14.6 | 612.9 | |
| UTN-4 | 34.04 | 25.5 | 930.8 | |
| UTN-6 | 39.92 | 14.5 | 672.1 | |
| SEC-8/DBO 3.1 | 6.70 | 30.7 | 29.1 | |
| SEC-7/DBO 3.2 | 1.08 | 24.9 | 27.4 | |
| SEC-6/DBO 3.3 | 0.73 | 24.7 | 23.1 | |
| SEC-5/DBO 3.4 | 0.80 | 24.8 | 22.5 | |
| SEC-4/DBO 3.5 | 1.75 | 25.4 | 68.0 | |
| SEC-3/DBO 3.6 | 12.36 | 53.9 | 269.4 | |
| SEC-2/DBO 3.7 | 18.24 | 14.7 | 471.7 | |
| SEC-1/DBO 3.8 | 13.52 | 24.6 | 417.8 | |
| UTN-7 | 29.44 | 34.2 | 560.8 | |
| 2015 | UTN-1 | 2.02 | 24.8 | 37.5 |
| UTN-2 | 8.52 | 5.4 | 168.4 | |
| UTN-3 | 12.64 | 15.2 | 185.8 | |
| UTN-4 | 4.72 | 5.3 | 90.1 | |
| UTN-6 | 15.52 | 5.0 | 185.8 | |
| SEC-8/DBO 3.1 | 1.28 | 15.0 | 26. 8 | |
| SEC-7/DBO 3.2 | 1.63 | 4.8 | 43.9 | |
| SEC-6/DBO 3.3 | 1.72 | 25.0 | 50.4 | |
| SEC-5/DBO 3.4 | 1.47 | 34.6 | 49.0 | |
| SEC-4/DBO 3.5 | 5.92 | 15.2 | 79.77 | |
| SEC-3/DBO 3.6 | 22.08 | 5.0 | 238.0 | |
| SEC-2/DBO 3.7 | 16.76 | 4.98 | 175.9 | |
| SEC-1/DBO 3.8 | 6.28 | 5.02 | 65.1 | |
| UTN-7 | 3.41 | 36.7 | 516.8 | |
| 2014 | UTN-1 | 7.72 | 15.1 | 169.3 |
| UTN-2 | 15.96 | 41.8 | 456.5 | |
| UTN-3 | 19.28 | 45.0 | 582.4 | |
| UTN-4 | 11.24 | 46.3 | 301.7 | |
| UTN-6 | 20.48 | 45.2 | 380.0 | |
| SEC-8/DBO 3.1 | 1.00 | 25.2 | 23.3 | |
| SEC-7/DBO 3.2 | 1.11 | 5.7 | 25.1 | |
| SEC-6/DBO 3.3 | 0.92 | 42.9 | 28.6 | |
| SEC-5/DBO 3.4 | 0.93 | 25.1 | 32.9 | |
| SEC-4/DBO 3.5 | 0.61 | 47.9 | 22.2 | |
| SEC-3/DBO 3.6 | 3.15 | 25.5 | 96.6 | |
| SEC-2/DBO 3.7 | 7.60 | 14.4 | 234.0 | |
| SEC-1/DBO 3.8 | 8.32 | 25.7 | 234.1 | |
| UTN-7 | 1.18 | 25.6 | 31.7 | |
| 2013 | UTN-1 | 0.76 | 25.3 | 16.4 |
| UTN-2 | 1.41 | 42.4 | 33.9 | |
| UTN-3 | 10.84 | 4.6 | 309.0 | |
| UTN-4 | 12.00 | 35.1 | 330.9 | |
| UTN-6 | 18.96 | 4.8 | 462.2 | |
| SEC-8/DBO 3.1 | 0.72 | 5.2 | 12.7 | |
| SEC-7/DBO 3.2 | 0.53 | 15.7 | 15.1 | |
| SEC-6/DBO 3.3 | 1.68 | 34.9 | 48.1 | |
| SEC-5/DBO 3.4 | 1.69 | 15.3 | 40.4 | |
| SEC-4/DBO 3.5 | 0.38 | 48.9 | 13.5 | |
| SEC-3/DBO 3.6 | 13.28 | 25.0 | 524.9 | |
| SEC-2/DBO 3.7 | 20.16 | 5.3 | 461.4 | |
| SEC-1/DBO 3.8 | 19.04 | 5.03 | 345.0 | |
| UTN-7 | 23.72 | 24.7 | 600.5 | |
| 2012 | UTN-1 | 0.26 | 15.2 | 5.6 |
| UTN-2 | 4.44 | 35.4 | 121.4 | |
| UTN-3 | 3.90 | 44.7 | 71.0 | |
| UTN-4 | 4.44 | 45.3 | 55.2 | |
| UTN-6 | 1.10 | 44.6 | 35.9 | |
| SEC-8/DBO 3.1 | 0.26 | 15.3 | 5.5 | |
| SEC-7/DBO 3.2 | 0.33 | 25.0 | ||
| SEC-6/DBO 3.3 | 0.10 | 35.5 | 3.2 | |
| SEC-5/DBO 3.4 | 0.29 | 45.7 | 9.4 | |
| SEC-4/DBO 3.5 | 0.94 | 49.0 | 27.5 | |
| SEC-3/DBO 3.6 | 7.84 | 53.8 | 179.7 | |
| SEC-2/DBO 3.7 | 1.06 | 45.3 | 17.1 | |
| SEC-1/DBO 3.8 | 5.08 | 45.5 | 70.0 | |
| UTN-7 | 4.84 | 50.1 | 88.5 | |
| 2011 | UTN-1 | 0.71 | 25.6 | 16.1 |
| UTN-2 | 1.12 | 35.2 | 27.3 | |
| UTN-3 | 18.24 | 25.2 | 416.8 | |
| UTN-4 | 7 | 45.4 | 194.1 | |
| UTN-6 | 2.48 | 25.7 | 80.4 | |
| SEC-8/DBO 3.1 | 2.228 | 5.4 | 20.2 | |
| SEC-7/DBO 3.2 | 0.53 | 25.4 | 15.2 | |
| SEC-6/DBO 3.3 | 0.65 | 15.6 | 19.7 | |
| SEC-5/DBO 3.4 | 0.95 | 15.4 | 30.8 | |
| SEC-4/DBO 3.5 | 1.755 | 34.9 | 38.4 | |
| SEC-3/DBO 3.6 | 15.47 | 21.6 | 266.5 | |
| SEC-2/DBO 3.7 | 0.76 | 15.6 | 28.3 | |
| SEC-1/DBO 3.8 | 5.52 | 5.2 | 112.8 | |
| UTN-7 | 22.44 | 5.4 | 166.8 | |
| 2010 | UTN-1 | 1.23 | 29.8 | 12.0 |
| UTN-2 | 2.22 | 5.2 | 35.8 | |
| UTN-3 | 0.89 | 46.2 | 18.9 | |
| UTN-4 | 1.04 | 45.2 | 27.2 | |
| UTN-6 | 0.79 | 24.82 | 20.9 | |
| SEC-1/DBO 3.8 | 2.89 | 14.7 | 47.9 | |
| UTN-7 | 0.53 | 54.1 | 11.2 | |
| 2008 | UTN-1 | 0.63 | 11.8 | 12.0 |
| UTN-2 | 2.34 | 41.6 | 35.8 | |
| UTN-3 | 3.10 | 50.4 | 18.9 | |
| UTN-4 | 4.28 | 50.3 | 27.2 | |
| UTN-6 | 14.08 | 6.7 | 20.9 | |
| SEC-1/DBO 3.8 | 8.24 | 11.7 | 47.9 | |
| UTN-7 | 22.20 | 21.5 | 11.2 | |
| 2007 | UTN-1 | 9.00 | 31.3 | 191.1 |
| UTN-2 | 23.96 | 5.4 | 608.0 | |
| UTN-3 | 15.36 | 46.8 | 501.0 | |
| UTN-4 | 13.64 | 46.7 | 287.8 | |
| UTN-6 | 14.68 | 45.8 | 266.9 | |
| SEC-1/DBO 3.8 | 0.34 | 48.4 | 4.3 | |
| UTN-7 | 11.28 | 54.0 | 309.23 | |
| 2006 | UTN-1 | 0.444 | 24.7 | 9.0 |
| UTN-2 | 6.04 | 25.2 | 171.5 | |
| UTN-3 | 0.56 | 44.2 | 14.7 | |
| UTN-4 | ||||
| UTN-6 | ||||
| SEC-1/DBO 3.8 | 0.12 | 40.8 | 3.5 | |
| UTN-7 | 16.84 | 5.1 | 244.9 | |
| 2005 | UTN-1 | 0.75 | 6.3 | 6.2 |
| UTN-2 | 2.38 | 26.0 | 76.3 | |
| UTN-3 | 14.28 | 5.9 | 351.3 | |
| UTN-4 | 11.24 | 20.6 | 322.9 | |
| UTN-6 | 3.34 | 40.6 | 142.6 | |
| SEC-1/DBO 3.8 | 7.88 | 36.0 | 189.3 | |
| UTN-7 | 2.13 | 51.6 | 83.6 | |
| 2004 | UTN-1 | 3.83 | 43.9 | 109.4 |
| UTN-2 | 5.00 | 45.3 | 145.26 | |
| UTN-3 | 11.80 | 48.6 | 329. 7 | |
| UTN-4 | 13.16 | 45 | 330.6 | |
| UTN-6 | 13.16 | 45 | 330.6 | |
| SEC-1/DBO 3.8 | 6.60 | 49.4 | 226.8 | |
| UTN-7 | 6.56 | 30.6 | 188.5 | |
| 2003 | UTN-1 | 1.39 | 10.9 | 29.3 |
| UTN-2 | 6.16 | 25 | 134.5 | |
| UTN-3 | 6.44 | 15.2 | 164.8 | |
| UTN-4 | 7.84 | 44.3 | 250.7 | |
| UTN-6 | 5.28 | 10.7 | 160.4 | |
| SEC-1/DBO 3.8 | 5.92 | 20.5 | 178.9 | |
| UTN-7 | 4.049 | 1.3 | 1133.9 | |
| 2002 | UTN-1 | 0.63 | 15.7 | 15.4 |
| UTN-2 | 1.16 | 40.2 | 32.6 | |
| UTN-3 | 14.84 | 41.2 | 426.1 | |
| UTN-4 | 18.88 | 35.9 | 519.7 | |
| UTN-6 | 27.70 | 25.4 | 498.9 | |
| SEC-1/DBO 3.8 | 18.40 | 21.1 | 380.9 | |
| UTN-7 | 8.88 | 15.9 | 336.8 | |
| 2001 | UTN-1 | 1.05 | 2.6 | 27.0 |
| UTN-2 | 2.57 | 6.5 | 62.5 | |
| UTN-3 | 11.16 | 48.0 | 291.2 | |
| UTN-4 | 23.48 | 0.1 | 708.7 | |
| UTN-6 | 16.64 | 0.1 | 301.5 | |
| SEC-1/DBO 3.8 | 18.20 | 19.2 | 287.3 | |
| UTN-7 | 32.96 | 6.1 | 628.9 | |
| 2000 | UTN-1 | |||
| UTN-2 | 0.82 | 35.8 | 28.2 | |
| UTN-3 | 19.32 | 5.0 | 745.4 | |
| UTN-4 | 14.92 | 45.0 | 528.5 | |
| UTN-6 | 27.68 | 5.0 | 719.3 | |
| SEC-1/DBO 3.8 | 21.92 | 55.0 | 784.8 | |
| UTN-7 | 25.72 | 5.0 | 620.3 |
| Year | Station | DBO 4 Maximum Chlorophyll (mg m−3) | Depth of Maximum Chlorophyll (m) | Integrated Chlorophyll (mg m−2) |
|---|---|---|---|---|
| 2019 | DBO 4.6n | 16.88 | 25.2 | 247.2 |
| DBO 4.5n | 2.58 | 40.4 | 36.3 | |
| DBO 4.4N | 7.16 | 7.16 | 122.0 | |
| DBO 4.3n | 2.42 | 43.2 | 85.0 | |
| DBO 4.2 | 2.49 | 25.3 | 57.7 | |
| DBO 4.1n | 1.34 | 52.4 | 95.4 | |
| 2018 | DBO 4.6n | 8.68 | 25.1 | 161.4 |
| DBO 4.5n | 9.56 | 38.6 | 102.6 | |
| DBO 4.4N | 6.96 | 42.5 | 152.7 | |
| DBO 4.3n | 4.64 | 43.8 | 398.7 | |
| DBO 4.2 | 8.60 | 43.9 | 216.4 | |
| DBO 4.1n | ||||
| 2017 | DBO 4.6n | 0.71 | 24.9 | 19.6 |
| DBO 4.5n | 0.83 | 24.6 | 19.5 | |
| DBO 4.4N | 0.77 | 25.0 | 20.3 | |
| DBO 4.3n | 1.30 | 15.3 | 35.8 | |
| DBO 4.2 | 0.83 | 41.6 | 38.5 | |
| DBO 4.1n | 1.41 | 35.0 | 44.7 | |
| 2016 | DBO 4.6n | 3.65 | 24.8 | 52.2 |
| DBO 4.5n | ||||
| DBO 4.4N | ||||
| DBO 4.3n | 14.56 | 25.4 | 170.3 | |
| DBO 4.2 | 9.44 | 24.6 | 150.4 | |
| DBO 4.1n | 3.39 | 35.1 | 78.4 | |
| 2015 | DBO 4.6n | 5.80 | 25.4 | 84.9 |
| DBO 4.5n | 4.52 | 25.1 | 73.8 | |
| DBO 4.4N | 4.84 | 25.5 | 91.9 | |
| DBO 4.3n | 23.48 | 25.3 | 440.5 | |
| DBO 4.2 | 8.60 | 34.8 | 113.7 | |
| DBO 4.1n | 3.16 | 35.1 | 57.5 | |
| 2014 | DBO 4.6n | 8.40 | 37.3 | 106.0 |
| DBO 4.5n | 18.84 | 14.4 | 334.4 | |
| DBO 4.4N | 15.12 | 14.9 | 313.9 | |
| DBO 4.3n | 2.512 | 41.7 | 66.3 | |
| DBO 4.2 | 1.72 | 25.1 | 39.2 | |
| DBO 4.1n | 9.80 | 24.9 | 116.8 | |
| 2013 | DBO 4.6n | 7.52 | 15.3 | 137.6 |
| DBO 4.5n | 3.89 | 25.1 | 76.6 | |
| DBO 4.4N | 7.84 | 24.8 | 195.3 | |
| DBO 4.3n | 10.76 | 15.5 | 176.3 | |
| DBO 4.2 | 179.0 | |||
| DBO 4.1n | 3.392 | 42.2 | 62.5 |
| Year | Station | DBO 5 Maximum Chlorophyll (mg m−3) | Depth of Maximum Chlorophyll (m) | Integrated Chlorophyll (mg m−2) |
|---|---|---|---|---|
| 2019 | BarC-10/DBO 5.10 | 7.60 | 35.2 | 135.2 |
| Bar-C-9/DBO 5.9 | 3.68 | 34.1 | 76.7 | |
| BarC-8/DBO 5.8 | 2.48 | 35.3 | 65.6 | |
| BarC-7/DBO 5.7 | 0.93 | 77.7 | 31.7 | |
| BarC-6/DBO 5.6 | 2.58 | 35.0 | 66.7 | |
| BarC/DBO 5.5 | 3.12 | 35.1 | 136.9 | |
| BarC-4/DBO 5.4 | 1.34 | 75.6 | 63.0 | |
| BarC-3/DBO 5.3 | 1.03 | 15.7 | 80.0 | |
| BarC-2/DBO 5.2 | 0.81 | 35.5 | 39.3 | |
| BarC-1/DBO 5.1 | 1.96 | 4.5 | 54.7 | |
| 2017 | BarC-10/DBO 5.10 | 3.86 | 34.7 | 79.8 |
| Bar-C-9/DBO 5.9 | 3.09 | 34.3 | 56.7 | |
| BarC-8/DBO 5.8 | 1.66 | 35.6 | 50. 6 | |
| BarC-7/DBO 5.7 | 2.36 | 24.9 | 75.5 | |
| BarC-6/DBO 5.6 | 12.24 | 35.3 | 255.7 | |
| BarC/DBO 5.5 | 1.62 | 34.8 | 106.2 | |
| BarC-4/DBO 5.4 | 0.72 | 75.7 | 65.1 | |
| BarC-3/DBO 5.3 | 0.91 | 14.4 | 54.6 | |
| BarC-2/DBO 5.2 | 1.08 | 4.7 | 37.0 | |
| BarC-1/DBO 5.1 | 1.12 | 4.8 | 33.9 | |
| 2015 | BarC-10/DBO 5.10 | 6.64 | 25.4 | 127.5 |
| Bar-C-9/DBO 5.9 | 13.68 | 25.1 | 234.6 | |
| BarC-8/DBO 5.8 | 2.28 | 15.4 | 61.6 | |
| BarC-7/DBO 5.7 | 12.04 | 35.1 | 235.96 | |
| BarC-6/DBO 5.6 | 24.64 | 15.2 | 361.16 | |
| BarC/DBO 5.5 | 14.64 | 99.8 | 476.56 | |
| BarC-4/DBO 5.4 | 15.08 | 25.1 | 438.26 | |
| BarC-3/DBO 5.3 | 6.28 | 86.9 | 333.4 | |
| BarC-2/DBO 5.2 | 2.016 | 24.7 | 70.5 | |
| BarC-1/DBO 5.1 | 1.188 | 24.6 | 33.1 | |
| 2014 | BarC-10/DBO 5.10 | 6.64 | 25.4 | 127.5 |
| Bar-C-9/DBO 5.9 | ||||
| BarC-8/DBO 5.8 | ||||
| BarC-7/DBO 5.7 | ||||
| BarC-6/DBO 5.6 | ||||
| BarC/DBO 5.5 | 8.96 | 34.7 | 244.4 | |
| BarC-4/DBO 5.4 | 1.09 | 15.6 | 63.1 | |
| BarC-3/DBO 5.3 | 0.9 | 75.2 | 45.5 | |
| BarC-2/DBO 5.2 | ||||
| BarC-1/DBO 5.1 | ||||
| 2013 | BarC-10/DBO 5.10 | 7.6 | 35.2 | 135.2 |
| Bar-C-9/DBO 5.9 | ||||
| BarC-8/DBO 5.8 | ||||
| BarC-7/DBO 5.7 | ||||
| BarC-6/DBO 5.6 | ||||
| BarC/DBO 5.5 | 4.72 | 35.4 | 163.5 | |
| BarC-4/DBO 5.4 | 0.77 | 25.3 | 24.5 | |
| BarC-3/DBO 5.3 | 11.10 | 14.7 | 15.7 | |
| BarC-2/DBO 5.2 | 10.12 | 24.9 | 511.8 | |
| BarC-1/DBO 5.1 | 10.28 | 35.6 | 509.8 | |
| 2012 | BarC-10/DBO 5.10 | 3.08 | 50.1 | 46.4 |
| Bar-C-9/DBO 5.9 | 0.58 | 59.4 | 10.6 | |
| BarC-8/DBO 5.8 | 1.24 | 25.7 | 25.4 | |
| BarC-7/DBO 5.7 | 0.76 | 35.4 | 30.2 | |
| BarC-6/DBO 5.6 | 7.36 | 35.3 | 222.5 | |
| BarC/DBO 5.5 | 4.60 | 35.7 | 274.3 | |
| BarC-4/DBO 5.4 | 0.79 | 35.7 | 53.9 | |
| BarC-3/DBO 5.3 | 0.62 | 86.5 | 40.4 | |
| BarC-2/DBO 5.2 | 0.54 | 25.1 | 21.4 | |
| BarC-1/DBO 5.1 | 0.85 | 25.9 | 26.4 |
Publisher’s Note: MDPI stays neutral with regard to jurisdictional claims in published maps and institutional affiliations. |
© 2022 by the authors. Licensee MDPI, Basel, Switzerland. This article is an open access article distributed under the terms and conditions of the Creative Commons Attribution (CC BY) license (https://creativecommons.org/licenses/by/4.0/).
Share and Cite
Cooper, L.W.; Grebmeier, J.M. A Chlorophyll Biomass Time-Series for the Distributed Biological Observatory in the Context of Seasonal Sea Ice Declines in the Pacific Arctic Region. Geosciences 2022, 12, 307. https://doi.org/10.3390/geosciences12080307
Cooper LW, Grebmeier JM. A Chlorophyll Biomass Time-Series for the Distributed Biological Observatory in the Context of Seasonal Sea Ice Declines in the Pacific Arctic Region. Geosciences. 2022; 12(8):307. https://doi.org/10.3390/geosciences12080307
Chicago/Turabian StyleCooper, Lee W., and Jacqueline M. Grebmeier. 2022. "A Chlorophyll Biomass Time-Series for the Distributed Biological Observatory in the Context of Seasonal Sea Ice Declines in the Pacific Arctic Region" Geosciences 12, no. 8: 307. https://doi.org/10.3390/geosciences12080307
APA StyleCooper, L. W., & Grebmeier, J. M. (2022). A Chlorophyll Biomass Time-Series for the Distributed Biological Observatory in the Context of Seasonal Sea Ice Declines in the Pacific Arctic Region. Geosciences, 12(8), 307. https://doi.org/10.3390/geosciences12080307