Article

Soil Risk Assessment in the Surrounding Area of Hulene-B Waste Dump, Maputo (Mozambique)

by
Bernardino Bernardo
1,2,
Carla Candeias
1,* and
Fernando Rocha
1
1
GeoBioTec Research Centre, Department of Geosciences, University of Aveiro, 3810-193 Aveiro, Portugal
2
Faculty of Earth Sciences and Environment, Pedagogic University of Maputo, Maputo 2482, Mozambique
*
Author to whom correspondence should be addressed.
Geosciences 2022, 12(8), 290; https://doi.org/10.3390/geosciences12080290
Submission received: 2 June 2022 / Revised: 20 July 2022 / Accepted: 25 July 2022 / Published: 28 July 2022
(This article belongs to the Section Geochemistry)

Abstract

:
Soil contamination in areas close to unplanned dumpsites represents an increasing risk to the ecosystems and human health. This study aimed to evaluate soil quality in the area surrounding the Hulene-B waste dump, Maputo, Mozambique, and to estimate potential ecological and human health risks. A total of 71 surface soil samples were collected in the surrounding area of the dump, along with 10 samples in areas considered not impacted by the dump. Chemical and mineralogical analyses were performed using XRF and XRD. Quartz was the most abundant mineral phase, followed by feldspars, carbonates, clay minerals, and Fe oxides/hydroxides. Results showed a significant contribution to ecological degradation by PTE enrichment, ranked as Zn >> Cu > Cr > Zr > Pb > Ni > Mn. Carcinogenic risk for both children and adults was significant due to Pb soil content. Soil sample concentrations of Cr, Cu, Mn, Ni, Pb, Zn, and Zr, posing a risk especially in children, suggested the need for continuous monitoring, as well as the definition and implementation of mitigation measures.

1. Introduction

Soil contamination is an environmental problem affecting urban areas, particularly in developing countries [1,2]. Contamination sources have been attributed to unregulated overlapping of activities that influence soil quality, e.g., industrialization, urbanization, agriculture, and solid waste [3]. Solid waste heterogeneity contributes with the enrichment of potentially toxic elements (PTEs) in soil [4], being currently considered as a major threat to soil and groundwater quality in urban areas [5]. Previous studies [6] described that the rapid growth of cities and their inhabitants has boosted global waste production, with an estimated global annual production of municipal solid waste (MSW), in 2025, of 2.2 billion metric tons [7,8]. Heavy metals are among the most hazardous soil pollutants, being highly reactive; when organisms are unable to eliminate them chemically, they are retained in ecosystem, representing a potential risk [9,10]. Areas surrounding waste dump sites, are prone to PTE contamination [11], with several studies reporting soil contamination, e.g., ref. [12] with high soil contamination by As, Hg, and Al in soil around a dumpsite in Italy, ref. [13] identifying Cu, Pb, Co, Mn, and Hg soil contamination in China, [14] evidencing high levels of contamination by As, Cd, Pb, and Cr in seven dumpsites in Malaysia, and [15] finding Cd, Zn, Cu, Pb, Ni, and Co contamination. Soil contamination around waste dumps poses a risk to human health [16]. A study near a dumpsite in Kenya suggested that high soil PTE levels (Pb, Hg Cd, Cu, and Cr) pose a risk to children and adolescents living and studying near the dumpsite, who presented a high incidence of respiratory diseases and blood Pb levels, along with blood cell aberrations. The authors of [17,18] systematized data from waste dumps in developing countries and concluded that the levels of contamination caused by PTEs posed potential health risks. In turn, the authors of [19] showed that the high levels of heavy-metal contamination of the soil environment of the Udoyo dumpsite in Nigeria constituted a risk factor for human health. The geochemical heterogeneity of soil worldwide has led to the need for a definition of a local background [20], relevant for reducing discrepancy between world established guidelines and local soils [21], thereby providing a reliable estimate of the influence of contamination according to measured element concentrations [22]. In Mozambique, one cause of soil contamination is the unregulated disposal of solid wastes, especially in the capital, Maputo [23]. In Maputo city, MSW production is increasing, with an estimated daily waste production of 1250 t [23,24], of which ~1000 t is deposited in the largest open-air dump of the city, the Hulene-B dump [23]. All types of waste, e.g., domestic, construction, medical, sanitary, and industrial, are deposited in the dump without any treatment, posing a worrying ecological and public health risk. The authors of [23,25] linked Hulene-B waste to the Hg, As, Pb, Cu, and Zn contamination of the surrounding soils. The authors of [24] suggested that high electric conductivities of the soils surrounding the Hulene-B dump may be associated with a possible enrichment of the PTEs, with origin in dump leachates. Studies by [23,24,26] reported that the dump may be impacting the health of the population around the Hulene-B dump. However, studies on the chemical quantification of the levels of enrichment of the surroundings of the dump by PTEs are scarce, as are models of the impact of ecological systems and human health. Soil quality evaluation can be assessed by using world guidelines and local background concentrations, which can contribute to the improvement of methodologies. The integration of ecological and human health risk assessment models is significant to understand the impact of the Hulene-B dumpsite and to assist in the definition of mitigation measures. The present study aimed to assess soil contamination by Cr, Cu, Mn, Ni, Pb, Zn, and Zr in the area surrounding Hulene-B waste dump, Maputo, and to estimate potential ecological and human health risk.

2. Materials and Methods
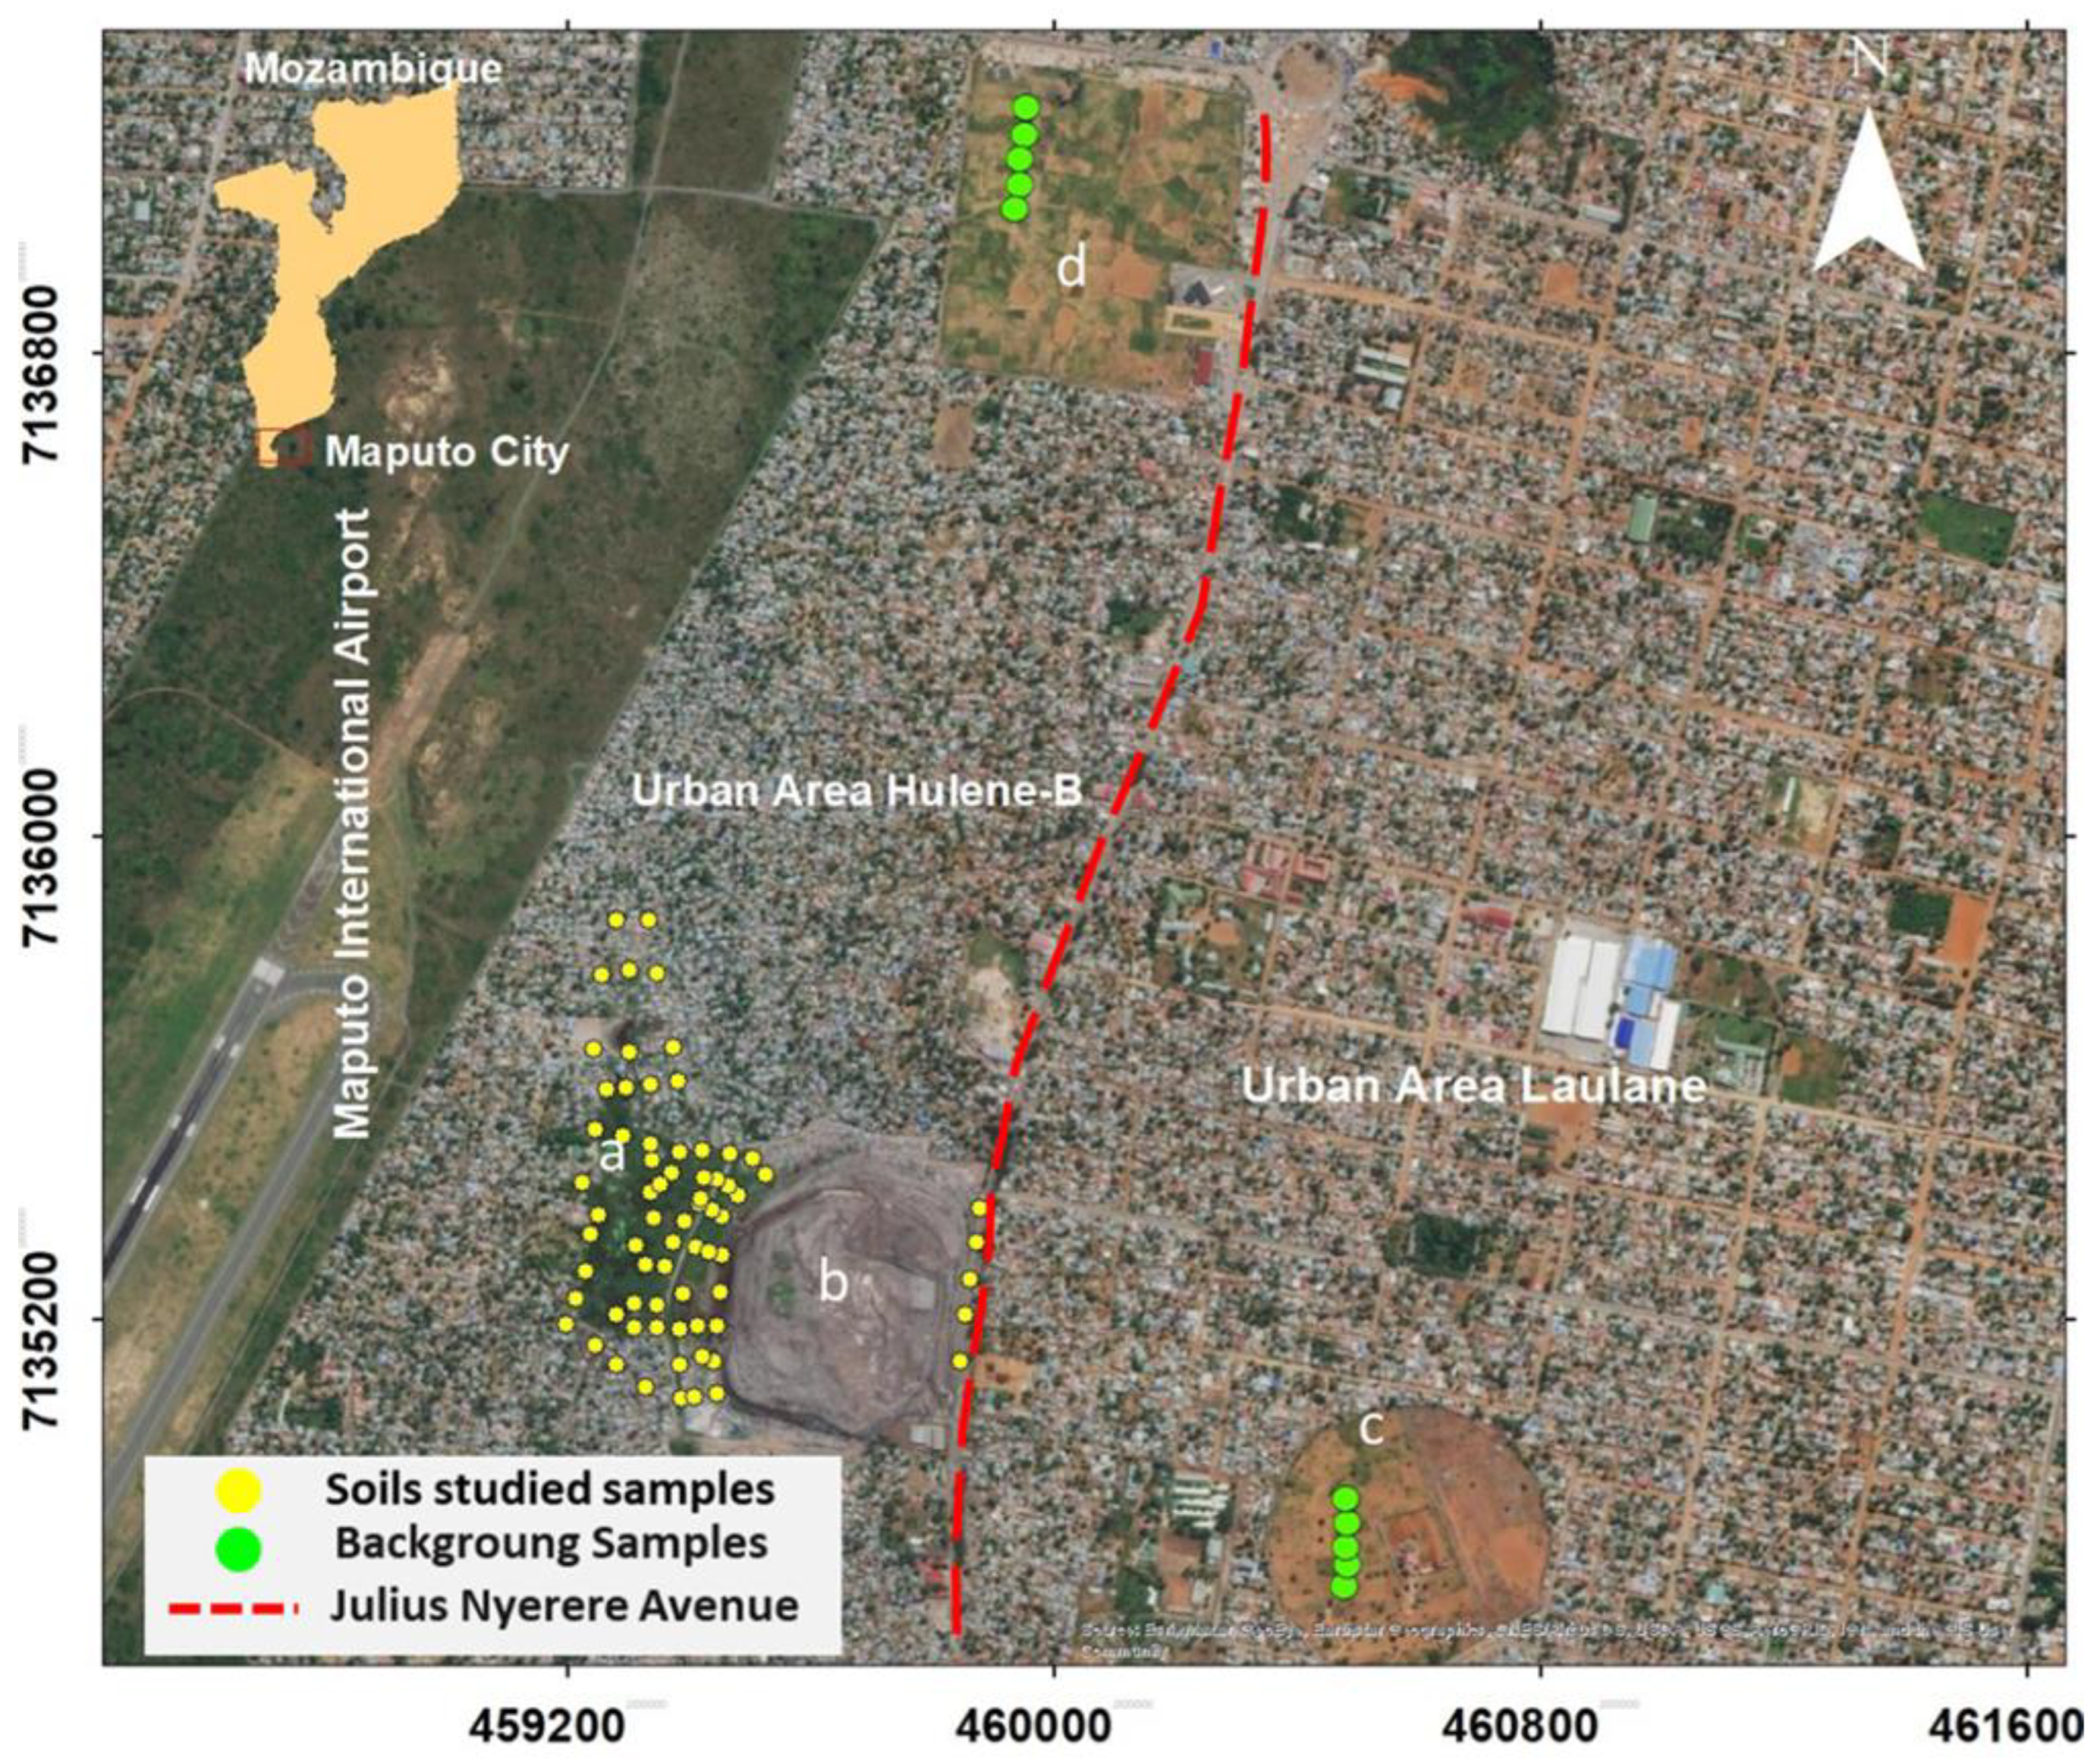
2.1. Study Area

The Hulene-B dump is located in the northern part of Maputo city, the capital of Mozambique (Figure 1). The surrounding area is densely inhabited, with over 75,500 residents [27]. On the eastern edge of the dump is Julius Nyerere Avenue, a road with heavy traffic that provides access to Maputo city center, while the largest airport in Mozambique (Maputo International Airport) is located on the west side. The dump covers an area of ~17 hectares [23,28], occupying an abandoned (1973) open sand pit, where the population started to deposit all type of wastes without previous preparation [29]. The height of the waste is estimated at 6–15 m [28]. The dump is characterized by open-air deposition and was described by [25] as the source of soil and groundwater contamination by Hg, As, Pb, Cu, and Zn. Recently, the authors of [30] described the Hulene-B dump as one cause of contaminated particle (re)suspension and deposition as a result of uncontrolled waste incineration.
Geologically, the Hulene-B dump is in the Mesocenozoic sedimentary basin of southern Mozambique [31], in contact with two lithologies, the Ponta Vermelha formation (TPv) at the dump eastern limit and the Malhazine formation (QMa) at the dump western limit [32]. The Malhazine formation consists of coarse to fine, poorly consolidated sands with whitish to reddish colors, fixed by vegetation, as a result of successive consolidation processes [32,33]. The Ponta Vermelha formation is composed by ferruginous sandstone and red sedimentary sands that gradually passe to yellow and whitish sands [32]. Arenosols are dominant in the area, with sandy texture [34]. The predominant climate is of subtropical type, with mean annual precipitation of ~789 mm, with two climatic seasons: (a) a hot (mean 25 °C) and rainy period from December to March with >60% of the annual precipitation, peaking in January (~125 mm), and (b) a dry and cold season, from April to September, with lower temperatures in June and July (mean 21 °C), and scarce precipitation, whose minimum values are recorded in August (~12 mm) [35]. The prevailing winds are SE [36].

2.2. Sampling and Analysis
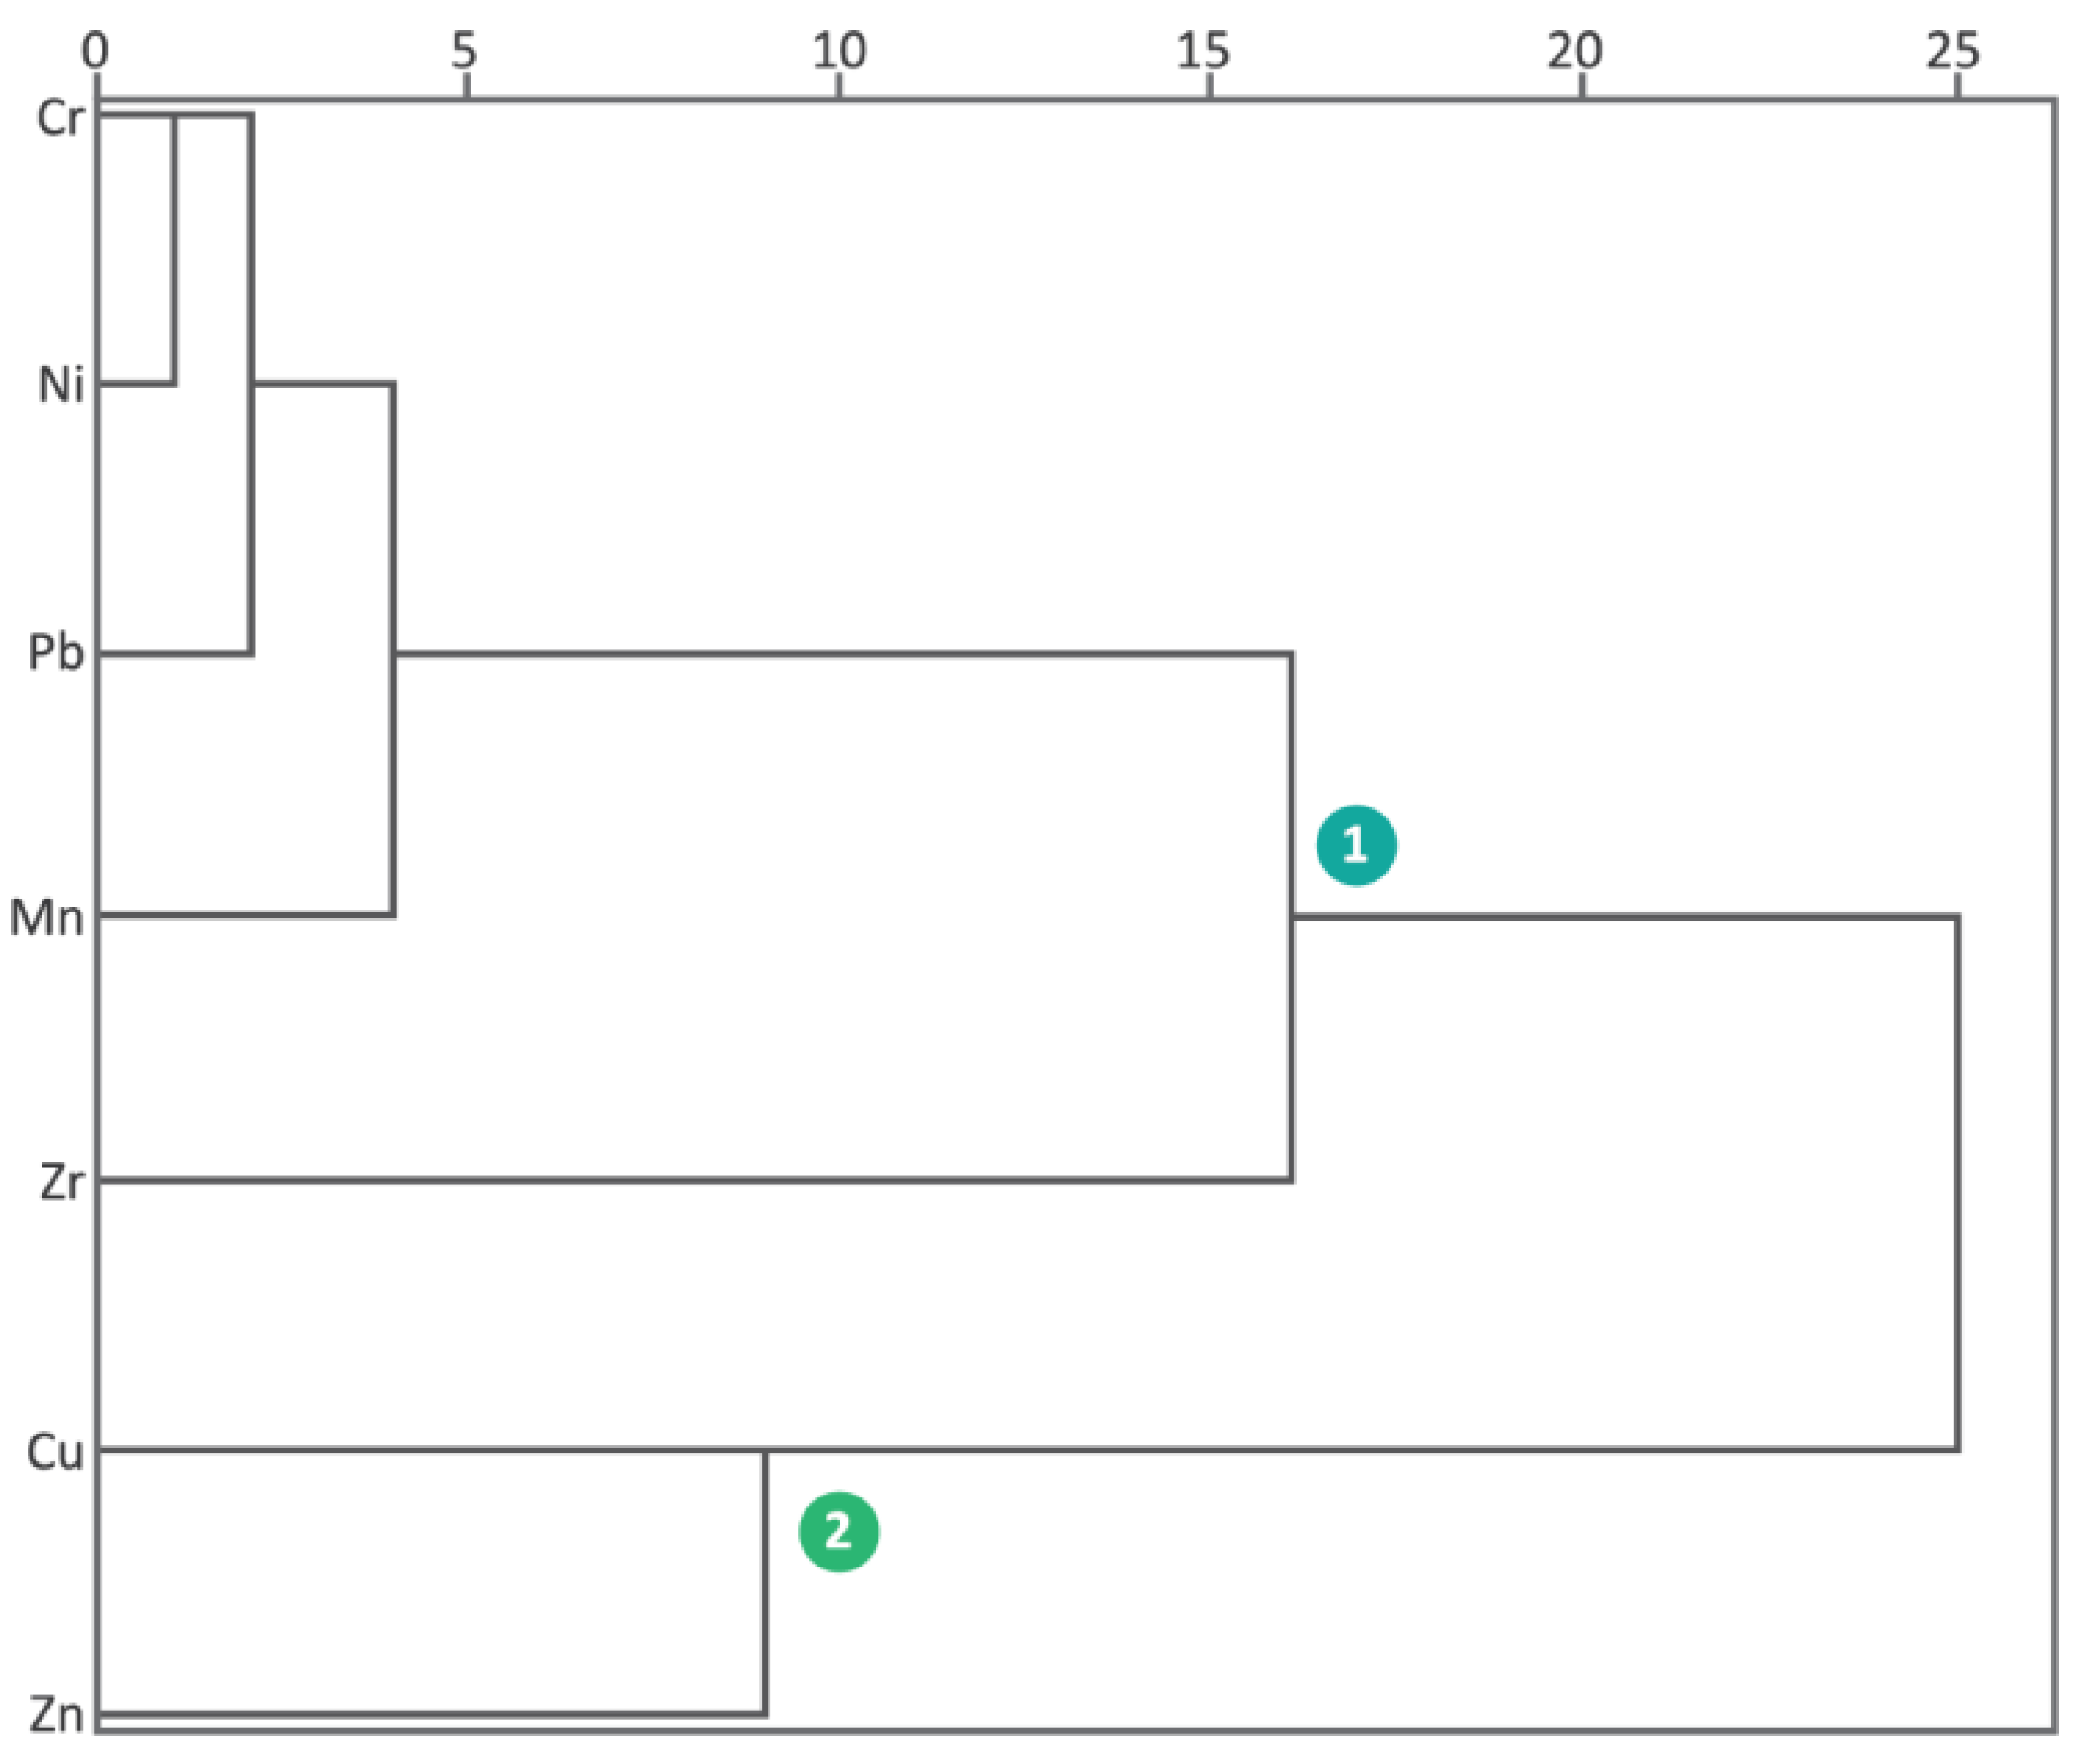
A total of 71 soil samples were collected in the surrounding area of the Hulene-B dump, Maputo (Mozambique), in January 2020 (Figure 1). To determine the local background, 10 samples were collected in areas considered not impacted by the dump. Local background sampling sites were selected taking into consideration not only the similar lithologies of the study area, but also the distance, wind direction, and topography: (a) eastern sampling site, located ~1 km distance from Hulene-B dump on a high relief with opposite prevailing wind direction (SE); (b) northern site, ~2 km distance from Hulene-B, with opposite wind direction, representing an area not impacted by the dump.
Samples were collected superficially (0–20 cm), georeferenced, and preserved in plastic bags until laboratorial analysis. In the laboratory, samples were oven-dried at ≤40 °C (Pedagogical University of Maputo, Mozambique). Afterward, samples were transported to the laboratories of the GeoBioTec Research Center, University of Aveiro (UAVR), Portugal, for analyses. Soil samples were sieved at <2000 and <63 µm.
The chemical composition of samples was accessed by X-ray fluorescence (XRF) spectrometry, using a PANalytical PW 4400/40 45 Axios with Cr Kα radiation. Mineralogical phases were determined by powder X-ray diffraction (XRD) using a Phillips/Panalytical powder diffractometer, model X’Pert-Pro MPD, equipped with an automatic slit. A Cu X-ray tube was operated at 50 kV and 30 mA. Data were collected from 2° to 70° 2θ with a step size of 1° and a counting interval of 0.02 s. The precision and the accuracy of analyses and procedures were monitored using UAVR internal standards, certified reference material (BGS119), and quality control blanks. Results were within the 95% confidence limits. The relative standard deviation was between 5% and 10%.

2.3. Data Analysis

Descriptive statistics, principal component analysis (PCA), Spearman correlation, one-way ANOVA and cluster analysis were performed using SPSS v.25® software (IBM, New York, NY, USA). Cluster analysis was applied using Ward’s method and Euclidean distance as a measure of similarity.
Potential ecological risk (PERI) has been widely used to assess the degree of potential ecological risk of heavy metals in soils, which was originally used in sediment samples [37]. The potential ecological risk factor is defined as the sum of the monomial potential ecological risk factors (EF), which quantitatively defines the potential ecological risk of a contaminant in a sample [38], calculated as PERI = i   = 1 7 EF i = i   = 1 7 CF i   ×   TF , where PERIi is the potential ecological risk index, EFi the monomial potential ecological risk factor of each variable, CFi is the single contamination factor, and TF us the heavy metal toxic-response factor for the seven selected elements, computed as described by [37] taking into consideration biochemical composition proposed by [39] that have been used widely (e.g., [40,41]). TF values obtained were Cr = 25, Cu and Zr = 10, Ni and Zn = 5, and Mn and Pb = 2. The five EF classes and four PERI degrees are presented in Table 1.
The soil Nemerow index (PN) is widely used to assess the contribution of pollutants to soil contamination [42]. The Nemerow pollution index synthesizes the single pollution index values of all elements, and it can comprehensively reflect the degree of soil pollution and highlight the impact of element concentration [43]. The index is calculated as Pn   = [ ( 1 / n i = 1 n PI ) 2 + ( PI max ) 2 ] / 2 , where PI is the single element pollution index, PImax is the PI maximum value in all elements, and n is the number of elements studied. Soil quality is classified as follows: nonpolluted PN ≤ 0.7, warning line of pollution 0.7 < PN ≤ 1.0, low level of pollution 1.0 < PN ≤ 2.0, moderate level of pollution 2.0 < PN ≤ 3.0, and high level of pollution PN > 3.0. The soil Nemerow index was calculated using both local background (PNbkg) and world soils (PNRC) [22].
The pollution load index (PLI) provides a simple comparative means to assess the level of enrichment [38]. It was determined as the n-th root of the product of the nPI, where n is the number of variables considered; PLI = (PI1 × PI2 × PI3 ×⋯× PIn)1/n. PLI > 1 implies environmental deterioration by elemental pollution.
Noncarcinogenic and carcinogenic risk assessments were calculated taking into consideration that residents, both children and adults, are directly exposed to soils through three main pathways: (a) ingestion, (b) inhalation, and (c) dermal absorption [44]. The carcinogenic and noncarcinogenic side effects for each element were computed individually, considering reference toxicity levels for each variable, as extensively described in, e.g., [45,46]. Equations used to estimate the chronic daily intake for each exposure route considered, supplemented by specific quantitative information, were as follows: CDIing = Csoil × (IngR × EF × ED)/(BW × AT) × 10−6; CDIderm = Csoil (SA × SAF × DA × EF × ED)/(BW × AT ) × 10−6; CDIinh = Csoil (InR × EF × ED)/(PEF × BW × AT), where CDIing is the chronic daily intake dose through ingestion (mg/kg·day), Csoil (mg/kg) is the concentration of the element in soil in this study, IngR (mg/day) is the soil ingestion rate (100 for children and 200 for adults), InhR (m3/day) is the inhalation rate (7.6 for children and 20 for adults), EF (days/year) is the exposure frequency (180), ED is the exposure period (6 and 24 years for noncarcinogenic effects in children and adults, respectively, with 70 years as a lifetime for of carcinogenic effects), BW is the average body weight (15 kg for children and 70 kg for adults), AT (days) is the average time for noncarcinogenic effects (=ED × 365 days), SA is the exposed skin area (2800 and 5700 cm2 for children and adults, respectively), SAF is the skin adherence factor (0.2 and 0.07 mg/cm2 for children and adults, respectively), DA is the dermal absorption factor (0.03 for As and 0.001 for all of the selected elements), and PEF is the particulate emission factor (1.36 × 10⁹ m3/kg) [47,48,49,50]. For each selected potentially toxic element and pathway, the noncarcinogenic toxic hazard was estimated by computing the hazard quotient (HQ) for systemic toxicity (i.e., noncarcinogenic risk), where HQ = CDIpathway/RfD. If HQ > 1, noncarcinogenic effects might occur as the exposure concentration exceeds the reference dose (RfD) [50]. The cumulative non-carcinogenic hazard index (HI) corresponds to the sum of HQ for each pathway and/or variable. Similarly, HI > 1 indicates that noncarcinogenic effects might occur, calculated with HI = ∑HQ = HQing + HQderm + HQinh.
Carcinogenic risk, or the probability of an individual developing any type of cancer over a lifetime due to exposure to a potential carcinogen (Risk), was estimated by the sum of total cancer risk for the three exposure routes, Risk = Risking + Riskderm + Riskinh, as described by [50]. A risk > 1.00 × 10⁻⁶ is classified as the carcinogenic target risk, while values > 1.00 × 10⁻⁴ are considered unacceptable [50].

3. Results and Discussion

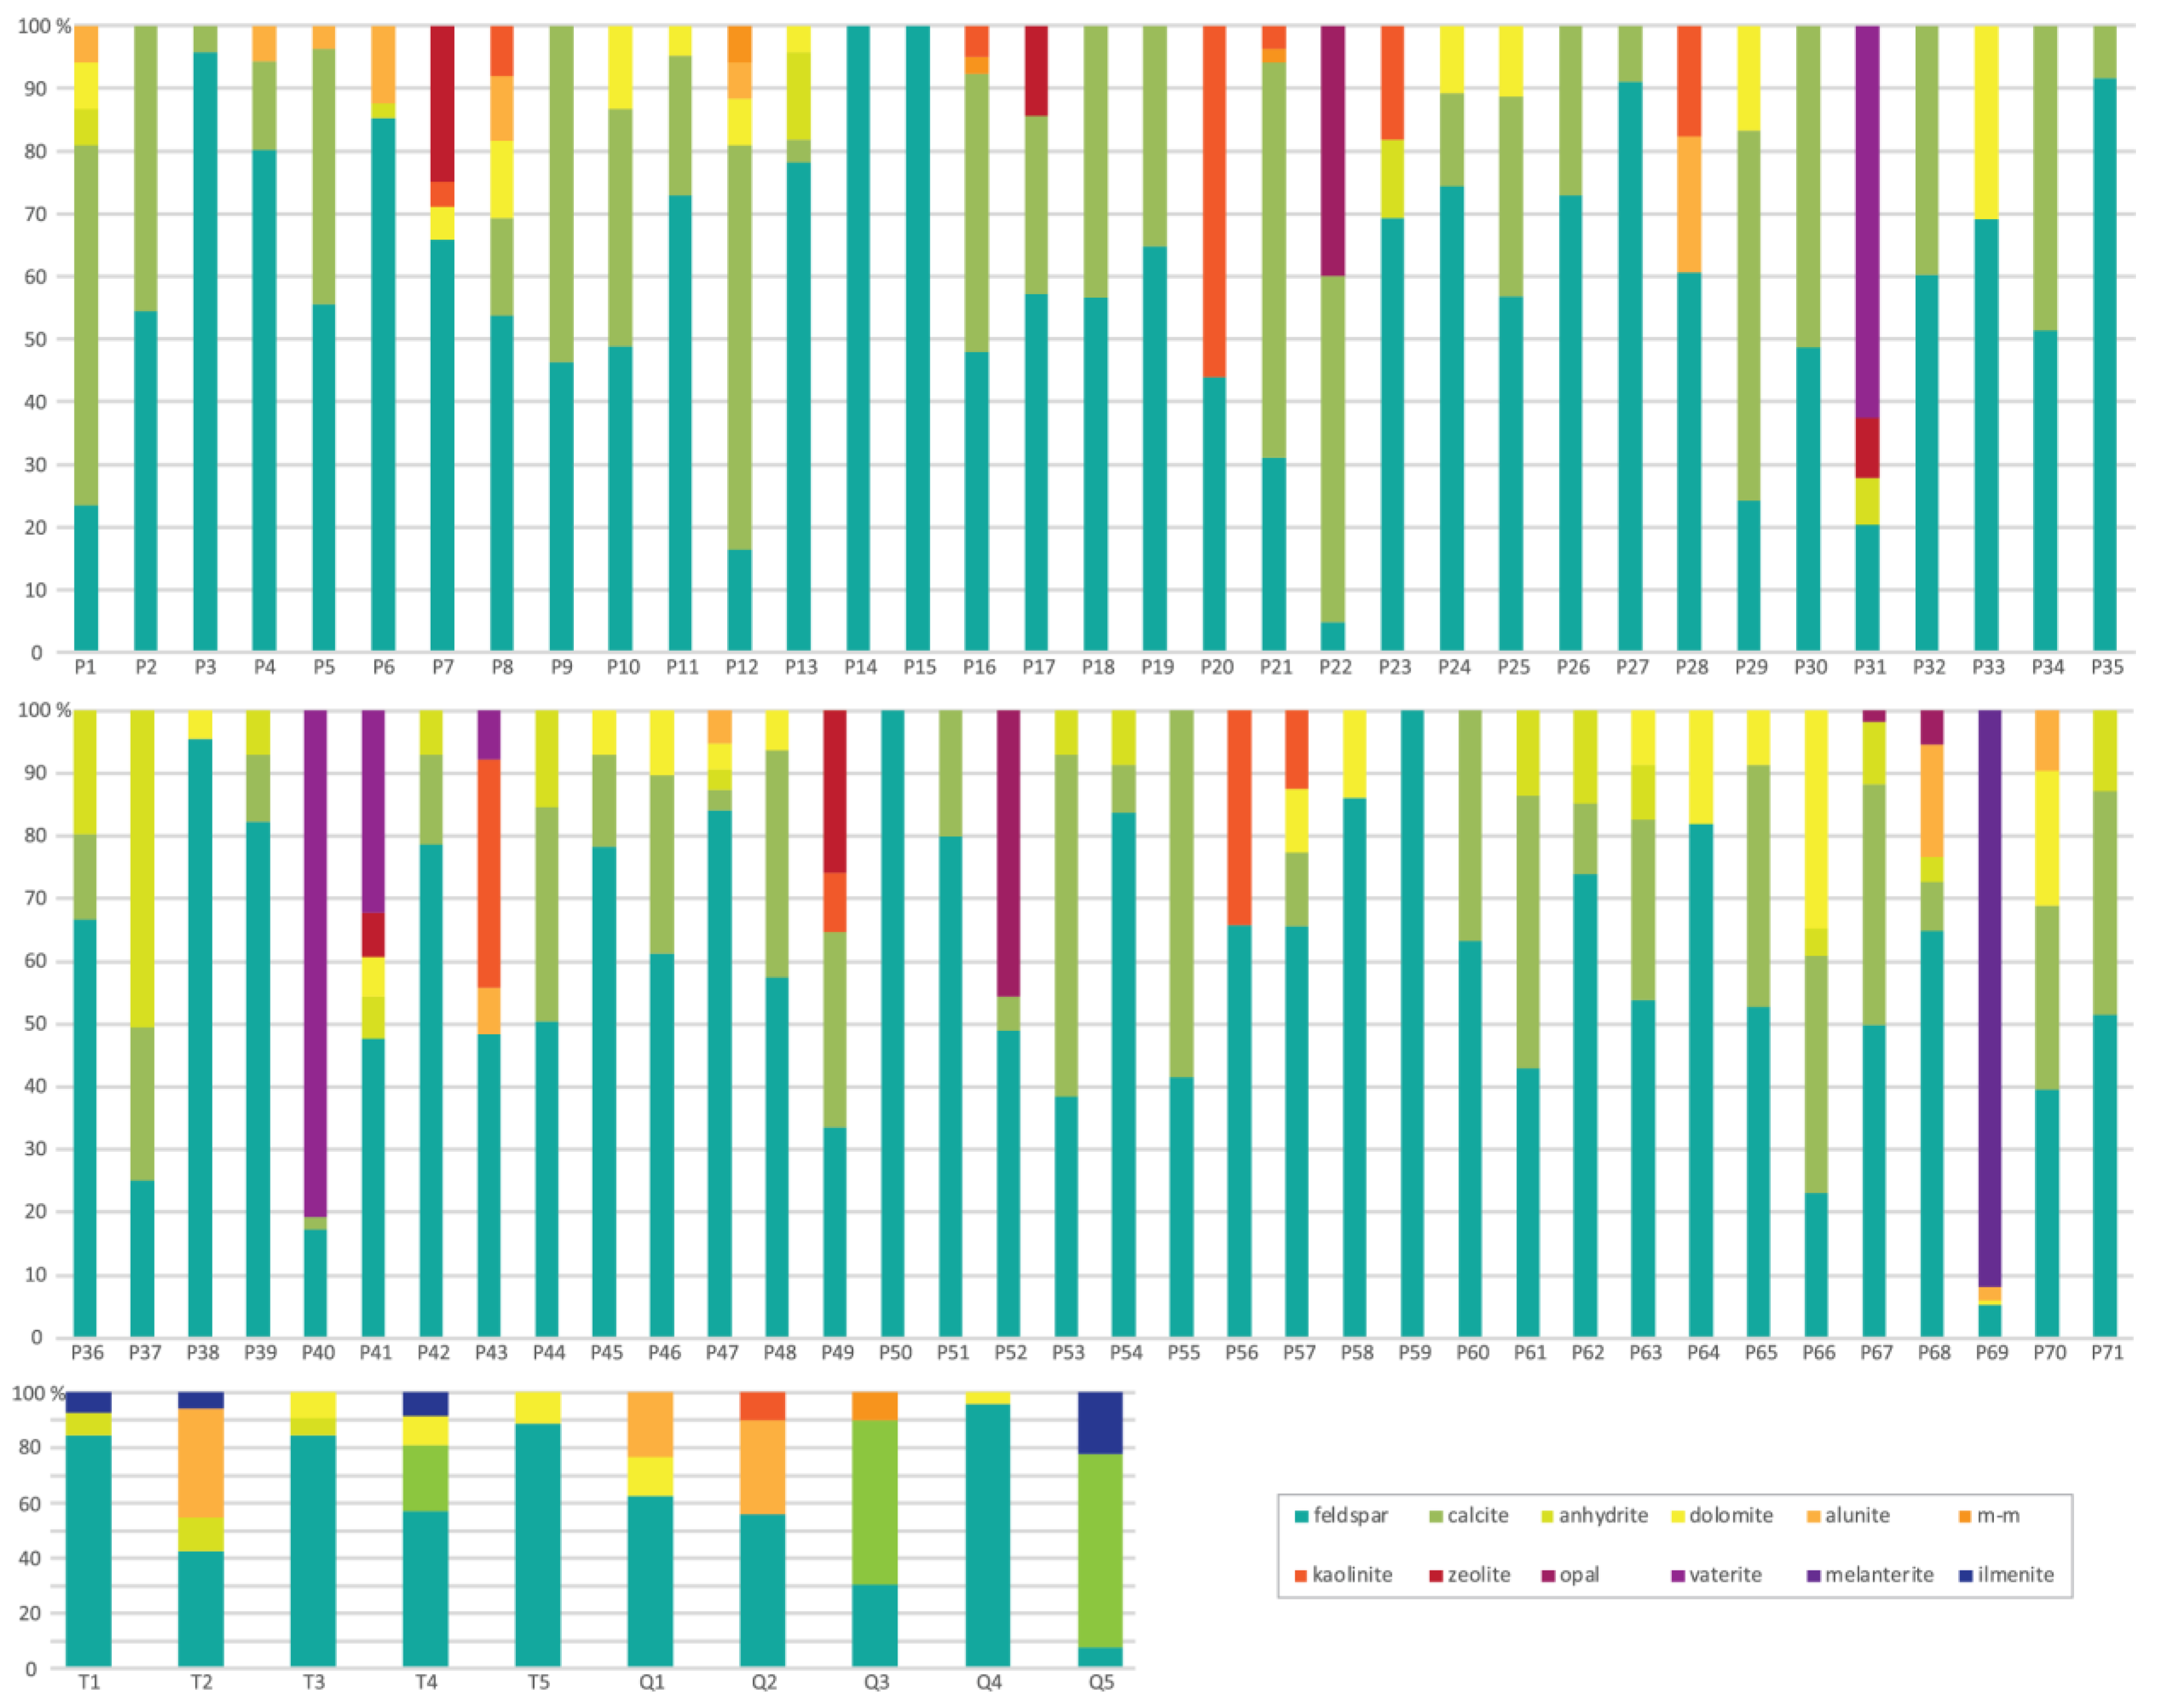
3.1. Mineralogical and Chemical Characterization

Mineralogical analysis showed that quartz (SiO2) was the dominant mineral, ranging 93.1% to 99.6%, except in samples P40 (87.0%) and P60 (68.4%). Other mineral phases present were ranked as follows: feldspars (K feldspar (KAlSi3O8) and plagioclase ((Na,Ca)[(Si,Al)AlSi2]O8); 0.2% to 6.2%) > carbonates (calcite (CaCO3), dolomite (CaMg(CO3)2), and siderite (FeCO3); 0.2% to 5.7%) > kaolinite (Al2(Si2O5)(OH)4; 0.1% to 1.4%) > alunite (KAl3(SO4)2(OH)6; 0.1% to 1.4%) > anhydrite (CaSO4; 0.1% to 1.1%) (Figure 2). Other minerals present in a few samples were magnetite–maghemite (Fe3O4-γ-Fe2O3), zeolites, opal C/CT (SiO2·nH2O), vaterite (CaCO3), and melanterite (Fe2+(H2O)6SO4·H2O). Local background samples revealed a similar trend but showing some ilmenite (Fe2+TiO3; 0.2% to 0.3%). These results are similar to those described by [32], who considered the soils surrounding Hulene-B as heterogeneous as a result of remobilization and mixing of the Ponta Vermelha (90% to 95% quartz) and Malhazine formations (~98% quartz).
The chemical composition of the areas surrounding the waste dump and local background samples is presented in Table 2. Cd was below the limit of detection (LOD 3.88 mg/kg) in 93% of the samples. A one-way ANOVA revealed significant differences between soil and local background sample concentrations of Al, Fe, K, Mn, Ni, Rb, Si, V, and Zr (p < 0.05). Higher concentrations were found in local background samples, except for Si and Zr, with lower content. The high concentrations of Al, Fe, K, Mn, Ni, Rb, and V in the local background samples could be associated with the mineralogical and geochemical composition of Ponta Vermelha formation, characterized by high levels of Al and Fe oxides, continually remobilized to the Malhazine formation [32]. Additionally, the Malhazine formation in local background areas does not exhibit high erosional disturbance or surface runoff, as it is relatively flat. Soils in the surrounding of dump are distributed between a dune slope and a depression (heterogeneous area of sediments from the Malhazine and Ponta Vermelha formations), characterized by strong sediment mobilization and cyclic retention of surface water from the dump and the unchanneled flow of Julius Nyerere Avenue in the east (Figure 1). Studies by [51,52] suggested that Al, Fe, K, Mn, Ni, Rb, and V concentrations in soils with strong surface water circulation and high porosity are prone to strong depletion due to high oxide mobility. The relatively high concentrations of Si in soil samples could be associated with the soil mineralogical composition, with predominance of silicate minerals. The feldspar presence was similar to the results in [32]. Studies by [53] suggested that Fe and Al oxides have the ability to adsorb and retain PTEs. Te authors of [54] suggested that SiO2 mineral also has the aptitude to adsorb PTEs, such as Pb and Cu, while clay minerals, such as kaolinite, can adsorb and retain PTEs in soils [55].
Principal component analysis (PCA) performed on the studied soil samples identified four main components: (a) Group 1, with 61.2% of the total variance explained, grouping Br, Ca, Mg, Mn, Ni, P, S, and Sr with positive loading and Si with negative loading; (b) Group 2, explaining 12.4% of the total variance, with variables Al, Ba, Cr, K, Na, Rb, and V; Group 3, explaining 8.0% of the total variance, with elements Cu, Fe, Pb, Sn, and Zn; (d) Group 4, with 4.4% of the total variance grouping variables Ti and Zr.
Group 1 suggested the existence of two enrichment sources, the anthropogenic Hulene-B dump with elements Br, Ca, Mg, Mn, Ni, P, S, and Sr and a natural source of Si, with negative loading. The waste dump elemental contribution can be evidenced by higher mean concentrations in studied samples when compared to local background mean contents (Table 2). The high Si concentration may be associated with mineralogical phases identified, with >98% quartz (SiO2) [32]. Group 2 variables suggested heterogeneous sources. High Cr concentrations might be related to anthropogenic enrichment (e.g., dump and Julius Nyerere Avenue degraded asphalt). Group 3 variables presented high concentrations of Cu, Pb, Sn, and Zn when compared to local background samples, suggesting anthropogenic sources (e.g., dump, Julius Nyerere Avenue degraded asphalt, and airport traffic flow). The low Fe content can be linked to leaching of Fe oxides given the topographic nature of the sampling area [24], promoting water circulation and infiltration. The low Ti concentration (Group 4) could be associated with geogenic context and the Ti oxide leaching processes. The higher Zr concentration (Group 4), when compared to local background samples, suggested an anthropogenic source (dump).
To access elemental sources, a Spearman correlation analysis (Table 3) was applied to elements Cr, Cu, Mn, Ni, Pb, and Zn, considered by several studies as PTEs [56]. The analysis revealed statistically significant correlations between pairs Cr/Cu, Mn/Cr, Mn/Cu, Ni/Cr, Ni/Cu, Ni/Mn, Pb/Cr, Pb/Cu, Pb/Mn, Pb/Ni, Zn/Cr, Zn/Cu, Zn/Mn, Zn/Ni, Zn/Pb, and Zr/Cr (p < 0.01), suggesting a common source.
Cluster analysis was conducted on selected PTEs in order to assess Cr, Ni, Pb, Mn, Zn, Cu, and Zr common sources. Two main variable groups were formed (Figure 3). Cluster 1 grouped variables Cr, Ni, Pb, Mn, Zr, and Zn, suggesting a common anthropogenic source (Hulene-B waste dump), with elemental concentrations higher than local background samples (p < 0.05). Contaminants may be associated with the dispersion of leachates from the dump, ash from burnt waste, degraded pavements and traffic-related materials from Julius Nyerere Avenue, and the international airport (west of the dump). Cr pollution has been associated with paints, varnishes, organic solvents, oils, and vehicle brakes [57,58], whereas Ni pollution has been associated electronic wastes deposited on the dump [59]. Zr and Mn contamination could be associated with paints, cosmetics, pharmaceuticals, textiles, electrical waste, traffic associated emissions, and electronic equipment [60], while Pb could be associated with electronic wastes such as rechargeable batteries, paint cans, varnishes, organic solvents, glass waste, fuel combustion, and air transport [61]. Cluster 2 grouped elements Cu and Zn, characterized by higher concentrations than local background samples, suggesting a common origin (the dump site). These PTEs were linked to electronic waste, paints, bottle caps, tire wear, and asphalt degradation. Studies by [62] found high concentrations of heavy metals in soils around landfills and considered an association with leachates. Furthermore, the authors of [63,64] suggested that high levels of Pb, Zn, Hg, and Cd in soils around a dumpsite can be associated with ash deposition in soils, resulting from contaminated waste burning.

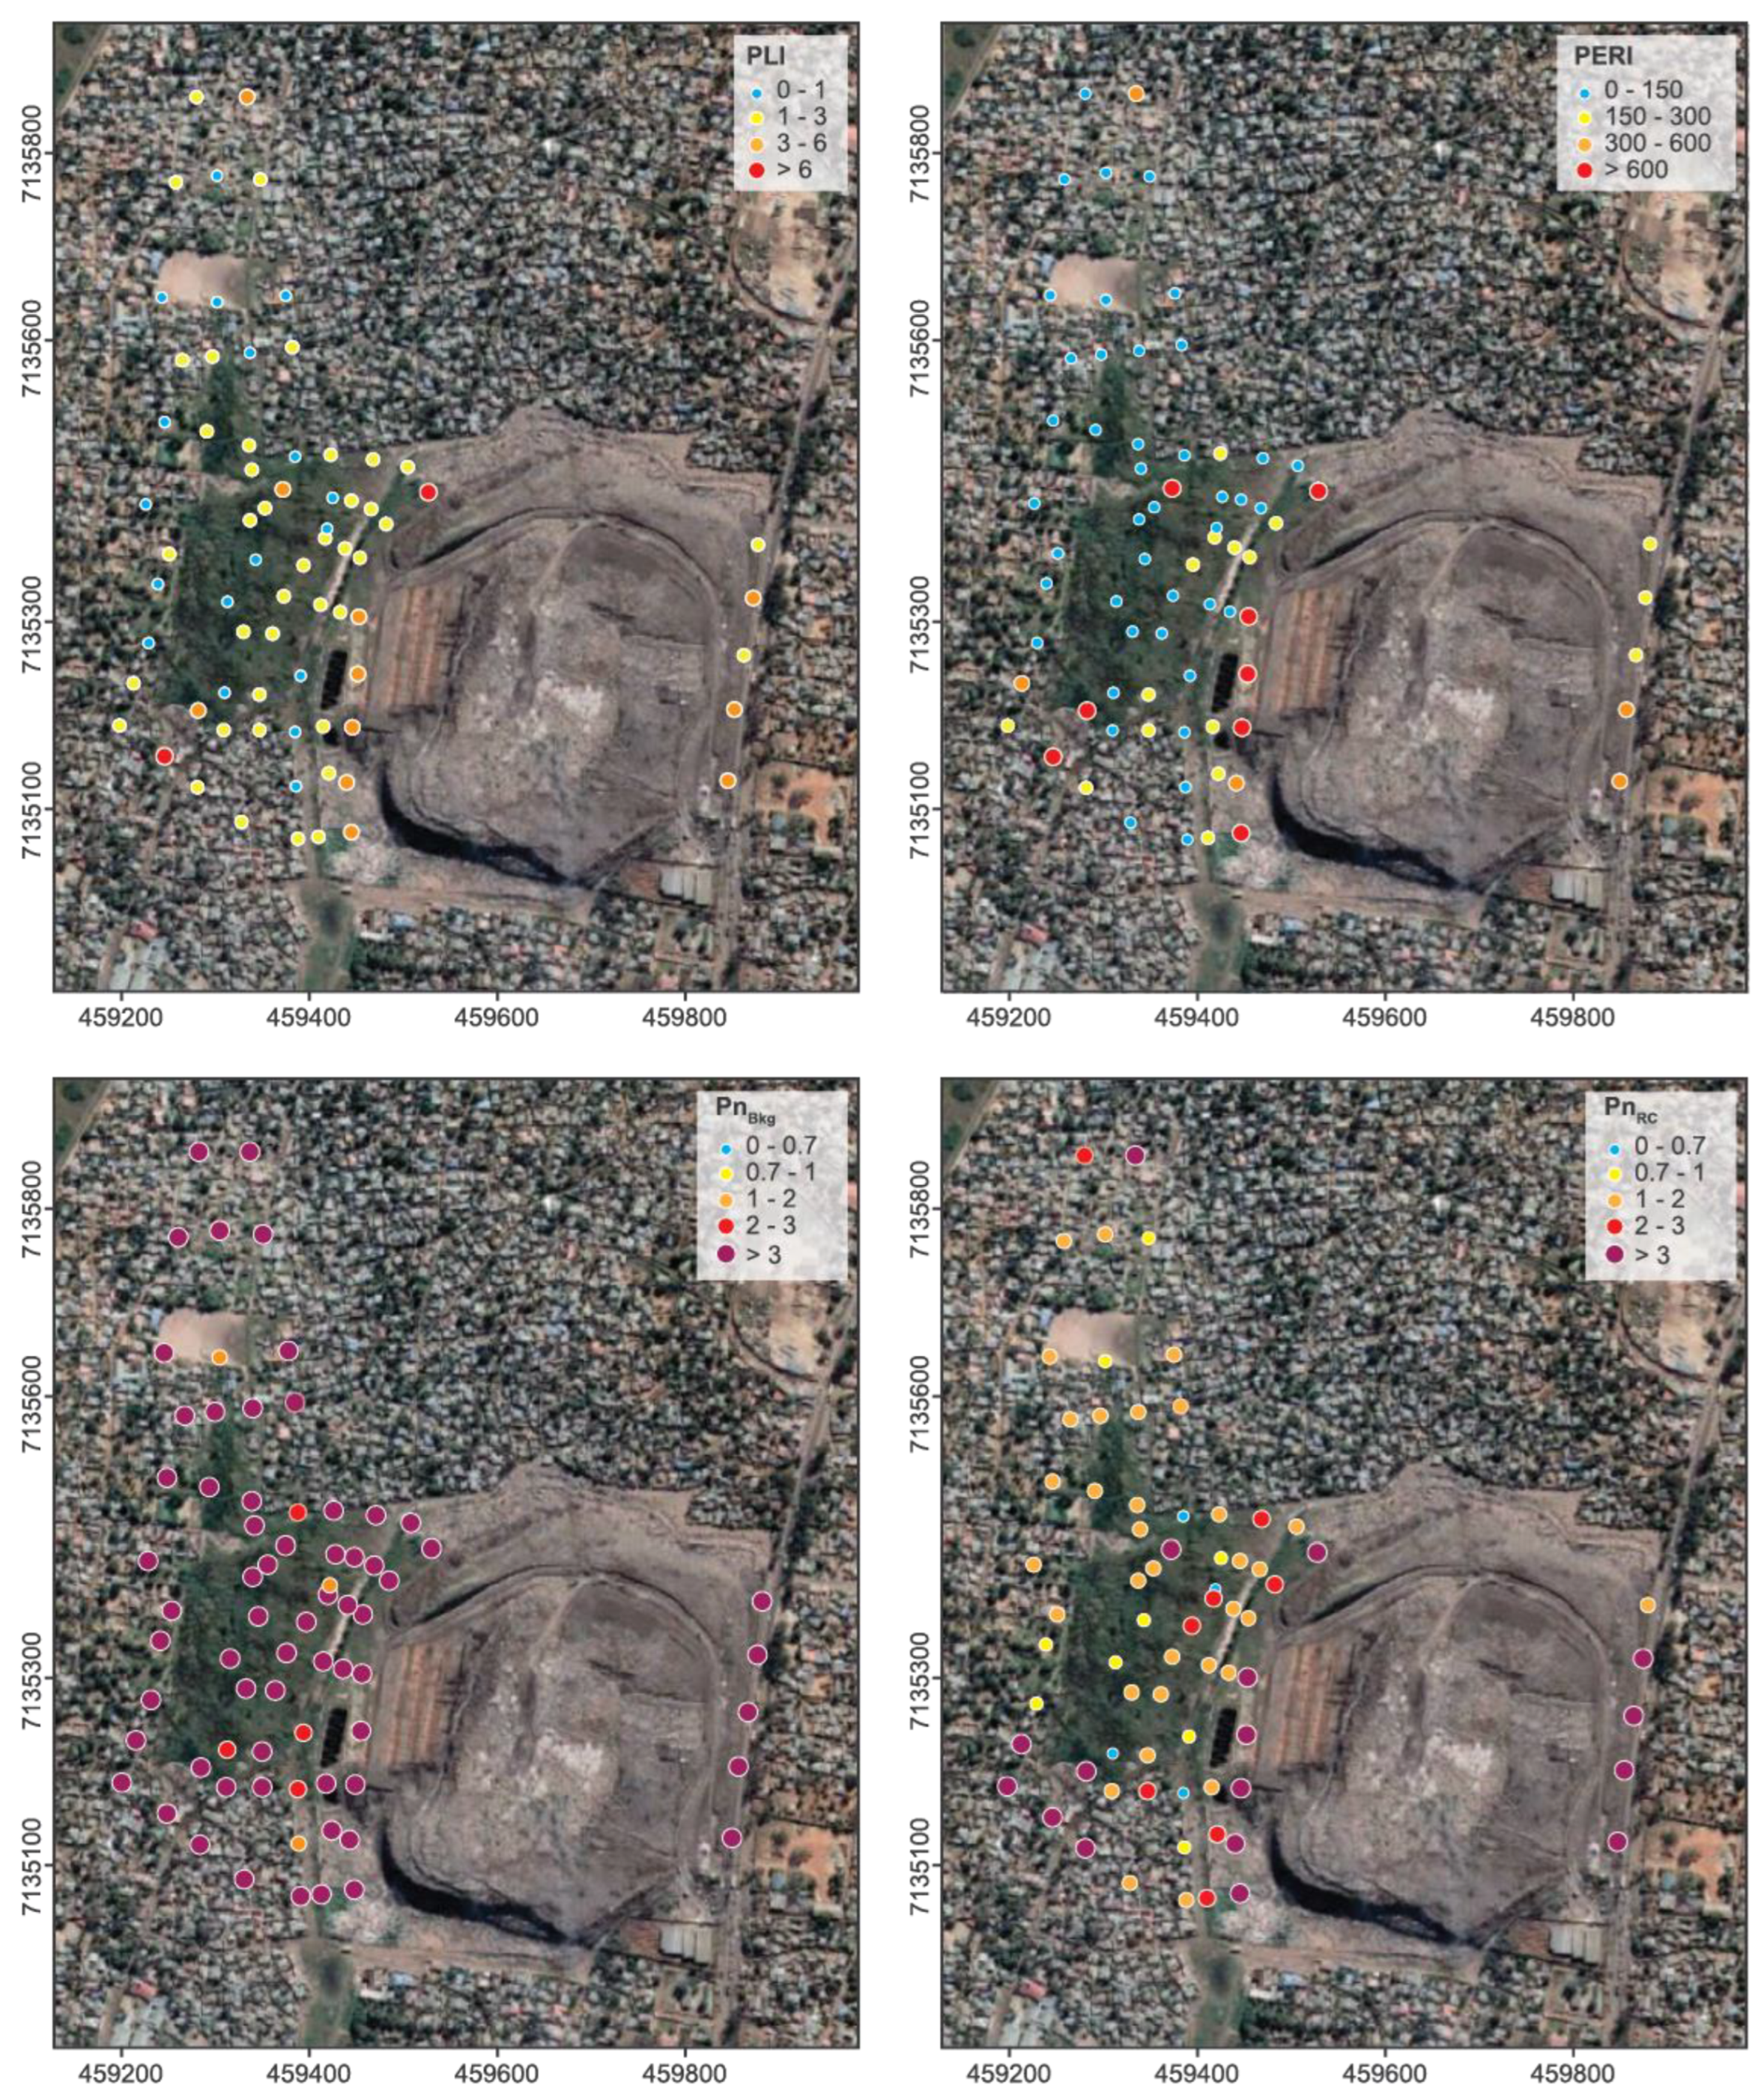
3.2. Environmental Risk Assessment

The PTEs Cr, Cu, Mn, Ni, Pb, Zn, and Zr were selected to estimate the impact on the environment using the potential ecological risk index (PERI), pollution load index (PLI) and soil Nemerow index (PN) (Figure 4). PLI results showed that 15.5% and 2.8% of all samples were classified with high and very high contamination, respectively. A greater representative number of samples (56.3%) were classified with moderate contamination, while 25.4% were classified with low contamination. The PLI individual element contribution was ranked as Zn >> Cu > Pb > Cr = Zr > Ni > Mn. Spatially, the environmental contamination levels varied significantly. PLI results < 1 were found in samples located at the central, western, and northern boundaries of the dump. In turn, samples suggesting high levels of environmental deterioration (PLI > 1), due to Zn >> Cu > Pb > Cr concentrations, were located at the eastern boundary and at the immediate western boundary of the dump. Two samples with extremely high levels of deterioration (PLI > 6) were located at the southwestern (densely inhabited) boundary and at the immediate northwestern boundary of the dump.
PERI results revealed that 59.2% of all samples presented a low ecological risk, while 22.5%, 11.3%, and 7.0% of the samples were classified with moderate, serious, and severe potential ecological risk, respectively. The monomial potential ecological risk factor was ranked as Zn >> Cu > Cr > Zr > Pb > Ni > Mn. The samples with PERI index < 150 were concentrated in the center and north of the sampling area. Medium and high risk was found to the immediate east of the dumpsite and to the east of the sampling area. Extremely high risk (PERI > 600) was predominant in samples to the east, west, and southwest of the dump (densely inhabited).
The soil Nemerow index was calculated using both local background (PNbkg) and world soils (PNRC) proposed by [22]. The spatial distribution of (PNRC) showed that only four samples, on the eastern boundary of sampling area, were classified as nonpolluted. The warning level of pollution was found in random samples in the center, east, west, and north of study area. Samples with low to moderate levels of pollution were predominant at the eastern and northern boundaries, while a high level of pollution was identified in samples at the immediate east and west boundaries of the dump and in the extreme southwest (densely inhabited). The PNbkg suggested that only three samples were classified with a low pollution level, whereas four samples were classified with a moderate pollution level, located at the eastern boundary and in the northern direction of the dump.
The eastern and western boundaries of the dump were characterized by a high pollution level, suggesting a strong contribution of the dump to soil contamination. Pollutants were ranked as Zn >> Cu > Pb > Cr = Zr > Ni > Mn for PNbkg and Cu > Pb > Zn > Cr > Zr > Mn = Ni for PNRC. About 90.1% of studied samples were classified as seriously polluted, with no samples in the safety or precaution domains. PNRC revealed 46.5% of the samples to be slightly polluted and 23.9% to be seriously polluted. The variation between local background and world soil reference indices evidenced a bias resulting from the differing biogeochemical characteristics of the soils [22].
Dumps have been reported to be a source of enrichment of pollutants in surrounding soils [20]. Variables Cr, Cu, Mn, Ni, Pb, Zn, and Zr found in the studied samples could be associated with different anthropogenic sources, such as the dump wastes [65], surrounding traffic and pavement degradation [42], resuspension [66], and airport proximity [67]. Aluminum has been associated with untreated disposal of cans, household utensils, cosmetics, and laminated packaging [7], Cr has been associated with packaging waste from paints, varnishes, organic solvents, and oils [56,57], Cu, Pb, Zn, and Ni have been associated with waste electronic equipment, rechargeable, paint cans, varnishes, organic solvents, and glass waste [58,59], and Zr has been associated with hospital wastes, explosives, and lamps [68], all deposited in the Hulene-B dump.
The spatial distribution of indices (Figure 4) suggested very high levels in the immediate eastern, western, and southwestern limits of the dump, with medium to low levels predominant in the central and northern areas. The high contamination levels found in the southwest area of the dump may be associated with three contamination mechanisms, namely, incineration of wastes ash deposition, a recent sporadic waste disposal area that contributes significantly to leachates, especially during rainy season, with mobile metals such as Mn, Zn, Ni, and Zr [69], and the Maputo International Airport in the vicinity of the study area (Figure 1). Contamination found on samples collected west of the study area may be associated with leachate circulation originating from the dump, an important source of enrichment of mainly Zn, Cu, Pb, and Cr, which are easily incorporated into the leachate [6]. High levels of contamination on the eastern border may be associated with leachate dispersion and intense traffic flow on Julius Nyerere Avenue (Figure 1), due to degraded asphalt, a source of Pb, Cu, Mn, Ni, Zn, and Zr. Recently, the authors of [24] suggested that the area around the Hulene-B dump is characterized by anomalous resistive surfaces associated with heavy-metal contamination, e.g., Cr, Cu, Mn, Ni, Pb, Zn, and Zr, as well as pollutants reported in leachates originating from landfills [70].

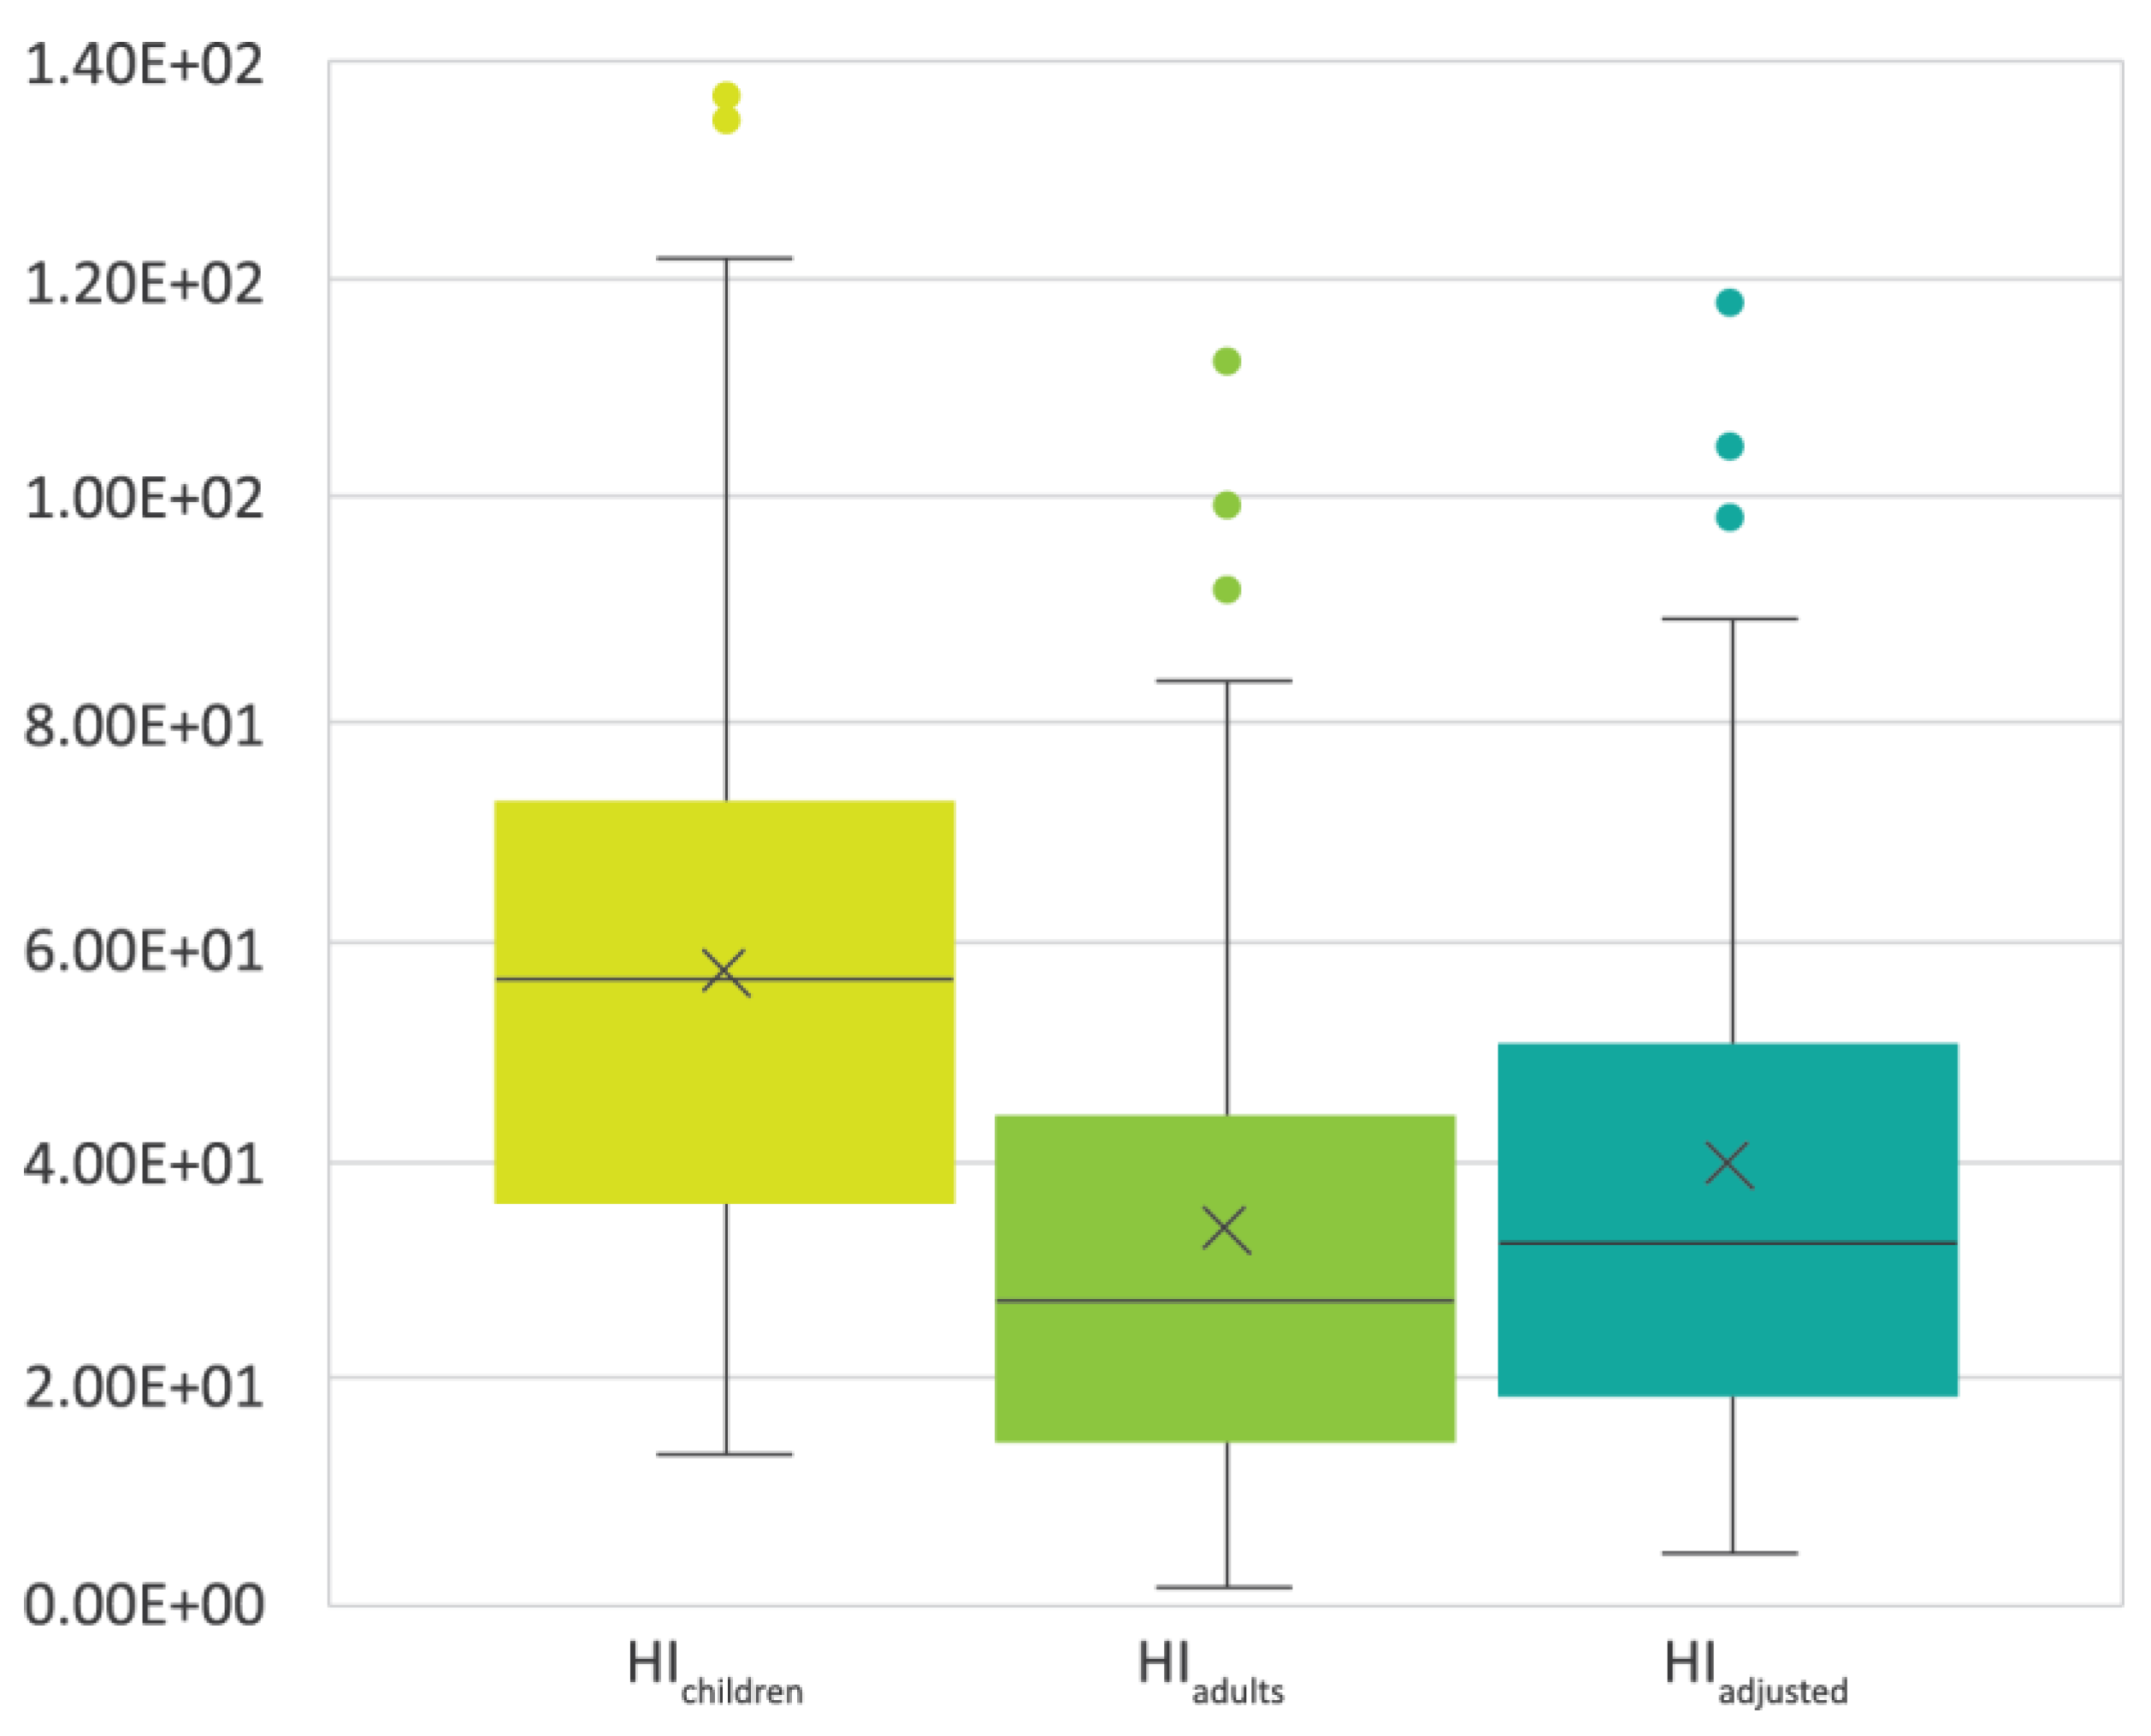
3.3. Human Health Risk Assessment

Areas with contaminated soils pose a health risk to the exposed population [6,71]. For example, Cr chronic exposure can cause nasal irritation, bleeding, ulcers, convulsions, kidney, and liver damage and even death [70]. The mean Cr concentration (41.3 mg/kg) found in the studied soils was below maximum allowable soil (MAS) target proposed by [72] (150 mg/kg). Nevertheless, a maximum of 238 mg/kg was found in a sample located in the eastern end of the waste dump, near Avenida Julius Nyerere. The high concentration levels may be associated with traffic-related waste, such as tires and brakes, as well as emissions from Julius Nyerere Avenue traffic, including degraded road pavement. The toxic effects of Cu chronic exposure include anemia and disorders of the central nervous system and cardiovascular system. The average Cu concentration found in this study was 59.7 mg/kg, below the MAS (150 mg/kg) [71], and a maximum of 1470 mg/kg was found in a sample at the immediate northwestern boundary the dump. This area is characterized by intense tire burning. Tires are considered a source of Cu enrichment. Zinc toxicity leads to loss of appetite, dehydration, weakness, weight loss or gain, diarrhea, and jaundice [73]. The mean content found in the studied samples was 92 mg/kg, below the MAS (250 mg/kg) [71]; however, a maximum of 1077 mg/kg was found in a sample at the immediate northwestern boundary the dump. Zinc enrichment may be associated with batteries, metal alloys, paint cans, cosmetics, pharmaceuticals, textiles, and electrical and electronic equipment, accumulated over time [59]. Nickel chronic exposure has been associated with gastrointestinal and neurological effects including lung cancer [73]. The average concentration in studied samples was 3.4 mg/kg, below the MAS (45 mg/kg) [71]. Ingestion or inhalation of Pb can disturb almost all organs and the nervous system, in addition to causing kidney damage, brain damage, miscarriage, and death [74]. The average concentration found in the studied samples was 30.2 mg/kg, below the MAS (300 mg/kg) [72], with a maximum of 506 mg/kg in a sample at the immediate northwestern boundary the dump. Mn is classified with low toxicity [75]; however, chronic exposure to high levels can cause memory problems, hallucinations, Parkinson’s disease, pulmonary embolism and bronchitis, apathy, schizophrenia, muscle weakness, headaches, and insomnia [76]. The average concentration found was 83 mg/kg, below the MAS (330 mg/kg) [71], and a maximum of 310 mg/kg was observed in a sample at the immediate northwestern boundary the dump. Zr is classified with low toxicity, but chronic exposure can cause respiratory tract irritation, dermatitis, and pulmonary fibrosis, with a few cases reported in nonindustrial settings [77]. The limits of its concentration in soils are still in debate [77].
Considering that the surroundings of the Hulene-B dumpsite are densely populated [27], and that the dumpsite is used daily by adult and children waste-pickers [26], the noncarcinogenic hazard, systemic toxicity, and carcinogenic risk associated with selected PTE concentrations were calculated. The hazard index (HI) for systemic toxicity (Figure 5), as expected, was higher in children than adults, due to the lower body mass and higher absorption factor in children [16,78]. Elements that most contribute to HI are Zr and Al. A higher exposure of children to PTEs present in soils around the Hulene-B dump was recently reported by [26], who found that children around the dump were collecting solid wastes without using proper protection, thus increasing exposure.
Carcinogenic risk, for both children and adults, only posed a significant risk for Pb ingestion in samples P13 (6.19 × 10⁻⁶) and P33 (2.94 × 10⁻⁶), remaining lower than 1.00 × 10⁻⁴, the target level. Sample P13 was collected at the immediate northwestern boundary of the dump, ~20 m away from dwellings, where waste pickers are common, and sample P33 was collected in a residential area, southwest of the dump, representing a risk especially for children, due to hand-to-mouth habits, associated with the fact that Pb accumulates at the soil surface in the first 2–5 cm [60]. Studies by [79,80] described that Pb is very toxic to children and pregnant women, who are more susceptible to adverse health effects. The population around the Hulene-B dump is young and active (14–44 years), representing ~65% of the inhabitants [27], who spend most of their time working on solid waste recycling inside the dump, often without adequate protection [26]. In both samples, total risk and ingestion risk were similar, with inhalation and dermal contact considered negligible.

4. Conclusions

Hazard indices PLI, PN, and PERI ranged from low to moderate in samples collected in the central west area of the dumpsite, whereas samples closer to the dumpsite and at the southwestern edge showed a predominantly high ecological hazard. The Nemerow hazard using local background mean concentrations (PNbkg) revealed a predominantly high hazard (90.1%) in the studied area, suggesting a high level of environmental deterioration. The individual elemental contributions could be ranked as Zn >> Cu > Pb > Cr = Zr > Ni > Mn for the pollution load index, as Zn >> Cu > Cr > Cr > Zr > Pb > Ni > Mn for PERI, and as Zn >> Cu > Pb > Cr = Zr > Ni > Mn for PNbkg. The carcinogenic risk for both children and adults was significant only due to Pb concentrations in the immediate northwest area of the dump (6.19 × 10⁻⁶) and southwest of the densely inhabited dump (2.94 × 10⁻⁶). Future studies are needed to understand the bioaccessibility of metals in soils, allowing the identification of bioaccumulation standards in indicators such as biological absorption coefficient for each element. Given the toxicity of Cr, Cu, Mn, Ni, Pb, Zn, and Zr, especially for children, measures to control and mitigate soil contamination in the surroundings of the Hulene-B dump are pertinent.

Author Contributions

Conceptualization, B.B., C.C. and F.R.; methodology, B.B. and C.C.; formal analysis, C.C. and F.R.; investigation, B.B. and C.C.; writing—original draft preparation, B.B. and C.C.; writing—review and editing, B.B., C.C. and F.R.; supervision, F.R. and C.C. All authors have read and agreed to the published version of the manuscript.

Funding

This work was supported by the GeoBioTec (UIDB/04035/2020) Research Center, funded by FEDER funds through the Operational Program Competitiveness Factors COMPETE and by National funds through FCT. The first author acknowledges grants from the Portuguese Institute Camões and FNI (Investigation National Fund—Mozambique).

Data Availability Statement

Not applicable.

Conflicts of Interest

The authors declare no conflict of interest.

References

  1. Boente, C.; Baragaño, D.; García-González, N.; Forján, R.; Colina, A.; Gallego, J. A holistic methodology to study geochemical and geomorphological control of the distribution of potentially toxic elements in soil. Catena 2022, 208, 105730. [Google Scholar] [CrossRef]
  2. Morita, A.K.M.; Pelinson, N.D.S.; Wendland, E. Persistent impacts of an abandoned non-sanitary landfill in its surroundings. Environ. Monit. Assess. 2020, 192, 463. [Google Scholar] [CrossRef] [PubMed]
  3. Khan, S.; Anjum, R.; Raza, S.T.; Bazai, N.A.; Ihtisham, M. Technologies for municipal solid waste management: Current status, challenges, and future perspectives. Chemosphere 2022, 288, 132403. [Google Scholar] [CrossRef]
  4. Lashen, Z.M.; Shams, M.S.; El-Sheshtawy, H.S.; Slaný, M.; Antoniadis, V.; Yang, X.; Sharma, G.; Rinklebe, J.; Shaheen, S.M.; Elmahdy, S.M. Remediation of Cd and Cu contaminated water and soil using novel nanomaterials derived from sugar beet processing- and clay brick factory-solid wastes. J. Hazard. Mater. 2022, 428, 128205. [Google Scholar] [CrossRef]
  5. Hoang, S.A.; Bolan, N.; Madhubashani, A.; Vithanage, M.; Perera, V.; Wijesekara, H.; Wang, H.; Srivastava, P.; Kirkham, M.; Mickan, B.S.; et al. Treatment processes to eliminate potential environmental hazards and restore agronomic value of sewage sludge: A review. Environ. Pollut. 2022, 293, 118564. [Google Scholar] [CrossRef]
  6. Zaynab, M.; Al-Yahyai, R.; Ameen, A.; Sharif, Y.; Ali, L.; Fatima, M.; Khan, K.A.; Li, S. Health and environmental effects of heavy metals. J. King Saud Univ. Sci. 2022, 34, 101653. [Google Scholar] [CrossRef]
  7. Morita, A.K.; Ibelli-Bianco, C.; Anache, J.A.; Coutinho, J.V.; Pelinson, N.S.; Nobrega, J.; Rosalem, L.M.; Leite, C.M.; Niviadonski, L.M.; Manastella, C.; et al. Pollution threat to water and soil quality by dumpsites and non-sanitary landfills in Brazil: A review. Waste Manag. 2021, 131, 163–176. [Google Scholar] [CrossRef]
  8. Cheela, V.R.S.; Goel, S.; John, M.; Dubey, B. Characterization of municipal solid waste based on seasonal variations, source and socio-economic aspects. Waste Dispos. Sustain. Energy 2021, 3, 275–288. [Google Scholar] [CrossRef]
  9. Breus, D.; Yevtushenko, O. Modeling of Trace Elements and Heavy Metals Content in the Steppe Soils of Ukraine. J. Ecol. Eng. 2022, 23, 159–165. [Google Scholar] [CrossRef]
  10. Singh, A.; Pal, D.B.; Mohammad, A.; Alhazmi, A.; Haque, S.; Yoon, T.; Srivastava, N.; Gupta, V.K. Biological remediation technologies for dyes and heavy metals in wastewater treatment: New insight. Bioresour. Technol. 2022, 343, 126154. [Google Scholar] [CrossRef]
  11. Kalisz, S.; Kibort, K.; Mioduska, J.; Lieder, M.; Małachowska, A. Waste management in the mining industry of metals ores, coal, oil and natural gas—A review. J. Environ. Manag. 2022, 304, 114239. [Google Scholar] [CrossRef]
  12. Meloni, F.; Montegrossi, G.; Lazzaroni, M.; Rappuoli, D.; Nisi, B.; Vaselli, O. Total and Leached Arsenic, Mercury and Antimony in the Mining Waste Dumping Area of Abbadia San Salvatore (Mt. Amiata, Central Italy). Appl. Sci. 2021, 11, 7893. [Google Scholar] [CrossRef]
  13. Li, H.; Sun, J.; Gui, H.; Xia, D.; Wang, Y. Physiochemical properties, heavy metal leaching characteristics and reutilization evaluations of solid ashes from municipal solid waste incinerator plants. Waste Manag. 2021, 138, 49–58. [Google Scholar] [CrossRef]
  14. Hussein, M.; Yoneda, K.; Mohd-Zaki, Z.; Amir, A.; Othman, N. Heavy metals in leachate, impacted soils and natural soils of different landfills in Malaysia: An alarming threat. Chemosphere 2021, 267, 128874. [Google Scholar] [CrossRef]
  15. Soumahoro, N.S.; Kouassi, N.L.B.; Yao, K.M.; Kwa-Koffi, E.K.; Kouassi, A.M.; Trokourey, A. Impact of municipal solid waste dumpsites on trace metal contamination levels in the surrounding area: A case study in West Africa, Abidjan, Cote d’Ivoire. Environ. Sci. Pollut. Res. 2021, 28, 30425–30435. [Google Scholar] [CrossRef] [PubMed]
  16. Yap, C.K.; Chew, W.; Al-Mutairi, K.A.; Nulit, R.; Ibrahim, M.H.; Wong, K.W.; Bakhtiari, A.R.; Sharifinia, M.; Ismail, M.S.; Leong, W.J.; et al. Assessments of the Ecological and Health Risks of Potentially Toxic Metals in the Topsoils of Different Land Uses: A Case Study in Peninsular Malaysia. Biology 2022, 11, 2. [Google Scholar] [CrossRef]
  17. Kimani, N. Implications of the Dandora Municipal Dumping Site in Nairobi, Kenya. Environ. Pollut. Impacts Public Health 2012, 1, 14. [Google Scholar]
  18. Wang, S.; Han, Z.; Wang, J.; He, X.; Zhou, Z.; Hu, X. Environmental risk assessment and factors influencing heavy metal concentrations in the soil of municipal solid waste landfills. Waste Manag. 2022, 139, 330–340. [Google Scholar] [CrossRef]
  19. Essien, J.P.; Ikpe, D.I.; Inam, E.D.; Okon, A.O.; Ebong, G.A.; Benson, N.U. Occurrence and spatial distribution of heavy metals in landfill leachates and impacted freshwater ecosystem: An environmental and human health threat. PLoS ONE 2022, 17, e0263279. [Google Scholar] [CrossRef] [PubMed]
  20. El Fadili, H.; Ben Ali, M.; Touach, N.; El Mahi, M.; Lotfi, E.M. Ecotoxicological and pre-remedial risk assessment of heavy metals in municipal solid wastes dumpsite impacted soil in morocco. Environ. Nanotechnol. Monit. Manag. 2022, 17, 100640. [Google Scholar] [CrossRef]
  21. Liao, J.; Cui, X.; Feng, H.; Yan, S. Environmental Background Values and Ecological Risk Assessment of Heavy Metals in Watershed Sediments: A Comparison of Assessment Methods. Water 2022, 14, 51. [Google Scholar] [CrossRef]
  22. Reimann, C.; Caritat, P. Chemical Elements in the Environment: Factsheets for the Geochemist and Environmental Scientist; Springer: Berlin, Germany, 1998; ISBN 3540636706. [Google Scholar]
  23. Serra, C. Da Problemática Ambiental à Mudança: Rumo à um Mundo Melhor; Editora Escolar: Maputo, Mozambique, 2012; ISBN 0A9789896700300. (In Portuguese) [Google Scholar]
  24. Bernardo, B.; Candeias, C.; Rocha, F. Application of Geophysics in geo-environmental diagnosis on the surroundings of the Hulene-B waste dump, Maputo, Mozambique. J. Afr. Earth Sci. 2022, 185, 104415. [Google Scholar] [CrossRef]
  25. Vicente, E.; Jermy, C.; Schreiner, H. Urban geology of Maputo, Mozambique. Geol. Soc. London 2006, 338, 1–13. Available online: https://citeseerx.ist.psu.edu/viewdoc/download?doi=10.1.1.606.7220&rep=rep1&type=pdf (accessed on 10 February 2022).
  26. Matsinhe, F.; Paulo, M. Estudo Etnográfico sobre os catadores de Lixo da Lixeira de Hulene (Maputo); Cadernos África Contemporânea 3; Universidade Eduardo Mondlane: Maputo, Moçambique, 2020; ISSN 2595-5713. [Google Scholar]
  27. INE. Boletim de Estatísticas Demográficas e Sociais, Maputo Cidade 2019; Instituto Nacional de Estatistica: Maputo, Mozambique, 2020. Available online: http://www.ine.gov.mz/estatisticas/estatisticas-demograficas-e-indicadores-sociais/boletim-de-indicadores-demograficos-22-de-julho-de-2020.pdf/at_download/file. (accessed on 21 February 2022).
  28. Palalane, J.; Segala, I. Urbanização e Desenvolvimento Municipal em Moçambique: Gestão de Resíduos Sólidos. Available online: https://limpezapublica.com.br/urbanizacao-e-desenvolvimento-municipal-em-mocambique-capitulo-gestao-de-residuos-solidos/ (accessed on 22 April 2022).
  29. Ferrão, D. Evaluation of Removal and Disposal of Solid Waste in Maputo City, Mozambique. Master’s Thesis, University of Cape Town, Cape Town, South Africa, 2006. Available online: https://open.uct.ac.za/bitstream/handle/11427/4851/thesis_sci_2006_ferrao_d_a_g.pdf?sequence=1 (accessed on 10 February 2022).
  30. WHO. Global Air Quality Guidelines Particulate matter (PM2.5 and PM10), Ozone, Nitrogen Dioxide, Sulfur Dioxide and Carbon Monoxide. World Health Organization. 2020. Available online: https://apps.who.int/iris/bitstream/handle/10665/345334/9789240034433-eng.pdf (accessed on 10 February 2022).
  31. Afonso, R. A Geologia de Moçambique—Notícia Explicativa da Carta Geológica de Moçambique 1978, 1:2,000,000; Imprensa Nacional de Moçambique: Maputo, Moçambique, 1978. (In Portuguese) [Google Scholar]
  32. Momade, F.; Ferrara, M.; Oliveira, J. Notícia Explicativa da Carta Geológica 2532 Maputo (1:50,000); Direção Nacional de Geologia: Maputo, Mozambique, 1996. (In Portuguese) [Google Scholar]
  33. Cendón, D.I.; Haldorsen, S.; Chen, J.; Hankin, S.; Nogueira, G.; Momade, F.; Achimo, M.; Muiuane, E.; Mugabe, J.; Stigter, T.Y. Hydrogeochemical aquifer characterization and its implication for groundwater development in the Maputo district, Mozambique. Quat. Int. 2020, 547, 113–126. [Google Scholar] [CrossRef]
  34. Nhantumbo, A.B.; Cambule, A.H. Bulk density by Proctor test as a function of texture for agricultural soils in Maputo province of Mozambique. Soil Tillage Res. 2006, 87, 231–239. [Google Scholar] [CrossRef]
  35. CIAT. Climate-Smart Agriculture in Mozambique. Climate-Smart Agriculture in Mozambique, Center for Tropical Agriculture 2017. Available online: https://climateknowledgeportal.worldbank.org/sites/default/files/2019-06/CSA-in-Mozambique.pdf (accessed on 13 April 2022).
  36. Muchangos, A. Paisagens e Regiões Naturais de Moçambique; Editora Escolar: Maputo, Mozambique, 1999; Available online: https://docplayer.com.br/47220681-Mocambique-paisagens-e-regioes-naturais.html (accessed on 30 April 2022).
  37. Håkanson, L. An ecological risk index for aquatic pollution control. A sedimentological approach. Water Res. 1980, 14, 975–1001. [Google Scholar] [CrossRef]
  38. Candeias, C.; Da Silva, E.F.; Ávila, P.F.; Teixeira, J.P. Identifying Sources and Assessing Potential Risk of Exposure to Heavy Metals and Hazardous Materials in Mining Areas: The Case Study of Panasqueira Mine (Central Portugal) as an Example. Geosciences 2014, 4, 240–268. [Google Scholar] [CrossRef] [Green Version]
  39. Bowen, H.J.M. Trace Elements in Biochemistry; Academic Press: London, UK, 1966. [Google Scholar]
  40. Candeias, C.; Ávila, P.F.; Alves, C.; Gama, C.; Sequeira, C.; da Silva, E.F.; Rocha, F. Dust Characterization and Its Potential Impact during the 2014–2015 Fogo Volcano Eruption (Cape Verde). Minerals 2021, 11, 1275. [Google Scholar] [CrossRef]
  41. Nazzal, Y.; Bărbulescu, A.; Howari, F.; Al-Taani, A.; Iqbal, J.; Xavier, C.; Sharma, M.; Dumitriu, C. Assessment of Metals Concentrations in Soils of Abu Dhabi Emirate Using Pollution Indices and Multivariate Statistics. Toxics 2021, 9, 95. [Google Scholar] [CrossRef]
  42. Candeias, C.; Ávila, P.F.; Sequeira, C.; Manuel, A.; Rocha, F. Potentially toxic elements dynamics in the soil rhizospheric-plant system in the active volcano of Fogo (Cape Verde) and interactions with human health. Catena 2022, 209, 105843. [Google Scholar] [CrossRef]
  43. Xiao, H.; Shahab, A.; Xi, B.; Chang, Q.; You, S.; Li, J.; Sun, X.; Huang, H.; Li, X. Heavy metal pollution, ecological risk, spatial distribution, and source identification in sediments of the Lijiang River, China. Environ. Pollut. 2021, 269, 116189. [Google Scholar] [CrossRef]
  44. Candeias, C.; Vicente, E.; Tomé, M.; Rocha, F.; Ávila, P.; Célia, A. Geochemical, Mineralogical and Morphological Characterisation of Road Dust and Associated Health Risks. Int. J. Environ. Res. Public Health 2020, 17, 1563. [Google Scholar] [CrossRef] [Green Version]
  45. Zhang, Y.; Wang, S.; Gao, Z.; Zhang, H.; Zhu, Z.; Jiang, B.; Liu, J.; Dong, H. Contamination characteristics, source analysis and health risk assessment of heavy metals in the soil in Shi River Basin in China based on high density sampling. Ecotoxicol. Environ. Saf. 2021, 227, 112926. [Google Scholar] [CrossRef] [PubMed]
  46. Mallongi, A.; Astuti, R.D.P.; Amiruddin, R.; Hatta, M.; Rauf, A.U. Identification source and human health risk assessment of potentially toxic metal in soil samples around karst watershed of Pangkajene, Indonesia. Environ. Nanotechnol. Monit. Manag. 2022, 17, 100634. [Google Scholar] [CrossRef]
  47. USEPA. Risk Assessment Guidance for Superfund, Volume I: Human Health Evaluation Manual; EPA 540-1-89-002; U.S. Environmental Protection Agency: Washington, DC, USA, 1989. [Google Scholar]
  48. USEPA. Screening Levels (RSL) for Chemical Contaminants at Superfund Sites. U.S.; U.S. Environmental Protection Agency: Washington, DC, USA, 2013. [Google Scholar]
  49. Berg, R. Human Exposure to Soil Contamination: A Qualitative and Quantitative Analysis towards Proposals for Human Toxicological Intervention Values (Partly Revised Edition); Report No. 725201011; National Institute for Public Health and the Environment: Leiderdorp, The Netherlands, 1994. [Google Scholar]
  50. RAIS. The Risk Assessment Information System (RAIS); U.S. Department of Energy’s Oak Ridge Operations Office (ORO): Oak Ridge, TN, USA, 2022. Available online: https://rais.ornl.gov/ (accessed on 10 May 2022).
  51. Ghasera, K.M.; Rashid, S.A. Geochemical characteristics of two contrasting weathering profiles developed at high altitude, NE Lesser Himalaya, India: Implications for controlling factors and mobility of elements. J. Earth Syst. Sci. 2022, 131, 5. [Google Scholar] [CrossRef]
  52. Han, B.; Weatherley, A.J.; Mumford, K.; Bolan, N.; He, J.-Z.; Stevens, G.W.; Chen, D. Modification of naturally abundant resources for remediation of potentially toxic elements: A review. J. Hazard. Mater. 2022, 421, 126755. [Google Scholar] [CrossRef]
  53. Kabata-Pendias, A. Trace Elements in Soils and Plants, 3rd ed.; CRC Press: Boca Raton, FL, USA, 2000. [Google Scholar] [CrossRef]
  54. Bai, B.; Nie, Q.; Zhang, Y.; Wang, X.; Hu, W. Cotransport of heavy metals and SiO2 particles at different temperatures by seepage. J. Hydrol. 2021, 597, 125771. [Google Scholar] [CrossRef]
  55. Srivastava, P.; Singh, B.; Angove, M. Competitive adsorption behavior of heavy metals on kaolinite. J. Colloid Interface Sci. 2005, 290, 28–38. [Google Scholar] [CrossRef]
  56. Fan, P.; Lu, X.; Yu, B.; Fan, X.; Wang, L.; Lei, K.; Yang, Y.; Zuo, L.; Rinklebe, J. Spatial distribution, risk estimation and source apportionment of potentially toxic metal(loid)s in resuspended megacity street dust. Environ. Int. 2022, 160, 107073. [Google Scholar] [CrossRef] [PubMed]
  57. Al-Salem, S.M. Soil quality of simulated landfill exposure to plastics in context of heavy metal analysis. Environ. Sci. Pollut. Res. 2021, 28, 36904–36910. [Google Scholar] [CrossRef]
  58. Safonov, A.; Popova, N.; Andrushenko, N.; Boldyrev, K.; Yushin, N.; Zinicovscaia, I. Investigation of materials for reactive permeable barrier in removing cadmium and chromium(VI) from aquifer near a solid domestic waste landfill. Environ. Sci. Pollut. Res. 2021, 28, 4645–4659. [Google Scholar] [CrossRef] [PubMed]
  59. Fiala, M.; Hwang, H.-M. Influence of Highway Pavement on Metals in Road Dust: A Case Study in Houston, Texas. Water Air Soil Pollut. 2021, 232, 185. [Google Scholar] [CrossRef]
  60. Islamd, S.; Idris, A.M.; Islam, A.R.M.T.; Phoungthong, K.; Ali, M.M.; Kabir, H. Geochemical variation and contamination level of potentially toxic elements in land-uses urban soils. Int. J. Environ. Anal. Chem. 2021, 1–18. [Google Scholar] [CrossRef]
  61. Alghamdi, A.G.; Aly, A.A.; Ibrahim, H.M. Assessing the environmental impacts of municipal solid waste landfill leachate on groundwater and soil contamination in western Saudi Arabia. Arab. J. Geosci. 2021, 14, 350. [Google Scholar] [CrossRef]
  62. Gujre, N.; Mitra, S.; Soni, A.; Agnihotri, R.; Rangan, L.; Rene, E.R.; Sharma, M.P. Speciation, contamination, ecological and human health risks assessment of heavy metals in soils dumped with municipal solid wastes. Chemosphere 2021, 262, 128013. [Google Scholar] [CrossRef]
  63. Obiri-Nyarko, F.; Duah, A.A.; Karikari, A.Y.; Agyekum, W.A.; Manu, E.; Tagoe, R. Assessment of heavy metal contamination in soils at the Kpone landfill site, Ghana: Implication for ecological and health risk assessment. Chemosphere 2021, 282, 131007. [Google Scholar] [CrossRef] [PubMed]
  64. Chen, H.; Wang, L.; Hu, B.; Xu, J.; Liu, X. Potential driving forces and probabilistic health risks of heavy metal accumulation in the soils from an e-waste area, southeast China. Chemosphere 2022, 289, 133182. [Google Scholar] [CrossRef] [PubMed]
  65. Amiri, H.; Daneshvar, E.; Azadi, S. Contamination level and risk assessment of heavy metals in the topsoil around cement factory: A case study. Environ. Eng. Res. 2021, 27, 210313. [Google Scholar] [CrossRef]
  66. Brtnický, M.; Pecina, V.; Baltazár, T.; Galiová, M.V.; Baláková, L.; Bęś, A.; Radziemska, M. Environmental Impact Assessment of Potentially Toxic Elements in Soils Near the Runway at the International Airport in Central Europe. Sustainability 2020, 12, 7224. [Google Scholar] [CrossRef]
  67. Perks, C.; Mudd, G.M.; Currell, M. Using corporate sustainability reporting to assess the environmental footprint of titanium and zirconium mining. Extr. Ind. Soc. 2021, 9, 101034. [Google Scholar] [CrossRef]
  68. Gautam, P.; Kumar, S. Characterisation of Hazardous Waste Landfill Leachate and its Reliance on Landfill Age and Seasonal Variation: A Statistical Approach. J. Environ. Chem. Eng. 2021, 9, 105496. [Google Scholar] [CrossRef]
  69. Aydi, A.; Mhimdi, A.; Hamdi, I.; Touaylia, S.; Sdiri, A. Application of electrical resistivity tomography and hydro-chemical analysis for an integrated environmental assessment. Environ. Nanotechnol. Monit. Manag. 2020, 14, 100351. [Google Scholar] [CrossRef]
  70. Aghili, S.; Vaezihir, A.; Hosseinzadeh, M. Distribution and modeling of heavy metal pollution in the sediment and water mediums of Pakhir River, at the downstream of Sungun mine tailing dump, Iran. Environ. Earth Sci. 2018, 77, 128. [Google Scholar] [CrossRef]
  71. Ceballos, E.; Dubny, S.; Othax, N.; Zabala, M.E.; Peluso, F. Assessment of Human Health Risk of Chromium and Nitrate Pollution in Groundwater and Soil of the Matanza-Riachuelo River Basin, Argentina. Expo. Health 2021, 13, 323–336. [Google Scholar] [CrossRef]
  72. EU. Heavy Metals and Organic Compounds from Wastes Used as Organic Fertilisers; Final Report for ENV. A. 2./ETU/2001/0024. 2004. Available online: https://ec.europa.eu/environment/pdf/waste/compost/hm_finalreport.pdf (accessed on 15 January 2022).
  73. Stuckey, J.W.; Neaman, A.; Verdejo, J.; Navarro-Villarroel, C.; Peñaloza, P.; Dovletyarova, E.A. Zinc Alleviates Copper Toxicity to Lettuce and Oat in Copper-Contaminated Soils. J. Soil Sci. Plant Nutr. 2021, 21, 1229–1235. [Google Scholar] [CrossRef]
  74. Naveed, M.; Bukhari, S.; Mustafa, A.; Ditta, A.; Alamri, S.; El-Esawi, M.; Rafique, M.; Ashraf, S.; Siddiqui, M. Mitigation of Nickel Toxicity and Growth Promotion in Sesame through the Application of a Bacterial Endophyte and Zeolite in Nickel Contaminated Soil. Int. J. Environ. Res. Public Health 2020, 17, 8859. [Google Scholar] [CrossRef] [PubMed]
  75. Sattar, S.; Jehan, S.; Siddiqui, S. Potentially toxic metals in the petroleum waste contaminated soils lead to human and ecological risks in Potwar and Kohat Plateau, Pakistan: Application of multistatistical approaches. Environ. Technol. Innov. 2021, 22, 101395. [Google Scholar] [CrossRef]
  76. Li, J.; Smith, R.L.; Xu, S.; Yang, J.; Zhang, K.; Shen, F. Manganese oxide as an alternative to vanadium-based catalysts for effective conversion of glucose to formic acid in water. Green Chem. 2022, 24, 315–324. [Google Scholar] [CrossRef]
  77. Stewart, C.; Damby, D.E.; Horwell, C.J.; Elias, T.; Ilyinskaya, E.; Tomašek, I.; Longo, B.M.; Schmidt, A.; Carlsen, H.K.; Mason, E.; et al. Volcanic air pollution and human health: Recent advances and future directions. Bull. Volcanol. 2022, 84, 11. [Google Scholar] [CrossRef]
  78. Jones, J.V.; Piatak, N.M.; Bedinger, G.M. Zirconium and hafnium, Chap. V. In Critical Mineral Resources of the United States Economic and Environ Mental Geology and Prospects for Future Supply; Schulz, K.J., DeYoung, J.H., Jr., Seal, R.R., Bradley, D.C., Eds.; U.S. Geological Survey Professional: St. Petersburg, FL, USA, 2017; p. 26. Available online: https://doi.org/https://doi.org/10.3133/pp1802V (accessed on 21 February 2022).
  79. Lian, Z.; Zhao, X.; Gu, X.; Li, X.; Luan, M.; Yu, M. Presence, sources, and risk assessment of heavy metals in the upland soils of northern China using Monte Carlo simulation. Ecotoxicol. Environ. Saf. 2022, 230, 113154. [Google Scholar] [CrossRef] [PubMed]
  80. Wixson, B.G.; Davies, B.E. Lead in Soil; CRC Press: Boca Raton, FL, USA, 2017. [Google Scholar] [CrossRef]
Figure 1. Study area with (a) dune depression, (b) Hulene-B waste dump, and (c,d) areas considered not impacted.
Geosciences 12 00290 g001
Figure 2. Mineral phases identified on the studied soils and local background samples. Quartz was not considered.
Geosciences 12 00290 g002
Figure 3. Hierarchical cluster analysis of the selected PTEs.
Geosciences 12 00290 g003
Figure 4. Potential ecological risk index (PERI), pollution load index (PLI), and soil Nemerow index calculated with local background soils and with world soils proposed by Reimann and Caritat (1998).
Geosciences 12 00290 g004
Figure 5. Hazard index for systemic toxicity for children and adults, as well as adjusted for both children and adults.
Geosciences 12 00290 g005
Table 1. Monomial potential ecological risk factor (EF) and potential ecological risk index (PERI) classification levels [37].
EFClassificationPERIClassification
0 ≤ EF < 40LowPERI < 150Low
40 ≤ EF < 80Moderate150 ≤ PERI < 300Moderate
80 ≤ EF < 160Considerable300 ≤ PERI < 60Considerable
160 ≤ EF < 32Very high600 ≤ PERIVery high
320 ≤ EFVery high
Table 2. Descriptive statistics of studied soil and local background samples (in mg/kg).
VarSoils (n = 71)Local Background (n = 10)
MinMaxMeanSDMinMaxMeanSD
Al639924,51011,453397419,10132,20022,4064061
Ba64287117417213410623
Br0.512.13.72.41.03.52.30.8
Ca48631,24091678630243843471217
Cr10.3238.041.341.120.059.433.511.5
Cu3.3147059.71896.814.09.22.1
Fe136427,839465542045316920468011255
K351210,60162781719640914,12990012263
Mg103 028979530609965675104
Mn2331083579519414034
Na386376910917805191803974343
Ni0.516.13.43.32.85.23.90.7
P793 02968667712728419753
Pb6.450630.259.66.69.57.80.8
Rb8.028.813.13.413.923.818.03.8
Si363,290451,075430,50518,882398,497433,284422,57313,835
Sn0.51107.012.90.54.93.41.6
S5032285445785517510331
Sr98929.521.810.018.013.62.7
Ti77928121624514112133331754696
V318.47.33.39.619.913.63.3
Zn21077921623431
Zr65341161658120012340
Var—variable; Bkg—local background; min—minimum; max—maximum; SD—standard deviation.
Table 3. Spearman correlation between the selected PTEs of the soil samples.
CrCuMnNiPbZn
Cu0.640 **1
Mn0.747 **0.709 **1
Ni0.770 **0.699 **0.792 **1
Pb0.626 **0.759 **0.669 **0.711 **1
Zn0.695 **0.813 **0.791 **0.799 **0.734 **1
Zr0.377 **0.140.2180.1520.1750.155
** p < 0.01.
Publisher’s Note: MDPI stays neutral with regard to jurisdictional claims in published maps and institutional affiliations.

