Abstract
The generalized Hoek-Brown (GHB) failure criterion can estimate the rock mass parameters required for rock mechanics–related analyses such as numerical modeling in geomechanics. The determination of GHB parameters has been developed in the field of rock mechanics. Due to the wide use of the Mohr-Coulomb criterion and the lack of an existing relationship for determining its parameters for a rock mass, equivalent Mohr-Coulomb parameters (EMC) can be derived from the GHB. To determine the differences in the use of these two criteria, we analyzed the behavior of a deep circular tunnel in nine stress states for three metamorphic rocks recovered from the Canadian Shield from rock masses that present a very blocky structure. We carried out 241 simulations using the finite element code RS2 to assess the effect of the geological strength index (GSI), in situ stress, and rock type on the deviation of wall displacement, the number of yielded elements, and the differential stress obtained by the GHB and EMC parameters. A combination of low in situ stress and high GSI yielded similar results when using both failure criteria.
1. Introduction
The generalized Hoek-Brown (GHB) criterion is the most widely used rock mass failure criterion in geotechnical engineering, although it is semi-empirical in nature and has certain limitations. The GHB is the most recent failure criterion [1], combining the geological strength index (GSI) and the intact rock parameters to offer a practical means of estimating rock mass properties in geotechnical projects such as tunneling, slopes, and foundation. There have been many efforts to determine the GHB parameters for a rock mass based on in situ characterization of the rock mass and laboratory tests on the intact rock. Many empirical equations have been developed to determine the GHB failure criterion in the domain of rock mechanics [2,3]. Although the GHB criterion is applied widely and can produce improved results, some design practices, numerical modeling codes, and standards are based on the linear Mohr-Coulomb criterion (MC). Furthermore, cohesion (c′) and friction angle (φ′), components of the MC criterion, are intuitive and have a physical meaning for many professionals. The use of the MC criterion overcomes the difficulty resulting from the nonlinearity of the strength envelope in many routine calculations and the use of numerical code. Contrary to the GHB parameters, there are no existing empirical equations for determining the MC criterion of a rock mass. As such, estimating the equivalent Mohr-Coulomb parameters (EMC) for rock masses that satisfy the nonlinear GHB criterion has become both a necessity and a challenge. In geomechanics, the existing solution is to first determine the GHB parameter for a rock mass and then determine the MC parameter through curve-fitting solutions [1] on the GHB failure criterion. Fitting the MC curve to the GHB over a given stress range may lead to considerable errors when determining the limiting stress at which failure occurs. This is especially true when evaluating low minor principal stresses (close to the tensile strength of the materials). Unfortunately, these conditions are mobilized at the boundary of the tunnel where minimal error is important for the design of the support system. Rather than a linear MC criterion, a smooth MC criterion has been developed [4] on a simple hyperbolic yield surface that deletes the singular tip from the Mohr-Coulomb surface. This yield surface is continuous and differentiable at all stress levels, and by adjusting the parameters it can be used to estimate the Mohr-Coulomb failure criterion as finely as required.
Although the nonlinear form of the Hoek-Brown criterion distinguishes it from the linear Mohr-Coulomb failure criterion, it is conditions of high in situ stress, large nearby excavations, low rock strength (low GSI), and more nonlinear failure envelopes that tend to increase the difference between the EMC and GHB curves for at minor principal stresses [5]. Figure 1 illustrates this visually, for extreme conditions where errors can exceed 700%.
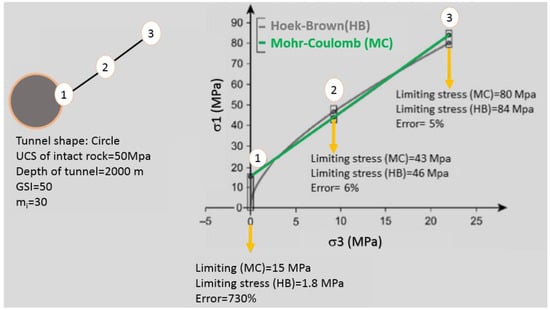
Figure 1.
Differences in errors between the Mohr-Coulomb and Hoek-Brown criteria when applied to deep excavations [5].
The rock mass parameters for the GHB criterion depend strongly on the GSI and the disturbance factor D (set to 0 for this study); the latter depends on the geomechanical structure-type and excavation method. The EMC parameters are stress dependent and are linked to the GHB rock mass parameters, as presented in Equation (6) through Equation (9). The difference between the results of applying the GHB criterion and EMC depends much on several parameters of the intact rock and the rock mass, as well as the state of the in-situ stress. The uniaxial compressive strength of the intact rock () and the GHB intact rock parameter (mi) are the parameters used to determine the GHB criterion for a rock mass. The rock mass parameters are summarized in the GSI index of a rock mass. The GSI is one of the more important rock mass classifications for determining rock mass quality and, consequently, the GHB parameters [6,7]. Therefore, to establish the differences between the use of the MCB and GHB criteria when evaluating the stability of the underground structure, all these parameters should be considered. Table 1 summarizes the limitations and advantages of EMC and GHB criteria.

Table 1.
The limitations and advantages of equivalent Mohr-Coulomb and generalized Hoek-Brown criteria.
Different criteria can be used to determine the difference between EMC and GHB criteria. Meng et al. [8] and Sofianos et al. [9] used analytical calculations to evaluate maximum displacement and yield radius for various rock types and support pressures. However, they did not compare their results of EMC and GHB criteria using a numerical method. In a hydrostatic in situ stress, Sharan [10] used the Hoek-Brown criterion to present a simple exact solution for analyzing the elastic-brittle-plastic plane strain of displacements around circular openings in an isotropic rock. This study only evaluated hydrostatic stress, and the calculated displacements around the tunnel were not compared with those obtained using EMC criterion.
Minimal importance was attributed to calculating the induced stresses at different locations. Differential stress , defined as the difference between the major and minor principal stresses, is an important parameter; however, studying the effect of various stress levels when using the EMC parameters for different rock masses has not been investigated thoroughly via numerical simulations. Differential stress is used to calculate the safety factor, shear stress, and it is also used in many indicators of stability, such as the rock mass brittle shear ratio (BSR). Adoko et al. [11] used RS2 software to calculate the rock supports in underground mine drifts. The properties of the rock domains for intact rock (UCS, Ei, mi, and GSI) were 56 to 158 (MPa), 69 to 73 (GPa), 7 to 20, and 45 to 75, respectively. In their studies, they used the criterion of differential stress to investigate the stability of mine drifts in cases with and without support. Only the Mohr-Coulomb failure criterion was used, and they did not consider the GHB criterion, despite the underground openings being located among different rock types and various stress regimes. Differential stress was also used to control opening stability, and other very important and vital criteria such as displacement and the number of yielded nodes were not considered.
The use of GHB can be recommended for most rock types (igneous, sedimentary, metamorphic) and for problems involving a range of confining stress magnitudes (from low to very high confinement). Nonetheless, most numerical modeling software uses only the MC criterion, not GHB criterion. All told, there lacks a comprehensive study about the application of EMC to tunnel stability under different intact rock and rock mass conditions (effect of GSI) that also differ in stress fields.
To establish the differences between the GHB and EMC failure criteria for evaluating the stability of an underground structure, we use a circular tunnel section. We then subject the elastic-perfectly-plastic numerical analysis of rock masses around this tunnel to various in situ stresses using the GHB and EMC parameters. We use a linearization process [1] to calculate the EMC parameters. The effect of the GSI, rock type and the major principal stress on the relative deviation between both criteria are analyzed for maximum displacement, the number of yielded elements, and induced differential stress.
2. GHB and EMC Failure Criteria
The GHB and EMC failure criteria are presented in Figure 2 and Equation (1) to Equation (4) [1]. These respective failure criteria depend on three parameters: the GSI, the uniaxial compressive strength of the intact rock ( and a material constant mi of GHB for intact rock. The material constant mi is an indicator of the brittleness of the intact rock, with ductile and weaker rocks having a lower mi. This material constant shows the characteristics and size of the micrograins of the intact rock and can also define the ratio between UCS and tensile strength. This parameter is determined using the triaxial compression test performed on the intact rock sample.
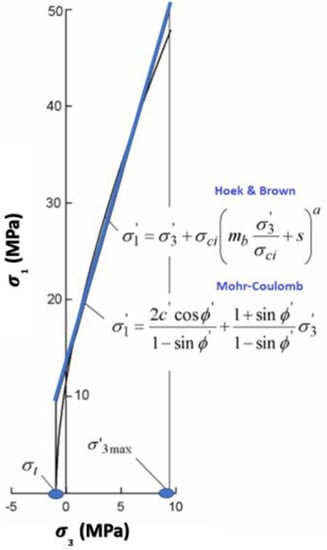
Figure 2.
Relationships between the major and minor principal stresses for the Hoek-Brown and equivalent Mohr-Coulomb criteria [1].
The mb parameter has the same significance as mi, although for a rock mass, and it can be a reduced value mi for the rock mass. The parameter s represents the degree of rock jointing or blockiness of the rock mass, and a reflects the steepness of the principal stress plot evaluated for the rock mass. The other parameter used for determining the GHB criterion for a rock mass is the disturbance factor D that accounts for the degree of disturbance of the rock mass. This factor depends on the geomechanical structure and the excavation method used to build this structure.
The Mohr-Coulomb failure criterion can be expressed in the form of Equation (5) in the major and minor principal stress planes.
With the introduction of the GHB criterion, Hoek et al [1] introduced a best-fitting procedure in an artificial stress range (i.e., the BFA procedure) to obtain equivalent Mohr-Coulomb parameters from the GHB parameters. Since then, several authors have proposed alternate procedures to estimate the EMC parameters for different applications. Meng et al. [8] presented a procedure based on the best uniform approximation technique for use with elastic–plastic or elastic–brittle–plastic rock masses. Sofianos and Nomikos [9] discussed two methods for supported and unsupported tunnels in elastic–plastic or elastic-brittle-plastic rocks. Our study will focus on the BFA method that is found within the RocLab software [12].
The fitting process involves balancing the areas above and below the MC plot in the range , where is the tensile strength, and is the artificial upper limit of confining stress—or maximum confining pressure—over which the relationship between HB and MC is considered. can be calculated from Equation (6) and is influenced by the overburden pressure and the rock mass uniaxial compressive strength . In cases where the horizontal stress is higher than the vertical stress, the horizontal stress value should be used in place of . Hoek et al. [1] proposed the closed-form solution presented in the equations below. The cohesion and friction angle of rock mass depend on and have been calculated using Equation (7) to Equation (9).
3. Material and Methods
As the objective of this paper is to establish the differences between using the GHB and EMC failure criteria for the same case study, our methodology follows a series of sequential steps (Figure 3) that we follow to evaluate the individual and combined effects of GSI, rock type, and in situ stress on the deviation from the GHB failure criterion when using the EMC parameters.
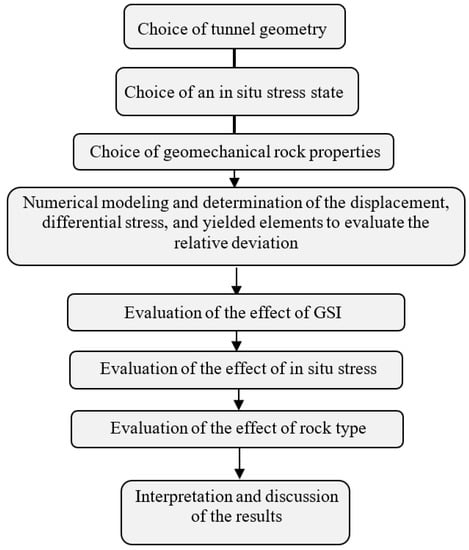
Figure 3.
Methodology to compare the equivalent Mohr-Coulomb (EMC) and generalized Hoek-Brown (GHB) criteria.
3.1. Input Data
We selected a circular-shaped tunnel for this study for its convenience and wide use in the published literature [3,8,9,13]. An unsupported scenario, according to Equation (10), was favored to eliminate any influence of the support pressure as a variable in the analysis. The tunnel diameter was set at 6 m.
The properties of the second type of rock are the average properties of rock found at the Niobec mine [14]. Rock types 1 and 3 fall within the range proposed in Practical Rock Engineering [3] for mi and and in [15] for the rock mass modulus. The last two properties are common in mining and civil engineering projects. The three rock types, as listed in Table 2, cover the leading parameters that govern the GHB criterion. We selected these three rock types from a larger set of rock masses to ensure a proper evaluation of the deviation between the two criteria.

Table 2.
Geological and mechanical properties for the three studied intact rocks.
The disturbance factor D was set to 0 to simulate no damage to the surrounding rock mass from controlled blasting or other excavation methods, such as via a tunnel boring machine (TBM). We used the chart of Marinos & Hoek [16] for jointed rocks to select the GSI inside the very blocky structure. We considered GSI values of 35, 50, and 70 (see Figure 4).
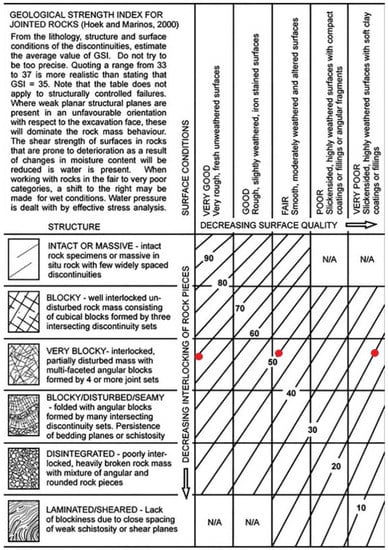
Figure 4.
Basic geological strength index (GSI) chart for the visual geological characterization of rock masses. Red dots indicate the selected GSI values in the very blocky structure category used in this paper. From Marinos & Hoek [16].
For each rock, GSI value, and stress statistic, we calculated the GHB and EMC constants using the RocLab software [12]. Perfectly plastic behavior was assumed, meaning that no reduction of strength occurs, and the residual parameters remain equal to peak values throughout the simulation.
3.2. In Situ Stress States
Vertical stress levels increase with depth as more material weighs upon the excavations [3]. The horizontal stress, on the other hand, varies greatly between different geological regions. It is common practice to relate both stresses using the stress constant k, which is the ratio of horizontal stress to vertical stress .
In this study, the major principal stress was considered as horizontal and the minor principal stress as vertical because of the state of in situ stress in the Canadian Shield [17]. The out of plane stress in the numerical modeling was considered to be equal to the horizontal stress. We considered three major principal stresses equal to 10, 20, and 30 MPa. The considered nine major principal stress states are presented in Table 3 with the corresponding depth, assuming a unit weight of 0.027 MPa/m.

Table 3.
In situ stresses and the corresponding depths.
3.3. Numerical Modeling and Evaluating the Deviation between the GHB and EMC
We used the finite element numerical code RS2 from RocScience to perform the calculations. The modeling steps are summarized as below:
- Creation of the model, including defining the model dimension and tunneling. To prevent boundary effects, we had the tunnel excavated in the center of the model at a distance of at least three times its diameter away from the model boundaries.
- Introduction of the characteristics of materials and failure criteria and their assignment to the model. For this purpose, we used the elastoplastic model for the Hoek-Brown and Mohr-Coulomb models.
- Definition of model stress and boundary conditions
- Discretization of the model (meshing)
- Computation of the model and interpretation of the results
We used plane strain conditions, suggesting that the analyzed cross section was far away from the face of the tunnel. The mesh was composed of 8640 triangular six-node elements in a graded configuration, meaning that the finer mesh size was nearest to the tunnel wall. The mesh size was optimized and validated using an elastic medium and the Kirsch solution [18]. We applied the in-situ stress states to the model as a constant stress field. The model and boundary conditions and stress inputs are presented visually in Figure 5.
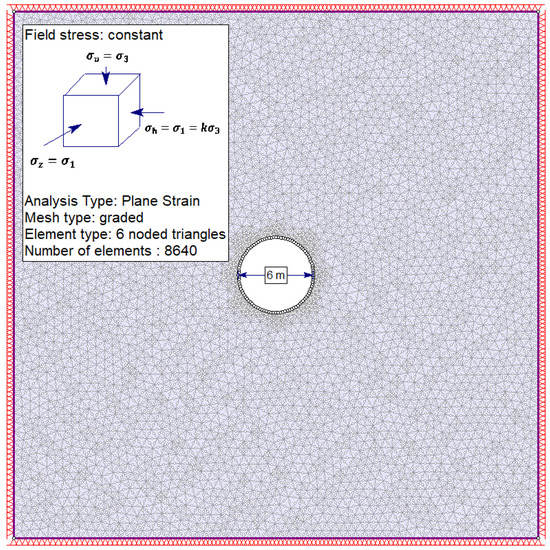
Figure 5.
RS2 numerical model and key characteristics used to compare the equivalent Mohr-Coulomb (EMC) and generalized Hoek-Brown (GHB) criteria.
For comparative analysis, we considered three variables: wall displacement, differential stress, and the number of yielded elements. These parameters, among others, allow the designer to evaluate the safety of tunnel design. The validity of these parameters is critical. The relative deviation (∆), given by Equation (12) evaluates the importance of the deviation from the obtained GHB results when using the EMC for perfectly elastic–plastic rocks. A negative ∆ indicates that the EMC parameters underestimate the GHB results.
We did not consider absolute deviation, as the goal of this study was to analyze the importance of the obtained difference.
We evaluated the number of cases in a given stress range according to GSI, rock type, and major principal stress. Classes beginning at zero were set as intervals having a 5% to 10% increase, depending on the observed total deviation range. Zeros indicate that the EMC and GHB responses were equivalent. We then analyzed the distribution of cases to evaluate the effect of each parameter on the relative deviation. Finally, we generated select plots to observe the evolution of relative deviation when GSI is increased, mi is held constant, and we applied the major principal stress.
To evaluate our methodology, we compared it with similar works. Vakili et al. [5] produced an improved unified constitutive model (IUCM) to predict the stress–strain relationships of the rock mass or intact rock. Both the MC and HB failure criteria were included in this unified model. However, they did not evaluate the impact of GSI, stress, and rock type on the deviation of the unified model from other failure criteria. Alejano et al. [19] compared Drucker-Prager and Mohr-Coulomb by considering the principal stresses (σ′2 and σ′3); they illustrated that errors increased with greater differences between σ′2 and σ′3 (when σ′1 = σ′2 > σ′3) and with increasing confining pressure. A number of other publications have focused on comparing failure criteria [20,21]. Our study, however, studies the effect of considering an equivalent Mohr-Coulombe criteria rather than a HB criterion, with an emphasis on deep tunnels and various levels of in situ stress; elements that have yet to be assessed.
4. Results and Discussion
A range of failure evaluation criteria can be used to assess the stability of underground openings. Here, we apply GHB and EMC criteria to evaluate the effect of GSI, in situ stress, and rock type on tunnel behavior and determine the resulting differences obtained from the two criteria. To facilitate this comparison, we study selected parameters including displacement, the number of yielded elements (radius of the plastic zone), and differential stress. Yielding elements are a common built-in function in most numerical modeling tools when an elastoplastic behavior is adopted. A rock mass yields when it is loaded beyond its elastic limit. From this selection of parameters and evaluation criteria, we construct 27 numerical models using RS2 software. For each model, we compare the GHB and EMC criteria in relation to the three selected parameters.
4.1. Effect of GSI, In Situ Stress, and Rock Type on the Deviation of the Displacement
Ground control is an important safety measure in underground excavation. Excessive displacement can lead to collapse, support issues, and operating difficulties [18]. Maximum displacement was obtained by evaluating the displacement on the boundary control points (discretized boundary) of the excavation using RS2 software. The number of cases for the different relative deviation ranges according to GSI, rock type, and major principal stress is shown in Table 4.

Table 4.
Number of cases for the various error ranges of maximum displacement.
First, rock type and stress are held constant. As it is illustrated in Figure 6, by decreasing GSI, the deviation between EMC and GHB to increase. This deviation also increases by a heightening of the minor principal stress (σ3). From this relationship, we can observe that for deep tunnels, the deviation of the two criteria is greatest in low-strength rock masses.
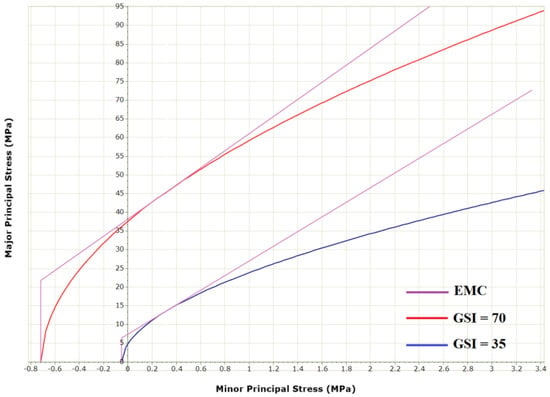
Figure 6.
Difference between the generalized Hoek-Brown (GHB) and equivalent Mohr-Coulomb (EMC) criteria for a geological strength index (GSI) of 35 and 70.
This behavior could also be seen in this research, as the increase in GSI leads to a decrease in the relative deviation independent of rock type and in situ stress (Figure 7). From Table 4, we observe that the EMC parameters always underestimate the maximum displacement for a GSI of 35 and 50, and slightly overestimate about half of the cases when GSI is 70. The GSI has more effect on relative deviation—producing clearer trends and greater slopes—than it does on rock type and the principal in situ stress. GSI has less effect for low in situ stress having a lower slope. In nearly all cases, the slope between the deviation obtained for a GSI of 35 to 50 is greater than a GSI between 50 and 70.
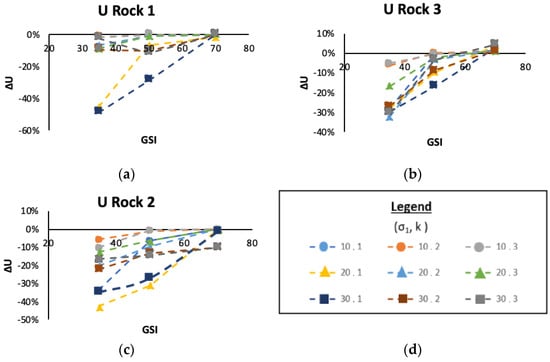
Figure 7.
Variation of the relative deviation of wall displacement for GSI values of 35, 50, and 70 (∆U is the relative deviation), (a) Rock 1, (b) Rock 2, (c) Rock 3, (d) legend.
Second, when rock type and GSI are held constant, increased in situ stress causes an increase in the relative deviation (Figure 8). The number of cases in a ±5% variation is greatest when the major principal stress is 10 MPa. The highest relative deviation obtained for a major principal stress of 10 MPa is 34% compared to 49% for a major principal stress of 30 MPa. The relative deviation decreases as the deviatoric constant k increases. Indeed, the largest relative deviation is obtained for k = 1, although the effect of GSI should be considered.
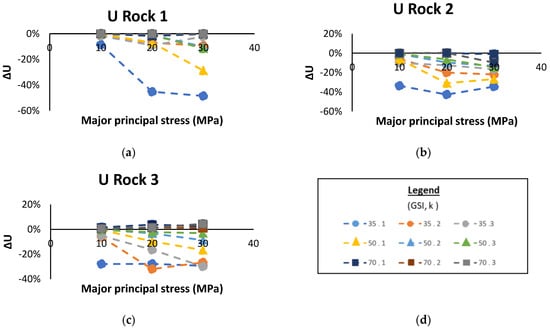
Figure 8.
Variation of the relative deviation of wall displacement for an increase in the major principal stress at 10, 20, and 30 MPa, (a) Rock 1, (b) Rock 2, (c) Rock 3, (d) legend.
For better realization of the stress paths around the tunnel, the isolines of the vertical and horizontal stresses have been illustrated in Figure 9.
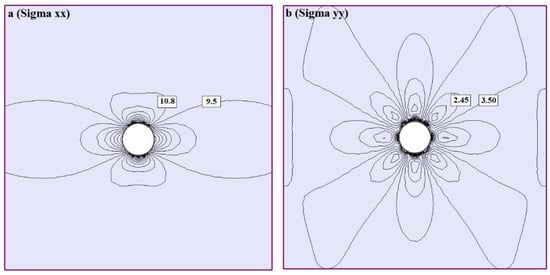
Figure 9.
The isolines of stresses in the (a) x and (b) y directions.
Finally, rock type has a distinct effect on the relative deviation for the displacement. When we select displacement as the control parameter, stronger rocks, characterized by a higher mi and produce less variation with an increased GSI. Thus, in terms of the displacement of the strong rock, the difference between GHB and EMC is limited. For a given stress state, the variation of the trend line for a plot of the relative deviation according to mi (or ) is greatest for Rock type 3, followed by Rock type 2 and Rock type 1.
4.2. Effect of GSI, In Situ Stress, and Rock Type on the Deviation for the Number of Yielded Elements
In FE, the model is discretized into multiple meshes of finite elements that are evaluated based on the failure criterion and strength parameters. An element yields either by shear or tension. We selected the number of yielded elements (YE) as an indicator to compare the GHB and EMC, as YE indicates the number of times the failure envelope is exceeded. In RS2, yielding occurs when the applied stress surpasses the chosen strength parameter (failure envelope).
The number of cases for the different ranges of relative deviation based on GSI, rock type, and major principal stress is shown in Table 5. The “failed” category assesses cases where the GHB evaluated YE, and the EMC could not.

Table 5.
Number of cases in the various error ranges for the number of yielded elements.
The EMC parameters mostly underestimate the number of YE. Underestimating the number of failed elements is not conservative and can lead to unsafe design. For a GSI of 35, only one case is overestimated by 2%. These results suggest that an increase in GSI leads to a smaller negative relative deviation and a shift to a positive relative deviation for Rock type 3.
As the intact rock parameters increase, so does the relative deviation (Figure 10). Rock type 1 presents the largest relative deviation and greatest range of extending values. Rock type 1 is also the only type to consistently underestimate the number of YE. The three cases in the (0, 10) range are all equal to zero and are recorded for a major principal stress of 10 MPa and a GSI of 70. When the number of yielded elements is the control parameter, EMC use for Rock type 1 is not recommended, as the relative deviations are too variable at higher magnitudes, with values mostly greater than −10% and reaching more than −60% in some cases. Rock type 3 presents the lowest relative deviation having a maximum of −20%. When the number of yielded elements is the control parameter (Table 5), we observe that the effect of in situ stress must be considered with the other two parameters of rock type and GSI; therefore, the effect of stress is very dependent on rock type and GSI [22].
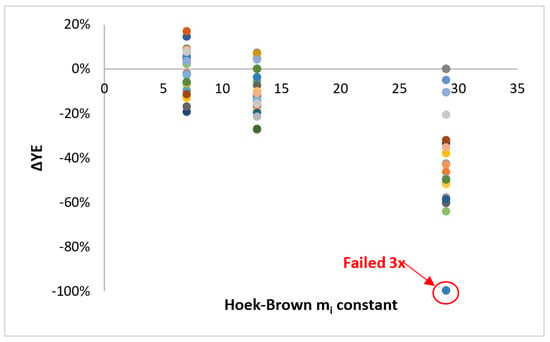
Figure 10.
Variation of the relative deviation of the number of yielded elements for the three rock types presented in Table 2; rocks are represented by their mi Hoek & Brown constant.
4.3. Effect of GSI, In Situ Stress, and Rock Type on the Deviation of Differential Stress at the Boundary
Differential stress (∆σ) is defined as the difference between the major and the minor principal stresses at each node. High differential stress can lead to shear failure or cause the induced stress to go beyond the failure envelope. The number of cases for the different relative deviation ranges based on GSI, rock type, and major principal stress is shown in Table 6.

Table 6.
Number of cases in the various error ranges for maximal differential stress at the boundary of the excavation.
As GSI increases, the deviation decreases rapidly (Figure 11). Only two data points do not follow this trend: Rock type 1 for a major principal stress of 30 MPa when k = 1 and 3. The results obtained for a GSI of 35 are all >40%, while those obtained for a GSI of 70 are <20%. At the boundary, the EMC largely overestimates . Only a GSI of 70 and a low to intermediate stress state cause the EMC to produce negative deviations; this indicates a smaller differential stress than that obtained using the GHB criterion. Using the EMC parameters to evaluate differential stress at the boundary of the excavation can lead to pessimistic results. The effect of GSI is apparent in Figure 12, whereas major principal stress increases, the relative deviation is divided into groups of differing magnitudes and similar slopes based on GSI. Lower GSI values produce a larger relative deviation.
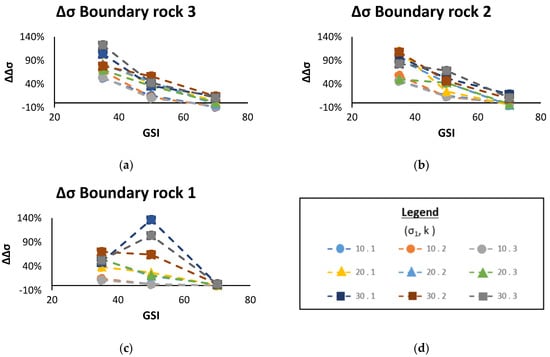
Figure 11.
Variation of the relative deviation of the maximal differential stress at the boundary of the excavation for the stress states of Table 3 with an increasing GSI, (a) boundary rock 3, (b) boundary rock 2, (c) boundary rock 1, (d) legend.
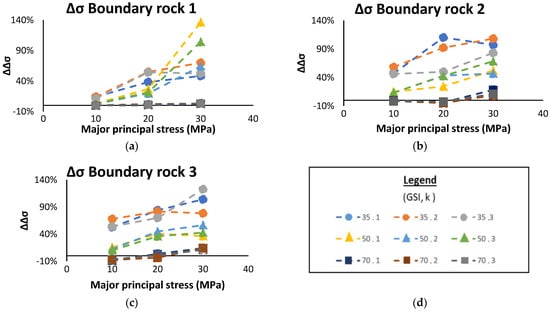
Figure 12.
Variation of the relative deviation of the maximal differential stress at the boundary of the excavation as the major principal stress increases, (a) boundary rock 1, (b) boundary rock 2, (c) boundary rock 3, (d) legend.
When we apply the differential principal stresses at the boundary as a control parameter, we observe that, rock type influences the relative deviation. Rocks having a lower mi and σci produce slightly better results, as there are more cases in the 5% to −5% range. For all scenarios, an increase in the major principal stress causes an increase in the relative deviation (Figure 12). A major principal stress of 10 MPa has the most cases for the lower ranges.
4.4. Effect of GSI, In Situ Stress, and Rock Type on Deviation for the Maximal Differential Stress
We calculated the maximal differential stress in the model for all scenarios. A rock mass can fail either at the boundary or at a certain radius from the tunnel excavation, thereby modifying the support needs and requirements; for example, a consequence is the length of the rock bolts required to reach undisturbed rock. The number of cases for different relative deviation ranges based on GSI, rock type, and major principal stress is shown in Table 7.

Table 7.
Number of cases for the various error ranges for maximal differential stress in the model.
The relative deviations for all maximal differential stress levels in the model are lower and less variable than for the differential stress at the boundary of the excavation. Indeed, for all stress states, GSI, and rock type, the relative deviations are contained within a ±10% range, and the majority fall in the negative range.
It is important to consider the location of the maximal differential stress from a design and safety perspective. For a given stress state with k = 1, a higher GSI yields a maximum differential stress closer to the boundary of the excavation, as shown in Figure 13. Thus, an increase in GSI also reduces the distance required for the value of the relative deviation at the boundary to attain its lowest value calculated for the maximum differential stress in the model. For a GSI of 70, the differential stress distribution is practically the same when using the GHB or the EMC. On the other hand, the distribution of the differential stress for a GSI of 35 is more complex and covers a broader range when the GHB criterion is used.
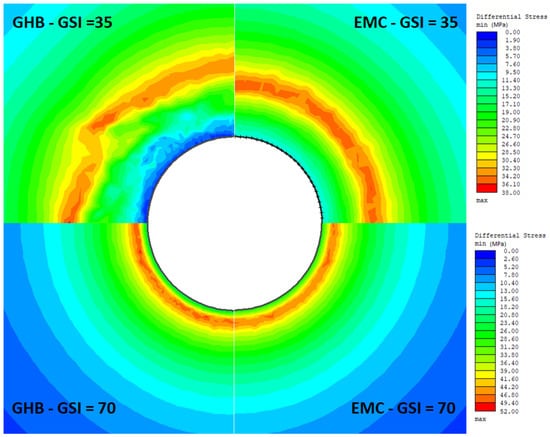
Figure 13.
Distribution of the differential stress around the test tunnel for a major principal stress of 10 MPa and a stress ratio of 1 for Rock type 2.
5. Conclusions
We used the finite element software RS2 to calculate the relative deviation obtained between the EMC failure criterion and the GHB obtained by the BFA linearization procedure for wall displacement, the number of yielded elements (YE), and differential stress. We assessed the influence of the GSI, rock type, and in situ stress, and we found that all three parameters influenced the selected variables.
Wall displacement is always underestimated for GSI values of 35 and 50; this leads to non-conservative displacements. For higher values of GSI, the relative displacement is limited to a reasonable 5% to –5% range for most stress states. An increase in the in-situ stress increases the relative deviation. The number of YE is most influenced by rock type; Rock type 3 presents the lowest relative deviation. On the other hand, Rock type 1 presents the largest and most scattered distribution. For the differential stress at the boundary, an increase in the GSI decreases the relative deviation. As well, an increase of the major principal stress increases the relative deviation independent of rock type. For low GSI, the relative deviation is >40% and attained 122%. Finally, the distribution of the relative deviation for maximal differential stress in the model lies within a 10% to –10% range for all rock types, GSI values, and in situ stress states. Hence, maximal differential stress presents the lowest variation and the lowest overall deviation using the GHB results. Evaluating the maximum differential stress with EMC, however, produces a good approximation of the GHB results.
Author Contributions
Conceptualization, A.S. (Ali Saeidi) and C.C.; methodology, A.S. (Ali Saeidi) and C.C.; software, C.C. and A.S. (Alireza Shahbazi); validation, C.C., A.S. (Ali Saeidi) and A.S. (Alireza Shahbazi); formal analysis, A.S. (Ali Saeidi) and C.C.; investigation, C.C. and A.K.; resources, A.S. (Ali Saeidi); data curation, C.C. and A.S. (Ali Saeidi); writing—original draft preparation, C.C.; writing—review and editing, A.S. (Ali Saeidi) and A.K.; visualization, C.C. and A.S. (Ali Saeidi); supervision, A.S. (Ali Saeidi).; project administration, A.S. (Ali Saeidi); funding acquisition, A.S. (Ali Saeidi). All authors have read and agreed to the published version of the manuscript.
Funding
This work was funded by a grant from Natural Sciences and Engineering Research Council of Canada (NSERC: DDG-2017-00018).
Data Availability Statement
This study is not reporting any data.
Conflicts of Interest
The authors declare no conflict of interest exist in publishing this article.
Abbreviations
| c′ | Equivalent rock mass cohesion |
| φ′ | Equivalent frictional angle of the rock mass |
| σ1 | Major principal stress |
| σ3 | Minor principal stress |
| σ3max | Artificial upper limit of confining stress |
| σci | Uniaxial compressive strength of the intact rock |
| σcm | Rock mass uniaxial compressive strength |
| σt | Tensile strength |
| ∆σ | Differential stress |
| GSI | Geological strength index |
| mb | Reduced material constant for disturbed rock |
| mi | Material constant for intact rock |
| D | Disturbance factor |
| s | Material constants |
| a | Constants for the rock mass |
| γH | Overburden pressure |
| Erm | Rock mass deformation modulus |
| Ei | Intact rock Young’s modulus |
| k | Deviatoric constant |
| σv | Vertical stress |
| σh | Horizontal stress |
References
- Hoek, E.; Carranza-Torres, C.; Corkum, B. Hoek-Brown Failure Criterion-2002 Edition. In Proceedings of the 5th North American Rock Mechanics Symposium, Toronto, ON, Canada, 7–10 July 2002; Volume 1, pp. 267–273. [Google Scholar]
- Hu, J.; Xu, N. Numerical analysis of failure mechanism of tunnel under different confining pressure. Procedia Eng. 2011, 26, 107–112. [Google Scholar] [CrossRef][Green Version]
- Hoek, E. Practical rock engineering. Rocscience 2007. Available online: www.rocscience.com (accessed on 10 April 2022).
- Abbo, A.J.; Sloan, S.W. A smooth hyperbolic approximation to the Mohr-Coulomb yield criterion. Comput. Struct. 1995, 54, 427–441. [Google Scholar] [CrossRef]
- Vakili, A. An improved unified constitutive model for rock material and guidelines for its application in numerical modelling. Comput. Geotech. 2016, 80, 261–282. [Google Scholar] [CrossRef]
- Wang, Y.; Aladejare, A.E. Evaluating Variability and Uncertainty of Geological Strength Index at a Specific Site. Rock Mech. Rock Eng. 2016, 49, 3559–3573. [Google Scholar] [CrossRef]
- Somodi, G.; Krupa, Á.; Kovács, L.; Vásárhelyi, B. Comparison of different calculation methods of Geological Strength Index (GSI) in a specific underground construction site. Eng. Geol. 2018, 243, 50–58. [Google Scholar] [CrossRef]
- Meng, Q.X.; Wang, H.L.; Xu, W.Y.; Xie, W.C.; Wang, R.B.; Zhang, J.C. Robust equivalent tunnelling Mohr–Coulomb strength parameters for generalised Hoek–Brown media. Eur. J. Environ. Civ. Eng. 2016, 20, 841–860. [Google Scholar] [CrossRef]
- Sofianos, A.I.; Nomikos, P.P. Equivalent Mohr–Coulomb and generalized Hoek–Brown strength parameters for supported axisymmetric tunnels in plastic or brittle rock. Int. J. Rock Mech. Min. Sci. 2006, 43, 683–704. [Google Scholar] [CrossRef]
- Sharan, S.K. Exact and approximate solutions for displacements around circular openings in elastic–brittle–plastic Hoek–Brown rock. Int. J. Rock Mech. Min. Sci. 2005, 42, 542–549. [Google Scholar] [CrossRef]
- Adoko, A.C.; Yakubov, K.; Kaunda, R. Reliability Analysis of Rock Supports in Underground Mine Drifts: A Case Study. Geotech. Geol. Eng. 2022, 40, 2101–2116. [Google Scholar] [CrossRef]
- Rocscience. RocLab; Rocscience: Toronto, ON, Canada, 2021. [Google Scholar]
- Sofianos, A.I.; Halakatevakis, N. Equivalent tunnelling Mohr–Coulomb strength parameters for given Hoek–Brown ones. Int. J. Rock Mech. Min. Sci. 2002, 39, 131–137. [Google Scholar] [CrossRef]
- Chayer, S. Projet de fin d’études en génie géologique 6GLG634, Conception des chantiers du bloc 4 de la mine Niobec; Université du Québec à Chicoutimi: Saguenay, QC, Canada, 2017. [Google Scholar]
- Palmström, A.; Singh, R. The deformation modulus of rock masses—Comparisons between in situ tests and indirect estimates. Tunn. Undergr. Space Technol. 2001, 16, 115–131. [Google Scholar] [CrossRef]
- Marinos, P.; Hoek, E. Gsi: A Geologically Friendly Tool for Rock Mass Strength Estimation. In Proceedings of the ISRM International Symposium, Melbourne, Australia, 19–24 November 2000. [Google Scholar]
- Lavoie, C. Analyse de l’effet du remblayage des chantiers souterrains de la mine Niobec sur leur stabilité; Université du Québec à Chicoutimi: Saguenay, QC, Canada, 2018. [Google Scholar]
- Brady, B.H.G.; Brown, E.T. Rock Mechanics for Underground Mining, 3rd ed.; Springer Science & Business Media: Berlin, Germany, 2013. [Google Scholar]
- Alejano, L.R.; Bobet, A. Drucker–Prager Criterion. In The ISRM Suggested Methods for Rock Characterization, Testing and Monitoring: 2007–2014; Ulusay, R., Ed.; Springer International Publishing: Cham, Switzerland, 2015; pp. 247–252. [Google Scholar]
- Benz, T.; Schwab, R. A quantitative comparison of six rock failure criteria. Int. J. Rock Mech. Min. Sci. 2008, 45, 1176–1186. [Google Scholar] [CrossRef]
- Edelbro, C.; Sjöberg, J.; Nordlund, E. A quantitative comparison of strength criteria for hard rock masses. Tunn. Undergr. Space Technol. 2007, 22, 57–68. [Google Scholar] [CrossRef]
- Hassan, M.E.; Draz, W.M.; Ali, F.A.; Sleem, S.M. Studying the effect of rock type on damaged rock zone around underground excavation. Int. J. Sci. Eng. Res. 2017, 8, 2229–5518. [Google Scholar]
Publisher’s Note: MDPI stays neutral with regard to jurisdictional claims in published maps and institutional affiliations. |
© 2022 by the authors. Licensee MDPI, Basel, Switzerland. This article is an open access article distributed under the terms and conditions of the Creative Commons Attribution (CC BY) license (https://creativecommons.org/licenses/by/4.0/).