Article

Environmental and Biological Controls on Sedimentary Bottom Types in the Puquios of the Salar de Llamara, Northern Chile

1
Department of Mineral Sciences, National Museum of Natural History, Smithsonian Institution, 10th St. & Constitution Ave. NW, Washington, DC 20560, USA
2
Department of Marine Geosciences, Rosenstiel School of Marine and Atmospheric Science, University of Miami, 4600 Rickenbacker Cswy, Miami, FL 33149, USA
3
Bahamas Marine EcoCentre, 7201 SW 144th St., Palmetto Bay, FL 33158, USA
4
Department of Environmental Health Sciences, Arnold School of Public Health, University of South Carolina, 921 Assembly Street, Columbia, SC 29208, USA
5
FisioAqua, Avenida Vitacura 2909, Oficina 717, Las Condes, Santiago 7550024, Chile
6
Skidmore College, 815 N Broadway, Saratoga Springs, New York, NY 12866, USA
*
Author to whom correspondence should be addressed.
Geosciences 2022, 12(6), 247; https://doi.org/10.3390/geosciences12060247
Submission received: 28 April 2022 / Revised: 1 June 2022 / Accepted: 7 June 2022 / Published: 14 June 2022

Abstract

:
The Puquios of the Salar de Llamara in the Atacama Desert, northern Chile, is a system of small lakes that is characterized by evaporitic mineral deposition and that commonly hosts microbial communities. This region is known for its extreme aridity, solar irradiance, and temperature fluctuations. The Puquios are a highly diverse ecosystem with a variety of sedimentary bottom types. Our previous results identified electrical conductivity (EC) as a first-order environmental control on bottom types. In the present paper, we extend our analysis to examine the effects of additional environmental parameters on bottom types and to consider reasons for the importance of EC as a control of sedimentology. Our results identify microbially produced extracellular polymeric substances (EPS) as a major player in the determination of bottom types. The relative amounts and properties of EPS are determined by EC. EPS, in turn, determines the consistency of bottom types, exchange of bottom substrate with the overlying water column, and mineral precipitation within the substrate. Low-EC ponds in the Puquios system have flocculent to semi-cohesive bottom types, with low-viscosity EPS that allows for high-exchange with the surrounding waters and mineral precipitation of granular gypsum, carbonate, and Mg–Si clay in close association with microbes. Ponds with elevated EC have bottom types that are laminated and highly cohesive with high-viscosity EPS that restricts the exchange between sediments and the surrounding waters; mineral precipitation in these high-EC ponds includes granular to laminated gypsum, carbonate and Mg–Si, which also form in close association with microbes. Bottom types in ponds with EC above the threshold for thriving benthic microbial communities have insufficient EPS accumulations to affect mineral precipitation, and the dominant mineral is gypsum (selenite). The variations in EPS production throughout the Puquios, associated with heterogeneity in environmental conditions, make the Puquios region an ideal location for understanding the controls of sedimentary bottom types in evaporative extreme environments that may be similar to those that existed on early Earth and beyond.

1. Introduction

The Atacama Desert in northern Chile is a polyextreme environment, having at least two extreme environmental stress factors: hyperaridity and high ultraviolet radiation [1]. Large diurnal fluctuations in temperature are also common throughout the region. These conditions make the region an ideal location for geobiological investigations of highly evaporative extreme environments such as those that may have existed on early Earth and beyond. Small lakes, often with high salinity, are common throughout the Atacama Desert, and many of these ponds host microbial ecosystems with associated mineral precipitation [2]. A recent study of one of these Andean Microbial Ecosystems, the Puquios in the Salar de Llamara, documented the spatial heterogeneity of water chemistry, free-living biota, microbial communities, and bottom types, as well as identified electrical conductivity as the overall driver of biologic and geologic heterogeneity from data collected in the summer of 2017/2018 [3]. In the present paper, we extend the analysis of bottom types in the Puquios system with field data and samples collected in March 2019 and examine the effects of additional environmental parameters on mineral deposition to identify specific linkages between environmental factors and bottom types. Increased understanding of how environmental processes shape deposition in modern extreme environments provides a useful analog for interpreting the geologic record on Earth and beyond.

Background

The Puquios system in the Salar de Llamara (21°23′ S, 69°37′ W) is a salar consisting of four main lakes (Puquios 1 through 4) and a series of smaller ponds. Most of the smaller ponds are located between Puquio 1 and Puquio 2, in a region termed the “Transition Zone” (Figure 1). A strong gradient in water chemistry and diverse bottom types are exhibited between Puquios 1 and 2 [3,4,5]. This sub-system, consisting of two main lakes and the smaller ponds characteristic of the Transition Zone are designated as the P1/P2 subsystem, and it is the focus of the present study. The ponds in the P1/P2 subsystem are all hydrologically connected, with ground water flow from southwest to northeast, and increasing EC from P1 to P2 [3,4,5]. Evaporation and subsurface water–rock interactions significantly influence brine composition across this gradien [4,5,6,7]. Across this gradient, Reid et al. [3] and Oehlert et al. [5] observed a variety of microbial and crystalline bottom types that could be correlated with the EC. Ponds with relatively low EC values typically had flocculent microbial mat substrates with microbially influenced gypsum, carbonate and clay minerals. As EC increased, microbial mat substrates became less flocculent and more cohesive, with similar microbially influenced minerals. Ponds with the highest EC values lacked microbial mats and were associated with gypsum spar as the dominant bottom type [3,5]. As such, their results suggested that bottom types might be useful as a “visual representation of both the environmental gradients and likely spatial heterogeneity in mineral deposition” [3]. Specific linkages between conductivity and the diversity of bottom types and associated variations in mineral precipitation were not identified. To extend the former study, in the present paper, we examine if any other environmental factors in addition to EC impact bottom types in the Puquios, and we discuss how and why these parameters impact mineral formation.

2. Materials and Methods

2.1. Field Studies

Fieldwork was conducted in March 2019. Previously collected drone imagery [3] was used as a base map. Using Global Mapper, the footprint of each pond was mapped and assigned a unique identification number. Around the margins of the P1/P2 subsystem, the locations of small wooden stakes previously installed by Sociedad Química y Minera de Chile (SQM) for environmental monitoring were included as unique identifiers in the geodatabase. Bottom type observations made in conjunction with in situ measurements of environmental parameters were recorded for each unique identification number, and samples of main bottom types were collected.
Drone Imagery—Drone imagery was collected of the P1/P2 subsystem in March 2019 using a DJI Flying Frame MATRICE 600 mounted with a ZENMUSE X5R RGB camera at a height of 20 m. The images were mosaicked and georeferenced in ENVI 5.6 using the Image Registration toolkit.
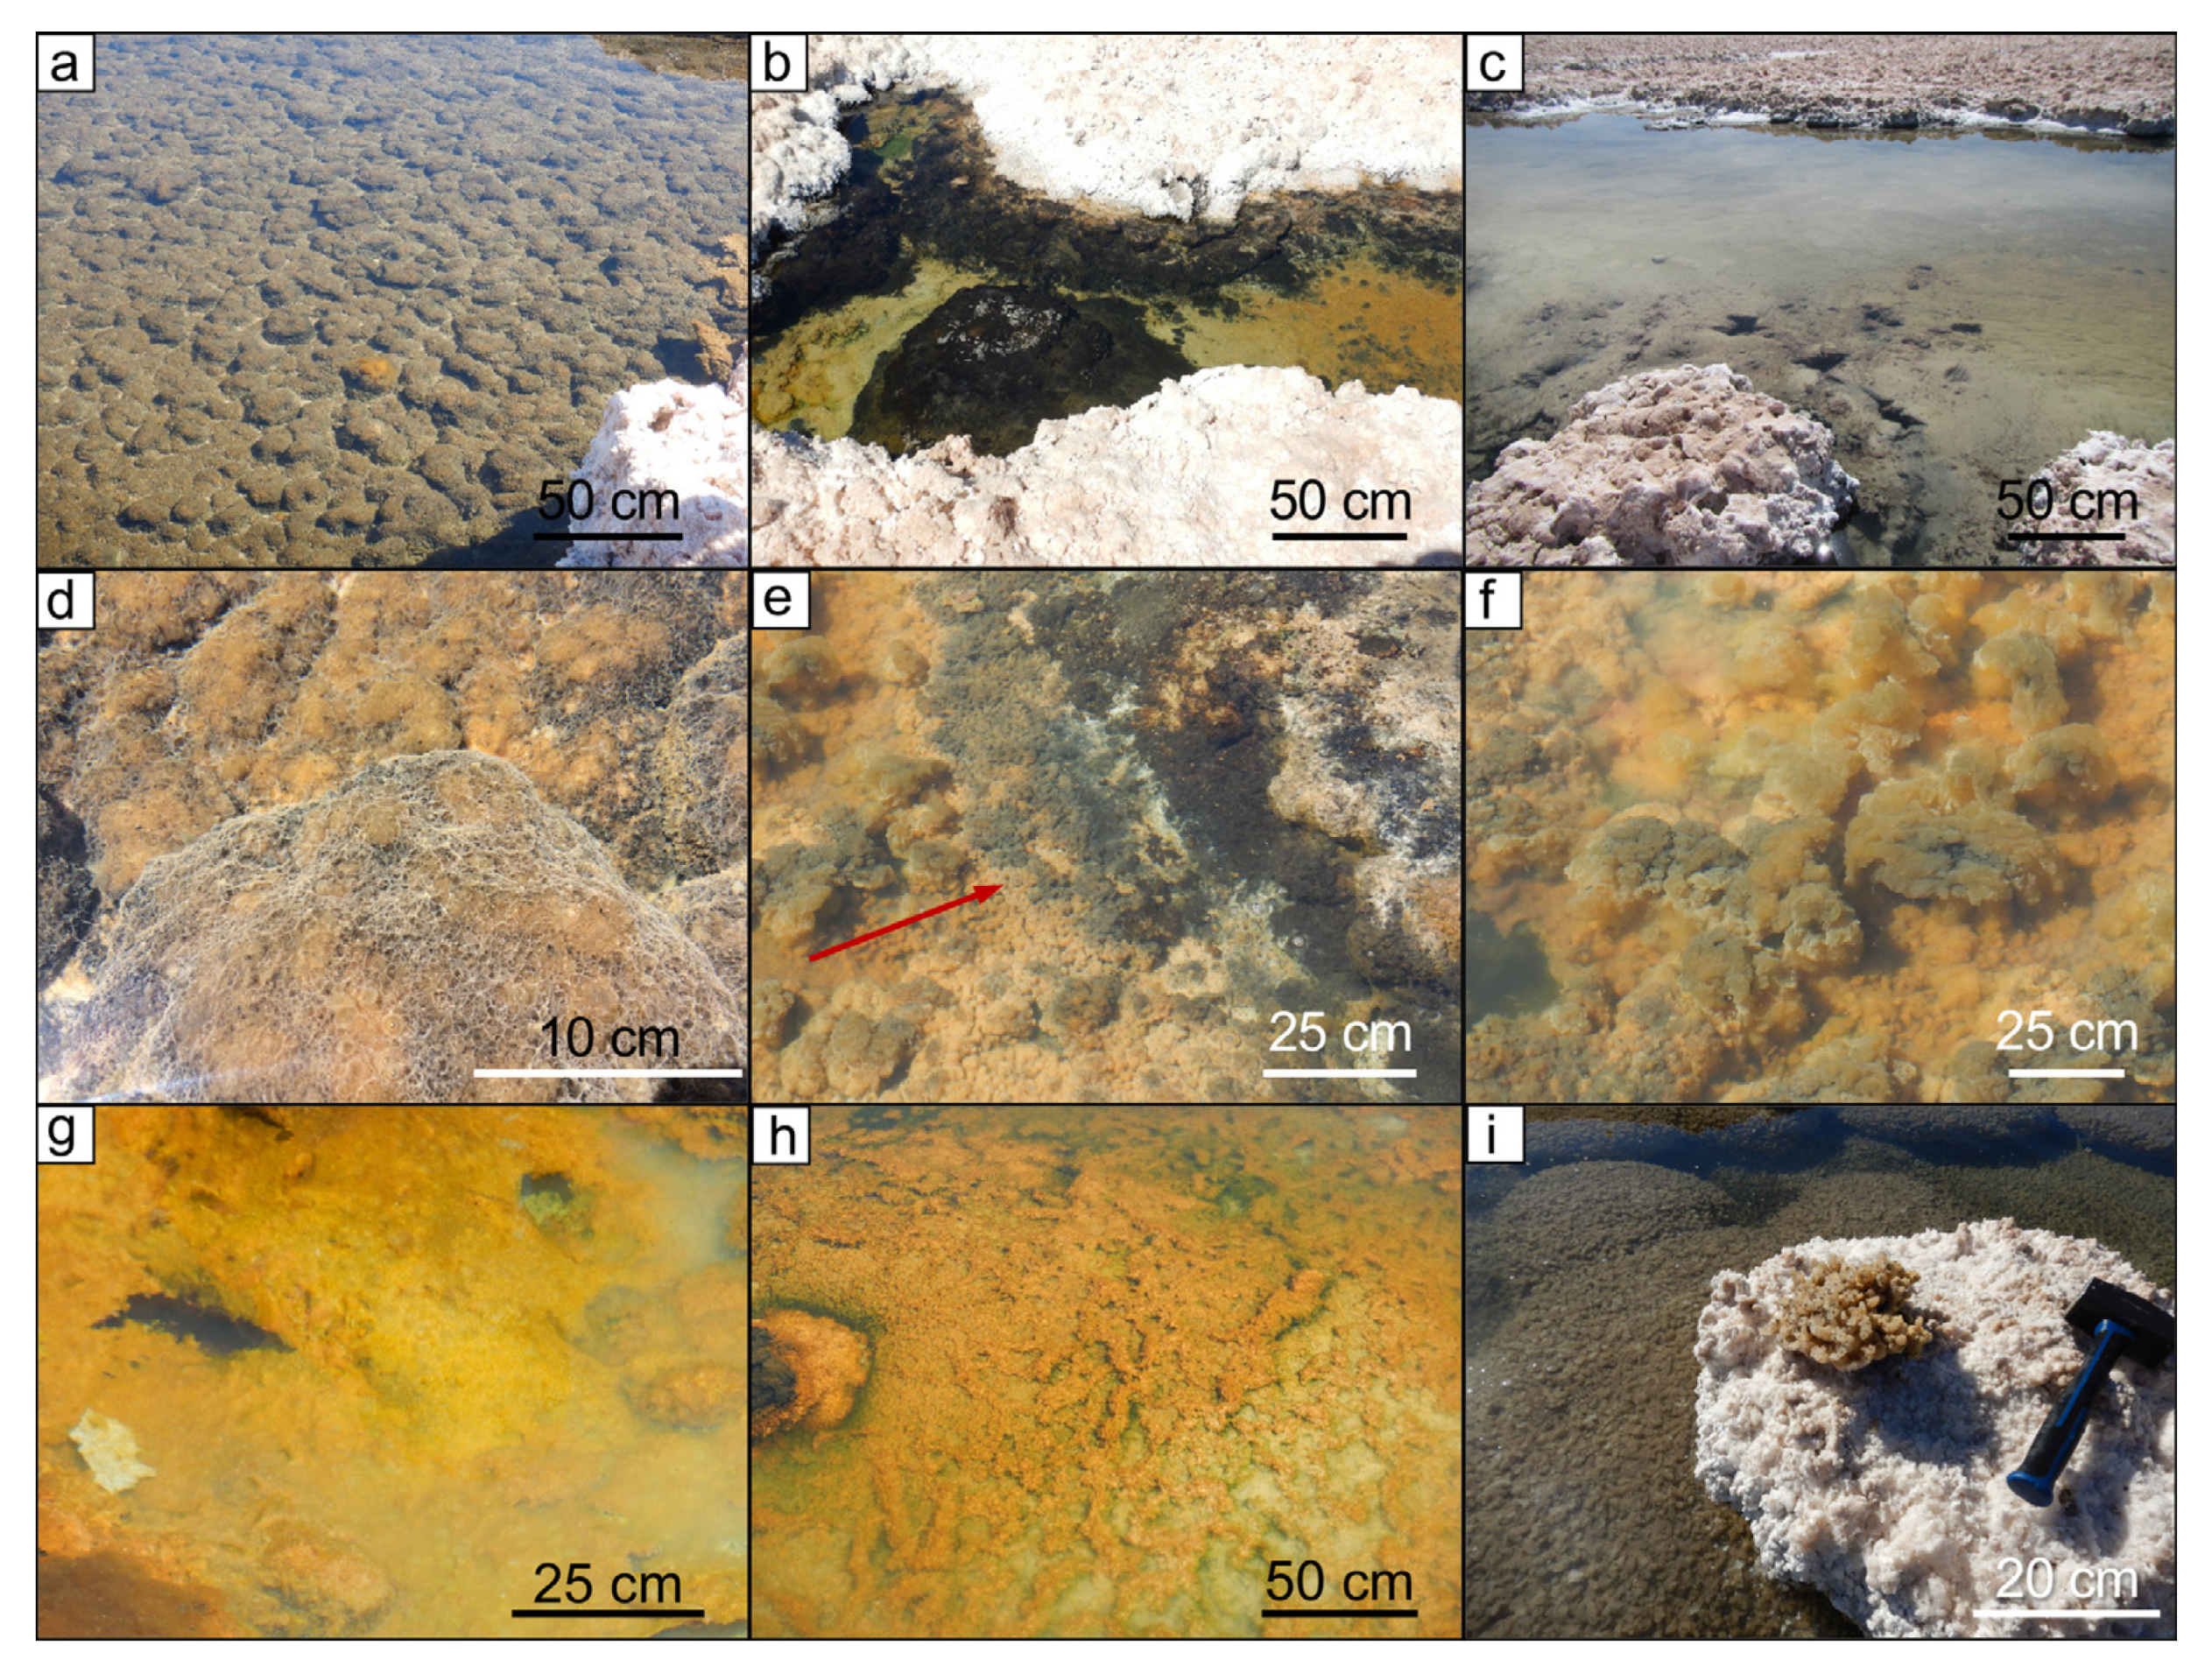
Mapping of Bottom Types—Distinct differences in color and surface morphology of bottom types were previously observed, identified, and described across the Puquios system (see Supplemental Figure S5 in [3]. Nine dominant bottom types were identified and mapped in the P1/P2 subsystem: black domes (Figure 2a), black semi-cohesive mat (Figure 2b), floccules (Figure 2c), network on bulbous mat (Figure 2d), carpet (Figure 2e), orange–brown bulbous mat (Figure 2f), orange gel mat (Figure 2g), orange gel mat with black pinnacles (Figure 2h), and spar (Figure 2i). Using the categories above, a bottom type designation was assigned to each pre-assigned unique numerical identifier for a total of 307 distinct observations of bottom type in the P1/P2 subsystem. If more than one bottom type was observed, the visually dominant type was recorded.
Sampling of Bottom Types—A total of 9 bottom type samples were collected. Archetypal samples of bottom types were carefully selected from the P1/P2 system through visual confirmation (Figure 2). Samples were preserved in formalin to maintain organic structures for laboratory analysis.
Environmental Parameters—Environmental parameters including dissolved oxygen (DO), pH, oxidation/reduction potential (ORP), electrical conductivity (EC), temperature, and turbidity were collected in tandem with bottom type observations using a Hanna 9289 Multiparameter Meter (Supplemental Figure S1 lists resolution and accuracy and shows probe position) at each location with a pre-assigned numerical identifier. A total of 307 Hanna measurements were made across the P1/P2 subsystem, each associated with a specific bottom type. Depth was recorded to the nearest 5 cm.

2.2. Laboratory Analyses of Samples

Samples collected from the Puquios were prepared for analyses using scanning electron microscopy (SEM) with EDAX Octane Energy Dispersive X-ray Spectrometer (EDS), and X-ray diffraction (XRD).
Scanning electron microscopy (SEM)—A subset of the collected microbial samples was embedded in epoxy following the method of [8], which preserves both biological and mineral material. Samples were sliced and polished in graduated increments to 0.6 microns, prior to examination with SEM. Imaging was performed at the Smithsonian National Museum of Natural History using a ThermoFisher Scientific Apreo Field Emission SEM (Bedford, MA, USA). Images were captured in angular backscatter mode at an acceleration voltage of 15 kV, with a working distance of ~10 mm. Elemental composition of mineral phases was determined using EDS.
X-ray diffraction (XRD)—Grains that were large enough to be hand-picked from the collected microbial samples were removed using tweezers. Large crystalline samples were chiseled into smaller sub-samples. All samples were rinsed with ethanol, dried and ground into fine powder using a mortar and pestle. Diffraction data were collected from these powdered samples using a Rigaku D/MAX Rapid microdiffractometer (The Woodlands, TX, USA) with an imaging plate detector at the Smithsonian National Museum of National History. Samples were exposed to an X-ray beam for 5–10 min and the XRD patterns produced, and after background subtraction, they were qualitatively matched to theoretical mineral d-spacing reference patterns using the International Center for Diffraction Data libraries and/or user libraries developed from reference materials using Jade 9 software.

2.3. Statistical Analyses

The median, standard deviation, and interquartile ranges (IQR) for each environmental parameter measured by the Hanna meter (pH, ORP, EC, DO, turbidity, and depth) were calculated using the inclusive quartile calculation in Microsoft Excel (Office 365). To help elucidate the dominant environmental drivers across the P1/P2 subsystem, a one-way analysis of variance (ANOVA) was conducted using SPSS™ software to evaluate how different bottom types correlate with pH, ORP, EC, DO, turbidity, and depth. Results are reported for the F-test, where η2p represents an unbiased effect size correction of the strength of the association percentage of variance in the bottom type accounted for by the environmental parameter:
η2p = Sum of squares between/(Sum of squares between + Sum of squares within)
Homogenous subsets were identified as groups within bottom types that could not be separated as statistically different from one another using Tukey’s honest significant difference (HSD) post hoc test. In order to detect significant differences between bottom types in relationship with measured environmental parameters, principal component analysis (PCA) was completed for the bottom types with EC, pH, ORP, and DO as variables using the PAST software package [9]. The analyses were performed on the correlation matrix, as the units differed among the input variables.

3. Results

3.1. Field Studies

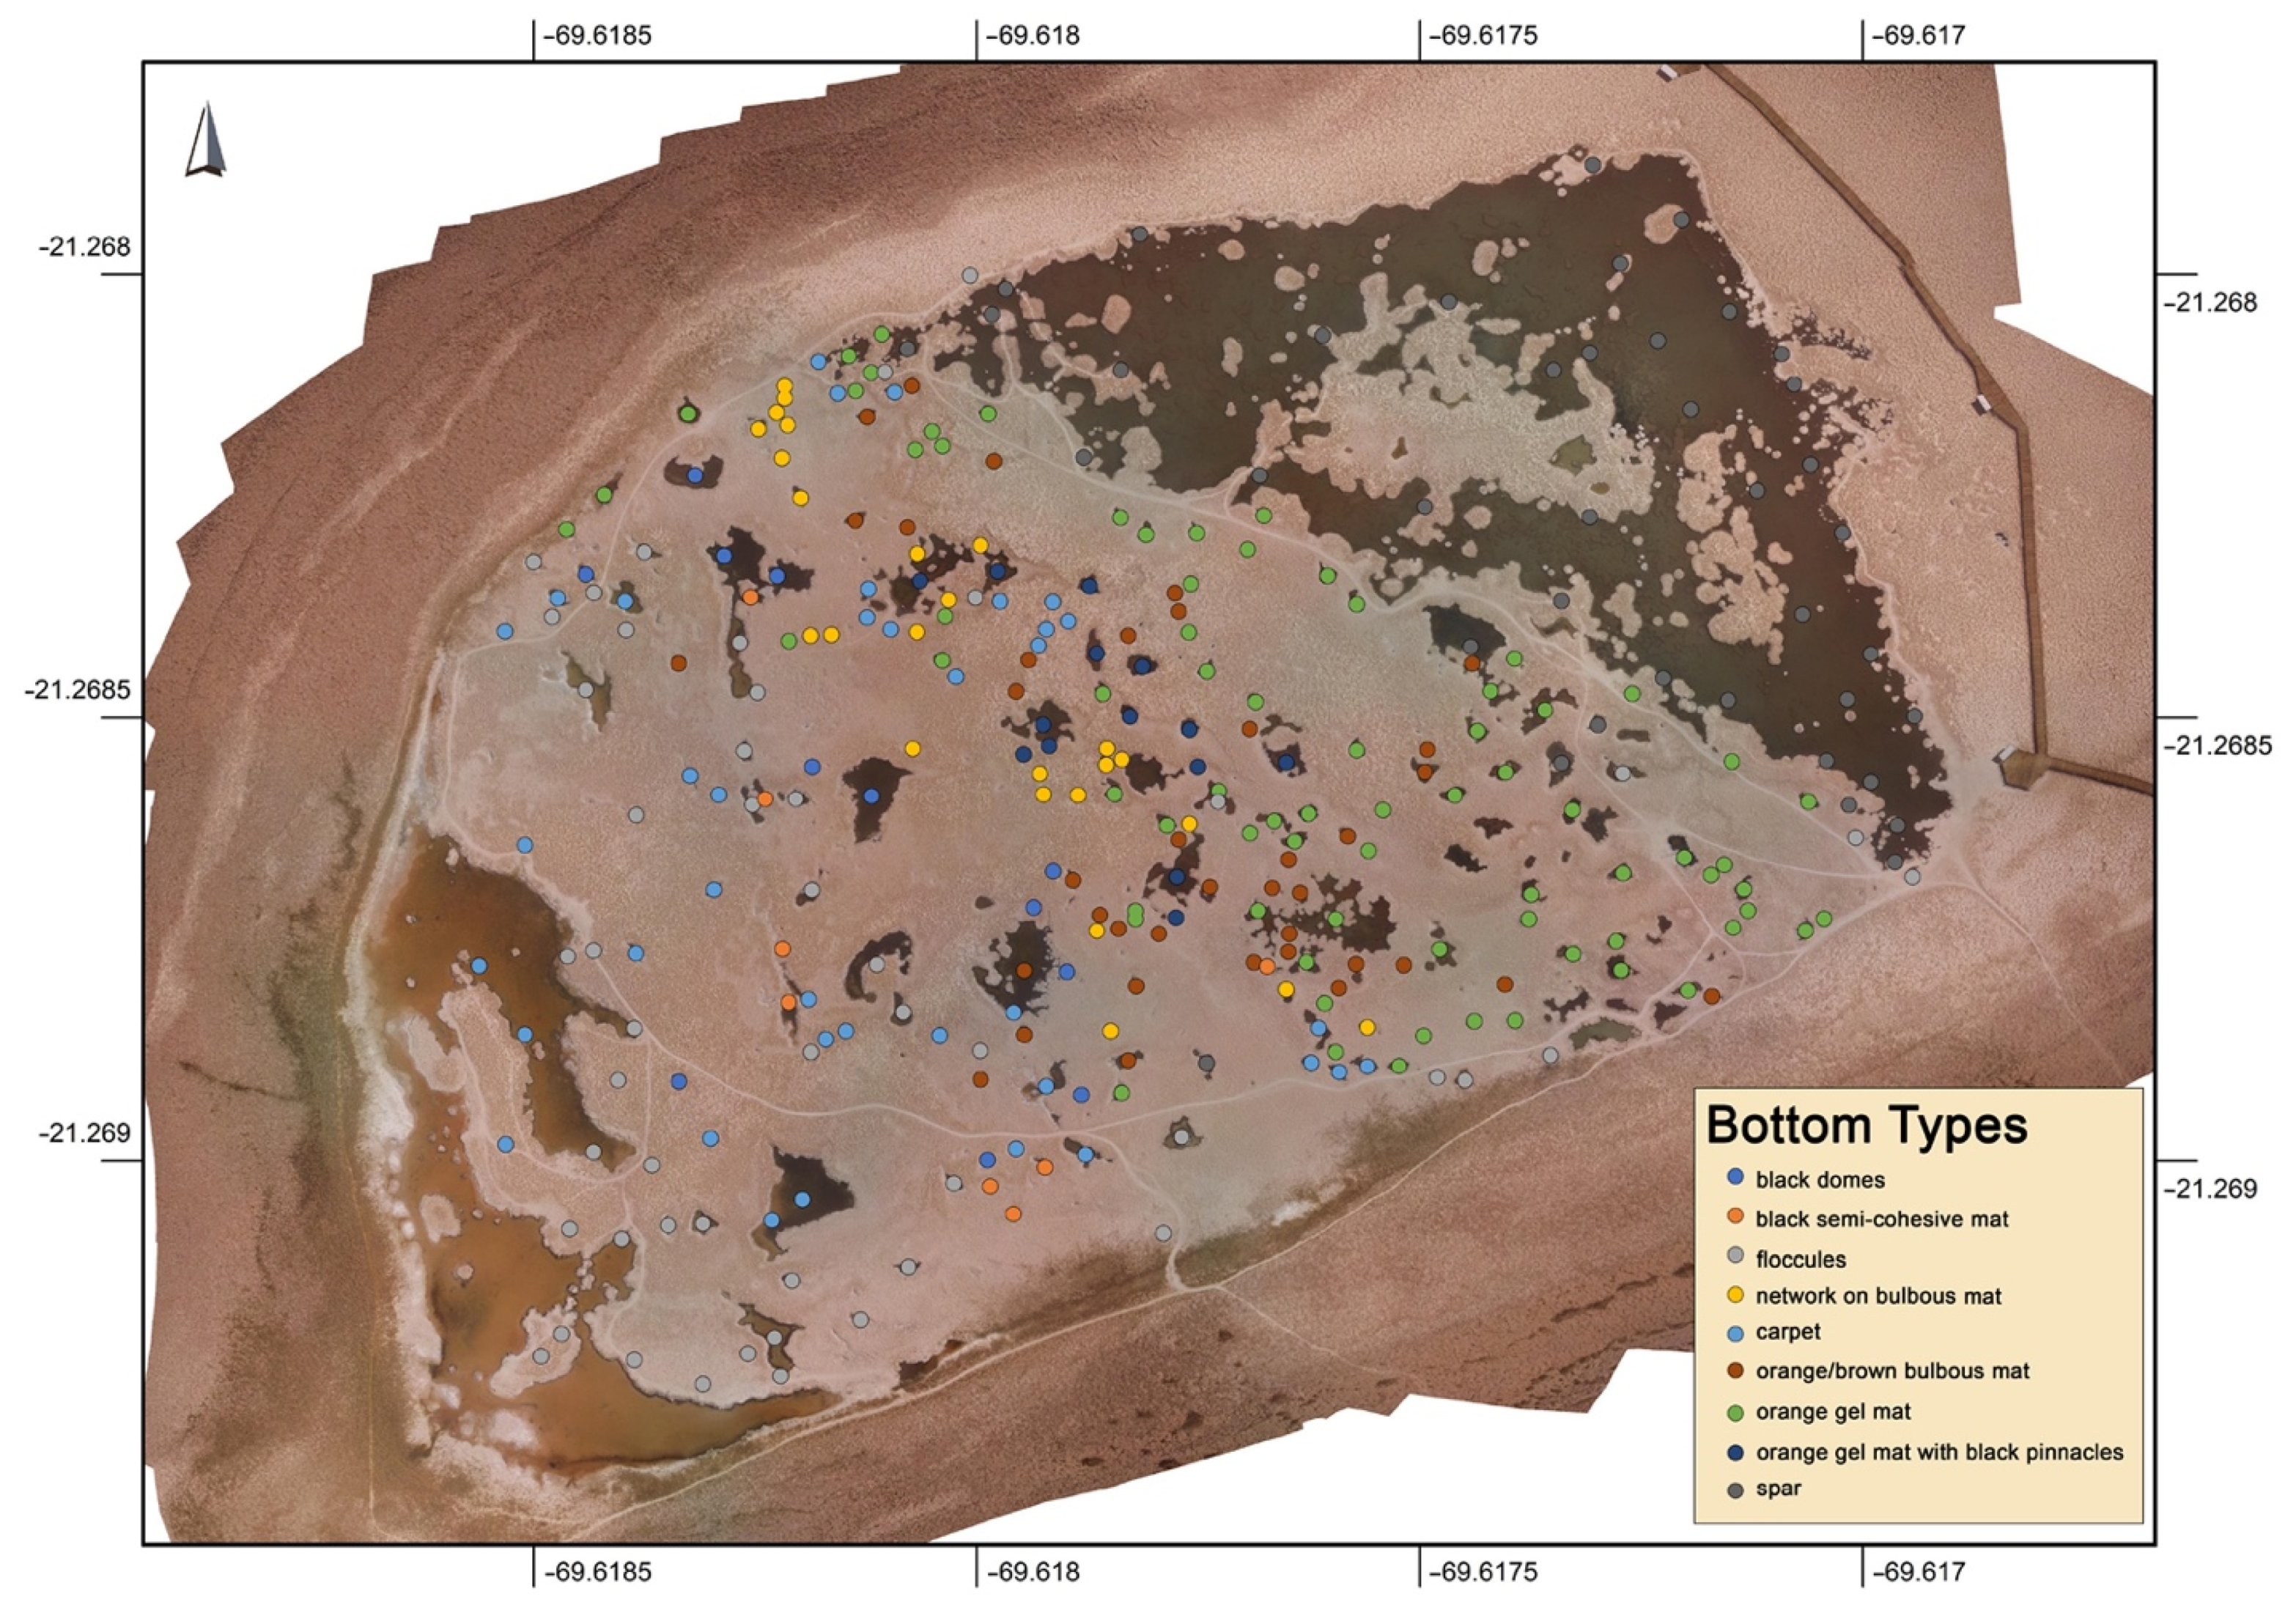
Bottom Type Distribution—The distribution of dominant bottom types in the Puquios plotted using field observations and corresponding drone imagery demonstrate the juxtaposition and diversity of bottom types across the P1/P2 subsystem (Figure 3). Puquio 1 and the Transition Zone showed a general lack of lithified structures with topographic relief, whereas Puquio 2 contains isolated domes, up to 0.5 m high. Gradients between bottom types were observed moving from Puquio 1 to Puquio 2 (southwest to northeast) across the Transition Zone. The dominant bottom type found throughout most of Puquio 1 was floccules (Figure 2c), followed by carpet (Figure 2e), which occurred intermittently across the bottom of Puquio 1, mostly in the northern region of the pond. Floccules were also found in shallow ponds to the east of Puquio 1. Carpet was also found in a wedge shaped region throughout the Transition Zone, most abundant in the north, but with common appearances until midway along the southern boundary. Black semi-cohesive mat (Figure 2b), black domes (Figure 2a), and network on bulbous mat (Figure 2d) all occurred predominantly in a N–S trending band across the Transition Zone, located geographically closer to Puquio 1 in the south, and closer to Puquio 2 in the north. Orange–brown bulbous mat (Figure 2f) was most commonly found in the central region of the Transition Zone, geographically closer to Puquio 2 than to Puquio 1. Orange gel mats with and without black pinnacles (Figure 2g,h) were most commonly found in a NW to SE trending band of Transition Zone ponds parallel to the western margin of Puquio 2. Spar (Figure 2i) was the dominant type across Puquio 2 with smaller accumulations found in peripheral ponds fringing the southwestern margin of Puquio 2.
Field descriptions of bottom types—Hand samples of the nine bottom types collected in the field are described below:
Black domes—Black in color, gelatinous, loosely consolidated, small domes up to 5 cm in relief. With minor agitation, the top of the sample began to disaggregate. However, within this accumulation, large grains and white aggregates with a creamy consistency when rubbed between two fingers were present. A clear division was visible between the loosely consolidated black surface and the granular framework underneath (Figure 4a).
Black semi-cohesive mat—Black in color, loosely consolidated, flocculent material. With minor agitation, much of the material disaggregated into smaller flocculent material. The grains throughout this sample appear to be coarser at the top and finer toward the bottom (Figure 4b). Large crystals of gypsum (selenite), often greater than 5 cm in length, were observed beneath the sampled area.
Floccules—Brown, light tan, or pinkish in color that darkened in color toward the bottom of the sample, with unconsolidated floccules at the surface. The floccules were easily disturbed with minor agitation, causing suspension of floccules into surrounding water column (Figure 4c). Although coarse sediment grains were not prevalent, fine grains could be felt when rubbing the floccules between fingers.
Network on bulbous mat—Whitish-brown in color, spiderweb-like network covering brown gelatinous bulbs to 4 cm in diameter; easily disturbed with minor agitation causing immediate disaggregation. Grains were suspended within the gel at the surface and throughout the orange layer. A well-laminated microbial mat was present beneath these bulbs (Figure 4d).
Carpet—Gray to pink in color, soft, shaggy tufts of loosely aggregated floccules at the sediment/water interface; easily disturbed with minor agitation, causing suspension of floccules into the surrounding water column. Coarse sediment grains were not prevalent within the carpet bottom type. A well-laminated microbial mat with more prevalent sediment grains occurred beneath the carpet bottom type (Figure 4e).
Orange–brown bulbous mat—Orange to brown in color, thick, gelatinous bulbs up to 4 cm in diameter that were not immediately disaggregated with minor agitation. The orange bulbs had small granules of precipitation throughout the gel, along with small cylindrical tubes. A microbial mat with sediment grains and discontinuous laminations was beneath the orange–brown bulbs (Figure 4f).
Orange gel mat—Orange in color, cohesive microbial gel mat up to 1 cm in thickness with a relatively smooth surface. A weakly lithified, laminated layer of precipitation was located underneath the orange gel mat. Beneath this top layer were cohesive green and pink laminations within the mat, along with unconsolidated gelatinous sediments, dark-brown in color (Figure 4g).
Orange gel mat with black pinnacles—Orange in color, cohesive gel mat up to 1 cm in thickness with orange and black pinnacles (1–5 mm) growing vertically from the underlying mat; granular and laminar precipitates were visible within the gel. Beneath this top layer were cohesive green and pink laminations within the mat. Beneath these layers was a grey, granular bottom with abundant sediment grains. A sharp division was present between the upper cohesive microbial mats and lower unconsolidated grains (Figure 4h).
Spar—White, well-cemented, >1 cm gypsum spar with readily discernible faces, typically 1–3 cm in length with a thin brown biofilm at the base of the crystals. The sample was well cemented throughout. A green layer was visible within the cement (Figure 4i).
Note: Many of the bottom types described above have significant porosity, but there is no evidence indicating that the mats have been exposed/dried out (i.e., desiccation cracks or fenestral pores). Occasional gas bubbles have been observed. Detrital input appears to be minimal.

3.2. Laboratory Analyses of Bottom Type Samples

Samples of the nine bottom types were analyzed using SEM with EDS and XRD as described below:
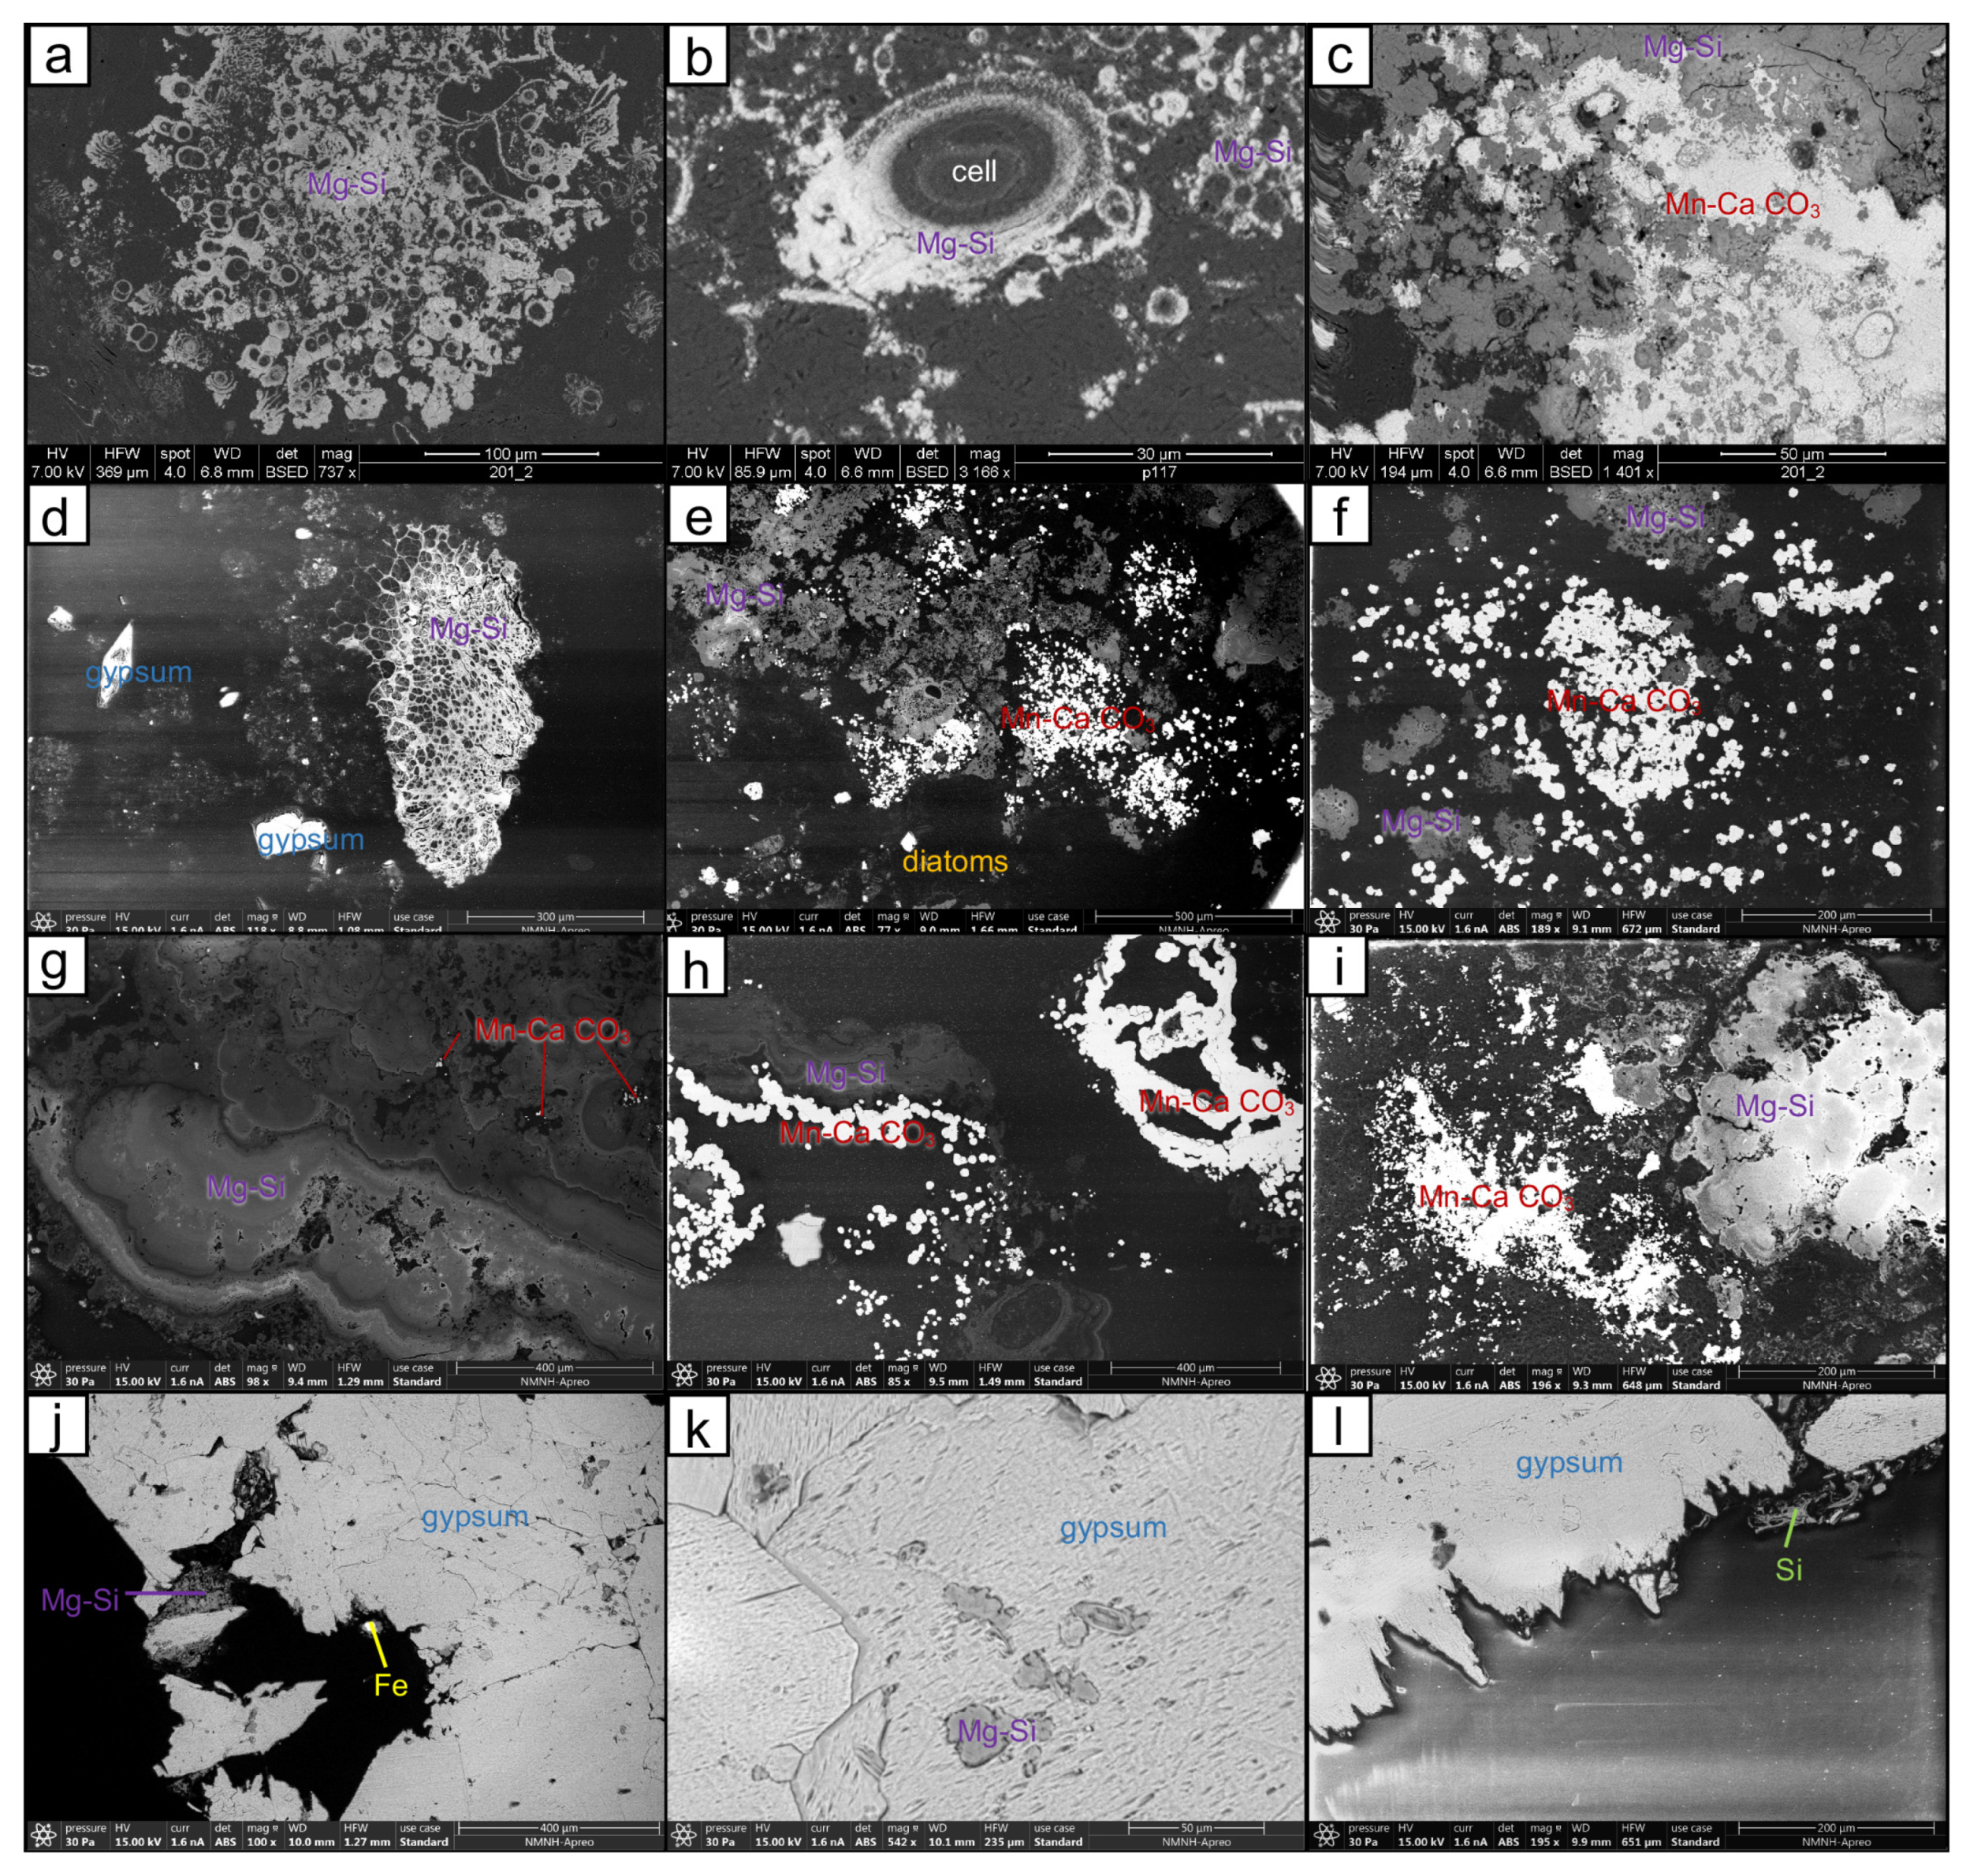
Black domes—SEM–EDS analyses of the black domes bottom type revealed an intimate association of microbes and minerals in various stages of mineralization. Mg–Si was observed forming around cell sheaths (Figure 5a), as well as throughout loose networks of EPS. Diatom frustules at various stages of degradation were observed throughout the sample and within the Mg–Si (Figure 5b). Gypsum precipitates were common as irregularly shaped grains, often intermixed with carbonates (Figure 5c). EDS of Mg–Si precipitates surrounding microbial filaments and enveloping EPS networks surrounding the cells showed minor amounts of Mn incorporated with the Mg–Si. EDS of the carbonate material revealed strong peaks for both Ca and Mn. XRD showed the strongest peaks for gypsum and minor calcite (Supplemental Figure S2a).
Black semi-cohesive mat—SEM–EDS analyses of black semi-cohesive mat revealed abundant bacterial cells, loose networks of EPS often enveloped with Mg–Si, diatom frustules, gypsum and carbonate grains, often found as aggregates. Mg–Si was observed forming around cells and diatom frustules (Figure 5d) and throughout EPS networks (Figure 5e). Mg–Si was also present in the interstices between variously sized and irregularly shaped gypsum crystals (Figure 5f). Mn-oxide was observed in laminated buildups along the edges of both the aggregates and along the margins of diatom frustules (Figure 5d,f). EDS of the carbonate material forming throughout Mg–Si accumulations revealed strong peaks for both Ca and Mn. XRD showed the strongest peaks for gypsum and minor calcite (Supplemental Figure S2b).
Floccules—SEM–EDS analyses of floccules showed evidence of abundant bacterial cells, minimal EPS in diffuse networks, diatom frustules, CaCO3, and gypsum (Figure 5g–i). Additionally, amphipods and gastropods were common throughout. CaCO3 grains were small irregularly shaped precipitates (<10 µm), often aggregated together to form accumulations larger than 200 µm (Figure 5g). Gypsum was observed as irregularly shaped individual grains (Figure 5g–i), and forming as large aggregates of smaller irregularly shaped grains (Figure 5i). Diatom frustules were prevalent in varying states of degradation (Figure 5g–i). XRD showed the strongest peaks for gypsum and minor calcite (Supplemental Figure S2c).
Network on bulbous mat—SEM–EDS analyses of network on bulbous mat revealed an intimate association between microbes, EPS alveolar networks, and minerals. The EPS networks were diffuse and enveloped by Mg–Si, which was abundant throughout the sample. Diatom frustules and minor gypsum crystals were also observed (Figure 5j–l). In addition to forming in and around EPS networks (Figure 5j–l), Mg–Si was observed forming along cell sheaths and infilling degraded cell cavities. XRD did not reveal strong peaks from the powdered samples.
Carpet—SEM–EDS analyses of carpet showed evidence of abundant cells and diffuse EPS alveolar networks encrusted in Mg–Si (Figure 5m–o). In addition to forming in and around EPS networks, Mg–Si was observed infilling degraded cell cavities in and around the aggregates (Figure 5n). Small, 10–20 µm sized gypsum grains, irregular to lenticular shaped, were found throughout the carpet bottom type within the Mg–Si matrix (Figure 5o). Overall, this bottom type was dominated by microbial material and Mg–Si. As such, XRD did not reveal strong peaks from the powdered samples.
Orange–brown bulbous mat—SEM–EDS analyses of orange–brown bulbous mat revealed a close association of microbes, Mg–Si, and carbonates (Figure 6a–c). EPS were common throughout the sample often exhibiting loose, diffuse to slightly more condensed alveolar networks, often encrusted in Mg–Si (Figure 6a). Mg–Si was also observed forming around the cell sheath in small micrometer-scale precipitates that accumulated into dense bands around cell sheaths, building to tens of microns in diameter (Figure 6b). A Mn-rich calcium carbonate was also observed forming within the Mg–Si networks, in intimately mixed accumulations, with the carbonate material appearing to be secondary to the Mg–Si, infilling pore spaces and encrusting around the edges of the accumulation (Figure 6c). XRD showed the strongest peaks for gypsum and minor calcite (Supplemental Figure S2d).
Orange gel mat—SEM–EDS analyses of orange gel mat showed evidence of abundant cells and highly concentrated EPS networks that were commonly encrusted in Mg–Si, carbonate grains, and diatom frustules (Figure 6d–f). The Mg–Si was found encrusting the characteristic honeycomb morphology exhibited by EPS alveolar networks (Figure 6d,e), and observed forming in dense botryoidal accumulations that appeared laminated in cross-section (Figure 6f). Mn-rich grains of calcium carbonate were found as isolated precipitates, tens of microns in size throughout the pore-space in some Mg–Si accumulations (Figure 6e), and along with the outer margins of the dese botryoidal accumulations of Mg–Si (Figure 6f). Gypsum grains were also identified but were a minor component in relation to the Mg–Si and carbonate fractions. XRD did not reveal strong peaks from the powdered samples.
Orange gel mat with black pinnacles—SEM–EDS analyses of orange gel mat with black pinnacles were analogous to the orange gel mat samples. Abundant highly concentrated EPS networks, Mg–Si, and Mn-rich carbonate grains, were often found in aggregates. Mg–Si was abundant throughout all samples, forming in dense accumulations that were commonly botryoidal and laminated (Figure 6g,h). The outer margins of the laminated botryoidal Mg–Si accumulations were more porous and often with fringing grains of Mn-rich calcium carbonate (Figure 6g,h). Mn-rich calcium carbonate was also observed as isolated precipitates, tens of microns in size, often aggregated into larger accumulations (Figure 6h,i). Gypsum grains were present but were a minor component in relation to the Mg–Si and carbonate fractions. XRD showed the strongest peaks for gypsum and minor calcite (Supplemental Figure S2e).
Spar—SEM–EDS analyses of spar revealed less granular accumulations of gypsum than in other samples. Gypsum crystals were anhedral to subhedral and often had sutured mosaic fabrics between crystal margins (Figure 6j,l). EPS were minimal to absent along the outer margins of the structure. Mg–Si were observed infilling crevices (Figure 6j) and within sutured fabrics (Figure 6k). Cross-sections of striations caused by dissolution were evident along the outer margins of the spar (Figure 6l). XRD showed the strongest peaks for gypsum (Supplemental Figure S2f).

3.3. Statistical Analyses of Environmental Parameters

Collected environmental data showed trends in distribution, median, and variability between each identified bottom type as described below.
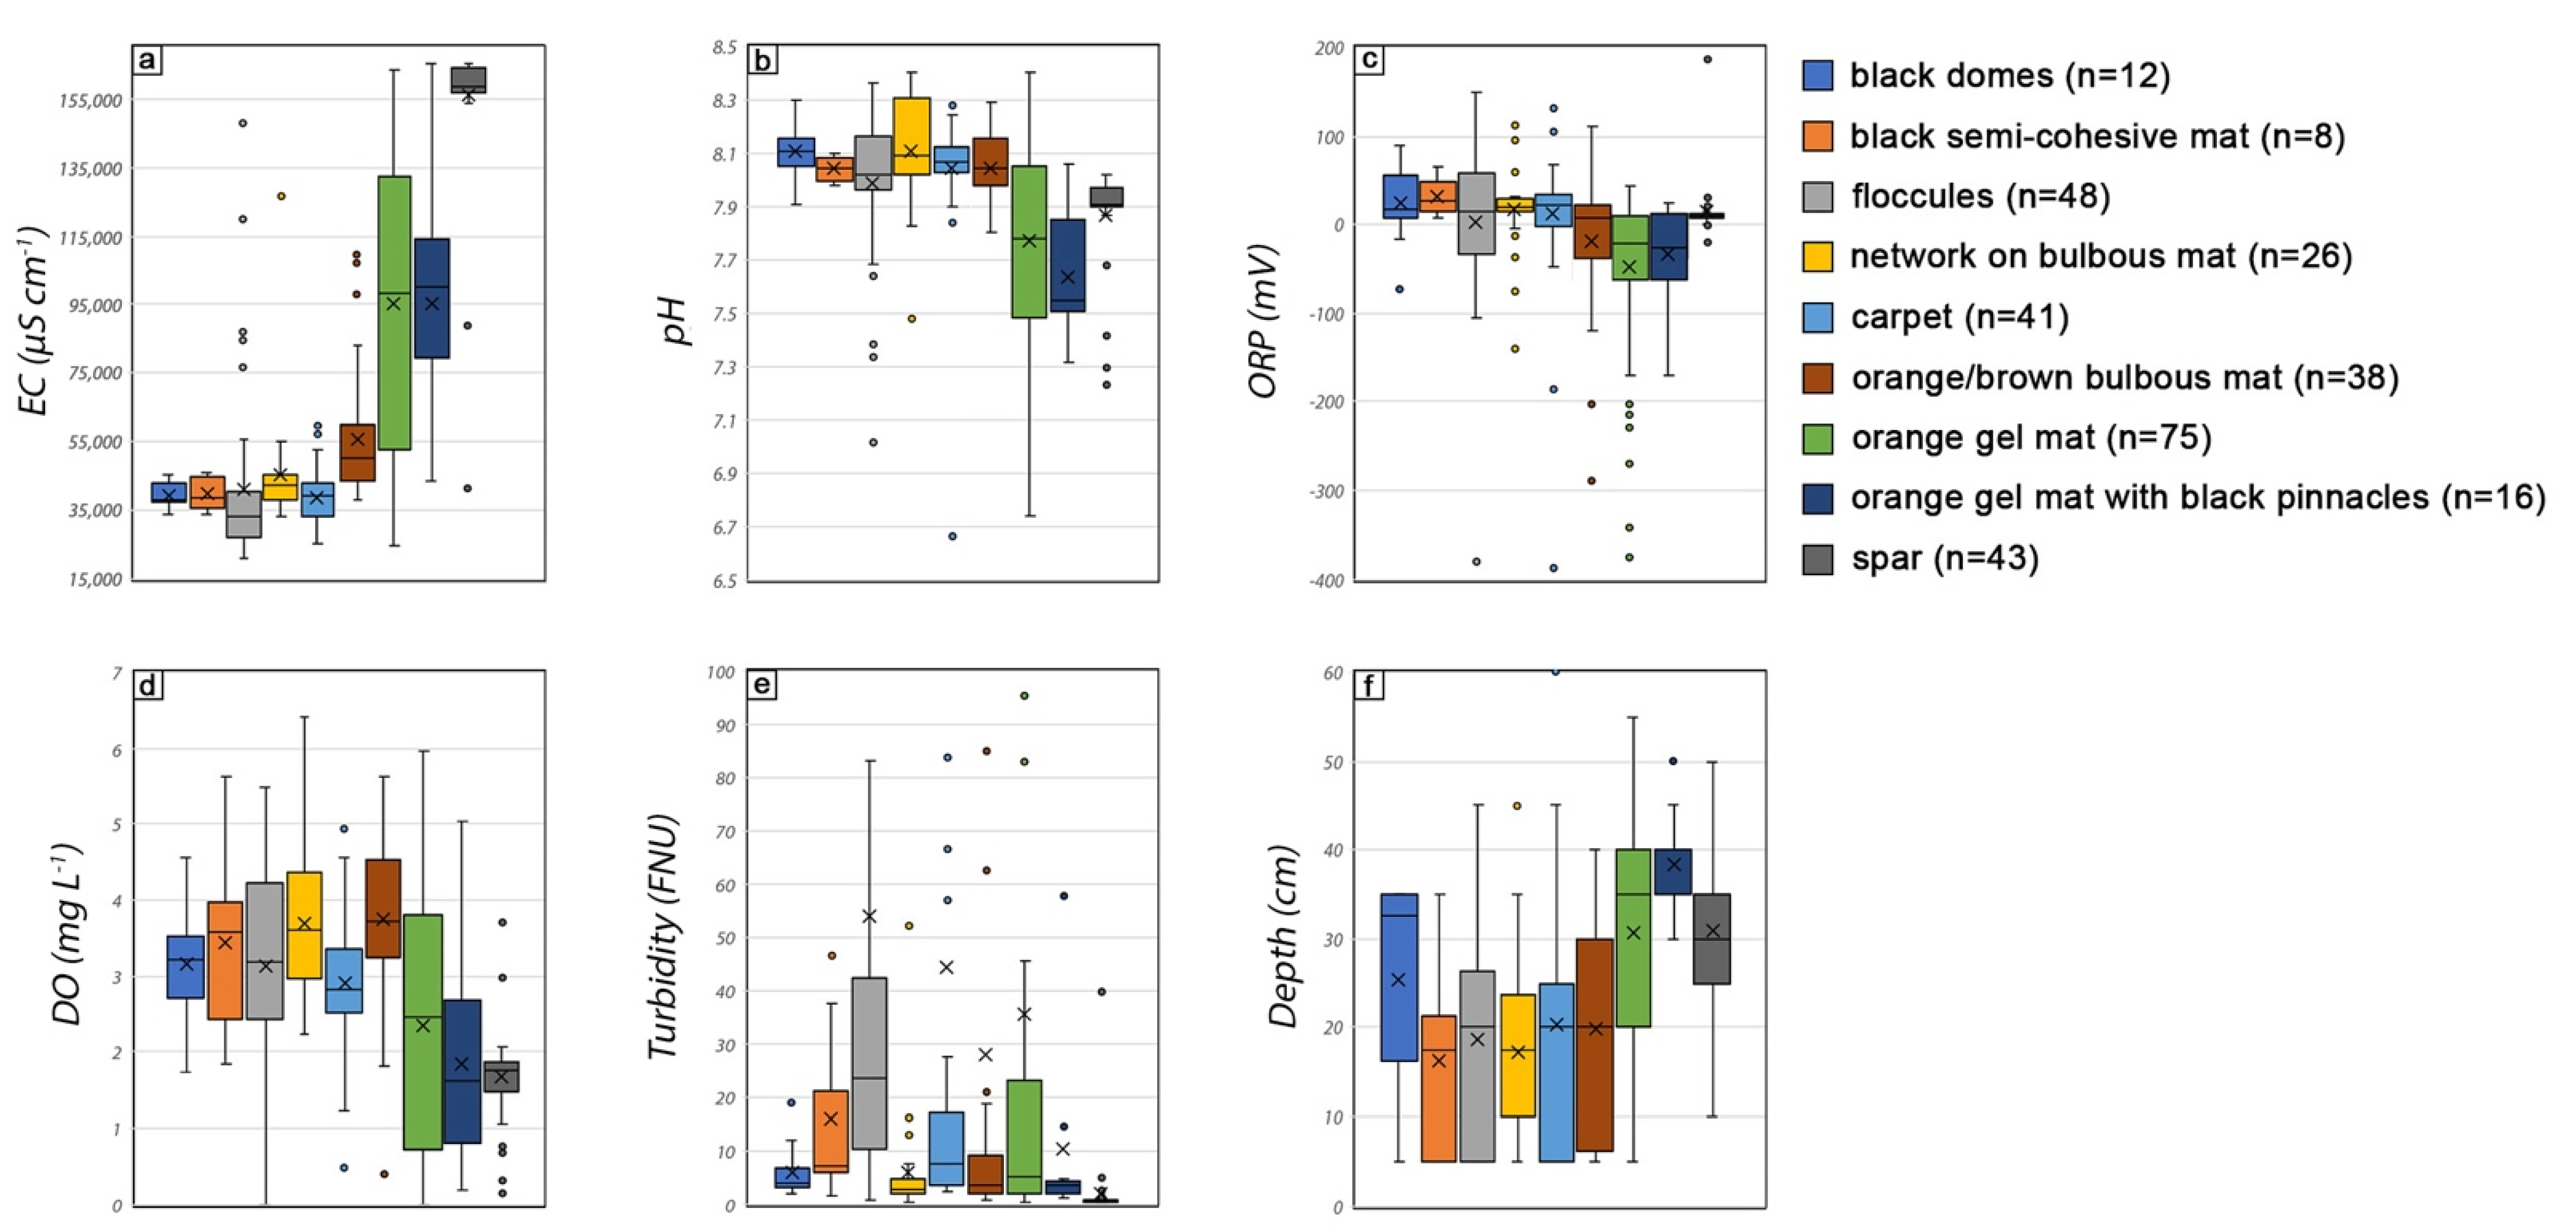
Environmental parameters—Large ranges in EC (20,710–16,5400 µS cm−1), pH (6.66–8.40), ORP (−380.9–186.8 mV), and DO (0.00–6.42 mg L−1) were recorded between different bottom types across the P1/P2 depositional environment (Figure 7, Supplemental Table S1).
EC—The smallest interquartile range was observed in black domes bottom type (n = 12; Q1: 37,267.5 µS cm−1, Q3: 42,832.5 µS cm−1; IQR: 5575 µS cm−1). The largest interquartile range was observed in orange gel mat (n = 75; Q1: 52,795 µS cm−1, Q3: 132,550 µS cm−1; IQR: 79,755 µS cm−1). Carpet had the lowest mean EC value (n = 41; 38,560 µS cm−1), whereas the lowest median value was recorded for floccules bottom type (n = 48; 33,250 µS cm−1). Spar bottom type (n = 43) had both the highest mean (156,317.4 µS cm−1) and median (159,000 µS cm−1) (Figure 7a, Supplemental Table S1).
pH—The smallest interquartile range was observed in spar bottom type (n = 43; Q1: 7.89, Q3: 7.97; IQR: 0.08). The largest interquartile range was observed in orange gel mat (n = 75; Q1: 7.48, Q3: 8.05; IQR: 0.57). Orange gel mat with black pinnacles (n = 16) had the lowest mean pH value (7.63), and the lowest median value (7.55). Black domes (n = 12) and carpet (n = 41) had the lowest mean pH value (8.11); the lowest median pH value was recorded for black domes (8.11) (Figure 7b, Supplemental Table S1).
ORP—The smallest interquartile range was observed in spar bottom type (n = 43; Q1: 7.0 mV, Q3: 12.3 mV; IQR: 5.4 mV). The largest interquartile range was observed in floccules (n = 48; Q1: −33.4 mV, Q3: 56.9 mV; IQR: 90.3 mV). Orange gel mat had the lowest mean ORP value (n = 75; −47.6 mV), while orange gel mat with black pinnacles had the lowest median ORP value (n = 16; −25.4 mV). Black semi-cohesive mat (n = 8) had both the highest mean (31.2 mV) and median (25.8 mV) ORP values (Figure 7c, Supplemental Table S1).
DO—The smallest interquartile range in DO was observed in spar bottom type (n = 43; Q1: 1.47 mg L−1, Q3: 1.87 mg L−1; IQR: 0.40 mg L−1). The largest interquartile range was observed in orange gel mat (n = 75; Q1: 0.73 mg L−1, Q3: 3.81 mg L−1; IQR: 3.08 mg L−1). Spar bottom type had the lowest mean DO concentration (n = 43; 1.66 mg L−1), whereas the lowest median DO concentration was recorded for orange gel mat with black pinnacles bottom type (n = 16; 1.63 mg L−1). Orange–brown bulbous mat (n = 16) had the highest mean DO concentration (3.73 mg L−1), and the highest median value (3.73 mg L−1) (Figure 7d, Supplemental Table S1).
Turbidity—Turbidity readings between 0.3–1000 FNU were recorded across the Puquio 1 and Puquio 2 depositional environment. The smallest interquartile range in turbidity was observed in spar bottom type (n = 43; Q1: 0.4 FNU, Q3: 0.7 FNU; IQR: 0.3 FNU). The largest interquartile range was observed in floccules bottom type (n = 48; Q1: 10.1 FNU, Q3: 42.4 FNU; IQR: 32.4 FNU). Spar bottom type (n = 43) had the lowest mean turbidity value (1.9 FU) and lowest median value (0.5 FNU). Floccules bottom type (n = 48) had the highest mean turbidity value (53.8 FU) and highest median value (23.4 FNU) (Figure 7e, Supplemental Table S1).
Depth—The maximum depth recorded across the Puquio 1 and Puquio 2 depositional system was 60 cm. The smallest interquartile depth range was recorded for orange gel mat with black pinnacles (n = 16; Q1: 35 cm, Q3: 40 cm; IQR: 5 cm). The largest interquartile range was observed in orange–brown bulbous mat (n = 38; Q1: 6 cm, Q3: 30 cm; IQR: 24 cm). Black semi-cohesive mat (n = 8) had the shallowest mean depth (16 cm) and shared the shallowest median depth with network on bulbous mat bottom type (n = 26; 18 cm). Orange gel mat with black pinnacles bottom type (n = 16) had both the deepest mean depth value (38 cm), and the deepest median depth value (40 cm) (Figure 7f, Supplemental Table S1).

ANOVA

ANOVA revealed significant differences in each environmental parameter dataset (Supplemental Table S2), with EC as the strongest driver, accounting for nearly 70% of the variance between bottom types (F(8, 298) = 85.214, p < 0.001, η2p = 0.696). Although statistically significant differences (p < 0.05) were present, certain environmental variables were highly significant (p< 0.001), including for pH, but accounted for a smaller fraction (23%) of the total variance explained among bottom types (F(8, 298) = 11.321, p < 0.001, η2p = 0.233), ORP, 12% of variance between bottom types, F(8, 298) = 5.037, p < 0.001, η2p = 0.119), DO, 25% of variance between bottom types, (F(8, 298) = 12.316, p < 0.001, η2p = 0.248), depth, 24% of variance between bottom types, (F(8, 298) = 11.467, p < 0.001, η2p = 0.235), and turbidity, 4% of variance between bottom types, (F(8, 298) = 1.338, p < 0.001, η2p = 0.035).
Post hoc tests were completed on the ANOVA dataset (Supplemental Table S2). Using EC as the independent variable, this analysis grouped bottom types into three homogenous subsets (Table 1, Figure 8). Group I contained six statistically similar bottom types with respect to EC when using medians (M) and standard deviation (SD), and included carpet (M = 38,560.24, SD = 8167.99), black domes (M = 39,124.17, SD = 3516.85), black semi-cohesive mat (M = 39,660.00, SD = 5014.63), floccules (M = 40,704.79, SD = 24,337.31), network on bulbous mat (M = 45,266.54, SD = 17,592.93), and orange–brown bulbous mat (M = 55,533.95, SD = 18,350.31). Group II contained orange gel mat (M = 95,509.60, SD = 41,985.26) and orange gel mat with black pinnacles (M = 95,519.38, SD = 33,015.45); Group III contained only the spar bottom type (M = 156,318.37, SD = 21,358.77). Using pH, ORP, DO, depth, and turbidity as independent variables, homogenous subset groups of bottom types were not well defined, with overlap between groups (Supplemental Table S3); thus, they were not considered further.

3.4. Principal Component Analysis

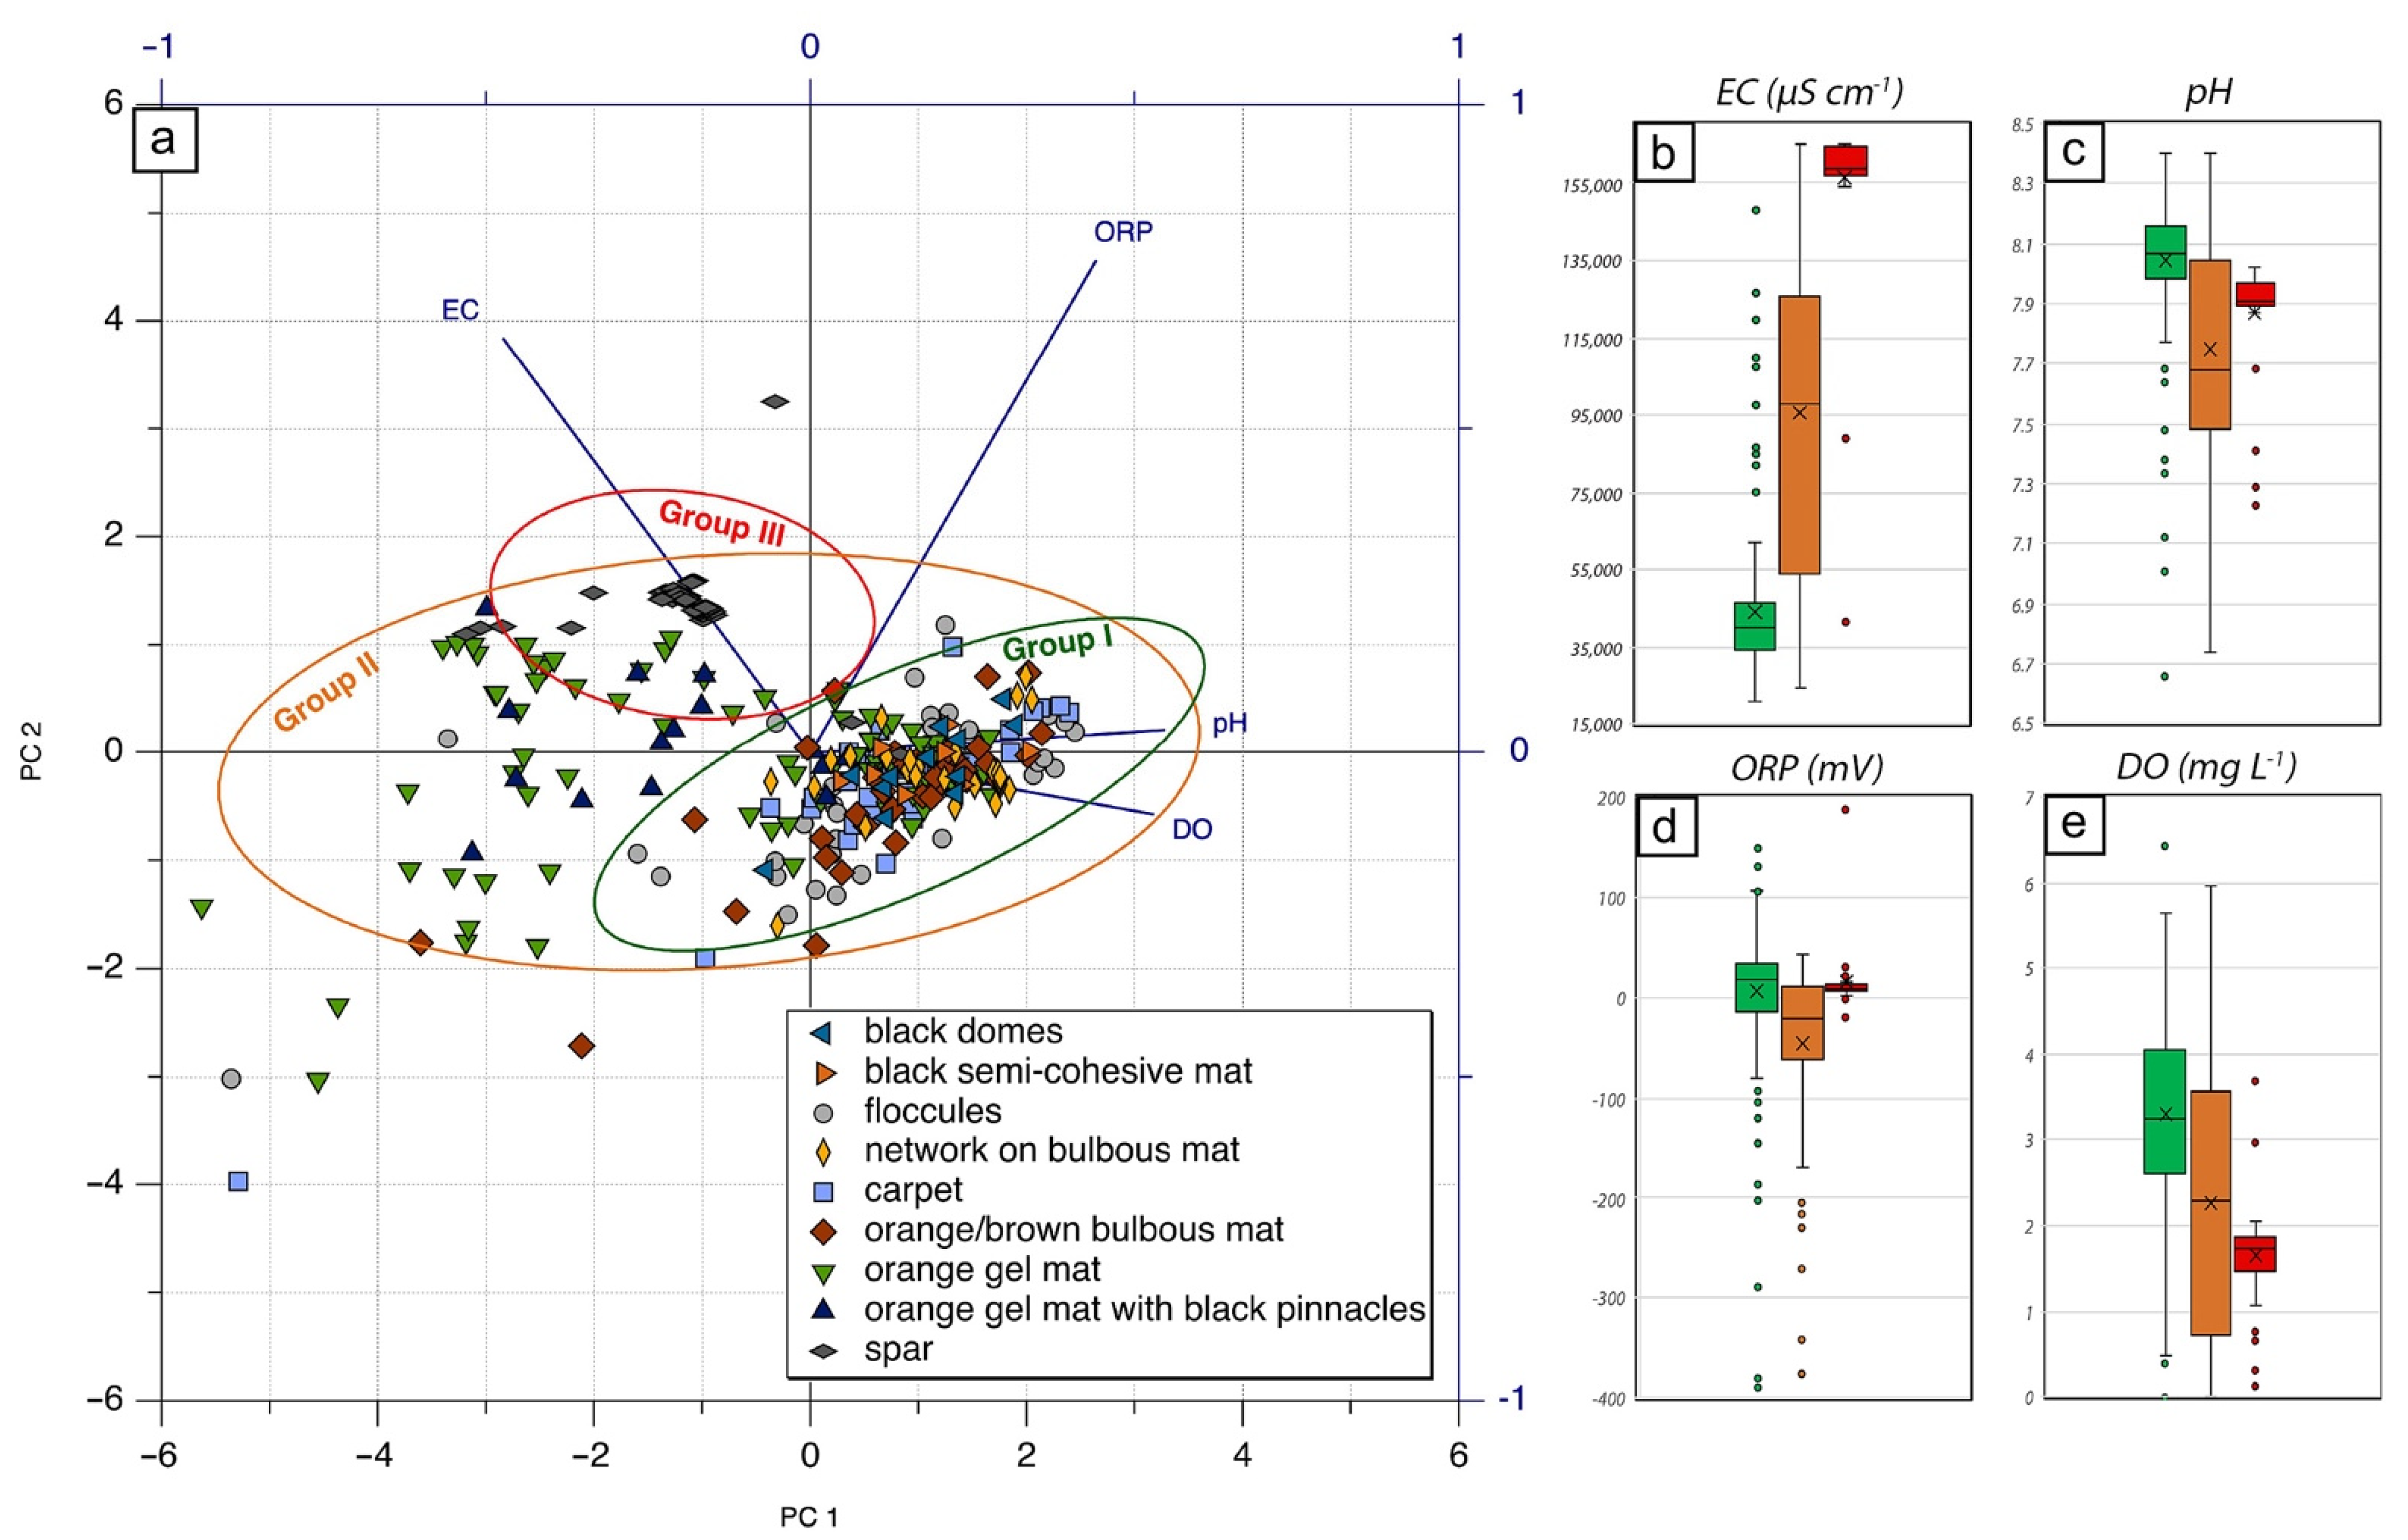
The principal component analysis (PCA) used EC, pH, ORP, and DO as variables on the correlation matrix. The interpretation was restricted to the first and second principal components (PC1 and PC2) because the cumulative proportions of variance showed that they account for 64.5% and 18.5% of the variability in the dataset, respectively. Samples with high DO and pH values loaded positively on the first principal component. Samples with high EC values loaded negatively on the first principal component and positively on the second principal component. Samples with negative ORP values loaded negatively on both the first and second principal components. Groups I, II, and III can be easily differentiated by their 95% concentration ellipses in the PCA biplot (Figure 9a).
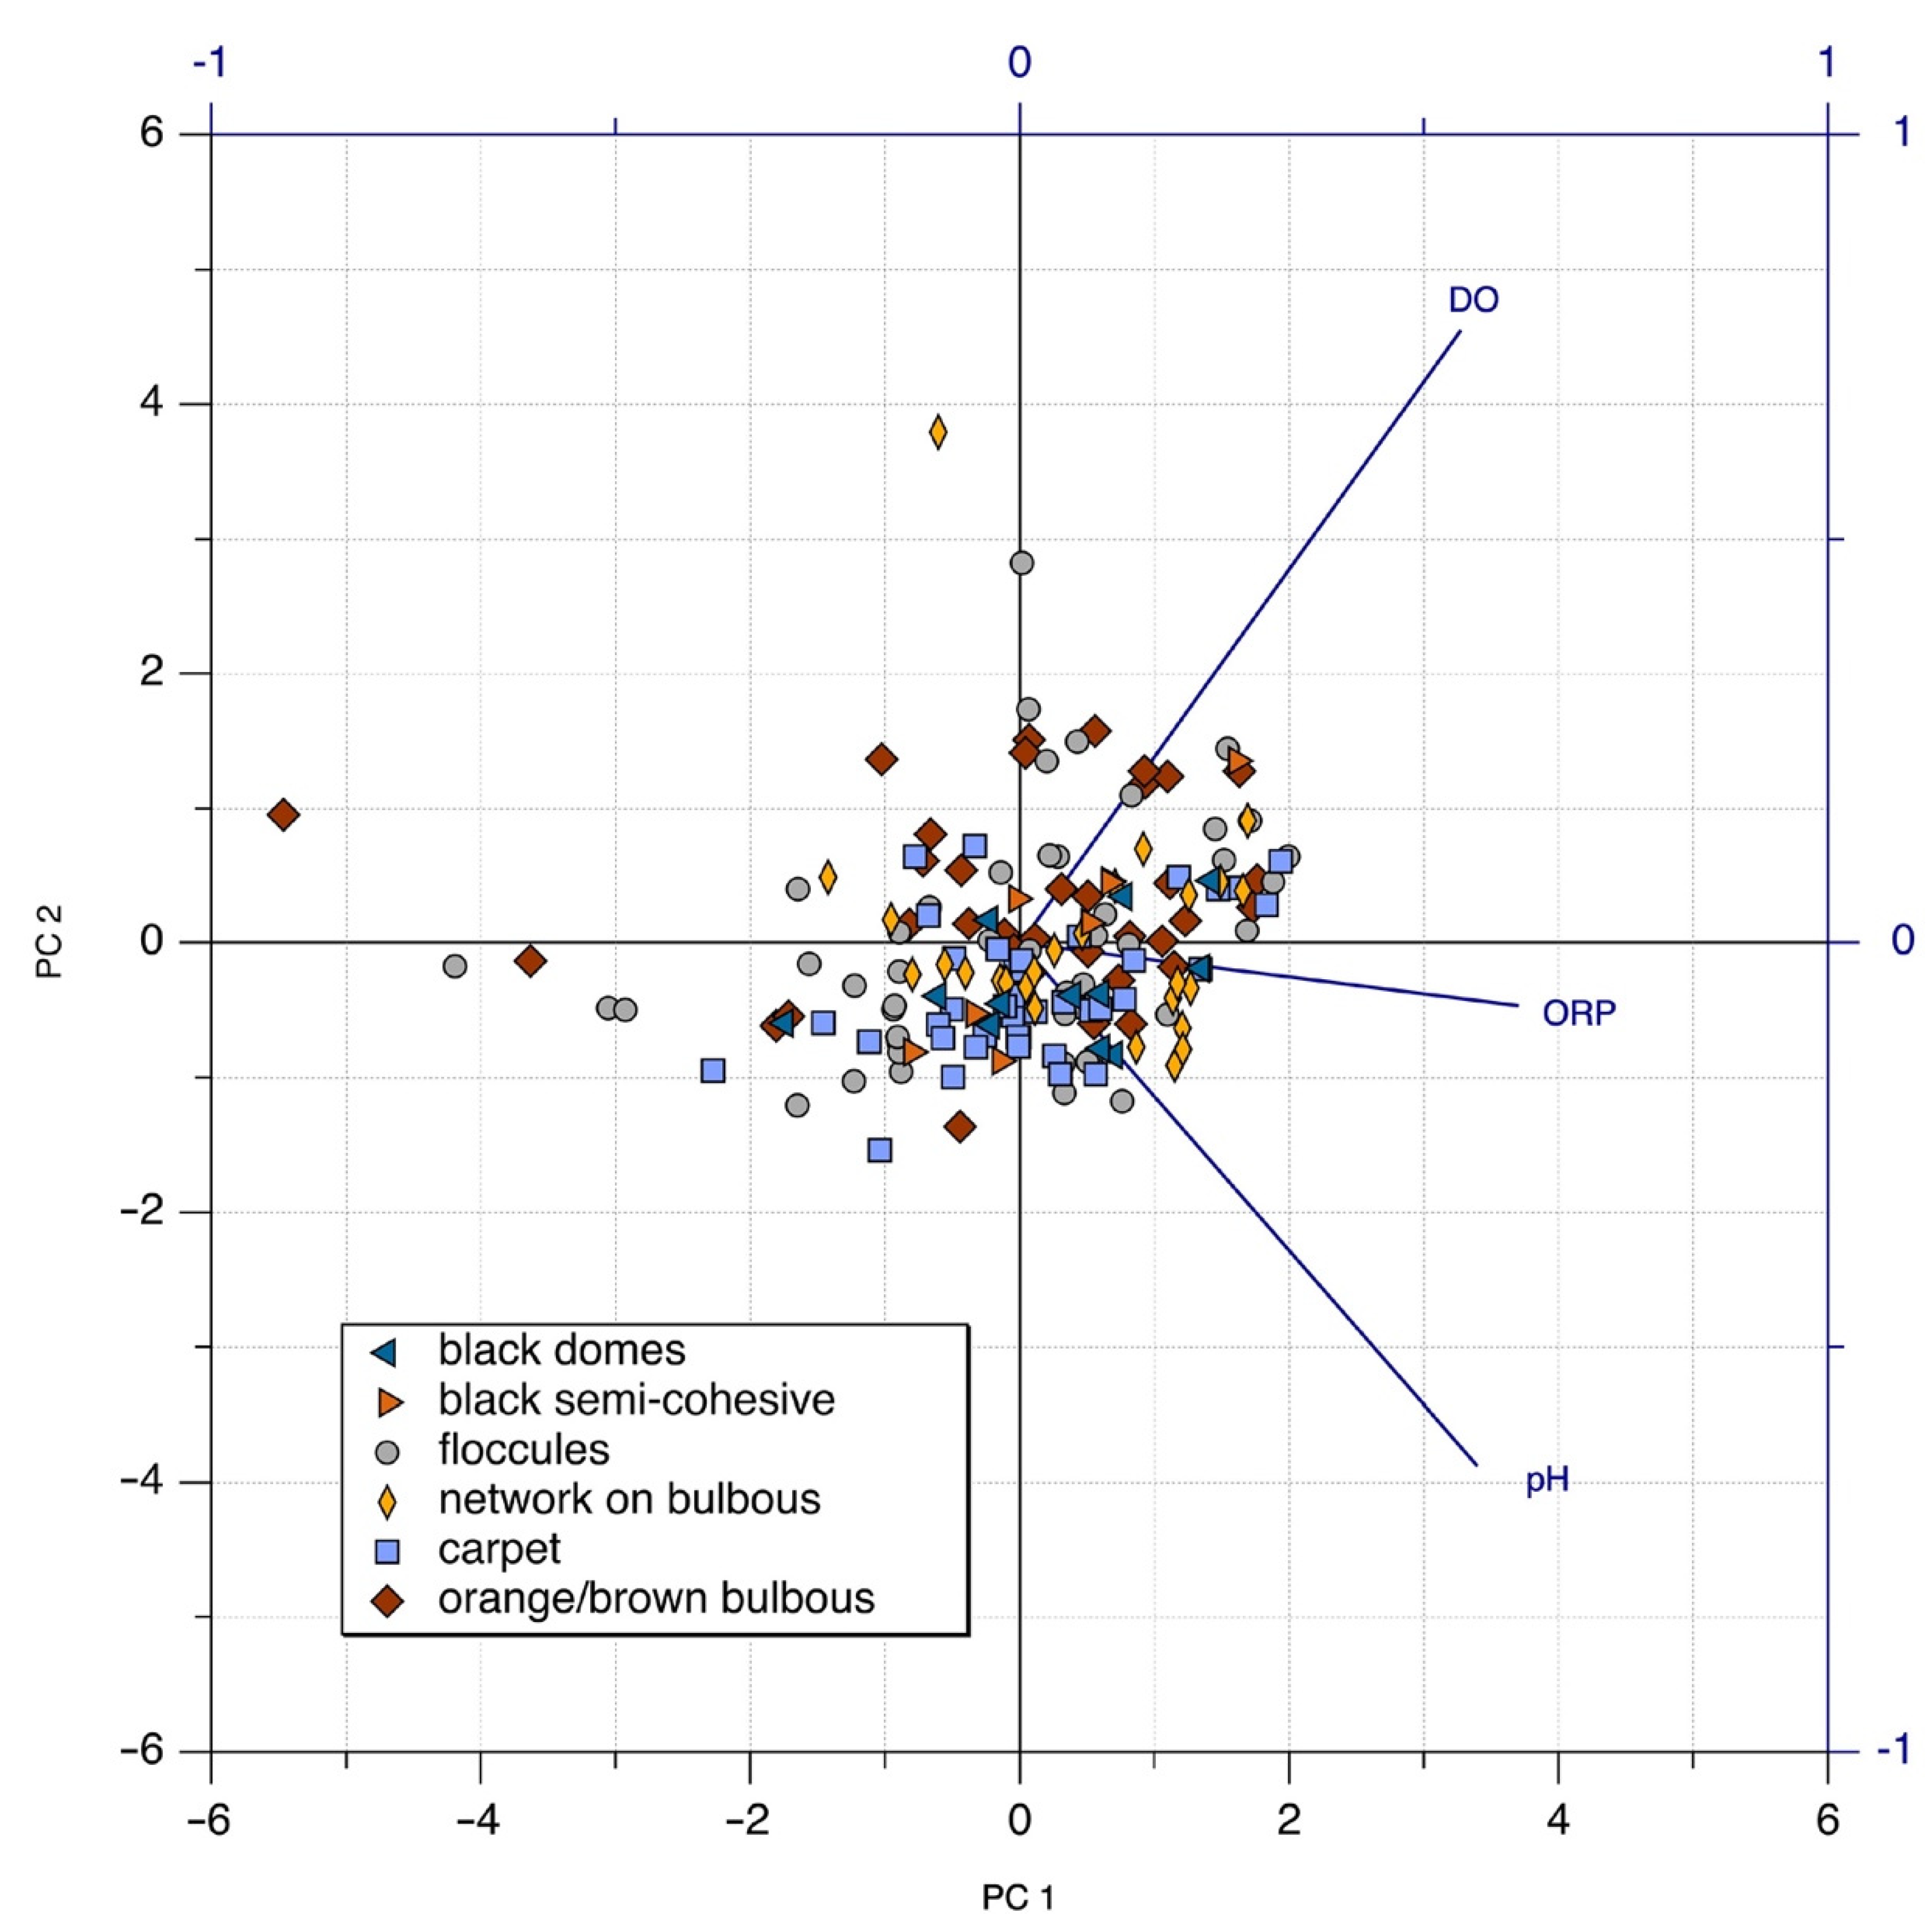
Box and whisker plots of each bottom type group are shown with respect to each environmental parameter in Figure 9 to further highlight the differences between groups. Bottom types included in Group I (black domes, black semi-cohesive mat, floccules, network on bulbous mat, carpet, and orange–brown bulbous mat) cluster tightly together, with relatively elevated pH, ORP, and DO (Figure 9b–e; green). Bottom types included in Group II (orange gel mat and orange gel mat with black pinnacles), with mostly negative ORP values and low pH and DO concentrations, cover the largest spread of measured physicochemical parameters (Figure 9b–e; orange). Group III (spar) has elevated EC, pH, and ORP, and lower DO (Figure 9b–e; red). A separate PCA was performed on Group I bottom types using DO, pH, and ORP (i.e., excluding EC), revealing bottom types as statistically indistinguishable from one another. (Figure 10).

3.5. Synthesis of Results

The results above show that ponds within the P1/P2 subsystem are distinct in terms of bottom types, brine chemistry, microbial mat development, and mineral precipitation (Table 2). Puquio 1 was dominated by loosely cohesive floccules with minor carpet. EC measurements in Puquio 1 were less than 40,000 µS cm−1, median pH levels were above 8, median ORP levels show oxidative environments, median DO concentrations were ~3 mg L−1, and turbidity was low. Bottom sediments showed abundant microbial communities with diffuse networks of EPS. The sample was dominantly irregularly shaped gypsum grains, with minor irregularly shaped CaCO3 grains formed from agglutinated crystals smaller than 10 µm.
Bottom types in Transition Zone ponds close to Puquio 1 include black domes, black semi-cohesive mat, floccules, network on bulbous mat, carpet, and orange–brown bulbous mat (Table 2). These ponds had median electrical conductivity measurements between ~38,000–55,000 µS cm−1, median pH levels above 8, and generally oxidative conditions with ORP median levels higher than 0 mV. These bottom types were most commonly associated with granular (irregularly and lenticular shaped) to laminated gypsum precipitates, loosely bound alveolar networks of EPS often encrusted with Mg–Si, and minor Mn-enriched calcium carbonate precipitates.
Bottom types in Transition Zone ponds close to Puquio 2 include orange gel mat and orange gel mat with black pinnacles bottom types (Table 2). These ponds had higher electrical conductivity values (median ~95,000 µS cm−1), median pH levels lower than 8, generally reducing environments with median ORP below 0 mV, and low DO (median ~2–3 mg L−1). These bottom types were commonly associated with irregular and lenticular gypsum grains, Mn-rich calcium-carbonates, abundant cells commonly encrusted with Mg–Si, and copious amounts of EPS with tightly bound alveolar networks often enveloped with Mg–Si. Within these bottom types, Mg–Si was also observed to form dense botryoidal accumulations (Figure 6d–i).
In Puquio 2, and along the eastern margin of the Transition Zone in a small narrow band to the SW of Puquio 2, spar was the main bottom type observed (Figure 3). Spar bottom type was found to occur in ponds with elevated electrical conductivity measurements (median: 159,000 µS cm−1), median pH levels below 8, slightly oxidative environments, and median dissolved oxygen levels less than 2 mg L−1. Spar bottom type is made up of large gypsum crystals (selenite), often with a sutured mosaic fabric; minor amounts of Mg–Si were observed as intracrystalline or infilling crevices. The surfaces of these crystals have minimal EPS, and dissolution was also observed along some crystal margins (Table 2, Figure 6j–l).

4. Discussion

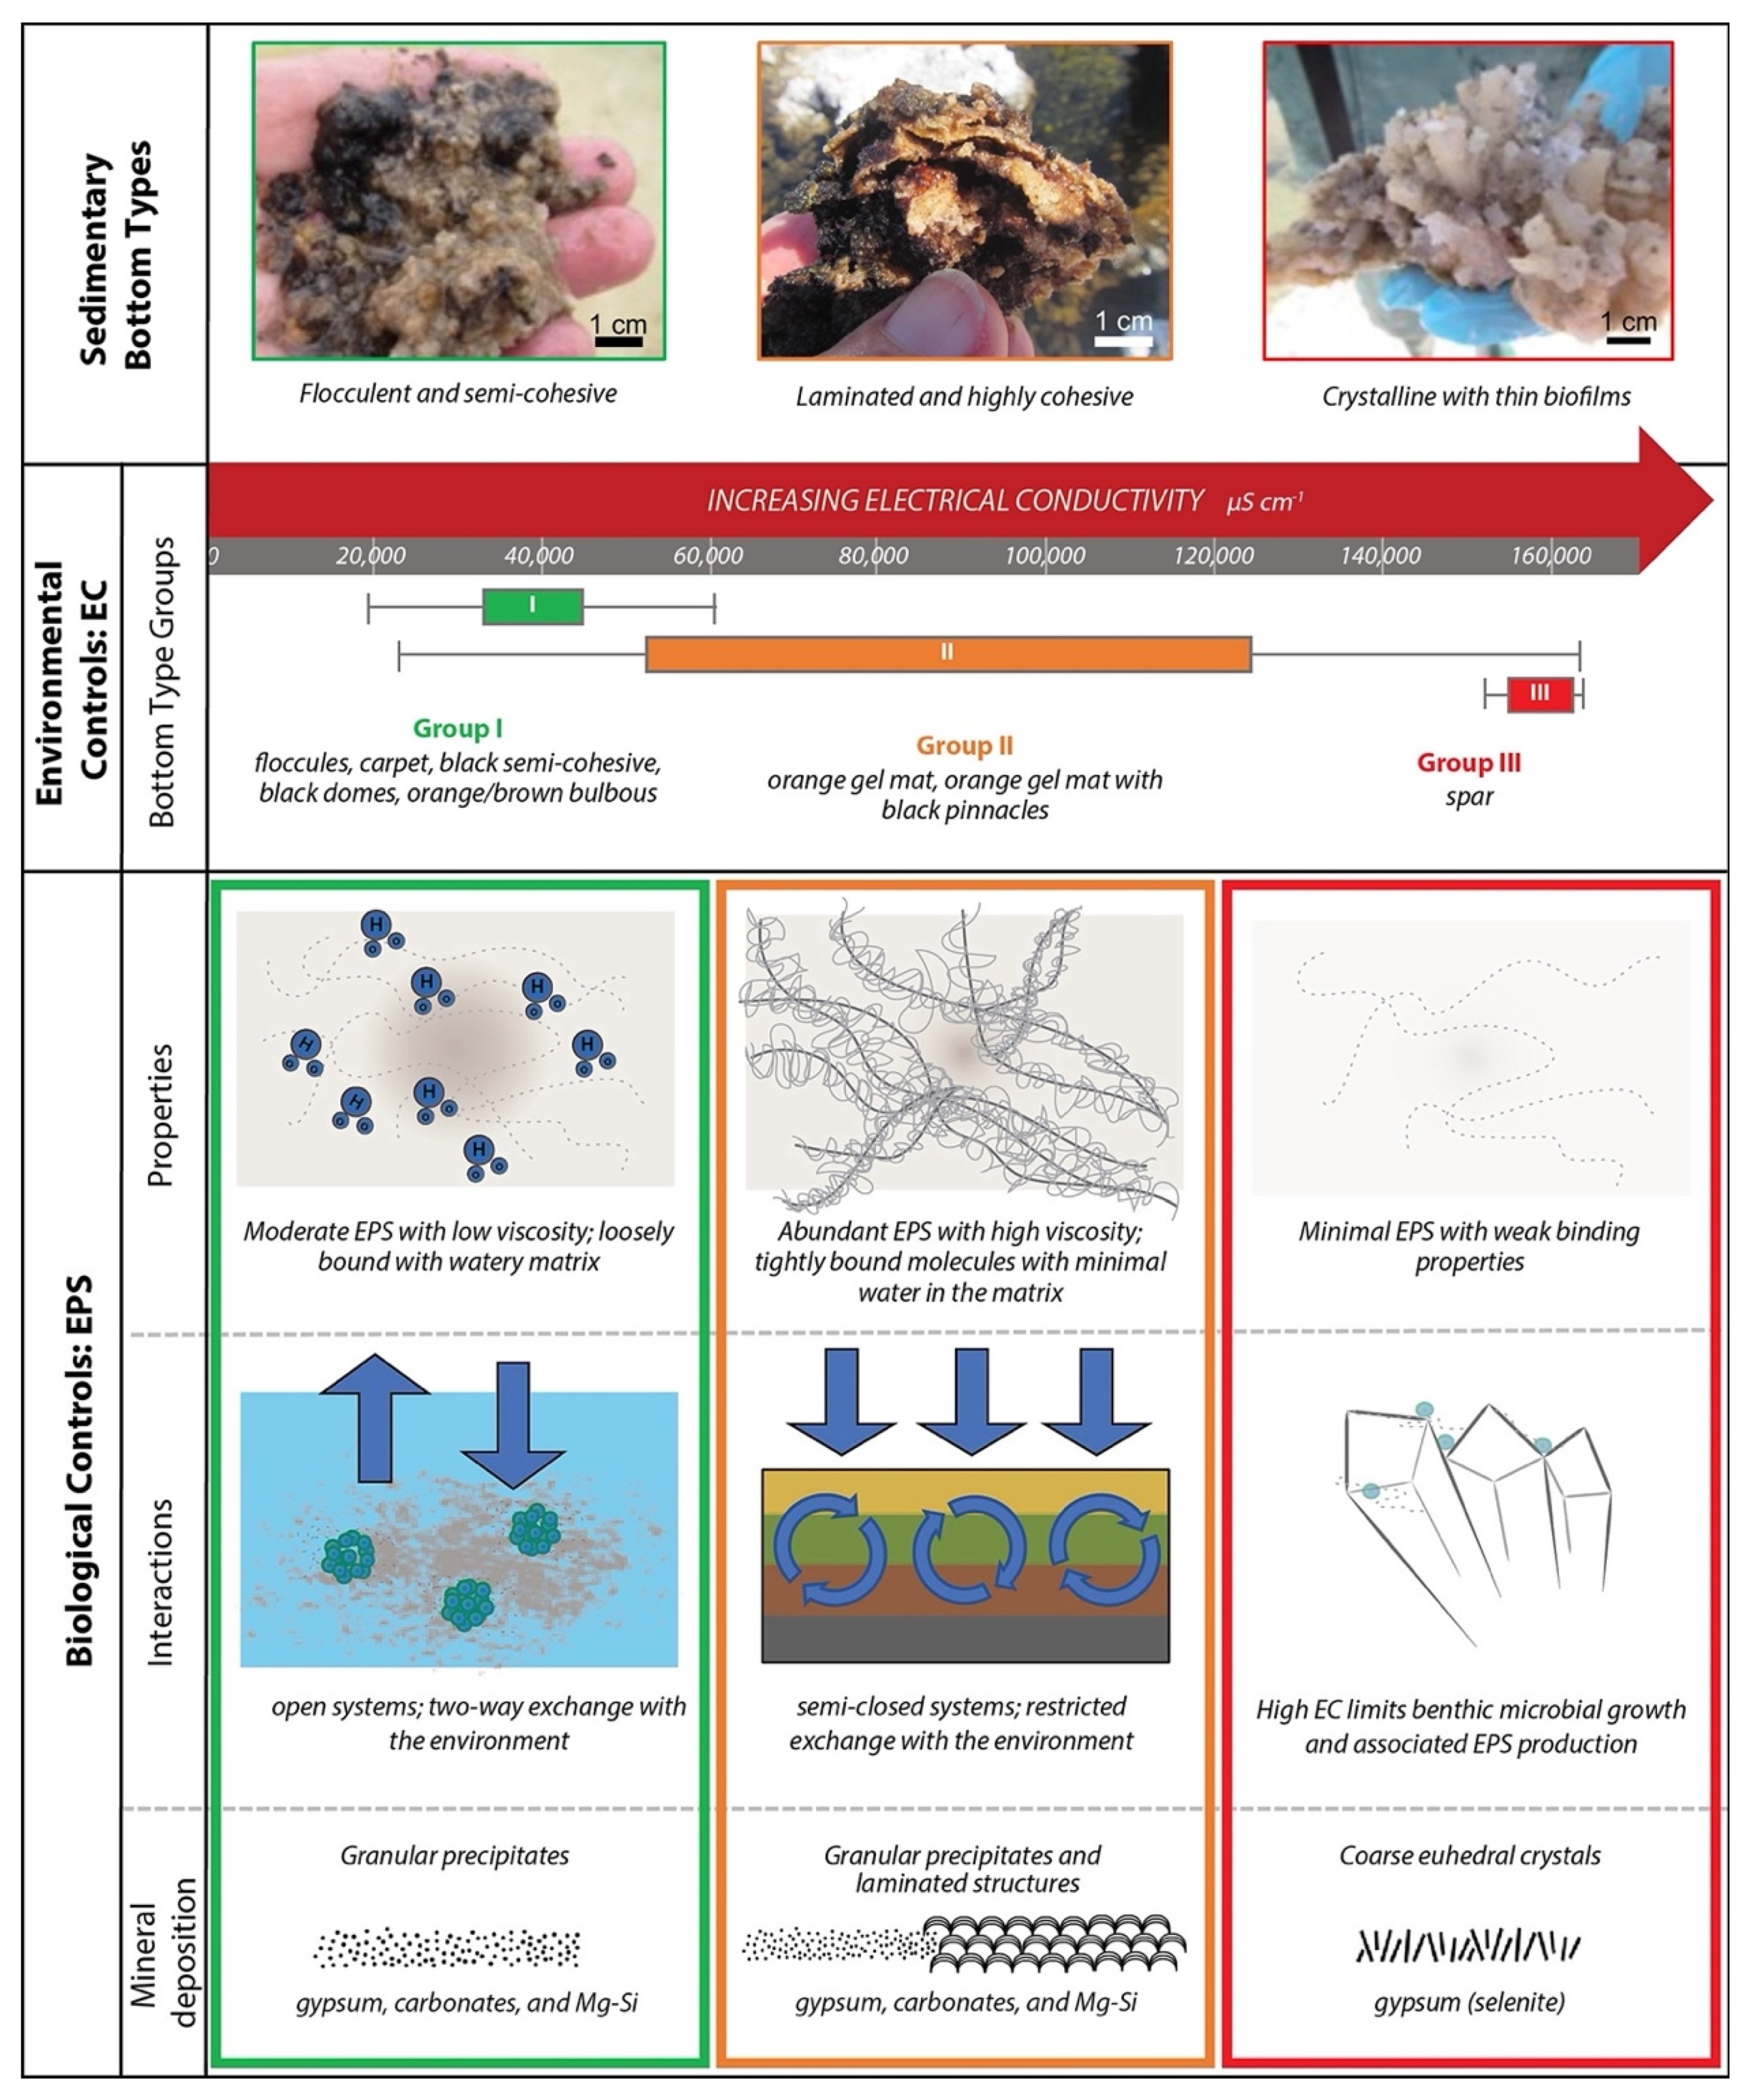
The findings above provide a basis for considering the effects of environmental and biological controls on bottom types. Our results confirm that EC is the first-order control on the variations in sedimentary bottom types, as proposed by [3]. We further propose that the importance of EC as a sedimentological control is linked to the relative amounts and properties of microbially produced EPS. EPS, in turn, determines the consistency of bottom types, exchange of bottom substrate with the overlying water column, and mineral precipitation within the substrate, as summarized in Figure 11 and discussed below.

4.1. Electrical Conductivity

Statistical analyses of data collected from March 2019 show that 70% of the variance between bottom types across the Puquio 1 and Puquio 2 system was accounted for by EC. This finding is consistent with results from a previous study of data collected in November 2017, which identified EC as a major driver of system heterogeneity [3]. EC values correlate to the ability of the water to transmit an electrical current, and previous work has shown that EC is directly related to the concentration of dissolved ions (TDS) in the water after temperature correction [10,11,12]. Other measured environmental parameters evaluated in the present study, which included pH, ORP, DO, depth, and turbidity, had smaller effects on bottom type differentiation, accounting for 4 to 25% of variance (Supplemental Table S2).
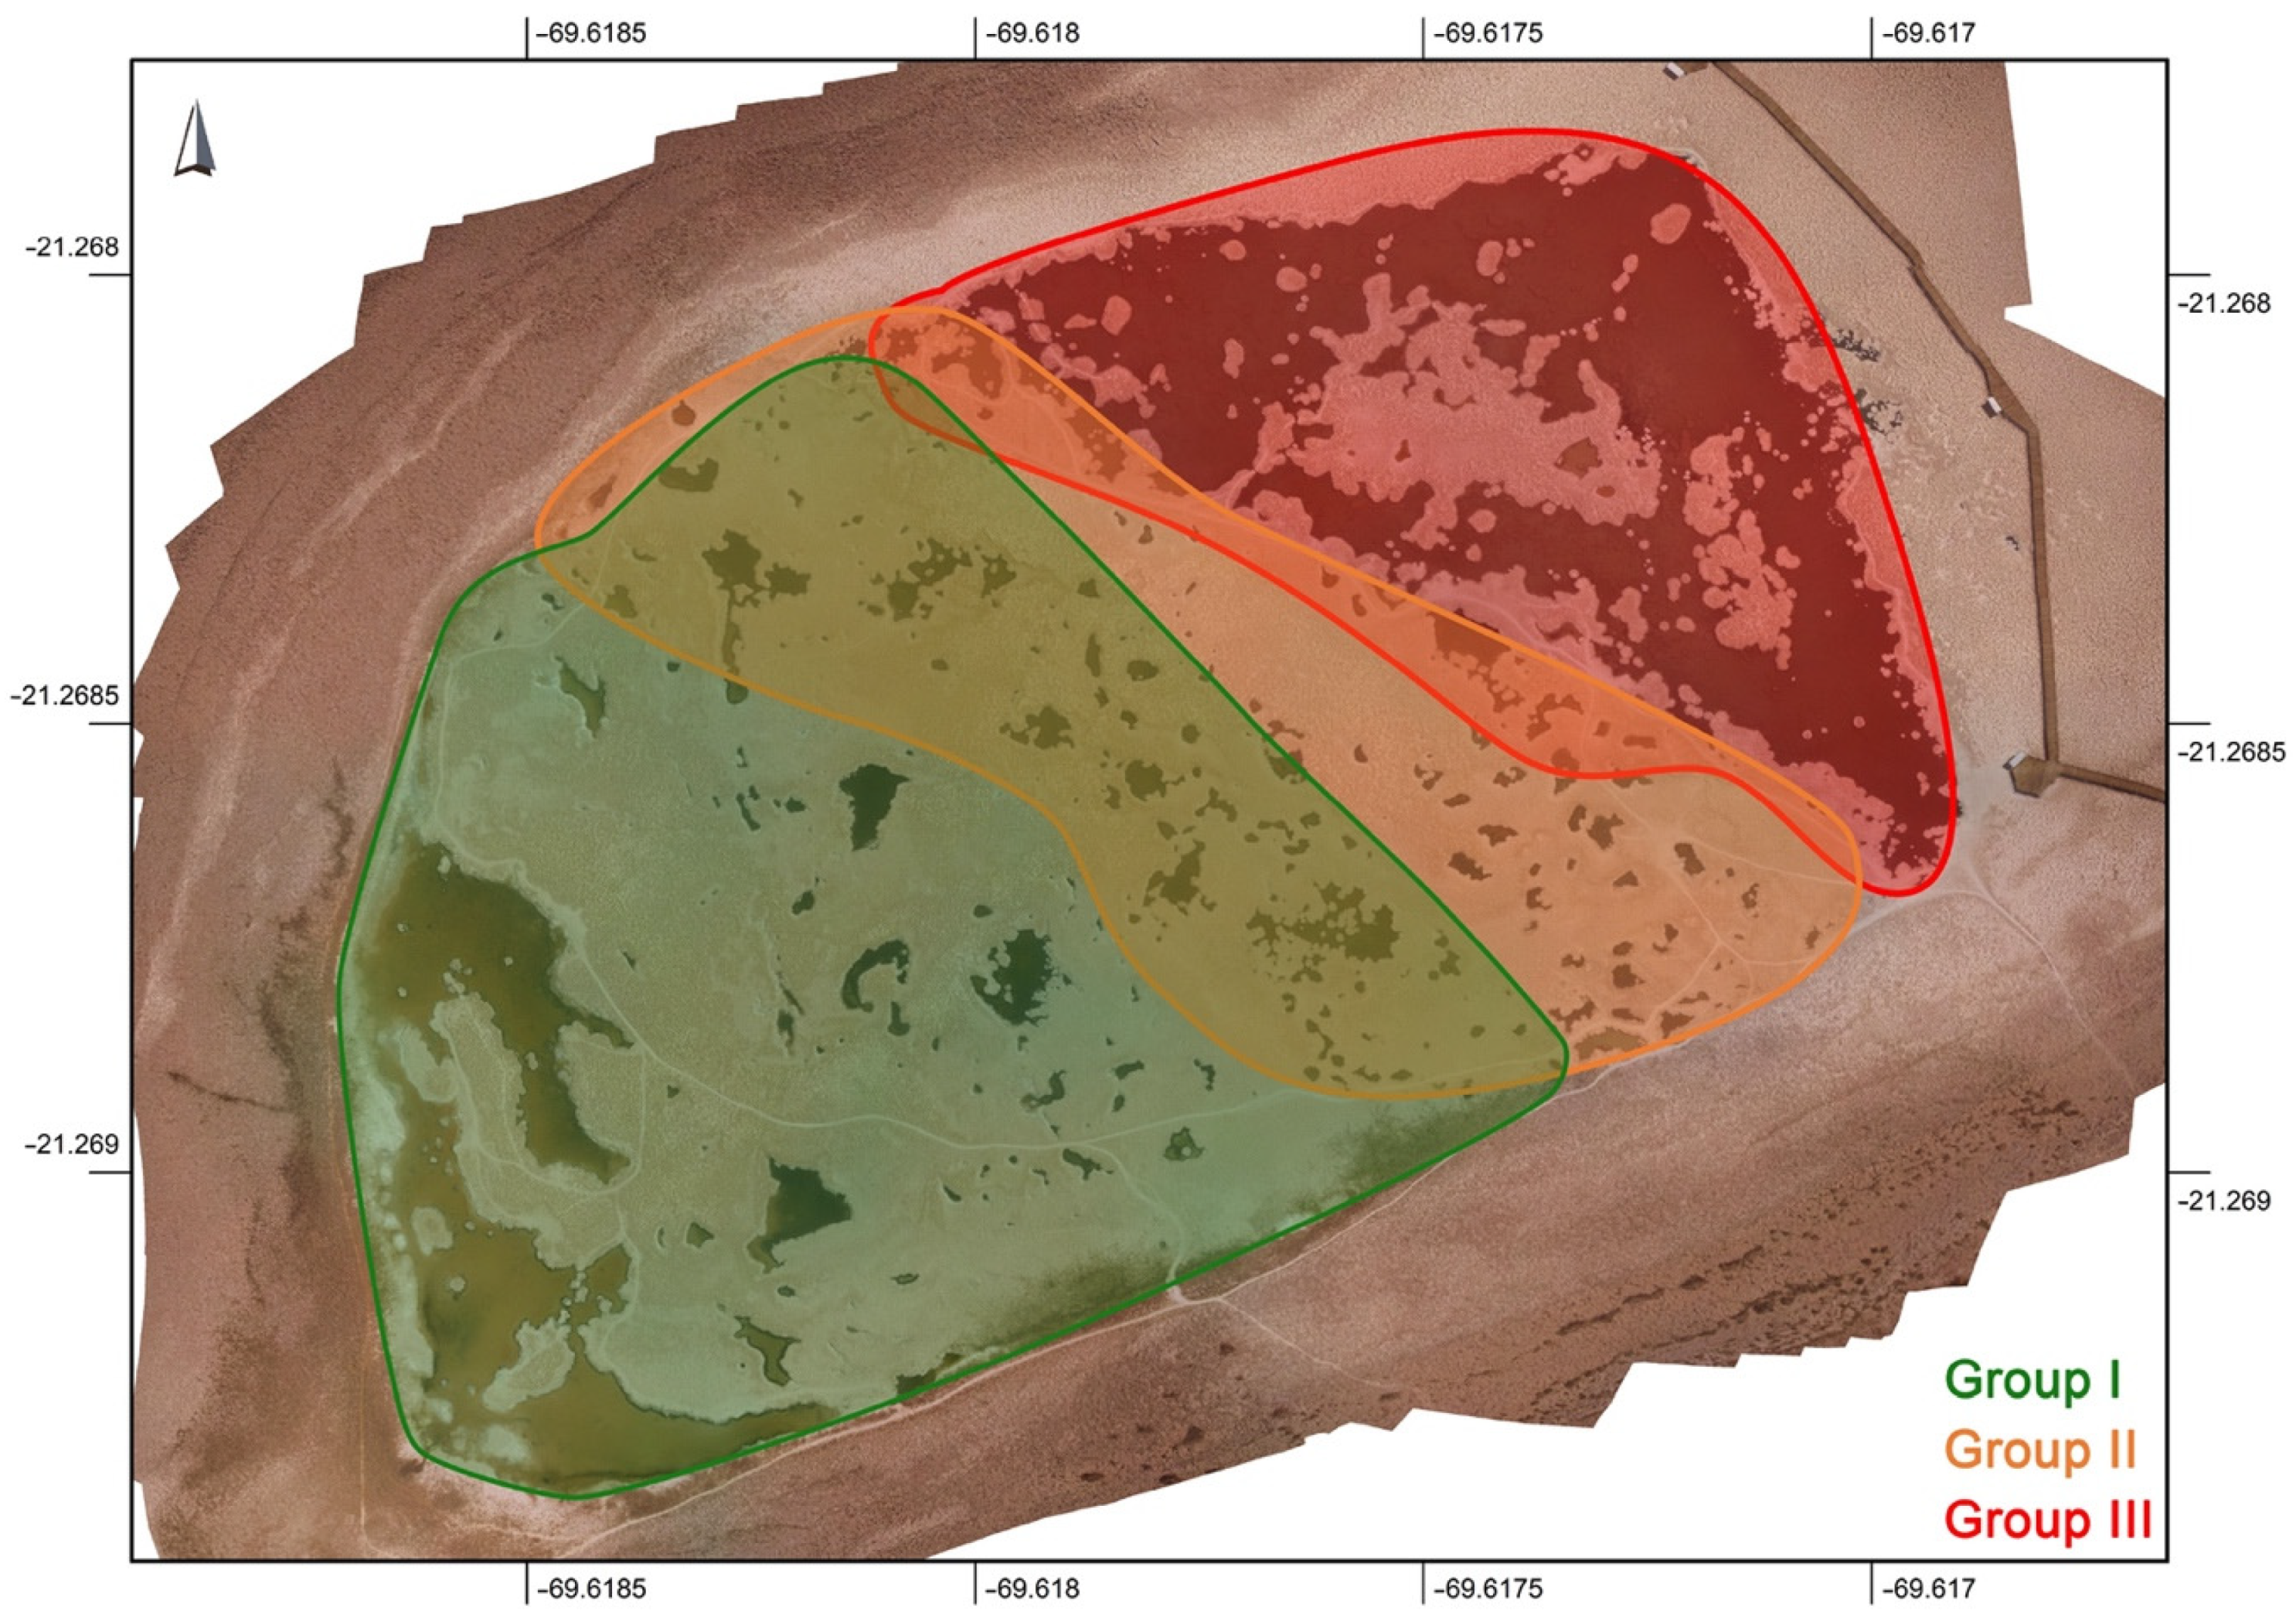
Additional effects of EC are indicated by the grouping of principal bottom types into three homogenous subsets (Table 1) using Tukey HSD post hoc tests. These subsets, or groups, show a SW–NE trend across the Puquios (Figure 8). Group I, which includes carpet, black domes, black semi-cohesive mat, floccules, network on bulbous mat, and orange–brown bulbous mat (Table 2), geographically covers Puquio 1 and the western ponds throughout the Transition Zone, a region with overall lower EC values (means between 38,560.24–55,533.95 µS cm−1) (Figure 9b and Figure 11. Group II, which contains orange gel mat and orange gel mat with black pinnacles geographically occurs as a NW–SE trending band along the eastern margin of the Transition Zone (Figure 8), a region with elevated EC (means between 95,509.60–95,519.38 µS cm−1) (Figure 9b and Figure 11. Group III, containing only the spar bottom, geographically covers Puquio 2, and a narrow band in the Transition Zone adjacent to Puquio 2 (Figure 8), a region with the overall highest measured EC values (mean 156,318.37 µS cm−1) (Figure 9c and Figure 11. Although trends between bottom types and environmental parameters other than EC were observed (Figure 9c–e), distinct homogenous subset groups of bottom types were not defined by these parameters (Supplemental Table S3). As such, EC is responsible for controlling the observed differences in bottom types across the Puquios 1 and 2 system.

4.2. The EPS Story

The three groups classified by EC, as discussed above, are further distinguished by differences in the extent of microbial development and cohesivity. Group I bottom types have abundant microbes and mats that exhibit low cohesivity, Group II bottom types have abundant microbes and mats that exhibit high-cohesivity, and Group III bottom types lack extensive microbial development and have crystalline bottom types (Table 2). These distinct differences in the consistency of bottom types between Groups I, II, and II are a reflection of biologically produced exopolymeric substances (EPS), which change in response to EC, as outlined below.
A key characteristic that allows microbes to thrive in extreme environments is their ability to establish complex biofilms that protect or buffer them from their surroundings [13,14]. Aggregations of organisms, including primary producers, consumers, and decomposers, living within a matrix of EPS are typically a successful mode of life [15]. This success of biofilm communities is in part due to the EPS, a highly adhesive mucilage produced by microorganisms, which provides a physically and chemically resistant biostructure [15,16,17] by controlling fluid, gas and nutrient flow, and buffering salinity [13]. Serving as a permeable to semi-permeable/impermeable diffusion barrier between the microbial communities and their surrounding environments, EPS regulates how the surrounding environment can impact the microbial community. As a result, the presence of EPS is capable of providing a more stable environment and of promoting growth of organisms [13,18,19,20,21]. EPS is the primary emergent property of a biofilm, forms the framework for the architecture of microbial communities, and controls the mechanical stability and cohesivity of microbial mats [15,21,22,23].
Differences in mechanical stability and cohesivity are observed between the three bottom type groups across the EC gradient in the P1/P2 subsystem (Table 2 and Figure 11). When EC values are low and corresponding environmental pressures are less extreme, Group I bottom types are dominant and grazers such as amphipods and gastropods are common. These less-cohesive, more flocculent bottom types are easily dispersed upon disturbance and appear to share some qualities with floating aggregated microbial assemblages, or flocs [24]. Within flocs, molecules of EPS are loosely spaced, resulting in a less cohesive microbial mat that allows for greater exchange with the overlying water column. This exchange supports interactions with the surrounding environment (Figure 11) [24,25]. As such, the cohesivity of Group I bottom types does not limit bidirectional flow of biogeochemical products between the environmental and the biofilm communities, acting as open systems (Figure 11).
When EC values are elevated, Group II bottom types (Table 2, Figure 11) become the dominant bottom type. Group II bottom types are characterized by increasingly cohesive and often well-laminated microbial mats (Figure 4g, Figure 5h and Figure 11. This evolution of microbial mat organization and cohesivity can be attributed to the changing EPS composition as a result of extreme conditions [13]. Experimentally, in higher salinity environments, microbes have been observed to overproduce EPS [26], and EPS has been shown to have a higher viscosity [27]; EPS molecules become more tightly bound together [28], and contain less water within the matrix [29] (Figure 11). Here, the consortia of microorganisms are diverse, with each microbial group characterized by different nutrient and redox state requirements supporting their metabolic processes [30]. Associations of microbial groups with unique metabolic products can generate self-sustaining biogeochemical cycles within microbial consortia, where diffusion-driven exchange of community by products can serve as substrate for another microbial group [31]. Through these associations and biogeochemical cycling and transformation of nutrients and energy sources, effectual interactions within these consortia can support the survival of the community [15,17,32,33,34,35] in resource-limited or extreme environmental conditions [36,37]. As a result of these attributes, Group II bottom types act as semi-closed systems as protection from increasing environmental stressors by restricting exchange with the surrounding environment (Figure 11) [29,38].
When EC values are extremely high, creating increasing environmental pressures, Group III bottom types are dominant (Table 2, Figure 11). In Group III bottom types, well-developed microbial mats are not present, but instead, thin biofilms form on the surface of the spar or as endolithic communities (Figure 11). Here, where EC (interquartile range: 156800–164500 µS cm−1) is too high for optimal microbial growth [39,40], thick microbial mats are absent, and subsequent EPS production is lacking [41], and Group III bottom types are dominant (Figure 11). Thus, while EC may influence the relative amounts and properties of EPS produced by biological communities, EPS determines the consistency of the bottom type and regulates exchange with the surrounding environment and associated mineral precipitation.

4.3. Mineral Formation

Differences between Group I, Group II, and Group III bottom types and the characteristics of their EPS play a role in the type and style of mineral formation throughout the P1/P2 subsystem. These complex microbial assemblages are often sites of robust biogeochemical cycling [42] that regulate mineral precipitation [38,43,44]. Minerals within Group I bottom types (Figure 11) include small, irregularly shaped carbonate grains that are often observed forming in aggregates, Mg–Silicates forming in association with cell sheaths and EPS, and fine-grained, granular gypsum of lenticular and irregular morphologies that have been interpreted to be typical of microbial precipitates [3,45,46,47]. Mineral formation within Group I bottom types occurs within the semi-cohesive mat at the sediment/water interface, where frequent exchange with the overlying water column is hypothesized to occur.
Minerals within Group II bottom types (Figure 11) include fine-grained, granular gypsum exhibiting various irregular habits, and small, irregularly shaped carbonate grains that are often observed forming in aggregates (particularly in association with Mg–Si, cell sheaths and EPS alveolar networks). Mineral laminations were also present, sometimes forming small domal structures (Figure 11). In Group II bottom types, mineral precipitation is located within the microbial mat, where exchange is restricted with the surrounding microenvironment, and the microbes are able to evolve their surrounding microenvironment through EPS production and properties and the community’s biogoechemical cycling. EPS and biological material such as cell sheaths can serve as templates for the generation of irregular mineral forms [48] lithified laminations are often attributed to the breakdown of EPS rich in calcium ions, which can serve as hotspots of mineral nucleation [49,50,51].
In Group III, bottom types were cm scale selenite crystals that lacked organic matrices and had well-developed crystal faces (Figure 11). Endolithic communities were often present; however, they do not appear to contribute to mineral precipitation but simply inhabit the crystal structure, which protects them from extreme environmental conditions [1,52,53]. As a result, the Group III bottom type is driven by physicochemical/largely abiotic processes, similar to what has been observed in other gypsum-saturated systems globally [40,46,47].
Microbially produced EPS is thus identified as key to the differentiation of bottom types in the Puquios, and the EPS properties are largely controlled by EC. These EPS properties determine the consistency of bottom types, the exchange between bottom substrate and the overlying water column, and the mineral precipitation within the substrate.

5. Summary and Conclusions

The Puquios of the Salar de Llamara in Chile represent a highly diverse ecosystem where environmental and biological controls determine sedimentary bottom types across the P1/P2 subsystem. Electrical conductivity drives EPS production, which acts as the first order control on the differentiation of bottom types. The differences in the cohesion of microbial bottom types, the level of exchange with the surrounding environment, and the type and style of mineral precipitation are all functions of EPS (Figure 11). Ponds with low EC have bottom types that are flocculent to semi-cohesive with low-viscosity EPS that allows for high-exchange with the surrounding waters. Minerals precipitating within the bottom types that form in low EC ponds include granular gypsum, carbonate, and Mg–Si minerals. They form in close association with microbes. Ponds with elevated EC have bottom types that are well developed, laminated, and highly cohesive, with high-viscosity EPS that restricts exchange with the surrounding waters. Minerals precipitating within these bottom types are granular to laminated gypsum, carbonate, and Mg–Si in close association with microbes. Ponds with EC above the threshold for thriving benthic microbial communities have bottom types that are sometimes coated in thin biofilms with inadequate EPS accumulations to affect mineral precipitation. Within these bottom types, gypsum (selenite) precipitation occurs on the pond floor, with little or no microbial influence.
In summary, EC drives the microbially produced EPS characteristics, which in turn determine the cohesion of the microbial mat, the level of interaction of the microbial community with the surrounding environment, and the type of mineral precipitation.

Supplementary Materials

The following supporting information can be downloaded at: https://www.mdpi.com/article/10.3390/geosciences12060247/s1, Figure S1: Hanna 9289 Multiparameter Meter resolution and accuracy; Figure S2: Diffraction data of powdered samples from bottom types; Table S1: Summary Table of Hanna parameters by bottom type; Table S2: ANOVA Post Hoc tests; Table S3: Homogenous subsets.

Author Contributions

E.P.S. wrote the main manuscript text. E.P.S., A.M.O., A.T.P. and R.P.R. conducted field work. E.P.S., I.L. and P.F.M. conducted laboratory analysis. E.P.S., A.M.O., I.L., A.W.D., A.M.P., A.T.P., P.F.M. and R.P.R. reviewed and edited the manuscript. All authors have read and agreed to the published version of the manuscript.

Funding

Funding for this study was provided by Sociedad Química y Minera de Chile, S.A. (SQM). SQM was not involved in study design; data collection, analysis, and interpretation; or writing of the paper. SQM S.A. approved submission of this manuscript.

Institutional Review Board Statement

Not applicable.

Informed Consent Statement

Not applicable.

Data Availability Statement

Not applicable.

Acknowledgments

We thank SQM Ltd. and FisioAqua for logistical and field support and T. Gooding and S. Whittaker for technical assistance with sample preparation and SEM analyses. I.L. is grateful for a Smithsonian Institution Edward and Helen Hintz Secretarial Scholarship.

Conflicts of Interest

The authors declare that they have no known competing financial interests or personal relationships that could have appeared to influence the work reported in this paper.

References

  1. Wierzchos, J.; Ascaso, C.; Artieda, O.; Casero, M.C. The Desert Polyextreme Environment and Endolithic Habitats. In Microbial Ecosystems in Central Andes Extreme Environments; Farías, M.E., Ed.; Springer: Cham, Switzerland, 2020; pp. 37–49. [Google Scholar]
  2. Farías, M.E. Microbial Ecosystems in Central Andes Extreme Environments; Farías, M.E., Ed.; Springer: Cham, Switzerland, 2020. [Google Scholar]
  3. Reid, R.P.; Oehlert, A.M.; Suosaari, E.P.; Demergasso, C.; Chong, G.; Escudero, L.V.; Piggot, A.M.; Lascu, I.; Palma, A.T. Electrical Conductivity as a Driver of Biological and Geological Spatial Heterogeneity in the Puquios, Salar de Llamara, Atacama Desert, Chile. Sci. Rep. 2021, 11, 12769. [Google Scholar] [CrossRef]
  4. Otálora, F.; Criado-Reyes, J.; Baselga, M.; Canals, A.; Verdugo-Escamilla, C.; García Ruiz, J.M. Hydrochemical and Mineralogical Evolution through Evaporitic Processes in Salar de Llamara Brines (Atacama, Chile). ACS Earth Space Chem. 2020, 4, 882–896. [Google Scholar] [CrossRef]
  5. Oehlert, A.M.; Suosaari, E.P.; Kong, T.; Piggot, A.M.; Maizel, D.; Lascu, I.; Demergasso, C.; Chong, G.; Reid, R.P. Physical, Chemical, and Microbial Feedbacks Controlling Brine Geochemistry and Lake Morphology in Polyextreme Salar Environments. Sci. Total Environ. 2022, 836, 19. [Google Scholar] [CrossRef] [PubMed]
  6. Eugster, H.P.; Hardie, L.A. Saline Lakes BT—Lakes: Chemistry, Geology, Physics; Lerman, A., Ed.; Springer: New York, NY, USA, 1978; pp. 237–293. ISBN 978-1-4757-1152-3. [Google Scholar]
  7. Eugster, H.P. Geochemistry of Evaporitic Lacustrine Deposits. Annu. Rev. Earth Planet. Sci. 1980, 8, 35–63. [Google Scholar] [CrossRef]
  8. Nye, O.B.; Dean, D.A.; Hinds, R.W. Improved Thin Section Techniques for Fossil and Recent Organisms. J. Paleontol. 1972, 46, 271–275. [Google Scholar]
  9. Hammer, Ø.; Harper, D.A.T.; Ryan, P.D. PAST: Paleontological Statistics Software Package for Education and Data Analysis. Palaeontol. Electron. 2001, 4, 9. [Google Scholar]
  10. Walton, N.R.G. Electrical Conductivity and Total Dissolved Solids—What Is Their Precise Relationship? Desalination 1989, 72, 275–292. [Google Scholar] [CrossRef]
  11. Millero, F.J. The Physical Chemistry of Natural Waters. Pure Appl. Chem. 1985, 57, 1015–1024. [Google Scholar] [CrossRef]
  12. Hayashi, M. Temperature-Electrical Conductivity Relation of Water for Environmental Monitoring and Geophysical Data Inversion. Environ. Monit. Assess. 2004, 96, 119–128. [Google Scholar] [CrossRef]
  13. Blanco, Y.; Rivas, L.A.; González-Toril, E.; Ruiz-Bermejo, M.; Moreno-Paz, M.; Parro, V.; Palacín, A.; Aguilera, Á.; Puente-Sánchez, F. Environmental Parameters, and Not Phylogeny, Determine the Composition of Extracellular Polymeric Substances in Microbial Mats from Extreme Environments. Sci. Total Environ. 2019, 650, 384–393. [Google Scholar] [CrossRef]
  14. Yin, W.; Wang, Y.; Liu, L.; He, J. Biofilms: The Microbial “Protective Clothing” in Extreme Environments. Int. J. Mol. Sci. 2019, 20, 3423. [Google Scholar] [CrossRef] [PubMed] [Green Version]
  15. Stoodley, P.; Sauer, K.; Davies, D.G.; Costerton, J.W. Biofilms as Complex Differentiated Communities. Annu. Rev. Microbiol. 2002, 56, 187–209. [Google Scholar] [CrossRef] [PubMed] [Green Version]
  16. Dupraz, C.; Reid, R.P.; Braissant, O.; Decho, A.W.; Norman, R.S.; Visscher, P.T. Processes of Carbonate Precipitation in Modern Microbial Mats. Earth-Science Rev. 2009, 96, 141–162. [Google Scholar] [CrossRef]
  17. Decho, A.W. Extracellular Polymeric Substances (EPS). In Encyclopedia of Geobiology; Reitner, J., Thiel, V., Eds.; Springer: Berlin/Heidelberg, Germany, 2011; pp. 359–362. [Google Scholar]
  18. De Philippis, R.; Vincenzini, M. Exocellular Polysaccharides from Cyanobacteria and Their Possible Applications. FEMS Microbiol. Rev. 1998, 22, 151–175. [Google Scholar] [CrossRef]
  19. Sutherland, I.W. Biofilm Exopolysaccharides: A Strong and Sticky Framework. Microbiology 2001, 147, 3–9. [Google Scholar] [CrossRef] [Green Version]
  20. Rossi, F.; De Philippis, R. Role of Cyanobacterial Exopolysaccharides in Phototrophic Biofilms and in Complex Microbial Mats. Life 2015, 5, 1218–1238. [Google Scholar] [CrossRef] [Green Version]
  21. Flemming, H.C.; Wingender, J.; Szewzyk, U.; Steinberg, P.; Rice, S.A.; Kjelleberg, S. Biofilms: An Emergent Form of Bacterial Life. Nat. Rev. Microbiol. 2016, 14, 563–575. [Google Scholar] [CrossRef]
  22. Applegate, D.H.; Bryers, J.D. Effects of Carbon and Oxygen Limitations and Calcium Concentrations on Biofilm Removal Processes. Biotechnol. Bioeng. 1991, 37, 17–25. [Google Scholar] [CrossRef]
  23. Flemming, H.C.; Wingender, J. The Biofilm Matrix. Nat. Rev. Microbiol. 2010, 8, 623–633. [Google Scholar] [CrossRef]
  24. Conradi, F.D.; Zhou, R.-Q.; Oeser, S.; Schuergers, N.; Wilde, A.; Mullineaux, C.W. Factors Controlling Floc Formation and Structure in the Cyanobacterium Synechocystis Sp. Strain PCC 6803. J. Bacteriol. 2019, 201, e00344-19. [Google Scholar] [CrossRef] [Green Version]
  25. Wilking, J.N.; Zaburdaev, V.; De Volder, M.; Losick, R.; Brenner, M.P.; Weitz, D.A. Liquid Transport Facilitated by Channels in Bacillus Subtilis Biofilms. Proc. Natl. Acad. Sci. USA 2013, 110, 848–852. [Google Scholar] [CrossRef] [PubMed] [Green Version]
  26. Kim, L.H.; Chong, T.H. Physiological Responses of Salinity-Stressed Vibrio Sp. and the Effect on the Biofilm Formation on a Nanofiltration Membrane. Environ. Sci. Technol. 2017, 51, 1249–1258. [Google Scholar] [CrossRef] [PubMed]
  27. Mayer, C.; Moritz, R.; Kirschner, C.; Borchard, W.; Maibaum, R.; Wingender, J.; Flemming, H.C. The Role of Intermolecular Interactions: Studies on Model Systems for Bacterial Biofilms. Int. J. Biol. Macromol. 1999, 26, 3–16. [Google Scholar] [CrossRef]
  28. Zhao, L.; She, Z.; Jin, C.; Yang, S.; Guo, L.; Zhao, Y.; Gao, M. Characteristics of Extracellular Polymeric Substances from Sludge and Biofilm in a Simultaneous Nitrification and Denitrification System under High Salinity Stress. Bioprocess Biosyst. Eng. 2016, 39, 1375–1389. [Google Scholar] [CrossRef]
  29. Yildiz, F.H.; Schoolnik, G.K. Vibrio Cholerae O1 El Tor: Identification of a Gene Cluster Required for the Rugose Colony Type, Exopolysaccharide Production, Chlorine Resistance, and Biofilm Formation. Proc. Natl. Acad. Sci. USA 1999, 96, 4028–4033. [Google Scholar] [CrossRef] [Green Version]
  30. Paerl, H.W.; Pinckney, J.L. A Mini-Review of Microbial Consortia: Their Roles in Aquatic Production and Biogeochemical Cycling. Microb. Ecol. 1996, 31, 225–247. [Google Scholar] [CrossRef]
  31. Sorokin, D.Y.; Berben, T.; Melton, E.D.; Overmars, L.; Vavourakis, C.D.; Muyzer, G. Microbial Diversity and Biogeochemical Cycling in Soda Lakes. Extremophiles 2014, 18, 791–809. [Google Scholar] [CrossRef] [Green Version]
  32. Paerl, H.W.; Pinckney, J.L.; Steppe, T.F. Cyanobacterial-Bacterial Mat Consortia: Examining the Functional Unit of Microbial Survival and Growth in Extreme Environments. Environ. Microbiol. 2000, 2, 11–26. [Google Scholar] [CrossRef]
  33. Allen, M.A.; Goh, F.; Burns, B.P.; Neilan, B.A. Bacterial, Archaeal and Eukaryotic Diversity of Smooth and Pustular Microbial Mat Communities in the Hypersaline Lagoon of Shark Bay. Geobiology 2009, 7, 82–96. [Google Scholar] [CrossRef]
  34. Spring, S.; Brinkmann, N.; Murrja, M.; Spröer, C.; Reitner, J.; Klenk, H.-P. High Diversity of Culturable Prokaryotes in a Lithifying Hypersaline Microbial Mat. Geomicrobiol. J. 2015, 32, 332–346. [Google Scholar] [CrossRef]
  35. Ruvindy, R.; White, R.A.; Neilan, B.A.; Burns, B.P. Unravelling Core Microbial Metabolisms in the Hypersaline Microbial Mats of Shark Bay Using High-Throughput Metagenomics. ISME J. 2016, 10, 183–196. [Google Scholar] [CrossRef] [PubMed] [Green Version]
  36. Dorador, C.; Molina, V.; Hengst, M.; Eissler, Y.; Cornejo, M.; Fernández, C.; Pérez, V. Microbial Communities Composition, Activity, and Dynamics at Salar de Huasco: A Polyextreme Environment in the Chilean Altiplano BT—Microbial Ecosystems in Central Andes Extreme Environments: Biofilms, Microbial Mats, Microbialites and Endoevaporites; Farías, M.E., Ed.; Springer International Publishing: Cham, Switzerland, 2020; pp. 123–139. ISBN 978-3-030-36192-1. [Google Scholar]
  37. Rasuk, M.C.; Visscher, P.T.; Leiva, M.C.; Farías, M.E. Mats and Microbialites from Laguna La Brava. In Microbial Ecosystems in Central Andes Extreme Environments; Farías, M.E., Ed.; Springer: Cham, Switzerland, 2020; pp. 221–230. [Google Scholar] [CrossRef]
  38. Visscher, P.T.; Stolz, J.F. Microbial Mats as Bioreactors: Populations, Processes, and Products. Palaeogeogr. Palaeoclimatol. Palaeoecol. 2005, 219, 87–100. [Google Scholar] [CrossRef]
  39. Knoll, A.H.; Bauld, J. The Evolution of Ecological Tolerance in Prokaryotes. Earth Environ. Sci. Trans. R. Soc. Edinburgh 1989, 80, 209–223. [Google Scholar] [CrossRef] [PubMed]
  40. Ba̧bel, M. Models for Evaporite, Selenite and Gypsum Microbialite Deposition in Ancient Saline Basins. Acta Geol. Pol. 2004, 54, 219–249. [Google Scholar]
  41. Pflüger, F.; Gresse, P.G. Microbial Sand Chips - A Non-Actualistic Sedimentary Structure. Sediment. Geol. 1996, 102, 263–274. [Google Scholar] [CrossRef]
  42. Franks, J.; Stolz, J.F. Flat Laminated Microbial Mat Communities. Earth-Science Rev. 2009, 96, 163–172. [Google Scholar] [CrossRef]
  43. Wong, H.; Ahmed-Cox, A.; Burns, B. Molecular Ecology of Hypersaline Microbial Mats: Current Insights and New Directions. Microorganisms 2016, 4, 6. [Google Scholar] [CrossRef] [Green Version]
  44. Del Buey, P.; Sanz-Montero, M.E.; Braissant, O.; Cabestrero, Ó.; Visscher, P.T. The Role of Microbial Extracellular Polymeric Substances on Formation of Sulfate Minerals and Fibrous Mg-Clays. Chem. Geol. 2021, 581. [Google Scholar] [CrossRef]
  45. Cody, R.D.; Cody, A.M. Gypsum Nucleation and Crystal Morphology in Analog Saline Terrestrial Environments. J. Sediment. Res. 1988, 58, 247–255. [Google Scholar]
  46. Vogel, M.B.; Des Marais, D.J.; Turk, K.A.; Parenteau, M.N.; Jahnke, L.L.; Kubo, M.D.Y. The Role of Biofilms in the Sedimentology of Actively Forming Gypsum Deposits at Guerrero Negro, Mexico. Astrobiology 2009, 9, 875–893. [Google Scholar] [CrossRef]
  47. Vogel, M.B.; Des Marais, D.J.; Parenteau, M.N.; Jahnke, L.L.; Turk, K.A.; Kubo, M.D.Y. Biological Influences on Modern Sulfates: Textures and Composition of Gypsum Deposits from Guerrero Negro, Baja California Sur, Mexico. Sediment. Geol. 2010, 223, 265–280. [Google Scholar] [CrossRef]
  48. Guerrero, R.; Piqueras, M.; Berlanga, M. Microbial Mats and the Search for Minimal Ecosystems. Int. Microbiol. 2002, 5, 177–188. [Google Scholar] [CrossRef] [PubMed]
  49. Knorre, H.V.; Krumbein, W.E. Bacterial Calcification BT—Microbial Sediments; Riding, R.E., Awramik, S.M., Eds.; Springer: Berlin/Heidelberg, Germany, 2000; pp. 25–31. ISBN 978-3-662-04036-2. [Google Scholar]
  50. Visscher, P.T.; Reid, R.P.; Bebout, B.M. Microscale Observations of Sulfate Reduction: Correlation of Microbial Activity with Lithified Micritic Laminae in Modern Marine Stromatolites. Geology 2000, 28, 919–922. [Google Scholar] [CrossRef]
  51. Pace, A.; Bourillot, R.; Bouton, A.; Vennin, E.; Galaup, S.; Bundeleva, I.; Patrier, P.; Dupraz, C.; Thomazo, C.; Sansjofre, P.; et al. Microbial and Diagenetic Steps Leading to the Mineralisation of Great Salt Lake Microbialites. Sci. Rep. 2016, 6, 31495. [Google Scholar] [CrossRef] [Green Version]
  52. Walker, J.J.; Pace, N.R. Endolithic Microbial Ecosystems. Annu. Rev. Microbiol. 2007, 61, 331–347. [Google Scholar] [CrossRef]
  53. Wierzchos, J.; de los Ríos, A.; Ascaso, C. Microorganisms in Desert Rocks: The Edge of Life on Earth. Int. Microbiol. 2012, 15, 173–183. [Google Scholar] [CrossRef] [Green Version]
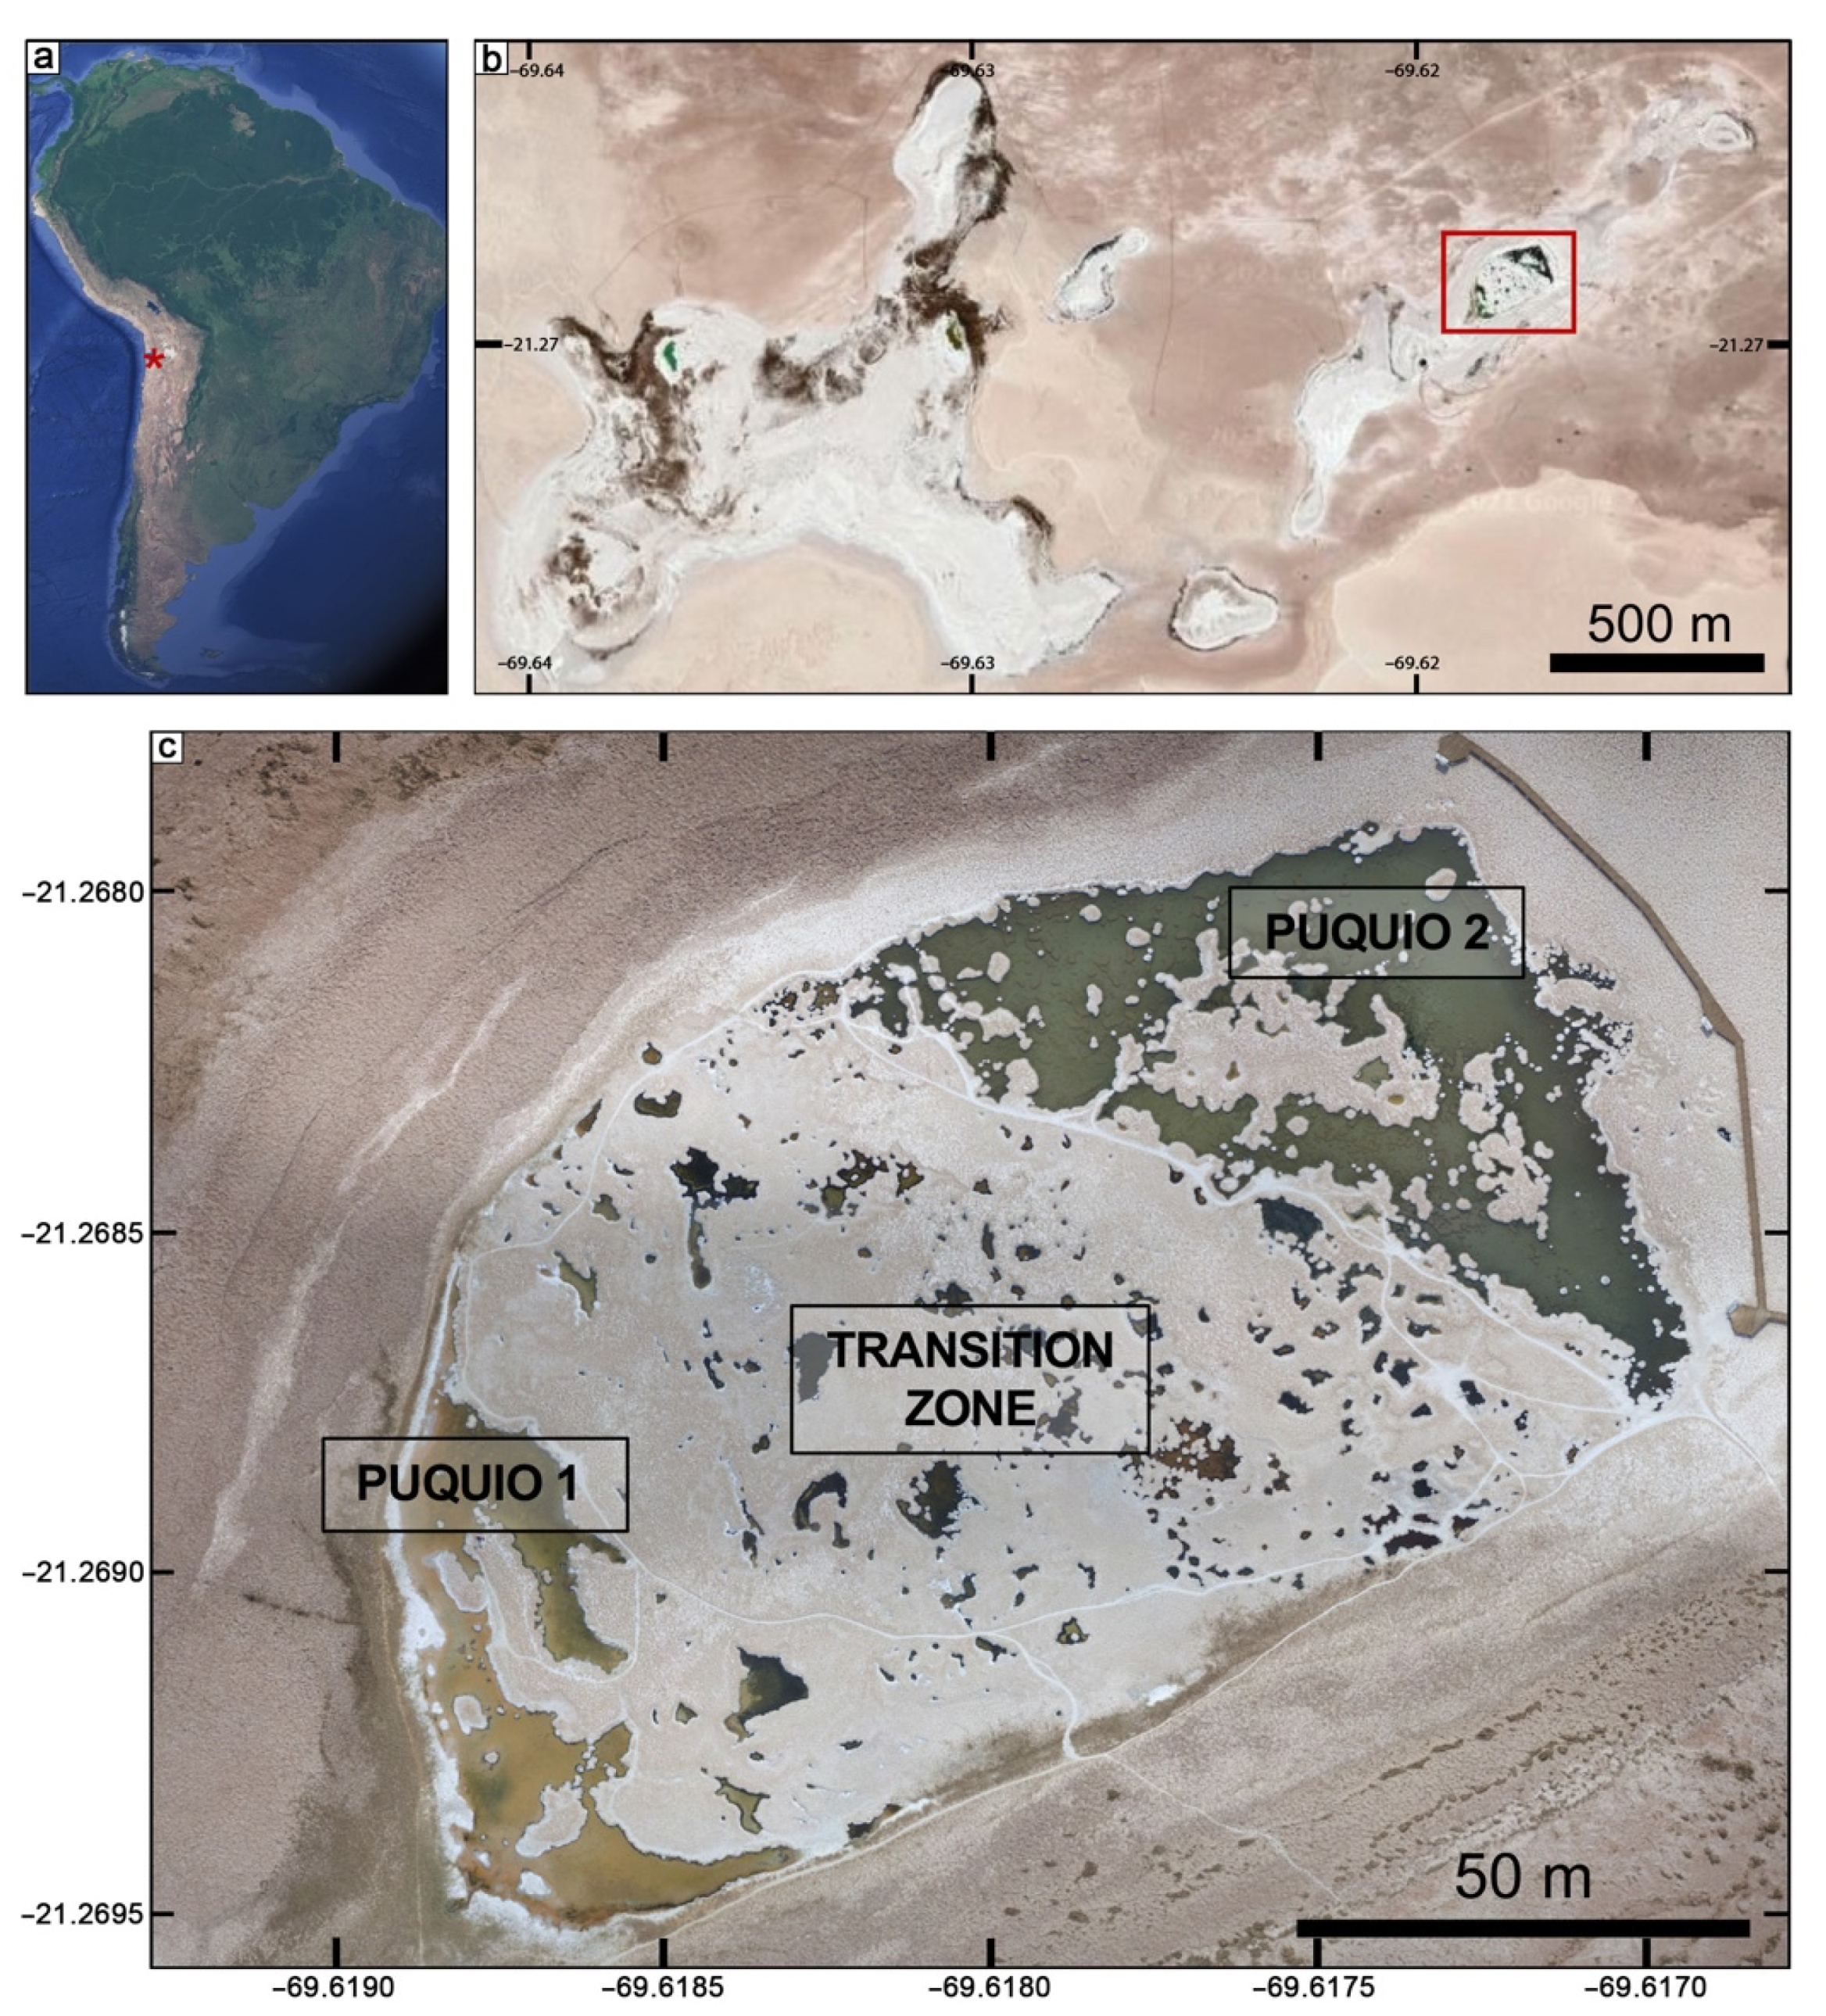
Figure 1. Location map: (a) regional context and location of the Salar de Llamara, northern Chile; (b) Puquios system within the Salar de Llamara with the red box highlighting (c) Puquio 1, Puquio 2, and the Transition Zone.
Geosciences 12 00247 g001
Figure 2. Field photos showing the main bottom types during March 2019 in the Puquio 1 and Puquios 2 system including (a) black domes, (b) black semi-cohesive mat, (c) floccules, (d) network on bulbous mat, (e) carpet (arrow pointing to the carpet bottom type), (f) orange–brown bulbous, (g) orange gel mat, (h) orange gel mat with black pinnacles, and (i) spar.
Geosciences 12 00247 g002
Figure 3. Map of bottom type locations recorded in March 2019 in the Puquio 1 and Puquio 2 system. Each colored dot represents a field observation.
Geosciences 12 00247 g003
Figure 4. Map showing the location of the collected samples, marked as pink circles, and photographs of corresponding hand samples from March 2019 including (a) black domes, (b) black semi-cohesive mat, (c) floccules, (d) network on bulbous mat, (e) carpet, (f) orange–brown bulbous, (g) orange gel mat, (h) orange gel mat with black pinnacles, and (i) spar.
Geosciences 12 00247 g004
Figure 5. SEM images (backscatter mode) of bottom types in the Puquios collected in March 2019. Black domes: (a) cross section of a bacterial cell sheath surrounded by Mg–Si, diatom frustules at various stages of degradation are also present around the cell; (b) diatom frustules within and around the Mg–Si; (c) Mn-rich CaCO3 forming around a grain of gypsum. Black semi-cohesive mat: (d) cross section of a bacterial cell sheath and diatom frustules surrounded in Mg–Si and Mn-oxide; (e) dense EPS network coated in Mg–Si with pore space infilled with Mn-rich CaCO3; (f) anhedral to subhedral gypsum grains surrounded by Mg–Si and Mn-oxide. Floccules: (g) small irregularly shaped grains of CaCO3 (labeled in red and marked with an asterisk), anhedral gypsum grains, and an abundance of diatom frustules in various stages of degradation; (h) small irregularly shaped grains of CaCO3 aggregating into larger irregularly shaped grains, surrounded by anhedral gypsum grains and an abundance of diatom frustules in various stages of degradation; (i) anhedral to subhedral grains of gypsum forming larger aggregate grains with small irregularly shaped grains of CaCO3 (labeled in red and marked with an asterisk). Network on bulbous mat: (j) cross sections of bacterial cell sheaths surrounded by Mg–Si within a larger EPS network; (k) EPS network infilled with Mg–Si; (l) EPS network with clots of Mg–Si throughout, cell sheaths surrounded by Mg–Si, diatom frustules, and an anhedral gypsum grain. Carpet: (mo) Mg–Si forming throughout an EPS network; often with anhedral gypsum grains (o).
Geosciences 12 00247 g005
Figure 6. SEM images (backscatter mode) of dominant principal bottom types in the Puquios collected in March 2019. Orange–brown bulbous mat: (a) EPS alveolar network and clusters of cells surrounded by Mg–Si; (b) Mg–Si forming around a cell sheath, shown in cross section; (c) Mn-rich CaCO3 filling pore spaces throughout Mg–Si. Orange gel mat: (d) Mg–Si encrusting around an EPS alveolar network surrounded by lenticular and anhedral gypsum grains; (e) Mn-rich CaCO3 forming around the periphery and filling pore spaces throughout an Mg–Si network; (f) Mn-rich CaCO3 forming around the edges of dense, botryoidal Mg–Si accumulations. Orange gel mat with black pinnacles: (g) dense botryoidal, layered accumulations of Mg–Si often with small ~20 µm sized Mn-rich CaCO3 precipitates forming in pore spaces; (h) Mn-rich CaCO3 forming around the edges of dense, botryoidal Mg–Si accumulations, and replacing Mg–Si; (i) forming around the edges and filling pore spaces throughout an Mg–Si network, but not within dense Mg–Si. Spar: (jl) anhedral to subhedral gypsum crystals often with sutured mosaic fabrics between crystal margins, often with Mg–Si infilling crevices; cross-sections of striations caused by dissolution were evident along the outer margins of the spar (l).
Geosciences 12 00247 g006
Figure 7. Box and whisker plots showing bottom type with corresponding (a) electrical conductivity (EC, µS cm−1), (b) pH, (c) oxidation reduction potential (ORP, mV), (d) dissolved oxygen (DO, mg L−1), (e) depth (cm), and (f) turbidity (FNU) measurements as recorded in March 2019.
Geosciences 12 00247 g007
Figure 8. Map of the Puquio 1 and Puquio 2 system showing the generalized geographic region of Group I (carpet, black domes, black semi-cohesive mat, floccules, network, and orange–brown bulbous mat), Group II (orange gel mat and orange gel mat with black pinnacles) and Group III (spar).
Geosciences 12 00247 g008
Figure 9. Principal component analysis (PCA) of bottom types using EC, pH, ORP, and DO as variables (a). Homogenous subsets of bottom types separated by EC (Table 1) are circled with 95% concentration ellipses for Group I (carpet, black domes, black semi-cohesive mat, floccules, network, and orange–brown bulbous mat), Group II (orange gel mat and orange gel mat with black pinnacles) and Group III (spar). Box and whisker plots showing (b) electrical conductivity (EC, µS cm−1), (c) pH, (d) oxidation reduction potential (ORP, mV), and (e) dissolved oxygen (DO, mg L−1), for bottom type groupings, as recorded in March 2019.
Geosciences 12 00247 g009
Figure 10. Principal component analysis (PCA) of Group I bottom types (carpet, black domes, black semi-cohesive mat, floccules, network, and orange–brown bulbous mat) using pH, ORP, and DO as variables, showing that the six bottom types in the group are statistically similar.
Geosciences 12 00247 g010
Figure 11. Summary diagram showing the effects of environmental and biological controls on bottom types, dominated by electrical conductivity and EPS in the P1/P2 subsystem of the Puquios. Group I bottom types (carpet, black domes, black semi-cohesive mat, floccules, network on bulbous mat, and orange–brown bulbous mat) are flocculent and semi-cohesive, occur in ponds with relatively low EC values, and have moderate amounts of EPS with low viscosity, which allow the microbial communities to have two-way exchange with the surrounding environment; mineral precipitates are granular and include gypsum, carbonates, and Mg–Si. Group II bottom types (orange gel mat, and orange gel mat with black pinnacles) are laminated and highly cohesive, occur in ponds with elevated EC values, and have abundant EPS with high viscosity, which allow the microbial communities to restrict exchange with the surrounding environment; mineral precipitates are granular to laminated and include gypsum, carbonates, and Mg–Si. Group III bottom types (spar) are crystalline with thin biofilms and occur in ponds with the highest EC values, where benthic microbial growth and associated EPS production are limited; mineral precipitates are coarse, often euhedral crystals of gypsum (selenite).
Geosciences 12 00247 g011
Table 1. Means for groups in homogeneous subsets of bottom types, based on electrical conductivity (EC, µS cm−1).
Electrical Conductivity
Bottom TypesNSubset for Alpha = 0.05
Group IGroup IIGroup III
Carpet4138,560.24
Black domes1239,124.17
Black semi-cohesive mat839,660.00
Floccules4840,704.79
Network on bulbous mat2645,266.54
Orange/brown bulbous mat3855,533.95
Orange gel mat75 95,509.60
Orange gel mat with black pinnacles16 95,519.38
Spar43 156,318.37
Significance 0.4991.0001.000
Table 2. Summary table showing bottom type groups (I, II, III) in relation to the group’s location in the P1/P2 subsystem, including the main bottom types, measured environmental parameters, microbial development, and dominant mineralogy.
Location Bottom Typesmedian in situ environmental measurementsMicrobial developmentMineralogy
EC (µS/cm)pHORPDO (mg/L)Turbidity (FNU)
Puquio 1 floccules, carpet
(low cohesivity)
<40,000>8oxidative~3lowflocculent microbial mats: abundant cells, diatoms, and EPSabundance of irregularly shaped gypsum grains, irregularly shaped CaCO3 grains formed from agglutinated crystals smaller than 10 µmGroup I
Transition ZoneCloser to Puquio 1floccules, carpet, black domes, black semi-cohesive, network on bulbous, orange/brown bulbous mat
(low cohesivity)
~38,000–55,000>8generally oxidative~3–4lowflocculent microbial mats: abundant cells, diatoms, and EPSirregularly and lenticular shaped gypsum grains, Mg-clay, irregularly shaped carbonate precipitates often enriched in Mn; Mn-oxide in black semi-cohesive
Closer to Puquio 2orange gel mat, orange gel mat with black pinnacles
(highly cohesive)
~95,000<8reducing~2–3lowwell-developed, often laminated microbial mats: abundant cells, diatoms, and EPSirregular and lenticular gypsum grains and laminations, Mn-rich calcium-carbonates, and Mg-clay that was observed forming around cells and as dense botryoidal accumulationsGroup II
Narrow band to the SW of Puquio 2spar>155,000<8reducing<2lowthin biofilmslarge gypsum crystals (selenite), often with a sutured mosaic fabric and intracrystalline Mg-clay, or infilling crevicesGroup III
Puquio 2 spar>155,000<8oxidative<2lowthin biofilmslarge gypsum crystals (selenite), often with a sutured mosaic fabric and intracrystalline Mg-clay, or infilling crevices; dissolution observed along margins
Publisher’s Note: MDPI stays neutral with regard to jurisdictional claims in published maps and institutional affiliations.