Abstract
We reconstructed the seismotectonic setting of the area comprising the northeastern Friuli Plain and the Julian pre-Alpine border (NE Italy) by integrating geological and seismological data. The study area represents the junction between the SSE-verging polyphase thrust-front of the south-Alpine Chain and the NW–SE-trending strike-slip faults of the eastern Friuli–western Slovenia domain. Following a multidisciplinary approach, the 3D geometry of the Susans–Tricesimo thrust system was reconstructed through the elaboration of four geological cross sections derived from the interpretation of ENI industrial seismic lines. In a second step, the seismogenic volume of the central-eastern Friuli area was investigated through hypocentral distribution analysis: the seismic events of the latest 50 years (1976–1977 and 1978–2019 time intervals) were plotted on four NE-SW-oriented seriated sections together with the fault plane’s geometry. Through this procedure, we were able to investigate the relationship between the NW-SE-striking high-angle faults, which characterize the northern Julian pre-Alps, and the WSW-verging medium-angle reverse fronts located at the piedmont of the Friuli plain, which experienced NW-SE- to NNW-SSE-oriented compression starting at least from the Pliocene. In detail, we examined the involvement of these structures during the seismic sequences of May and September 1976, in terms of activation and/or interaction. The resulting seismotectonic model highlights the interplay between transpressive/strike-slip and reverse planes. In particular, this study suggests that Predjama and Maniaglia transpressive faults strongly control the stress release and likely played a fundamental role both during the 6 May (Mw 6.5) and 15 September (Mw 6.0) Friuli earthquakes.
1. Introduction
Northeastern Italy is one of the areas of central Mediterranean with a high seismic hazard, and the Friuli region is one of the most seismic areas in Italy: in historical times it was hit by several I0 ≥ 9 earthquakes (1348, 1511, 1873, 1928, 1936) [1]. The last devastating seismic sequence occurred in 1976 (6 May, Mw 6.5 and 15 September, Mw 6.0), causing about 1000 fatalities and the destruction of many towns. In particular, the seismicity of the Friuli region is mostly concentrated along the Carnian and Julian Alpine and pre-Alpine arcuate belt (Figure 1). At present, this area undergoes an NNW-SSE-oriented sigma 1 [2], and the accumulating stress is released through the interaction between the SW-NE- to WNW-ESE-trending compressional fronts of the eastern south-Alpine belt in Friuli [3] and the Dinaric NW-SE strike-slip fault systems of western Slovenia [4,5,6,7].
The study area has been affected by a polyphase tectonic history: the Mesozoic extensional event was initially followed by the Upper Cretaceous—middle Eocene (External Dinaric chain), and then by the Neogene–Quaternary (eastern Southern Alps) compressional events. The derived tectonic structures are characterized by different trends, since they developed during distinct tectonic phases under a differently oriented maximum compressional axis (σ1). Indeed, the present complex structural arrangement of the crust is the result of articulated tectonic evolution, during which the inherited structures were often reactivated by youngest one [8]. At present, Mesozoic, Paleogene and Neogene–Quaternary structural systems are affected by the northwestward propagation of NW-SE-trending dextral strike-slip fault systems of western Slovenia, which have been developing since the Miocene–Pliocene transition [5].
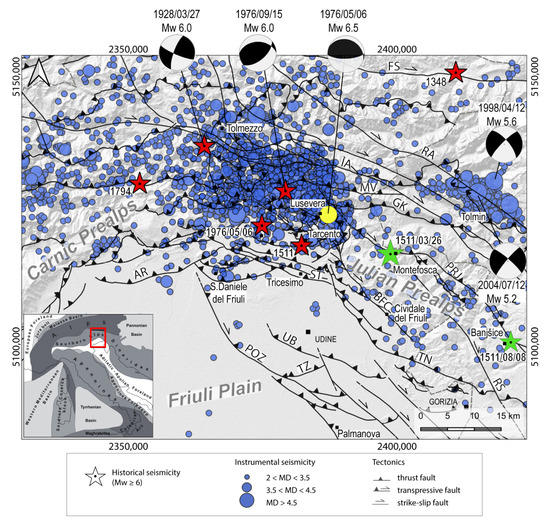
Figure 1.
Seismotectonic map of the Friuli region and western Slovenia. Focal mechanisms from [9]. Historical seismicity from CPTI15 v4.0 [1] (red stars) and from CFTI5 MED [10] (green stars). Instrumental seismicity: 1976/05/06 Mw 6.5 (yellow circle) from [11]; 1976–1977 from [12] and 1978–2019 from [13]. Faults acronyms: AR: Arba–Ragogna Thrust; BFC: Borgo Faris–Cividale Fault; FS: Fella Sava Ft.; GK: Gemona–Kobarid Th.; IA: Idrija–Ampezzo Ft. MV: Musi–Verzegnis Th.; POZ: Pozzuolo Th.; PRJ: Predjama Ft.; RA: Ravne Ft.; RS: Raša Ft.; ST: Susans–Tricesimo Th.; TN: Trnovo Th.; TZ: Terenzano Th.; UB: Udine–Buttrio Th.
This work focuses on the seismotectonic characterization of the active fault systems of the northern Friuli Plain and southern Julian pre-Alps, with the aim of investigating the seismogenic potential of the area and providing a new contribution to seismic hazard assessment. Starting from the interpretation of seismic lines kindly supplied by ENI_SpA (henceforth ENI), the 2D and 3D structural setting of the study area was reconstructed by means of 3D-MOVE Software [by PetEx Ltd., Edinburgh, version 2019.1], while the seismogenic volume was investigated through the analysis of seismicity distribution, freely available on the CRS-OGS Friuli Venezia Giulia Seismometric Network Bulletin [13]. In order to explore the involvement of the Susans–Tricesimo thrust system during the Friuli seismic events, the hypocentral distribution of 1976–1977 was analyzed and compared with the post-1977 time interval seismicity. In this context, particular attention was paid to the interaction between NW-SE-trending high-angle faults of the northern Julian pre-Alps and the WSW-verging medium-angle reverse planes located in the northern Friuli Plain, which experienced a polyphase tectonic evolution. The obtained data allowed us to formulate new hypotheses regarding the present seismotectonic setting and the seismogenesis of the eastern Friuli area.
2. Geological and Seismotectonic Setting
The Cenozoic structural framework of NE Italy is the result of the collision and indentation of the Adria microplate with the southern margin of Europe [14,15]. After the Mesozoic rifting phase, the first compressive event involving the study area was characterized by a NE-SW-oriented maximum stress axis, which caused the upper Cretaceous–middle Eocene southwestward migration of the external Dinaric fold and thrust belt, often through the inversion of the Mesozoic NW-SE-striking normal faults [16]. Starting from the late Oligocene–early Miocene (Chattian–Burdigalian event in [17]) the northern sector of the eastern Southern Alps (ESA) was affected by exhumation [18,19], but only during the middle Miocene, in response to a roughly NNW-SSE- to NW-SE-oriented maximum compressional stress [17,20,21], an S-SE-verging, ENE-WSW fold and thrust belt, coupled with a strongly subsiding, slightly N-tilted foredeep [18,22], developed in the Veneto and Friuli Alps and pre-Alps [23]. In this regard, the authors in [20,21,24,25] highlight the persistence of a NW-SE to NNW-SSE stress regime starting from the Messinian to the Pliocene. In particular, on the basis of detailed analyses of pitted pebbles of the Veneto and Friuli pre-Alpine regions, the authors in [21,25] confirm an NNW-SSE main stress tensor during the early middle Pleistocene. One study [24] proposes an NW-SE stress tensor for the Plio-Quaternary time span. As a consequence of the southward propagation of the south-Alpine fronts, the inherited Paleogene Dinaric structures were folded, reactivated, and/or dismembered [8,16,26,27]. Since Miocene–Pliocene transition, the onset of the counterclockwise rotation of the Adria microplate [28], combined with its northward motion, has resulted in an oblique convergence. As a result of this articulated framework, the structural style gradually changes from west to east: from thrusting in the Venetian Alps and pre-Alps [17], to oblique in the Italian–Slovenian border region [27,29,30,31] and then to strike-slip in western Slovenia [5,6,7,32,33,34].
At present, GPS measurements reveal for the Friuli region 2–3 mm/year of shortening [2,35,36,37], which is absorbed by both NW-SE-trending high-angle strike-slip structures in the easternmost Friuli area and western Slovenia [6,7,38], and by reverse WSW-ENE- to WNW-ESE-striking neo-Alpine frontal ramps in the Veneto and Friuli pre-Alpine area [3].
Concerning the seismicity of NE Italy and its surroundings, the distribution of fault plane solutions (FPSs) of the major earthquakes [9] registered by the OGS seismometric network [39] suggests that the oblique convergence is still active [4,29,30], in good agreement with the stress and strain tensors of the Friuli and western Slovenian area computed through the inversion of focal mechanisms by [40]. Seismicity depicts an arcuate belt coinciding with the Alpine and pre-Alpine border region of Friuli Venezia Giulia and western Slovenia (Figure 1). Particularly, focusing on the historical seismicity (from the Parametric Catalogue of Italian Earthquakes, CPTI15 v4.0) [1], two destructive seismic events (Mw ≥ 6.0) have been documented within the Julian pre-Alpine area since the year 1000: the 1511 and the 1976 earthquakes. Regarding the 1511 event, on 26 March a strong earthquake (Mw 6.3) [1] affected a wide area extending from Friuli to western Slovenia. Based on the updated macroseismic field elaborated by [41], the revised epicenter has been located near Tarcento, where Io 9 MSC was estimated (Figure 1). On the contrary, CFTI5 MED [10] reports two strong events during March and August 1511. The macroseismic epicenter of the first 1511 earthquake (equivalent magnitude Meq 7) is located near Montefosca, in the Natisone valley, while a subsequent event (Meq 6) is documented on 8 August 1511 near Banjšice, in western Slovenia (Figure 1). Concerning the possible source responsible for the 1511 events, it is worth noting that the macroseismic epicenters in both March and August from CFTI5 MED are located on the Predjama strike-slip fault. Based on macroseismic data inversion, one study [42] proposed an earthquake modeling scenario consistent with an Mw 6.9 event which activated the 50 km-long SE portion of the Idrija strike-slip fault. Differently, as already suggested by [43], one study [41] concluded that the 1511 earthquake involved both Alpine and Dinaric structures.
Recent paleoseismological analyses on the NW-SE strike slip fault system of eastern Italy and western Slovenia revealed Holocene surface rupturing referable to the 1511 event across the Colle Villano–Borgo Faris-Cividale fault system [30], across the Idrija [38,44] and Predjama faults [38].
The more recent 1976 Friuli sequences have been accurately reviewed [11] based on a large amount of bibliography. Preceded by an Ml 4.5 foreshock, a destructive earthquake (on 6 May 1976, Ml 6.4) struck central-eastern Friuli, where Imax 9–10 MSC was recorded. After the strong Ml 5.3 aftershock on 9 May 1976, seismic activity slowly decreased until September 1976. Two quakes on 11 September 1976 (Ml 5.1 and 5.6, respectively) and two others on 15 September 1976 (Ml 5.8 and 6.1, respectively) caused further damage. One year later, on 16 September 1977, another seismic event with Ml 5.2 occurred and was followed by an aftershock series which lasted more than one month. The only data interpreted as coseismic deformation [45] come from topographic leveling carried out in 1952 and 1977 [46], and triangulation measurements [47]. Regarding the Mw 6.5 mainshock, the macroseismic epicenter is located between Buia and Gemona del Friuli (Figure 1, [1]), while the instrumental location of the event [11] is placed near Lusevera, about 12 km ENE, in a sector of the Julian pre-Alps where no major settlements are found. Regarding the focal mechanism of the mainshock of May, most of the available interpretations agree with the activation of a reverse N-dipping low-angle plane [9], with only a small oblique component. Differently, concerning the focal mechanism solution of the strongest event of 15 September (Ml 6.1), different interpretations are present in the literature, which mainly propose the activation of a reverse N-dipping plane or of an NNE-dipping reverse-oblique geometry [9].
Regarding the possible source, most of the interpretations agree with the activation of two different structures (see fault traces in Figure 2). One study [48] proposed the activation of the Buja–Tricesimo thrust system for the May event and the involvement of the Periadriatic thrust (or Barcis–Staro Stelo Auct.) during September. One study [49], on the basis of hypocenter relocation, long-period surface-wave inversion, field geology and strong motion modelling, revisited the 1976 Friuli earthquake sequence and proposed that the Friuli earthquake rupture was related to a 19 km fault-related folding evolving from blind faulting beneath the Bernadia and Buia basement-involved structures to semi-blind faulting beneath the Susans structure. On the basis of geological and seismological evidence, others [3,50] have proposed the activation of the Susans–Tricesimo thrust for the May event, and assessed the activation of a deeper blind structure during the event of September. The activation of a single source for the entire sequence, whose surficial expression is compatible with the Buia–Tricesimo thrust, was proposed in [37] based on geodetic data. Conversely, another study [51] attributed most of the events to the Periadriatic overthrust and only two aftershocks of May to the inherited Dinaric structures. Recently, one study [29] confirmed the Susans–Tricesimo thrust as the source of the May event, based on the evidence of Quaternary deformation both on the surface and in seismic ENI profiles, and the possible activation of the Buia thrust was not excluded. Following the 1976–1977 sequence, the instrumental seismicity recorded two other more recent seismic events in 1998 and 2004 (Figure 1). The April 1998 sequence (Bovec earthquake) had an Mw 5.6 [52,53,54], while an Mw 5.2 event was registered in July 2004 (Tolmin earthquake) [55]. Both sequences are associated with the NW-SE dextral strike-slip Ravne fault, which is actively propagating through interactions of individual right-stepping fault segments and breaching of local transtensional step-over zones [33,53].
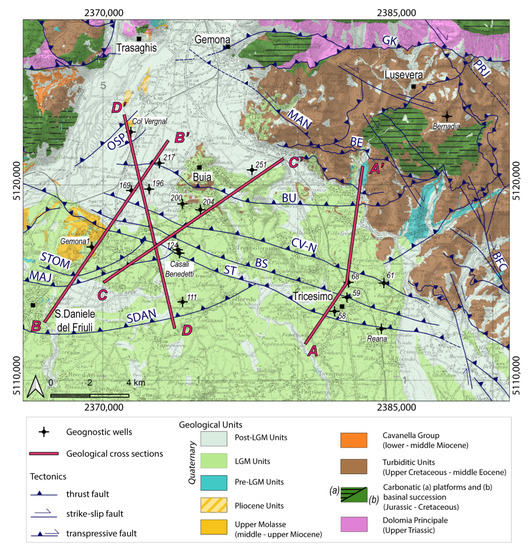
Figure 2.
Geological map of the study area (modified after CARG Geological Sheets 049 Gemona del Friuli [27] and 066 Udine [56]). AA’, BB’, CC’, DD’ traces of the geological cross sections elaborated from the interpretation of ENI seismic lines and geognostic wells. Legend: BE: Bernadia Thrust; BFC: Borgo Faris–Cividale Fault; BS: Borgo Soima Th.; BU: Buia Th.; CV-N: Colle Villano–North Th.; GK: Gemona–Kobarid Th.; MAJ: Majano Th.; MAN: Maniaglia Ft.; OSP: Osoppo Th.; PRJ: Predjama Ft; SDAN: San Daniele Th., ST: Susans–Tricesimo Th., STOM: S.Tomaso Th.
3. Methodology
3.1. Structural Model Reconstruction
The interpretation of a grid of ENI seismic lines of the northern Friuli Plain allowed us to reconstruct the buried structural setting of the study area. Four of the analyzed seismic profiles have been selected for the construction of the bi-dimensional and tri-dimensional model of the area.
Starting from the upper Carnian Travenanzes Formation, the simplified stratigraphic model of Friuli region, functional to the interpretation of seismic lines, is composed of five seismo-stratigraphic units [22,57].
- -
- The Mesozoic platforms succession includes the Dolomia Principale and the Friuli–Dinaric carbonate platform [27], which developed from the late Triassic to middle-late Cretaceous. It is composed of an about 3000 m-thick sequence of platform facies, with locally transgressive and emersion episodes [58,59,60,61,62].
- -
- The Upper Cretaceous–Middle Eocene turbiditic sequence represents the filling of the foredeep of the SW-verging External Dinaric Chain. The complete westward thinning sequence up to 4000 m [18,63] is characterized by siliciclastic turbiditic sequence (Campanian–Maastrichtian flysch), carbonatic megabeds (seismoturbidites [64]) (Grivò Flysch, Thanetian p.p.–Ypresian p.p.) and calciclastic and siliciclastic turbidites in the upper part (Savorgnano Marls and Arenites and Cormons Flysch, lower-middle Eocene) [56,65,66,67].
- -
- The lower-middle Miocene sequence is commonly referred as the “Cavanella Group” and is composed of shallow-water marine sediments [18,23,68,69]. In the context of seismic lines interpretation, the Cavanella Group represents an important regional-scale seismo-stratigraphic group of reflectors, showing an overall tabular geometry and a southwestward thinning with thicknesses spanning from tens to hundreds of meters [22].
- -
- The middle to upper Miocene Molasse sequence represents the foredeep deposition of the southeastward verging and migrating south Alpine chain. In the Piedmont Friuli Plain, at the outer border of the pre-Alpine relieves, the upper portion of the sequence consists of very thick fan delta and alluvial deposits dated back to latest Tortonian–early Messinian (Montello Conglomerate, [56,70]), testifying the transition from terrigenous platform to continental facies [23,27].
- -
- The Plio-Quaternary sequence develops on top of the Messinian unconformity. It is composed of thick conglomeratic channel bodies filling the narrow Messinian canyons since the successive transgression episode [27,71]. The sea ingression extended in the Tagliamento paleovalley area and north up to Osoppo, where coarse-grained Gilbert-type deltaic bodies are preserved; the Osoppo Conglomerate dates back to upper Miocene–Pliocene [72] or to the Zanclean [25,73]. The middle-to-late Pleistocene sequence covering the erosional plain surface includes alluvial and glacial facies [27,56,70,71].
A simplified seismostratigraphic model was elaborated (Table 1) for the 2D time-to-depth conversion by integrating the stratigraphic framework of the study area with the velocity logs of some ENI exploratory wells and velocity values extracted from the bibliography, in analogy with [31].

Table 1.
Velocity model adopted for the 2D depth seismic lines conversion. Velocity values (p-waves) derived from Cargnacco 1, Amanda 1, Gemona1 ENI well-logs and from bibliography [22,27].
Particularly, velocity values of the Jurassic–Cretaceous carbonate platform (late Paleogene–early Eocene turbidites) were derived from the Cargnacco 1 and Amanda 1 wells, the middle–late Miocene Molasse velocity was derived from the Gemona 1 well, and the early–middle Miocene Cavanella Group and Plio-Quaternary succession velocity values were extracted from the bibliography [22,27,56,70].
The elaborated velocity model was uploaded in the 3D Move Software (by PetEx Ltd., Edinburgh, version 2019.1), where the interpretation of seismic lines was made. The detected seismostratigraphic tops (top Cretaceous carbonatic platform, top turbiditic units and top Cavanella Group) and tectonic structures were digitalized on the selected ENI seismic profiles (sections AA’ to DD’, see traces in Figure 2). For mapping the Messinian unconformity, we also consulted the regional database of geognostic wells gently supplied by the Friuli Venezia Giulia Region. The horizon digitalization was calibrated using the point data of pre-Quaternary bedrock depth, extracted from projected geognostic wells.
Once digitalized, each section was converted from time to depth through the Database Method of 2D Conversion tool, which considers the velocity values settled in the stratigraphic model and computes the conversion procedure as the incremental sum of the thicknesses of equal velocity. Starting from the 2D geological sections obtained from the interpretation of seismic lines, the 3D surface of the main tectonic structure was constructed through the interpolation procedure of Create new fault within the Create Surface with Boundaries tool. The Control Points for Kriging option was ticked in order to create a surface from points that are geostatistically valid.
3.2. Instrumental Seismicity Analysis
The seismogenic thickness of the studied area was reconstructed through the hypocentral distribution analysis of instrumental seismicity. Two distinct databases were created, referring to the 1976–1977 and 1978–2019 time intervals. The 1976–77 database includes the complete relocation of the sequence performed by [12] and the latest location of the mainshock epicenter elaborated by [11]. In this context, an update of the North-Eastern Italy Seismic Network catalogue was performed by [74], which revised and corrected magnitude estimation thanks to new linear empirical regressions between Ml and Md for the eastern Southern Alps. Differently, the 1978–2019 seismic database contains the events registered by the CRS–OGS Seismometric Network and freely available on the Friuli Venezia Giulia Seismometric Network Bulletin [13]. Both databases were filtered following three criteria: gap < 180°; vertical and horizontal error < 4 km and Md ≥ 1. In this regard, the error distribution analysis shows that among the collected events, less than 6% of the earthquakes have an error between 3–4 km, and specifically, they include events with magnitude lower than 3.5.
Focusing on the spatial and temporal earthquake distribution analysis, the events of both databases were classified based on depth and magnitude classes, and the 2D depth distribution was analyzed in terms of number of events per depth class. The 1976–77 seismicity was further categorized into three “time classes” (May–August 1976; September–December 1976; January–December 1977) in order to analyze the evolution of the sequences with time.
Regarding the 1978–2019 database, the Md values were first converted in Ml through the [75] relation, and then the corresponding energy value was calculated through the [76] formula, valid for Ml < 4.5 earthquakes. Differently, the [77] relation for strong earthquakes was only used for only Ml 4.9 event. The total released energy per depth class distribution was then analyzed, differentiating by magnitude value. Successively, the epicentral distributions of the earthquakes of both databases were analyzed by plotting the events in map view. In detail, they were categorized in three depth classes (0–7 km; 7–13 km and >13 km). In a third step, the 3D distribution of the earthquakes was analyzed with respect to the reconstructed fault surfaces by plotting seismicity on seriated sections. Particularly, four N 40°-trending sections were elaborated, characterized by a length of 30 km, a spacing of 5 km and a projection distance of the events of 3 km.
The focal mechanisms available from the Catalogue of earthquakes of Southern Alps and surrounding area from 1928 to 2019 [9] were consulted for both databases (1976–1977 and 1978–2019). Following the recent focal mechanisms dataset revision, performed by [9], the Catalogue contains all the available focal mechanisms obtained by different authors, and the preferred solution for each event is suggested by the catalogue’s authors.
4. Results
4.1. Three-Dimensional Reconstruction of the Susans–Tricesimo Thrust System
The subsurface geometry of the Piedmont Friuli Plain was reconstructed through the elaboration of four geological cross sections (AA’, BB’, CC’ and DD’ in Figure 2) obtained by the interpretation of the seismic lines gently supplied by ENI (Figure 3 and Figure 4). The analysis focused on the area between Buia, San Daniele and Tricesimo towns, located into the morainic arc of the Tagliamento river in central Friuli. It is worth noting that the distribution of seismic lines in the study area is not homogeneous (Figure 2), preventing the complete interpretation of the lateral continuity of the tectonic structures.
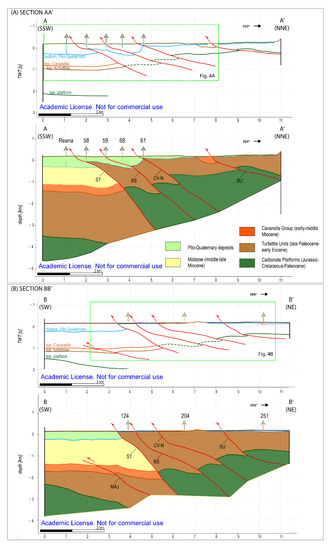
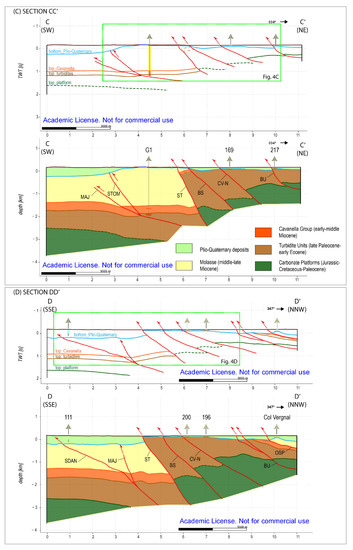
Figure 3.
Seismic interpretation of the main seismo-stratigraphic horizon and related geological cross sections AA’ (A), BB’ (B), CC’ (C) and DD’ (D), representing the buried setting of the Piedmont Friuli Plain. Section traces and acronyms are reported in Figure 2.
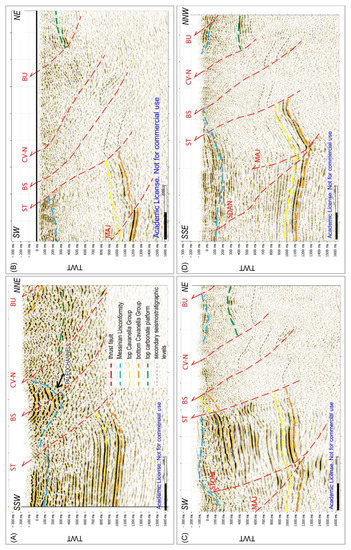
Figure 4.
Interpretation of clippings of seismic lines of sections AA’ (A), BB’ (B), CC’ (C) and DD’ (D) across the Susans–Tricesimo Thrust System, with a 3X vertical exaggeration of the z scale. See location on sections in Figure 3.
Particularly, we detected an S-SW-verging, WNW-ESE-striking thrust-system (the Susans–Tricesimo Thrust System—STTS), composed of a set of reverse faults named Susans–Tricesimo (ST), Borgo Soima (BS) and Colle Villano-North (CV-N), respectively (Figure 2). The major frontal structure (i.e., the masterfault) is the Susans–Tricesimo Thrust, a medium-angle thrust that shows a long polyphase tectonic history. ST gives rise to an about 1.2 s displacement of the top of the carbonatic platform and displaces the Cavanella Group by about 0.8 s (Figure 3A–D), indicating that ST was involved in two deformational events (i.e., the Paleogene Dinaric and the Neogene neo-Alpine tectonic phases, respectively) after the Mesozoic carbonate platform deposition. Moreover, the reduced thickness of the Serravallian–Messinian Molasse at the hanging wall of ST confirms the neo-Alpine activity of the thrust fault, suggesting a syn-depositional growth.
At the hanging wall of ST Thrust, Borgo Soima (BS) and Colle Villano-North (CV-N) thrust-splays slightly displace the top of the carbonatic platform of about 0.25 s (total displacement), and can be traced up to the 0 masl.
Concerning the Quaternary units, the interpretation of seismic lines allowed us to decipher that STTS clearly affects the Plio-Quaternary succession, suggesting recent tectonic activity for the whole thrust system. In particular, in section AA’ (Figure 3A), the projected Reana well reaches the top of Upper Molasse at a depth of 260 masl, covered by a roughly 330 m-thick conglomeratic unit (pre-LGM unit) and a 78 m-thick gravel deposition (LGM unit). Conversely, about 5 km NW, the n. 61 well testifies the presence of a 40 m-thick gravel deposition directly above the turbiditic units (encountered at about 140 masl). In addition, in section AA’ (Figure 3A), BS propagates within a deep Plio-Quaternary paleochannel, probably causing the deformation of the channel itself (Figure 4A).
The most internal structure detected is the Buia thrust (BU), a low-angle thrust fault that only in the first kilometer depth consists of a steeper ramp. BU slightly displaces the top of the carbonatic platform, and in section AA’ (Figure 3A) it is constrained at the surface by the tectonic contact between Cavanella Group and Eocene turbidites cropping out near Tarcento [27,78].
In the most internal portion of section DD’ (Figure 3D), an additional low-angle infra-Molasse reverse structure is present: the SE-verging, WSW-ENE-trending Osoppo thrust (OSP). This area is constrained by the close Col Vergnal relief and by the homonymous geognostic well located about 250 m south. The relief is formed by Pliocene units (Osoppo conglomerates [25,27,72,79]), on top of which the presence of LGM deposits (Spilimbergo Synthem—SPB) is documented. Conversely, the Col Vergnal well stratigraphy is characterized by about 30 m Holocene deposits and 60 m LGM units, which lie on top of the upper Tortonian–lower Messinian sandstone–mudstone member of Montello conglomerate (MON2), at 83 masl [27] (see the Supplementary Material S1 for the chronostratigraphical correlation scheme of the Plio-Quaternary Units of the Tagliamento Basin, modified after [27]).
In the western portion of the investigated area, at the footwall of ST, three minor reverse faults (roughly E-W-striking) were detected: the San Tomaso (STOM), Majano (MAJ) and San Daniele (SDAN) thrusts. Particularly, in section CC’ (Figure 3C), STOM gives rise to a well-developed anticline that involves the south-Alpine Molasse and propagates toward the surface, also affecting the bottom of the Quaternary succession (Figure 4C). STOM, MAJ and SDAN are characterized by a medium-angle ramp geometry (Figure 4C,D), running in flat within the Upper Molasse. Majano, San Tomaso and San Daniele thrusts seem to only slightly affect the Quaternary deposition in this area. Conversely, clear Quaternary activity can be assessed for ST, BS, CV-N and BU thrusts.
Following the elaboration of the geological cross sections, the 2D profiles were interpolated with the aim to reconstruct the 3D geometry of the active Susans–Tricesimo thrust system and Buia Th. in the piedmont Friuli Plain. (Figure 5). It is worth noting that seismic lines allow us to reconstruct the geometry of the tectonic structures only in their shallowest portion, up to 5 km in depth.
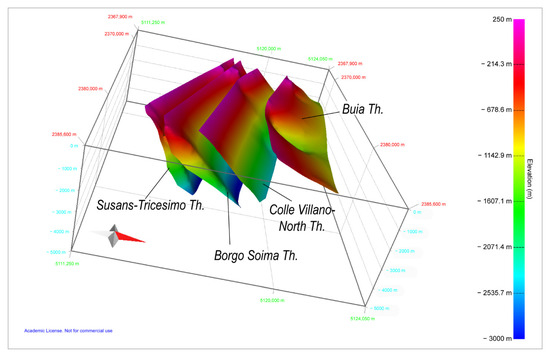
Figure 5.
Three-dimensional structural model of the Susans–Tricesimo thrust system and Buia thrust, obtained through the interpretation of ENI seismic lines in 3D Move in the first five km.
In particular, STTS is made by a set of three sub-parallel 40°−45° NNE-dipping, WNW-ESE-average-striking reverse faults. The faults surfaces are folded according to their polyphase tectonic history. We consider the ST thrust as the masterfault, while Borgo Soima and Colle Villano-North represent two minor splays. Conversely, we consider the Buia thrust as a different structure because it has a different surface strike, and it is characterized by an average low-angle dipping geometry (10–20°) in the first kilometers of depth.
4.2. Analysis of Seismicity Distribution
We analyzed the 1976–2019 collected events in order to investigate the involvement of the tectonic structures during the 1976–1977 earthquakes. Moreover, in order to study the evolution of the seismicity of the Julian Alps and pre-Alps during the last 50 years, seismicity was divided into two different time intervals: 1976–1977 (seismic period) and 1978–2019 (interseismic period). The seismicity distribution was analyzed with respect to the tectonic structures characterizing the study area through the elaboration of four NE-SW-seriated sections (sections 1, 2, 3 and 4 in Figure 6). Moreover, in order to integrate the relationship between the tectonic structures and 1976–1977 seismicity, we realized four additional N-S-oriented sections (Sections S05–S08 in the Supplementary Material S2). The collected events were plotted together with the active faults of the area, partly reconstructed in this study, and partly extracted from the literature [27,31,56,70]. The interpretation of the deep geometry of the tectonic structures followed the detection of planes depicted by seismicity distribution in the different time intervals analyzed. Starting from these planes, we reconstructed the structural model of the investigated crustal volume [80]. In this concern, it is important to note that the identified planes are not always all recognizable in the different time intervals, but only in occurrence of their activation. The strain pattern of the studied fault surfaces was also investigated through the analysis of the available focal mechanisms [9]. Particularly, in order to better define the transpressive, rather than pure dip-slip character of the investigated faults, special attention was dedicated to the events characterized by an oblique component (Reverse-to-Strike-Slip: R-SS; Strike-Slip-to-Reverse: SS-R; Strike-Slip: SS, as in Table 2 and Table 3). The analyzed events of both 1976–1977 and 1978–2019 seismic databases are identified with a progressive number, listed in Table 2 and Table 3, and classified with different colors based on their kinematics.
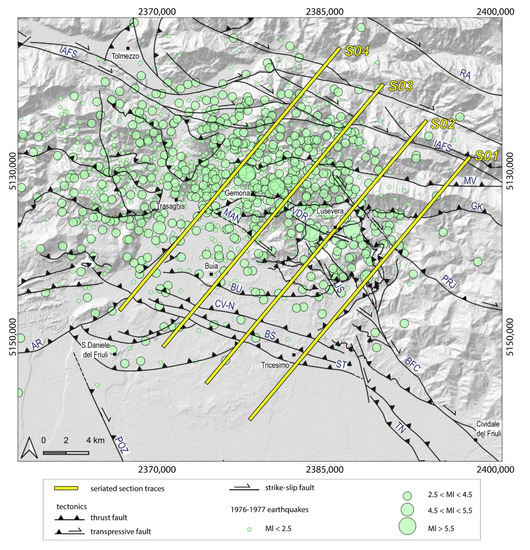
Figure 6.
Earthquake localization from [12] of the 1976–1977 sequences and traces of the seriated sections realized for the 3D distribution analysis of seismicity. Faults acronyms: AR: Arba–Ragogna Thrust, BFC: Borgo Faris–Cividale Fault; BS: Borgo Soima Th.; BU: Buia Th.; CV-N: Colle Villano-North Th.; GK: Gemona–Kobarid Th.; IAFS: Idrija–Ampezzo Ft. System; MAN: Maniaglia Ft.; MV: Musi–Verzegnis Th.; POZ: Pozzuolo Th.; PRJ: Predjama Ft.; RA: Ravne Ft.; ST: Susans–Tricesimo Th.; TN: Trnovo Th.; VDR: Vedronza Ft.; US: Useunt Ft.
4.2.1. 1976–1977 Seismicity Distribution
First, we analyzed the 1976–1977 sequence relocalized by [12]. With the aim to investigate the spatial evolution of the sequence in time, the collected events were classified in three different “time classes”: May-August 1976, September–December 1976 and January-December 1977 (Figure 7). This aspect is also useful for exploring the possibility that the sequences ruptured one single structure or whether many different sources were activated.
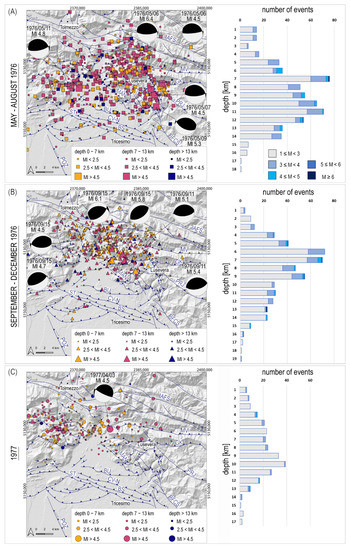
Figure 7.
Map and depth distribution of the 1976–1977 time interval seismicity: (A) May-August 1976; (B) September-December 1976; (C) 1977. The number of the events refers to Table 2 and focal mechanisms from [81]. The frequency histograms are in terms of number of events, differentiated per magnitude classes, per depth classes.

Table 2.
Collection of analyzed focal mechanisms of the strongest events of the 1976–1977 seismicity. FT refers to the fault type classification by [82], as indicated in [9].
Table 2.
Collection of analyzed focal mechanisms of the strongest events of the 1976–1977 seismicity. FT refers to the fault type classification by [82], as indicated in [9].
| Event Parameters [12] | Focal Mechanism [9] | |||||
|---|---|---|---|---|---|---|
| ID | DATE | TIME | DEPTH [km] | Ml | FT | FT-REF |
| 1 | 1976/05/06 | 19:59 | 9.4 | 4.5 | R | [81] |
| 2 | 1976/05/06 | 20:00 | 7 | 6.4 | R | [81] |
| 3 | 1976/05/07 | 00:23 | 8.5 | 4.5 | R | [81] |
| 4 | 1976/05/09 | 00:53 | 11.6 | 5.3 | R | [81] |
| 5 | 1976/05/11 | 22:44 | 12.0 | 4.8 | R | [81] |
| 6 | 1976/05/07 | 11:15 | 11.7 | 3.5 | R-SS | [50] |
| 7 | 1976/05/15 | 16:50 | 10.2 | 3 | SS | [50] |
| 8 | 1976/06/26 | 11:13 | 5.9 | 4.3 | R-SS | [81] |
| 9 | 1976/09/11 | 16:31 | 8.9 | 5.1 | R | [81] |
| 10 | 1976/09/11 | 16:35 | 4.8 | 5.4 | R | [81] |
| 11 | 1976/09/15 | 03:15 | 7 | 5.8 | R | [81] |
| 12 | 1976/09/15 | 04:38 | 14 | 4.7 | R | [81] |
| 13 | 1976/09/15 | 09:21 | 12 | 6.1 | R-SS | [81] |
| 14 | 1976/09/15 | 11:11 | 6.2 | 4.5 | R | [81] |
| 15 | 1976/09/15 | 20:34 | 5.4 | 3.7 | R-SS | [50] |
| 16 | 1976/10/27 | 04:25 | 5.1 | 3.3 | R-SS | [50] |
| 17 | 1976/11/20 | 00:01 | 5.8 | 2.9 | R-SS | [50] |
| 18 | 1976/12/07 | 03:37 | 7.4 | 3.6 | R-SS | [50] |
| 19 | 1977/04/03 | 03:18 | 12.2 | 4.5 | R | [81] |
| 20 | 1977/08/24 | 12:00 | 6.8 | 3.4 | SS-R | [81] |
The maps of Figure 7 highlight the northwestward migration of the sequences, as already remarked by many authors [11,83,84,85,86]. However, it should be noted that already during the first sequence (May–August 1976), most of the seismicity is confined to the NW portion of the study area (Figure 7A).
The depth frequency histogram for each of the three “time classes” shows that most seismicity occurred during the first year. Particularly, the comparison between the two 1976 time classes shows that the mainshock of May-Aug 1976 (Ml 6.4) is located at a 7 km depth, which is one of the most active depth classes together with 11 and 12 km, while during Sept-Dec 1976, the most active thickness lies between 6 and 9 km depth, but the strongest event of September (Ml 6.1) occurred at greater depth (12 km).
Concerning the focal mechanisms of the strongest events, the authors in [81] assessed that the May earthquakes activated a low-to-medium-angle NNE-dipping plane, while the events of September are referable to an E-W-trending gently N-dipping geometry (Figure 7A,B). In this regard, it is worth noting that both studies [87,88] agreed on a different interpretation of the strongest event of 15 September (Ml 6.1), proposing the activation of a roughly NW-SE-oriented medium-angle plane.
In order to make some assessments regarding a possible association earthquake – structure, the distribution of the 1976–1977 sequence was analyzed with respect to the tectonic structures of the area. It must be remarked that we interpret the Colle Villano-North (CV-N) and Borgo Soima (BS) thrusts as secondary splays of the Susans–Tricesimo thrust system (STTS), and we henceforth refer to the whole structure as the Susans–Tricesimo masterfault (ST). The 1976–1977 earthquakes, classified per “time classes”, and plotted on the seriated sections (Figure 8, see traces in Figure 6), reveal a diffuse distribution affecting the entire seismogenic thickness. The abrupt decrease in seismicity, which is interpreted as the bottom of the seismogenic thickness, is located at about a 15 km depth, in good agreement with previous literature [89].
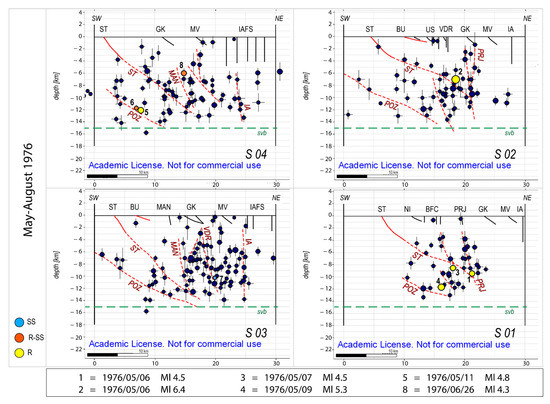
Figure 8.
May–August 1976 Ml ≥ 2.5 seismicity (dark blue circles) plotted on the seriated sections 01, 02, 03, 04 (see traces in Figure 6) together with the active faults’ surfaces reconstructed in this study (red thrusts) and tectonic structures known from the literature (black faults, [27]). The symbols’ size is proportional to the magnitude value (Ml), the number of the events refers to Table 2, and the color refers to the kinematics as shown in the legend. The vertical and horizontal bars for each event represent the vertical (Z) and horizontal (H) error localization, respectively. The red dashed lines refer to the interpretations of the activated structures, recognized on each section. The green dashed line represents the base of the seismogenic volume (svb). Fault acronyms: BFC: Borgo Faris–Cividale Fault System; BU: Buia Thrust; GK: Gemona–Kobarid Th.; IAFS: Idrija–Ampezzo Ft. System; MV: Musi-Verzegnis Th.; PRJ: Predjama Ft.; ST: Susans–Tricesimo Th.; VDR: Vedronza Fault; US: Useunt Ft.
Focusing on the May-Aug 1976 time interval (Figure 8, sections 01–04) we observe that at depth, seismicity is always confined by means of a frontal medium-angle surface, probably referable to the Pozzuolo thrust system (POZ), i.e., the inherited NW-SE-striking, SW-verging frontal thrust of the External Dinarides in Friuli [90], reactivated with an oblique component under the Neolpine maximum stress tensor. In the Piedmont Friuli Plain under Udine locality, POZ shows a transpressional component on the NW-SE-striking plane, and a pure dip-slip movement on the ENE-WSW-striking lateral ramp of Terenzano thrust, deforming the pre-LGM conglomerates (Friuli Supersynthem) and the LGM surface [31,56,91].
Towards the NE, seismicity is confined by means of high-angle structures. Looking at Section 01, located in the south-easternmost edge of the study area, a sub-vertical cluster possibly corresponding at the surface to the Predjama high-angle transpressional fault (PRJ) [7,92,93,94] seems to be linked at depth to ST, forming an SW-verging positive transpressional structure. A similar arrangement is also visible in Section 02, where the Predjama fault and Susans–Tricesimo thrust interact at about a 10 km depth. Note that the strongest event (6 May Ml 6.4) spatially coincides with the ST (earthquake n. 2 in Figure 8, Section 02), while the Ml 4.5 foreshock is located on the Predjama structure (earthquake n. 1 in Figure 8, Section 01). Therefore, the activation of the Predjama high-angle fault during the earliest 1976 sequence can be hypothesized (see also S2—Figure S3 of Supplementary Material S2), and the possibility that its activation could have triggered the ST source, responsible of the mainshock of May 1976, could be taken into account. We rule out the activation of the Buia source (as proposed by [37]) because BU is characterized by a low-angle dipping geometry (about 20°) in the first kilometers of depth (Figure 5 and Figure 8 Section 02). Nevertheless, the results of the inversion of the geodetic data suggest that the observed coseismic deformation could be reproduced even with seismogenic sources located further south that the Buia thrust (see Figure 6A of [37]), in agreement with the hypothesis of activation of the ST source during the 1976–1977 seismic sequence.

Table 3.
Collection of analyzed focal mechanisms of the 1978–2019 time interval seismicity. FT refers to the fault type classification by [82], as indicated in [9].
Table 3.
Collection of analyzed focal mechanisms of the 1978–2019 time interval seismicity. FT refers to the fault type classification by [82], as indicated in [9].
| Event Parameters [13] | Preferred Focal Mechanism [9] | |||||
|---|---|---|---|---|---|---|
| ID | DATE | TIME | DEPTH [km] | MD | FT | FT-REF |
| 21 | 1978/04/02 | 18:23 | 7.3 | 2.4 | SS-R | [81] |
| 22 | 1978/04/03 | 14:34 | 7 | 3.1 | R | [81] |
| 23 | 1978/12/02 | 04:05 | 0.6 | 3.5 | R-SS | [81] |
| 24 | 1981/08/30 | 23:30 | 9.7 | 3.9 | R-SS | [4] |
| 25 | 1983/02/10 | 22:30 | 15.1 | 4.2 | R | [40] |
| 26 | 1983/12/20 | 08:26 | 4.6 | 3.4 | R-SS | [40] |
| 27 | 1991/10/05 | 05:14 | 19.5 | 3.8 | R | [40] |
| 28 | 1991/10/05 | 14:56 | 10.9 | 3.1 | R-SS | [4] |
| 29 | 1995/07/25 | 11:53 | 8.1 | 3 | R | [40] |
| 30 | 1996/12/22 | 03:49 | 8.1 | 3.2 | R-SS | [40] |
| 31 | 1997/12/09 | 01:36 | 8.3 | 3.1 | R | [40] |
| 32 | 2002/07/06 | 08:30 | 11.4 | 3.5 | R-SS | [40] |
| 33 | 2006/08/11 | 01:35 | 11.6 | 3.1 | R | [40] |
| 34 | 2017/03/23 | 13:11 | 12.9 | 3.1 | SS-R | [40] |
| 35 | 2018/05/09 | 21:48 | 7.3 | 3.7 | R | [95] |
| 36 | 2018/11/10 | 07:59 | 10.5 | 3 | R | [95] |
Moving towards the NW (Figure 8, sections 03 and 04), the basal seismic level still corresponds to the POZ at about 14–15 km depth (which represents the base of the seismogenic thickness), while in the northeastern inner sector seismicity is confined by the Idrija–Ampezzo Fault System (IAFS). Differently from the southeastern area (sections 01 and 02), on sections 03 and 04, ST gives rise to a steeper ramp (about 40–45° dip) and extends up to 12 km depth. Moreover, in sections 03 and 04, seismicity mainly concentrates on high-angle structures depicted by means of a clear high-angle alignment of earthquakes. In particular, a well-developed structure, probably corresponding at the surface to the high-angle transpressional Maniaglia fault (MAN) (“Gemona del Friuli geological Sheet”, [27]) interacts with the ST steep ramp at about a 12 km depth.
On the basis of the field data, we rule out the possibility that these high-angle structures could represent Gemona–Kobarid (GK) and Musi–Verzegnis (MV) thrusts, since they both are characterized at the surface by a middle dipping angle (about 45° dip) (Gemona del Friuli Geological Sheet and out of text Figure 1, [27]). If considering the orientation of the seriated sections with respect to the thrusts’ geometry, GK and MV would appear with an even lower dip angle, much different from the roughly 70°-dipping plane observed on the seriated sections (see also S2—Figure S3 of Supplementary Material S2).
Focusing on the September–December 1976 sequence, we observe that most of seismicity develops in the northwestern sector of the study area (see also Figure 7B) and is preferably located on a set of high-angle (60–80°-dipping) structures (Figure 9, sections 03 and 04), often characterized by oblique focal mechanisms (events n. 15, 16, 18 in Table 2 and Figure 9, Section 04), thus revealing their transpressive kinematics. In particular, sections 03 and 04 (Figure 9) show a roughly 70° NE-dipping alignment, probably representing the deep expression of the high-angle Maniaglia fault (MAN). The location of the mainshock of September (Ml 6.1, event n. 13 in Table 2) suggests the activation of the NE deep portion of ST, which here extends up to 12 km-deep and likely interacts at depth with the Maniaglia fault. The remarkable seismic activity at the interaction depth between ST and MAN is already evident from the May–August 1976 earthquakes’ distribution (Figure 8, Section 04). In this sector, the Idrija–Ampezzo Fault System (IAFS) also seems to be involved, acting as the northern backstop of seismicity.
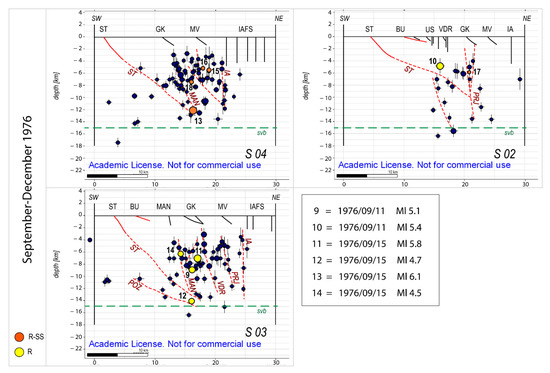
Figure 9.
September–December 1976 Ml ≥ 2.5 seismicity (dark blue circles) plotted on the seriated sections 01–04 (see traces in Figure 6) together with the active faults’ surfaces reconstructed in this study (red thrusts) and tectonic structures known from the literature (black faults, [27]). The symbol’s size is proportional to the magnitude value (Ml), the number of the events refers to Table 2, while the color refers to the kinematics as shown in the legend. The vertical and horizontal bars for each event represent the vertical (Z) and horizontal (H) error localization, respectively. The red dashed lines refer to the interpretations of the activated structures, recognized on each section. The green dashed line represents the base of the seismogenic volume (svb). Fault acronyms: BFC: Borgo Faris–Cividale Fault System; BU: Buia Thrust; GK: Gemona–Kobarid Th.; IAFS: Idrija–Ampezzo Ft. System; MV: Musi-Verzegnis Th.; PRJ: Predjama Ft.; ST: Susans–Tricesimo Th.; VDR: Vedronza Fault; US: Useunt Ft.
Concerning the southeastern sector (Figure 9, Section 02), seismicity is very scarce; in analogy with the May-August distribution, we suppose that the earthquakes are bordered towards the NE by the high-angle Predjama fault (PRJ). The reactivation of ST can be assessed from event n. 10 (Table 2).
During January–December 1977, seismicity decreased considerably, and the strongest event (n. 19 in Table 2) is located at the similar depth to the mainshock of 15 September. However, the scarcity of recorded earthquakes prevents any attribution to possible tectonic features.
Based on these results, it is worth remarking that a complex geometry characterizes the ST structure spanning from the SE to the NW. Particularly, in sections 01 and 02 (Figure 8 and Figure 9), the ST reaches about 10 km in depth, by means of roughly 30–35°-dipping ramp. However, in sections 03 and 04 it shows a steeper ramp (about 40–45° dipping) and reaches increasingly higher depths (up to 12 km) (Figure 8), suggesting that the ST surface is deformed rather than planar.
4.2.2. The 1978–2019 Seismicity
The collected and filtered 1978–2019 time interval seismicity of the study area (blue rectangle in Figure 10) contains 2726 earthquakes with Md values spanning from 1 to 4.9. The frequency–depth graph (Figure 10), in terms of number of events per 1 km depth class, shows that 90% of earthquakes are located in the first 15 km of depth. Moreover, an abrupt increase in seismicity is evident at a 7 km depth. If considering the magnitude Md of the events, the total released energy per depth class graph shows that most of the energy is released between 9 and 12 km depth since only a few Md > 3.5 are registered in the first 5 km.
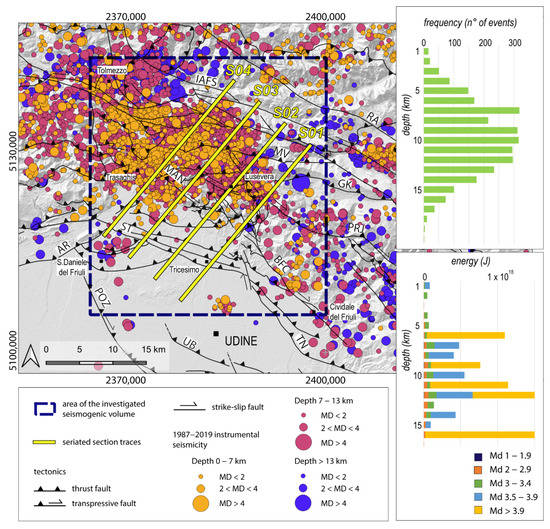
Figure 10.
Map and depth of 1978–2019 seismicity distribution of eastern Friuli–western Slovenia from [13]. The events are classified per depth and magnitude classes. Hypocentral frequency histograms of 1978–2019 seismicity are in terms of number of events per depth class and in terms of cumulated energy, differentiated per magnitude values, per depth classes.
In order to investigate the geometry of the seismogenic thickness, the collected events were classified in three macro-depth classes (0–7 km; 7–13 km and depth > 13 km) and the map distribution of the earthquakes was analyzed by plotting the three macro-depth classes as stacked layers, from the deepest to the shallowest (Figure 11).
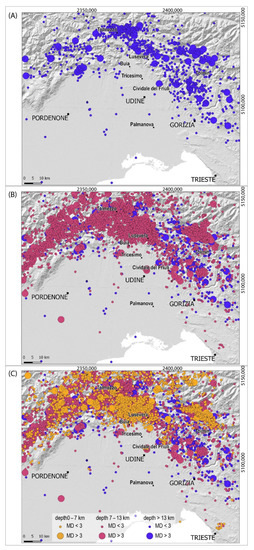
Figure 11.
Map distribution of the 1978–2019 events at different depths. (A) Earthquakes with depth > 13 km; (B) earthquakes with depth > 7 km; (C) earthquakes with depth > 0 km.
The maps of different hypocentral depths (Figure 11) show the arcuate distribution of events and highlight the main structural elements, testifying that this area represents the junction zone between the western NE-SW-trending front in the western Carnic pre-Alps and the NW-SE-trending eastern front for the Julian pre-Alps and central Friuli area. Particularly, focusing on the study area, the events located at depth greater than 13 km (Figure 11A) depict a clear NW-SE alignment, from Tolmezzo to Gorizia. Moving up at shallower depths (Figure 11B), the earthquakes between 7 and 13 km-deep affect a wider area, expanding south of the Tolmezzo–Gorizia alignment. The southern border of the 7–13 km seismicity is characterized by a WNW-ESE orientation in the central portion of the study area, while SE of Tricesimo, seismicity is distributed along a NW-SE alignment matching the deeper (>13 km) seismicity distribution. Any major details can be added from the shallowest seismicity distribution analysis (0–7 km, Figure 11C), which is widely distributed. Regarding surficial seismicity, it is worth remembering that only 17% of earthquakes are located in the first 6 km depth, with one event exceeding Md > 3.5. Anyhow, the three maps of Figure 11 nicely highlight two active regions: the arcuate, mostly compressive pre-Alpine and Alpine portion of the south-Alpine chain, and the strike-slip domain of western Slovenia, related by a transpressional sector.
In good agreement with the 1976–1977 sequence previously analyzed, the 1978–2019 time interval earthquake distribution highlights the same seismogenic volume activated during the seismic 76–77 period. In detail, the seriated sections (Figure 12) show that spanning from SE to NW, seismicity affects the entire seismogenic thickness, which extends to depth up to 15 km, progressively involving a wider crustal volume. In this context, it is worth remarking that the post-1977 seismicity refers to an interseismic period, therefore the earthquake distribution nicely highlights the active seismogenic crustal volume as a whole, but the individual structures inside of it are not clearly recognizable.
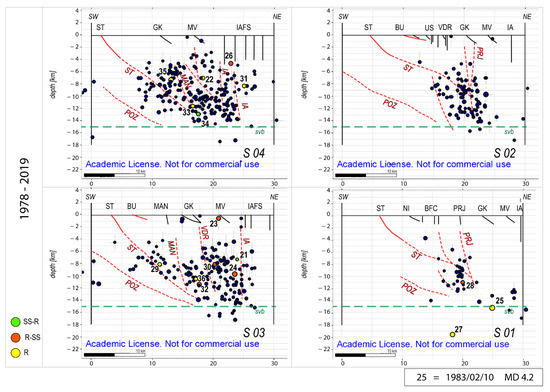
Figure 12.
Seriated sections 01–04 (see Figure 6 for section traces). The filtered 1978–2019 Md ≥ 2 seismicity (dark blue circles) was plotted together with the active faults’ surfaces reconstructed in this study (red thrusts) and tectonic structures known from the literature (black faults, [27]). The symbol’s size is proportional to the magnitude value (Md), the number of the events refers to Table 3, while the color refers to the kinematics as shown in the legend. The vertical and horizontal bars for each event represent the vertical (Z) and horizontal (H) error localization, respectively. The red dashed lines refer to the interpretations of the activated structures, recognized on each section. The green dashed line represents the base of the seismogenic volume (svb). Fault acronyms: BFC: Borgo Faris–Cividale Fault System; BU: Buia Thrust; GK: Gemona–Kobarid Th.; IAFS: Idrija–Ampezzo Ft. System; MV: Musi–Verzegnis Th.; PRJ: Predjama Ft.; ST: Susans–Tricesimo Th.; VDR: Vedronza Fault; US: Useunt Ft.
The southeastern portion of the study area is characterized by a tighter seismogenic volume: in sections 01 and 02 (Figure 12), the earthquake distribution is limited towards the NE by the high-angle Predjama fault and by a frontal medium–high-angle plane towards the SW. The latter correlates with the deep steep ramp which develops at the footwall of ST, as already identified from the 1976–1977 sequence distribution (Figure 8 and Figure 9, sections 01 and 02).
In the northwestern portion of the study area, sections 03 and 04 (Figure 12) show that seismicity abruptly decreases towards the NE in correspondence to the Idrija–Ampezzo strike-slip Fault System (IAFS). Regarding the first 20 km length of the sections, the plotted earthquakes are limited at depth by means of a roughly 40° NE-dipping plane, probably correlating to the ST. Contrary to the 1976 seismic sequence, only scarce seismic activity can be related to POZ (Figure 12).
5. Discussion
The seismicity of the central-eastern Friuli region was investigated through hypocentral distribution analysis of the earthquakes registered in the last 50 years, starting from the two seismic sequences that occurred in May and September 1976. The earthquakes’ distribution analysis was also compared with both the deep geometry of the tectonic structures obtained from the interpretation of ENI industrial seismic lines in 3D Move (STTS in this paper and POZ in [31]) and with the surface geological data available from the literature [27,56,70]. Both subsurface and surficial data highlight significant structural complexities derived from the polyphase deformational evolution which affected the study area. The results obtained in this work allowed us to better characterize the seismotectonic model of the central-eastern Friuli region, and also to formulate new hypotheses regarding the seismogenic sources of the strongest recent earthquakes.
The eastern south-Alpine area reveals an articulated geological evolution, within which the inherited tectonic structures have always played a fundamental role, strongly conditioning the geometry and the kinematics of the structural elements activated during the successive deformative stages. At present, the seismotectonic framework of the study area is characterized by different deformational domains: towards the east, in western Slovenia, stress is accommodated through pure strike-slip kinematics by NW-SE (Dinaric trending) fault systems [7], while the Venetian and Carnic pre-Alpine regions are characterized by a dominantly dip-slip motion accommodated by the ENE-WSW-striking eastern south-Alpine fronts [96]. At the transition between the two structural domains, the Alpine and pre-Alpine Julian regions define a compressional domain with a strong oblique component [5,30].
Focusing on the earthquakes, the seismicity of the eastern domain is mainly referable to the dextral strike-slip fault systems, as testified by the most recent events of Bovec (1998, Mw 5.6) and Tolmin (2004, Mw 5.2) associated with the Ravne strike-slip fault [33]. Differently, the genesis of the destructive historical earthquake of 26 March 1511 is more debated, but many authors refer it to the strike-slip fault systems of western Slovenia. The CFTMed05 Catalogue [10] suggests the Predjama fault as a seismogenic source, the authors in [38,42] indicate the Idrija fault, while those in [30] propose the activation of the Borgo Faris–Cividale fault. Moving to the western domain, in central Friuli, the widespread presence of many high-angle to subvertical fault segments, often connected by structural bend and step-over zones [27,92], testifies the active northwestward propagation of the dextral strike-slip fault systems. In this sector, slip is accommodated through the partitioning between strike-slip fault segments and the inherited reverse planes from the Paleogene Dinaric orogeny, which were affected by deformation during the neo-Alpine polyphase tectonics (Pliocene–Quaternary phase in [24]; Messinian–Pliocene phase in [17,20,21,25]). At the surface, the presence of dome and basin [97] structures is documented all over the central Friuli region and is related to the superimposition of the neo-Alpine (σ1 = NW-SE to NNW-SSE) tectonics over the Dinaric (σ1 = NE-SW) compression. In the central Friuli area, polydeformed structures have already been documented and mapped by [98], who assigned a tectonic origin to the so-called Arzino, Bernadia (Figure 2) and Natisone “Ellipsoid” located in the Carnian and Julian pre-Alps. The authors in [27,99,100] described the SE-verging macrofold of Covria Mt. on the right bank of the Tagliamento river (Figure 2). The authors in [101,102] analyzed the polyphase structural framework of the Bernadia Mts., and those in [103], through a detailed structural analysis of the area located south of the Gemona–Kobarid thrust, confirmed the relationship between Dinaric and neo-Alpine tectonics, as already suggested by [88].
Moreover, the geological field data presented by [27,56] testify that in the northern portion of the Friuli Plain, the sub-surfacing pre-Quaternary succession is characterized by dome and basin structuring, and is generally tilted towards the north. Particularly, while in the whole eastern sector and Buia area the pre-Quaternary terms consist of Eocene turbiditic units affected by ENE-WSW-trending folding, in the northwestern portion, among the Susans Hill, Osoppo and Trasaghis relieves border, a reduced succession of south-Alpine Molasse outcrops [27].
The hypocentral distribution analysis of the 1976 seismic sequences conducted in this study allowed for the 3D reconstruction of the seismogenic volume of the central Friuli region, which corresponds to the first 15 km depth, in good agreement with [89]. In detail, starting from the 2D geometry of Susans–Tricesimo thrust, reconstructed from the interpretation of seismicity distribution on the four seriated sections at the different time intervals (red dashed lines in Figure 8, Figure 9 and Figure 12), the 3D surface was elaborated through interpolation procedures in 3D Move (Spline Curve Method of the Create Surface from Lines Tool). In this context, it is worth highlighting that the 3D surface of the first 5 km depth, reconstructed by integrating geological surface data and interpreted industrial seismic lines (Figure 5), shows the same features of the deep 3D surface reconstructed from the interpretation of the hypocentral distribution (Figure 13). Indeed, the elaborated model highlights the folded geometry of the Susans–Tricesimo thrust system with an about 20–30° N-dipping fold axis (Figure 13), likely representing the result of the superimposition of the Pliocene tectonic evolution over the Dinaric compressional phase. The reconstructed deformed surface defines two distinct planes which are probably subjected to different shortening rates: the southeastern surface, characterized by a mean dipping geometry N33°/30°, is connected at about a 10 km depth with the Predjama high-angle transpressional fault. Differently, the northwestern segment plane shows a mean N30°/40° dipping geometry and reaches higher depths, interacting at about 12 km with the Maniaglia fault. On the first surface (ST-SE) lies the mainshock of May 1976 (Ml 6.4) (Figure 8, sections 01 and 02 and Figure 13), while the strongest event of September 1976 (Ml 6.1) is located on the deepest portion of ST-NW segment, right at the interaction depth with the Maniaglia fault (Figure 9 sections 03 and 04 and Figure 13).
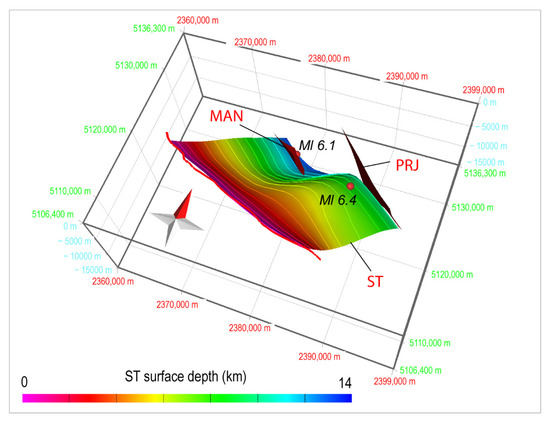
Figure 13.
Three-dimensional deep surface of Susans–Tricesimo Thrust (ST), Maniaglia Fault (MAN) and Predjama Fault (PRJ), reconstructed through the hypocentral distribution analysis. The red circles represent the hypocenters of the strongest events of May (Ml 6.4) and September (Ml 6.1), respectively.
On the basis of these statements, important implications in terms of seismogenesis arise: as a consequence of the structural complexities characterizing the deep geometry of the Susans–Tricesimo Thrust, combined with the articulated strain regime of the area, it is likely that the southeastern and northwestern portions of ST define two distinct seismogenic segments. Particularly, the depicted seismotectonic framework suggests that the Ml 6.4 mainshock of May 1976 ruptured the solely southeastern portion (ST-SE) and was likely triggered by the Predjama fault, which was responsible for the Ml 4.5 foreshock. This hypothesis was further investigated by computing the static Coulomb stress change [104,105,106,107] (see Supplementary Material S3). The modelling showed that the foreshock event on the Predjama fault plane induces and increase in Coulomb stress on the ST-SE plane where the Ml 6.4 mainshock of 6 May nucleated. This event caused an increase in Coulomb stress in the area of higher structural complexity affected by the September sequence, as demonstrated by [108]. In particular, the proposed structural model showed that the Ml 6.1 mainshock of 15 September ruptured the deepest portion of the ST-NW seismogenic segment, at the depth of interaction with the Maniaglia fault, which was also activated during the second part of the sequence (Figure 14).
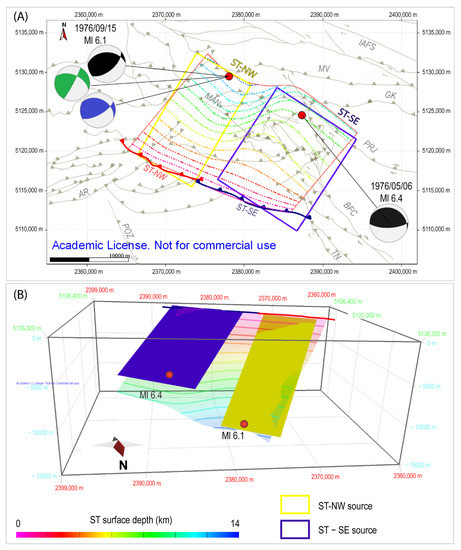
Figure 14.
Schematic representation of the seismotectonic model elaborated for the study area. (A) Map view where the colored isolines refer to the ST surface reconstructed from the seismicity distribution analysis; the yellow and blue box represent the seismogenic sources associated with the ST-NW and ST-SE segments. Red circles represent the strongest earthquakes of May (Ml 6.4) and September (Ml 6.1). (B) Three-dimensional view of the seismotectonic model. Black focal mechanisms from [81], blue from [87] and green from [88].
If considering the presence of a medium earthquake during the hours immediately before the mainshock of 15 September (event n. 11 in Table 2), located on the Maniaglia fault alignment (Figure 9, Section 03), it is likely that the Maniaglia fault triggered the Susans–Tricesimo northwestern segment, similarly to the interplay that likely occurred during the May sequence between the Predjama fault and southeastern Susans–Tricesimo segment. In this regard, it is worth remarking that the authors in [87] proposed a focal mechanism for the mainshock of September, which shows the activation of a 30°-dipping NW-SE-striking plane with a significant dextral component, in good agreement with the focal mechanism solution proposed by [88]. Both interpretations, which only slightly differ from the 38° N-dipping geometry of [81], match our hypothesis regarding the activation of the ST-NW segment as the source of the Ml 6.1 September earthquake.
On the basis of the 3D seismotectonic model reconstructed, the seismotectonic parameters of the identified seismogenic segments are presented in Table 4. Particularly, starting from the length (SRL) and the area (RA) of each source, the maximum expected values were calculated through the [106] empirical relationships considering both thrust–fault (TH) and all type (ALL) kinematics. The estimated Mmax values for both ST-SE and ST-SW well represent the seismogenic potential of the strongest events of the 1976 Friuli sequences.

Table 4.
Seismotectonic parameters of ST-SE and ST-NW seismogenic source segments [106].
6. Conclusions
By integrating 3D structural settings reconstructed from ENI seismic line interpretation (up to 5 km in depth), the seismogenic upper crustal volume investigated through hypocentral seismicity distribution analysis (up to 15 km depth) and the surficial structural setting of the central Friuli area, we reconstructed the present seismotectonic framework of the southern Julian pre-Alps and the northern Friuli Plain. The elaborated seismotectonic model highlights many significant aspects regarding the seismogenesis of the area, suggesting new implications in terms of seismic hazard assessment. Particularly, the proposed model shows that:
- The seismogenesis of the area is strongly defined by the structural inheritance, especially in terms of structural complexities representing the product of the combined effect of the Paleogene Dinaric orogeny and the late Miocene–Pliocene neo-Alpine compression;
- Because of its deep structural complexity, the polyphasic Susans–Tricesimo masterfault is likely segmented into two distinct seismogenic sources (ST-SE and ST-NW);
- The northwestward-propagating dextral transpressive fault systems of western Slovenia are affecting the inherited thrusts, and the Dinaric trending transpressive fault segments strongly control the strain accommodation in the central Friuli area, as already remarked by [29,30]. In this context, the possibility that the 15 September 1976 mainshock was induced by a transpressive source, corresponding at the surface with the Maniaglia fault, is not excluded. While regarding the mainshock of 6 May 1976, the southeastern segment of ST was likely triggered by the Predjama fault, as testified by the Coulomb stress analysis (Supplementary Material S3);
- The activation of the Buia thrust during the strongest events of 1976 is ruled out, and the involvement of the Gemona–Kobarid and Musi–Verzegnis thrusts is reduced, as confirmed by [8].
Supplementary Materials
The following supporting information can be downloaded at: https://www.mdpi.com/article/10.3390/geosciences12060227/s1, Supplementary Material S1: Chronostratigraphical correlation scheme of the Plio-Quaternary Units of the Tagliamento basin (S1—Figure S1). Supplementary Material S2: N-S oriented seriated sections (S2—Figure S2 and S2—Figure S3). Supplementary Material S3: Coulomb Stress Changes (S3–Figure S4, S3—Figure S5, S3—Figure S6, S3—Figure S7).
Author Contributions
Conceptualization, G.P. and M.E.P.; Data curation, M.E.P. and D.C.; Formal analysis, D.C.; Funding acquisition, M.E.P.; Investigation, G.P. and M.E.P.; Methodology, G.P. and M.E.P.; Project administration, M.E.P.; Supervision, M.E.P.; Visualization, G.P.; Writing—original draft, G.P.; Writing—review and editing, M.E.P. and D.C. All authors have read and agreed to the published version of the manuscript.
Funding
This research was realized in the framework of the Environmental Life Science PhD Course XXXIII cycle managed by the University of Trieste and the University of Udine. The study was supported by the Accordo attuativo di collaborazione tra il Servizio geologico della Direzione centrale difesa dell’ambiente, energia e sviluppo sostenibile e il Dipartimento di Matematica e Geoscienze dell’Università degli Studi di Trieste, il Dipartimento di Scienze AgroAlimentari, Ambientali e Animali dell’Università degli Studi di Udine e l’Istituto Nazionale di Oceanografia e di Geofisica Sperimentale per la redazione delle linee guida e per la segnalazione delle criticità delle faglie attive, Cap. 2185, Funding Number: U.1.04.01.02.008.
Data Availability Statement
The interpreted seismic lines are property data of ENI. Focal mechanisms are from the Catalogue of earthquakes of southern Alps and surroundings area from 1928 to 2019, available online at https://zenodo.org/record/4660412#.Yjn_WurMLIU (accessed on 10 May 2022). Seismological data of the 1978–2019 earthquakes are from the OGS-CRS Friuli Venezia Giulia Seismometric Network Bulletin, available online at http://www.crs.inogs.it/bollettino/RSFVG/RSFVG.en.html (accessed on 15 December 2021).
Acknowledgments
We acknowledge ENI for the consultation and supply of seismic data. We thank Petroleum Expert Ltd. (Edinburgh) for the availability of the 3D-Move Software (version 2019.1) to the University of Udine. We are grateful to A. Saraò, A. Rebez and G. Renner for the critical discussion during manuscript writing. Many thanks to A. Zanferrari for his constructive suggestions and to L. Ronchiadin for his contribution to seismic line interpretation. We are also grateful to the four anonymous referees who strongly contributed to improve our manuscript. Many thanks to the Academic Editor for his suggestions.
Conflicts of Interest
The authors declare no conflict of interest.
References
- Rovida, A.; Locati, M.; Camassi, R.; Lolli, B.; Gasperini, P.; Antonucci, A. Catalogo Parametrico dei Terremoti Italiani (CPTI15); Versione 4.0; Istituto Nazionale di Geofisica e Vulcanologia: Rome, Italy, 2022. [Google Scholar] [CrossRef]
- Serpelloni, E.; Vannucci, G.; Anderlini, L.; Bennet, R.A. Kinematics, seismotectonics and seismic potential of the eastern sector of the European Alps from GPS and seismic deformation data. Tectonophysics 2016, 688, 157–181. [Google Scholar] [CrossRef]
- Galadini, F.; Poli, M.E.; Zanferrari, A. Seismogenic sources potentially responsible for earthquakes with M ≥ 6 in the eastern Southern Alps (Thiene-Udine sector, NE Italy). Geophys. J. Int. 2005, 161, 739–762. [Google Scholar] [CrossRef] [Green Version]
- Poli, M.E.; Renner, G. Normal focal mechanisms in the Julian Alps and Prealps seismotectonic implications for the Italian-Slovenian border region. Boll. Geof. Teor. Appl. 2004, 45, 51–69. [Google Scholar]
- Vrabec, M.; Fodor, L. Late Cenozoic tectonics of Slovenia: Structural styles at the Northeastern corner of the Adriatic microplate. In The Adria Microplate: GPS Geodesy, Tectonics and Hazards; Springer: Dordrecht, The Netherlands, 2006; pp. 151–168. [Google Scholar]
- Moulin, A.; Benedetti, L.; Rizza, M.; Rupnik, P.J.; Gosar, A.; Bourlès, D.; Keddadouche, K.; Aumaitre, G.; Arnold, M.; Gçuillou, V.; et al. The Dinaric fault system: Large-scale structure, rates of slip, and Plio-Pleistocene evolution of the transpressive northeastern boundary of the Adria microplate. Tectonics 2016, 35, 2258–2292. [Google Scholar] [CrossRef] [Green Version]
- Atanackov, J.; Jamšek Rupnik, P.; Jež, J.; Celarc, B.; Novak, M.; Milanič, B.; Markelj, A.; Bavec, M.; Kastelic, V. Database of Active Faults in Slovenia: Compiling a New Active Fault Database at the Junction Between the Alps, the Dinarides and the Pannonian Basin Tectonic Domains. Front. Earth Sci. 2021, 9, 151. [Google Scholar] [CrossRef]
- Turrini, C.; Angeloni, P.; Lacombe, O.; Ponton, M.; Roure, F. Three-dimensional seismo-tectonics in the Po Valley basin, Northern Italy. Tectonophysics 2015, 661, 156–179. [Google Scholar] [CrossRef] [Green Version]
- Saraò, A.; Sugan, M.; Bressan, G.; Renner, G.; Restivo, A. A focal mechanism catalogue of earthquakes that occurred in the southeastern Alps and surrounding areas from 1928–2019. Earth Syst. Sci. Data 2021, 13, 2245–2258. [Google Scholar] [CrossRef]
- Guidoboni, E.; Ferrari, G.; Tarabusi, G.; Sgattoni, G.; Comastri, A.; Mariotti, D.; Ciuccarelli, C.; Bianchi, M.G.; Valensise, G. CFTI5Med, the new release of the catalogue of strong earthquakes in Italy and in the Mediterranean area. Sci. Data 2019, 6, 80. [Google Scholar] [CrossRef]
- Slejko, D. What science remains of the 1976 Friuli earthquake? Boll. Geof. Teor. Appl. 2018, 59, 327–350. [Google Scholar] [CrossRef]
- Rebez, A.; Cecić, I.; Renner, G.; Sandron, D.; Slejko, D. Misunderstood “forecasts”: Two case histories from former Yugoslavia and Italy. Boll. Geof. Teor. Appl. 2018, 59, 481–504. [Google Scholar] [CrossRef]
- OGS-CRS: Friuli Venezia Giulia Seismometric Network Bulletin. Available online: http://www.crs.inogs.it/bollettino/RSFVG/RSFVG.en.html (accessed on 15 December 2021).
- Roeder, D. South-Alpine thrusting and trans-Alpine convergence. In Alpine Tectonics; Coward, M.P., Dietrich, D., Park, R.G., Eds.; Geological Society, Special Publications: London, UK, 1989; Volume 45, pp. 211–227. [Google Scholar]
- Castellarin, A.; Nicolich, R.; Fantoni, R.; Cantelli, L.; Sella, M.; Selli, L. Structure of the lithosphere beneath the Eastern Alps (southern sector of the TRANSALP transect). Tectonophysics 2006, 414, 259–282. [Google Scholar] [CrossRef]
- Doglioni, C.; Bosellini, A. Eoalpine and mesoalpine tectonics in the Southern Alps. Geol. Rundsch. 1987, 76, 735–754. [Google Scholar] [CrossRef]
- Castellarin, A.; Cantelli, L.; Fesce, A.M.; Mercier, J.L.; Picotti, V.; Pini, G.A.; Prosser, G.; Selli, L. Alpine compressional tectonics in the Southern Alps. Relationships with the N-Apennines. Ann. Tecton. 1992, 6, 62–94. [Google Scholar]
- Fantoni, R.; Catellani, D.; Merlini, S.; Rogledi, S.; Venturini, S. La registrazione degli eventi deformativi cenozoici nell’avampaese Veneto-Friulano. Mem. Soc. Geol. Ital. 2002, 57, 301–313. [Google Scholar]
- Monegato, G.; Stefani, C.; Zattin, M. From present rivers to old terrigenous sediments: The evolution of the drainage system in the eastern Southern Alps. Terra Nova 2010, 22, 218–226. [Google Scholar] [CrossRef]
- Castellarin, A.; Cantelli, L. Neo-Alpine evolution of the Southern Eastern Alps. J. Geodyn. 2000, 30, 251–274. [Google Scholar] [CrossRef]
- Caputo, R.; Poli, M.E.; Zanferrari, A. Neogene-Quaternary stratigraphy of the eastern Southern Alps, NE Italy. J. Struct. Geol. 2010, 32, 1009–1027. [Google Scholar] [CrossRef]
- Toscani, G.; Marchesini, A.; Barbieri, C.; Di Giulio, A.; Fantoni, R.; Mancin, N.; Zanferrari, A. The Friulian-Venetian Basin I: Architecture and sediment flux into a shared foreland basin. Ital. J. Geosci. 2016, 135, 444–459. [Google Scholar] [CrossRef]
- Massari, F.; Grandesso, P.; Stefani, C.; Jobstraibizer, P.G. A small polyhistory basin evolving in a context of oblique convergence: The Venetian basin (Chattian to Recent, Southern Alps, Italy). In Foreland Basins; Allen, P.A., Homewood, P., Eds.; Blackwell Scientific: Oxford, UK, 1986; pp. 141–168. [Google Scholar]
- Venturini, C. Cinematica neogenico-quaternaria del Sudalpino orientale (settore friulano). Studi Geol. Cam. 1990, 1990, 109–116. [Google Scholar]
- Monegato, G. Le Successioni Conglomeratiche Messiniano-Pleistoceniche nel Bacino del Fiume Tagliamento. Ph.D. Thesis, University of Udine, Udine, Italy, 2006. [Google Scholar]
- Caputo, R. The polyphase tectonics of eastern Dolomites, Italy. Mem. Di Sci. Geol. 1996, 48, 93–106. [Google Scholar]
- Zanferrari, A.; Masetti, D.; Monegato, G.; Poli, M.E. Geological Map and Explanatory Notes of the Geological Map of Italy at the Scale 1:50.000: Sheet 049 “Gemona del Friuli”. ISPRA—Servizio Geologico d’Italia—Regione Autonoma Friuli Venezia Giulia. 2013; p. 262. Available online: www.isprambiente.gov.it/Media/carg/friuli.html (accessed on 10 January 2022).
- Márton, E.; Cosovic, V.; Drobne, K.; Moro, A. Palaeomagnetic evidence for Tertiary counterclockwise rotation of Adria. Tectonophysics 2003, 377, 143–156. [Google Scholar] [CrossRef]
- Poli, M.E.; Zanferrari, A. The seismogenic sources of the 1976 Friuli earthquakes: A new seismotectonic model for the Friuli area. Boll. Geof. Teor. Appl. 2018, 59, 463–480. [Google Scholar] [CrossRef]
- Falcucci, E.; Poli, M.E.; Galadini, F.; Scardia, G.; Paiero, G.; Zanferrari, A. First evidence of active transpressive surface faulting at the front of the Eastern Southern Alps, northeastern Italy. Insight on the 1511 earthquake seismotectonics. Solid Earth 2018, 9, 911–922. [Google Scholar] [CrossRef] [Green Version]
- Patricelli, G.; Poli, M.E. Quaternary tectonic activity in the north-eastern Friuli Plain (NE Italy). Boll. Geof. Teor. Appl. 2020, 61, 309–332. [Google Scholar] [CrossRef]
- Poljak, M.; Živčić, M.; Zupančič, P. The seismotectonic characteristics of Slovenia. In Seismic Hazard of the Circum-Pannonian Region; Birkhäuser: Basel, Switzerland, 2000; pp. 37–55. [Google Scholar]
- Kastelic, V.; Vrabec, M.; Cunningham, D.; Gosar, A. Neoalpine structural evolution and present day tectonic activity of the eastern Southern Alps: The case of the Raune fault, NW Slovenia. J. Struct. Geol. 2008, 30, 963–965. [Google Scholar] [CrossRef]
- Moulin, A.; Benedetti, L.; Gosar, A.; Rupnik, P.J.; Rizza, M.; Bourlès, D.; Ritz, J. Determining the present-day kinematics of the Idrija fault (Slovenia) from aiborne LiDAR topography. Tectonophysics 2014, 628, 188–205. [Google Scholar] [CrossRef]
- Bechtold, M.; Battaglia, M.; Tanner, D.C.; Zuliani, D. Constraints on the active tectonics of the Friuli/NW Slovenia area from CGPS measurements and three-dimensional kinematic modeling. J. Geophys. Res. 2009, 114. [Google Scholar] [CrossRef] [Green Version]
- Devoti, R.; Esposito, A.; Pietrantonio, G.; Pisani, A.R.; Riguzzi, F. Evidence of large scale deformation patterns from GPS data in the Italian subduction boundary. Earth Planet. Sci. Lett. 2011, 311, 230–241. [Google Scholar] [CrossRef]
- Cheloni, D.; D’Agostino, N.; D’Anastasio, E.; Selvaggi, G. Reassessment of the source of the 1976 Friuli, NE Italy, earthquake sequence from the joint inversion of high-precision levelling and triangulation data. Geophys. J. Int. 2012, 190, 1279–1294. [Google Scholar] [CrossRef] [Green Version]
- Grützner, C.; Aschenbrenner, S.; Rupnik, P.J.; Reicherter, K.; Saifelislam, N.; Včič, B.; Vrabec, M.; Welte, J.; Ustaszewski, K. Holocene surface rupturing earthquakes on the Dinaric Fault System, western Slovenia. Solid Earth 2021, 12, 2211–2234. [Google Scholar] [CrossRef]
- OGS-CRS: Friuli Venezia Giulia Seismometric Network. Available online: http://rts.crs.inogs.it/ (accessed on 15 December 2021).
- Bressan, G.; Barnaba, C.; Bragato, P.; Ponton, M.; Restivo, A. Revised seismotectonic model of NE Italy and W Slovenia based on focal mechanism inversion. J. Seismol. 2018, 22, 1563–1578. [Google Scholar] [CrossRef]
- Camassi, R.; Caracciolo, C.H.; Castelli, V.; Slejko, D. The 1511 Eastern Alps earthquakes: A critical update and comparison of existing macroseismic datasets. J. Seismol. 2011, 15, 191–213. [Google Scholar] [CrossRef] [Green Version]
- Fitzko, F.; Suhadolc, P.; Aoudia, A.; Panza, G.F. Constraints on the location and mechanism of the 1511 Western-Slovenia earthquake from active tectonics and modeling of macroseismic data. Tectonophys 2005, 404, 77–90. [Google Scholar] [CrossRef]
- Ribaric, V. The Idrija earthquake of March 26, 1511. A reconstruction of some seismological parameters. Tectonophys 1979, 53, 315–324. [Google Scholar] [CrossRef]
- Bavec, M.; Atanackov, J.; Celarc, B.; Hajdas, I.; Jamšek, R.; Jež, J.; Kastelic, V.; Milanič, B.; Novak, M.; Skaberne, G.; et al. Evidence of Idrija fault seismogenic activity during the Late Holocene including the 1511 Mm 6.8 earthquake. In Proceedings of the 4th International INQUA Meeting on Paleoseismology, Active Tectonics and Archeoseismology (PATA), Aachen, Germany, 9–15 October 2013; Grützner & Reicherter Geosolutions: Aachen, Germany; pp. 23–26. [Google Scholar]
- Steinhauser, P.; Lenhardt, W. Interpretation of crustal deformations in the Friuli area for the earthquake of 1976. Gerlands Beitr. Geophys. 1986, 95, 459–467. [Google Scholar]
- Talamo, R.; Pampaloni, M.; Grassi, S. Risultati delle misure di livellazione di alta precisione eseguite dall’Istituto Geografico Militare nelle zone del Friuli interessate dalle recenti attività sismiche. Boll. Geod. Sci. Aff. 1978, 1, 6–75. [Google Scholar]
- IGM-RG. Relazione sui Lavori di Triangolazione Eseguiti nel Friuli dall’Istituto Geografico Militare Nell’anno 1977; Reparto Geodetico: Firenze, Italy, 1978. [Google Scholar]
- Amato, A.; Barnaba, P.F.; Finetti, I.; Groppi, G.; Martins, B.; Muzzin, A. Geodynamic outline and seismicity of Friuli Venetia Julia region. Boll. Geof. Teor. Appl. 1976, 18, 217–256. [Google Scholar]
- Aoudia, A.; Saraò, A.; Bukchin, B.; Suhadolc, P. The 1976 Friuli (NE Italy) thrust faulting earthquake: A reappraisal 23 years later. Geophys. Res. Lett. 2000, 27, 573–576. [Google Scholar] [CrossRef]
- Poli, M.E.; Peruzza, L.; Rebez, A.; Renner, G.; Slejko, D.; Zanferrari, A. New seismotectonic evidence from the analysis of the 1976-1977 and 1977-1999 seismicity in Friuli (NE Italy). Boll. Geof. Teor. Appl. 2002, 43, 53–78. [Google Scholar]
- Pondrelli, S.; Ekström, G.; Morelli, A. Seismotectonic re-evaluation of the 1976 Friuli, Italy, seismic sequence. J. Seismol. 2001, 5, 73–83. [Google Scholar] [CrossRef]
- Bernardis, G.; Poli, M.E.; Snidarcig, A.; Zanferrari, A. Seismotectonic and macroseismic characteristics of the earthquake of Bovec (NW Slovenia: April 12, 1998). Boll. Geof. Teor. Appl. 2000, 41, 133–148. [Google Scholar]
- Bajc, J.; Aoudia, A.; Saraò, A.; Suhadolc, P. The 1998 Bovec-Krn mountain (Slovenia) earthquake sequence. Geophys. Res. Lett. 2001, 28, 1839–1842. [Google Scholar] [CrossRef]
- Zupancîč, P.; Cecić, I.; Gosar, A.; Placer, L.; Poljak, M.; Živčić, M. The earthquake of 12 April 1998 in the Krn Mountains (Upper Soča valley, Slovenia) and its seismotectonic charcteristics. Geologija 2001, 44, 169–192. [Google Scholar] [CrossRef]
- Živčić, M.; Krn-2004 team. The Krn mountains (Slovenia) Mw 5.2 earthquake: Data acquisition and preliminary results. Geoph. Res. Abstr. 2006, 8, 06439. [Google Scholar]
- Zanferrari, A.; Avigliano, R.; Monegato, G.; Paiero, G.; Poli, M.E.; Stefani, C. Geological Map and Explanatory Notes of the Geological Map of Italy at the Scale 1:50.000: Sheet 066 “Udine”. APAT—Servizio Geologico d’Italia—Regione Autonoma Friuli Venezia Giulia 2008. 176p. Available online: www.isprambiente.gov.it/Media/carg/friuli.html (accessed on 10 January 2022).
- Mancin, N.; Barbieri, C.; Di Giulio, A.; Fantoni, R.; Marchesini, A.; Toscani, G.; Zanferrari, A. The Friulian-Venetian Basin II: Paleogeographic evolution and subsidence analysis from micropaleontological constraints. Ital. J. Geosci. 2016, 135, 460–473. [Google Scholar] [CrossRef]
- Cousin, M. Les rapports Alpes-Dinarides. Les confines de l’Italie et de la Yugoslavie. Soc. Géol. Nord 1981, 5, 521. [Google Scholar]
- Sartorio, D.; Tunis, G.; Venturini, S. Nuovi contributi per l’interpretazione geologica e paleogeografica delle Prealpi Giulie (Friuli orientale): Il pozzo SPAN1. Riv. Ital. Paleont. Strat. 1987, 93, 181–200. [Google Scholar]
- Cati, A.; Sartorio, D.; Venturini, S. Carbonate platforms in the subsurface of the northern Adriatic area. Mem. Soc. Geol. Ital. 1987, 40, 295–308. [Google Scholar]
- Tentor, M.; Tunis, G.; Venturini, S. Schema stratigrafico e tettonico del Carso Isontino. Nat. Nascosta 1994, 9, 1–32. [Google Scholar]
- Venturini, S. Il pozzo Cargnacco 1: Un punto di taratura stratigrafica nella pianura friulana. Mem. Soc. Geol. Ital. 2002, 57, 11–18. [Google Scholar]
- Sartorio, D.; Tunis, G.; Venturini, S. The Iudrio valley section and the evolution of the northeastern margin of the Friuli Platform (Julian Prealps, NE Italy-W Slovenia). Mem. Soc. Geol. Ital. 1997, 49, 163–193. [Google Scholar]
- Tunis, G.; Venturini, S. Evolution of the Southern margin of the Julian Basin with emphasis on the megabeds and turbidites sequence of the Southern Julian Prealps (NE Italy). Geol. Croat. 1992, 45, 127–150. [Google Scholar]
- Martinis, B. Ricerche geologiche e paleontologiche nella regione compresa tra il fiume Judrio e il fiume Timavo (Friuli orientale). Riv. Ital. Pal. Strat. Mem. 1962, 8, 244. [Google Scholar]
- Tunis, G.; Venturini, S. Geologia dei colli di Scriò, Dolegna e Ruttars (Friuli orientale): Precisazioni sulla stratigrafia e sul significato paleoambientale del Flysch di Cormons. Gortania 1989, 11, 5–24. [Google Scholar]
- Venturini, S.; Tunis, G. New stratigraphical, paleoenvironmental and tectonic data of the Flysch di Cormons (Eastern Friuli). Gortania Atti Museo Friul. Storia Nat. 1992, 13, 5–30. [Google Scholar]
- Stefani, C. Sedimentologia della molassa delle Prealpi Carniche occidentali. Mem. Soc. Geol. Ital. 1984, 36, 427–442. [Google Scholar]
- Mellere, D.; Stefani, C.; Angevine, C. Polyphase tectonics through subsidence analysis: The Oligo-Miocene Venetian and Friuli Basin, north-east Italy. Basin Res. 2000, 12, 159–182. [Google Scholar] [CrossRef]
- Zanferrari, A.; Avigliano, R.; Grandesso, P.; Monegato, G.; Paiero, G.; Poli, M.E.; Stefani, C. Geological Map and Explanatory Notes of the Geological Map of Italy at the Scale 1:50.000: Sheet 065 “Maniago”. APAT—Servizio Geologico d’Italia—Regione Autonoma Friuli Venezia Giulia 2008. 224p. Available online: www.isprambiente.gov.it/Media/carg/friuli.html (accessed on 20 September 2021).
- Fontana, A.; Monegato, G.; Rossato, S.; Poli, M.E.; Furlani, S.; Stefani, C. Carta delle Unità Geologiche Della Pianura del Friuli Venezia Giulia Alla Scala 1:150.000; Regione Autonoma Friuli Venezia Giulia; Direzione centrale ambiente ed energia, Servizio Geologico: Trieste, Italy, 2019. [Google Scholar]
- Venturini, C.; Discenza, K. Stratigrafia e paleo-idrografia del Friuli centrale (Prealpi Carniche): Miocene superiore-Pliocene inferiore. Gortania Geol. Paleontol. Planetol. 2009, 31, 31–52. [Google Scholar]
- Monegato, G.; Vezzoli, G. Post-Messinian drainage changes triggered by tectonic and climatic events (eastern Southern Alps, Italy). Sediment. Geol. 2011, 239, 188–198. [Google Scholar] [CrossRef]
- Sandron, D.; Renner, G.; Rebez, A.; Slejko, D. Early instrumental seismicity recorded in the eastern Alps. Boll. Geofis. Teor. Appl. 2014, 55, 755–788. [Google Scholar] [CrossRef]
- Sitaram, M.V.D.; Borah, P.K. Signal durations and local Richter magnitudes in northeast India: An empirical approach. J. Geol. Soc. India 2007, 70, 323–338. [Google Scholar]
- Richter, C.F. Elementary Seismology; W.H. Freeman and Company: San Francisco, CA, USA, 1958; pp. 136–139. [Google Scholar]
- Gutenberg, B.; Richter, C.F. Earthquake magnitude, intensity, energy, and acceleration. Bull. Seismol. Soc. Am. 1956, 46, 105–145. [Google Scholar] [CrossRef]
- Merlini, S.; Doglioni, C.; Fantoni, R.; Ponton, M. Analisi strutturale lungo un profilo geologico fra la linea Fella-Sava e l’avampaese adriatico (Friuli Venezia Giulia–Italia). Mem. Soc. Geol. Ital. 2002, 57, 293–300. [Google Scholar]
- Monegato, G.; Stefani, C. Preservation of a long-lived fluvial system in a mountain chain: The Tagliamento Valley (southeastern Italian Alps). In From River to Rock Record: The Preservation of Fluvial Sediments and Their Subsequent Interpretation Davidson; Davidson, S.K., Leleu, S., North, C.P., Eds.; SEPM Special Publications: Broken Arrow, OK, USA, 2011; Volume 97, pp. 359–374. [Google Scholar]
- Lavecchia, G.; Ferrarini, F.; de Nardis, R.; Visini, F.; Barbano, M.S. Active thrusting as a possible seismogenic source in Sicily (Southern Italy): Some insights from integrated structural-kinematic and seismological data. Tectonophysics 2007, 445, 145–167. [Google Scholar] [CrossRef]
- Slejko, D.; Neri, G.; Orozova, I.; Renner, G.; Wyss, M. Stress field in Friuli (NE Italy) from fault plane solutions of activity following the 1976 main shock. Bull. Seismol. Soc. Am. 1999, 89, 1037–1052. [Google Scholar]
- Álvarez-Gómez, J.A. FMC-Earthquake focal mechanisms data management, cluster and classification. SoftwareW 2019, 9, 299–307. [Google Scholar] [CrossRef]
- Colautti, D.; Finetti, I.; Nieto, D.; Pupis, C.; Russi, M.; Slejko, D.; Suhadolc, P. Epicenter distribution and analysis of 1976 earthquakes and aftershocks of Friuli. Boll. Geof. Teor. Appl. 1976, 18, 457–548. [Google Scholar]
- Finetti, I.; Giorgetti, F.; Haessler, H.; Hoang Trong, P.; Slejko, D.; Wittlinger, G. Time space epicenter and hypocenter distribution and focal mechanism of 1976 Friuli earthquakes. Boll. Geof. Teor. Appl. 1976, 18, 637–655. [Google Scholar]
- Cagnetti, V.; Console, R. Space-time distribution of the Friuli (1976) earthquake. Ann. Geofis. 1977, 30, 107–183. [Google Scholar]
- Wittlinger, G.; Haessler, H.; Hoang Trong, P. Contribution to the near field study of the aftershocks of the earthquakes on May 6th and September 15th 1976 in Friuli (Italy). In Proceedings of the Special Meeting on the 1976 Friuli Earthquake and the Antiseismic Design of Nuclear Installation CNEN, Rome, Italy, 11–13 October 1977; pp. 148–164. [Google Scholar]
- Anderson, H.; Jackson, J. Active tectonics of the Adriatic region. Geophys. J. Int. 1987, 91, 937–983. [Google Scholar] [CrossRef]
- Ebblin, C. Orientation of stresses and strains in the piedmont area of eastern Friuli, NE Italy. Boll. Geof. Teor. Appl. 1976, 18, 559–579. [Google Scholar]
- Chiarabba, C.; De Gori, P. The seismogenic thickness in Italy: Constraints on potential magnitude and seismic hazard. Terra Nova 2016, 28, 402–408. [Google Scholar] [CrossRef]
- Placer, L.; Vrabec, M.; Celarc, B. The bases for understanding of the NW Dinarides and Istria Peninsula tectonics. Geologija 2010, 53/1, 55–86. [Google Scholar] [CrossRef]
- Venturini, S. Nuovi dati sul Tortoniano del sottosuolo della Pianura Friulana. Gortania Atti Del Mus. Friul. Di Stor. Nat. 1987, 9, 5–16. [Google Scholar]
- Venturini, S.; Tunis, G. Nuovi dati ed interpretazioni sulla tettonica del settore delle prealpi Giulie e della regione ai confini fra Italia e Iugoslavia. Gortania Atti Mus. Friul. Stor. Nat. 1989, 10, 5–34. [Google Scholar]
- Carulli, G.B. Carta geologica del Friuli Venezia Giulia alla scala 1:150000. Regione Autonoma Friuli Venezia Giulia—Direzione centrale ambiente ed energia—Servizio Geologico 2006, S.E.L.C.A. Firenze.
- Ponton, M. Analisi strutturale profonda delle Dinaridi Esterne fra Alpi e Prealpi Giulie (Italia e Slovenia). Gortania Geol. Paleontol. Planetol. 2014, 36, 23–34. [Google Scholar]
- Sugan, M.; Renner, G.; Bressan, G.; Restivo, A.; Saraò, A. First motion data and focal mechanism solutions of 108 earthquakes occurred between 1928 and 2019 in the Southeastern Alps. Zenodo 2020. [Google Scholar] [CrossRef]
- Burrato, P.; Poli, M.E.; Vannoli, P.; Zanferrari, A.; Basili, R.; Galadini, F. Sources of MW 5+ earthquakes in north eastern Italy and western Slovenia: An updated view based on geological and seismological evidence. Tectonophys 2008, 453, 157–176. [Google Scholar] [CrossRef]
- Ramsay, J.G. Interference Patterns Produced by the Superposition of Folds of Similar Type. J. Geol. 1962, 70, 466–481. [Google Scholar] [CrossRef]
- Feruglio, E. Le Prealpi fra l’Isonzo e l’Arzino. Boll. Assoc. Agrar. Friuli 1925, 7, 302. [Google Scholar]
- Bosellini, A.; Sarti, M. Geologia del gruppo M. Cuar―M. Covria (Prealpi Carniche). G. Di Geol. 1978, 43, 47–88. [Google Scholar]
- Ponton, M. Un’area polideformata nelle Prealpi carniche: Il Monte Broili e il Cuel dal Meloc. Gortania Atti Mus. Friul. St. Nat. 2007, 28, 7–18. [Google Scholar]
- Ponton, M.; Tunis, G. La geologia del massiccio dei Monti la Bernadia (Prealpi Giulie). In Il Fenomeno Carsico Del Massiccio Dei Monti la Bernadia; Mem. Ist. Ital. Speleol, s II; Muscio, G., Ed.; Istituto Italiano di Speleologia: Trieste, Italy, 1996; Volume 8, pp. 36–48. [Google Scholar]
- Poli, M.E. Il massiccio carbonatico della Bernadia nelle Prealpi Giulie (Friuli, Italia NE): La registrazione di eventi tettonici tra il Cretacico superiore e il Quaternario. Rend. Online Soc. Geol. Ital. 2008, 2, 1–3. [Google Scholar]
- Poli, M.E. La carta geologica del Massiccio della Bernadia (Prealpi Giulie meridionali, Friuli, Italia NE). Rend. Online Soc. Geol. Ital. 2009, 5, 168–171. [Google Scholar]
- King, G.C.P.; Stein, R.S.; Lin, J. Static stress changes and the triggering of earthquakes. Bull. Seismol. Soc. Am. 1994, 84, 935–953. [Google Scholar]
- Freed, T.G. Earthquake triggering by static, dynamic, and post-seismic stress transfer. Annu. Rev. Earth Planet Sci. 2005, 33, 335–367. [Google Scholar] [CrossRef] [Green Version]
- Wells, D.L.; Coppersmith, K.J. New empirical relationships among magnitude, rupture length, rupture width, rupture area, and surface displacement. Bull. Seism. Soc. Am. 1994, 84, 974–1002. [Google Scholar]
- Lin, J.; Stein, R.S. Stress triggering in thrusts and subduction earthquakes, and stress interaction between the southern San Andreas and nearby thrust and strike-slip faults. J. Geophys. Res. 2004, 109. [Google Scholar] [CrossRef] [Green Version]
- Perniola, B.; Bressan, G.; Pondrelli, S. Changes in failure stress and stress transfer during the 1976–1977 Friuli earthquake sequence. Geophys. J. Int. 2004, 156, 297–306. [Google Scholar] [CrossRef] [Green Version]
Publisher’s Note: MDPI stays neutral with regard to jurisdictional claims in published maps and institutional affiliations. |
© 2022 by the authors. Licensee MDPI, Basel, Switzerland. This article is an open access article distributed under the terms and conditions of the Creative Commons Attribution (CC BY) license (https://creativecommons.org/licenses/by/4.0/).