Article

Influence of Depositional and Diagenetic Processes on Caprock Properties of CO2 Storage Sites in the Northern North Sea, Offshore Norway

1
Department of Geosciences, University of Oslo (UiO), 0371 Oslo, Norway
2
Norwegian Geotechnical Institute (NGI), 0806 Oslo, Norway
*
Author to whom correspondence should be addressed.
Geosciences 2022, 12(5), 181; https://doi.org/10.3390/geosciences12050181
Submission received: 28 February 2022 / Revised: 16 April 2022 / Accepted: 18 April 2022 / Published: 22 April 2022

Abstract

:
Characterization of caprock shale is critical in CO2 storage site evaluation because the caprock shale acts as a barrier for the injected buoyant CO2 plume. The properties of shales are complex and influenced by various processes; hence, it is challenging to evaluate the caprock quality. An integrated approach is therefore necessary for assessing seal integrity. In this study, we investigated the caprock properties of the Lower Jurassic Drake Formation shales from the proposed CO2 storage site Aurora (the Longship/Northern Lights CCS project), located in the Horda Platform area, offshore Norway. Wireline logs from 50 exploration wells, various 2D seismic lines, and two 3D seismic cubes were used to investigate the variations of the caprock properties. The Drake Formation was subdivided into upper and lower Drake units based on the lithological variations observed. Exhumation and thermal gradient influencing the caprock properties were also analyzed. Moreover, rock physics diagnostics were carried out, and caprock property maps were generated using the average log values to characterize the Drake Formation shales. In addiiton, pre-stack seismic-inverted properties and post-stack seismic attributes were assessed and compared to the wireline log-based analysis. The sediment source controlled at 61° N significantly influenced the depositional environment of the studied area, which later influenced the diagenetic processes and had various caprock properties. The upper and lower Drake units represent similar geomechanical properties in the Aurora area, irrespective of significant lithological variations. The Drake Formation caprock shale near the injection site shows less-ductile to less-brittle brittleness values. Based on the caprock thickness and shaliness in the Aurora injection site, Drake Formation shale might act as an effective top seal. However, the effect of injection-induced pressure changes on caprock integrity needs to be evaluated.

1. Introduction

CO2 capture and storage (CCS) in saline aquifers or depleted hydrocarbon reservoirs is one of the many solutions for reducing human-generated CO2 emissions into the atmosphere. Globally, governments and industries are planning large-scale CCS projects because the necessity for such a development is well documented by the UN’s climate panel (IPCC) and International Energy Agency (IEA). Partnering with industries, the Norwegian Government has developed a large-scale CCS strategy (the Longship CCS project) in the Norwegian Continental Shelf (NCS). According to the project proposal, CO2 will be captured from industrial point sources (cement factory and waste-to-energy plant), then liquefied and transported by ships to an onshore terminal (Øygarden municipality) on the Norwegian west coast. From that storage plant, the supercritical CO2 will be permanently stored in the deep saline aquifer (~2.6 km below the seabed) by ~100 km pipeline in the Horda Platform area. However, caprock shear failure or fracture [1,2,3,4,5] due to CO2 injection is one of the critical risks for reliable and permanent geological storage. Therefore, an intensive evaluation of caprock properties is necessary to successfully store CO2 in the Aurora injection site offshore Norway.
Caprock shales (or mudstones) mainly consist of clay and silt size particles (i.e., particles size <62.5 µm) and significantly differ from other clastic rocks in terms of composition, porosity, and heterogeneity [6,7,8,9]. The shale can be deposited in a wide range of environments (i.e., floodplains, lakes, shorefaces, prodelta, abyssal plains, etc.), has diverse origins (i.e., weathering products, biogenic remains), and there is a multitude in post-depositional processes, leading to a wide range of caprock properties. The studied Lower Jurassic Drake Formation shale in the Horda Platform area was deposited in a complex structural setting with various sub-basinal, paleo-depositional environments [10,11,12]. In addition, exhumation in the studied area [13,14] influenced the diagenetic processes (i.e., mechanical and chemical compactions); hence, various caprock properties were detected. Therefore, a detailed depositional and diagenetic analysis of Drake caprock shale is crucial for the Longship CCS project.
Compaction processes (i.e., mechanical and chemical) started altering the caprock shale just after deposition. Mechanical compaction (MC) depends on effective vertical stress, resulting in rock property changes due to frictional slippage, rotation, sliding, and reorientation of grains during burial [15,16]. MC occurs in siliciclastic rocks at low temperatures (below 60–70 °C), corresponding to burial depths less than 2 km in basins with normal geothermal gradients [17,18]. However, when the rock crosses the transition zone, chemical compaction (CC) commences where quartz cement starts to form, resulting in changing rock properties due to mineralogical and textural changes and cementation [19,20,21,22,23,24,25]. In shale, the formation of illite from smectite is the first major mineralogical change affecting rock properties during progressive burial. This reaction commences between 60–70 °C, where microquartz cement is also produced in addition to illite. Chlorite may also form from iron-rich smectite minerals [26]. At higher temperatures (above 120 °C), kaolinite clay may produce illite. This reaction requires (the kaolinite to illite reaction) a potassium source (e.g., potassium feldspar) present together with the clay minerals [26]. Elastic properties vary significantly between different types of clay minerals; hence, diagenetic evaluation is critical. The types of initial clay mineral deposition depend on weathering and provenance. Therefore, a depositional assessment is also crucial to characterize the caprock shales. In addition, the upliftment in any basin is critical because the maximum temperature and pressure experienced by the rock need to be evaluated for better caprock characterization. These processes considerably alter the rock properties; hence, the rocks behave differently under stress.
The fine-grained siliciclastic rocks (shale or mudstones) usually act as the top seal and prevent fluid flow due to their high capillary entry pressure [27]. However, rock failure or fracturing occurs when the shear stress exceeds the shear strength, controlled by the rock’s geomechanical properties [28]. Failure occurs quickly when the caprock shale indicates a brittle property compared to the ductile shales, which have a higher tolerance to stress and deformation (Figure 1). This might introduce a possible escape route for the injected fluid plume to flow upward. The geomechanical property such as rock brittleness can be assessed from the caprock properties (i.e., Young’s modulus, Poisson’s ratio, etc.), which are influenced by the depositional and diagenetic processes experienced by the rocks. Therefore, to evaluate caprock brittleness, the processes need to be characterized because, for a reliable and safe subsurface CO2 injection, effective viable top seal needs to be in place.
In this study, we characterized the Lower Jurassic Drake caprock shale properties in the Horda Platform area, offshore Norway. Effect of depositional environment, diagenesis, and exhumation on the caprock properties were evaluated. The influence of paleo-tectonic setting was assessed by analyzing the target formation’s structures, thickness, and shale volume (gamma-ray-based) differences. A series of regional caprock property maps were generated using the log data of 50 exploration wells, several 2D lines, and two 3D seismic volumes. Exhumation and thermal gradient analyses were also carried out to identify the mechanical and chemical compaction domains to better understand the diagenetic changes within the studied Drake Formation shales. This helped to interpret the Drake Formation’s strength properties by utilizing a Young’s modulus versus Poisson’s ratio rock physics template. The effects of possible clay structures and percentages of quartz particles within the caprock were discussed based on a published XRD-based mineralogical database [29]. Moreover, an inverted seismic property-based analysis was carried out to evaluate a detailed lateral properties variation in the Aurora injection site.

2. Geological Setting

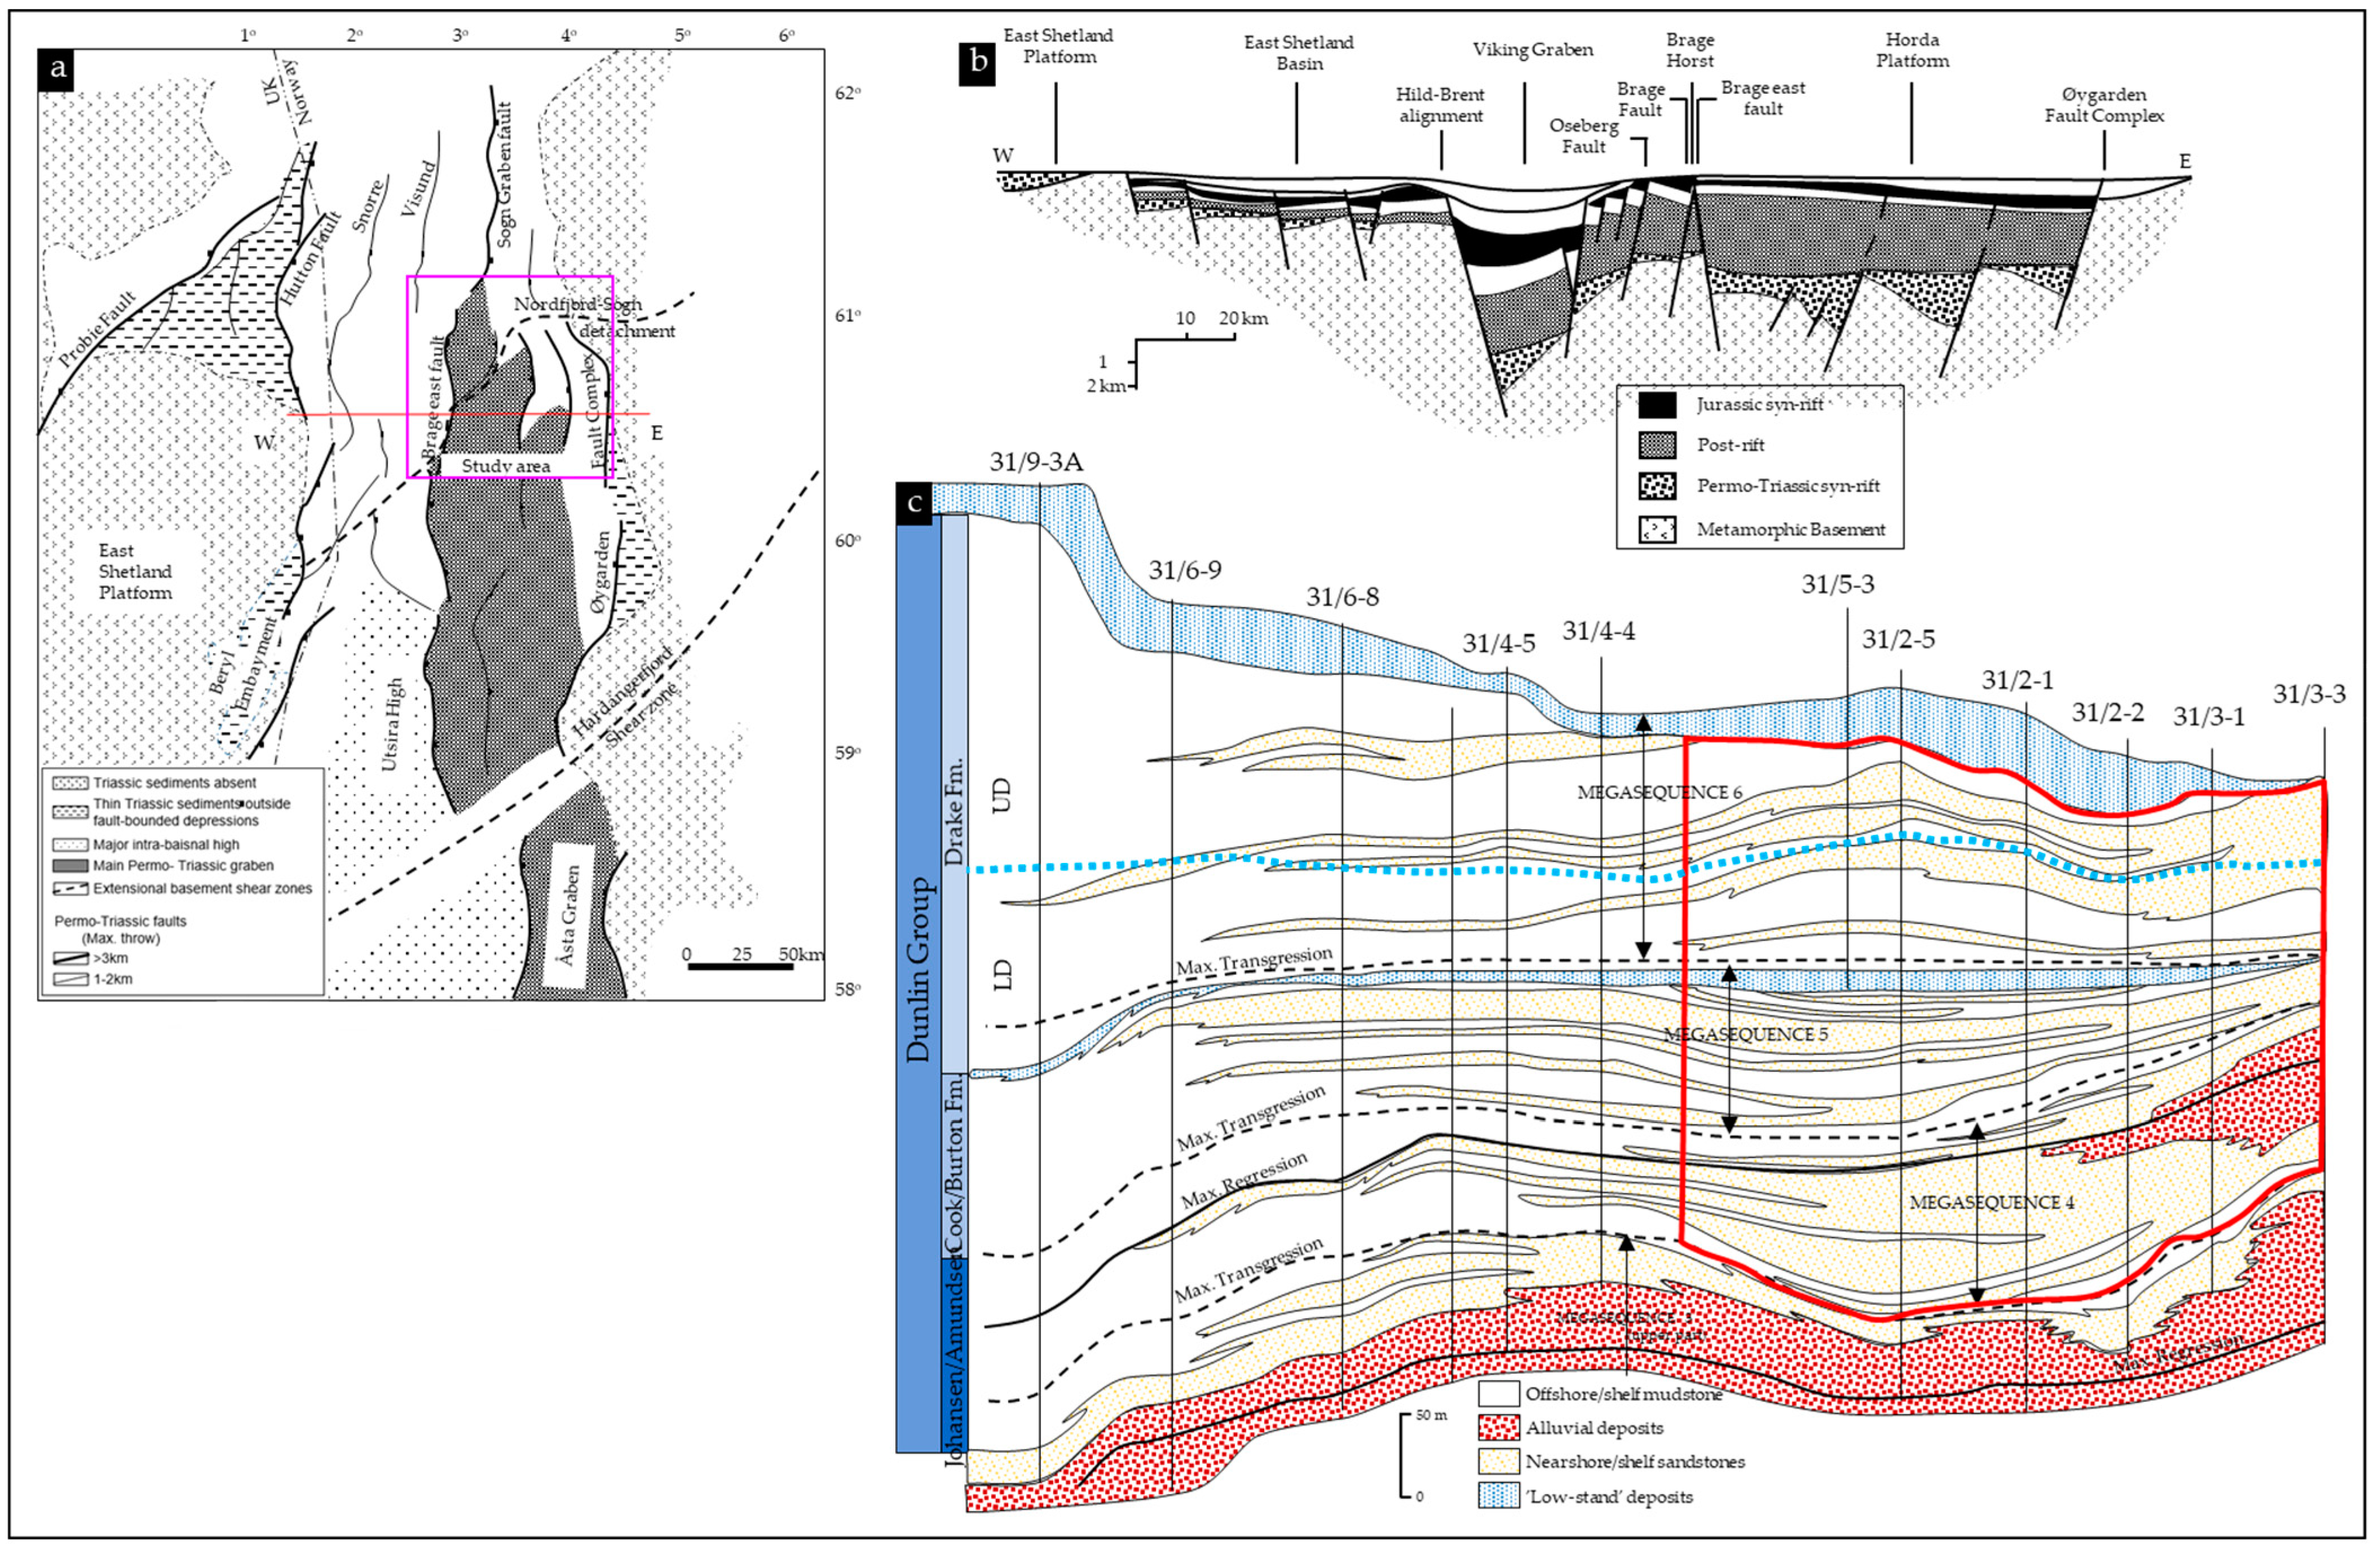
The northern North Sea experienced two main rifting events, during the Permo–Triassic and the Late Jurassic to Mid-Cretaceous times [10,12,30] (Figure 2a). A wide basin with deep-rooted faults and thick syn-depositional wedges was centered in the Horda Platform area during the first rifting event (Figure 2b). During the Late Jurassic to Mid-Cretaceous event, the major rifting and tilting were shifted westward (i.e., Lomre Terrace) [31]. It is assumed that during the second event, weak stretching with reactivation of major Permo–Triassic faults occurred on the Horda Platform [10,11,12,30,32,33]. Large normal faults with predominant N, NE, and NW orientations control basin formation, resulting in half-grabens (15–50 km in width) which are the fundamental morphological elements in the area [10]. Half-grabens in the North Sea may reach 100 km in along-strike length; however, studies suggested that normal faults occur in segments and were generally no longer than 20 km each [34,35]. The eastern margin of the Triassic sedimentary basins south of 61° N was, in general, associated with the Øygarden Fault Complex (ØFC), where vertical displacement was estimated between 3–5 km across normal faults [36,37]. However, north of 61° N, the structural pattern was controlled by the east-dipping Sogn Graben fault of Permo–Triassic origin, which created a westerly tilted basement with sediment deposited to the east [10].
There was a change in fault polarity at 61° N, between the Sogn Graben and the northern Horda Platform, creating opposite-facing half-grabens, constrained mainly by a pronounced basement shear zone known as the Nordfjord–Sogn detachment [10,36,38] (Figure 2a). This shear zone, interpreted as a Late Devonian extensional feature, separates Caledonian-influenced Precambrian rocks in the footwall to the south and metamorphosed Lower Paleozoic supracrustals in the hanging wall [39,40,41]. Seismic, gravity, and magnetic data showed this basement feature was oriented NE–SW across the northern North Sea. This feature was present at an anomalously high structural level immediately to the southeast (i.e., Horda Platform). The detachment significantly influenced the sedimentation between the northern and southern zones (reflected by thickness variations through syn-rift and post-rift time). Moreover, the major and minor faults created by rifting and subsequent thermal subsidence within the area played an important role in structural deformation and sediment deposition [42,43,44].
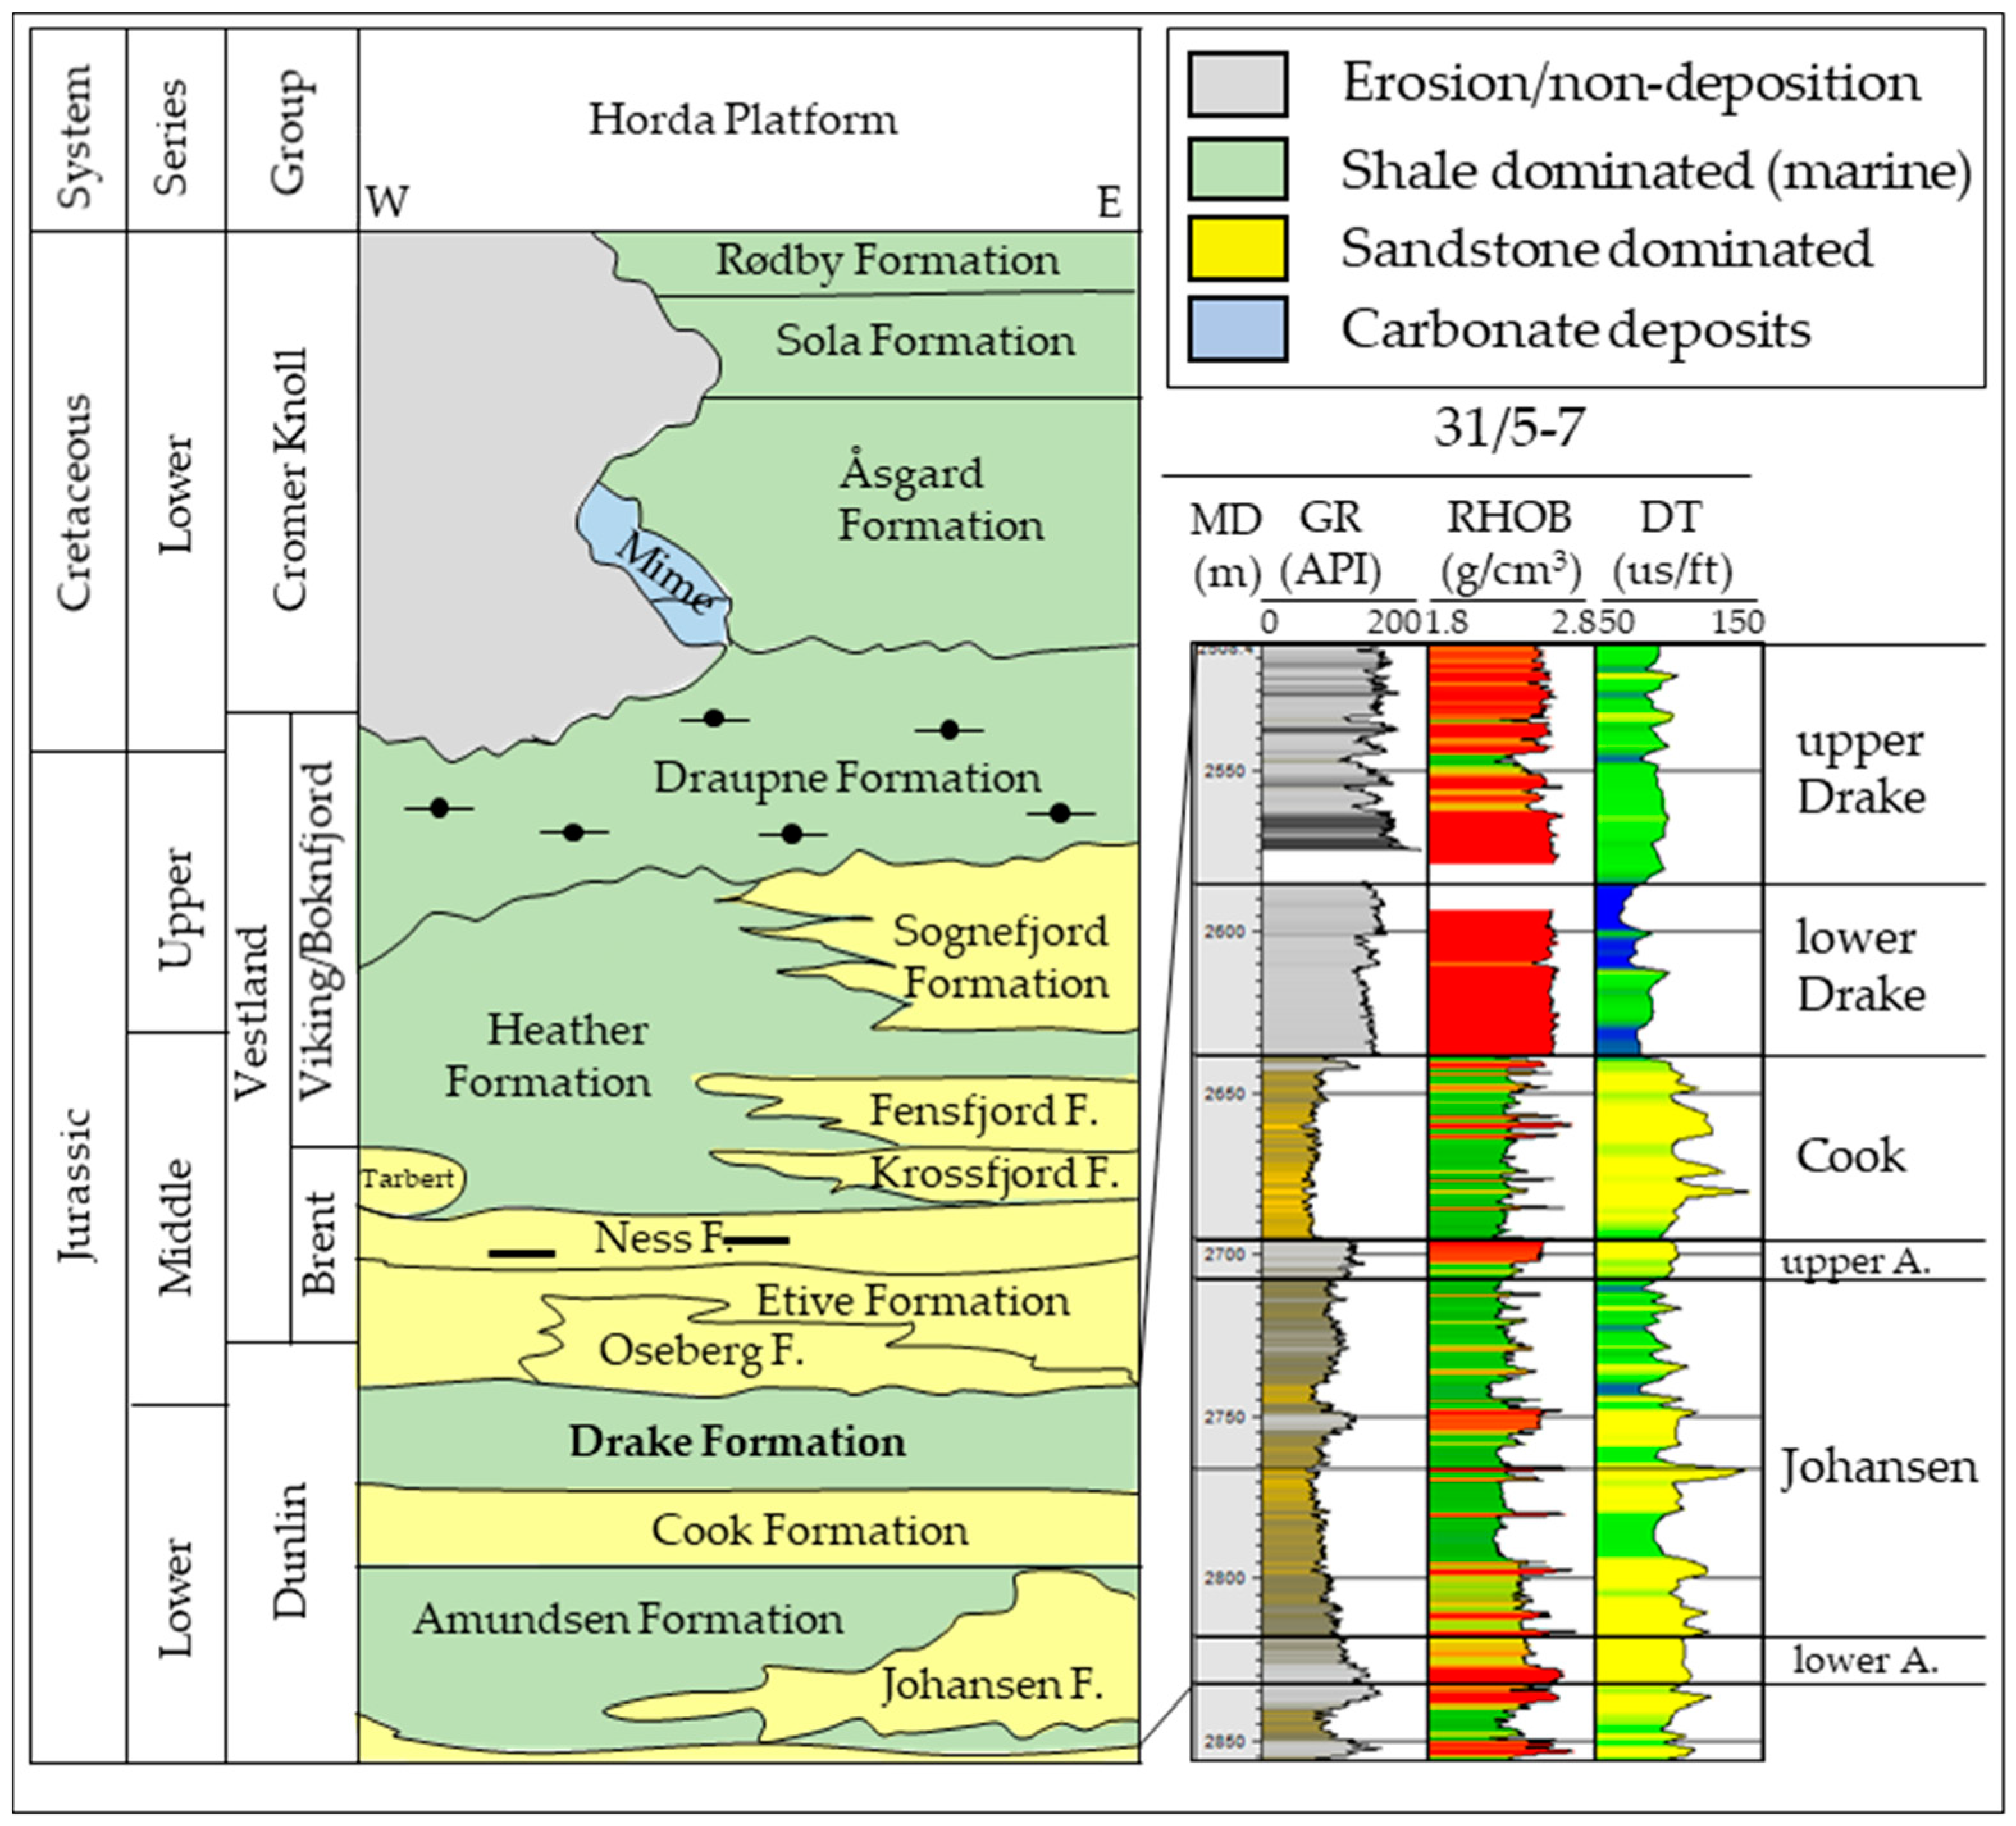
The Early Jurassic Dunlin Group consists of Johansen, Amundsen, Burton, Cook, and Drake Formations (Figure 3). The Dunlin Group shales have been defined as the retrograding shaley counterparts to prograding sands in the Early Jurassic mega-sequences PR4, PR5, and PR6, shown in Figure 2c. The mega-sequences equivalent to the Amundsen/Johansen formations, Burton/Cook formations, and Rannoch/Drake formations are PR4, PR5, and PR6, respectively, on the Horda platform area. Maximum flooding surfaces were found within the fine-grained Amundsen and Drake formations based on high gamma-ray values, indicating distal marine clay deposits [11]. However, on the Horda Platform, sands were prominent, since the area was located close to the basin margin.
The studied Drake Formation mainly consists of marine shales within the deeper parts of the sub-basins, while close to the basin margins, sandy deposits are found within the formation [45]. The caprock shale is divided into upper and lower units based on the lithology (Figure 2c), where the upper unit consists of heterolithic deposits comprising sandstones alternating with siltstones and claystones, while the lower unit consists of mainly claystone. The division into two units is visible in the Horda Platform area, while in the western, more-distal basin areas, it is less clear due to the absence of sand deposits. The coarser-grained upper Drake unit is considered a high-risk caprock and is therefore treated as a supporting caprock layer with the finer-grained, more clayey lower Drake unit.
Figure 3. A generalized Jurassic and Cretaceous stratigraphic succession of the study area (modified after NPD, [46]). The presented chronostratigraphy of Horda Platform has no scale, but the sandstone pinching out indicates relative east (E) and west (W) directions of the studied area. Wireline logs such as gamma-ray (GR), density (RHOB), and P-sonic (DT) of the Dunlin Group from well 31/5-7 are also shown. Note that the Drake and Amundsen formation shales are divided into upper and lower units.
Geosciences 12 00181 g003

3. Materials and Methods

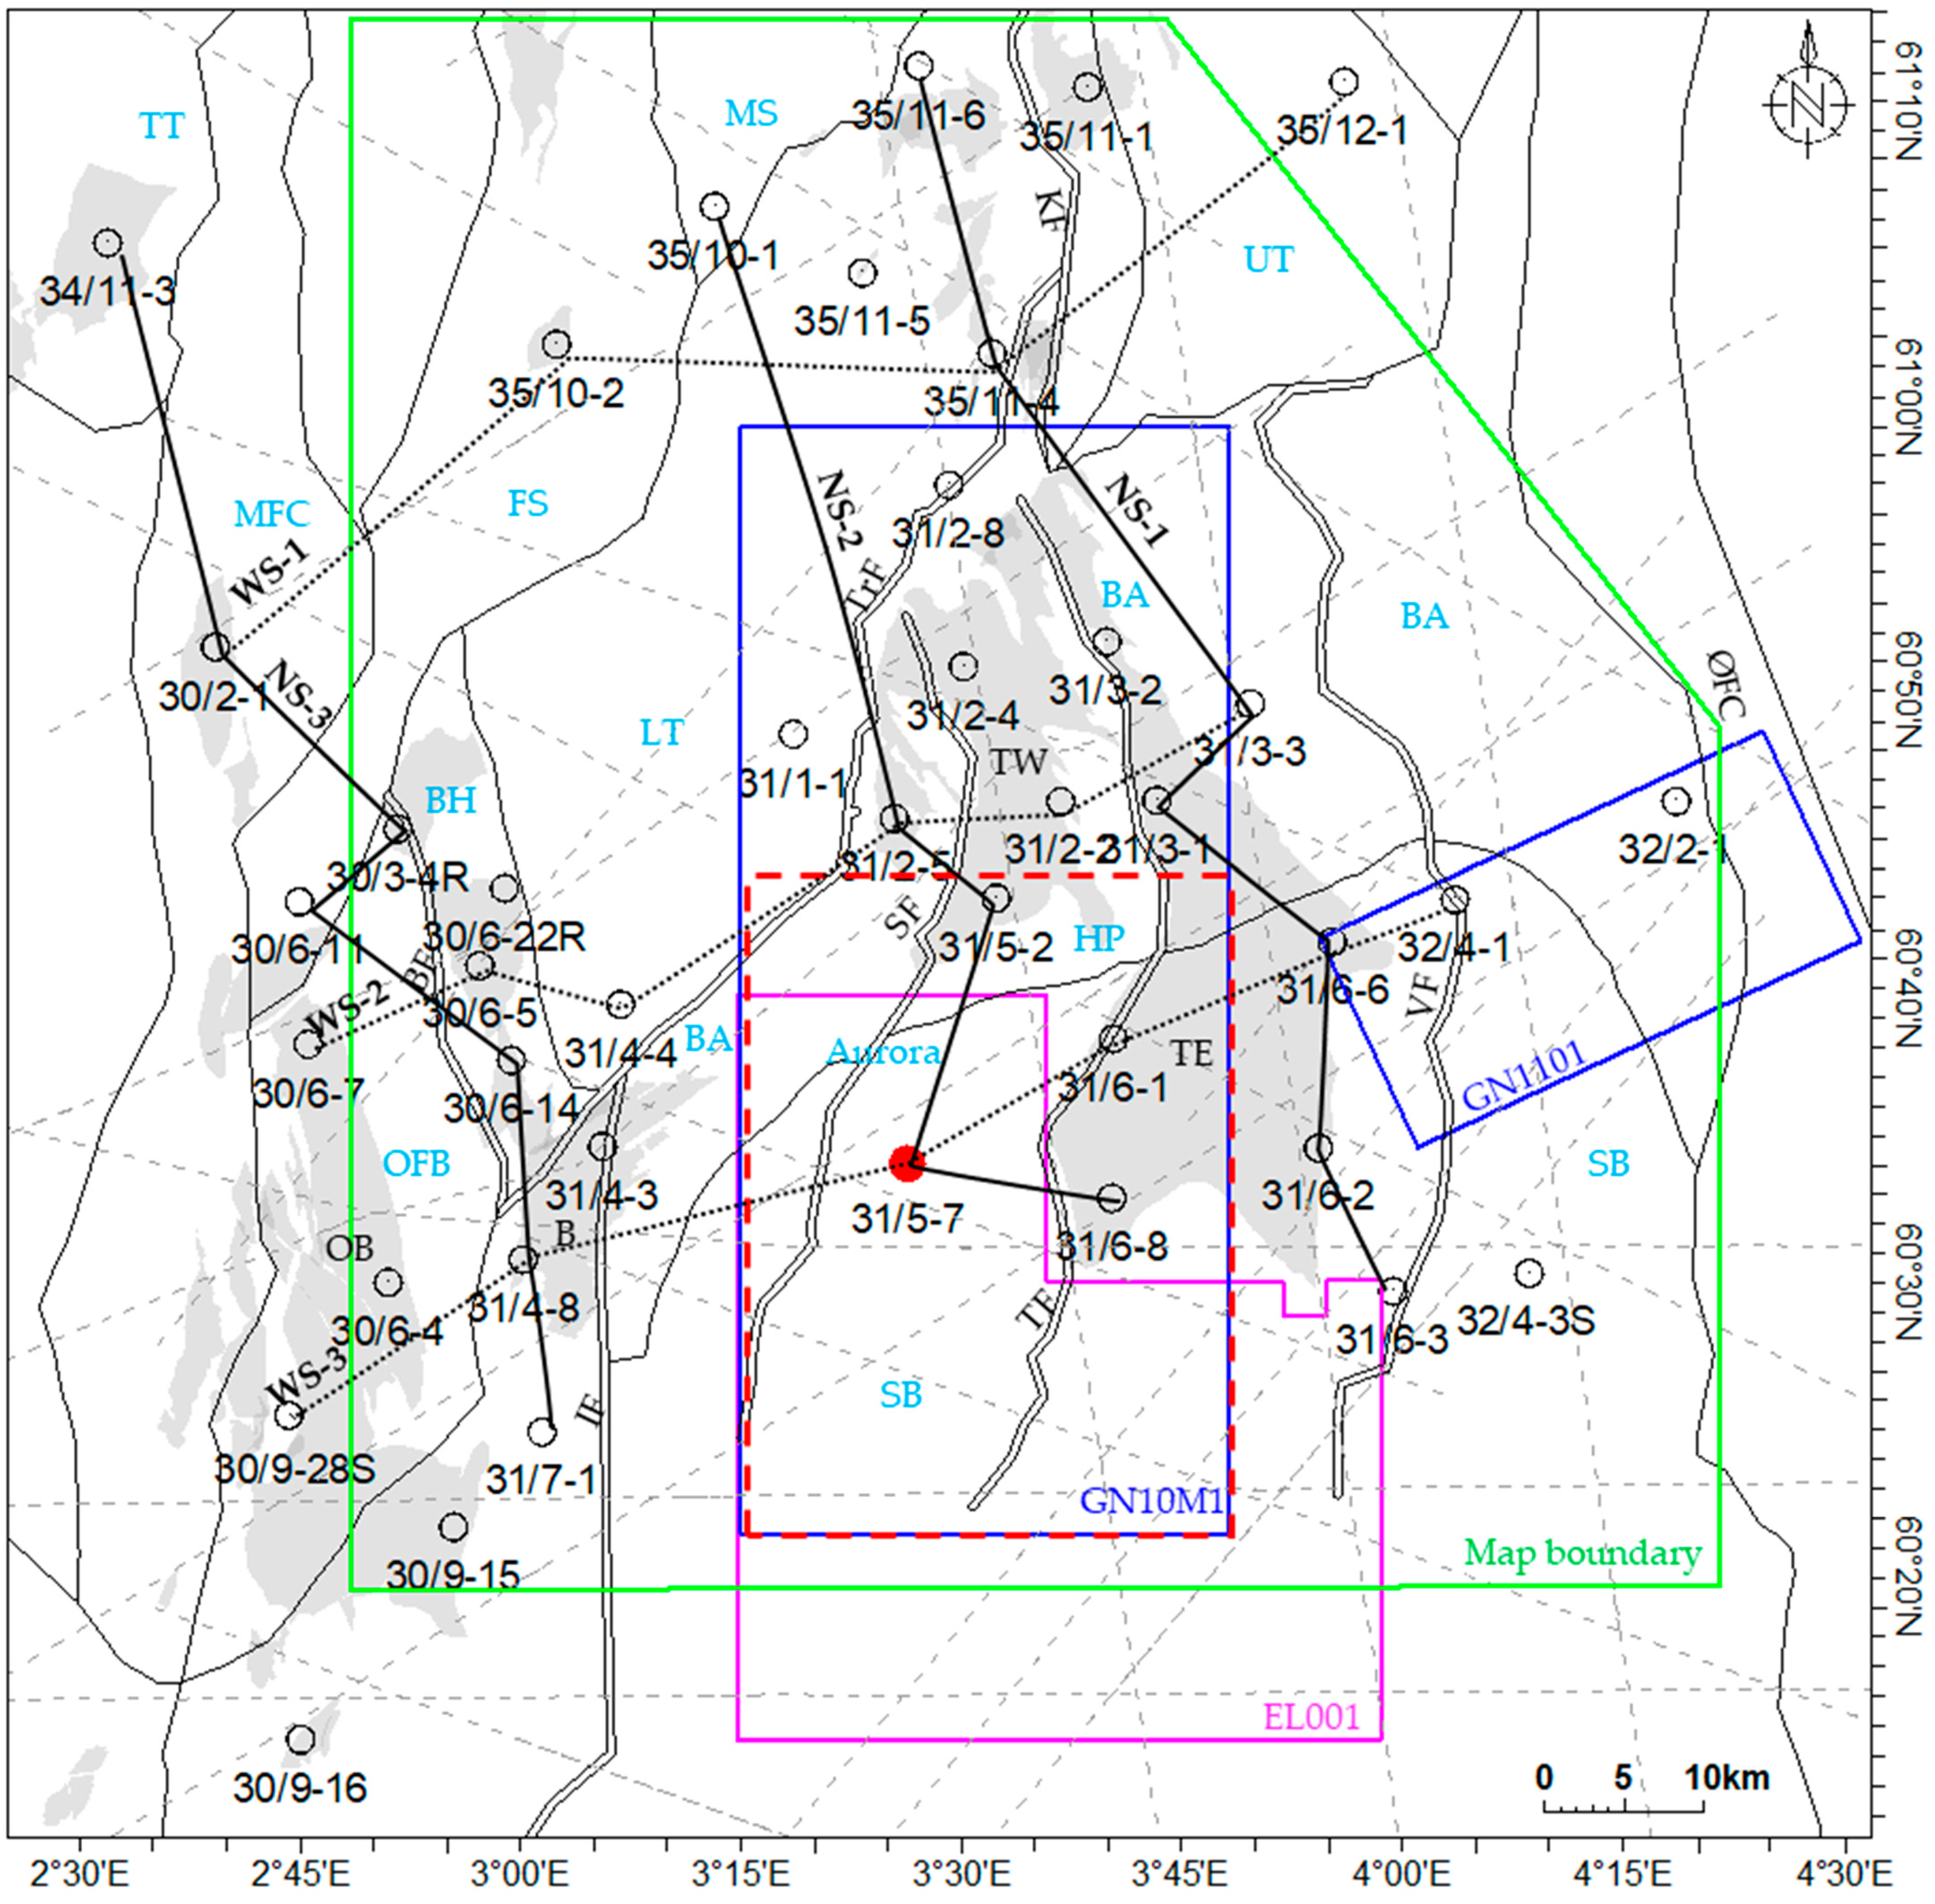
In this study, we used wireline logs from 50 exploration wells, several 2D seismic lines (NSR and SG8043 surveys), and two 3D surveys (GN10M1 and GN1101) from the Horda Platform area (Figure 4; Table 1) to evaluate the Drake Formation caprock properties. Present-day top depth of the Drake caprock is significantly varied and is located in various structural settings defined by the Norwegian Petroleum Directorate (NPD). The majority of the studied wells were from the Horda Platform (HP) area, which consists of Bjørgvin Arch (BA) and Stord Basin (SB) structural settings with 16 and 7 wells, respectively. In addition, a considerable number of wells were analyzed from other structural settings such as Lomre Terrace (LT), Oseberg Fault Complex (OFC), and Brage Horst (BH). The rest of the studied wells were selected from the deep basin part consisting of Flatfisk Slope (FS), Uer Terrace (UT), Mokkurkalve Fault Complex (MFC), Tjalve Terrace (TT), and Marflo Spur (MS) structural elements (Table 1).
There were considerable thickness variations observed within the studied wells in both upper and lower Drake units (Table 1). All the studied wells (50) were used for structural, thickness, temperature gradient, and exhumation studies, while 30 wells with available logs (i.e., gamma-ray, density, P-sonic, resistivity, neutron porosity, and vs. predicted by machine learning) were considered to evaluate the caprock geomechanical properties (i.e., Young’s modulus, Poisson’s ratio, and brittleness). A seismic (2D and 3D) interpreted top Drake time structure map was used for structural trends during the map generation process. Moreover, caprock characterization using post-stacked seismic attributes and pre-stacked seismic inverted properties was carried out based on the cropped seismic 3D cubes (the cropped area illustrated in Figure 4). NPD well tops of the studied wells were also updated based on Steel’s [11] stratigraphic sequence concept (Figure 2c). In this study, an integrated approach based on wireline logs and seismic data was employed to evaluate caprock properties. The research workflow is presented in Figure 5, where different methods used in this study are illustrated step by step. The techniques used to investigate the depositional history and diagenetic processes, map caprock properties, and estimate brittleness indices are briefly described below.

3.1. Depositional and Diagenetic Processes

Depositional history and diagenetic trends were carefully analyzed using selected wells. Radioactive minerals within the rocks can reveal the paleo-depositional water depth and sediment influx path [47] and possibly indicate the redox conditions between the sub-basins. Variation in the spectral gamma-ray (i.e., thorium and uranium) values observed within the Drake Formation is illustrated in the qualitative analysis of the paleo-depositional variation. The thorium (Th) and uranium (U) values of the lower Drake unit from four selected wells are shown in Figure 6a. Two wells (31/6-1 and 31/6-3) that are from the 31/6 block represent higher uranium and thorium content than the northern wells 31/3-1 and 35/11-1. Both wells show comparatively low uranium together with relatively high thorium. Higher U content wells (31/6-1 and 31/6-3) are located in the Stord Basin (SB), while 31/3-1 is in Bjørgvin Arch (BA) and 35/11-1 is in Uer Terrace (Figure 4). The percentage of radioactive elements indicates that paleo-water depth and sediment influx are similar in both sides of the 61° N (Nordfjord–Sogn detachment); however, the depositional setup changes significantly further south in SB.
Seven wells from a variable top depth of the Drake Formation were selected to evaluate the diagenetic processes. Top depth differences indicated the pressure and temperature variation experienced by the formation and represent intervals from both compactions (i.e., mechanical and chemical) regimes. The depth ranges from mechanical to chemical compaction allow us to evaluate the diagenetic influences on caprock geomechanical properties. Moreover, normalized gamma-ray (GR) based volume of shale (Vsh) was estimated and analyzed as a lithological variations proxy. For qualitative lithology assessment, GR is a powerful tool. However, GR values depend on different factors and must be calibrated with core data for use as lithological indicators. The volume of shale in this study was estimated using the Larionov [48] equation for older rock, where the sand and shale lines are defined separately for each well.
Caprock property changes during burial are due to compaction processes, which depend on the maximum temperature and pressure the rock experienced. Therefore, estimating the temperature gradient and exhumation correction are vital parameters to predict caprock properties. In this study, both exhumation and temperature gradient were calculated. The normal compaction trend (NCT) and the bottom hole temperature (BHT) were used in these calculations. The velocity-depth silt-kaolinite (50:50) trend suggested by Mondol [49]) was used as a reference NCT and then calibrated with the recently published data from Baig et al. [13]. The temperature on top surfaces was calculated using temperature gradient estimation based on the following equation:
m = ( y c ) T D
where m is the temperature gradient, y is the bottom hole temperature, c is the mean annual temperature at the seafloor (i.e., 5 °C for the North Sea), and TD is the total depth below the seafloor.
The regional maps (green polygon in Figure 4) based on the well data points (Table A1 and Table A2) were generated using the PetrelTM—2019 map generation process, where a convergent interpolation algorithm is used to interpolate the point datasets. In this process, the time surface interpreted from combining the 2D and 3D seismic interpretation was used as a soft structural trend.

3.2. Caprock Property Evaluation

Properties of caprock shale were evaluated using wireline logs and seismic cubes (Figure 5). The properties such as Young’s modulus (E) and Poisson’s ratio (PR) are the proxies of rock stiffness and can indicate the top seal’s integrity under stress. Therefore, a rock physics template was adapted from Perez and Marfurt [50] in an E versus PR cross-plot to evaluate the ductility of the Drake caprock shale. Compressional wave velocity (Vp), shear wave velocity (Vs), and bulk density (ρ) logs were used to estimate these properties by using the empirical equations. The static E was directly estimated using the equation proposed by Horsrud, [51]:
E s = 0.076 V p 3.23
The PR was calculated using the equation below:
P R = V p 2 2 V S 2 2 ( V p 2 V S 2 )
However, a limited number of studied wells have the acquired V S data; therefore, a machine learning (ML) algorithm-based Random Forest (RF) estimated V S was used in this analysis (Figure 6b). Several algorithms such as Neural Network (NN), K-nearest neighbors (kNN) and RF were tested, but we decided to use RF for this study. In addition, the elastic property-based brittleness indices (EBI) were evaluated. The BI is the quantitative measure of the geomechanical property of the rocks, where a higher BI value indicated brittle caprocks and lower values represented ductile rocks. The EBI equation used in this study [52] is based on acoustic impedance (AI) and deep resistivity (Rt) and defined as:
EBI = A I V p o m ρ o m a R w R t [ A I ( 1 V p w 1 V p o m ) ( ρ w ρ o m ) ] [ ( ρ m a ρ o m ) A I ( 1 V p m a 1 V p o m ) ]
where VPma and VPw are the P-wave velocities of the mineral matrix and the pore fluid (water), respectively, VPom is the P-wave velocities of the organic matter (OM), ρom is the density of organic matter, ρma is the density of mineral grains, ρw is the density of pore fluids (water in this case), Rt is formation resistivity, Rw is the resistivity of water (0.08 ohm-m based on estimates from the well calibration), ‘a’ is tortuosity factor, and AI is acoustic impedance.
A detailed, pre-stacked, seismic-inverted, property-based analysis was carried out in the Aurora injection site (mainly focusing on the proposed injection well location). The pre-stacked seismic inversion was carried out using an algorithm based on three modified Fatti et al. [53] reflectivity terms [54,55,56]. The pre-stacked simultaneous inversion method assisted in generating P-impedance (AI), S-impedance (SI), and density (ρ) cubes. These property cubes were then used to calculate other properties such as volume of shale (Vsh) and EBI. After generating an Rt cube using the equation that relates AI with formation resistivity [57] while assuming 100% water saturation (Sw), we used equation 4 to estimate seismic property-based EBI. Both wireline logs and inverted seismic property-based EBI were incorporated to have a comparative analysis. Moreover, based on the inverted cubes (i.e., AI, Vp/Vs ratio), the shale volume (Vsh) cube was estimated using the following equation [58]:
V s h = { ρ m a A I V P m a [ 1 ( V S V P G α ) 1 n ] [ A I ( 1 V P w 1 V P m a ) ( ρ w ρ m a ) ] } [ ( ρ s h ρ m a ) A I ( 1 V P s h 1 V P m a ) ]
where Vsh is the volume of shale in fraction, AI is acoustic impedance in g/cm3 x m/s, Vp is P-wave velocity in m/s, Vs is S-wave velocity in m/s, G is mineralogy/shaliness coefficient, α is Vs/Vp ratio of the mineral/rock matrix, n is stress/cementation coefficient, Vpma, Vpsh and Vpw are the P-wave velocities (in m/s) of the mineral matrix (e.g., quartz), shale, and water, respectively, ρma is the density of mineral grains, ρsh is the density of the shale, and ρw is the density of water (all in g/cm3).
A 3D post-stacked seismic (cropped cube from GN10M1 survey, marked in Figure 4) amplitude analysis was also carried out to evaluate caprock properties. The RMS amplitude computed the Root Mean Squares (RMS) on instantaneous trace samples over a specified window. The default window length (9) was implemented in this study. Another amplitude called Relative Acoustic Impedance (RAI) was analyzed, where the amplitude was summed up of regularly sampled intervals. A default 10 Hz low-cut frequency filter was implemented. The output RAI volume represents apparent acoustic contrast and indirectly indicates the porosities of studied rocks. Both post-stacked attributes were generated using the ‘volume attribute’ function in the PetrelTM-2019.

4. Results

4.1. Structural Setting and Sedimentation

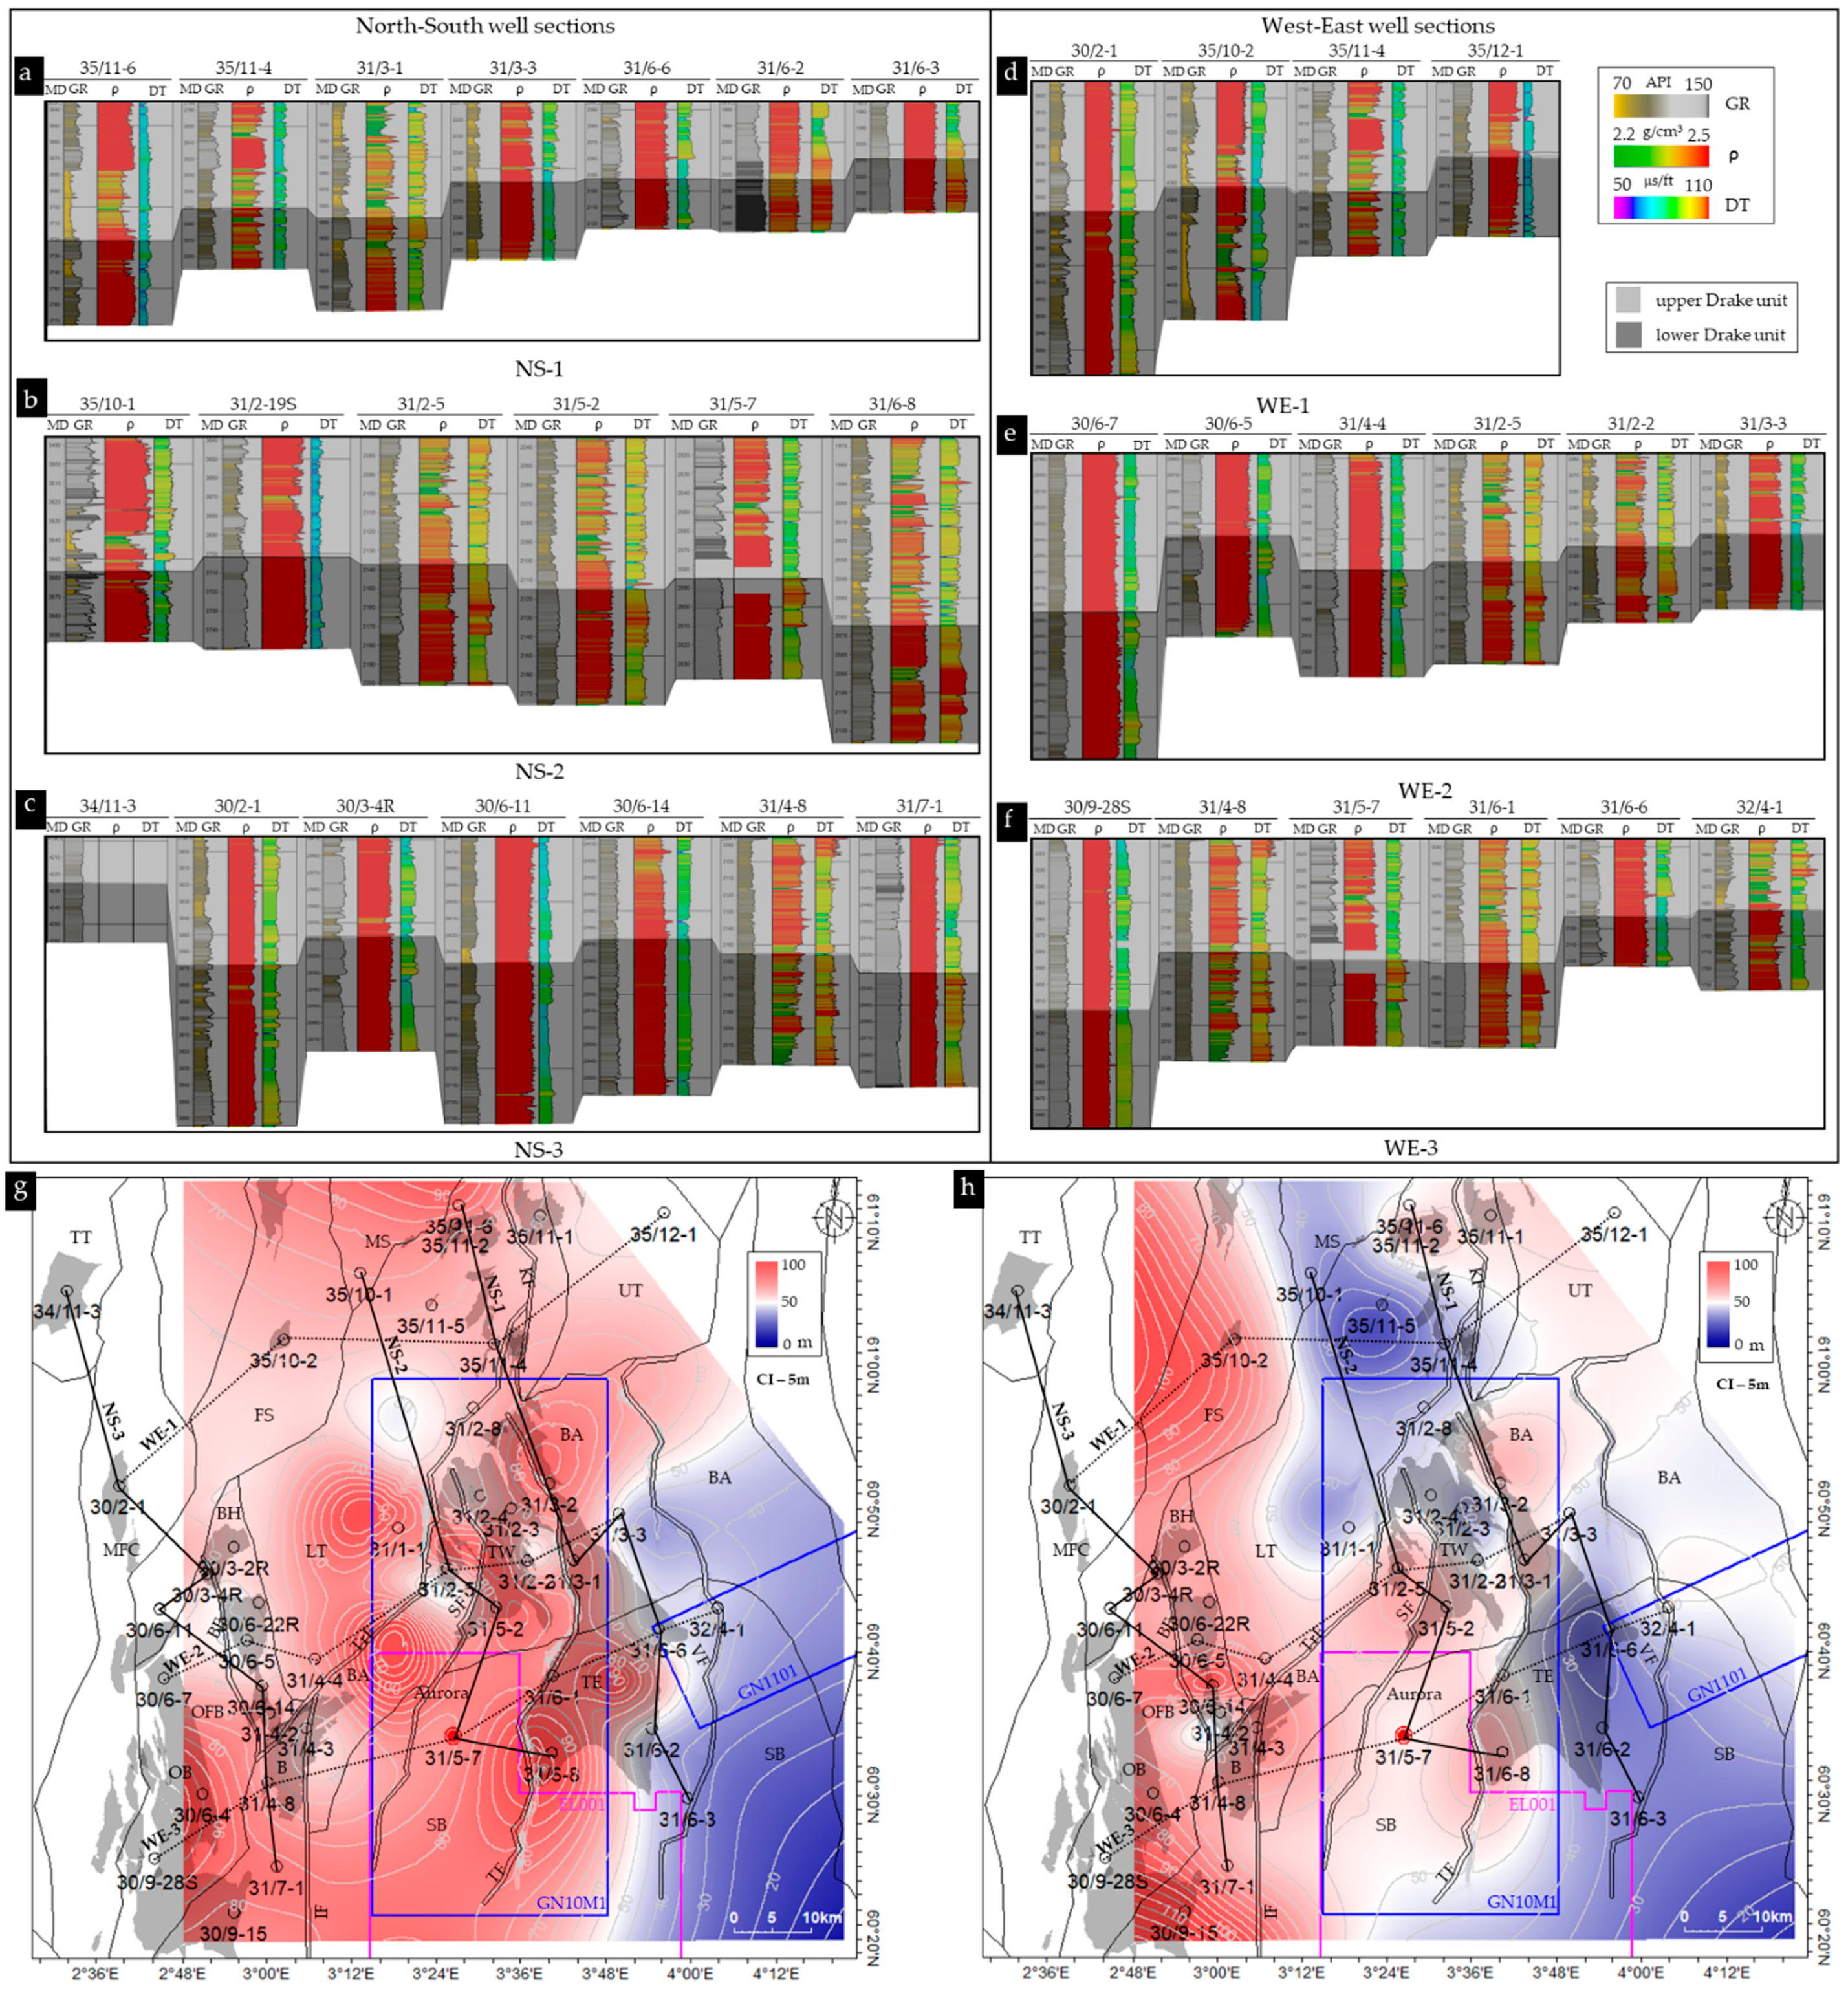
Six well correlations were generated flattened on 0 m TVDSS to evaluate the present-day structural variations within the study area (Figure 7). The correlation profiles are also shown on top of the structural maps (Figure 7g,h). Three of these profiles represent north–south sections located in the east (NS-1), middle (NS-2), and west (NS-3) of the study area. The remaining three profiles are roughly oriented east–west and cover the north (WE-1), middle (WE-2), and south (WE-3) sections. The possible structural boundaries between the wells are also demarcated based on the NPD’s [46] structural elements dataset. The southern wells of the NS-1 panel located in the Stord Basin (SB) and Bjørgvin Arch (BA) show comparatively shallow present-day burial depths. However, the wells located to the north show significantly deeper burial beyond the Nordfjord–Sogn detachment (NSD) into the Lomre terrace (LT) (Figure 7a). A similar trend is also observed in the middle (Figure 7b) and western sections (Figure 7c), where the overall deepening towards the north with several structural boundaries (i.e., major faults) is present. On the contrary, the west–east sections show increasing burial depths from east to west (Figure 7d–f). The major faults such as the Kinna fault (KF) in the north, Troll fault (TrF) in the middle, and Brage fault (BF) in the south demarcate the platform and basin areas. The influence of these major faults was observed in the east–west sections. Moreover, within the individual fault blocks in the platform area, the local depth variations are also observed at the major faults’ (i.e., Vette, Tusse, and Idunn faults) bounding blocks, which are mainly located in the Stord Basin (SB), Bjørgvin Arch (BA), and Oseberg Fault Block (OFB) (Figure 7f).
The depth structure maps of the upper and lower Drake units presented in Figure 7g,h illustrate the well correlations with structural elements and major faults in the study area. The present-day depth structure maps of the upper and lower Drake units reveal the overall lateral depth variations between the structural elements (Figure 7g,h). The depth variation ranges between 1500 m in the east to 5000 m in the northwest. As observed in the well correlations, the Troll Fault (TrF) marks the boundary between the eastern platform (i.e., Stord Basin and Bjørgvin Arch) and the western basin (i.e., Lomre Terrace), which becomes a deep basin further to the northwest. However, to the southwest, the areas of the Brage Horst (BH) and Oseberg Fault Complex (OFC) show comparatively shallower burial depths than the nearby area to the east. Furthermore, depths vary between the footwall and hanging wall sides within the major fault blocks (i.e., Vette–Tusse, Tusse–Svartlav blocks) in the Horda platform area, which is also observed in the well cross-sections (Figure 7).
The same well sections were evaluated for thickness variations between the wells and upper and lower Drake units. The correlation sections are flattened using the top upper Drake and illustrated in Figure 8. The eastern north–south section (Figure 8a) shows a gradual increase in overall thickness from south to north, where the lower Drake unit shows a similar thickness between the wells. However, the middle section (Figure 8b) shows an opposite trend with gradually decreasing thickness from south to north, but the thickness relationship between the upper and lower Drake remains the same (the overall thickness variation is related to the upper Drake unit). In the western section (Figure 8c), the thickness remains the same except in the northwestern well 34/11-3, where thickness is significantly less than the other wells. In all the east–west sections (Figure 8d–f), both upper and lower Drake thickness increase from east to west. This is expected considering sediment influx from the east and the paleo structural settings. The thickness maps (Figure 8g,h) show the detailed lateral variation of upper Drake (Figure 8g) and lower Drake (Figure 8h) units, respectively. The thicknesses range between 120 m to 10 m, where the upper Drake is thin near the sediment influx area (i.e., eastern boundary), which significantly increases to the west after crossing the Vette Fault (VF). However, a different thickness variation pattern was observed for the lower Drake unit, where the maximum thickness is observed in the west and an intermediate range of thickness persists in the NE–SW direction. Moreover, low thickness areas were detected in the Lomre Terrace (LT) and the SE part of the study area. There was no structural influence observed in the upper Drake thickness map (i.e., no thickness variation within fault blocks). However, the lower Drake unit shows thickening on the footwall side in the platform area compared to the hanging wall side (Figure 8h). Moreover, both upper and lower Drake units show a considerable thickness near the proposed CO2 injection site (near well 31/5-7).
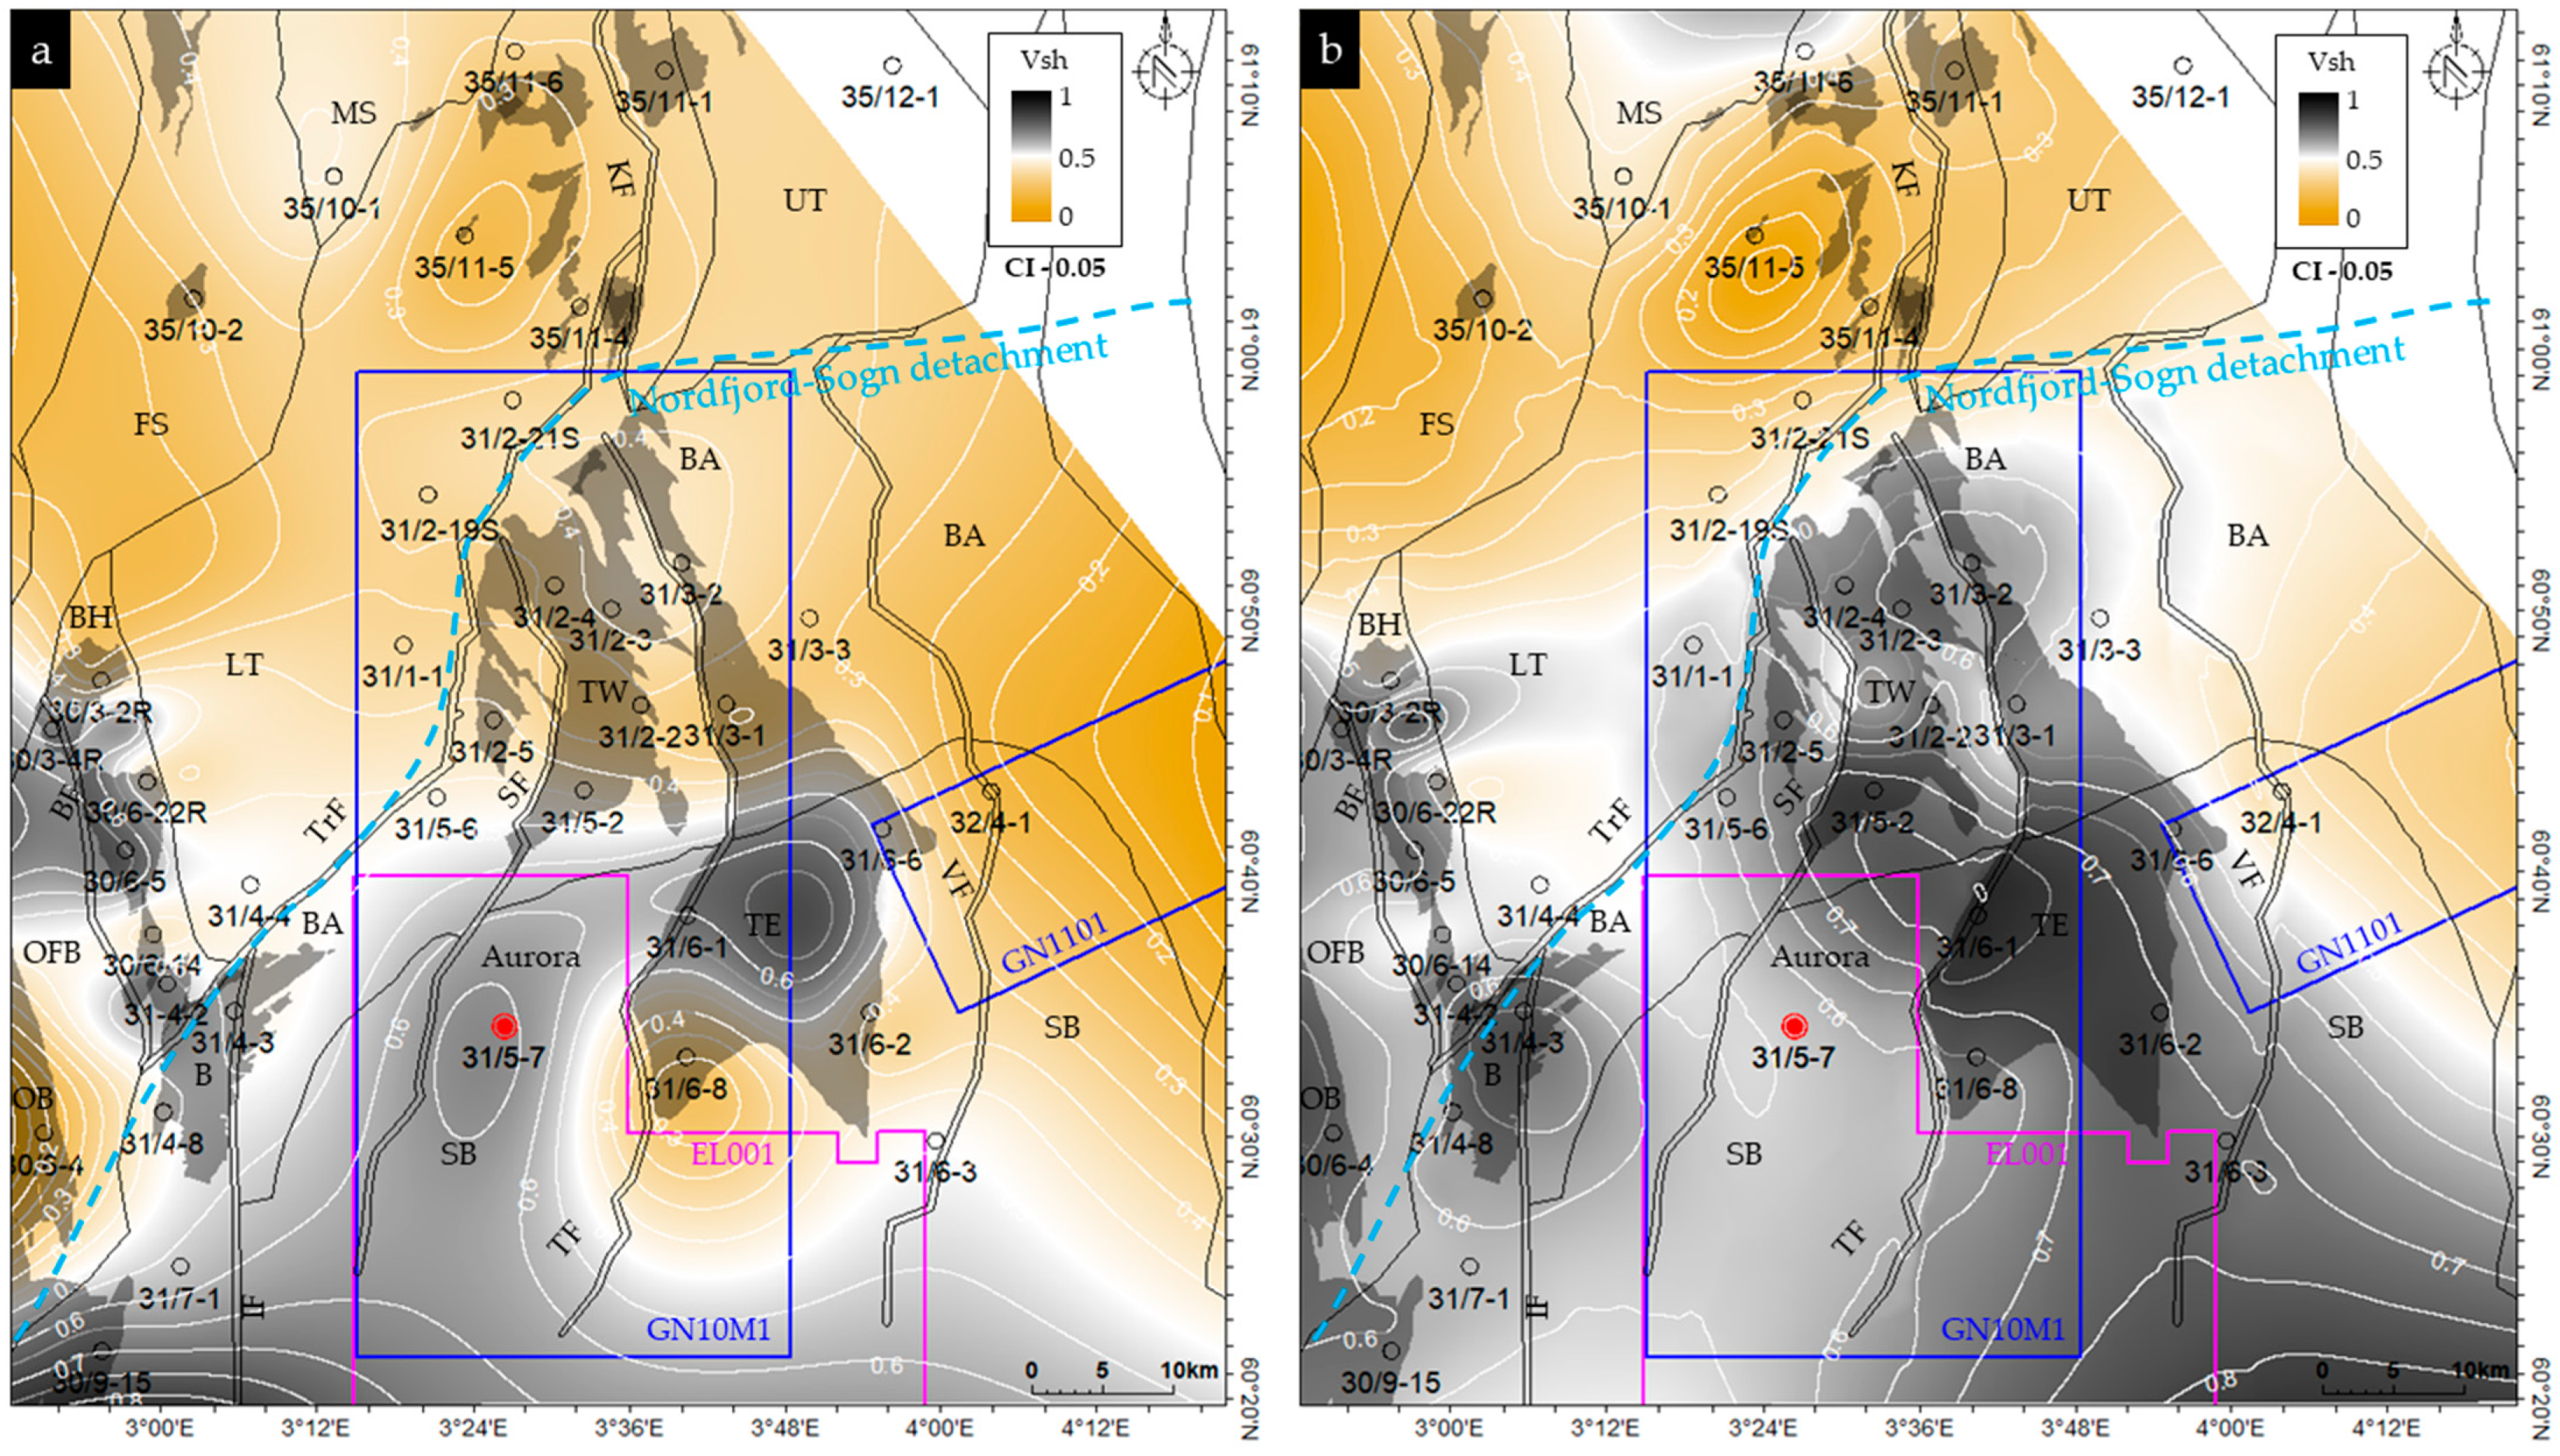
In general, a relationship between shale volume and the paleo-depositional conditions was recognized (i.e., depositional energy, sediment influx, oxic or anoxic conditions, etc.). Gamma-ray logs pick this up since clay minerals commonly contain radioactive elements such as potassium, uranium, and thorium. The normalized gamma-ray-based average shale volume maps for the upper and lower Drake units are shown in Figure 9. The average shale volumes (Vsh) in many wells are relatively low (i.e., 0.5), which is somewhat confusing, as we are evaluating caprock shale. Still, the low Vsh reflects the heterolithic nature of the Drake Formation with the presence of low GR sandstone layers in between the shale layers (Figure 8a–f). Moreover, the limitation of gamma-ray-based Vsh also needs to be considered. However, lateral high Vsh zones indicated depositional variations within the studied area. The high Vsh areas might represent deeper basins or stagnant lacustrine depositional settings resulting in high GR. Overall, the lower Drake unit is more clayey than the upper unit. Considering Vsh as a proxy for paleo-water depth, during lower Drake deposition, the Horda platform (HP), south Lomre Terrace (LT), Brage Horst (BH), and Oseberg Fault Complex (OFB) area might have deep water conditions with little water circulation. A very high Vsh zone is seen in the deepest part of the basin near the Troll field. Similar depositional conditions remained in this part also during the deposition of the upper Drake unit. However, this deeper depositional area was getting smaller, and coarser particles might be depositing nearby (Figure 9a). A detailed paleo-depositional study needs to be conducted to confirm these differences between the upper and lower Drake deposition, but this is out of the scope of the current study. In addition, the northern part of the studied area illustrated low shale volume, indicating high coarser grains compared to the southern part.

4.2. Exhumation and Diagenesis

Uplift and erosion can significantly influence diagenesis because estimating exhumation reveals the paleo depth and temperature experienced by the studied rock intervals. Due to the several rifting events, the studied area has been considerably impacted by erosion and upliftment, which needs to be evaluated to better understand the caprock properties. The exhumation map reveals that the studied area uplifted as high as 1400 m in the east, which gradually decreased towards the west (Figure 10). Comparing the Horda Platform with the other sub-basins (e.g., LM, BH, FS, OFB, MS, etc.), HP shows significantly higher upliftment than its basinal counterparts. However, within the HP, minor variations were observed between different fault segments. Especially the block with the proposed injection well (31/5-7) shows quite a variation in uplift that ranges between 100 and 400 m. The bottom hole temperature (BHT) based temperature gradient also varied within the area. The gradient trends do not follow the structural boundaries (faults); instead, they are undulating (Figure 10b).
The temperature gradient ranges between 40 and 30 °C per kilometer within the study areas. Low-temperature gradients are observed on top of the major oil/gas fields (i.e., Troll and Brage), while the surrounding areas show higher gradients. Present and paleo-temperatures on top of the Drake Formation were evaluated by combining the exhumation and temperature gradient information. Figure 10c,d show an example of the present and paleo-temperatures on top of the lower Drake unit. The present-day temperature reveals that the eastern fault block, a structural high, shows low temperatures. Moreover, based on the temperature gradient estimated using Equation (1), the temperatures on top of the major oil/gas fields are low compared to the other areas within the same fault blocks. These areas at the present day are within the mechanical compaction (MC) zone. Restoring the exhumation, the paleo-temperature experienced by the lower Drake caprock shales shows that only the areas close to the Troll and Brage fields have remained within the MC zone through time (assuming 75 °C as the transition temperature). In contrast, the lower Drake unit within the rest of the study area was in the temperature window within the chemical compaction (CC) zone (Figure 10d).

4.3. Caprock Properties

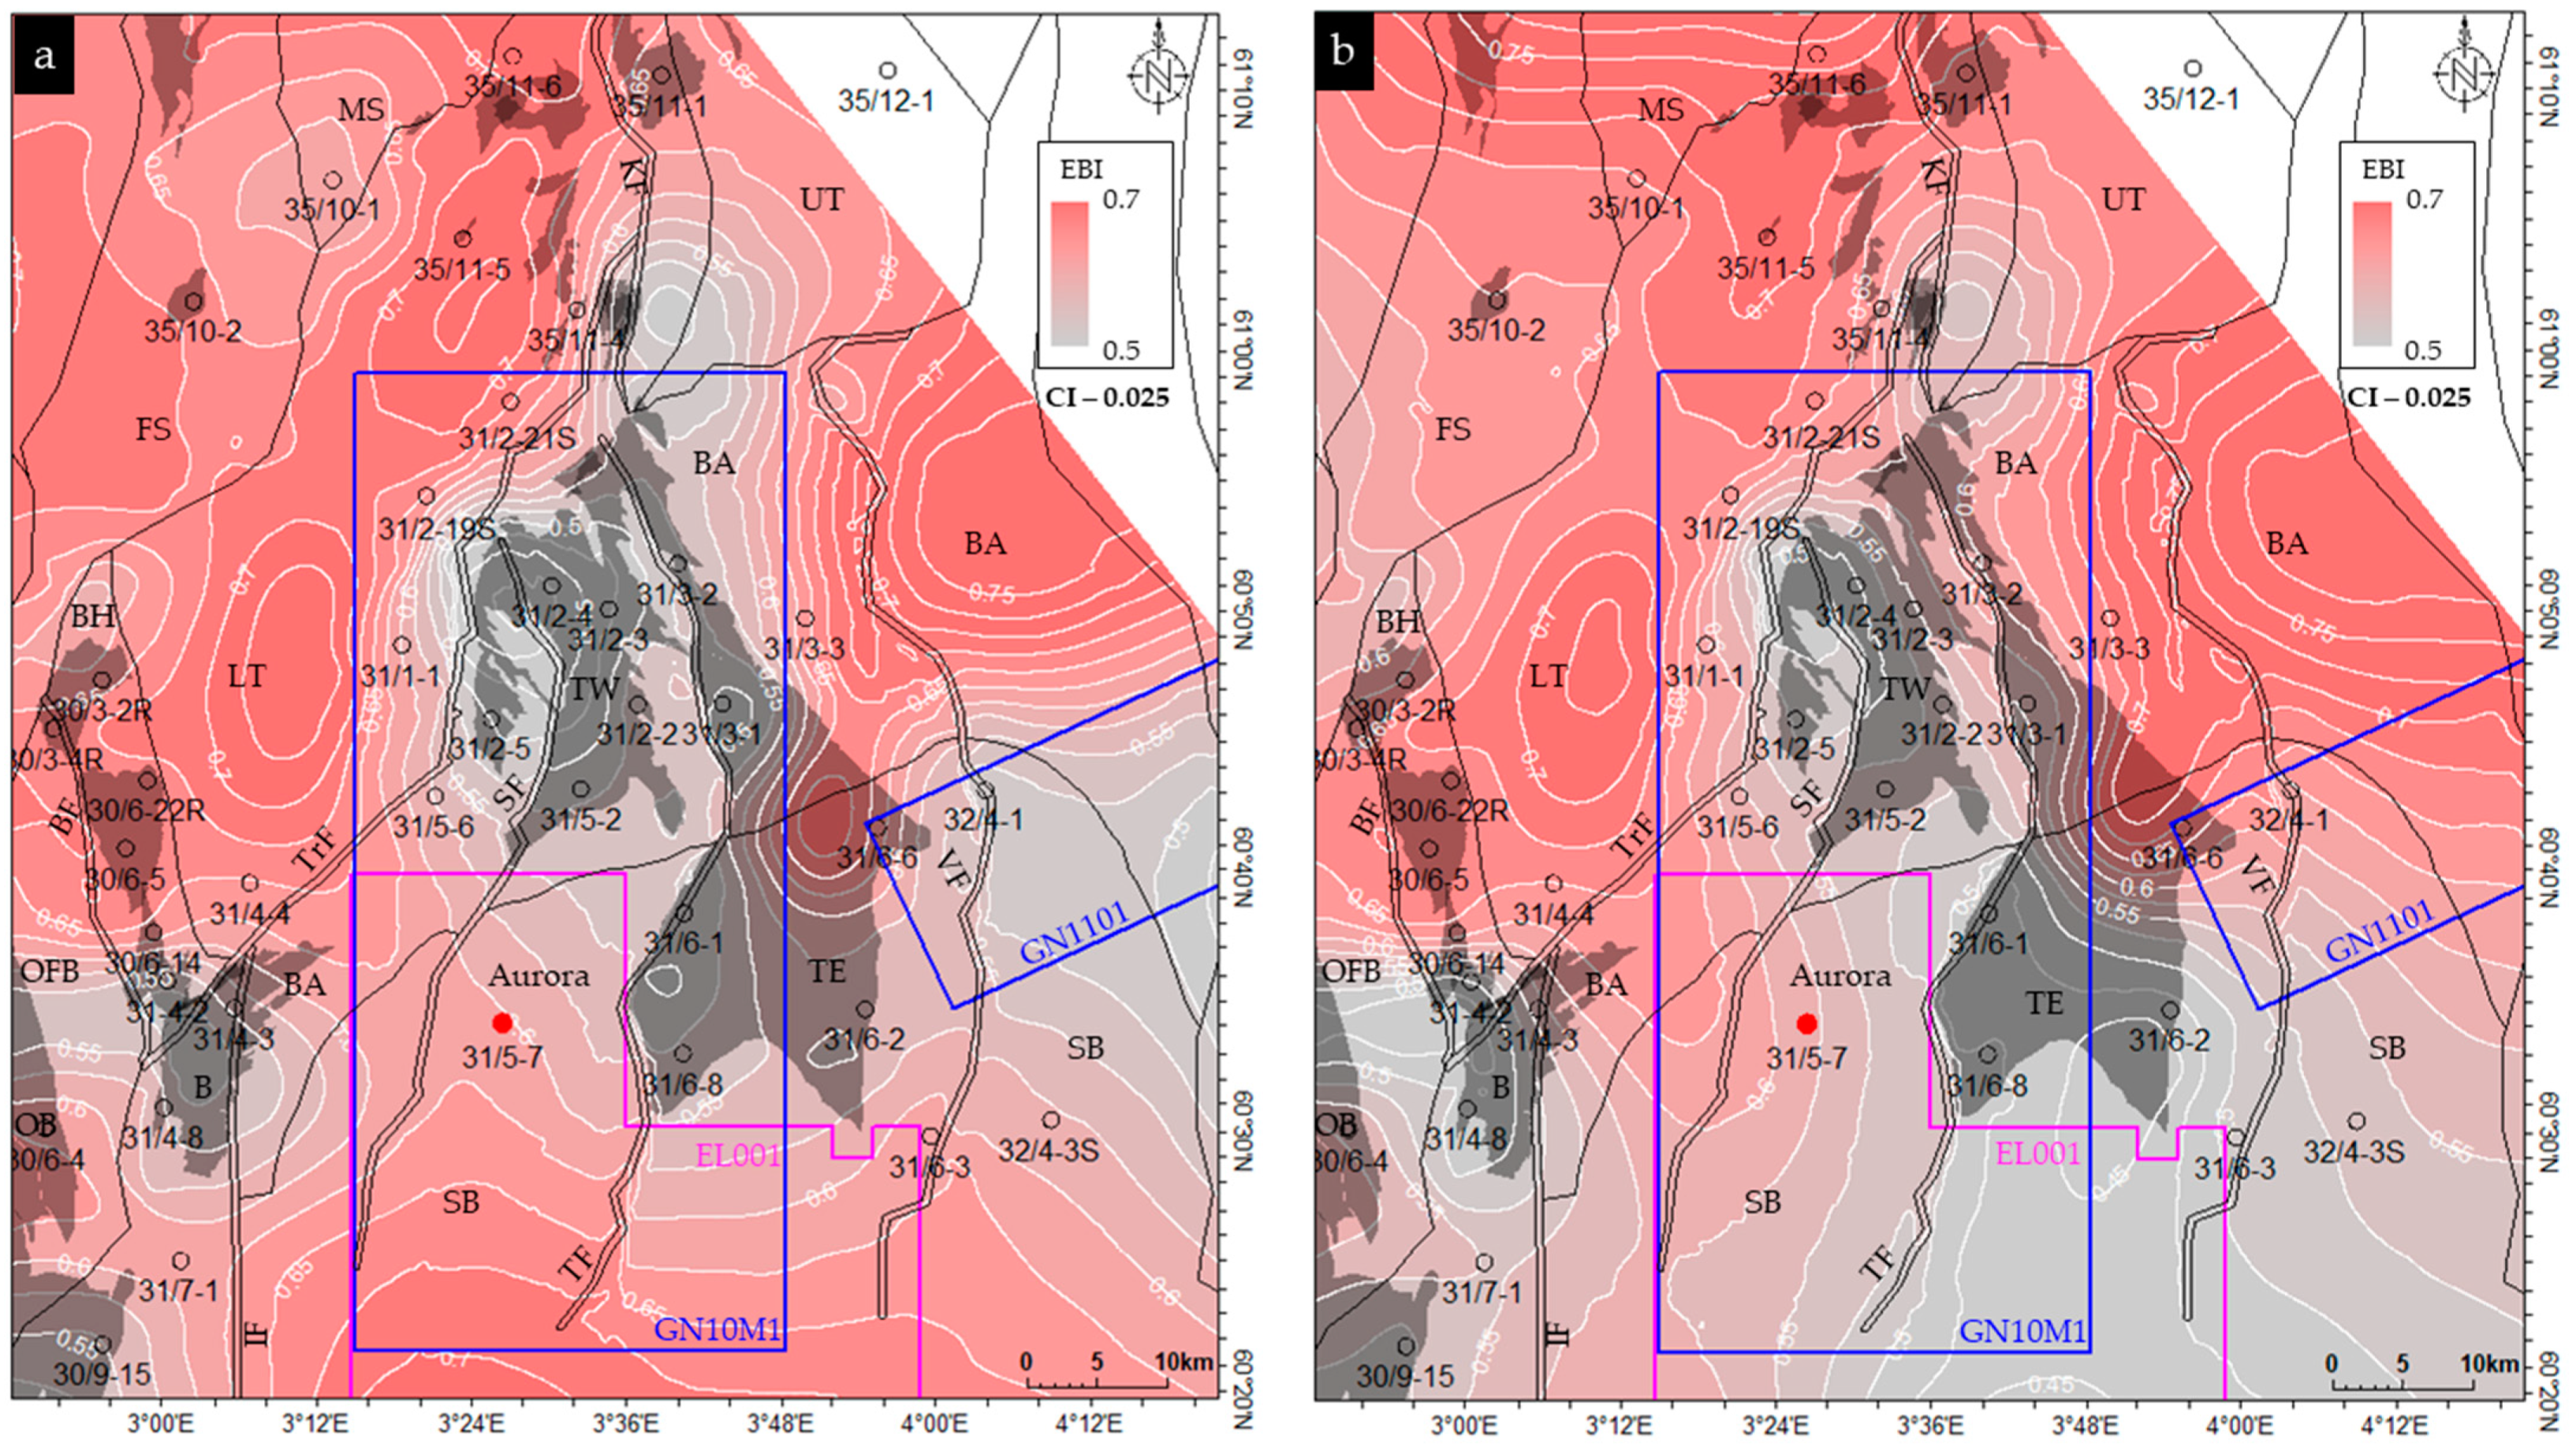
The lateral variation of the average mechanical properties (i.e., brittleness indices) of caprock shale was evaluated (Figure 11). Rock brittleness indices values can indicate the mechanical behavior of caprock shale under stress conditions. For instance, a ductile caprock can absorb the additional stresses, and deformation becomes more diffused, while brittle caprock might generate fractures with the same amount of stress applied (Figure 1). Comparatively, a softer (lower brittleness indices value) Drake Formation (both upper and lower units) was found around the gas fields (i.e., Troll, Brage, and Oseberg). Moreover, the lower Drake unit in the southeastern part of the study area shows a relatively ductile property. However, in the lower unit near the proposed CO2 injection well location (i.e., 31/5-7), the caprock was stiffer compared to the other areas within the CCS exploitation license EL001. In addition, the basinal part (north and northwest) and northeast part of the study areas have high brittleness indices (BI) values in both upper and lower Drake caprock shale units.

4.3.1. Depositional Variation

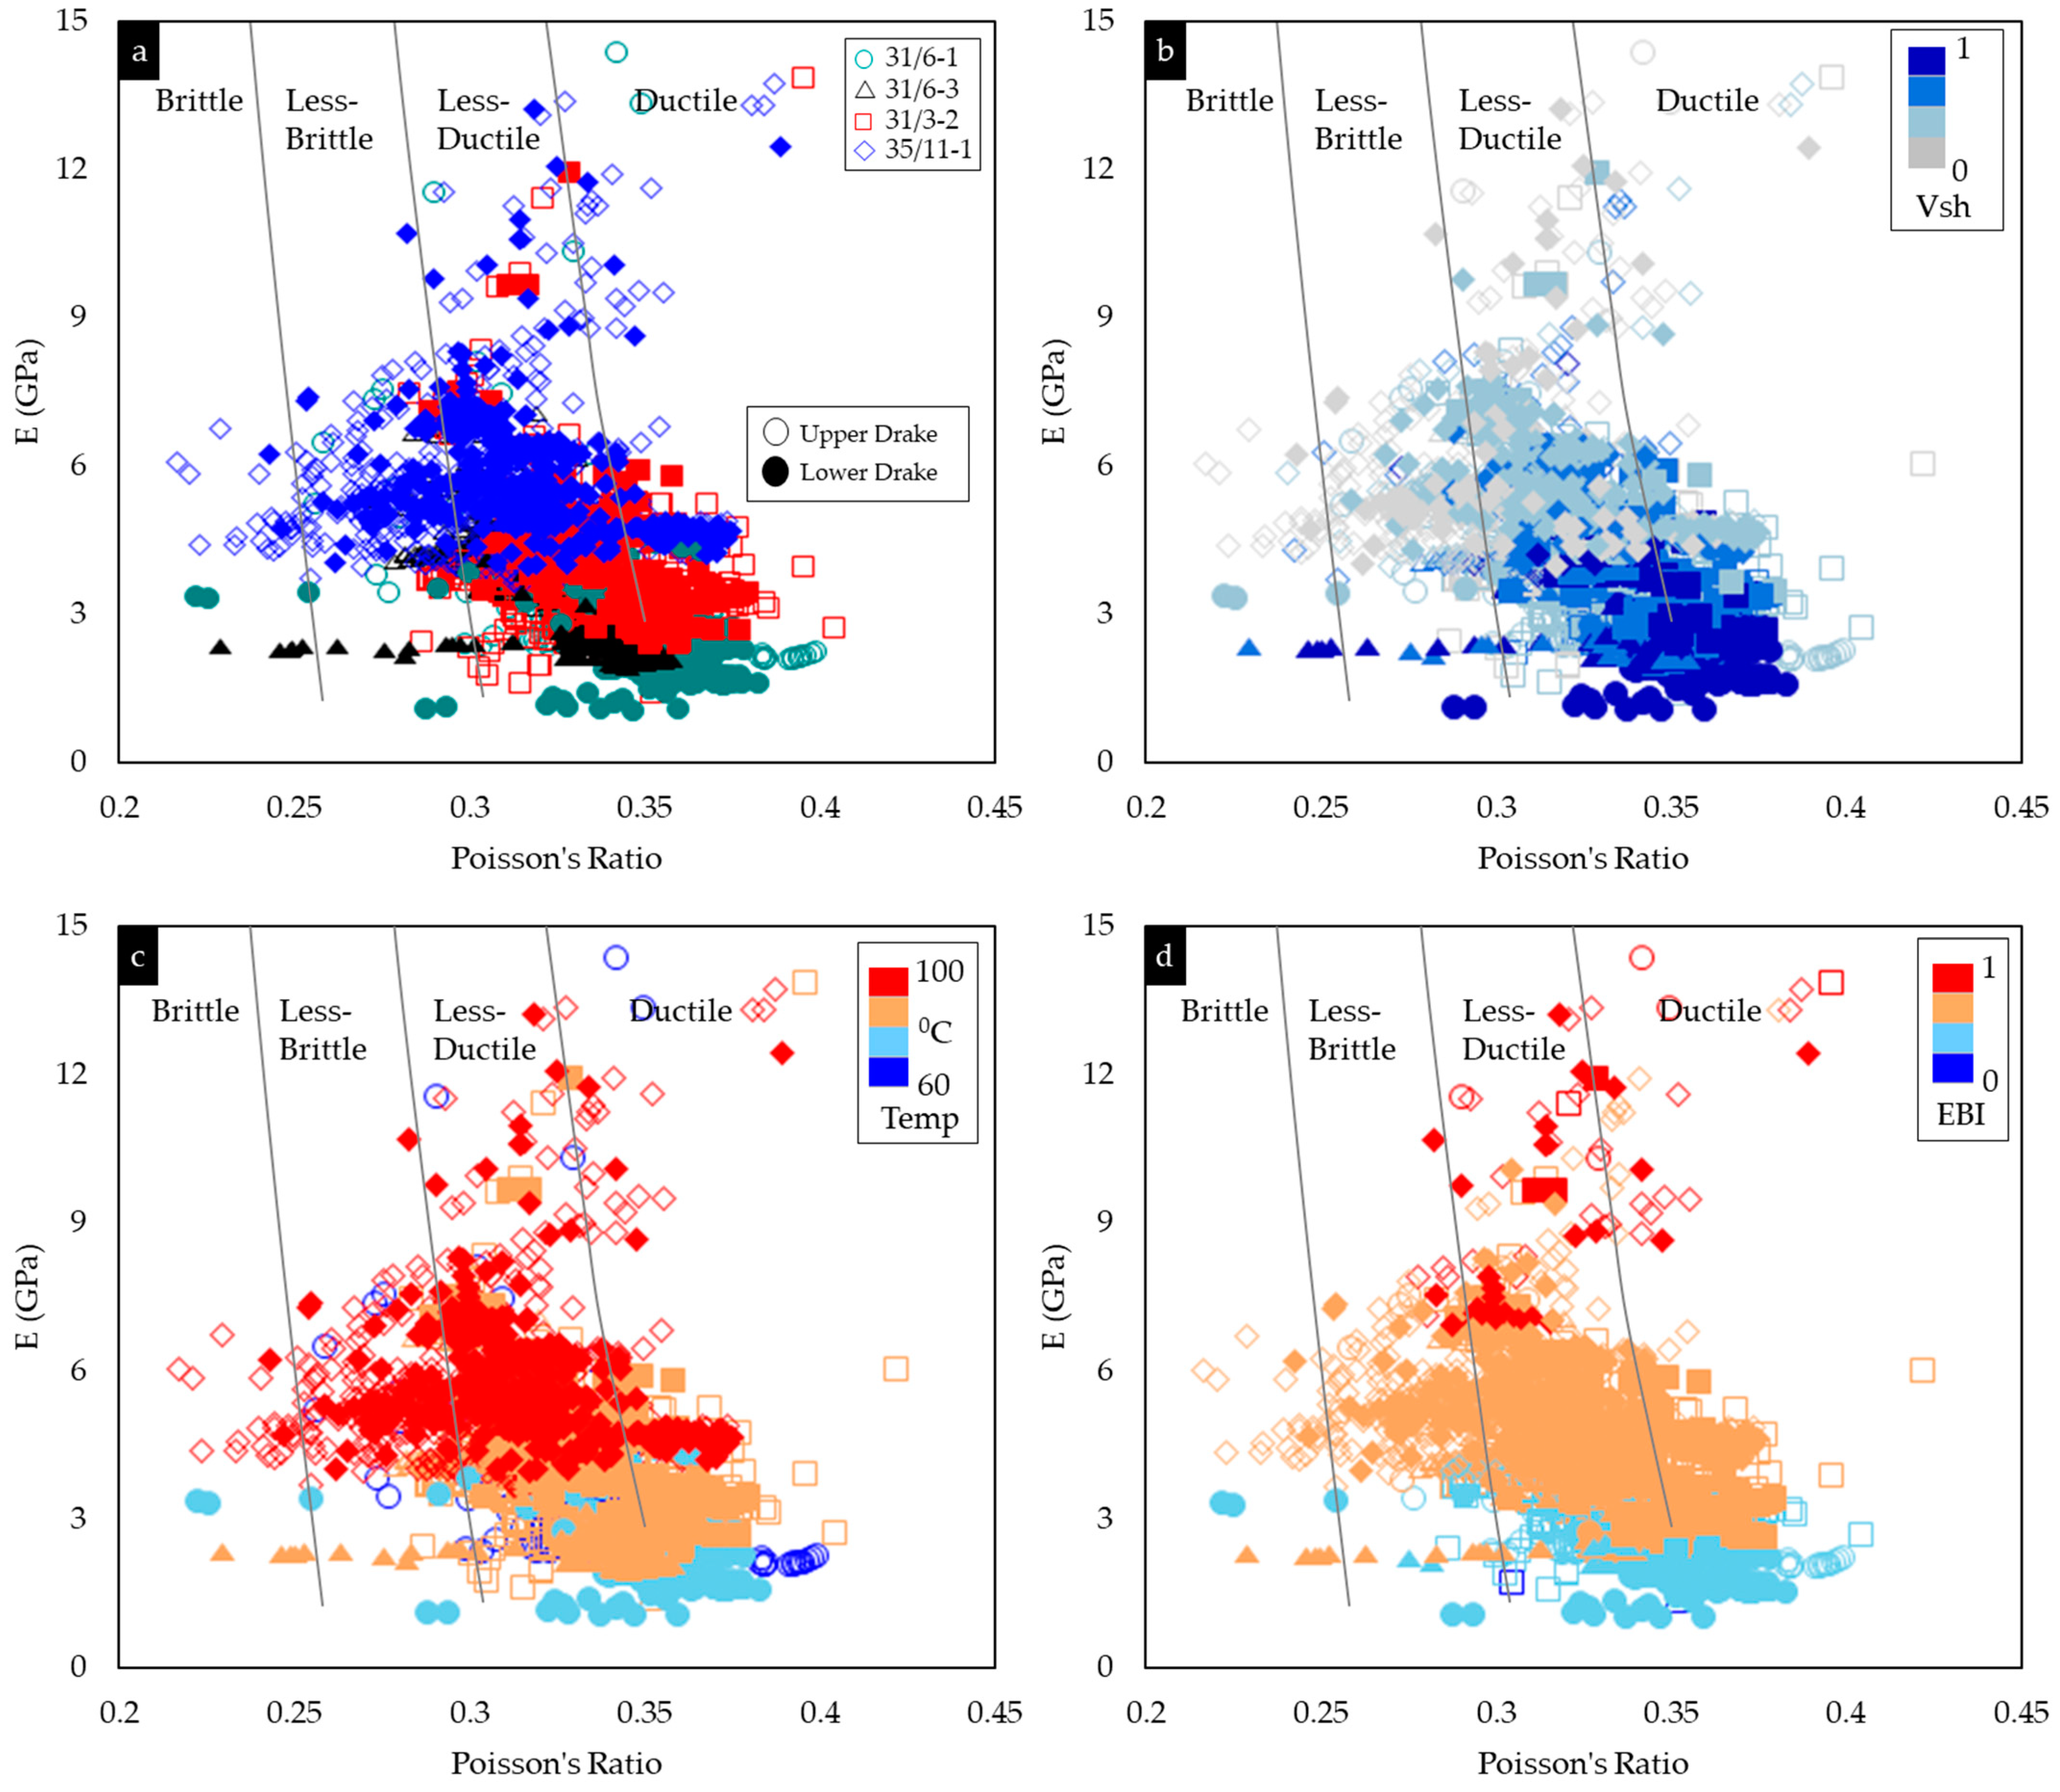
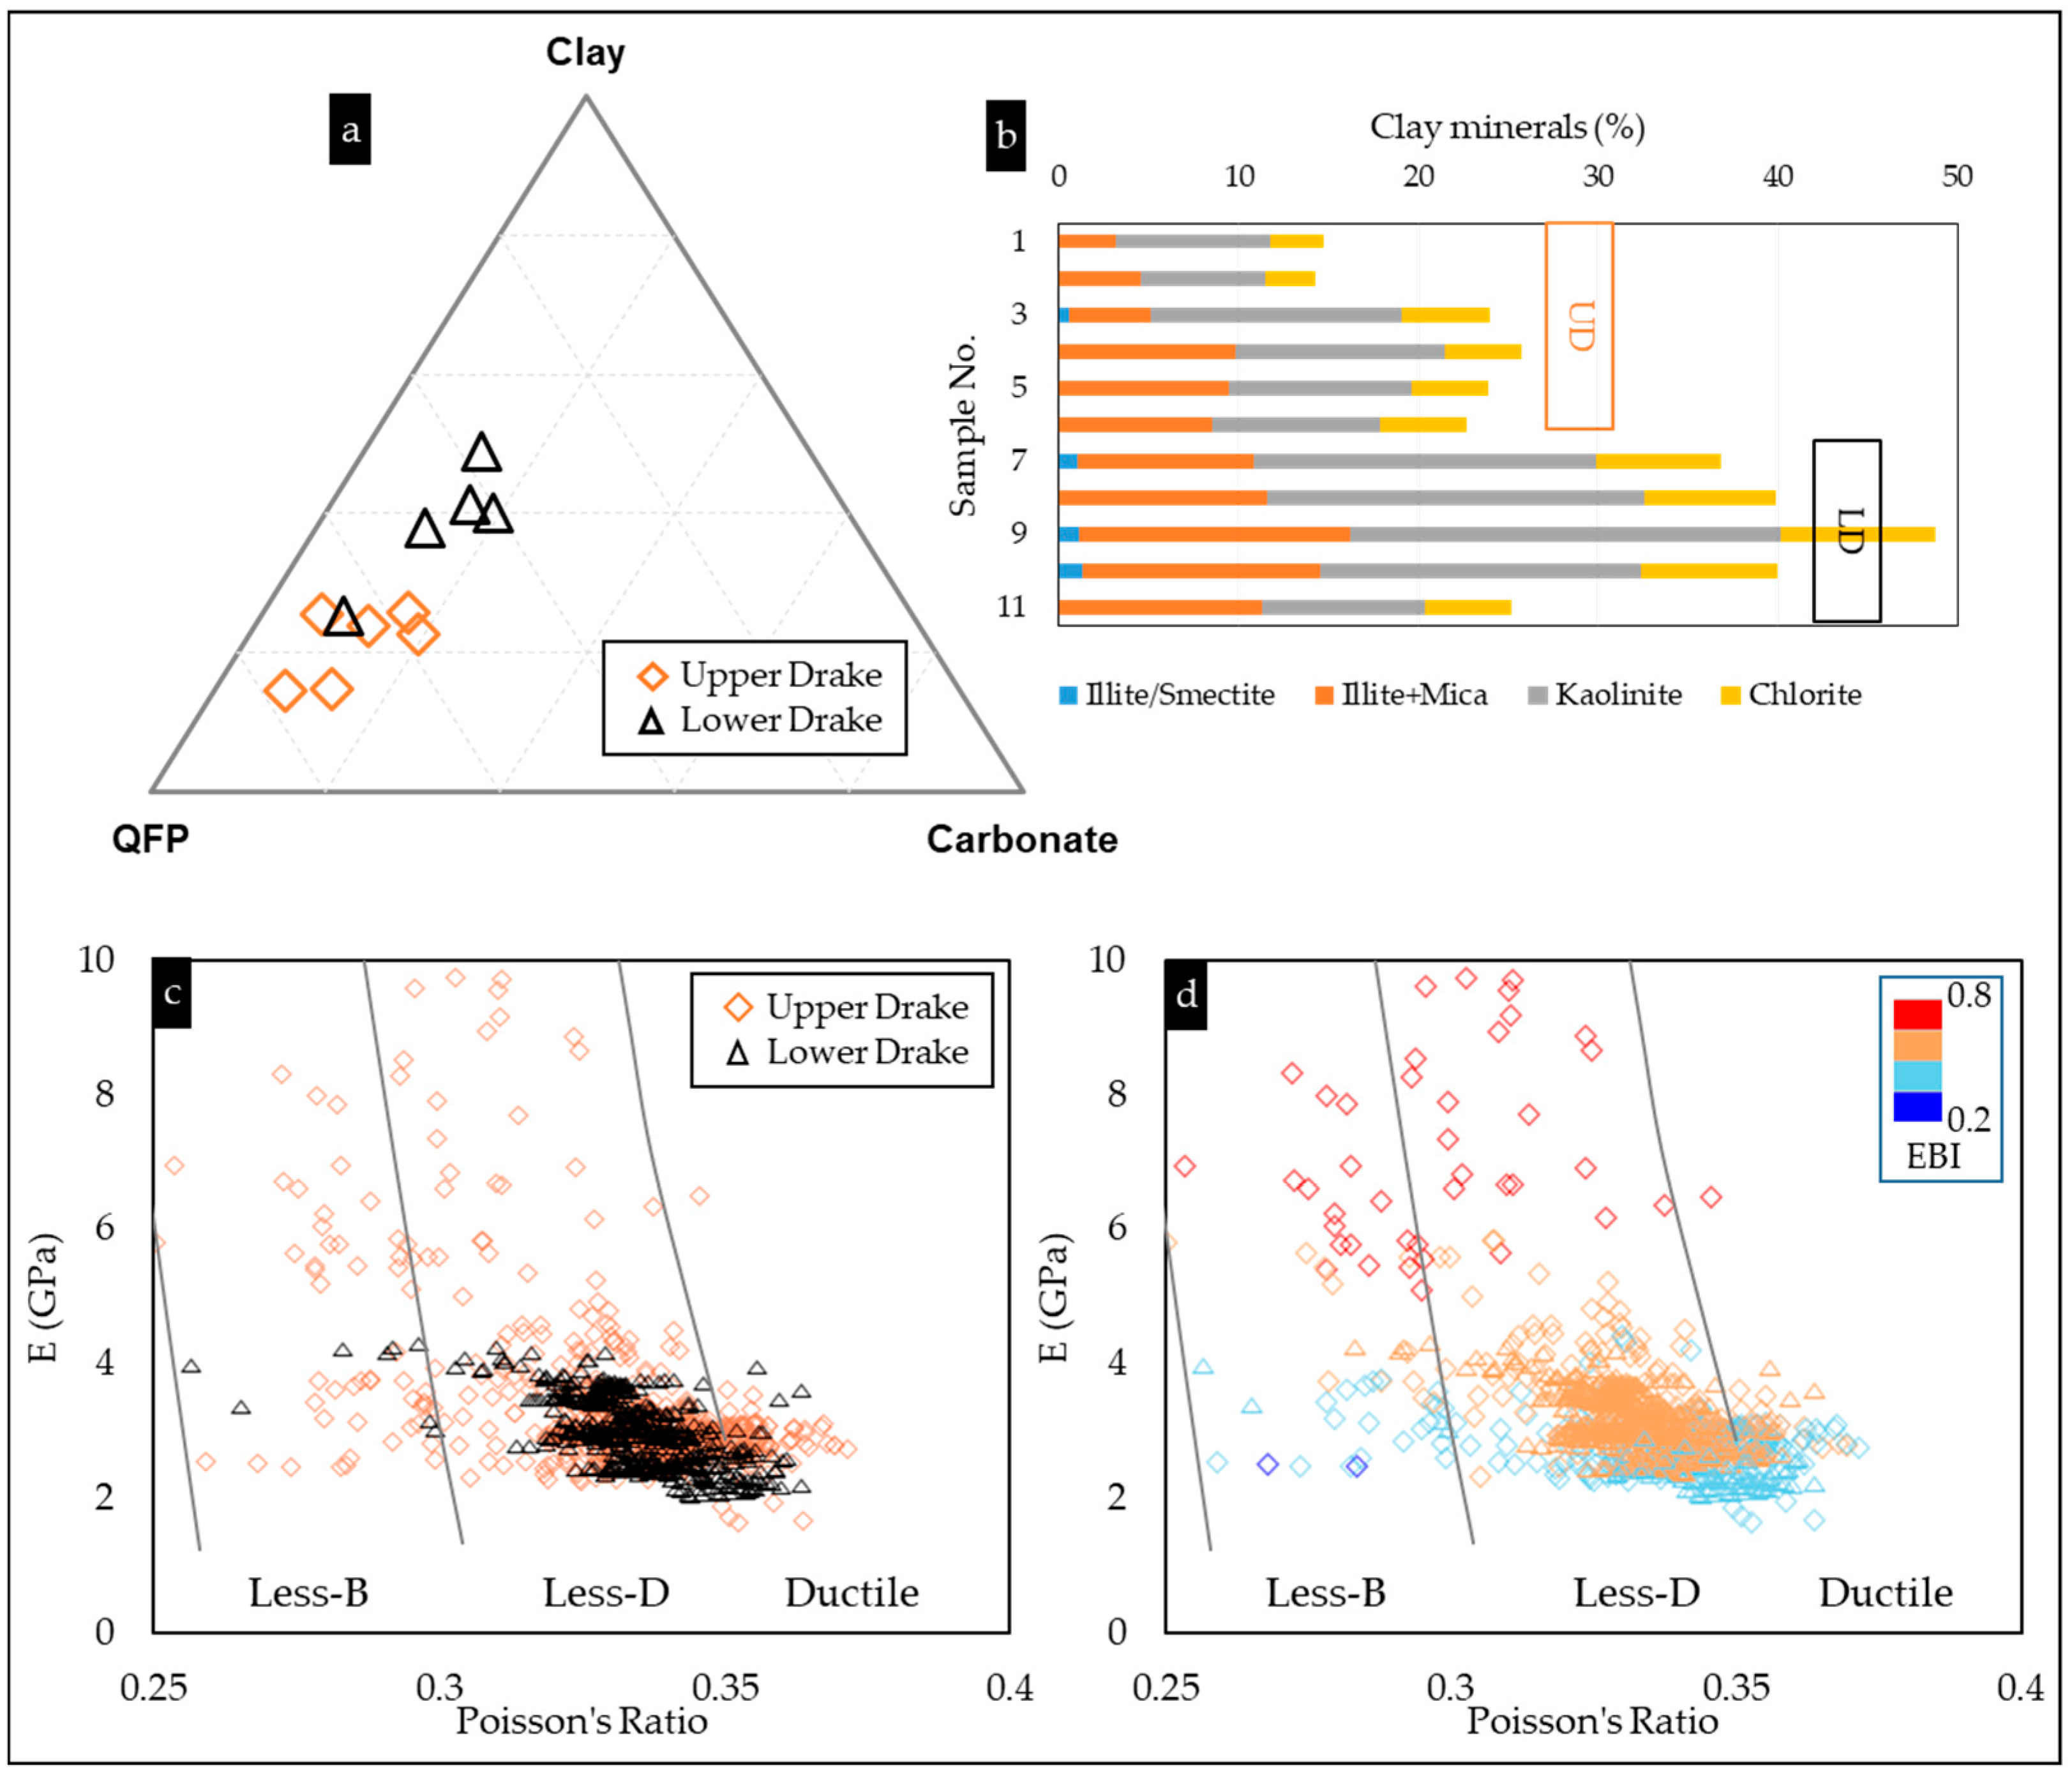
In order to evaluate the influence of depositional effects on caprock properties, the data from four wells plotted in Figure 6a were analyzed. The wells are located in the north of the study area in Uer Terrace (35/11-1), Bjørgvin Arch (31/3-2), and Stord Basin (31/6-1 and 31/6-3) (Figure 4). Moreover, wells 31/3-2, 31/6-1, and 31/6-3 are located within the same fault block (the Vette–Tusse fault block), while 35/11-1 is from the northern part of the study area. As shown in Figure 6a, distinct differences are evident, as wells 31/6-1 and 31/6-3 have higher uranium content than wells 31/3-2 and 35/11-1. The static Young’s modulus (E) and Poisson’s ratio (PR) plots also reveal that the wells 31/6-1 and 31/6-3 have lower E and higher PR compared with 35/11-1, while 31/3-2 plotted in between (Figure 12a). Moreover, the volume of shale (Vsh) is high in the higher-uranium-content wells compared to the others (Figure 12b). However, the paleo temperature experienced by the studied wells illustrated the influence of diagenetic processes on caprock geomechanical properties (Figure 12c). This diagenesis effect (higher E and lower PR with increasing temperature) is also revealed in the EBI plot, where the overlapped data points from the wells 31/3-2 and 31/6-1 illustrated that the higher temperature in well 31/3-2 indicated higher EBI and vice versa, despite the E and PR values having the same range. In addition, comparing the upper and lower Drake units within the studied wells, no separate clusters were observed. Based on EBI, most of the data points fall within the less-brittle to less-ductile zone (Figure 12d), while according to the Perez and Marfurt (2014) template, the Drake caprock shales are within the ductile to less brittle zones (Figure 12d). In both methods, qualitatively, a small number of data points fall within the brittle zone, which might be due to the carbonate strings present within the studied caprocks.

4.3.2. Diagenetic Effect

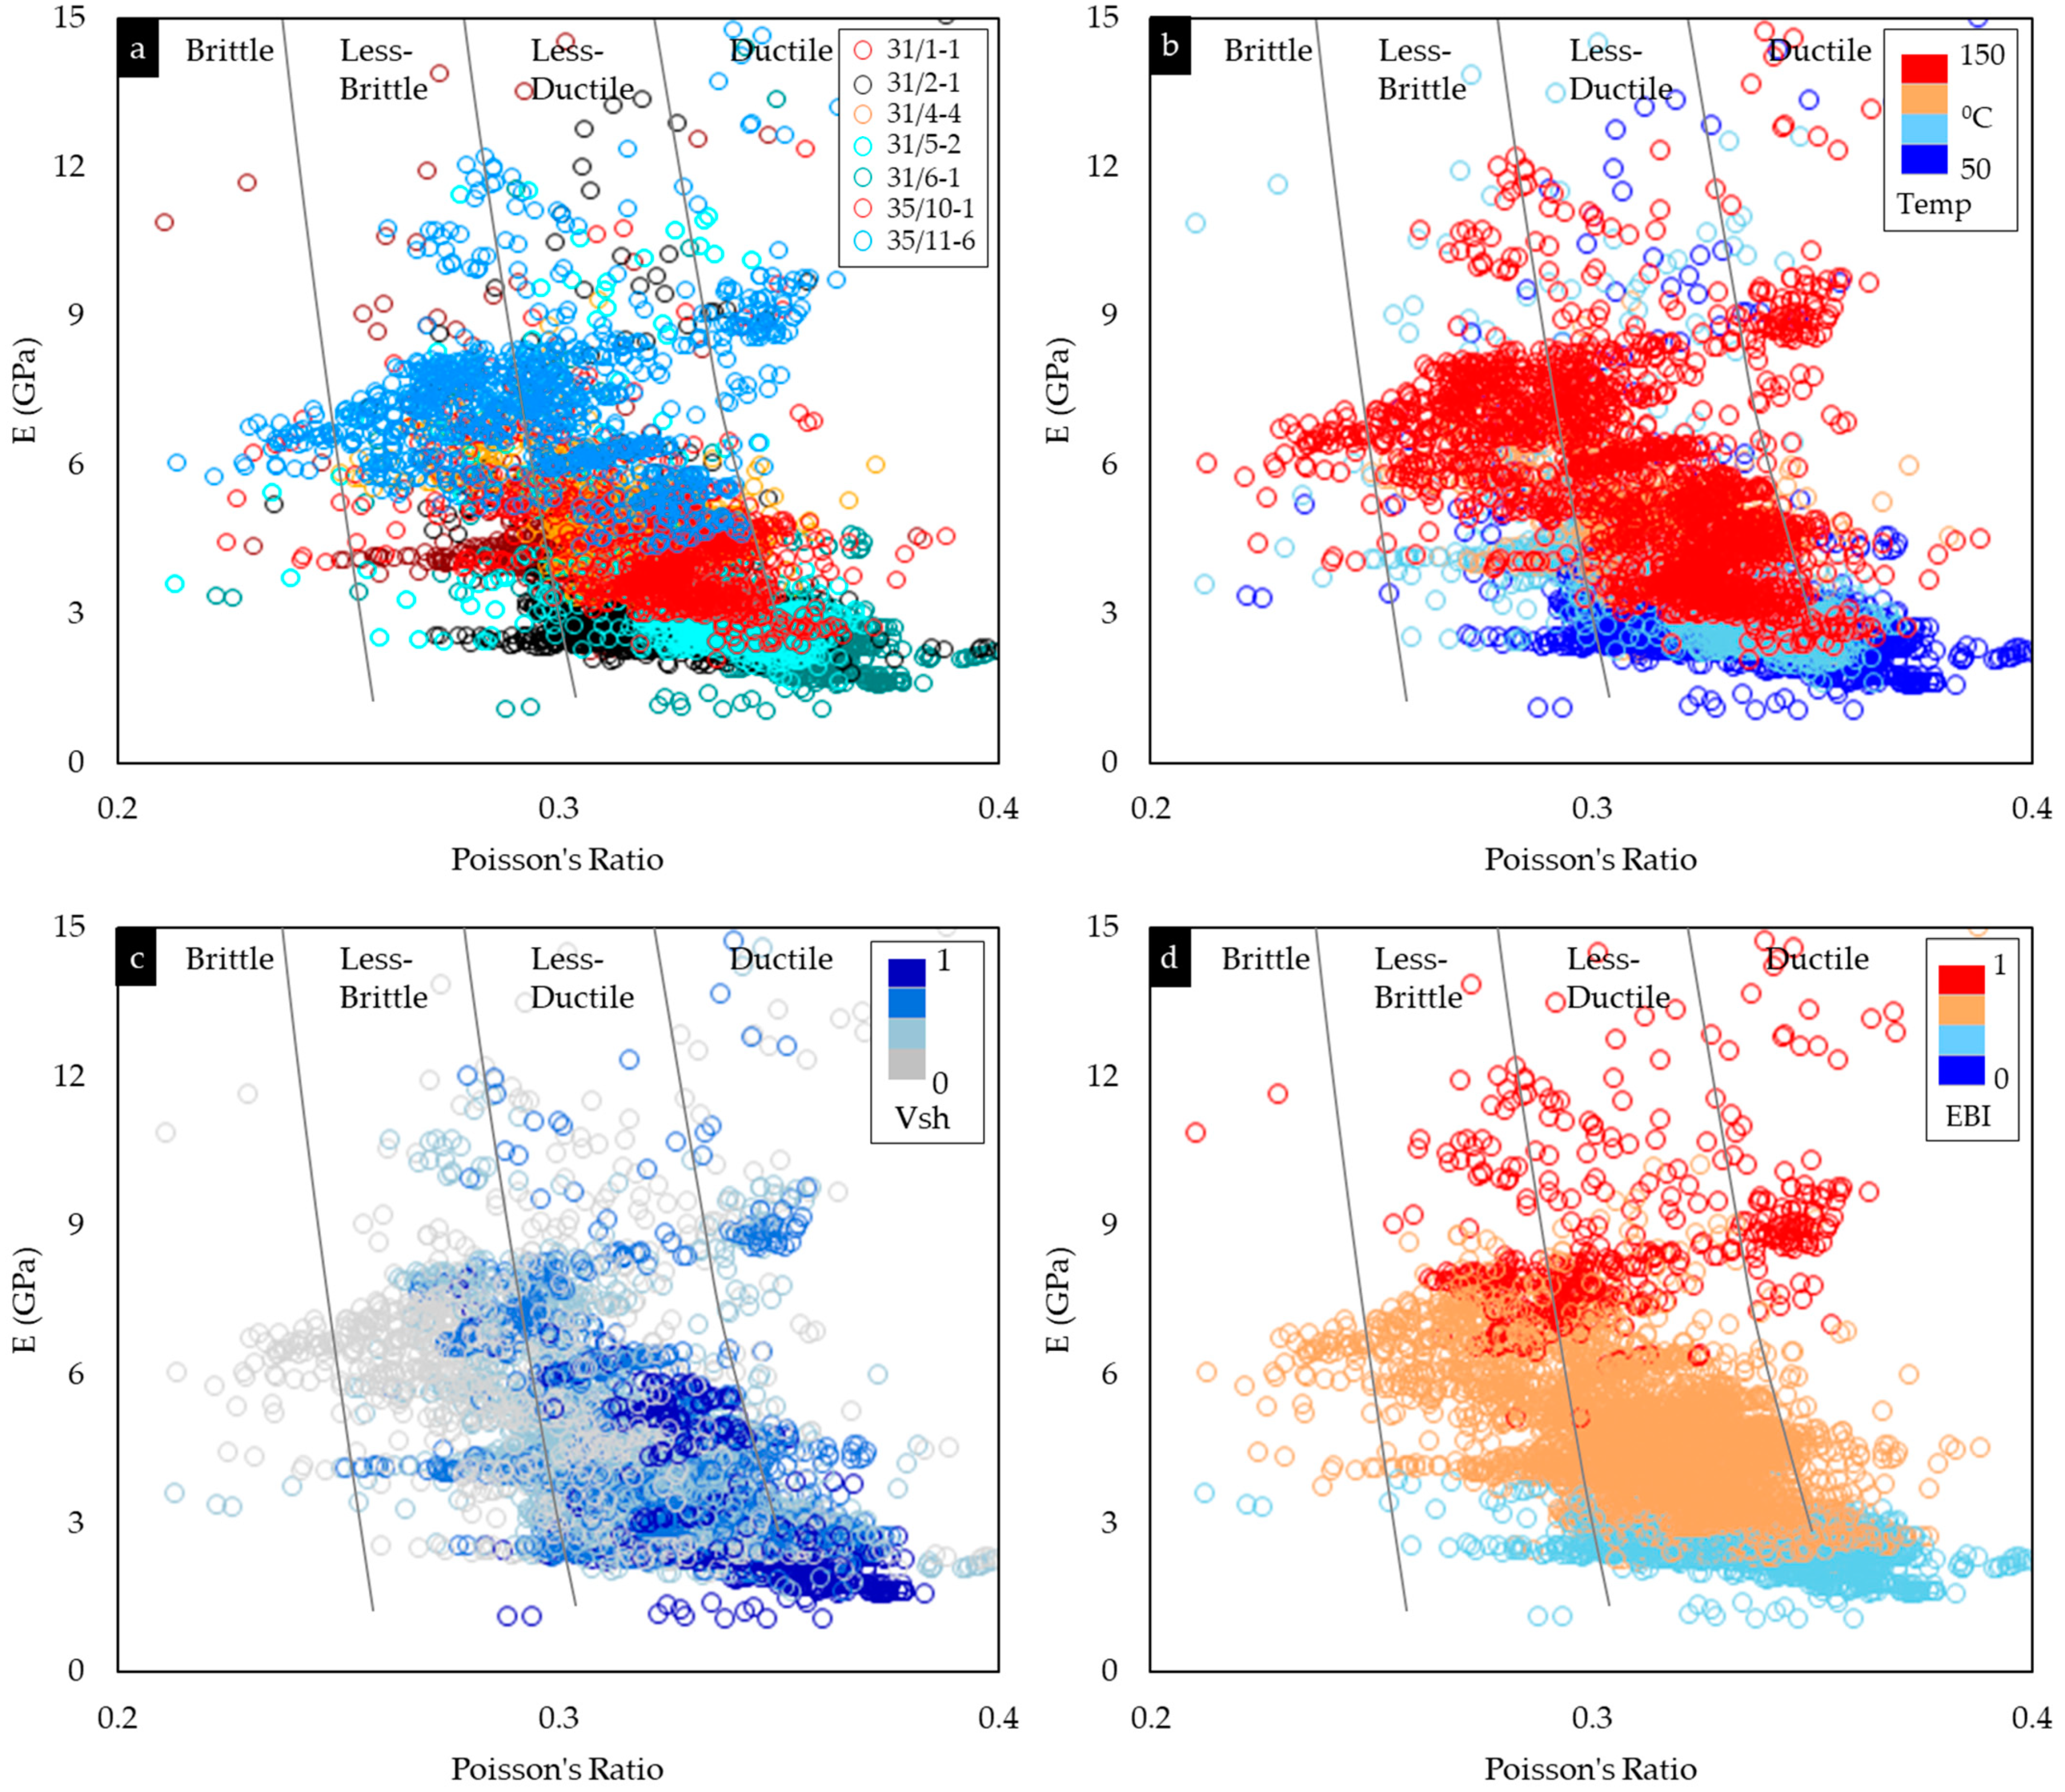
To evaluate the diagenetic influence on the Drake Formation, seven wells of the Drake Formation buried in different depths were analyzed (Figure 13a). A distinct gradient indicates an increasing paleo-temperature experienced by the caprock (Figure 13b). The mechanically compacted (MC) wells (31/2-1, 31/5-2 and 31/6-1) show a low gradient with a significant decrease in Poisson’s ratio (PR) and a gentle increase in Young’s modulus (E). On the contrary, the wells with chemical compaction (31/1-1, 31/4-4, 35/10-1, and 35/11-6) show a different trend with a significant increase in E and a gentle decrease in PR. The brittleness indices (BI) estimated using EBI (Figure 13d) also illustrate this separation between the MC and CC regimes. The MC data points show ductile to less-ductile behavior compared to less brittle to brittle behaviour in the CC wells (Figure 13d).

4.3.3. Seismic Data Analysis

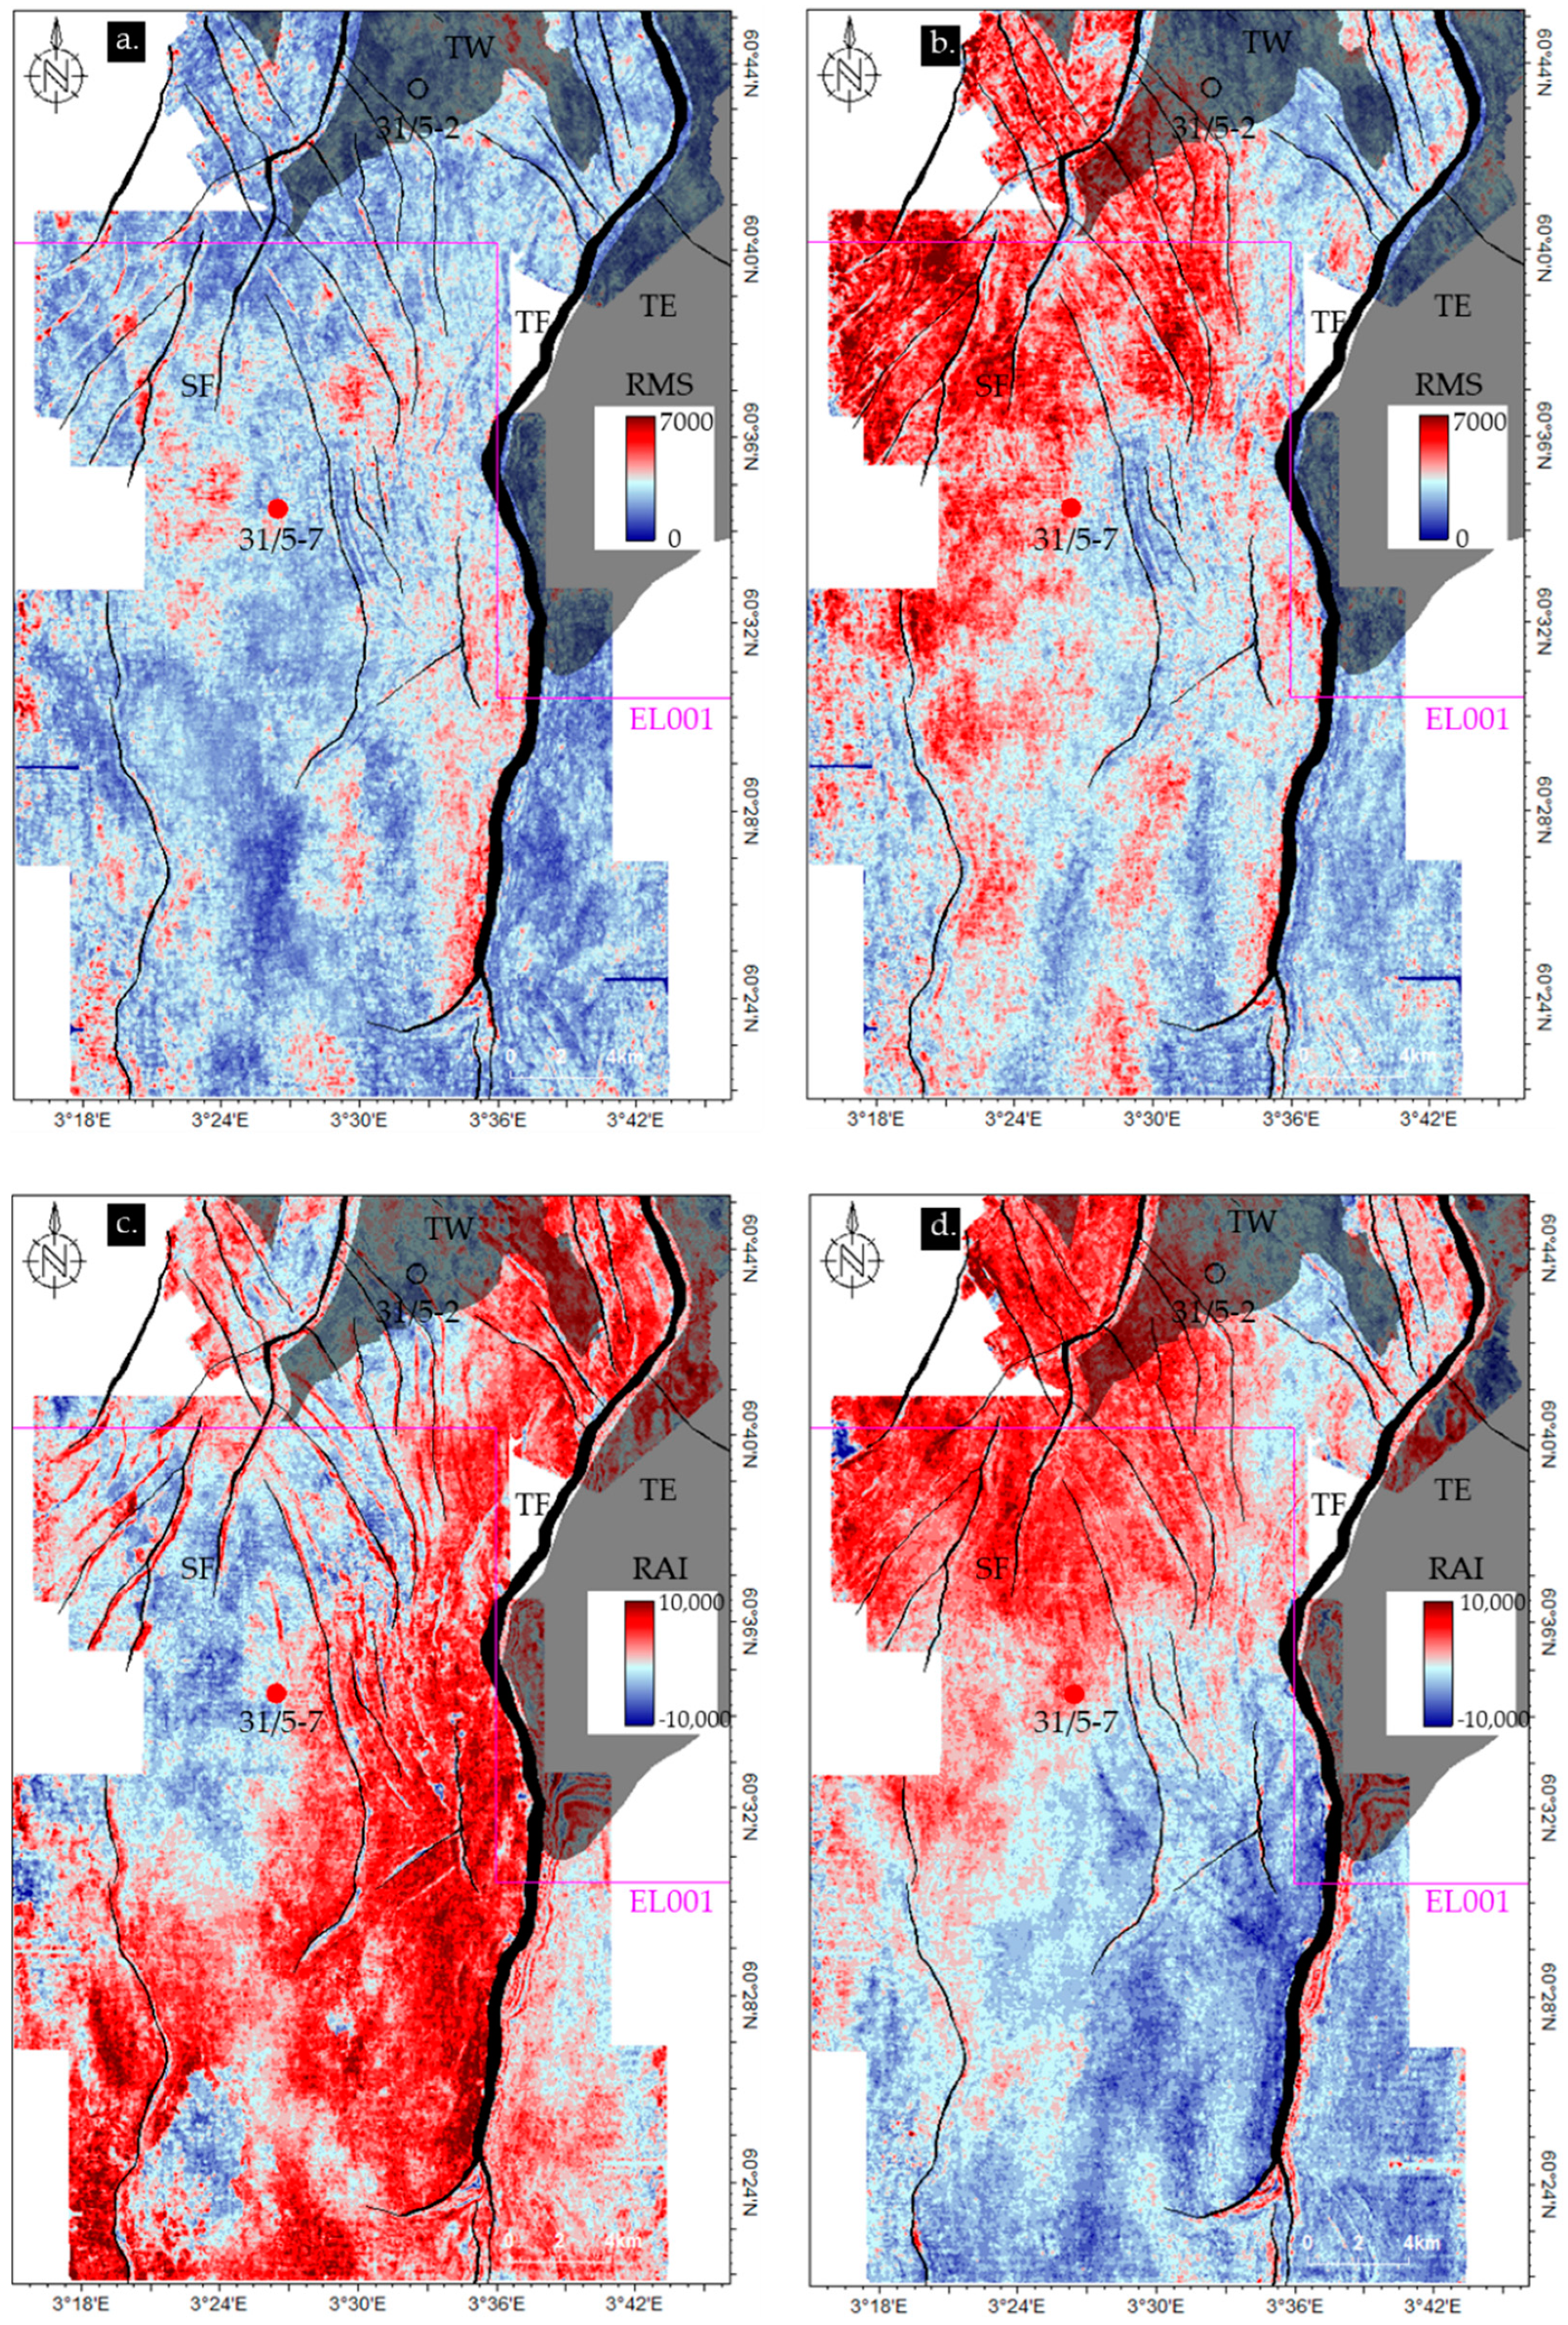
In this section, 3D seismic pre-stack inversion and post-stack attributes were analyzed. The main objective was to assess caprock properties near the Aurora injection site; hence, the 3D cube GN10M1 was cropped, focusing mainly near well 31/5-7 (Figure 14a). There are several major (i.e., TF and SF) and minor faults present in this area. The northern boundary of the CCS license (EL001) and part of Troll fields (i.e., TE and TW) are also shown in the studied cropped sections. Seismic properties were extracted on top of the seismic-interpreted surfaces. An example of interpreted horizons on full-stacked seismic sections near the 31/5-7 well is illustrated in Figure 14b. Surfaces in the middle of the upper and lower Drake units were considered representative horizons for property extraction. The variation of gamma-ray (GR) and P-wave velocity (Vp) between formations in 31/5-7 is also demonstrated. The display of the pre-stack inverted volume of shale (Vsh) property using the same seismic section reveals the vertical and lateral Vsh changes near well 31/5-7 (Figure 14c). The difference in shaliness between the UD and LD is visible in this section, where the LD possesses considerably higher Vsh than the UD. A detailed analysis of caprock seismic properties is presented in the sub-sections:

Seismic Inverted Properties

Lateral distribution of the volume of shale (Vsh) and elastic brittleness indices (EBI) were assessed. Both the shaliness and brittleness properties are indicators of the effectiveness of the caprock shale as a top seal. For instance, higher shaliness and lower brittleness represent better top seal quality and vice versa. The Vsh value significantly varied between the upper and lower Drake units, where the lower Drake represents a higher percentage of shale than the upper unit (Figure 15a,b). The upper Drake shale in the studied area is mostly silty; however, patchy distribution of the finer grain (higher Vsh value) is also present. North of the injection well location (31/5-7), the upper Drake caprock shale is mostly coarse-grained (Figure 15a). On the contrary, the lower Drake shale characterizes as fine-grained throughout the study area (Figure 15b).
A similar trend was also observed in brittleness indices maps, where the lower Drake unit represents a lower value than the upper unit (Figure 15c,d). Comparatively, the northern part of the study area (Troll West) illustrated a lower EBI value than the CCS license area, especially near the proposed injection well in the upper Drake unit.

Seismic Attributes Analysis

In this study, caprock lateral amplitudes were analyzed along with the comparison between the UD and LD. Lateral amplitude variation might also indicate possible depositional changes. However, as the properties are extracted on top of horizons, the position of these horizons is also important. For a detailed depositional analysis, we need multiple horizon slices within each unit (i.e., UD and LD), which is out of the scope of this research. Lateral variations of RMS amplitude on top of the UD and LD surfaces were assessed (Figure 16a,b). Comparing the shaliness, the LD illustrated more depositional variability with high and low RMS amplitude trends than the UD, which has less amplitude variation throughout the Aurora injection site area. Spatial variability of RMS amplitude near the injection site indicated the necessity for a detailed amplitude-based depositional environment analysis for better characterization.
Similar to the RMS, the relative acoustic impedance (RAI) attribute map can represent the lateral impedance variation. Moreover, a sign of the impedance value indicated the information about the layer above. The impedance variation trend in the LD is similar to the RMS amplitude observed where a strong positive RAI value was observed in the northwest part of the study area (Figure 16d). Impedance decreases towards the south and becomes a strongly negative RAI value. On the contrary, there are differences between the RMS amplitude and RAI in the UD. The impedance trend in UD followed a north–south orientation. Most of the east and southeast part has strong positive impedance, while the west part shows a negative RAI value (Figure 16c). Although both surfaces are located in the middle of the UD and LD intervals, strong positive and negative acoustic impedance values indicated spatial property variation within the Drake caprock shales.

5. Discussion

The geological setting of the study area has significantly influenced the mineralogical composition of the Drake caprock shales. Factors such as grain size, the internal distribution of clay minerals, and mineral composition have improved controls on caprock properties [6]. These factors influence the rock diagenetic processes. Moreover, the type of clay minerals dictates the mechanical compaction due to differences in grain orientation related to shape, size, and the volume of other particles present [59]. In contrast, chemical alteration in shale caprocks is a function of temperature, reactive clay mineral phases, and microquartz precipitation.
The type of clay mineral strongly depends on the sediment provenance, tectonic setting, and erosion and particle transportation rate from sediment source to deposition. For instance, the composition of caprock shale closer to the provenance, with more rapid erosion and transport, will be different compared to the distal deposits exposed to a higher rate of weathering. Therefore, unstable minerals (i.e., chlorite and feldspar) indicated rapid erosion with cold climates and a short transport distance between the site of erosion and deposition [60]. The percentage of chlorite and feldspar minerals within the Dunlin Group sediments indicated a short transport distance of particles before being deposited in the Horda Platform area [29]. Moreover, the abundance of kaolinite and low smectite percentages in Drake samples indicated a humid climate condition in the source area, which favors kaolinite formation from weathered bedrock [18].
Although the Drake Formation (Early Jurassic mega-sequence PR6) was deposited during the post-rift phase [11] (Figure 2c), the structure and thickness maps (Figure 7 and Figure 8) of the upper and lower Drake units indicated a continued influence of the major faults on the depositional environments within the studied area. The impact of major faults formed during the first rifting event in the Horda Platform is reflected as thickness variation between hanging and footwall sides of the faults. The structural high with low sediment accommodation in the east indicates a proximal coastal area where the eastern uplifted basement, east of the Øygarden Fault Complex (ØFC), acted as the main sediment source. Based on Sundal et al. [61], the sediment influx into the studied basin is located at 61° N, which followed the Late Devonian Nordfjord–Sogn detachment (Figure 9). There is a distinct difference in fault polarity north and south of the Nordfjord–Sogn detachment [10,36,38]; that explains the variation of the sediment influx into the basin. The lower Drake unit volume of shale (Vsh) map clearly shows the differences between the northern Uer Terrace (UT) and southern Horda Platform (HP) (Figure 9b). A gradual increase in Vsh is observed from east (near the sediment source influx) to west on HP. The highest Vsh is centered south of the Troll gas field, which is also observed in seismic-inverted Vsh maps (Figure 15b). This area is interpreted as a lagoon (back basin) in the depositional model by Sundal et al. [61] regarding the Johansen Formation characterization. Moreover, the higher percentage of uranium and thorium (Figure 6a) found in the wells from this area indicates negligible bottom circulation [47]. However, overall decreasing Vsh in the upper Drake unit indicates a regressive event within the existing back basin. However, north of 61° N, the interplay between accommodation space and sediment source resulted in very low Vsh in the upper and lower Drake units (Figure 9).
The temperature gradient map also shows a striking feature (Figure 10b). The thermal gradient underneath the oil/gas fields (i.e., Troll and Brage) shows comparatively cooler temperatures than the adjacent areas. Although the Drake Formation is buried much deeper than the Upper Jurassic hydrocarbon-bearing reservoirs, the hydrocarbon-accumulation-related pressure and temperature might influence the underburden. However, further study is needed to justify this interpretation. Moreover, the Drake Formation close to the hydrocarbon field area is within the mechanical compaction domain due to the low thermal gradient restricting chemical diagenesis, unlike the rest of the area (Figure 10d). This phenomenon explains the presence of less stiff (ductile) caprock on top of the hydrocarbon fields (Figure 11).

5.1. Effect of Deposition and Diagenetic Processes

Shales are often treated as one lithology during seismic and wireline log interpretation; however, in reality, the properties of individual clay minerals (i.e., smectite, illite, kaolinite, chlorite, etc.) vary significantly due to various processes during diagenesis [59,62]. Moreover, an abundance of coarser grains (i.e., silt and sand) within the muddy sediments results in a tightly compacted fabric. Shales compact due to effective vertical overburden stress within the mechanical compaction zone (i.e., temperatures below 60–70 °C), where stiffness increases by frictional slippage, rotation, sliding, and reorientation of the grains. Compaction-related grain reorientation varies significantly with clay mineralogy and the percentage of sand/silt content within shale [63,64]. In the chemical compaction zone, stiffer clay minerals (i.e., illite), micro-quartz, and other cement may be produced due to mineral diagenetic alteration. These predicted chemical alterations lead to the strengthening of the grain framework [20,65], possibly causing the stiffer Drake caprocks. However, shale compaction trends are much more complicated than sandstones [59,66,67]. Mechanical compaction varies with clay mineralogy, while chemical alteration requires reactive clay phases. Clay reactions are also temperature-dependent. Smectite, if present, will react with a potassium source (normally K-feldspar) at around 70 °C to form illite and quartz, while kaolinite requires around 120 °C to do the same. Additionally, horizontal thin laminations make caprock shale anisotropic and stratigraphically heterogenous [68,69]. Due to this complex nature, it is challenging to evaluate the mechanical properties of any caprock shale. However, an integrated study can effectively characterize the caprock shale’s geomechanical properties.
Irrespective of limitation, according to the gamma-ray (GR) based volume of shale (Vsh) analysis, the influence of the depositional setting on Drake caprock properties was insignificant (Figure 12b). The published clay mineral data from the Drake Formation were also sparse. Some results have been presented in a report related to the evaluation of the Johansen Formation as a reservoir for CO2 storage [29]. Drake Formation X-ray diffraction (XRD) mineralogical analysis is available for well 31/5-2 and is shown in Figure 17a. The results show a clear separation between the upper and lower Drake units, where the lower Drake is more clay-rich than the upper Drake. Carbonate minerals show a similar percentage in both units. Although the lower Drake unit clay mineral percentage is double that of the upper Drake, stiff clay minerals such as illlite, mica and chlorite are also higher than the upper Drake unit. Moreover, the coarser clay mineral (i.e., kaolinite) [70] percentage is also higher in the lower Drake unit (Figure 17b). On the contrary, the high quartz percentage in the upper Drake might suggests a grain-supported rock body. With the increase in effective stress and temperature with depth, the sheet-like silicate minerals (i.e., mica, illite, and chlorite) in the massive lower Drake clay unit might be reoriented normal to the stress and developed cleavage, which might significantly compact the rock, hence increasing the elastic properties. Moreover, a higher percentage of coarser kaolinite clay compressed more due to overburden stress might be another reason for the higher stiffness of the lower Drake unit. A high percentage of quartz with low Vsh within the upper Drake unit might have shifted the clay-dominated rock framework to a grain-supported rock with a possible quartz cementation that might increase this unit’s stiffness [21,23,24]. These processes may have led to similar E and PR values of upper and lower Drake units, though significant mineralogical variations exist (Figure 17c,d). The temperature at the top of Drake Formation after exhumation correction is 72 °C, which is above the temperature needed to alter the smectite clay into illite. The negligible proportion of smectite clay in clay mineralogy analysis explained that (Figure 17b). According to the studied wells in the Horda Platform area, it seems that the effect of the high percentage of clay minerals (also higher Vsh) in overall caprock stiffness is negligible when the shales are within the chemical compaction zone and coarser and sheet-like clay minerals are abundant. However, temperature data (Figure 12c and Figure 13b) clearly separate the mechanically and chemically compacted (CC) wells. Moreover, the caprock compressibility decreases with gentle stiffness changes observed within low-temperature zones, while considerable stiffness increase coupled with gentle strength change occurred in CC wells.

5.2. Implications

One of the critical parameters in any CCS project is to evaluate the caprock integrity during and after injection scenarios, which are dependent on the caprock’s geomechanical properties. The properties of shale are complex and depend on many different factors within the studied basins worldwide. Moreover, geomechanical properties and behavior-changing trends differ from basin to basin. If the caprock shale has considerable thickness with a substantial amount of fine-grained clay minerals, the possibility of caprock failure decreases considerably. However, considering the reservoir pressure changes (in CCS projects), caprock integrity depends on many other factors. This study only focuses on in-situ characterization; hence, injection-induced pressure change is out of scope.
The primary caprock (lower Drake) and secondary caprock (lower Drake) in the Aurora CCS licensed area have considerable thickness present (Figure 8g,h). Moreover, the shale volume (Vsh) within the Aurora injection site area represents a value of high to moderate in range, indicating a considerable presence of clay minerals (Figure 9 and Figure 16). The elastic-properties-based brittleness indices value of the primary caprock is comparatively high (within the less-ductile to less-brittle zone) in the CCS licensed (EL001) area compared with other parts of the studied basin. However, the brittleness indices property of shale is indicative of failure response during applied pressure and not a direct indicator of caprock integrity.
Seismic-inverted properties (Vsh and EBI) are used to investigate the Aurora area caprock properties in detail. Similarities of the caprock properties (Vsh and EBI) between wireline logs and seismic data inverted cubes (Figure 9, Figure 11 and Figure 16) indicated the practicality of the seismic properties in caprock shale characterization processes. Based on the seismic volume of shale, the primary caprock in the Aurora area showed significantly high (>75%) shale volume, which indicated higher clay mineralogy present in the area. Based on this study, the caprock in the Aurora storage site is less likely fail in in-situ stress conditions, mainly considering the primary caprock thickness and shaliness. However, a dynamic geomechanical simulation is needed to assess the stress–strain behavior of the caprock as a top seal in injection-induced pressure change scenarios. Moreover, variation in seismic attributes indicated a need for a further detailed depositional study focusing on the Aurora site.

6. Conclusions

Characterization of Drake caprock shales, mainly the lower Drake unit, is crucial for successful CO2 storage in the Aurora injection site. The depositional and diagenetic effects on caprock shale were analyzed. The critical observations of this study are as follows:
  • The Nordfjord–Sogn detachment at 61° N demarcated the northern boundary of the Horda Platform, which controlled the paleo-depositional environment. This was indicated by the difference in clay proportion in the lower Drake unit between the north and south of the detachment. Moreover, the published Dunlin Group mineralogy reveals that the sediment source was close to the basin with a cold climate-based rapid erosion and short particle transportation before deposition. Although the studied formation shale was deposited in the post-rift stages, the structural influence of the major faults created in the first rifting stage has been evident. However, the effect during the post-rift period was insignificant compared to pre-rift sedimentation.
  • The low temperature gradient underneath the hydrocarbon discoveries such as the Troll and Brage fields represents ductile caprock compared to the other areas. Further analysis needs to evaluate the relation between the stress change due to hydrocarbon accumulation and the underburden properties.
  • Although the upper and lower Drake units have different shale volumes, the geomechanical properties have a similar range. The published mineralogical data can explain where coarser kaolinite and sheet-like clay minerals within the lower Drake unit might significantly increase the density and stiffness irrespective of total clay percentage. In contrast, the abundance of quartz cementation within the upper Drake unit further stiffened the rock behavior. However, the possible lacustrine back basin depositional environment with high clay input signifies soft caprock shales. Moreover, the thickness map demonstrated that the lower Drake unit can solely act as the main caprock for the Aurora CO2 storage site of the Longship/Northern Lights CCS project.
  • In general, the caprock quality in the Horda Platform area is better (less brittle) than in the north and northwest parts of the study area. However, considering the future demand for the injection sites in the study area, further detailed analysis should be conducted in the northwest part.
Based on the caprock properties analyzed in this research, the Drake caprock shale might act as an effective top seal in the Aurora injection site in an in-situ stress state, but the effect of injection-induced pressure changes on caprock needs to be evaluated in the future.

Author Contributions

Conceptualization, M.J.R.; methodology, M.J.R.; software, M.J.R.; validation, M.J.R., M.F., J.J. and N.H.M.; formal analysis, M.J.R.; investigation, M.J.R.; resources, M.J.R.; data curation, M.J.R.; writing—original draft preparation, M.J.R.; writing—review and editing, M.J.R., M.F., J.J. and N.H.M.; visualization, M.J.R., M.F., J.J. and N.H.M.; supervision, M.F., J.J. and N.H.M.; project administration, N.H.M.; funding acquisition, N.H.M. All authors have read and agreed to the published version of the manuscript.

Funding

This research was funded by the Research Council of Norway, grant number “280472”.

Institutional Review Board Statement

Not applicable.

Informed Consent Statement

Not applicable.

Data Availability Statement

Partial data are available in Appendix A (Table A1 and Table A2).

Acknowledgments

We are grateful for the financial support provided by the Research Council of Norway for the OASIS (Overburden Analysis and Seal Integrity Study for CO2 Sequestration in the North Sea) project (NFR-CLIMIT project #280472). We are indebted to the additional funding and data provided by Norwegian Petroleum Directorate (NPD), Gassnova, Equinor, and TotalEnergies. We are thankful for the academic software licenses provided by Lloyd’s Register for Interactive Petrophysics (IP-2019) and Schlumberger for Petrel-2019.

Conflicts of Interest

The authors declare no conflict of interest.

Appendix A

Table A1. The wells’ average properties for Upper Drake unit.
Upper Drake Unit
Well #Surface XSurface YVsh
(Frac.)
Density
(g/cm3)
Vp
(m/s)
EBI
30/12-1491,768.636,667,795.870.39992.653321.150.7168
30/2-1480,825.136,748,314.800.37192.553321.150.5929
30/3-2R495,734.966,740,339.050.34912.523538.20.6368
30/3-3497,358.476,737,311.810.62412.563699.440.6815
30/3-4R492,282.136,736,867.730.56692.533631.810.6575
30/6-11486,083.566,732,323.660.32652.613917.570.7273
30/6-14499,416.896,722,343.600.43152.483625.480.6384
30/6-19R495,362.236,731,329.670.63682.603568.980.6615
30/6-22R498,984.726,733,159.400.44762.583602.10.6663
30/6-4491,665.136,708,367.570.18792.513468.180.6193
30/6-5497,435.436,728,313.090.65152.583544.290.6566
30/6-7486,655.236,723,352.200.28492.603594.680.6609
30/9-13S484,314.066,691,639.340.42622.623765.560.7015
30/9-15495,781.846,692,982.860.69382.483121.150.55
30/9-16486,172.386,679,756.320.55922.593525.790.6545
30/9-28S485,699.376,699,821.190.39252.593560.290.6578
31-4-2500,404.146,718,844.600.56392.513254.460.5376
31/1-1517,134.616,742,841.440.36322.463472.930.5987
31/2-1530,199.616,737,677.210.32012.333190.090.4773
31/2-2533,938.286,738,596.920.34312.403293.220.5383
31/2-3531,870.276,745,386.420.42162.333098.610.4707
31/2-4527,833.016,747,077.020.36262.312957.020.4313
31/2-5523,505.726,737,535.360.40632.393131.170.499
31/2-8526,923.976,758,501.650.3852.463748.270.6402
31/3-1539,987.896,738,661.330.30842.333234.540.4973
31/3-2536,834.496,748,639.000.41882.373285.620.5156
31/3-3545,882.336,744,748.550.32322.503613.810.6388
31/4-3505,143.686,716,917.620.48852.393360.760.5575
31/4-4506,285.026,725,858.560.49462.543588.060.6489
31/4-8500,144.246,709,817.070.48242.453163.840.5514
31/5-2529,892.446,732,542.320.43532.413225.810.5179
31/5-7524,300.056,715,849.930.65852.473448.40.603
31/6-1537,251.616,723,687.540.59962.413111.260.5036
31/6-2550,162.416,716,831.140.40252.483178.190.5553
31/6-3554,832.856,707,818.020.49472.533358.850.6079
31/6-6551,026.086,729,803.820.4692.523520.740.6385
31/6-8537,154.066,713,675.930.30912.403291.120.5331
31/7-1501,347.506,698,949.360.56632.543369.750.6115
32/4-1558,755.716,732,478.430.21932.353238.460.5152
35/10-1512,195.946,776,027.350.4482.593398.150.616
35/10-2502,257.886,767,362.440.3022.533695.130.6648
35/11-1535,624.026,783,526.820.36022.443789.620.6419
35/11-2524,673.056,782,416.440.29472.503854.320.697
35/11-4529,618.966,766,782.090.33322.453809.940.6346
35/11-5521,481.806,771,848.950.23522.484088.130.7149
35/11-6525,015.676,784,875.770.34212.524026.850.7103
35/11-7531,910.056,766,796.130.32732.363556.740.5554
35/12-1551,760.906,783,875.580.51912.534179.580.7494
Table A2. The wells’ average properties for Lower Drake unit.
Lower Drake Unit
NameSurface XSurface YVsh
(Frac.)
Density
(g/cm3)
Vp
(m/s)
EBI
30/12-1491,768.636,667,795.870.4362.643445.8370.6581
30/2-1480,825.136,748,314.800.50282.543366.5480.6001
30/3-2R495,734.966,740,339.050.49482.503496.4070.6278
30/3-3497,358.476,737,311.810.72732.613620.3160.6812
30/3-4R492,282.136,736,867.730.61862.563493.4170.6398
30/6-11486,083.566,732,323.660.52.633746.2970.6985
30/6-14499,416.896,722,343.600.50672.503541.7940.6352
30/6-19R495,362.236,731,329.670.60552.613541.7940.6613
30/6-22R498,984.726,733,159.400.48622.613527.6120.6596
30/6-4491,665.136,708,367.570.64112.533189.6190.5689
30/6-5497,435.436,728,313.090.60092.563564.7070.6555
30/6-7486,655.236,723,352.200.39652.663460.3010.6451
30/9-13S484,314.066,691,639.340.3982.623545.4180.6723
30/9-15495,781.846,692,982.860.59422.483010.1550.523
30/9-16486,172.386,679,756.320.53982.593328.5090.6228
30/9-28S485,699.376,699,821.190.42552.583279.6830.593
31-4-2500,404.146,718,844.600.58382.523082.2030.5037
31/1-1517,134.616,742,841.440.55742.553336.0730.6125
31/2-1530,199.616,737,677.210.52352.423104.0540.5076
31/2-2533,938.286,738,596.920.60422.473121.3740.5385
31/2-3531,870.276,745,386.420.61732.453193.5320.5469
31/2-4527,833.016,747,077.020.5652.432960.6970.4979
31/2-5523,505.726,737,535.360.6312.463055.0880.5226
31/2-8526,923.976,758,501.650.39792.453707.870.6366
31/3-1539,987.896,738,661.330.53952.433270.3950.5554
31/3-2536,834.496,748,639.000.63562.503412.3030.6013
31/3-3545,882.336,744,748.550.52212.533710.3170.677
31/4-3505,143.686,716,917.620.65092.443257.20.5633
31/4-4506,285.026,725,858.560.51152.573554.0090.6508
31/4-8500,144.246,709,817.070.60932.353002.5110.4867
31/5-2529,892.446,732,542.320.72512.483091.6280.532
31/5-7524,300.056,715,849.930.56862.533164.10.5817
31/6-1537,251.616,723,687.540.79882.452866.750.4617
31/6-2550,162.416,716,831.140.70812.432846.1960.4655
31/6-3554,832.856,707,818.020.70952.512908.9050.5059
31/6-6551,026.086,729,803.820.59052.543675.0230.6697
31/6-8537,154.066,713,675.930.64832.452905.5980.4792
31/7-1501,347.506,698,949.360.58692.533068.7910.549
32/4-1558,755.716,732,478.430.42842.493495.4910.6218
35/10-1512,195.946,776,027.350.43722.633599.7940.6753
35/10-2502,257.886,767,362.440.25682.453763.3910.6492
35/11-1535,624.026,783,526.820.34062.483814.9310.6696
35/11-2524,673.056,782,416.440.36392.593948.1520.7314
35/11-4529,618.966,766,782.090.25612.433755.3460.6209
35/11-5521,481.806,771,848.950.13522.474094.0940.7081
35/11-6525,015.676,784,875.770.50452.634124.7790.7666
35/11-7531,910.056,766,796.130.2722.363633.5140.5748
35/12-1551,760.906,783,875.580.47762.554230.9310.7634

References

  1. Hawkes, C.D.; McLellan, P.J.; Bachu, S. Geomechanical factors affecting geological storage of CO2 in depleted oil and gas reservoirs. J. Can. Pet. Technol. 2005, 44, 258. [Google Scholar] [CrossRef]
  2. Rutqvist, J.; Birkholzer, J.; Cappa, F.; Tsang, C.-F. Estimating maximum sustainable injection pressure during geological sequestration of CO2 using coupled fluid flow and geomechanical fault-slip analysis. Energy Convers. Manag. 2007, 48, 1798–1807. [Google Scholar] [CrossRef] [Green Version]
  3. Rutqvist, J.; Birkholzer, J.T.; Tsang, C.-F. Coupled reservoir–geomechanical analysis of the potential for tensile and shear failure associated with CO2 injection in multilayered reservoir—Caprock systems. Int. J. Rock. Mech. Min. Sci. 2008, 45, 132–143. [Google Scholar] [CrossRef] [Green Version]
  4. Soltanzadeh, H.; Hawkes, C.D. Semi-analytical models for stress change and fault reactivation induced by reservoir production and injection. J. Pet. Sci. Eng. 2008, 60, 71–85. [Google Scholar] [CrossRef]
  5. Streit, J.E.; Hillis, R.R. Estimating fault stability and sustainable fluid pressures for underground storage of CO2 in porous rock. Energy 2004, 29, 1445–1456. [Google Scholar] [CrossRef]
  6. Hart, B.S.; Macquaker, J.H.S.; Taylor, K.G. Mudstone (“shale”) depositional and diagenetic processes: Implications for seismic analyses of source-rock reservoirs. Interpretation 2013, 1, B7–B26. [Google Scholar] [CrossRef]
  7. Mondol, N.H.; Jahren, J.; Berre, T.; Grande, L.; Bjørlykke, K. Permeability Anisotropy in Synthetic Mudstones—An Experimental Study. In Proceedings of the 73rd EAGE Conference and Exhibition Incorporating SPE EUROPEC 2011, Vienna, Austria, 23–27 May 2011; European Association of Geoscientists & Engineers: Houten, The Netherlands, 2011; p. cp-238. [Google Scholar]
  8. Mondol, N.H.; Bjørlykke, K.; Jahren, J. Experimental compaction of clays: Relationship between permeability and petrophysical properties in mudstones. Pet. Geosci. 2008, 14, 319–337. [Google Scholar] [CrossRef]
  9. Storvoll, V.; Bjørlykke, K.; Mondol, N.H. Velocity-depth trends in Mesozoic and Cenozoic sediments from the Norwegian Shelf. Am. Assoc. Pet. Geol. Bull. 2005, 89, 359–381. [Google Scholar] [CrossRef]
  10. Færseth, R.B. Interaction of Permo–Triassic and Jurassic extensional fault-blocks during the development of the northern North Sea. J. Geol. Soc. London 1996, 153, 931–944. [Google Scholar] [CrossRef]
  11. Steel, R.J. Triassic–Jurassic megasequence stratigraphy in the Northern North Sea: Rift to post-rift evolution. In Geological Society, London, Petroleum Geology Conference Series; Geological Society of London: London, UK, 1993; Volume 4, pp. 299–315. [Google Scholar]
  12. Steel, R.; Ryseth, A. The Triassic—Early Jurassic succession in the northern North Sea: Megasequence stratigraphy and intra-Triassic tectonics. Geol. Soc. London Spec. Publ. 1990, 55, 139–168. [Google Scholar] [CrossRef]
  13. Baig, I.; Faleide, J.I.; Mondol, N.H.; Jahren, J. Burial and exhumation history controls on shale compaction and thermal maturity along the Norwegian North Sea basin margin areas. Mar. Pet. Geol. 2019, 104, 61–85. [Google Scholar] [CrossRef]
  14. Rahman, M.J.; Fawad, M.; Mondol, N.H. Organic-rich shale caprock properties of potential CO2 storage sites in the northern North Sea, offshore Norway. Mar. Pet. Geol. 2020, 122, 104665. [Google Scholar] [CrossRef]
  15. Bjørlykke, K.; Jahren, J. Sandstones and sandstone reservoirs. In Petroleum Geoscience; Springer: Berlin/Heidelberg, Germany, 2015; pp. 119–149. [Google Scholar]
  16. Chuhan, F.A.; Kjeldstad, A.; Bjørlykke, K.; Høeg, K. Porosity loss in sand by grain crushing—Experimental evidence and relevance to reservoir quality. Mar. Pet. Geol. 2002, 19, 39–53. [Google Scholar] [CrossRef]
  17. Bjørlykke, K.; Høeg, K. Effects of burial diagenesis on stresses, compaction and fluid flow in sedimentary basins. Mar. Pet. Geol. 1997, 14, 267–276. [Google Scholar] [CrossRef]
  18. Bjørlykke, K. Mudrocks, Shales, Silica Deposits and Evaporites. In Petroleum Geoscience; Springer: Berlin/Heidelberg, Germany, 2015; pp. 217–229. [Google Scholar]
  19. Aplin, A.C.; Matenaar, I.F.; van der Pluijm, B. Influence of mechanical compaction and chemical diagenesis on the microfabric and fluid flow properties of Gulf of Mexico mudstones. J. Geochem. Explor. 2003, 78, 449–451. [Google Scholar] [CrossRef]
  20. Bjørlykke, K. Clay mineral diagenesis in sedimentary basins—a key to the prediction of rock properties. Examples from the North Sea Basin. Clay Min. 1998, 33, 15–34. [Google Scholar] [CrossRef]
  21. Marcussen, Ø.; Thyberg, B.I.; Peltonen, C.; Jahren, J.; Bjørlykke, K.; Faleide, J.I. Physical properties of Cenozoic mudstones from the northern North Sea: Impact of clay mineralogy on compaction trends. Am. Assoc. Pet. Geol. Bull. 2009, 93, 127–150. [Google Scholar] [CrossRef] [Green Version]
  22. Nooraiepour, M.; Mondol, N.H.; Hellevang, H.; Bjørlykke, K. Experimental mechanical compaction of reconstituted shale and mudstone aggregates: Investigation of petrophysical and acoustic properties of SW Barents Sea cap rock sequences. Mar. Pet. Geol. 2017, 80, 265–292. [Google Scholar] [CrossRef] [Green Version]
  23. Peltonen, C.; Marcussen, Ø.; Bjørlykke, K.; Jahren, J. Mineralogical control on mudstone compaction: A study of Late Cretaceous to Early Tertiary mudstones of the Vøring and Møre basins, Norwegian Sea. Pet. Geosci. 2008, 14, 127–138. [Google Scholar] [CrossRef]
  24. Thyberg, B.; Jahren, J.; Winje, T.; Bjørlykke, K.; Faleide, J.I. From mud to shale: Rock stiffening by micro-quartz cementation. First Break 2009, 27. [Google Scholar] [CrossRef]
  25. Thyberg, B.; Jahren, J. Quartz cementation in mudstones: Sheet-like quartz cement from clay mineral reactions during burial. Pet. Geosci. 2011, 17, 53–63. [Google Scholar] [CrossRef]
  26. Bjørlykke, K. Principal aspects of compaction and fluid flow in mudstones. Geol. Soc. London Spec. Publ. 1999, 158, 73–78. [Google Scholar] [CrossRef]
  27. Ingram, G.M.; Urai, J.L.; Naylor, M.A. Sealing processes and top seal assessment. Nor. Pet. Soc. Spec. Publ. 1997, 7, 165–174. [Google Scholar]
  28. Nygård, R.; Gutierrez, M.; Bratli, R.K.; Høeg, K. Brittle–ductile transition, shear failure and leakage in shales and mudrocks. Mar. Pet. Geol. 2006, 23, 201–212. [Google Scholar] [CrossRef]
  29. Gassnova. Geological Storage of CO2 from Mongstad; Interim Report Johansen Formation, Doc. No. TL02-GTL-Z-RA-0001; Gassnova: Porsgrunn, Norway, 2012; p. 308. [Google Scholar]
  30. Whipp, P.S.; Jackson, C.L.; Gawthorpe, R.L.; Dreyer, T.; Quinn, D. Normal fault array evolution above a reactivated rift fabric; a subsurface example from the northern Horda Platform, Norwegian North Sea. Basin. Res. 2014, 26, 523–549. [Google Scholar] [CrossRef]
  31. Stewart, D.J.; Schwander, M.; Bolle, L. Jurassic depositional systems of the Horda Platform, Norwegian North Sea: Practical consequences of applying sequence stratigraphic models. Nor. Pet. Soc. Spec. Publ. 1995, 5, 291–323. [Google Scholar]
  32. Roberts, A.M.; Yielding, G.; Kusznir, N.J.; Walker, I.; Dorn-Lopez, D. Mesozoic extension in the North Sea: Constraints from flexural backstripping, forward modelling and fault populations. In Geological Society, London, Petroleum Geology Conference Series; Geological Society of London: London, UK, 1993; Volume 4, pp. 1123–1136. [Google Scholar]
  33. Roberts, A.M.; Kusznir, N.J.; Yielding, G.; Beeley, H. Mapping the bathymetric evolution of the Northern North Sea: From Jurassic synrift archipelago through Cretaceous—Tertiary post-rift subsidence. Pet. Geosci. 2019, 25, 306–321. [Google Scholar] [CrossRef]
  34. Roberts, S.; Jackson, J. Active normal faulting in central Greece: An overview. Geol. Soc. London Spec. Publ. 1991, 56, 125–142. [Google Scholar] [CrossRef]
  35. Jackson, J.A.; White, N.J. Normal faulting in the upper continental crust: Observations from regions of active extension. J. Struct. Geol. 1989, 11, 15–36. [Google Scholar] [CrossRef]
  36. Færseth, R.B.; Gabrielsen, R.H.; Hurich, C.A. Influence of basement in structuring of the North Sea basin, offshore southwest Norway. Nor. Geol. Tidsskr. 1995, 75, 105–119. [Google Scholar]
  37. Yielding, G.; Walsh, J.; Watterson, J. The prediction of small-scale faulting in reservoirs. First Break 1992, 10. [Google Scholar] [CrossRef]
  38. Badley, M.E.; Price, J.D.; Dahl, C.R.; Agdestein, T. The structural evolution of the northern Viking Graben and its bearing upon extensional modes of basin formation. J. Geol. Soc. London 1988, 145, 455–472. [Google Scholar] [CrossRef]
  39. Fichler, C.; Hospers, J. Deep crustal structure of the northern North Sea Viking Graben: Results from deep reflection seismic and gravity data. Tectonophysics 1990, 178, 241–254. [Google Scholar] [CrossRef]
  40. Hospers, J.; Ediriweera, K.K. Depth and configuration of the crystalline basement in the Viking Graben area, Northern North Sea. J. Geol. Soc. London 1991, 148, 261–265. [Google Scholar] [CrossRef]
  41. Klemperer, S.L. Crustal thinning and nature of extension in the northern North Sea from deep seismic reflection profiling. Tectonics 1988, 7, 803–821. [Google Scholar] [CrossRef]
  42. Anell, I.; Thybo, H.; Artemieva, I.M. Cenozoic uplift and subsidence in the North Atlantic region: Geological evidence revisited. Tectonophysics 2009, 474, 78–105. [Google Scholar] [CrossRef] [Green Version]
  43. Faleide, J.I.; Bjørlykke, K.; Gabrielsen, R.H. Geology of the Norwegian Continental Shelf. In Petroleum Geoscience, 2nd ed.; Springer: Berlin/Heidelberg, Germany, 2015; pp. 603–637. [Google Scholar]
  44. Jordt, H.; Faleide, J.I.; Bjørlykke, K.; Ibrahim, M.T. Cenozoic sequence stratigraphy of the central and northern North Sea Basin: Tectonic development, sediment distribution and provenance areas. Mar. Pet. Geol. 1995, 12, 845–879. [Google Scholar] [CrossRef]
  45. Vollset, J.; Doré, A.G. A Revised Triassic and Jurassic Lithostratigraphic Nomenclature for the Norwegian North Sea; Oljedirektoratet: Stavanger, Norway, 1984.
  46. NPD. NPD FactPages 2022. Available online: https://npdfactpages.npd.no/factpages/Default.aspx?culture=en (accessed on 28 March 2022).
  47. Isaksen, G.H.; Bohacs, K.M. Geological Controls of Source Rock Geochemistry Through Relative Sea Level; Triassic, Barents Sea. In Petroleum Source Rocks; Springer: Berlin/Heidelberg, Germany, 1995; pp. 25–50. [Google Scholar]
  48. Larionov, V.V. Radiometry of Boreholes; Nedra: Moscow, Russia, 1969; p. 127. [Google Scholar]
  49. Mondol, N.H. Porosity and permeability development in mechanically compacted silt-kaolinite mixtures. In SEG Technical Program Expanded Abstracts 2009; Society of Exploration Geophysicists: Houston, TX, USA, 2009; pp. 2139–2143. [Google Scholar]
  50. Perez Altamar, R.; Marfurt, K. Mineralogy-based brittleness prediction from surface seismic data: Application to the Barnett Shale. Interpretation 2014, 2, T1–T17. [Google Scholar] [CrossRef] [Green Version]
  51. Horsrud, P. Estimating mechanical properties of shale from empirical correlations. SPE Drill Complet. 2001, 16, 68–73. [Google Scholar] [CrossRef] [Green Version]
  52. Fawad, M.; Mondol, M.D.N.H. Method for Estimating Rock Brittleness from Well-Log Data 2021. U.S. Patent No. 17/175,770, 19 August 2021. [Google Scholar]
  53. Fatti, J.L.; Smith, G.C.; Vail, P.J.; Strauss, P.J.; Levitt, P.R. Detection of gas in sandstone reservoirs using AVO analysis: A 3-D seismic case history using the Geostack technique. Geophysics 1994, 59, 1362–1376. [Google Scholar] [CrossRef]
  54. Fawad, M.; Rahman, M.J.; Mondol, N.H. Seismic-derived geomechanical properties of potential CO2 storage reservoir and cap rock in Smeaheia area, northern North Sea. Lead Edge 2021, 40, 254–260. [Google Scholar] [CrossRef]
  55. Fawad, M.; Hansen, J.A.; Mondol, N.H. Seismic-fluid detection—A review. Earth-Sci. Rev. 2020, 210, 103347. [Google Scholar] [CrossRef]
  56. Hampson, D.P.; Russell, B.H.; Bankhead, B. Simultaneous inversion of pre-stack seismic data. In SEG Technical Program Expanded Abstracts 2005; Society of Exploration Geophysicists: Houston, TX, USA, 2005; pp. 1633–1637. [Google Scholar]
  57. Fawad, M.; Mondol, N.H. Monitoring geological storage of CO2: A new approach. Sci. Rep. 2021, 11, 5942. [Google Scholar] [CrossRef] [PubMed]
  58. Fawad, M.; Rahman, M.J.; Mondol, N.H. Seismic reservoir characterization of potential CO2 storage reservoir sandstones in Smeaheia area, Northern North Sea-Submitted for Review. J. Pet. Sci. Eng. 2020, 205, 108812. [Google Scholar] [CrossRef]
  59. Mondol, N.H.; Bjørlykke, K.; Jahren, J.; Høeg, K. Experimental mechanical compaction of clay mineral aggregates—Changes in physical properties of mudstones during burial. Mar. Pet. Geol. 2007, 24, 289–311. [Google Scholar] [CrossRef]
  60. Bjørlykke, K. Sedimentary, Geochemistry. In Petroleum Geoscience; Springer: Berlin/Heidelberg, Germany, 2015; pp. 91–117. [Google Scholar]
  61. Sundal, A.; Nystuen, J.P.; Rørvik, K.-L.; Dypvik, H.; Aagaard, P. The Lower Jurassic Johansen Formation, northern North Sea—Depositional model and reservoir characterization for CO2 storage. Mar. Pet. Geol. 2016, 77, 1376–1401. [Google Scholar] [CrossRef]
  62. Bjørlykke, K. Compaction of sedimentary rocks: Shales, sandstones and carbonates. In Petroleum Geoscience; Springer: Berlin/Heidelberg, Germany, 2015; pp. 351–360. [Google Scholar]
  63. Fawad, M.; Mondol, N.H.; Jahren, J.; Bjørlykke, K. Microfabric and rock properties of experimentally compressed silt-clay mixtures. Mar. Pet. Geol. 2010, 27, 1698–1712. [Google Scholar] [CrossRef]
  64. Voltolini, M.; Wenk, H.-R.; Mondol, N.H.; Bjørlykke, K.; Jahren, J. Anisotropy of experimentally compressed kaolinite-illite-quartz mixtures. Geophysics 2009, 74, D13–D23. [Google Scholar] [CrossRef] [Green Version]
  65. Zadeh, M.K.; Mondol, N.H.; Jahren, J. Compaction and rock properties of Mesozoic and Cenozoic mudstones and shales, northern North Sea. Mar. Pet. Geol. 2016, 76, 344–361. [Google Scholar] [CrossRef]
  66. Baldwin, B.; Butler, C.O. Compaction curves. Am. Assoc. Pet. Geol. Bull. 1985, 69, 622–626. [Google Scholar]
  67. Magara, K. Comparison of porosity-depth relationships of shale and sandstone. J. Pet. Geol. 1980, 3, 175–185. [Google Scholar] [CrossRef]
  68. Mondol, N.H.; Grande, L.; Aker, E.; Berre, T.; Ørbech, T.; Duffaut, K.; Jahren, J.; Bjørlykke, K. Velocity anisotropy of a shallow mudstone core. In Second EAGE Workshop on Shales; European Association of Geoscientists & Engineers: Houten, The Netherlands, 2010; p. cp-158. [Google Scholar]
  69. Mondol, N.H. Velocity anisotropy in experimentally compacted clay-silt and clay-clay mixtures. In SEG Technical Program Expanded Abstracts 2012; Society of Exploration Geophysicists: Houston, TX, USA, 2012; pp. 1–5. [Google Scholar]
  70. Mondol, N.H.; Jahren, J.; Bjørlykke, K.; Brevik, I. Elastic properties of clay minerals. Lead. Edge 2008, 27, 758–770. [Google Scholar] [CrossRef]
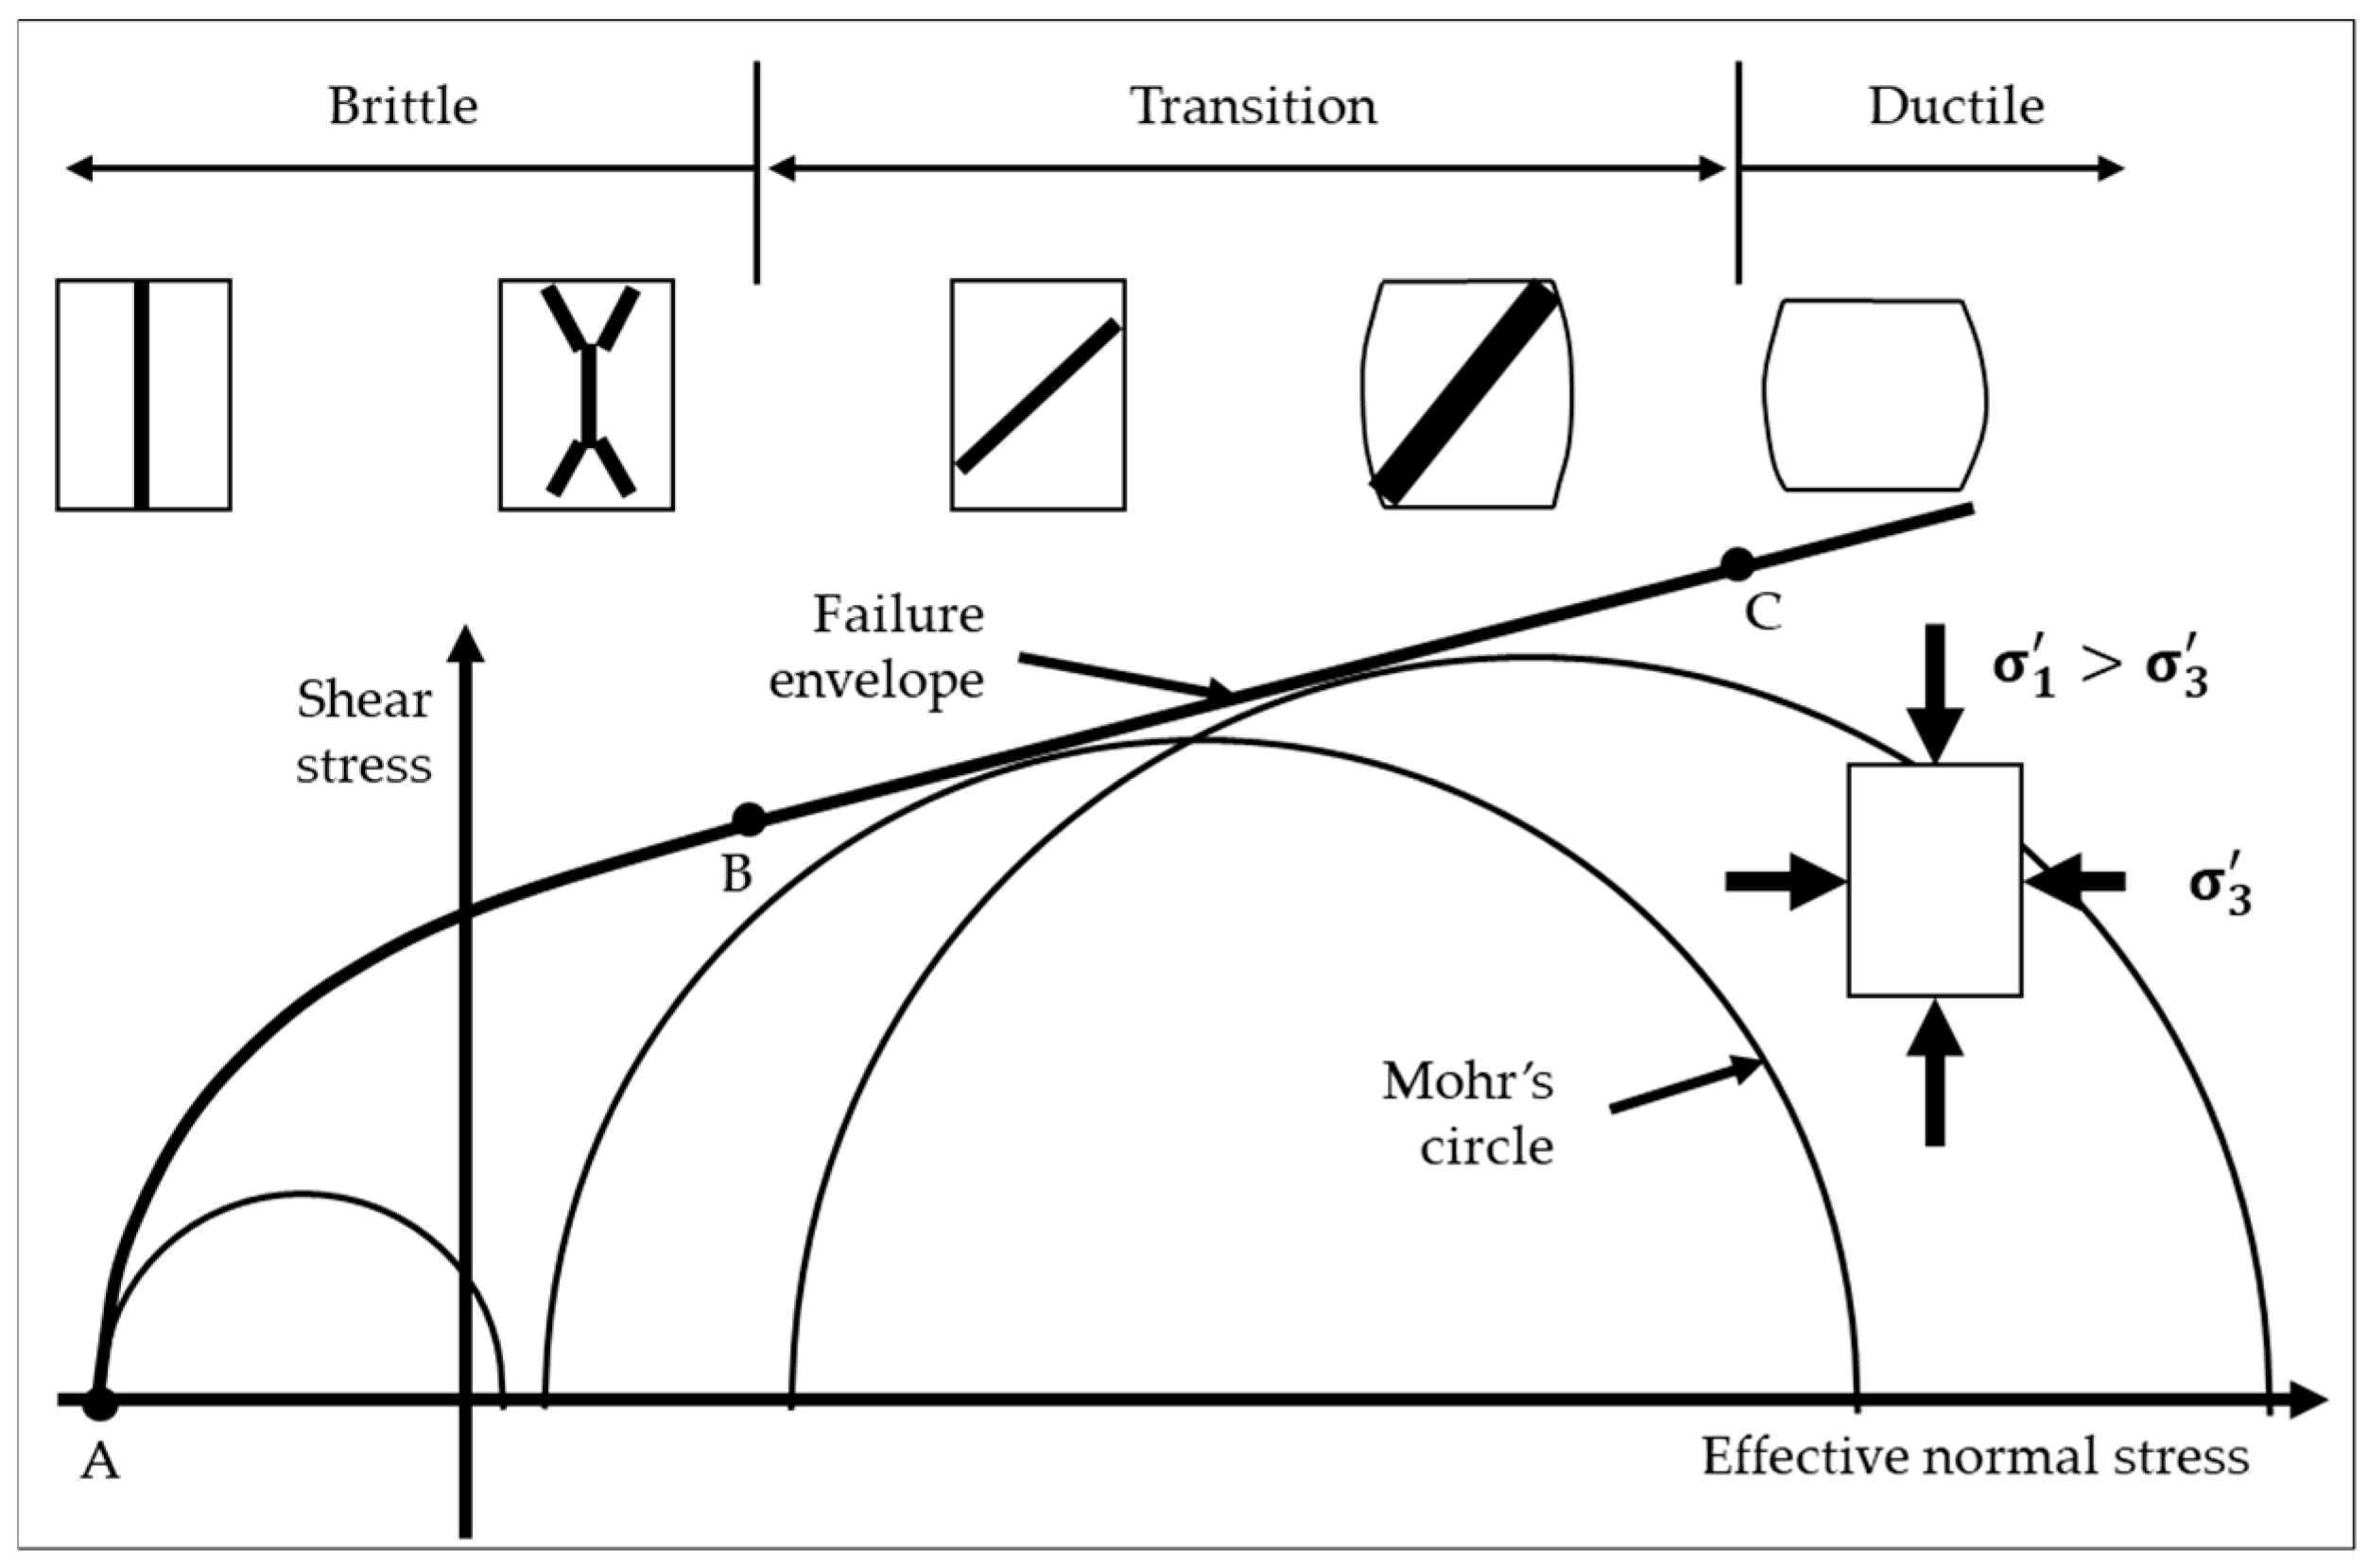
Figure 1. The possible modes of failure or fractures based on the mechanical behavior of the caprock are illustrated in the Mohr–Coulomb failure envelope (modified after Nygård et al. [28]). The points A, B, and C on top of the failure envelope define the brittle, transition, and ductile zones of any caprock.
Geosciences 12 00181 g001
Figure 2. (a) Main structural elements of the northern North Sea, resulting from Permo–Triassic extension, reveal the major faults and Nordfjord–Sogn detachment (modified after Færseth, [10]). Violet rectangle within the figure a represents the study area covered in this research (b) An E–W cross-section through the northern North Sea (marked in (a)) shows the sedimentation and major faults during syn- and post-rift times (modified after Færseth, [10]). (c) Schematic representation of Triassic and Jurassic post-rift mega-sequences (modified after Steel, [11]). The Horda Platform area is marked in the red rectangle.
Geosciences 12 00181 g002
Figure 4. Map of the study area shows wells (black circles), faults (grey lines), and structural elements (e.g., BA = Bjørgvin Arch; BH = Brage Horst; FS = Flatfisk Slope; HP = Horda Platform; LT = Lomre Terrace; MS = Marflo Spur; SB = Stord Basin; TT = Tjalve Terrace; UT = Uer Terrace; Faults: BF = Brage Fault; IF = Idunn Fault; KF = Kinna Fault; MFC = Mokkurkalve Fault Complex; OFB = Oseberg Fault Block; TF = Tusse Fault; TrF = Troll Fault; ØFC = Øygarden Fault Complex). The grey shaded polygons illustrate the hydrocarbon fields and discoveries (e.g., B = Brage; OB = Oseberg; TE = Troll East; TW = Troll West) in the study area. The solid black lines (NS-1, NS-2, and NS-3) and dotted black lines (WS-1, WS-2, and WS-3) represent the well sections interpreted in the result section The boundary of the regional map is denoted in a green polygon, where the blue boundaries represent 3D seismic volume GN10M1. The cropped 3D volume (dotted red polygon) is used for Aurora site-specific evaluation. The interpreted 2D lines are denoted by the grey dashed line. The first CCS license (EL001) in offshore Norway is indicated by the violet polygon, where the red circle (31/5-7) is the proposed CO2 injection well.
Geosciences 12 00181 g004
Figure 5. An integrated workflow to illustrate the caprock evaluation processes.
Geosciences 12 00181 g005
Figure 6. (a) Uranium versus thorium cross-plots of the lower Drake unit clearly show the variation of spectral gamma-ray values within the four studied wells. (b) A comparison between machine learning algorithms estimated vs. with the measured Vs. The Drake Formation data points from well 31/1-1 were used to construct the crossplot.
Geosciences 12 00181 g006
Figure 7. Well correlations flattened on 0 m TVDSS show the present day structural position of upper and lower unis of the Drake Formation: north–south sections (ac), and east–west sections (df). The structural elements with corresponding boundaries in between wells are also marked. The depth structure maps of upper (g) and lower (h) Drake units also illustrate the well correlations with structural elements and major faults (i.e., structural elements: BA = Bjørgvin Arch; BH = Brage Horst; FS = Flatfisk Slope; HP = Horda Platform; NSD = Nordfjord–Sogn Detachment; LT = Lomre Terrace; MS = Marflo Spur; SB = Stord Basin; TT = Tjalve Terrace; UT = Uer Terrace. Faults: BF = Brage Fault; IF = Idunn Fault; KF = Kinna Fault; MFC = Mokkurkalve Fault Complex; OFB = Oseberg Fault Block; SB = Stord Basin; TF = Tusse Fault; TrF = Troll Fault; UF = Undifined fault. Discoveries: B = Brage; OB = Oseberg; TE = Troll East; TW = Troll West).
Geosciences 12 00181 g007
Figure 8. Well sections flattened on top of the upper Drake unit representing thickness and property variations in wells covering the north–south (ac) and the east–west directions (df) in the study area. The thickness maps of the upper Drake (g) and lower Drake (h) units exhibit the correlation profiles’ locations and show the study area’s overall variation. Color legend used to displayed wireline logs is also shown.
Geosciences 12 00181 g008
Figure 9. The normalized gamma-ray-based average volume of shale maps show the variation in the percentage of clays of the upper (a) and lower (b) Drake units. The contour interval (CI) in both maps is 0.05. The possible location of the Late Devonian Nordfjord–Sogn detachment extensional feature is also shown.
Geosciences 12 00181 g009
Figure 10. The average exhumation map (a) and temperature gradient map (b) for the study area show the differential uplift and temperature variations. The present (c) and paleo (d) temperature distribution maps of the lower Drake unit calculated using exhumation and temperature gradient analysis display the variation and the maximum temperature experienced by the caprocks in the study area. The paleo-temperature map on top of the caprock surface represents the mechanical and chemical compaction zones. The contour interval (CI) of all maps is shown in the legend.
Geosciences 12 00181 g010
Figure 11. The property maps generated using the average well data of EBI of upper Drake (a) and lower Drake (b) units show the spatial variation of the caprock strength. The contour interval (CI) of each map is shown in the legend (0.025). Moreover, the grey shaded zones represent the oil and gas discoveries in the study area.
Geosciences 12 00181 g011
Figure 12. Young’s modulus versus Poisson’s ratio cross-plots of Drake Formation show the variations between upper (non-filled) and lower (filled) Drake units color-coded with well names (a), the volume of shale (b), temperature corrected for exhumation (c), and EBI (d). The reference background curves are adapted from Perez and Marfurt [50].
Geosciences 12 00181 g012
Figure 13. The diagenetic influences on geomechanical properties (E and PR) of the Drake Formation are illustrated in these cross-plots using the data points from 7 selected wells from the study area color-coded by well names (a), temperature corrected for exhumation (b), Vsh (c), and EBI (d). The brittle–ductile divisions are based on Perez and Marfurt [50] published curves.
Geosciences 12 00181 g013
Figure 14. Map shows the faults and hydrocarbon fields in the Aurora injection site (a). The first CCS license (EL001) and possible injection well (31/5-7) are also presented. A SW–NE (AB) cross-section of full-stacked seismic (b) and inverted volume of shale (c) near the 31/5-7 well is illustrated for reference. Top horizons (UD—upper Drake; LD—lower Drake; C—Cook; UJ—upper Johansen LJ—lower Johansen and S—Statfjord) and logs (GR—gamma-ray and Vp—P-wave velocity) from well 31/5-7 are also shown. Note that the property maps (Figure 15 and Figure 16) were extracted on top of the UD and LD horizons.
Geosciences 12 00181 g014
Figure 15. The extracted volume of shale property maps illustrated on top of the upper Drake (a) and lower Drake (b) units. The elastic brittleness indices property estimated using Equation (4) is also presented on top of the upper Drake (c) and lower Drake (d) units. The faults and hydrocarbon fields located in the study area are also presented. In addition, the first CCS license (EL001) and the proposed CO2 injection well (31/5-7) are shown.
Geosciences 12 00181 g015
Figure 16. Variations of RMS amplitude on top of the upper Drake (a) and lower Drake (b) units are presented. Spatial variation of relative acoustic impedance (RAI) are also shown on upper Drake (c) and lower Drake (d) surfaces. Note that the faults (black), oil and gas fields (dark grey shaded polygons), the CCS license (EL001), and the proposed injection well (31/5-7) are also shown.
Geosciences 12 00181 g016
Figure 17. Bulk mineralogy from upper and lower Drake units from well 31/5-2 shows the upper and lower Drake unit variations of mineralogical composition (a) and clay mineralogy (b) [29]. The log-based geomechanical properties are color-coded with units from the same well (c) and EBI (d). The background curves are adapted from Perez and Marfurt [50].
Geosciences 12 00181 g017
Table 1. Well database with structural elements, caprock present/max. burial depth and thickness.
Well NameStructural Elements (NPD)Upper Drake (mBSF)Thickness (m)Lower Drake (mBSF)Thickness (m)
PresentPaleo *PresentPaleo *
30/9-15Bjørgvin Arch214823287922272407107
30/9-16 288030451002980314581
30/12-1 299831331013100323598
31/2-1 15771697861664178457
31/2-2 17011832571759188947
31/2-3 15431933681611200140
31/2-4 15421802581600186047
31/2-5 17061946671772201264
31/3-1 14591839711530191057
31/3-2 158619068316701990-
31/3-3 18512371491900242047
31/4-3 22162386592275244572
31/4-8 19372077702006214667
31/5-2 16931883801773196361
31/7-1 23072517812388259869
35/11-7 21632358652228242341
31/5-7Stord Basin21732523742247259753
31/6-1 15081838761584191452
31/6-2 16492349481697239732
31/6-3 16482298351683233333
31/6-6 17092439481756248630
31/6-8 16401970991739206962
32/4-1 13042404441348244849
31/1-1Lomre Terrace21982398842282248243
31/2-8 23522582622414264441
31/4-4 25592559722630263066
31/2-19S 32723472633335353549
35/11-2 30933253743167332758
35/11-4 24132603662479266937
35/11-5 30143194663080326027
35/11-6 32383388853324347452
30/3-3Oseberg Fault Block29083028582966308667
30/3-4R 27602885592819294469
30/6-4 25512741942645283575
30/6-7 26482768982746286691
30/6-19R 28092934492858298364
30/9-13S 325932591223382338278
30/9-28S 318233721053287347773
30/3-2RBrage Horst27382868572795292568
30/6-5 27762916502826296663
30/6-14 22352390612296245194
30/6-22R 27972902562853295867
31/4-2 21862346692255241557
30/6-11Faltfisk Slope34153505753490358096
35/10-2 38934018623956408179
35/11-1Uer Terrace21722502602232256256
35/12-1 253130114425763056-
30/2-1Mokkurkalve Fault Complex36363701773713377897
34/11-3Tjalve Terrace39653995273992402236
35/10-1Marflo Spur31023242703173331337
* Corrected for exhumation estimated from Vp–depth trend to represent the maximum burial depth.
Publisher’s Note: MDPI stays neutral with regard to jurisdictional claims in published maps and institutional affiliations.