Abstract
Hand-held ground penetrating radar (GPR) systems have been widely applied to landmine detections during recent decades. The accuracy of an imaging result by migration for a hand-held GPR is strongly related to the accuracy of subsurface velocity distribution obtained from multi offset data. For shallow targets like landmines, the hyperbolas are usually not distinct in 2D slices and are masked by the surface reflections. In this article, we propose a 3D migration depth focus velocity analysis method for hand-held GPRs to estimate the background velocity of the subsurface. This method is performed based on the images generated by migrations. The objective function is defined as the proportion of the target on the depth slice containing the target. After migrating a GPR radargram with different velocities, the background velocity, which minimizes the objective function, can be determined by comparing the imaging results by migration using different velocities. To test the proposed method, we apply this procedure to experimental GPR data collected with an advanced landmine imaging system (ALIS) in the laboratory. Subsequently, the velocity of the background is obtained, 3D diffraction migration with the obtained velocity achieves subsurface imaging with high quality. The accurate position and depth of the target are obtained from the optimal migration image.
1. Introduction
Ground penetrating radar (GPR) is a non-destructive geophysical method that uses high-frequency electromagnetic (EM) waves to image the subsurface [1,2,3,4]. As a humanitarian method, it has been applied widely to the detection of unexploded ordnance (UXO) and tunnels [5,6,7,8]. The hand-held GPR system, the advanced landmine imaging system (ALIS), was developed for landmine detection in recent decades [9,10]. ALIS is a dual-sensor that consists of a GPR and a metal detection (MD) sensor. Its GPR system uses spiral antennas to transmit stepped frequency continuous wave (SFCW) and works over the frequency band of 800 MHz to 2.6 GHz. The GPR sensor is equipped with a 3-axual accelerometer to estimate the antenna position [10].
To construct a subsurface image of the underground object from the GPR time section, it is necessary to perform migrations [11,12]. The migration method is the process that returns the reflected signals to their true positions in the subsurface from the positions that were recorded at the surface and collapses diffractions, thereby generating a more accurate image of the subsurface [13]. It also can increase the signal-clutter ratio and the imaging resolution [14,15]. The migration technique has been much developed in seismic, acoustic, and geophysical engineering and was originally developed in two-dimensional form by Hagedoorn [16]. For the hand-held GPR system, Feng has modified the migration algorithm and developed a new processing procedure that can directly process irregular GPR data without interpolation [17].
However, migration was performed based on a priori knowledge of the velocity distribution of the background [18]. The accuracy of migration is strongly related to the accuracy of the subsurface velocity distribution used in this process. The subsurface velocity is usually not directly available and needs to be obtained by surface detection devices such as TDR or by velocity analysis. To solve these problems, Economou et al. proposed a GPR data diffraction focusing method without velocity models [19]. However, most of the velocity analysis methods are done in 2D slices and obtain the soil velocity by stacking the amplitude on the hyperbolic path with different velocities. For shallow targets like landmines, the hyperbolas are usually not distinct in 2D slices and will be masked by the surface reflections. In this case, the 2D velocity analysis methods can not obtain the subsurface velocity of high quality. Therefore, we proposed a 3D migration depth focus velocity analysis method for hand-held GPR to estimate the background velocity of the subsurface. This method is based on comparing the areas of an object after migrating a GPR image with different velocities. In this paper, we introduce the basic principles of the 3D migration depth focus velocity analysis technique and describe the implementation of the proposed method to an experimental GPR data collected with ALIS. The velocity of the background can be obtained accurately. 3D migration with the obtained velocity can achieve subsurface imaging of high quality, and accurate position and depth can be obtained.
2. 3D Migration Depth Focus Velocity Analysis
The Migration velocity analysis is based on migration imaging. The migration processing technology is now commonly used for GPR data [20]. It can construct the target reflector surface from the record surface and increase the signal-clutter ratio [21]. The migration used in this study is 3D diffraction stacking migration [22]. According to the error judgment criterion, the migration velocity analysis methods can be divided into the residual curvature analysis (RCA) method and the depth focus analysis (DFA) method. We used the DFA method in this study and proposed a new criterion to describe the focus degree of the target. In this section, the formulations of the 3D migration depth focus velocity analysis method are introduced. Their practical implementations are explained and illustrated.
2.1. 3D Diffraction Stacking Migration
3D diffraction stacking migration is based on the ray theory. According to the Huygens principle, each reflection point of the underground interface can be regarded as a wavelet source. The diffraction waves generated by these wavelet sources can reach the surface and be received by receiving antenna. The time-distance curves of these diffraction waves received by the ground are hyperbolic. Thus, for each point of the image, we construct a diffraction hyperboloid in the image and determine where the hyperboloid intersects with each trace. Subsequently, we take the value of each track at the intersection and add all these values together. The sum is treated as the value of the pixel, and the value is placed in the migration image at this point. The equation of 3D diffraction stacking migration can be expressed as follows:
where Pout (xout, yout, zout) represents the output wavefield at the subsurface location of the diffraction point (xout, yout, zout), while Pin (x, y, z) is the input wavefield that is the GPR data. The surface area A represents a hyperboloid with a fixed point of (xout, yout, zout), which can be formulated as follows:
where v denotes the propagation velocity of the EM wave in the background medium.
2.2. Depth Focus Velocity Analysis
Migration velocity analysis is performed on the basis of the images after migrations. It uses the migrated images to establish a criterion of velocity analysis. In this study, we use the degree of the focus of the migration image at the reflection point as the velocity analysis criterion. When the EM wave velocity chosen for the migration is close to the EM wave velocity of the background, the imaging area of the target is the smallest in the migrated image. Therefore, we first pick out the depth slice containing the target and then calculate the velocity analysis criterion.
In signal processing, cross-correlation is a method to characterize the displacement of two signals, it is a measure of the similarity of two series. For a migrated GPR image, two adjacent depth slices containing the target have a higher similarity than two adjacent depth slices without the target. Therefore, we can calculate the cross-correlation of every two adjacent depth slices. To find the position where the maximum cross-correlation appears, we can calculate the standard deviation for every cross-correlation result. The depth range in which the standard deviation has a local maximum is where the target exists. Among the depth range of the target, we can obtain the depth slice with the largest averaged value, and the depth of this slice is considered to be the depth of the target.
2.2.1. Cross-Correlation
For every two adjacent depth slices of GPR migration image g(x, y) and h(x, y):
where K represents the number of the depth slices. The 2D FFT of g(x, y) and h(x, y) are G(fx, fy) and H(fx, fy). Subsequently, we can obtain the convolution results as follows:
And the cross-correlation result can be obtained as follows:
2.2.2. Standard Deviation
When the similarity of two adjacent depth slices shows high strength, the area of the target imaging is the smallest. Therefore, we obtain the standard deviation of every cross-correlation result as follows:
where M × N represents the size of ϕ(x, y), ϕm represents the mean value of ϕ. By searching the local maximum of s, we can find the depth slice with the largest averaged value around it and the corresponding depth is considered as the depth of the target.
2.2.3. Velocity Analysis
The following objective function is defined to characterize the target radio of a migrated image slice:
where R denotes the target ratio, N(ϕ(x, y) ≥ ε) represents the number of pixels in the migrated image slice whose value is greater than a certain threshold ε. Usually, the ε is set to the middle value of the maximum and the minimum values in the migrated image slice.
For each migration image with different velocities, we choose the depth containing the imaging of the target. Subsequently, the R value for each depth slice can be obtained. The migration velocity corresponding to the depth slice with the smallest R value is considered to be the EM wave velocity of the background.
3. Application to Experimental Data
3.1. Experiment Description
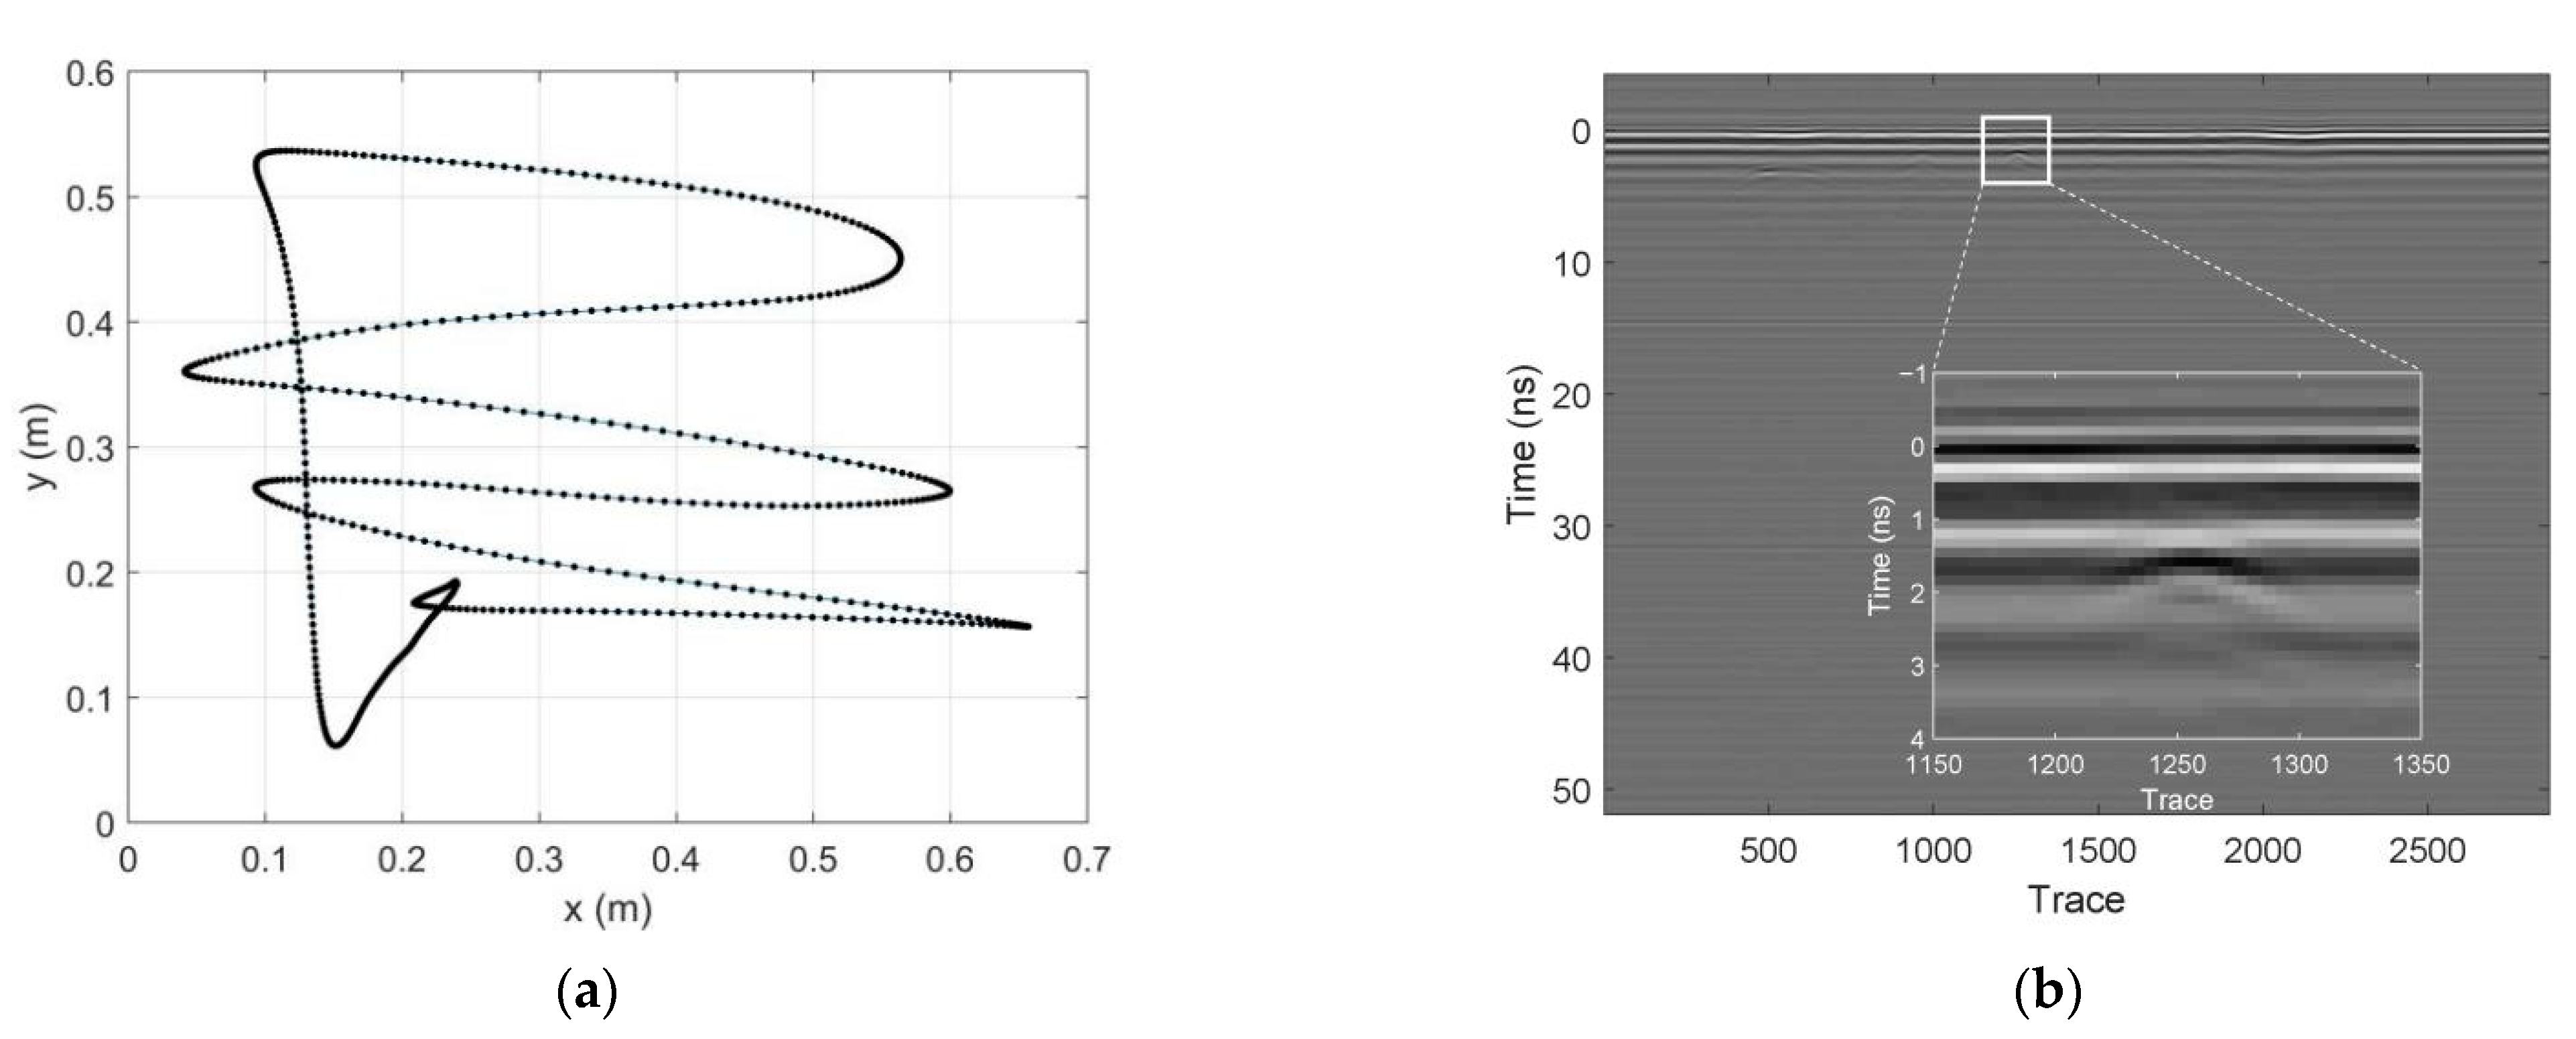
In order to verify the 3D migration depth focus velocity analysis method, we apply the procedure to experimental GPR data collected with ALIS in the laboratory. The target was a PMN-2 anti-person (AP) landmine model without the booster. The diameter and the height of the model are approximately 12 cm and 5.3 cm, respectively. It was buried at about 10 cm depth in the sand which is shown in Figure 1. The permittivity of the sand is approximately 5.5 and the corresponding EM velocity is about 0.1279 m/ns. The ground surface was almost flat. A human controlled the ALIS to scan the area with the buried landmine. Figure 2a shows the track of the GPR sensor and the measurement points. Figure 2b shows the raw data of ALIS.
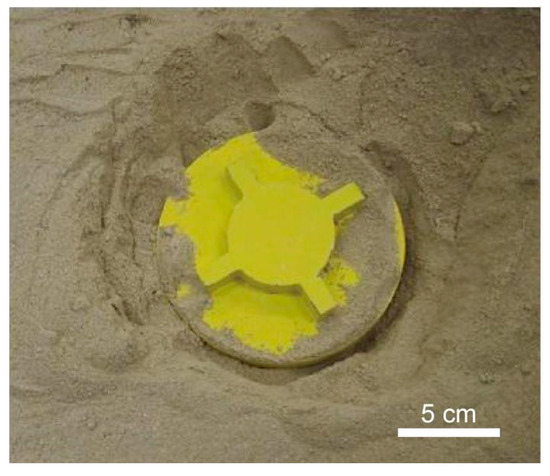
Figure 1.
PMN-2 anti-person landmine.
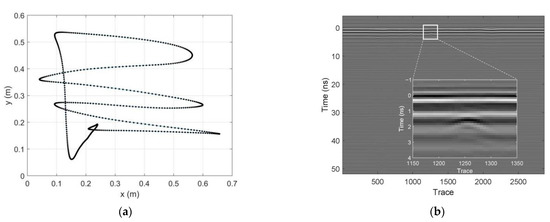
Figure 2.
The data acquisition of ALIS. (a) Survey line and measurement points of GPR. (b) Original raw data of ALIS.
3.2. Signal Processing
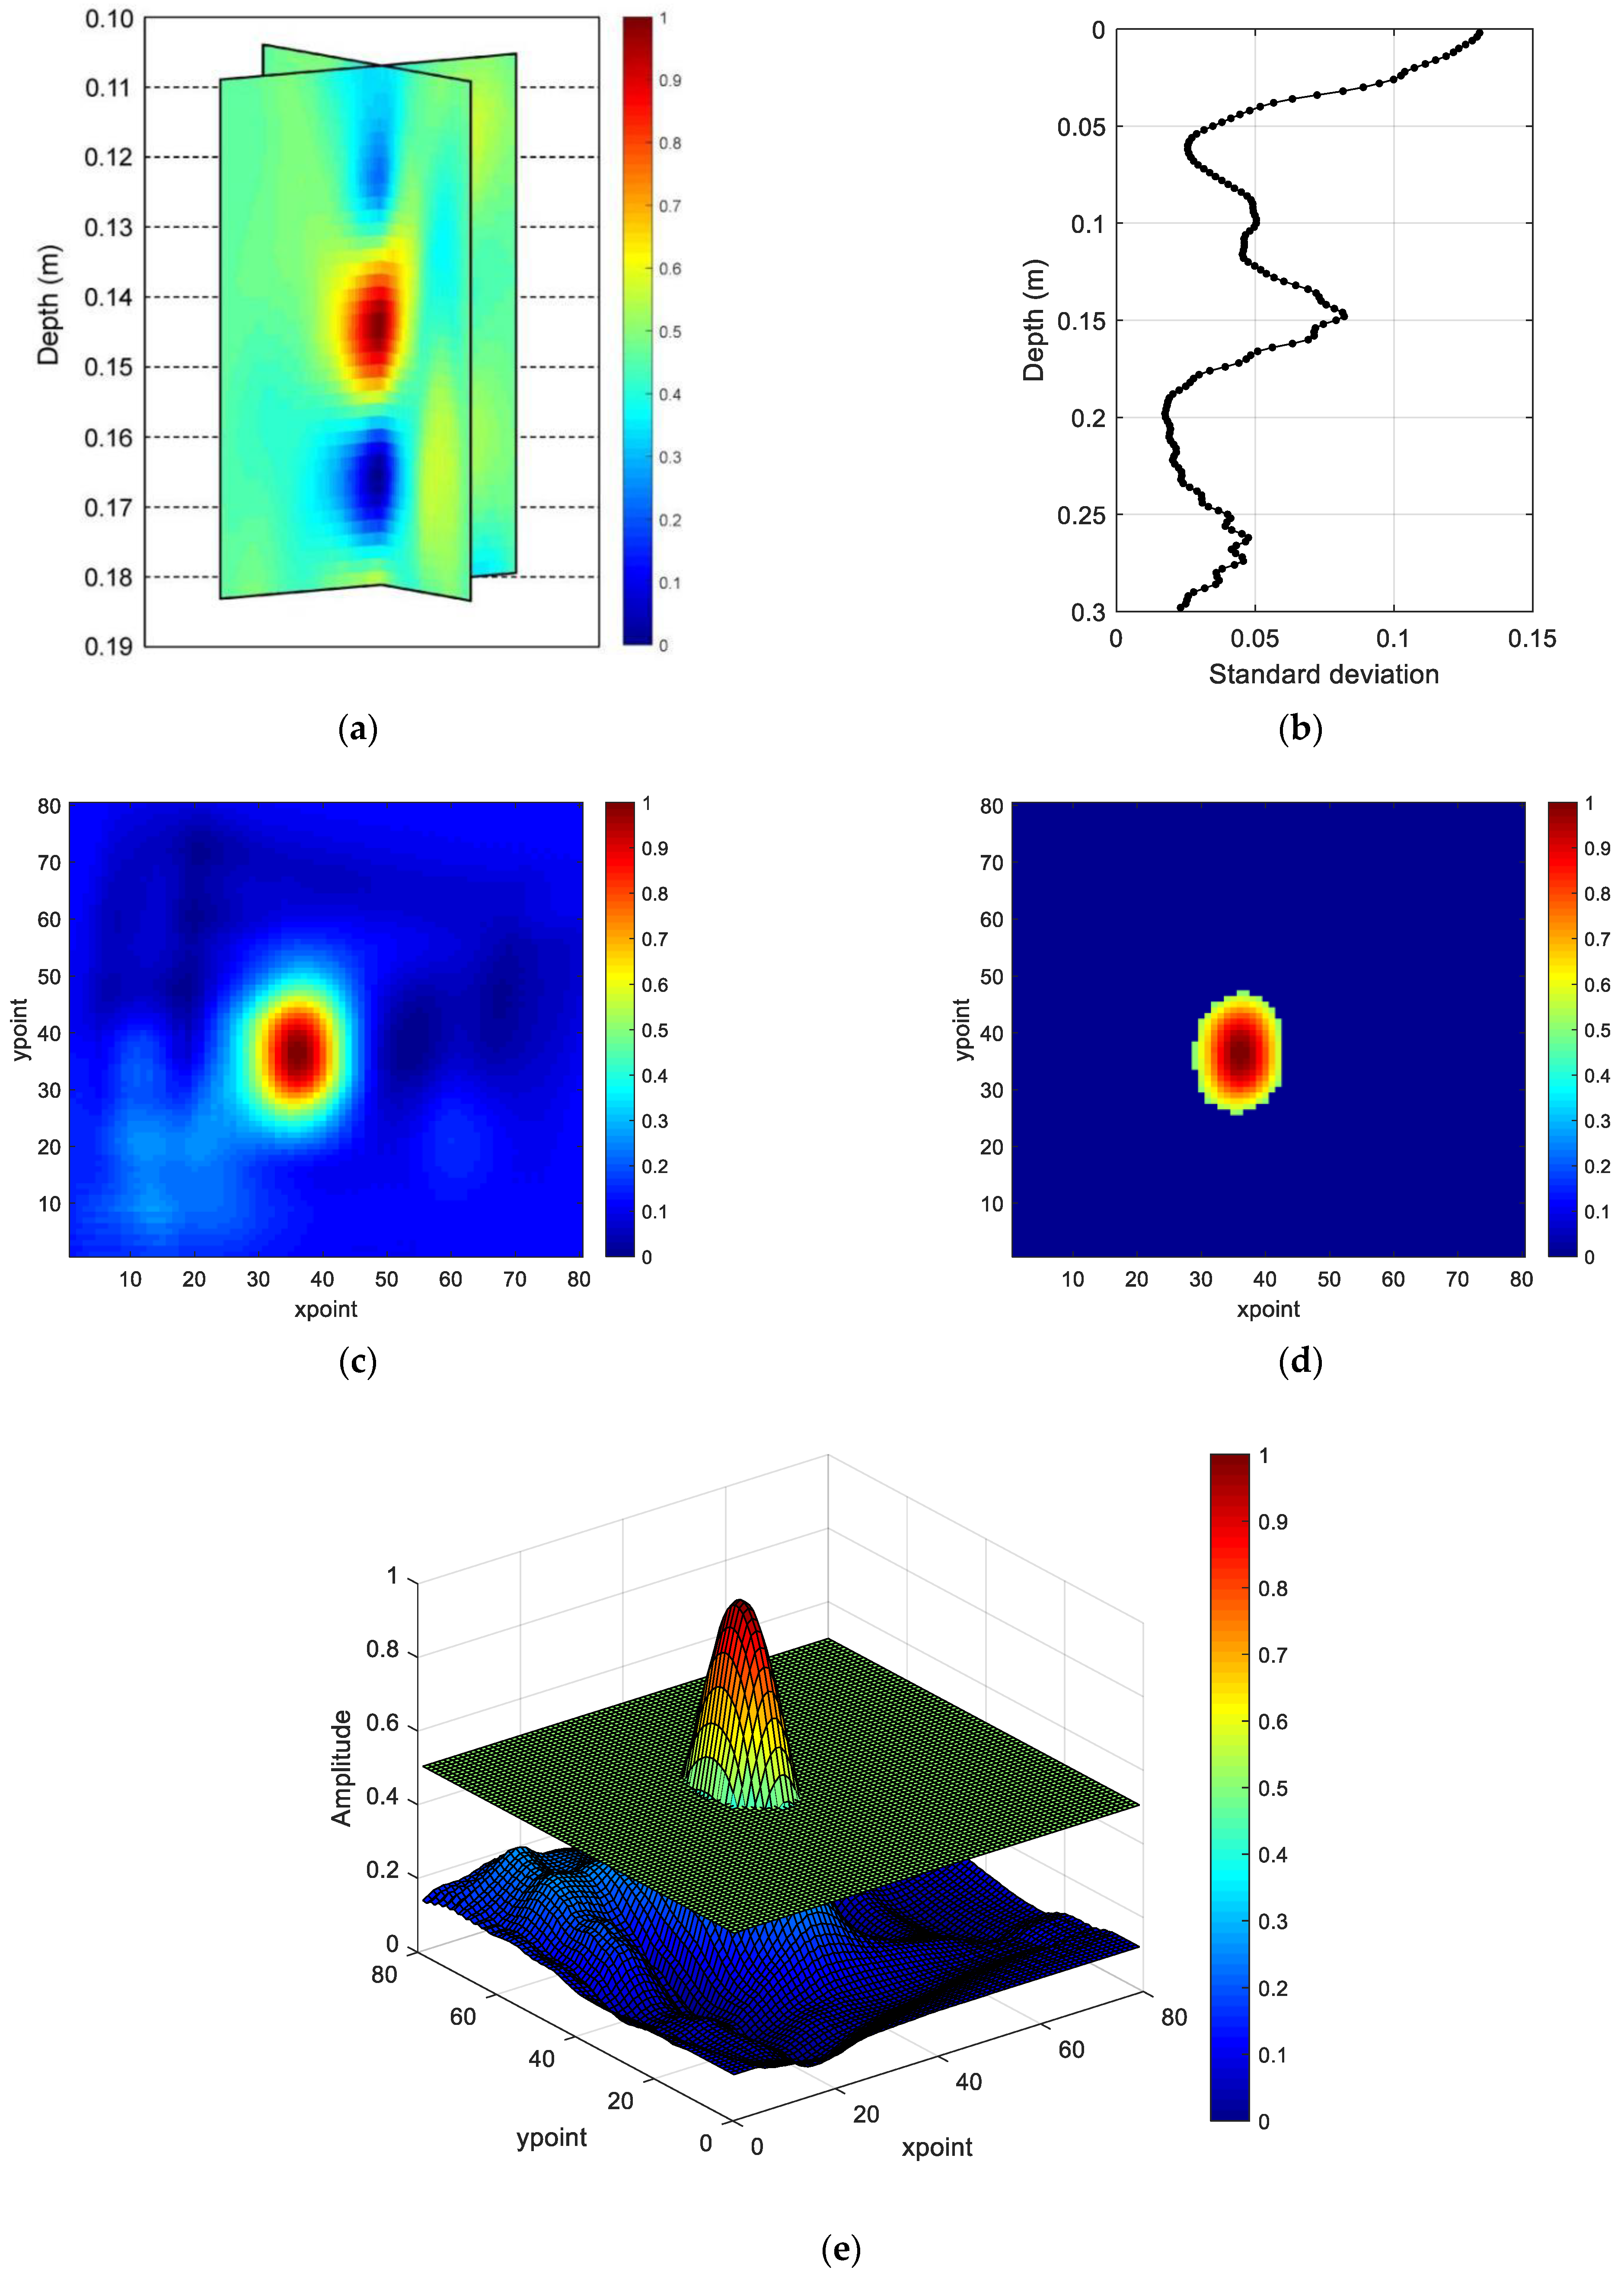
During the measurement, the GPR sensor is several centimeters above the ground. The use of the GPR needs some training to keep it steady. If the fluctuation of ground surface is severe, we can use the ground surface reflection compensation method to calibrate the error [23]. In this study the ground surface is almost flat, which can be seen from the radargram in Figure 2b. First, we removed the effects of antenna coupling components by subtracting the average of the measured data. Because the acquisition position was almost random, a grid GPR data set was produced before the migration processing. Subsequently, we migrated the grid GPR data with several different velocities, and the results are shown in Figure 3. From the figure, we can find that all the migrated GPR results can give clear images of the target, but the depths of the target are highly different from the migrated images. For example, when we perform the migration with the velocity of 0.17928 m/ns, the image shows that the target is at the depth of 0.17 m, while the migration image with the velocity of 0.10000 m/ns shows the depth is about 0.08 m. Subsequently, for every migrated image with different velocities, we chose the depth slices containing the target and calculated the target ratios R for each depth slice. Figure 4 shows the signal processing results at the velocity of 0.15596 m/ns for example. Figure 4a shows vertical slices of the migrated GPR data. Figure 4b is the standard deviation result of the cross-correlation results. Figure 4c,e are the depth slices containing the target. Figure 4d shows the pixels in the migration image slice with values greater than a threshold (ε = 0.5).
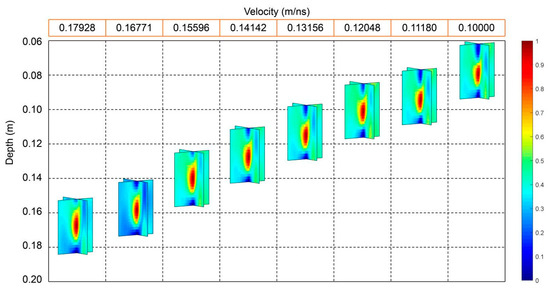
Figure 3.
Vertical slices of migrated GPR data with different velocities.

Figure 4.
Signal processing results at the velocity of 0.15596 m/ns. (a) Vertical slices of the migrated GPR data. (b) The standard deviation of cross-correlation. (c) Depth slice containing the target. (d) Pixels in the migration image slice with values greater than a certain threshold. (e) Depth slice containing the target with the threshold plane (ε = 0.5).
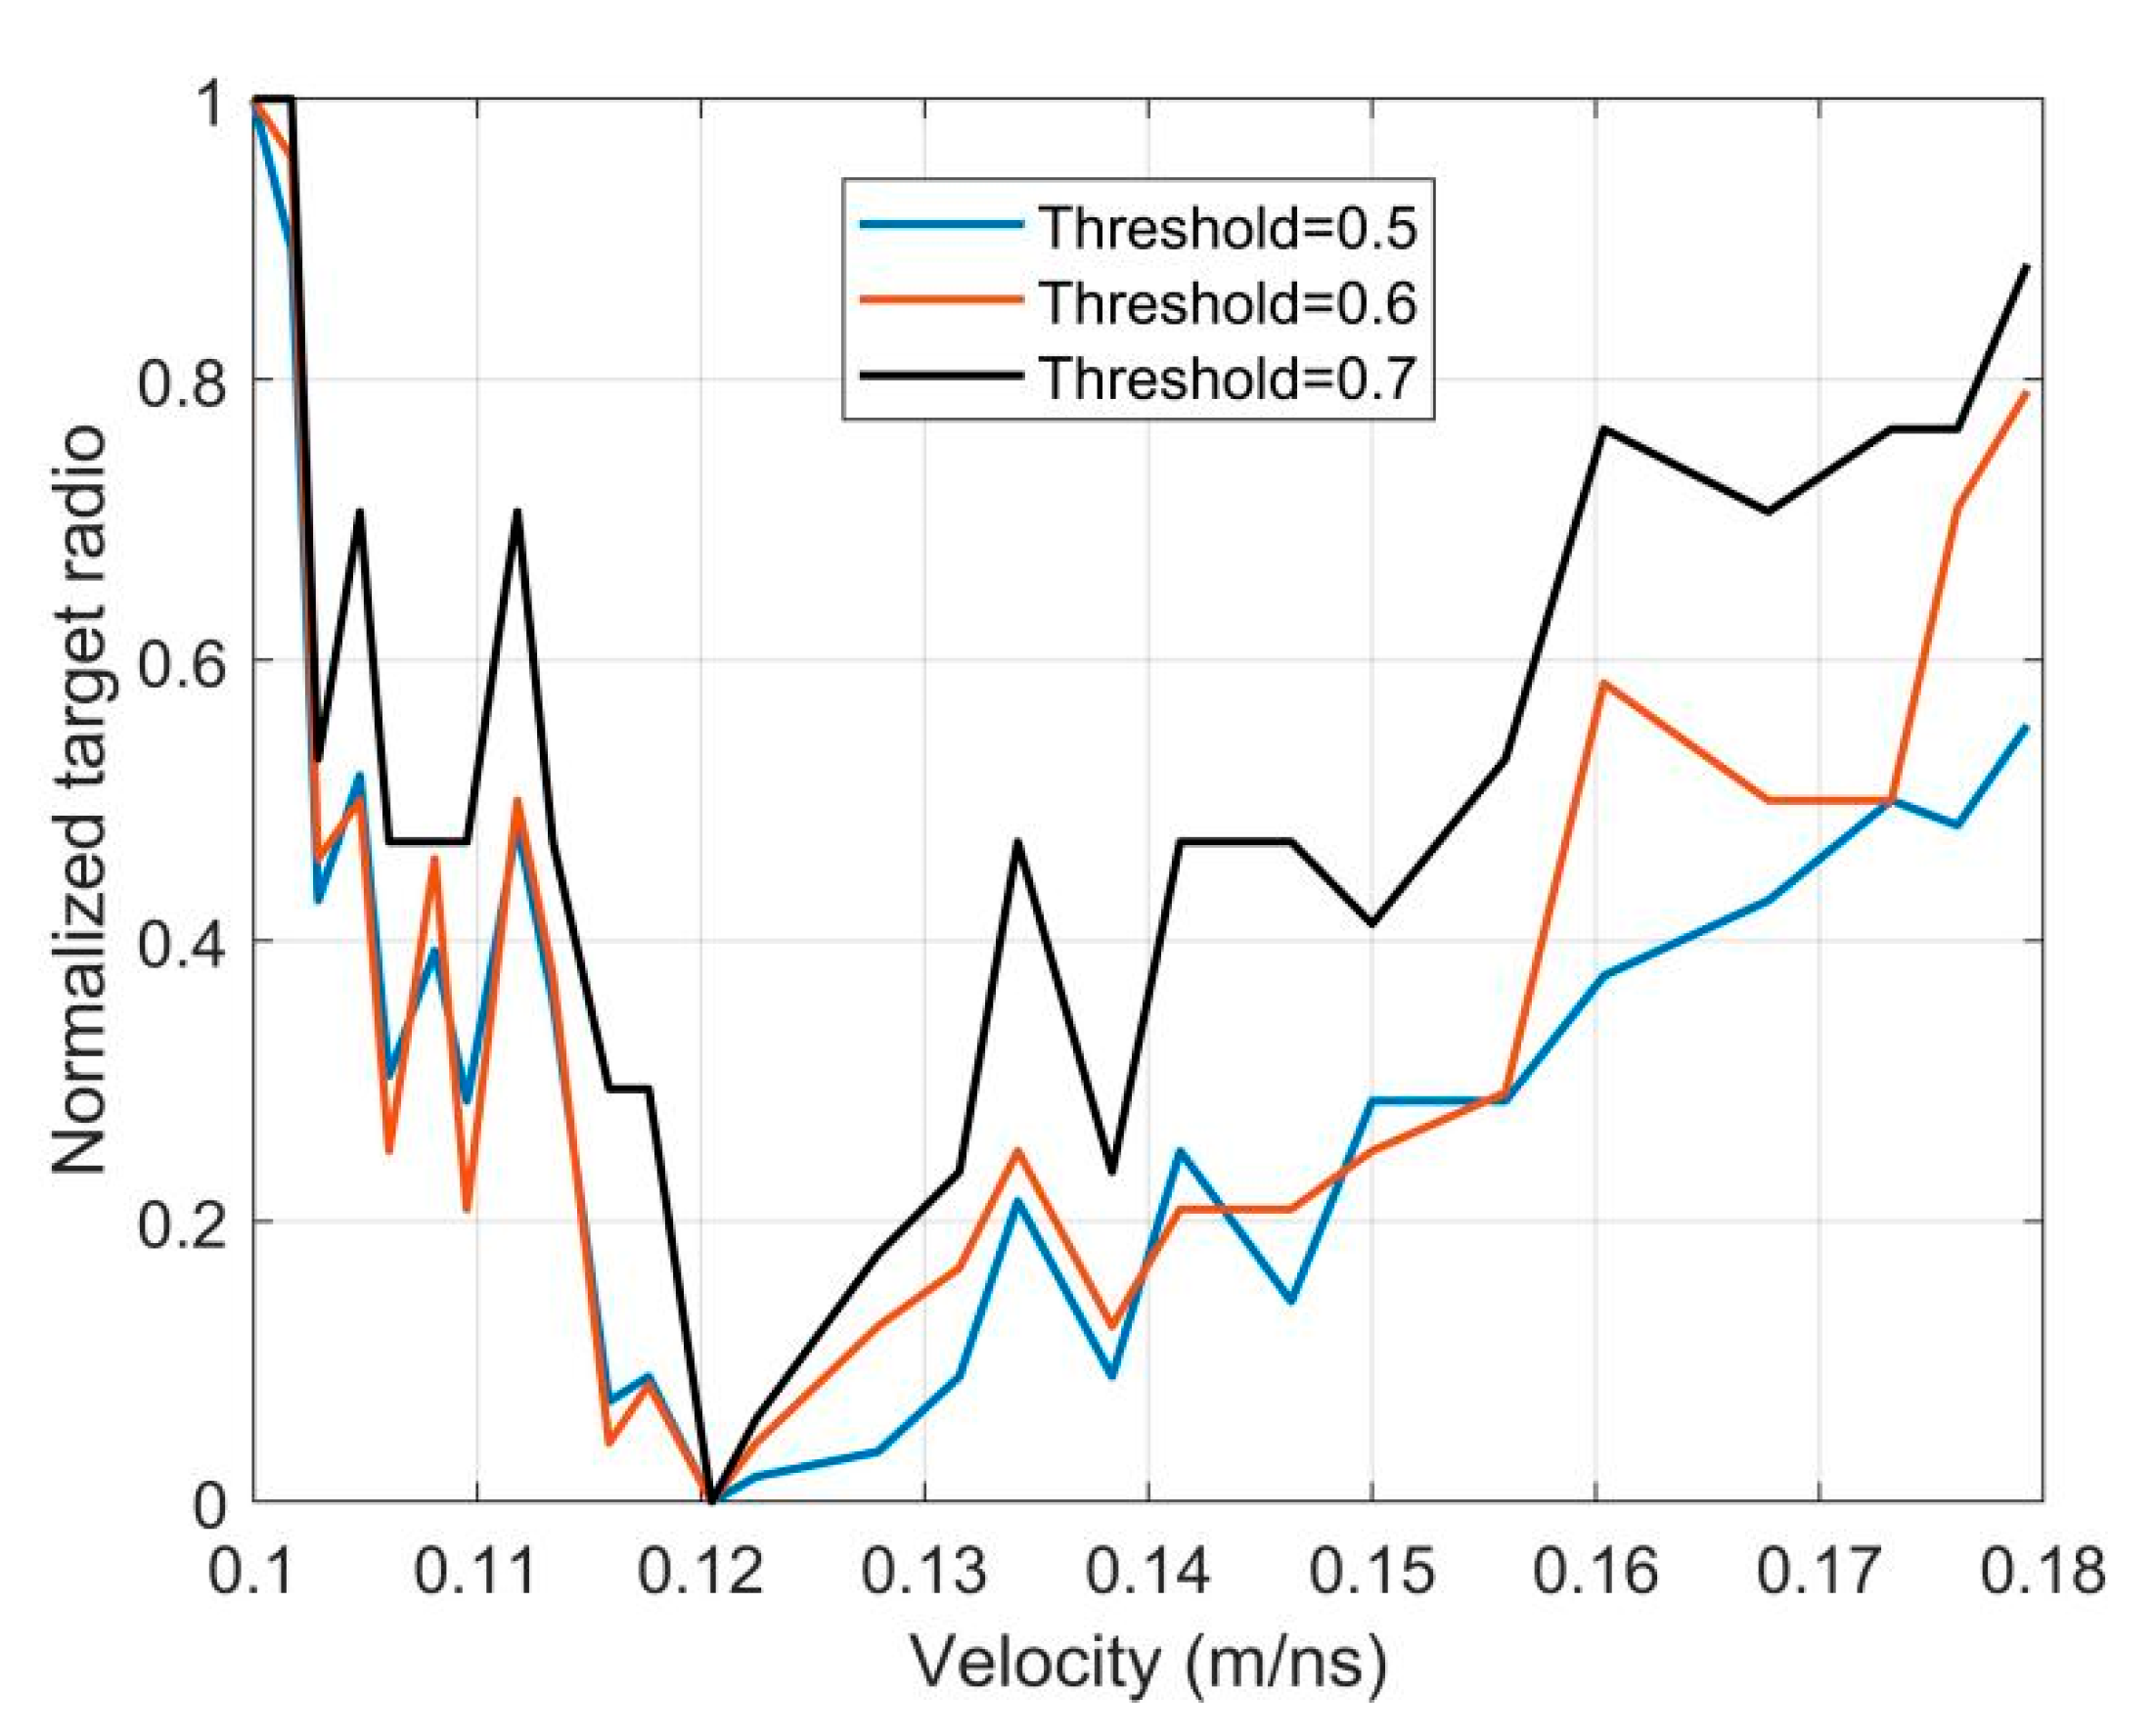
Figure 5 shows the target ratios R for migrated image slices with different velocities and different thresholds (ε). In this study, we respectively chose velocities from 0.10000 m/ns to 0.17928 m/ns, values of ε are set to 0.5, 0.6, and 0.7. The horizontal axis in Figure 5 indicates the velocity used in migration, and the vertical axis indicates the target ratio after normalization. The three different curves represent different thresholds. Comparing these three curves, we can find that the curve with the ε equal to 0.7 has a larger average slope than the other curves, and the curve with the ε equal to 0.5 is smoother than the other two curves. Although all three curves contain outliers, their overall orientation is consistent. From the figure, we can find that three different thresholds give the same result. When the velocity chosen for migration is 0.12048 m/ns, the target ratio is the smallest, and the depth of the target is 0.0986 m. This estimated depth of the target is consistent with the true depth.
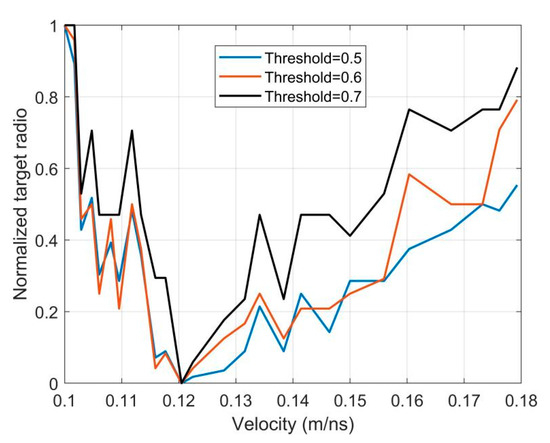
Figure 5.
Target ratio of different velocities under three thresholds.
4. Discussions
4.1. Comparison with Entropy-Based Migration Velocity Analysis Method
In this section, we perform a comparison between our proposed method and the entropy-based migration velocity analysis method [24]. Both methods use different EM velocities to perform migrations. Differently, the entropy-based method adopts the image entropy to evaluate the accuracy of the applied velocities [24]. The entropy characterizes the randomness of an image and can be approximated by the formula below [25,26]:
where ϕ(x, y) is an M × N sized slice similar to (7).
In the test, different EM velocities from 0.08321 m/ns to 0.1897 m/ns are applied to the migrations. Similar to Section 3.2, we extracted the slices with the target and used (8) to compute the image entropy results. Figure 6 shows the relations between the applied velocities and the computed IM results. The velocity (0.1225 m/ns) with minimum IM in the figure represents the estimated result by the entropy-based method. The result is close to the result (0.12048 m/ns) obtained by our proposed method. However, when the velocities are set to 0.1–0.12 m/ns, the values of the IM curve in Figure 6 are all very close to the minimum value. Therefore, if the noise is stronger, the result of the entropy-base method may be unstable. For the result of our proposed method in Figure 5, the minimum values are distinct for the three curves. By testing different values of thresholds, the accuracy of the result can also be strengthened.
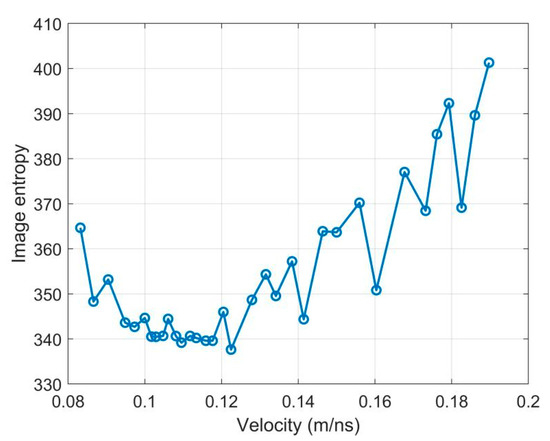
Figure 6.
The migration velocity analysis results using image entropy. The minimum corresponds to 0.1225 m/ns.
4.2. Advantages, Limitations, and Significance
In Section 4.1 we compared our proposed method with the entropy-based method. Both methods apply different EM velocities to migrations. Apart from migration velocity analysis, there are some other similar methods to obtain the EM velocity such as the hyperbolic fitting and velocity spectrum. These methods are widely used in geological surveys and also use different velocities to perform the analysis [27,28]. The hyperbolic fitting is more efficient but with low accuracy as it is subjective to human beings. The velocity spectrum is the updated method of the hyperbolic fitting method. It is more time-consuming but has higher accuracy. Apart from these methods, some researchers also use certain buried targets to perform the analysis [29]. This method can obtain accurate permittivity and conductivity of the subsurface but requires a target with a known depth. It is more suitable for obtaining the feature of the subsurface before field measurements.
Compared to the first two methods, the migration-based methods are also more time-consuming but can obtain accurate velocity and imaging results. Therefore, it is more suitable for the handheld GPR and the detection of point targets like landmines. For the third method, the migration-based method can simultaneously obtain the EM velocity and target depth. It does not depend on the target with a known depth, so it is more flexible in landmine detection.
This paper proposes the 3D velocity analysis method for handheld GPR data. We use a buried landmine to test our method. In the test, the landmine is a point target and its depth is known. The obtained velocity and depth can be compared with the true values. Therefore, it is also a typical example to validate the effects of velocity for 3D GPR migration imaging and the application of the proposed method is not limited to the handheld GPR. 3D imaging is widely used in GPR applications to geoscience. For example, Yuan et al. and Lai et al. use the lunar penetrating radar(LPR) data to establish the 3D model at Chang’E-3 and Chang’E-4 landing sites and reveal the complex geological evolution on Moon [30,31]. These two impressive works also use the irregularly surveyed GPR data to construct 3D slices of subsurface [30,31]. Our work verifies that to obtain an accurate 3D model using 3D migration, accurate EM velocity is necessary. If the velocity is misestimated, the depths of subsurface structures will also be erroneous, which will seriously affect the geological modeling and interpretations. Our proposed method provides an effective and efficient way to access the EM velocity of the subsurface which contributes greatly to general geoscience applications of GPR.
5. Conclusions
This paper proposes the 3D migration depth focus velocity analysis method for estimating the background velocity of EM waves using the hand-held GPR data. The presented method is based on a principle of energy concentrating maximization to search for the velocity which provides the best target focusing. This method is performed by comparing the areas of the object after migrating the GPR image with different velocities, then we can find the velocity which minimizes the target ratio. After applying the proposed method to an experimental hand-held GPR data, we obtained the effective velocity of the background and the depth of the target with high accuracy. Three different thresholds are selected to test the method, and all of them gave the same result. Comparing the three curves with thresholds equal to 0.5, 0.6, and 0.7, we find that the appropriate selection of the threshold value will provide the optimal result. The comparison with the entropy-based migration velocity analysis method indicates that the proposed method is more stable.
Author Contributions
Conceptualization, Z.D. and M.S.; methodology, Z.D., M.S. and X.F.; software, Z.D., X.F. and H.Z.; validation, Z.D., M.S. and H.Z.; formal analysis, Z.D., M.S., X.F. and H.Z.; investigation, M.S. and X.F.; resources, M.S.; data curation, Z.D., M.S. and L.Z. writing—original draft preparation, Z.D. and H.Z.; writing—review and editing, M.S. and X.F.; visualization, Z.D.; supervision, M.S. and X.F.; project administration, M.S.; funding acquisition, M.S. All authors have read and agreed to the published version of the manuscript.
Funding
This research was funded by the Science and Technology on Near-Surface Detection Laboratory and by JSPS KAKENHI Grant Number JP19KK0102.
Institutional Review Board Statement
Not applicable.
Informed Consent Statement
Not applicable.
Data Availability Statement
The data used in this research is available by contacting the authors.
Conflicts of Interest
The authors declare no conflict of interest.
References
- Zhou, H.; Sato, M.; Liu, H. Migration velocity analysis and prestack migration of common-transmitter GPR data. IEEE Trans. Geosci. Remote Sens. 2005, 43, 86–91. [Google Scholar] [CrossRef]
- Daniels, D.J. Ground Penetrating Radar, 2nd ed.; IEEE: London, UK, 2004. [Google Scholar]
- Feng, X.; Yu, Y.; Liu, C.; Fehler, M. Combination of H-Alpha decomposition and migration for enhancing subsurface target classification of GPR. IEEE Trans. Geosci. Remote Sens. 2015, 53, 4852–4861. [Google Scholar] [CrossRef]
- Feng, X.; Yu, Y.; Liu, C.; Fehler, M. Subsurface polarimetric migration imaging for full polarimetric ground-penetrating radar. Geophys. J. Int. 2015, 202, 1324–1338. [Google Scholar] [CrossRef] [Green Version]
- Feng, X.; Sato, M. Landmine imaging by a Hand-held GPR and metal detector sensor (ALIS). In Proceedings of the 2005 IEEE International Geoscience and Remote Sensing Symposium, IGARSS’05, Seoul, Korea, 29 July 2005; Volume 1, pp. 379–382. [Google Scholar]
- Feng, X.; Fujiwara, J.; Zhou, Z.; Kobayashi, T.; Sato, M. Migration and interpolation for the hand-held GPR MD sensor system (ALIS). In Proceedings of the Detection and Remediation Technologies for Mines and Minelike Targets XI, SPIE, Orlando, FL, USA, 17–21 April 2006; Volume 6217, pp. 67–73. [Google Scholar]
- Feng, X.; Fujiwara, J.; Zhou, Z.; Kobayashi, T.; Sato, M. Imaging algorithm of a Hand-held GPR MD sensor (ALIS). In Proceedings of the Detection and Remediation Technologies for Mines and Minelike Targets X, SPIE, Tokyo, Japan, 21–23 June 2005; Volume 5794, pp. 1192–1199. [Google Scholar]
- Sato, M.; Fujiwara, J.; Feng, X.; Zhou, Z.; Kobayashi, T. Development of a hand-held GPR MD sensor system (ALIS). In Proceedings of the Detection and Remediation Technologies for Mines and Minelike Targets X, SPIE, Tokyo, Japan, 21–23 June 2005; Volume 5794, pp. 1000–1007. [Google Scholar]
- Sato, M.; Kikuta, K. Dual sensor ‘Alis’ for humanitarian demining. In Proceedings of the IGARSS 2018 IEEE International Geoscience and Remote Sensing Symposium, Valencia, Spain, 22–27 July 2018; pp. 8428–8431. [Google Scholar]
- Sato, M.; Kikuta, K. Image reconstruction and processing algorithm of GPR for humanitarian demining sensor ALIS. In Proceedings of the 2018 International Conference on Electromagnetics in Advanced Applications (ICEAA), Cartagena de Indias, Colombia, 10–14 September 2018; pp. 118–121. [Google Scholar]
- Schleicher, J.; Daniels, D.; Hammerton, P. A multiple migration and stacking algorithm designed for land mine detection. IEEE Trans. Geosci. Remote Sens. 2014, 52, 6983–6988. [Google Scholar]
- Novais, A.; Costa, J.; Schleicher, J. GPR velocity determination by image-wave remigration. J. Appl. Geophys. 2008, 65, 65–72. [Google Scholar] [CrossRef]
- Yilmaz, Ö. Seismic Data Analysis; Society of Exploration Geophysicists: Tulsa, OK, USA, 2001. [Google Scholar]
- Leparoux, D.; Gibert, D.; Cote, P. Adaptation of prestack migration to multi-offset ground-penetrating radar (GPR) data. Geophys. Prospect. 2001, 49, 374–386. [Google Scholar] [CrossRef]
- Feng, X.; Sato, M. Pre-stack migration applied to GPR for landmine detection. Inverse Probl. 2004, 20, S99–S115. [Google Scholar] [CrossRef]
- Hagedoorn, J.G. A process of seismic reflection interpretation. Geophys. Prospect. 1954, 2, 85–127. [Google Scholar] [CrossRef]
- Feng, X.; Sato, M.; Liu, C. Hand-held GPR imaging using migration for irregular data. IEEE J. Sel. Topics Appl Earth Observ. Remote Sens. 2011, 4, 799–803. [Google Scholar] [CrossRef]
- Gonzalez-Huici, M.A. Adaptative Stolt migration via contrast maximization for GPR applications. In Proceedings of the 6th International Workshop on Advanced Ground Penetrating Radar (IWAGPR), Aachen, Germany, 22–24 June 2011; pp. 1–5. [Google Scholar]
- Economou, N.; Vafidis, A.; Bano, M.; Hamdan, H.; Ortega-Ramirez, J. Ground-penetrating radar data diffraction focusing without a velocity model. Geophysics 2020, 85, 1MJ–Z13. [Google Scholar] [CrossRef]
- Lopez-Sanchez, J.M.; Fortuny-Guasch, J. 3-D radar imaging using range migration techniques. IEEE Trans. Antennas Propag. 2000, 48, 728–737. [Google Scholar] [CrossRef]
- Zhuge, X.; Savelyev, T.G.; Yarovoy, A.G.; Ligthart, L.P.; Levitas, B. Comparison of different migration techniques for UWB short-range imaging. In Proceedings of the European Radar Conference (EuRAD), Rome, Italy, 30 September–2 October 2009; pp. 184–187. [Google Scholar]
- Schneider, W.A. Integral formulation for migration in two and three dimensions. Geophysics 1978, 43, 49–76. [Google Scholar] [CrossRef]
- Kondo, T.; Kikuta, K.; Sato, M. Ground surface reflection compensation for hand-held GPR. IEEE Geosci. Remote Sens. Lett. 2022, 19, 3501605. [Google Scholar] [CrossRef]
- Xu, X.; Miller, E.L.; Rappaport, C.R. Minimum entropy regularization in frequency-wavenumber migration to localize subsurface objects. IEEE Trans. Geosci. Remote Sens. 2003, 41, 8. [Google Scholar]
- Zhou, H.; Feng, X.; Ding, C.; Dong, Z.; Liu, C.; Zhang, Y.; Meng, Z. Yutu-2 radar sounding evidence of a buried crater at Chang’E-4 landing site. IEEE Trans. Geosci. Remote Sens. 2022, 60, 4600419. [Google Scholar] [CrossRef]
- Zhou, H.; Feng, X.; Dong, Z.; Liu, C.; Liang, W. Application of denoising CNN for noise suppression and weak signal extraction of lunar penetrating radar data. Remote Sens. 2021, 13, 779. [Google Scholar] [CrossRef]
- Feng, J.; Su, Y.; Ding, C.; Xing, S.; Dai, S.; Zou, Y. Dielectric properties estimation of the lunar regolith at CE-3 landing site using lunar penetrating radar data. Icarus 2017, 284, 424–430. [Google Scholar]
- Dong, Z.; Feng, X.; Zhou, H.; Liu, C.; Zeng, Z.; Li, J.; Liang, W. Properties analysis of lunar regolith at Chang’E-4 landing site based on 3D velocity spectrum of lunar penetrating radar. Remote Sens. 2020, 12, 629. [Google Scholar] [CrossRef] [Green Version]
- Alvarez Lopez, Y.; Garcia Fernandez, M.; Arboleya Arboleya, A.; Gonzalez-Valdes, B.; Rodriguez Vaqueiro, Y.; Las-Heras Andres, F.; Pino García, A. SAR-based technique for soil permittivity estimation. Int. J. Remote Sens. 2017, 38, 5168–5185. [Google Scholar] [CrossRef]
- Yuan, Y.; Zhu, P.; Zhao, N.; Xiao, L.; Garnero, E.; Xiao, Z.; Zhao, J.; Qiao, L. The 3-D geological model around Chang’E-3 landing site based on lunar penetrating radar Channel 1 data. Geophys. Res. Lett. 2017, 44, 6553–6561. [Google Scholar] [CrossRef] [Green Version]
- Lai, J.; Xu, Y.; Bugiolacchi, R.; Meng, X.; Xiao, L.; Xie, M.; Liu, B.; Di, K.; Zhang, X.; Zhou, B.; et al. First look by the Yutu-2 rover at the deep subsurface structure at the lunar farside. Nat. Commun. 2020, 11, 3426. [Google Scholar] [CrossRef] [PubMed]


Publisher’s Note: MDPI stays neutral with regard to jurisdictional claims in published maps and institutional affiliations. |
© 2022 by the authors. Licensee MDPI, Basel, Switzerland. This article is an open access article distributed under the terms and conditions of the Creative Commons Attribution (CC BY) license (https://creativecommons.org/licenses/by/4.0/).