Article

Comparison of Geogases in Two Cenozoic Sedimentary Basins

by
Gabriele M. Berberich
1,* and
Martin B. Berberich
2
1
Wissenschaftlich-Technisches Redaktionsbüro Dr. Berberich, Am Plexer 7, D-50374 Erftstadt, Germany
2
IT-Consulting Berberich, Am Plexer 7, D-50374 Erftstadt, Germany
*
Author to whom correspondence should be addressed.
Geosciences 2022, 12(10), 388; https://doi.org/10.3390/geosciences12100388
Submission received: 4 September 2022 / Revised: 28 September 2022 / Accepted: 13 October 2022 / Published: 19 October 2022
(This article belongs to the Special Issue Geogases in Fault Zones)

Abstract

:
We investigated fault gases (helium, radon, CO2) in two seismically active Cenozoic sedimentary basins: (a) Meinweg (in 2015), at a tectonically quiescent horst structure in the Lower Rhine Embayment; and (b) Bodanrück (in 2012; Lake of Constance), in the Molasse Basin and part of the seismically active Freiburg–Bonndorf–Bodensee Fault Zone (FBBFZ). Both study areas were selected because recent “GeoBio-Interactions” findings showed that red wood ants (RWA) are biological indicators of otherwise undetected degassing systems. We combined presence/absence data of RWA nests, their spatial pattern analysis (prototype lines), seismicity and known tectonic settings with soil gas analyses (a total of 817 samples) to unveil geochemical anomalies related to tectonic developments unknown so far. Currently, Meinweg can be considered “no ants land” due to the very low background-level of geogas concentrations. Thus, anomalies (Rn-CO2) weakly trending in NE-SW extension direction emerged. This could probably indicate the onset of (re)activation of the NE-SW-trending (Variscan) structures or the development of new fractures as an aftershock process of the 1992 Roermond earthquake that occurred about 15 km to the west. Results at Bodanrück (three RWA clusters and two RWA-free corridors) revealed degassing patterns in NW-SE and NNE-SSW directions in the clusters corresponding to re-activated and recent strike-slip fault systems. No gas anomalies were found in RWA-free corridors. The RWA nest distribution was shown to be a valuable tool for identifying areas of even actively degassing spotty anomalies caused by macro- and microscale brittle deformation masked by sediment cover.

1. Introduction

Soil gas analyses can be used to semi-quantitatively detect subsurface fault structures and crustal deformations in seismically active areas. The most important gases are helium (He), radon (Rn), and carbon dioxide (CO2) [1,2,3]. Helium is considered an ideal geochemical tracer for crustal fluid motion [4]. Radon can be used as a tracer providing a qualitative measure of gas migration [5,6]. CO2 serves as a carrier gas for, e.g., Rn, and is produced by deep processes such as mantle degassing or thermo-metamorphic reactions. CO2 is an important fault indicator, especially in areas with extensional tectonics [7]. Gases may flow through rocks along fault cuts or macro/microscale fracture systems and form (1) linear fault-bound anomalies, (2) irregularly shaped diffuse or “halo” anomalies and (3) irregularly spaced plumes or “spot anomalies” (e.g., [8]). Therefore, gas-bearing properties of faults are not necessarily continuous along a tectonic system [5,9]. However, in areas with several hundred meters of sediment cover, e.g., in the Lower Rhine Embayment (LRE) or the Alpine Molasse Basin (MB), it is difficult to detect buried fault structures.
A recent research approach, “GeoBio-Interactions”, that examined a combination of geoscientific and biological factors, found that red wood ants (F. rufa-group; hereafter RWA) can be used as a biological indicator for both, otherwise undetected degassing systems and faults [10,11]. RWA nests were “eight times more likely to be found within 60 m of known tectonic faults than were random points in the same region but without nests” [12]. The results also showed that geogenic gases [13], rock formations with elevated Rn concentrations [14], fault-related CH4 emissions [15], volatile organo-halogens, alkanes and limonene [16] play key roles in the settlement of RWA nests. Physical phenomena such as tectonic stress variations in the subsurface, leading to highly mobile and oxidizing electronic charge carriers and H2O2 that flow to the surface [17,18], may contribute to the survival of the colony. Ants selectively consume harmful reactive oxygen species, such as H2O2, upon exposure to a fungal pathogen [16,19]. Furthermore, the ability of RWA to detect CO2 concentrations in the soil [20,21] may provide an evolutionary advantage in site selection and nest establishments, positively influencing and supporting pupal respiration metabolism [22] and discontinuous breathing [23,24]. This “GeoBio-Interactions” approach also provides a satisfactory explanation for closely adjacent clusters of RWA nests and RWA-free areas (“no ants land”) in otherwise uniform forests.
The objective of this “GeoBio-Interaction” approach was to investigate whether a combination of tectonics (tectonic settings, e.g., presence/absence of faults, seismicity, present-day stress field), biology (presence/absence patterns of RWA nests and their preferred alignments directions indicating unknown faults (so-called prototype lines; [10,11])), and geochemistry (soil gas anomalies of fault gases helium, radon, and CO2) can shed light on the knowledge of degassing processes and fault systems relationships. Specifically, we wanted to investigate, whether clusters of RWA nests only occurred in seismically active areas and equate to underlying soil gas anomalies and thus previously unknown fault systems and vice versa.
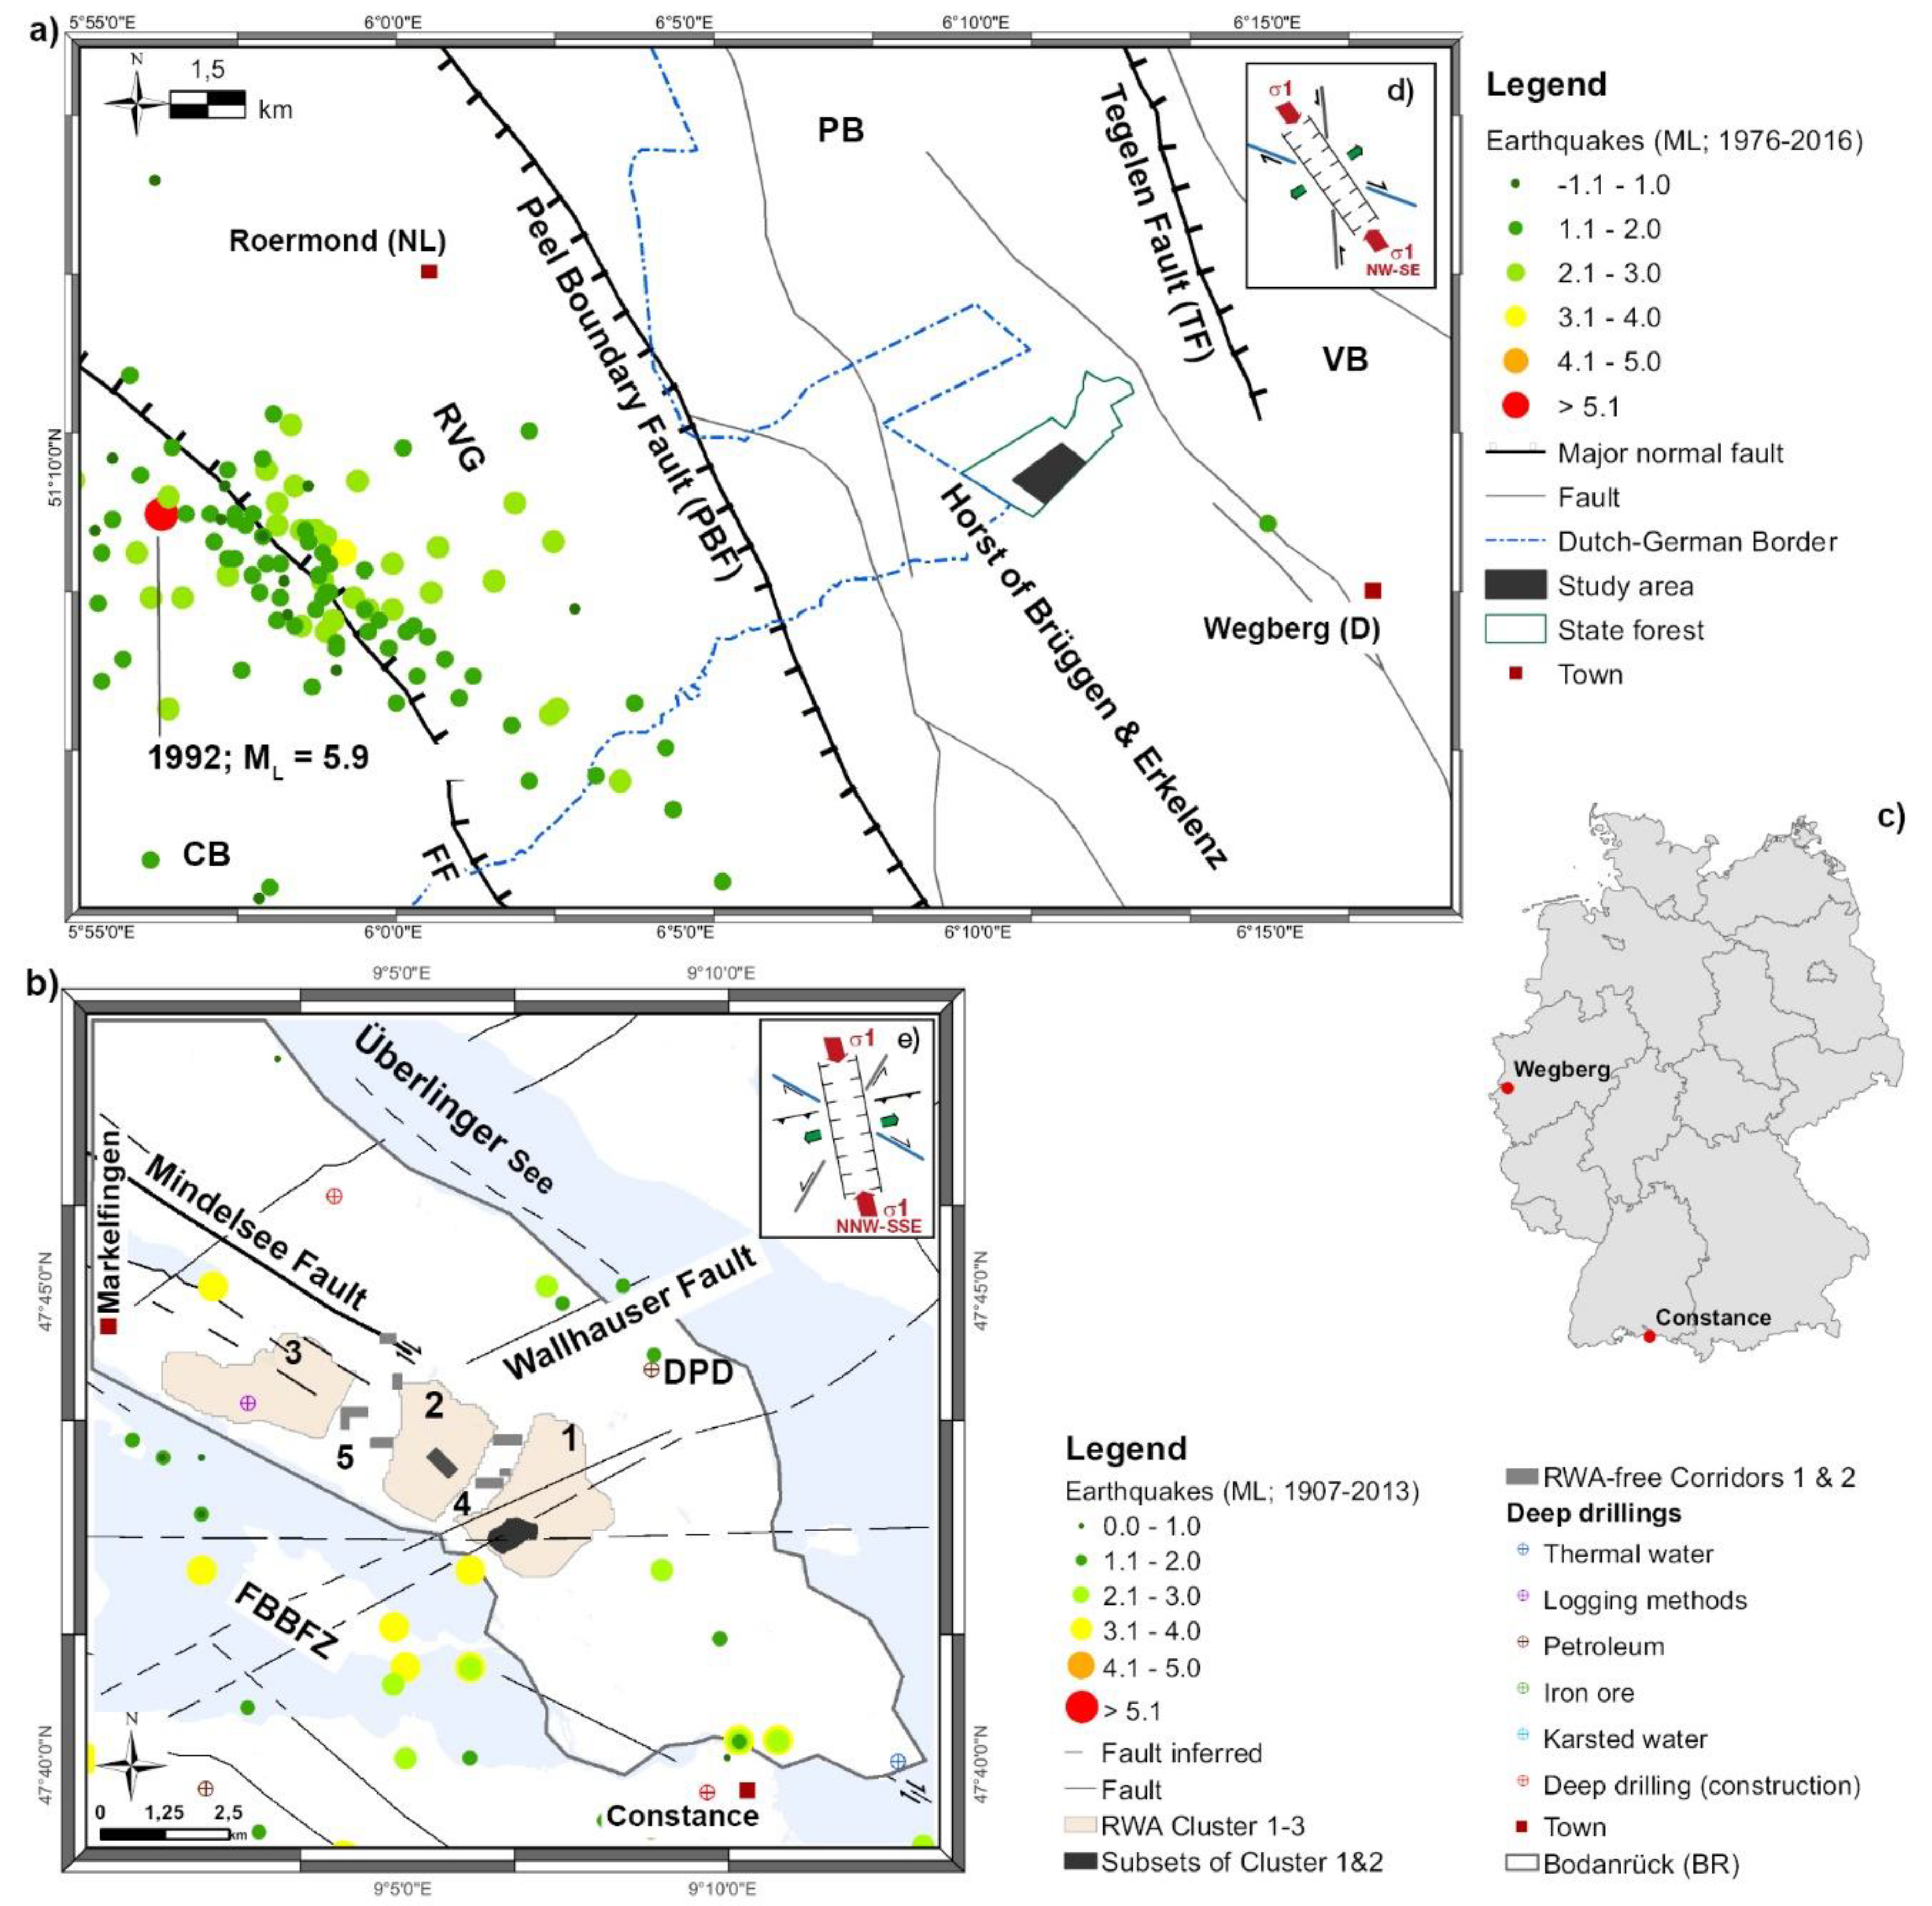
Soil gas analyses were conducted in two study areas located in two Cenozoic sedimentary basins: (a) Meinweg (MW), on the seismically inactive and stable Horst of Brüggen and Erkelenz, which is bordered by normal faults, the Peelrand Boundary fault (PBF) to the west and Tegelen fault (TF) to the east in the Lower Rhine Embayment (LRE; Figure 1a,c); and (b) Bodanrück (BR), in the seismically active part of the Molasse Basin (MB) of southwest Germany and the Freiburg–Bonndorfer–Bodensee Fault Zone (FBBFZ; Figure 1b,c). Both study areas had hot spots of RWA nests numbers (BR: three clusters) and areas with no RWA nests (BR: two ant-free corridors, MW: no ants). There is limited outcrop in both areas due to land cover, vegetation (forest stands and/or agriculture), sediments, or construction. Thus, current knowledge of the tectonic system is indeed limited and/or incomplete.
We therefore tested our hypothesis that even in sedimentary basins with deposits being hundreds of meters thick, (1) RWA preferentially establish and maintain their nests only on sites with fault gas anomalies (helium, radon, CO2), and that (2) areas with no RWA nests do not show any soil gas anomalies for helium, radon, and CO2.

2. Materials and Methods

2.1. Location and Tectonic Settings of Study Areas

2.1.1. Meinweg

The Nature Park Meinweg (MW; 0.8 km²; henceforth Meinweg; Figure 1a,c) is located approx. 6 km northwest of Wegberg and 13 km east of Roermond (The Netherlands) at the southeastern edge of the Roer Valley Rift System (RVRS), as part of the LRE. The stratigraphic and tectonic evolution of the LRE and RVRS has been extensively studied (e.g., [25,26,27,28,29,30,31,32,33,34,35,36,37,38,39,40]: The LRE is an asymmetric graben system ~100 km long and ~50 km wide, deepening toward the Roer Valley Graben (RVG) in the Netherlands.
Crustal movements and associated trans- and regression processes during the Neogene and Quaternary led to well-documented cyclic sedimentation of marine and coastal sediments under tidal conditions. In the Early Miocene, basin subsidence combined with plant compaction in extensive coastal marshes and peat bogs led to the formation of lignite seams up to 100 m thick, which have been mined in open-pit mines for decades. Due to uplift processes of the Rhenish Massif in the Pleistocene, fluviatile siliclastic sediments were deposited. Extension-related basin-fillings in the RVG have a maximum thickness of up to ~2000 m. The basin fillings are underlain by Devonian limestones (e.g., [25,26]). Both, the RVRS and LRE are part of the large European Cenozoic Rift System (ECRIS) that crosses western and central Europe [27]. During the Cenozoic, complex tectonic processes set in that triggered the subsiding North Sea basin, continent–continent collision along the Alpine front, and Ardennes compression, resulting in subsidence (rates 0.08–2.0 mm·a−1), horizontal NE-SW extension (rates 0.4–2.0 mm·a−1), and uplift (rates 0.06–2.0 mm·a−1; e.g., [26,28,29,30]). The present NW-SE compressional stress direction (~133°; [30]; Figure 1d) was established during the Middle and Late Miocene [31]. A mosaic of numerous NW-SE-trending syngenetic normal faults (Early Oligocene) with possible strike-slip component overprinted the pre-existing Paleozoic and Mesozoic structural framework. Known faults, namely the Feldbiss Fault (FF), the Peel Boundary Fault (PBF), the Tegelen Fault (TF), cut the LRE into several tectonic units forming half-graben and horst blocks [29,32,33,34]: from SW to NE, these are the uplifting Campine Block (CB), the Roer Valley Graben (RVG), the Peel Block (PB), the Horst of Brüggen and Erkelenz, and the subsiding Venlo Block (VB; Figure 1a). The faults have a significant influence on regional groundwater flow within the tectonic blocks [35]. The LRE has been seismically active since the Oligocene, with historical events exceeding ML > 6.3 [36]. A recent intraplate earthquake (ML = 5.9, depth 17 km, [37]) with dip-slip mechanism occurred on 13 April 1992, near the Dutch town of Roermond and the Peel Boundary Fault (Figure 1a). With more than 200 aftershocks, it was one of the largest in Central and NW Europe since historical times and was strongly felt in the border area of The Netherlands, Germany, and Belgium [38]. This earthquake triggered seismic activity in the RVRS up to 40 km to the southeast and caused damage in several Dutch and German cities [39]. Meinweg is located approx. 15 km east of the site of the Roermond earthquake and can be designated as “no ants land”, because no RWA nest was mapped within this seismically inactive study area.

2.1.2. Bodanrück

The Bodanrück (BR; 16 km²; Figure 1b,c) is located in the northern Alpine foreland between the towns of Markelfingen (northwest) and Constance (southeast) in the Molasse Basin. This basin is intersected along the Mindelsee fault to the south by the seismically active, NW-SE-trending Freiburg–Bonndorf–Bodensee Fault Zone (FBBFZ). The stratigraphic and tectonic evolution of this area which is related to the tilting, uplift, and erosion of the South German Block has been extensively studied (e.g., [41,42,43,44,45,46,47,48,49,50,51,52,53]). The MB is a classic WSW–ENE-trending peripheral Alpine foreland basin with a lateral distance of ~1000 km from France to Austria and a maximum width of ~130 km in Bavaria. The MB is dipping SE beneath the Alpine thrust front and has a maximum depth of ~4500 m at its deepest point.
Figure 1. Schematic depiction of location, tectonic structures [10,36,41,45,47,48,49,50,54], earthquake events [55,56,57], and sampling locations of (a) Meinweg (VB = Venlo Block; PB = Peel Block; RVG = Roer Valley Graben; CB = Campine Block; and major normal faults: FF = Feldbiss Fault, PBF = Peel Boundary Fault; TF = Tegelen fault) and (b) Bodanrück (DPD = Dingelsdorf petroleum drilling; FBBFZ = Freiburg–Bonndorf–Bodensee Fault Zone; 1–3: RWA clusters 1–3; 4–5: RWA-free corridors 1 and 2). Map (c) shows locations within Germany. Insets (d,e) show the tectonic standard models for both study areas [10].
Geosciences 12 00388 g001
The Dingelsdorf petroleum drilling at the BR, about 2 km northeast of RWA cluster 1, has revealed the geologic profile of this section of the MB [41]: During the Pleistocene, the BR was characterized by four glacial and interglacial periods. Glacial cover and movement resulted in gravel and moraine deposits (~20 m thick) and numerous drumlins (gravelly clayey ground moraine deposits) of Würm age. From the Early Oligocene to the Late Miocene, Molasse formation occurred due to the development of the Alpine Mountain chain. Preliminarily unconsolidated marine (sand, clay, and marl) and fluviatile sediments (sand, clay, conglomerates, and alluvial fan systems) also known as “Molasse” (~970 m thick) were deposited in four cycles. From bottom to top these are the Lower Marine Molasse (Early Oligocene), the terrestrial Lower Freshwater Molasse (Late Oligocene/Early Miocene), the Upper Marine Molasse (Early Miocene), and the Upper Freshwater Molasse (Middle to Late Miocene) as the uppermost molasse formation. The underlying Mesozoic–Paleozoic strata (~1730 m thick) consist of Bolus formation, consolidated Jurassic (sandstone, mudstone), Triassic (Middle Bunter, Muschelkalk, sandstone), Permian (arkose, sandstone, mudstone), and Carboniferous units (arkose and mudstone). Variscan crystalline/metamorphic rocks that are penetrated by crystalline dikes and intrusions are observed at the basement. Quaternary gravels (“Rinnenschotter”) were deposited in a ~1 km wide and NW-SE-trending channel structure that runs along the southern coast of the BR between Markelfingen and Constance, forming a confined groundwater system.
Since the Paleozoic, the BR area has been influenced by complex tectonic processes continuing into the Cenozoic and resulted in re-activated and re-arranged preexisting Paleozoic crustal discontinuities (e.g., [41,42,43,52]). Basin formation and sedimentation are suggested to be the result of combined processes, such as the northward thrusting and isostatic uplift of the Alpine Nappes and associated downward bending of the European plate, accompanied by strike-slip movements along NW–SE directions during the Late Cretaceous to Paleogene. Sedimentation and subsidence ended in the Late Miocene. Since then, uplift processes have continued at rates of up to 0.4 mm·a−1 to the present [47,50,51]. Since the Early Miocene, the stress field of the Molasse Basin has been controlled by forces from the potential gravitational energy of the Alps, resulting in a present-day main stress direction (NNW-SSE) and an ENE-WSW-oriented extension direction in southwestern Germany and the Swiss Molasse Basin [53]. Numerous faults, presumably of Miocene to Pliocene age, displace Jurassic and Neogene strata at the BR, but not the Late Pleistocene overburden [45,46]. The main fault activity of the seismically active NW-SE-trending FBBZ can be related to Middle to Late Miocene [52]. The BR is tectonically located in the unfolded foreland Molasse, which is hardly affected by the Alpine compression. The recent compression-induced NNW-SSE-directed stress field (~170°; Figure 1e) results in extensional faults (ENE-WSW to W-E direction) and NW-SE, NNE-SSW and N-S-trending faults (e.g., [41,44,45,46,47,48,49,53]). The Mindelsee Fault (right-lateral strike-slip; Figure 1b) runs along the long axis of the BR in NW-SE direction. Weak to moderate seismicity (ML < 4.2) showed historical events exceeding ML > 5.0. Geochemical soil gas anomalies indicate crustal degassing along faults [13,16,45].
More than 2600 RWA nests, divided into three clusters of 1310 (cluster 1), 915 (cluster 2) and 400 nests (cluster 3), were inventoried. These clusters are separated by two approx. NNE-SSW-trending RWA-free corridors with an average width of approx. 800 m. The Mindelsee fault is limiting the three clusters to the NE [10].

2.2. Data Collection

2.2.1. Soil Gas Sampling and Geochemical Analyses

The fault gases helium, radon, and CO2 were investigated in both study areas. A systematic sampling grid was placed depending on the area morphology and the number of RWA nests. A total of 817 soil gas samples was analyzed. In Meinweg, a 75 m × 75 m sampling grid was used, and a total of 222 samples were collected in spring 2015. At Bodanrück, a total of 427 soil gas samples (July 2011 and Mai 2012) were analyzed. The highest RWA nest numbers in cluster 1 and 2 determined the sample locations. A subset of cluster 1 (approx. 660 RWA nests on 40 ha; 337 gas samples) was sampled in a 60 m × 60 m sampling grid. Subset 2, in the center of cluster 2 (approx. 320 RWA nests on 15 ha; 90 gas samples), was sampled in slightly different sampling grid (50 m × 80 m) due to the presence of surface water (Figure 1b and Table 1; [10]). Cluster 3 was only randomly sampled and is not part of this study. In addition, selected areas of the two RWA-free corridors were sampled (60 m × 60 m sampling grid; 168 gas samples, Table 1; [10]).
Soil gas surveys were conducted during dry periods to avoid inference of meteorological factors [58]. The gases sampled were CO2 and the two trace gases heliumtot (hereafter He) and radon (Rn). Soil gas sampling followed the procedure described in [10] using a steel probe driven into the ground to a depth of 1 m. For He, a mobile, modified mass spectrometer converted to a 20 mL sample volume for a single He measurement (Alcatel ASM 142; adixen) was used on site. In parallel, standard air samples were analyzed to check the stability of the instrument. Since the samples may have been diluted by ambient atmospheric air during transfer from the syringe to the mass spectrometer, the measured residual He concentration was corrected accordingly. For Rn, 100 mL samples were transferred to evacuated, 100 mL-capacity Lucas cells coated with ZnS (Ag) plates: they were analyzed after an interval of at least three hours using a Lucas detector (JP048; Radon Detector LUK4). To obtain a semi-quantitative measure of the gas leakage (CO2) in the study area, a portable Dräger-meter equipped with a CO2 sensor was successively operated for two minutes with soil gas samples (Dräger X-am ® 7000; DrägerSensor® Smart IR CO2 HC, measuring range 0–100% by volume).

2.2.2. Collection of Tectonic Data

Information on tectonic data, such as published fault zones from geological maps (see list of geological maps this paper) of the study areas were transferred into a geographical information system.

2.3. Exploratory Data Analysis of Soil Gas

All collected information was entered into a database and processed. They were then analyzed geographically and statistically using R-Software (spatstat package [59] and ggplot2 version 1.11-7 [60] for R ([61]), Matlab 2015b (surface fitting using gridfit function [62] and ArcGIS 10.3 software.
For the subsets 1 and 2 of both clusters, gas data were summarized for each gas studied to create a compact database for the analyses.
Exploratory data analysis (EDA) was performed in advance to statistically examine and evaluate the soil gas data using the procedure proposed by [63]. Tukey boxplots [64] were used to check for evidence of multiple populations (polymodality), and extreme or outlying values. Extremely high or low values that were separate from the main body of data were omitted, and a subset without these values was created. To test for normal distribution, the skewness of the data was estimated and Shapiro-Wilk [65] and t test were calculated. Anomalous upper threshold values for the selected gases were calculated using the upper inner fence (UIF) of the boxplot [63,64] and the median + 2MAD [63] and compared to the mean ± 2SD rule [66,67]. The analysis of the sub-populations followed the procedure suggested by [68] but using the median + 2MAD rule [63] because these estimators are robust to extreme values. To evaluate the strength of a linear relationship between paired data of possible gas associations, the data were lognormally transferred, and the Pearson’s correlation analysis [69] was performed with a level of significance of p ≤ 0.05.
Gas data were then analyzed with respect to their spatial distribution, such as whether certain concentrations were clustered or randomly distributed. We used standard summary statistics, including estimates of Ripley’s K function [70], which estimate the expected number of random points within a distance r of a randomly chosen point in a plot, and the spatstat package for R to estimate K(r) for distances. Density plots were produced by using the background, threshold and maximum values and then compared to known structural features of known tectonic stress models.
Table 1. Main statistical parameters of the soil gas surveys, definitions of an upper threshold via: mean ± 2SD, upper inner fence (UIF) of a boxplot, and median + 2MAD and corresponding background values.
Gas SpeciesnMinMaxMeanMedianSDLQUQIQRSkew-nessShapiro-Wilk Testt Test (h)Mean ± 2SDUIFMedian + 2MADBackground Values
WHp
Meinweg (ntotal: 222)
He (ppm)745.165.275.225.230.025.215.240.03−0.400.9610.0115.275.295.275.22 a
Rn (BqL−1)740.0017.005.004.004.003.007.004.001.040.911<0.05112.3213.419.9740 b
CO2 (vol.%)740.003.200.700.600.600.401.000.601.600.841<0.0511.911.901.49<1.5 c
Bodanrück
Subsets 1 and 2 of cluster 1 and 2 (ntotal: 427)
He (ppm)1414.435.785.205.220.185.145.280.14−0.360.911<0.0515.575.495.465.22 a
Rn (BqL−1)1430.00107.0034.0031.0023.0015.0047.0031.000.910.941<0.05180.1693.5866.6223 d
CO2 (vol.%)1430.0010.802.001.601.601.002.601.602.400.791<0.0515.195.003.82<1.5 c
Corridors 1 and 2 (ntotal: 168)
He (ppm)562.345.375.135.170.385.145.210.07−6.990.211<0.0515.895.315.395.22 a
Rn (BqL−1)561.0087.0034.0025.0025.0013.0055.0042.000.490.921<0.05184.35118.7568.6723 d
CO2 (vol.%)560.0010.402.051.801.741.002.201.202.600.741<0.0515.524.003.91<1.5 c
a [71]; b [72]; c [73] for non-volcanic areas; d [74].

3. Results

3.1. Gas Composition

The EDA of the soil gas survey for all studied areas (Table 1) showed a wide range of variations for some of the gas concentrations. This was particularly the case for Rn with concentrations ranging from 0 to 107 BqL−1 in the clusters and 1 to 87 BqL−1 in the corridors, but also for CO2 in both clusters and corridors (0–~11 vol.%).
In all studied areas, the three gases (Rn, He, CO2) were not normally distributed, which was confirmed statistically (t test h = 1; H = 1 Shapiro–Wilk test; p ≤ 0.05). Geochemical data are generally right skewed [63], and this was also true for the Rn and CO2 data for all study areas. Very low values of negative skewness (−0.4) were found for He in Meinweg and both clusters. The high negative skewness (−6.99) for He in both corridors suggest that the non-normal distribution is strongly influenced by the large number of low concentrations (83%). The results (Table 1) illustrate that the mean ± 2SD [66,67] is generally not suitable for estimating the anomalous threshold [63], because these estimators are not robust to extreme values. This could be shown for the calculated anomalous He thresholds in both clusters. To capture outliers hidden in a lower population, the median + 2MAD value suggested by [63] was considered more reliable and used for interpretation.
According to the Pearson correlation test (Table 2), the Rn-CO2 couple for clusters 1 and 2 and for the subset within cluster 1 shows a strong relationship [75], whereas Meinweg and both BR corridors show only a weak-to-moderate relationship, respectively.

3.1.1. Meinweg

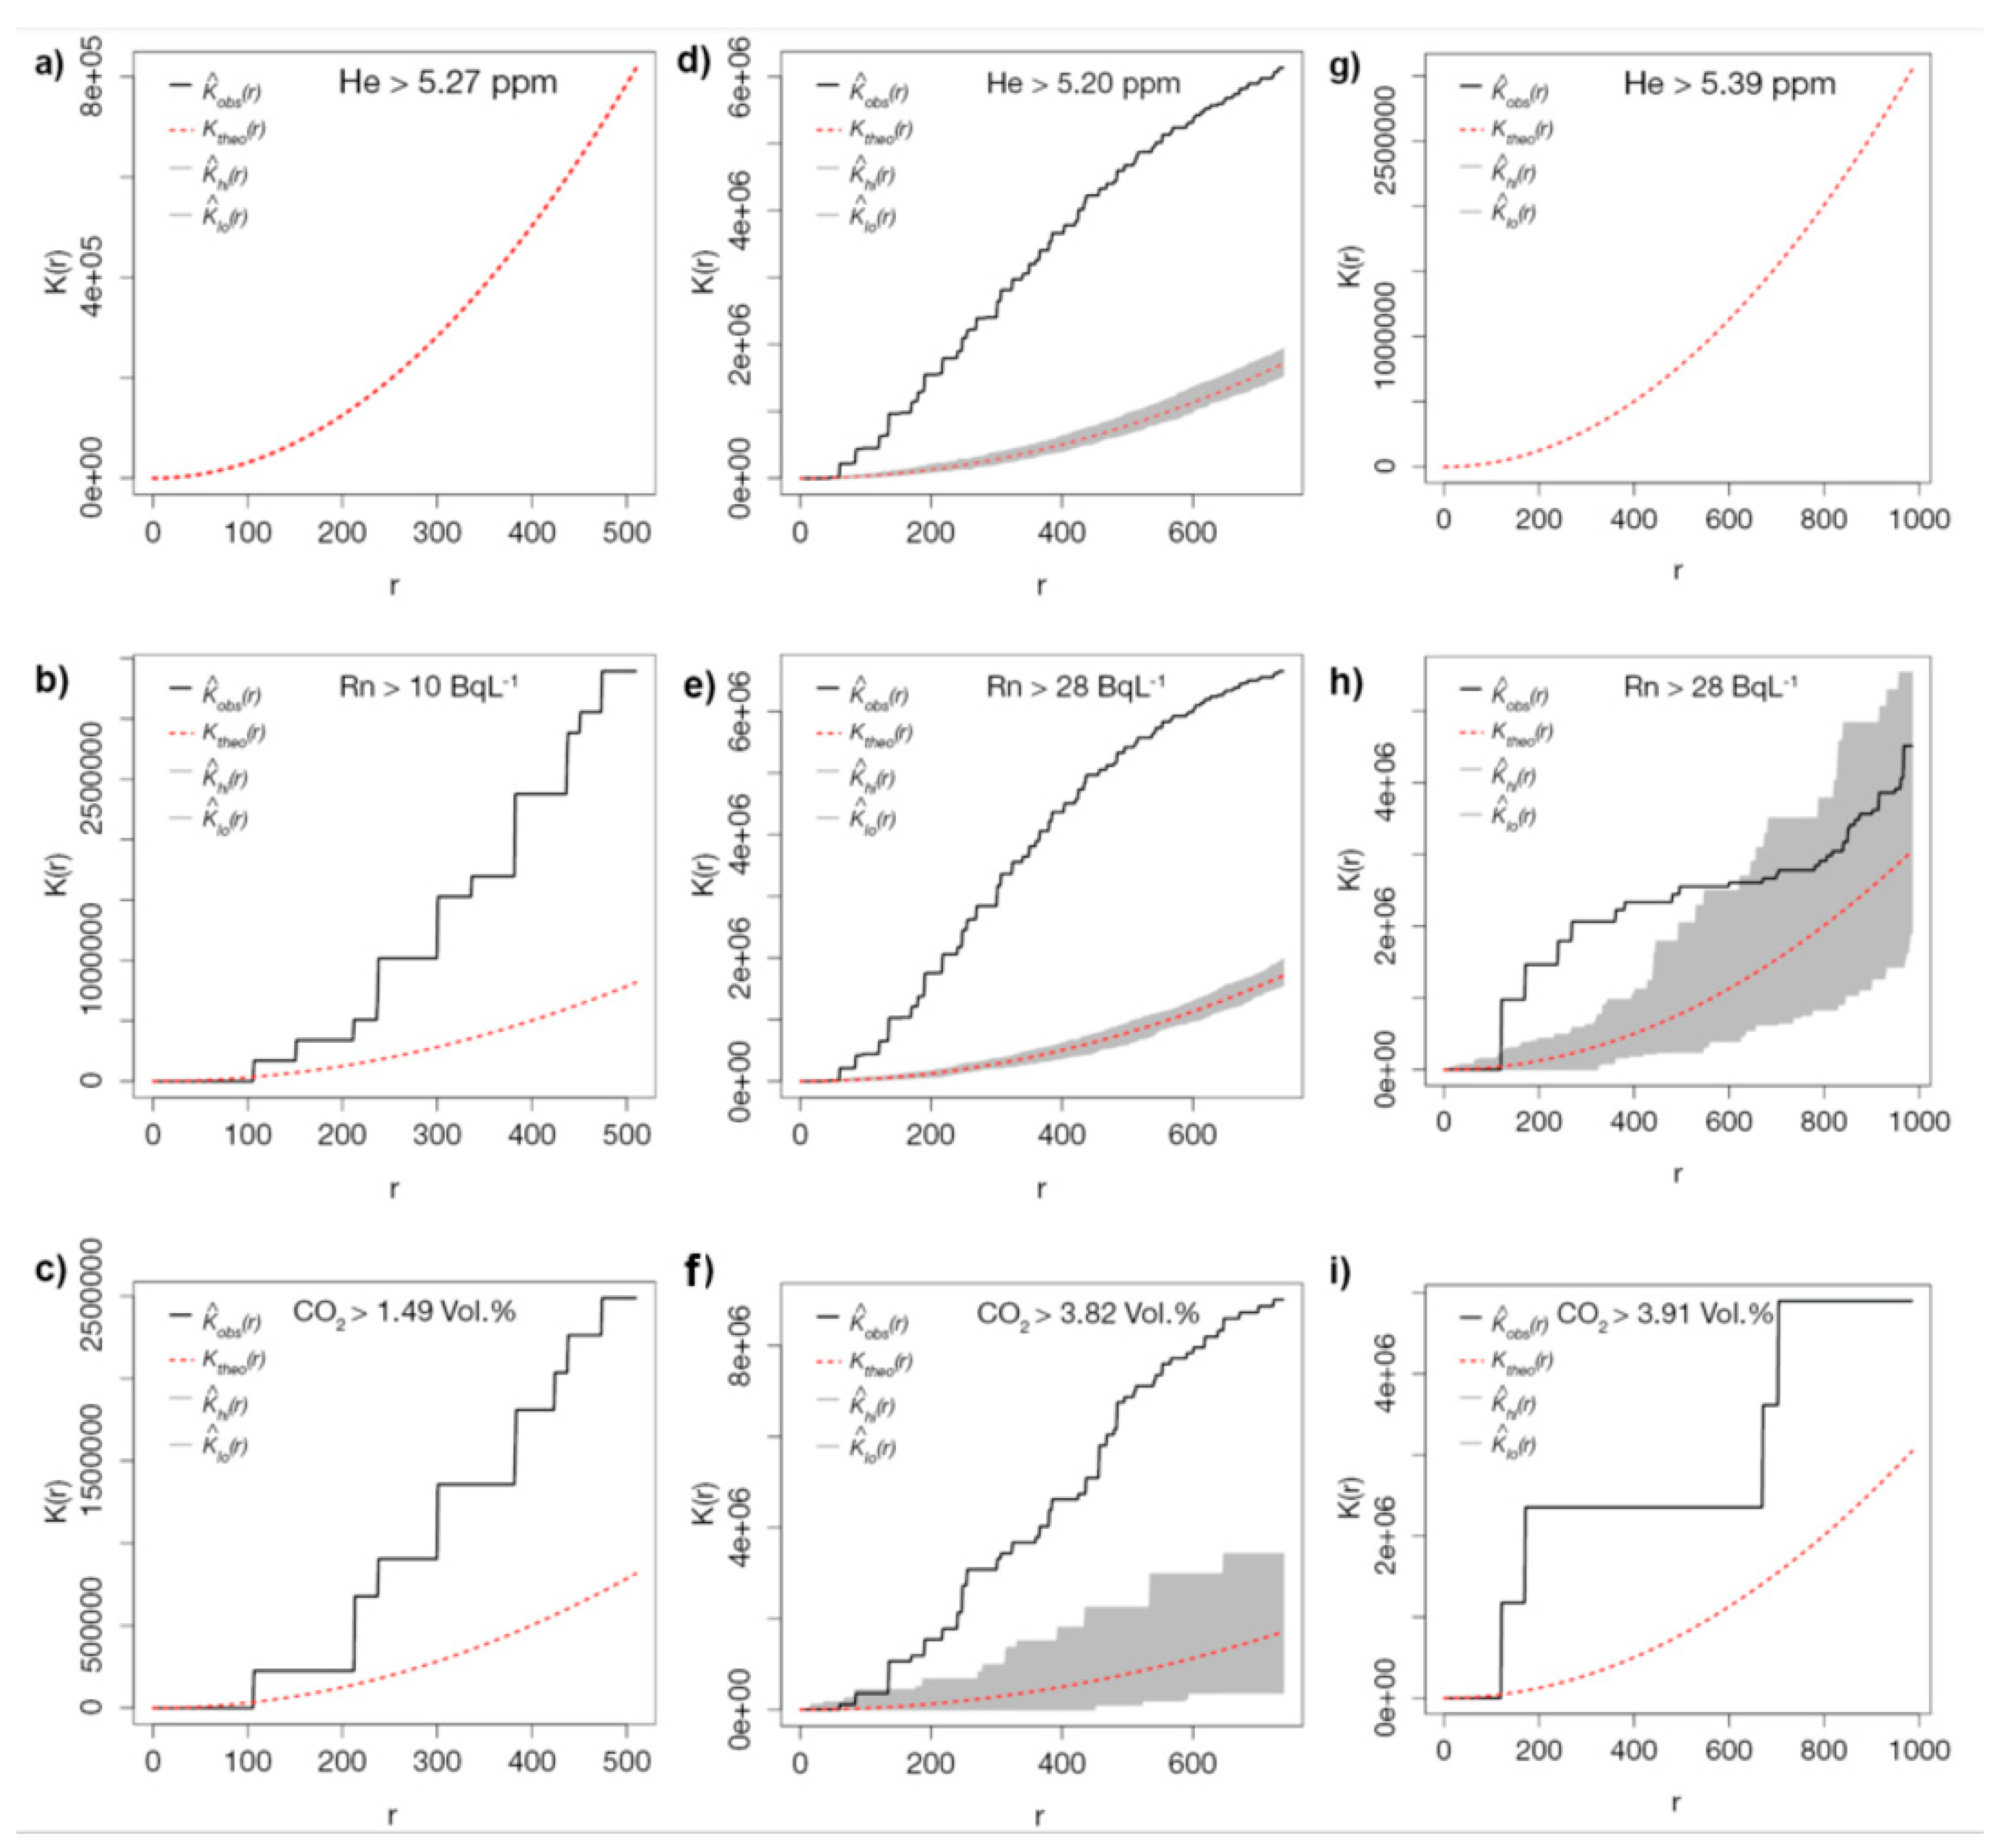
No He anomalies were observed in Meinweg (Table 1), which was confirmed by statistical analyses. Although 51% of the He concentrations were above the atmospheric standard of 5.22 ppm [71], they all remained below the threshold of 5.27 ppm (Table 1; Figure 2 and Figure 3). Approximately 16% of the Rn concentrations were above the anomalous threshold of ~10 BqL−1, and showed a tendency to cluster (Figure 3). However, all observed Rn concentrations remained below the background concentrations of ~40 BqL−1 [72] for this study area. CO2 concentrations were also very low, about 9.5% of them exceeding the anomalous threshold (Figure 2) of 1.5 vol.%. A tendency towards clustering of Rn was observed only at distances greater than ~100 m.

3.1.2. Bodanrück

Quantile–quantile plots for Bodanrück showed that most the gas species differ in shape, location, and distribution (Figure 2). The non-normal He distribution is strongly characterized by 47.5% of the data being below the constant atmospheric concentration (5.220 ± 0.0041 ppm; [71]). Two extreme He values in cluster 1 (~8.47 ppm), which could be clearly attributed to a mishandling in the analysis, were excluded from further investigations. He in clusters and Rn in corridors were bimodally distributed and represent sub-populations in both data sets. Analyses of the He sub-populations revealed five distinct anomaly classes: (1: concentrations above 5.61 ppm, 2: from 5.61–5.53 ppm, 3: 5.53–5.28 ppm, 4: 5.28–5.20 ppm, 5: concentrations below 5.20 ppm). The fifth class corresponds to the atmospheric standard of 5.22 ppm [71] and is considered as background levels for the entire population. Concentrations lower than background were considered to be undisturbed values [66]; all other anomaly classes indicated a tectonic influence. The analyses of the Rn sub-population also yielded anomaly classes (1: concentrations above 84 BqL−1, 2: 84–76 BqL−1, 3: 76–34 BqL−1, 4: 34–28 BqL−1). The anomalous threshold concentrations of categories 1–3 are up to 1.5 times higher than the estimated annual mean values for Germany (50 BqL−1; [76]). Concentrations below 28 BqL−1 were addressed as background level and considered as undisturbed values [68]. This corresponds well to the value of 23 BqL−1 published by [74]. The range of values between anomaly 1 and anomaly 4 indicates a tectonic influence and could reflect different lithological characteristics. The maximum Rn values (107 BqL−1) were found at the northeast edge and center of the subset of cluster 1 and in the center of subset 2 of cluster 2. The CO2 data had the highest values (11 and 9 vol.%, respectively) at the southwest edge of cluster 1 and in the center of cluster 2 (2.2 vol.%). Approximately 8% of the CO2 data were above the anomalous threshold of 4 vol.% (cluster 1).
To distinguish between random and cluster distributions, the observed gas concentrations were compared with 99 different random distributions with respect to the gas-specific anomalous thresholds (Figure 3). In the RWA-clusters, the observed values of all gases deviated significantly from a Poisson distribution, showing clustering at distances greater than ~60 m (above 5.20 ppm He and 28 BqL−1) and greater than ~80 m for CO2. In both corridors, only Rn showed a tendency to cluster at distances greater than ~120 m.

3.2. Spatial Analyses

3.2.1. Meinweg

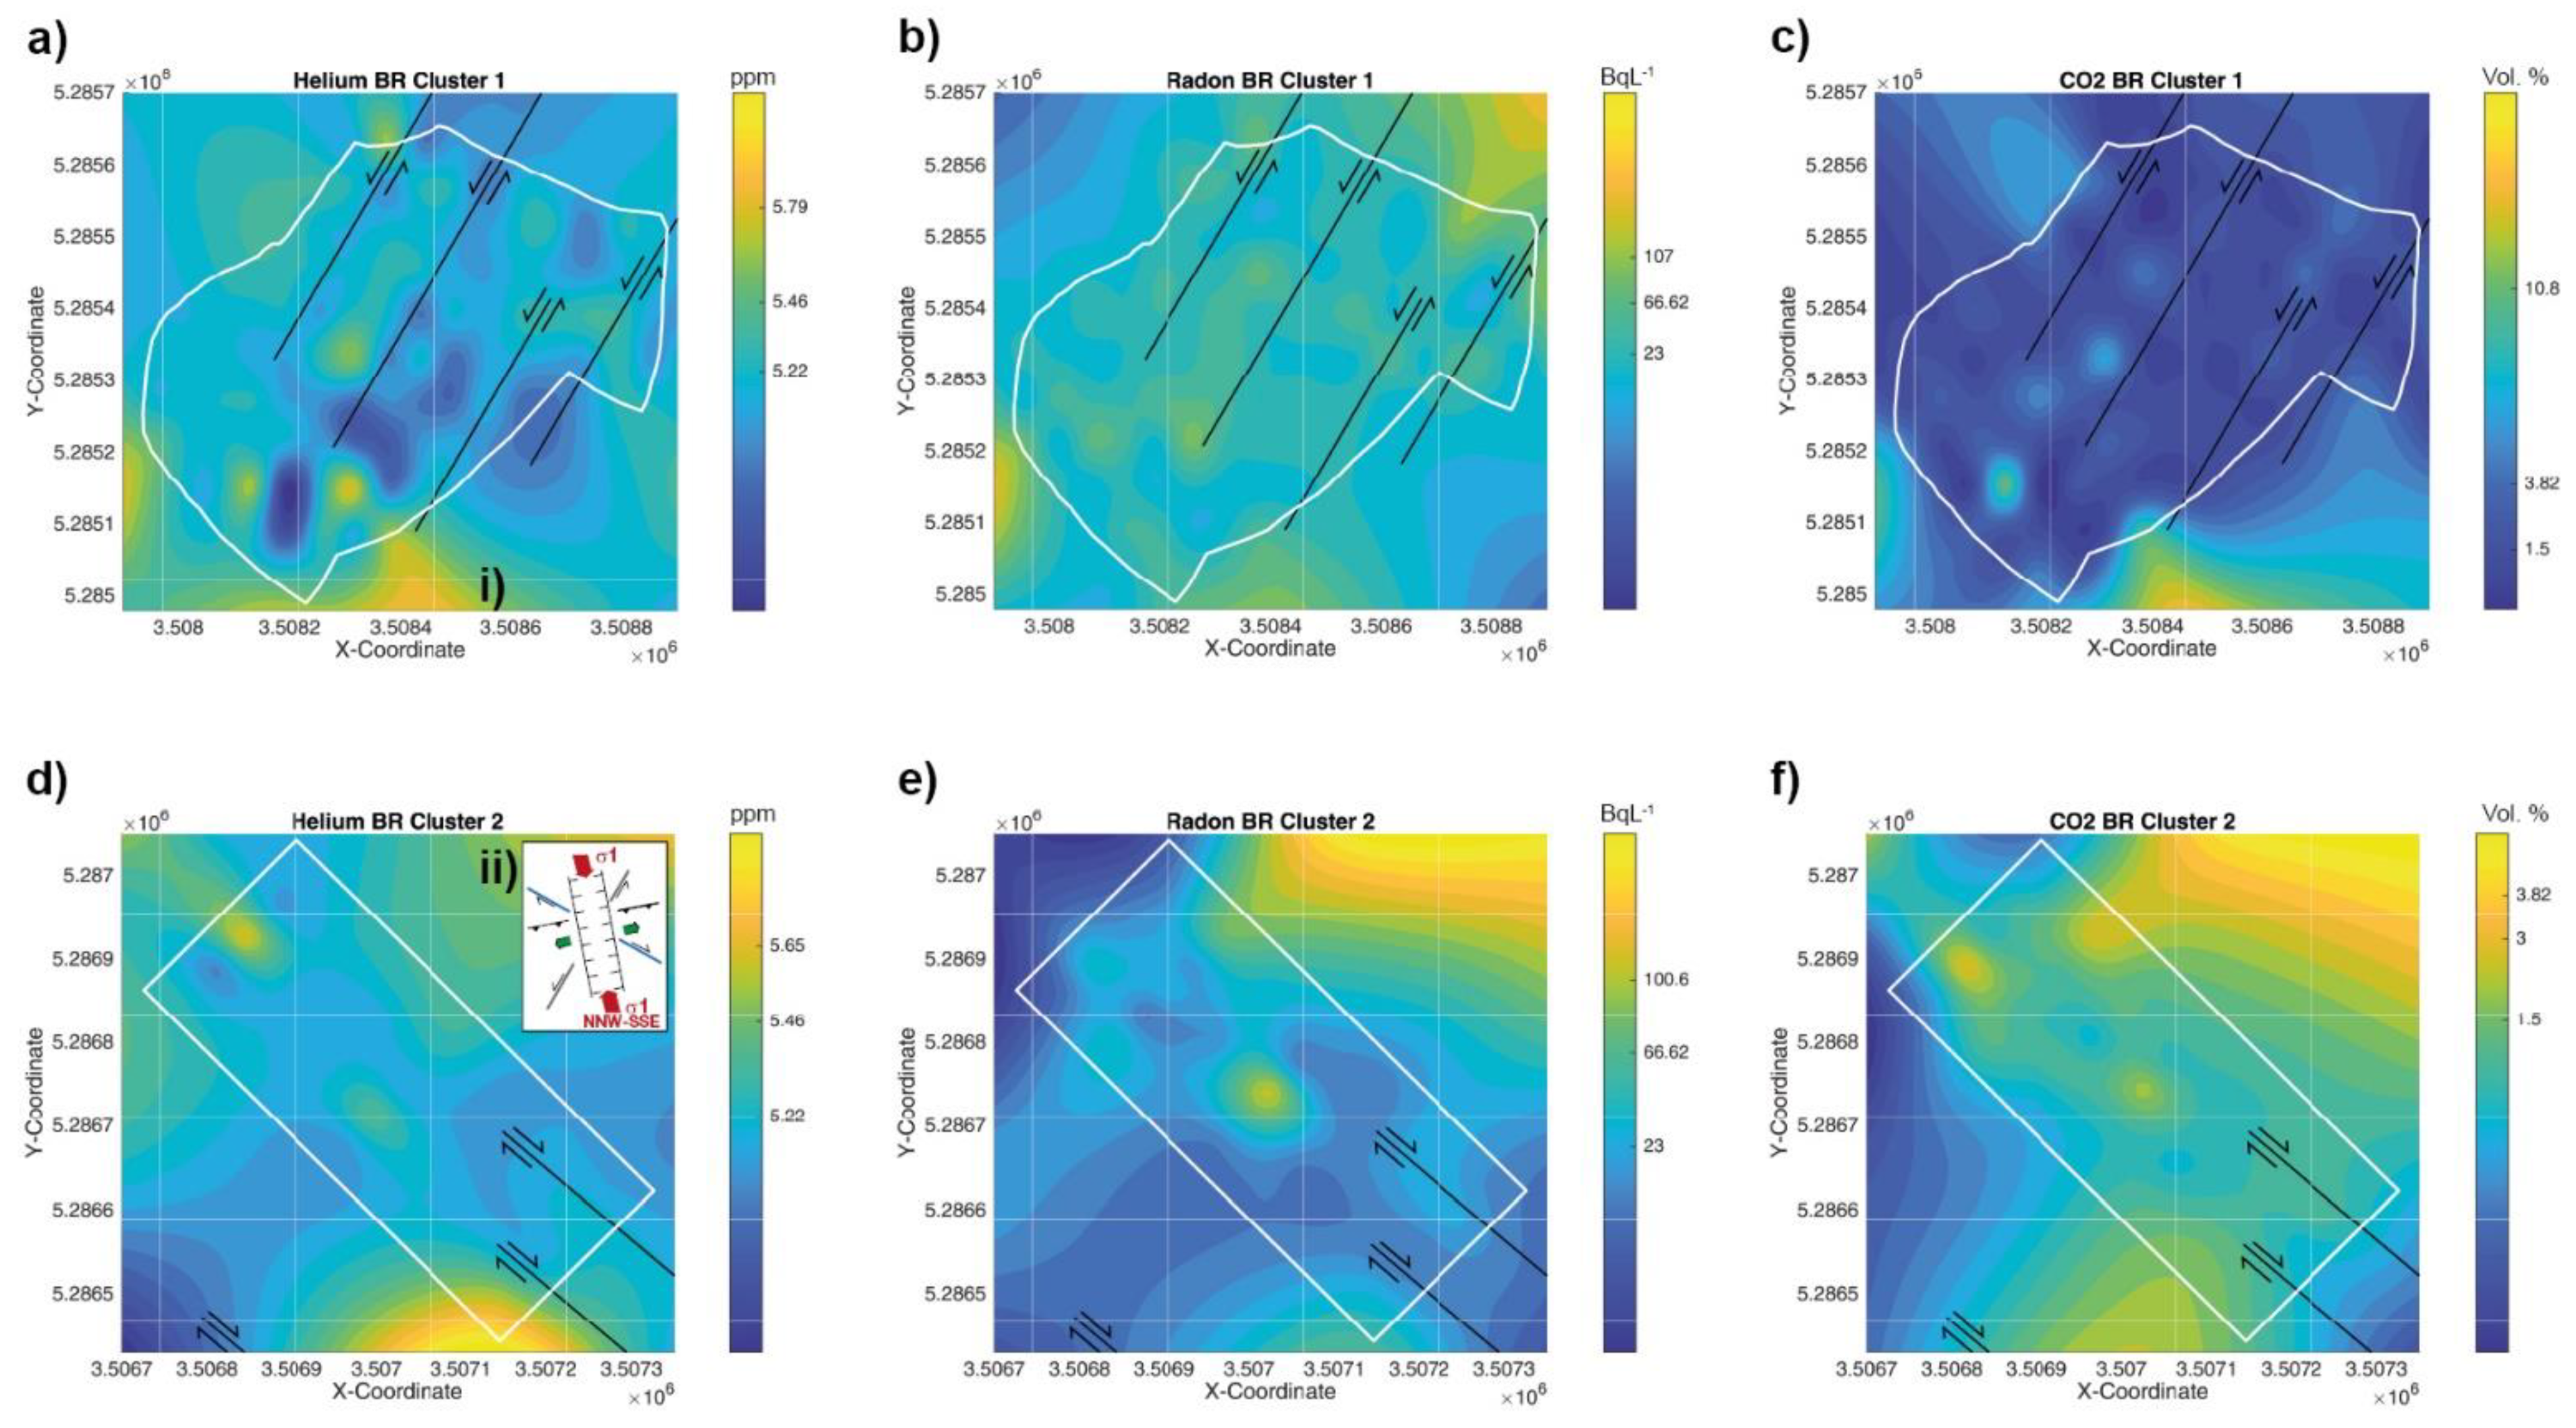
Surface plots of spatial degassing pattern in Meinweg revealed a weakly NE-SW-trending direction for the Rn-CO2 degassing couple (Figure 4a,c).

3.2.2. Bodanrück

Geostatistical analyses of spatial gas distribution for the two subsets at BR revealed spotty degassing patterns (Figure 5a–f) that were not randomly distributed for all three gases. A NW-SE- and a NNE-SSW-trending degassing pattern was observed in the subsets of cluster 1 and 2, respectively. Statistical analyses of RWA nest distribution pattern generated a set of RWA prototype lines, which are also trending in NNE-SSW directions. These lines are between approx. 25 m and 70 m away from the degassing spots. The spatial degassing directions in subset 2 of cluster 2 are less pronounced in NW-SE direction. RWA prototypes trending in NW-SE directions are suggested to be the best. No degassing pattern was observed in either RWA-free corridor.

4. Discussion

Geogenic gases such as He, Rn, and CO2 can be used to detect tectonic systems, e.g., shear zones, open fractures, and other zones of increased permeability that were previously unknown, and to semi-quantitatively track tectonic activity in seismically active zones [3,77]. Thermal, radiogenic, and geodynamic processes can influence degassing processes, as well as fault intersections and/or extensive macro- and/or micro-scale fractures at faults, resulting in a complex degassing pattern [8,77,78,79]). In addition to continuous degassing patterns along a tectonic structure, irregularly shaped diffuse or “halo” anomalies and irregularly distributed plumes or “spot anomalies” may develop [5,9]. Furthermore, complex multi-layered marine and fluviatile deposits can influence spatial degassing patterns [35].
The diffuse degassing patterns detected in both study areas are due to the heterogenic sedimentary deposits. Changing geological conditions in the surroundings of a fault system may trap geogenic gases (e.g., impermeable layers), resulting in residual migration and spotty degassing anomalies [80,81].
The Rn–CO2 couple, confirmed by statistical analyses, is a typical carrier–trace gas association [82]. In diffusive systems, given by the large thickness of clastic sediments at MW and BR, Rn has low mobility [76]. Combined with its short half-life, migration from the deeper source rock is limited in the absence of a carrier gas. Spatial concurrency of the Rn–CO2 concentrations provided evidence of this transport mechanism at Meinweg (Figure 4) and the two BR clusters (Figure 5). The correlation factors (Table 2) showed a strong relationship for areas with RWA, with higher values in areas with RWA occurrence than in areas without RWA occurrence. Correlation factors found in RWA areas are ~55% higher as compared to gas analyses of active normal faults in the Western Corinth Gulf Rift [83] and in the Tolfa region [84], confirming active degassing in both subsets of the BR clusters. The moderate-to-weak correlation factors of the Rn–CO2 gas couple in the BR corridors and in Meinweg are comparable to the findings by [84].

4.1. Meinweg

The Meinweg study area, located on the Horst of Brüggen and Erkelenz, can be considered tectonically quiescent due to the absence of earthquakes (Figure 1a). This could be confirmed by the absence of He concentrations above the anomalous thresholds (5.27 ppm; Table 1 and Figure 4a). These He values are also confirmed by the fact that 90.5% of the CO2 concentrations were below 1.5 vol.%. This is typical for non-volcanic areas and is consistent with rift basin processes [31,85]. The remaining 9.5% of the CO2 samples were only moderately higher and centered between 1.5 and <5 vol.%. The low CO2 concentrations could also be due to biological processes, such as the microbial decomposition of organic matter or root respiration, which could have a strong influence on the soil gas composition [84,86].
In addition, there was a moderate relationship between the Rn-CO2 degassing couple yet (Table 2), although the Rn concentrations were beyond the background value of ~40 BqL−1 [72]. The estimated K function curves for Rn and CO2 indicate some clustering (Figure 3b,c) which can be confirmed by the surface plots showing degassing spots approximately in NE-SW direction (Figure 4a,c). This observation would also confirm the findings by [7] that CO2 is a main fault indicator, especially in areas with extensional tectonics. This is also well related to the NE-SW extension direction of the present-day stress field according to the rifting process [31].
The identified orientation of the degassing activity is interpreted as indication of hidden faults in the subsurface and could be the first evidence for a possible new degassing system in NE-SW direction, although no information on NE-SW fault systems is known for the Horst of Brüggen and Erkelenz so far. Lineament analyses in a study area ~15 km NW of Meinweg identified NE–SW-oriented faults, interpreted as strike-slip faults of likely Caledonian age that have been active during the Quaternary [87].
These new findings probably indicating (a) the onset of (re)activation of the NE-SW-trending Caledonian fault systems unknown so far for the Horst of Brüggen and Erkelenz or b) the emergence of new fracture zones as aftershocks of the 1992 Roermond earthquake (M 5.9; [37]). This was one of the largest earthquakes recorded in the LRE and may have been the trigger for the onset of soil degassing processes on the seismically quiescent Horst of Brüggen and Erkelenz. In addition, overstepping faults in the deeper subsurface may have been triggered by this earthquake and may have led to a local reduction in the sealing effect of faults [25]. When seismicity increases due to the rifting process, the opening of degassing fracture zones will be further triggered [29].
Meinweg is also located approx. 20 km northwest to the open-pit mine Garzweiler (lignite), where large-scale water withdrawals are occurring. This large-scale abstraction and associated lowering of the groundwater table have significant impacts on the regional aquifer system. Because the stratified aquifer system is intersected by numerous NW-SE striking faults that can act as both barriers and preferential flow paths for groundwater [35], these changing water tables could also contribute to the degassing process and explain the weak expression of the observed degassing pattern.
Currently, Meinweg can be considered “no ants land” as no RWA nests have been observed so far. One reason could be that the concentrations of the soil gas anomalies were too low, for RWA especially prefer substrates with higher Rn concentrations [14]. If the rifting process, the (re-)activation of faults and a higher concentrated degassing continue, RWA nests could be observed in this area in the future. Such processes should be monitored regularly to detect the development of RWA nest foundations and, thus, new hot spots of degassing systems. The combination with regular gas monitoring should provide information on whether the assumed (re-)activation process of faults continues.

4.2. Bodanrück

The spotty degassing anomalies (Figure 5) at the BR were not randomly distributed for all three gases. The BR study area, as part of the FBBFZ, can be considered seismically active due to the occurrence of weak-to-moderate earthquakes. Seismically active zones are generally broad and may be intersected by tectonic structures. Faults and fractures may therefore favor gas seepage and serve as preferential conduits for trapped gases near the intersection of the fractures with the surface, as they increase the permeability of rock and soil [5,78].
On the other hand, geogenic gases, such as He, can become highly enriched over time in suitable traps [79], such as basin fillings with high porosities. At the BR, marine or freshwater sediment fillings can trap the gas in micro-pores, resulting in only spotty degassing [79]. The maximum (5.78 ppm) and minimum (4.43 ppm) concentrations of He in the RWA clusters are both higher than in the tectonically active Tolfa mine district [84]. Both clusters are in a geothermal area, that may be sources for He release in juvenile or circulating meteoric water [79]. Thermal water drillings in the adjacent towns Constance and Kreuzlingen showed similar water temperatures (29 °C), that were 2 °C to 3 °C higher than the normal geothermal gradient for this depth [88]. The anomalous thresholds of Rn, which were similar for both clusters and corridors, suggest a common degassing input linked to local tectonics. Spotty anomalies of Rn and CO2 in both clusters revealed the presence of degassing structures beneath the sediment cover at previously unknown depths. The high Rn concentrations suggest advective migration processes that preferentially pass through zones of brittle deformation [89], as suggested by the relatively high rate of migration required to obtain anomalies of short-lived Rn in the soil pores [84]. Peak Rn concentrations were twice the estimated annual mean for Germany (50 BqL−1; [76] and four times the background concentration [74]. CO2 is not only an important fault detector, but is also important for seismic and volcanic monitoring [90]. The high CO2 concentrations may also confirm the BR still today being an area with active extensional tectonics [7]. According to the CO2 concentration exposure categories for diffuse degassing hazard maps [73], 47% (clusters) and 41% (corridors) of the CO2 data show a signature of non-volcanic areas (<1.5 vol.%), whereas 6% (clusters) and 7% (corridors) are above the threshold of 5 vol.%, i.e., with lethal concentrations affecting the ecosystem [73,91]. Furthermore, the unusually high CO2 anomaly peaks (10.8 vol.% clusters, 10.4 vol.% corridors) were comparable to values from the sediment-covered and hydrothermally influenced Tolfa mine district [84]. The higher CO2 concentrations could also be associated with the adjacent Hegau volcanic field (Late Neogene), located at the northwest boundary of BR, as part of the seismically active FBBFZ [47,92]. Other sources of CO2 include meta-morphism of carbonate-bearing rocks or minerals, biological activity, or hydrocarbon degradation ([1,78,93]. Isotopic analysis of CO2 could provide information on the origin of this gas.
The recent NNW-SSE compression-induced stress field results in ENE-WSW to W-E extensional faults [41,44,45,46,47,48,49]. The observed gas anomalies were not related to these main directions but showed different orientations: In the subset of cluster 1, the gas anomalies for all three gases in the NNE-SSW direction were well related to the results of statistical analyses of the spatial distributions of RWA prototype lines. These prototype lines revealed the preferential nests alignment in NNE-SSW direction, which can be addressed as re-activated left-lateral strike-slip fault systems (Eocene–Oligocene) of the Swabian–Franconian fault system (main stress direction σ1: 170°; [10,42]; Figure 5a–c,i). This direction resembles the present-day stress system with a left-lateral strike-slip fault system as a conjugate shear system. The degassing pattern also followed this conjugate shear system. The supposed fault lines in NE-SW and W-E directions and at different, flatter angles [45] could not be confirmed by our “GeoBio-Interaction” approach.
The spatial degassing directions in subset 2 of cluster 2 are less pronounced in NW-SE direction (Figure 5d,e). The NW-SE-trending anomalies also agreed well with the trend of published NW-SE fault orientation (maxima at 135°–145°) in this area. This is also in good agreement with the NW-SE right-lateral strike-slip system of the large-scale Mindelsee fault zone (conjugated shear system to the present-day main stress direction; [41] that had been identified on parts of the BR, and with an assumed right-lateral strike-slip fault along the length of the Lake Constance (Figure 1b; [48,49]. Therefore, the NW-SE direction of the analyzed prototype lines from RWA nests can be interpreted as right-lateral strike-slip fault systems (conjugated shear system) to the present-day main stress direction (Miocene/Pliocene-recent; σ1: 135°; Figure 5d,e; [10,42]). At BR, the findings by [7] could not be confirmed, because the degassing patterns of CO2 as main fault indicator were not observed in the extension direction.
Both RWA-free corridors can be addressed as “no ants land”. Here, there is no tectonically influenced signature by the fault zone tracer He, as the observed He values do not exceeded the anomalous threshold (5.39 ppm). The highest CO2 value (10.4 vol.%) was found in corridor 2. About 7% of these CO2 values exceeded the anomalous threshold of 4 vol.%. The most common geological scenario for the occurrence of high CO2 concentrations are deep faults near to gas traps, reservoirs close to hot bedrock and carbonates associated with post-trap igneous activity [94]. In addition, it is suggested that previously unknown tectonic fault structures, trending NNE-SSW to NE-SW (e.g., Wallhauser fault; Figure 1b), may act as barriers and separate the degassing pattern in both clusters, consistent with a conduit-barrier model in unconsolidated sedimentary deposits as proposed by [35] for the LRE.
From our study, we conclude that the patterns of presence/absence of RWA nests and underlying geochemical anomalies are statistically significant even in sedimentary deposits being hundreds of meters thick. This is especially valuable in areas where actively degassing tectonic systems are masked by heterogeneous sedimentary deposits so far. Soil gas anomalies in areas with RWA nests confirmed that the spatial distribution patterns of RWA nests reflect (a) the main tectonic fault directions of the present-day stress field with its accompanying conjugated shear systems but also (b) previously unknown re-activated shear systems from earlier geological epochs [10]. In contrast, RWA were not present in areas without any soil gas anomalies.

5. Conclusions

Systematic sampling grids across both study areas showed a relation between gas anomalies and the spatial distribution of RWA nests. This trend-free procedure and our statistical analyses support our hypothesis: RWA are addicted to geogenic soil gases. Areas without soil gas anomalies are “no ants land”, regions where RWA nests are scarce. The relation between the spotty anomalies caused by macro- and micro-scale brittle deformation [86], and the RWA-prototype lines [10] confirmed RWA nests are a useful tool and are bioindicators to detect areas of even actively degassing spotty anomalies caused by macro- and microscale brittle deformation masked by sediment cover. The presence and composition of soil gas is one factor of the underlying mechanisms driving the alignment patterns of RWA nests. In addition, our results confirmed previous findings by [12], that RWA nests were eight times more likely to be found within 60 m of tectonic faults. This is especially valuable for areas with several hundred meters of sediment cover.

Author Contributions

G.M.B. and M.B.B. conducted the fieldwork, performed statistical analyses, and wrote the manuscript. All authors have read and agreed to the published version of the manuscript.

Funding

This research received no external funding.

Data Availability Statement

Data will be provided on demand.

Acknowledgments

The field work and analyses were conducted during the time that the first and corresponding author (Gabriele M. Berberich) was research associate of the University of Duisburg-Essen. Gas analyses were run on equipment from the department of Geology at University of Duisburg-Essen. The authors want to thank Mark Schumann, Thomas Ewert, Felix Dacheneder, Tamara Blocks, Stefan Hüssler and Martin Wankum for performing soil gas sampling and analyses (all University of Duisburg-Essen at that time).

Conflicts of Interest

The authors declare no conflict of interest.

References

  1. Wilkinson, M.; Haszeldine, R.S.; Fallick, A.; Odling, N.; Stoker, S.J.; Gatliff, R.W. CO2-Mineral Reaction in a Natural Analogue for CO2 Storage—Implications for Modeling. J. Sediment. Res. 2009, 79, 486–494. [Google Scholar] [CrossRef] [Green Version]
  2. Gilfillan, S.; Wilkinson, M.; Haszeldine, R.S.; Shipton, Z.; Nelson, S.T.; Poreda, R.J. He and Ne as tracers of natural CO2 migration up a fault from a deep reservoir. Int. J. Greenh. Gas Control 2011, 5, 1507–1516. [Google Scholar] [CrossRef] [Green Version]
  3. Martinelli, G.; Tamburello, G. Geological and Geophysical Factors Constraining the Occurrence of Earthquake Precursors in Geofluids: A Review and Reinterpretation. Front. Earth Sci. 2020, 8, 596050. [Google Scholar] [CrossRef]
  4. Ciotoli, G.; Lombardi, S.; Morandi, S.; Zarlenga, F. A multidisciplinary, statistical approach to study the relationships between helium leakage and neotectonic activity in a gas province: The Vasto basin, Abruzzo-Molise (central Italy). AAPG Bull. 2004, 88, 355–372. [Google Scholar] [CrossRef]
  5. Voltattorni, N.; Sciarra, A.; Quattrocchi, F. The Application of Soil-Gas Technique to Geothermal Exploration: Study of Hidden Potential Geothermal Systems. In Proceedings of the World Geothermal Congress, Bali, Indonesia, 25–29 April 2010; pp. 1–7. [Google Scholar]
  6. Ma, Y.; Bringemeier, D.; Scheuermann, A.; Molebatsi, T.; Li, L. Fault and fracture zone detection based on soil gas mapping and gamma ray survey at the extension site of an open pit coal mine. In Proceedings of the 12th Coal Operators’ Conference, University of Wollongong & The Australasian Institute of Mining and Metallurgy, Wollongong, NSW, Australia, 16–17 February 2012; pp. 378–386. [Google Scholar]
  7. Tamburello, G.; Pondrelli, S.; Chiodini, G.; Rouwet, D. Global-scale control of extensional tectonics on CO2 earth degassing. Nat. Commun. 2018, 9, 4608. [Google Scholar] [CrossRef] [PubMed] [Green Version]
  8. Ciotoli, G.; Lombardi, S.; Zarlenga, F. Natural leakage of helium from Italian sedimentary basins of the Adriatic structural margin. Perspectives for geological sequestration of carbon dioxide. In Advances in the Geological Storage of Carbon Dioxide; Lombardi, S., Altunina, L.K., Beaubien, S.E., Eds.; Springer: Dordrecht, The Netherlands, 2006; pp. 191–202. [Google Scholar]
  9. Ciotoli, G.; Lombardi, S.; Annunziatellis, A. Geostatistical analysis of soil gas data in a high seismic intermontane basin: Fucino Plain, central Italy. J. Geophys. Res. Earth Surf. 2007, 112, B05407. [Google Scholar] [CrossRef]
  10. Berberich, G.M.; Grumpe, A.; Klimetzek, D.; Wöhler, C. Are red wood ants (Formica rufa -group) tectonic indicators? A statistical approach. Ecol. Indic. 2016, 61, 968–979. [Google Scholar] [CrossRef]
  11. Berberich, G.M.; Klimetzek, D.; Paraschiv, M.; Stancioiu, P.T.; Grumpe, A. Biogeostatistics confirm: Even a low total number of red wood ant nests provide new information on tectonics in the East Carpathian Orogen (Romania). Ecol. Indic. 2019, 101, 486–500. [Google Scholar] [CrossRef]
  12. Del Toro, I.; Berberich, G.M.; Ribbons, R.R.; Berberich, M.B.; Sanders, N.; Ellison, A.M. Nests of red wood ants (Formica rufa-group) are positively associated with tectonic faults: A double-blind test. PeerJ 2017, 5, e3903. [Google Scholar] [CrossRef] [Green Version]
  13. Berberich, G.M.; Berberich, M.B.; Ellison, A.M.; Wöhler, C. Degassing Rhythms and Fluctuations of Geogenic Gases in A Red Wood-Ant Nest and in Soil in The Neuwied Basin (East Eifel Volcanic Field, Germany). Insects 2018, 9, 135. [Google Scholar] [CrossRef] [PubMed]
  14. Berberich, G.M.; Berberich, M.B.; Gibhardt, M. Red wood Ants (Formica rufa-group) prefer mature pine forests in Variscan granite environments (Hymenoptera: Formicidae). Fragm. Entom. 2022, 54, 1–18. [Google Scholar] [CrossRef]
  15. Berberich, G.M.; Ellison, A.M.; Berberich, M.B.; Grumpe, A.; Becker, A.; Wöhler, C. Can a Red Wood-Ant Nest Be Associated with Fault-Related CH4 Micro-Seepage? A Case Study from Continuous Short-Term In-Situ Sampling. Animals 2018, 8, 46. [Google Scholar] [CrossRef] [Green Version]
  16. Berberich, G.M.; Sattler, T.; Klimetzek, D.; Benk, S.A.; Berberich, M.B.; Polag, D.; Schöler, H.F.; Atlas, E. Halogenation processes linked to red wood ant nests (Formica spp.) and tectonics. J. Atmos. Chem. 2016, 74, 261–281. [Google Scholar] [CrossRef]
  17. Freund, F. Pre-earthquake signals: Underlying physical processes. J. Southeast Asian Earth Sci. 2011, 41, 383–400. [Google Scholar] [CrossRef]
  18. Freund, F.; Stolc, V. Nature of Pre-Earthquake Phenomena and their Effects on Living Organisms. Animals 2013, 3, 513–531. [Google Scholar] [CrossRef] [Green Version]
  19. Bos, N.; Sundström, L.; Fuchs, S.; Freitak, D. Ants medicate to fight disease. Evolution 2015, 69, 2979–2984. [Google Scholar] [CrossRef] [PubMed]
  20. Kirchner, W. Die Ameisen—Biologie und Verhalten; Verlag C.H. Beck: Munich, Germany, 2007. [Google Scholar]
  21. Hölldobler, B.; Wilson, E.O. Der Superorganismus—Der Erfolg von Ameisen, Bienen, Wespen und Termiten; Springer: Berlin/Heidelberg, Germany, 2010; p. 604. [Google Scholar]
  22. Schmidt, G.H. Einfluß von Temperatur und Luftfeuchtigkeit auf die Energiebilanz während der Metamorphose verschiedener Kasten von Formica polyctena Foerst. (Hym.). Z. angew. Entom. 2009, 61, 61–109. [Google Scholar] [CrossRef]
  23. Lighton, J.R. Discontinuous CO2 Emission in a Small Insect, the Formicine Ant Campoxotus Vicixus. J. Exp. Biol. 1988, 134, 363–376. [Google Scholar] [CrossRef]
  24. Hetz, S.K.; Bradley, T.J. Insects breathe discontinuously to avoid oxygen toxicity. Nature 2005, 433, 516–519. [Google Scholar] [CrossRef] [PubMed]
  25. Bense, V.; Van Balen, R.; De Vries, J. The impact of faults on the hydrogeological conditions in the Roer Valley Rift System: An overview. Neth. J. Geosci.-Geol. en Mijnb. 2003, 82, 41–54. [Google Scholar] [CrossRef]
  26. Schäfer, A.; Utescher, T. Origin, sediment fill, and sequence stratigraphy of the Cenozoic Lower Rhine Basin (Germany) interpreted from well logs. Z. Dt. Ges. Geowiss. Ger. J. Geosci. 2014, 165, 287–314. [Google Scholar]
  27. Ziegler, P.A. Cenozoic rift system of western and central Europe: An overview. Neth. J. Geosci.-Geol. en Mijnb. 1994, 73, 99–127. [Google Scholar] [CrossRef]
  28. Campbell, J.; Kümpel, H.-J.; Fabian, M.; Fischer, D.; Görres, B.; Keysers, C.J.; Lehmann, K. Recent movement pattern of the Lower Rhine Embayment from tilt, gravity and GPS data. Neth. J. Geosci.-Geol. en Mijnb. 2002, 81, 223–230. [Google Scholar] [CrossRef] [Green Version]
  29. Schäfer, A.; Siehl, A. Preface: Rift tectonics and syngenetic sedimentation—The Cenozoic Lower Rhine Basin and related structures. Neth. J. Geosci.-Geol. en Mijnb. 2002, 81, 145–147. [Google Scholar] [CrossRef] [Green Version]
  30. Trautwein-Bruns, U.; Hilgers, C.; Becker, S.; Urai, J.L.; Kukla, P.A. Fracture and fault systems characterising the intersection between the Lower Rhine Embayment and the Ardennes-Rhenish Massif results from the RWTH-1 well, Aachen, Germany. [Bruch- und Störungssysteme in der Übergangszone zwischen der Niederrheinischen Bucht und dem Rheinischen Schiefergebirge im belgisch-deutschen Grenzbereich Ergebnisse der Bohrung RWTH-1, Aachen, Deutschland]. Z. dt. Ges. Geowiss. 2011, 162, 251–276. [Google Scholar]
  31. VanBalen, R.; Houtgast, R.; Cloetingh, S. Neotectonics of The Netherlands: A review. Quat. Sci. Rev. 2005, 24, 439–454. [Google Scholar] [CrossRef]
  32. Hinzen, K.-G. Stress field in the Northern Rhine area, Central Europe, from earthquake fault plane solutions. Tectonophysics 2003, 377, 325–356. [Google Scholar] [CrossRef]
  33. Reamer, S.K.; Hinzen, K.-G. An Earthquake Catalog for the Northern Rhine Area, Central Europe (1975–2002). Seism. Res. Lett. 2004, 75, 713–725. [Google Scholar] [CrossRef]
  34. Camelbeeck, T.; Vanneste, K.; Alexandre, P.; Verbeeck, K.; Petermans, K.; Petermans, T.; Rosset, P.; Everaerts, M.; Warnant, R.; Van Camp, M. Relevance of active faulting and seismicity studies to assessments of long-term earthquake activity and maximum magnitude in intraplate northwest Europe, between the Lower Rhine Embayment and the North Sea. In Continental Intraplate Earthquakes: Science, Hazard, and Policy Issues; Stein, S., Mazzotti, S., Eds.; Special Paper 425; Geological Society of America: Boulder, CO, USA, 2007; pp. 193–224. [Google Scholar]
  35. Gumm, L.P.; Bense, V.F.; Dennis, P.F.; Hiscock, K.M.; Cremer, N.; Simon, S. Dissolved noble gases and stable isotopes as tracers of preferential fluid flow along faults in the Lower Rhine Embayment, Germany. Appl. Hydrogeol. 2015, 24, 99–108. [Google Scholar] [CrossRef] [Green Version]
  36. Lehmann, K.; Klostermann, J.; Pelzing, R. Paleoseismological Investigations at the Rurrand Fault, Lower Rhine Embayment. Neth. J. Geosci.-Geol. en Mijnb. 2001, 80, 139–154. [Google Scholar] [CrossRef] [Green Version]
  37. Van Eck, T.; Ahorner, L.; Paulssen, H. The earthquake of the century in Northwestern Europe: The Roermond, the Netherlands, earthquake of April 13,1992. Earthquakes and Volcanoes (USGS). Int. J. Rock Mech. Min. Sci. Geomech. Abstr. 1993, 24, 15–26. [Google Scholar] [CrossRef]
  38. Camelbeeck, T.; van Eck, T.; Pelzing, R.; Ahorner, L.; Loohuis, J.; Haak, H.W.; Hoang-Trong, P.; Hollnack, D. The 1992 Roermond earthquake, the Netherlands, and its aftershocks. Neth. J. Geosci.-Geol. en Mijnb. 1994, 73, 181–197. [Google Scholar]
  39. Camelbeeck, T.; van Eck, T. The Roer Valley Graben earthquake of 13 April 1992 and its seismotectonic setting. Terra Nova 1994, 6, 291–300. [Google Scholar] [CrossRef]
  40. Andeweg, B.; Cloetingh, S. Flexure and ‘Unflexure’ of the North Alpine German-Austrian Molasse Basin: Constraints from Forward tectonic Modelling. In Cenozoic Foreland Basins of Western Europe (Geological Society Special Publications); Mascle, A., Puigdefabregas, C., Luterbacher, H.P., Fernandez, M., Eds.; Geological Society of London: London, UK, 1998; Volume 134, pp. 403–422. [Google Scholar]
  41. Schreiner, A. Geol. Karte 1:50.000 Baden-Württ. Erl. Bl. Hegau und Westl. Bodensee; Geologisches Landesamt Baden-Württemberg: Freiburg im Breisgau, Germany, 1992.
  42. Schwarz, H.U. Das Schwäbisch-Fränkische Bruchmuster. Z. dt. Ges. Geowiss. 2012, 163, 411–446. [Google Scholar] [CrossRef]
  43. Véron, J. The Alpine Molasse Basin-review of petroleum geology and remaining potential. Bull. Für Angew. Geol. 2005, 10, 75–86. [Google Scholar]
  44. Ernst, W. Störungsabgrenzungen im Umkreis des Überlinger Sees mit Bodengasen. Bull. Ver. Schweiz. Petrol.-Geol. u.-Ing. 1969, 35, 1–11. [Google Scholar] [CrossRef]
  45. Ernst, W. Tektonische Untersuchungen mit der Gasmethode im westlichen Bodenseegebiet und im Tessin bei Lugano (Schweiz). Bull. Ver. Schweiz. Petrol.-Geol. u.-Ing. 1971, 37, 37–50. [Google Scholar]
  46. Schreiner, A. Zur Entstehung des Bodenseebeckens. Eiszeitalter u. Gegenwart. 1979, 29, 71–76. [Google Scholar] [CrossRef]
  47. Müller, H.W.; Naef, H.; Graf, H.R. Geologische Entwicklung der Nordschweiz, Neotektonik und Langzeitszenarien Zürcher Weinland. Nagra Techn. Ber. 2002, ntb 99-08. [Google Scholar]
  48. Pavoni, N. Seismotektonik Nordschweiz. Nagra Techn. Ber. 1984, ntb 84-45. [Google Scholar]
  49. Deichmann, N.; Ballarin Dolfin, D.; Kastrup, U. Seismizität der Nord- und Zentralschweiz. Nagra Techn. Ber. 2000, ntb 00-05. [Google Scholar]
  50. Mälzer, A.; Rösch, H.; Misselwitz, I.; Ebert, M.; Moosmann, D. Höhenänderungen in der Nordschweiz und im Südschwarzwald bis zum Bodensee. Nagra Techn. Ber. 1988, ntb 88-95. [Google Scholar]
  51. Pfiffner, O.A.; Deichmann, N. Seismotektonik in der Nordschweiz. Nagra Arb. NAB 2014, 14–26. [Google Scholar]
  52. Ring, U.; Bolhar, R. Tilting, uplift, volcanism and disintegration of the South German block. Tectonophysics 2020, 795, 228611. [Google Scholar] [CrossRef]
  53. Reinecker, J.; Tingay, M.; Müller, B.; Heidbach, O. Present-day stress orientation in the Molasse Basin. Tectonophysics 2010, 482, 129–138. [Google Scholar] [CrossRef] [Green Version]
  54. Vanneste, K.; Verbeeck, K.; Camelbeeck, T. A model of composite seismic sources for the Lower Rhine Graben. Poster T33A-2636. In Proceedings of the AGU Fall Meeting, San Francisco, CA, USA, 3–7 December 2012. [Google Scholar]
  55. BNS. Erdbebenstation Bensberg: Erdbebenkatalog. BNS-Erdbebenstation Bensberg. 2022. Available online: http://www.seismo.uni-koeln.de/catalog/index.htm (accessed on 1 August 2022).
  56. LGRB. Erdbebendienst Sü–west—Landeserdbebendienst Baden-Württemberg. LGRB|Erdbeben|Jahresbulletins (lgrb-bw.de). 2022. Available online: https://www.service-bw.de/zufi/lebenslagen/5000048 (accessed on 1 August 2022).
  57. SED. Schweizerischer Erdbebendienst (SED). Alle Erdbeben. SED|Alle Erdbeben (ethz.ch). 2022. Available online: http://www.seismo.ethz.ch/de/home/ (accessed on 1 August 2022).
  58. Hinkle, M. Concentrations of N2, O2, CO2 and He in Soil Gases Collected over and near the Dixie Valley Known Geothermal Resource Area Northern Dixie Valley, Nevada; Open-File Report 95-0080; US Geological Survey: Reno, NV, USA, 1995; p. 26.
  59. Baddeley, A.; Rubak, E.; Turner, R. Spatial Point Patterns: Methodology and Applications with R; Chapman and Hall/CRC Press: Boca Raton, FL, USA, 2015. [Google Scholar]
  60. Wickham, H. ggplot2: Elegant Graphics for Data Analysis; Springer: New York, NY, USA, 2009. [Google Scholar]
  61. R Core Team. R Version 3.2.2. 2015. Available online: https://www.r-project.or’/ (accessed on 4 January 2016).
  62. D’Errico, J. Surface Fitting Using Gridfit. Release 11 Nov 2005 (Updated 29 July 2010). 2010. Available online: https://de.mathworks.com/matlabcentral/fileexchange/8998-surface-fitting-using-gridfit (accessed on 1 August 2022).
  63. Reimann, C.; Filzmoser, P.; Garrett, R.G. Background and threshold: Critical comparison of methods of determination. Sci. Total Environ. 2005, 346, 1–16. [Google Scholar] [CrossRef] [PubMed]
  64. Tukey, J.W. Exploratory Data Analysis; Addison-Wesley: Boston, MA, USA, 1977. [Google Scholar]
  65. Shapiro, S.S.; Wilk, M.B. An analysis of variance test for normality (complete samples). Biometrika 1965, 52, 591–611. [Google Scholar] [CrossRef]
  66. Sinclair, A. Selection of threshold values in geochemical data using probability graphs. J. Geochem. Explor. 1974, 3, 129–149. [Google Scholar] [CrossRef]
  67. Sinclair, A. A fundamental approach to threshold estimation in exploration geochemistry: Probability plots revisited. J. Geochem. Explor. 1991, 41, 1–22. [Google Scholar] [CrossRef]
  68. Risdianto, D.; Kusnadi, D. The Application of a Probability Graph in Geothermal Exploration. In Proceedings of the World Geothermal Congress 2010, Bali, Indonesia, 25–29 April 2010; pp. 1–6. [Google Scholar]
  69. Edwards, A.L. The Correlation Coefficient. In An Introduction to Linear Regression and Correlation; W. H. Freeman: San Francisco, CA, USA, 1976; Chapter 4; pp. 33–46. [Google Scholar]
  70. Ripley, B.D. Statistical Inference for Spatial Processes; Cambridge University Press: Cambridge, UK, 1991; p. 154. [Google Scholar]
  71. Davidson, T.A.; Emerson, D.E. Direct determination of the helium 3 content of atmospheric air by mass spectrometry. J. Geophys. Res. Earth Surf. 1990, 95, 3565. [Google Scholar] [CrossRef]
  72. BfS IMIS. 2022. Available online: www.imis.bfs.de/geoportal (accessed on 23 August 2022).
  73. Viveiros, F.; Ferreira, T.; Silva, C.; Gaspar, J. Meteorological factors controlling soil gases and indoor CO2 concentration: A permanent risk in degassing areas. Sci. Total Environ. 2009, 407, 1362–1372. [Google Scholar] [CrossRef] [PubMed]
  74. LfU-BW. Radioaktivität in Baden-Württemberg. Jahresbericht 1998–2001. Radioaktivität und Strahlenschutz. Band 7. Landesanstalt für Umweltschutz Baden-Württemberg. 1. Auflage. 2003. Available online: https://pudi.lubw.de/detailseite/-/publication/85390-Radioaktivit%C3%A4t_in_Baden-W%C3%BCrttemberg._Jahresbericht_1998-2001.pdf (accessed on 1 August 2022).
  75. Hinkle, D.E.; Wiersma, W.; Jurs, S.G. Applied Statistics for the Behavioral Sciences, 5th ed.; Wadsworth Publishing: Belmont, CA, USA, 2009. [Google Scholar]
  76. Dubois, G. An Overview of Radon Surveys in Europe; European Commission: Luxembourg, 2005; p. 168. ISBN 92-79-01066-2. [Google Scholar]
  77. Podugu, N.; Mishra, S.; Wiersberg, T.; Roy, S. Chemical and Noble Gas Isotope Compositions of Formation Gases from a 3 km Deep Scientific Borehole in the Koyna Seismogenic Zone, Western India. Geofluids 2019, 2019, 1078942. [Google Scholar] [CrossRef] [Green Version]
  78. Baubron, J.-C.; Rigo, A.; Toutain, J.-P. Soil gas profiles as a tool to characterise active tectonic areas: The Jaut Pass example (Pyrenees, France). Earth Planet. Sci. Lett. 2002, 196, 69–81. [Google Scholar] [CrossRef]
  79. Butt, C.R.M.; Gole, M.J.; Dyck, W. Helium. Handb. Explor. Geochem. 2000, 7, 303–352. [Google Scholar]
  80. Ammann, M.; Schenker, F. Nachweis von tektonischen Störungen in 2 Bodengasprofilen in der Nordschweiz. Nagra Techn. Ber. 1989, ntb 89-25. [Google Scholar]
  81. Chiodini, G.; Frondini, F.; Ponziani, F. Deep structures and carbon dioxide degassing in Central Italy. Geothermics 1995, 24, 81–94. [Google Scholar] [CrossRef]
  82. Etiope, G.; Lombardi, S. Evidence for radon transport by carrier gas through faulted clays in Italy. J. Radioanal. Nucl. Chem. Artic. 1995, 193, 291–300. [Google Scholar] [CrossRef]
  83. Voltattorni, N.; Cinti, D.; Pizzino, L.; Sciarra, A. Statistical approach for the geochemical signature of two active normal faults in the western Corinth Gulf Rift (Greece). Appl. Geochem. 2014, 51, 86–100. [Google Scholar] [CrossRef]
  84. Voltattorni, N.; Lombardi, S.; Beaubien, S. Gas migration from two mine districts: The Tolfa (Lazio, Central Italy) and the Neves-Corvo (Baixo Alentejo, Portugal) case studies. J. Geochem. Explor. 2015, 152, 37–53. [Google Scholar] [CrossRef]
  85. Viveiros, F.; Gaspar, J.L.; Ferreira, T.; Silva, C.; Marcos, M.; Hipólito, A. Mapping of Soil CO2 Diffuse Degassing at São Miguel Island and its Public Health Implications. Azores Archipelago: Volcano Monitoring Perspectives. In Volcanic Geology of São Miguel Island (Azores Archipelago); Gaspar, J.L., Guest, J.E., Duncan, A.M., Barriga, F.J.A.S., Chester, D.K., Eds.; The Geological Society: London, UK, 2015; Chapter 14. [Google Scholar]
  86. Amundson, R.G.; Davidson, E. Carbon dioxide and nitrogenous gases in the soil atmosphere. J. Geochem. Explor. 1990, 38, 13–41. [Google Scholar] [CrossRef]
  87. Houtgast, R.F.; van Balen, R.T. Neotectonics of the Roer Valley Rift System, the Netherlands. Global and Planetary Change 27. Glob. Planet. Chang. 2000, 27, 131–146. [Google Scholar] [CrossRef]
  88. Büchi, U.P.; Schlanke, S.; Müller, E. Zur Geologie der Thermalwasserbohrung Konstanz und ihre sedimentpetrographische Korrelation mit der Erdölbohrung Kreuzlingen. Bull. Ver. Schweiz. Petroleum-Geol. u.-Ing. 1976, 42, 25–33. [Google Scholar]
  89. Ciotoli, G.; Bigi, S.; Tartarello, C.; Sacco, P.; Lombardi, S.; Ascione, A.; Mazzoli, S. Soil gas distribution in the main coseismic surface rupture zone of the 1980, Ms = 6.9, Irpinia earthquake (southern Italy). J. Geophys. Res. Solid Earth 2013, 119, 2440–2461. [Google Scholar] [CrossRef]
  90. Baubron, J.C.; Allard, P.; Toutain, J.P. Diffuse volcanic emissions of carbon dioxide from Vulcano Island, Italy. Nature 1990, 344, 51–53. [Google Scholar] [CrossRef] [PubMed]
  91. Pfanzn, H.; Saßmannshausen, F. Geogenic CO2-Exhalations and Vegetation: Its Possible Use to Predict Volcanic Eruptions; Geophysical Research Abstracts: Munich, Germany, 2008; Volume 10. [Google Scholar]
  92. Burkhard, M.; Grünthal, G. Seismic source zone characterization for the seismic hazard assessment project PEGASOS by the Expert Group 2 (EG1b). Swiss J. Geosci. 2009, 102, 149–188. [Google Scholar] [CrossRef] [Green Version]
  93. Das, N.; Chandran, P. Microbial Degradation of Petroleum Hydrocarbon Contaminants: An Overview. Biotechnol. Res. Int. 2011, 2011, 941810. [Google Scholar] [CrossRef] [Green Version]
  94. Fleet, A.J.; Wycherley, H.; Shaw, H. Large volumes of carbon dioxide in sedimentary basins. Mineral. Mag. 1998, 62A, 460–461. [Google Scholar] [CrossRef]
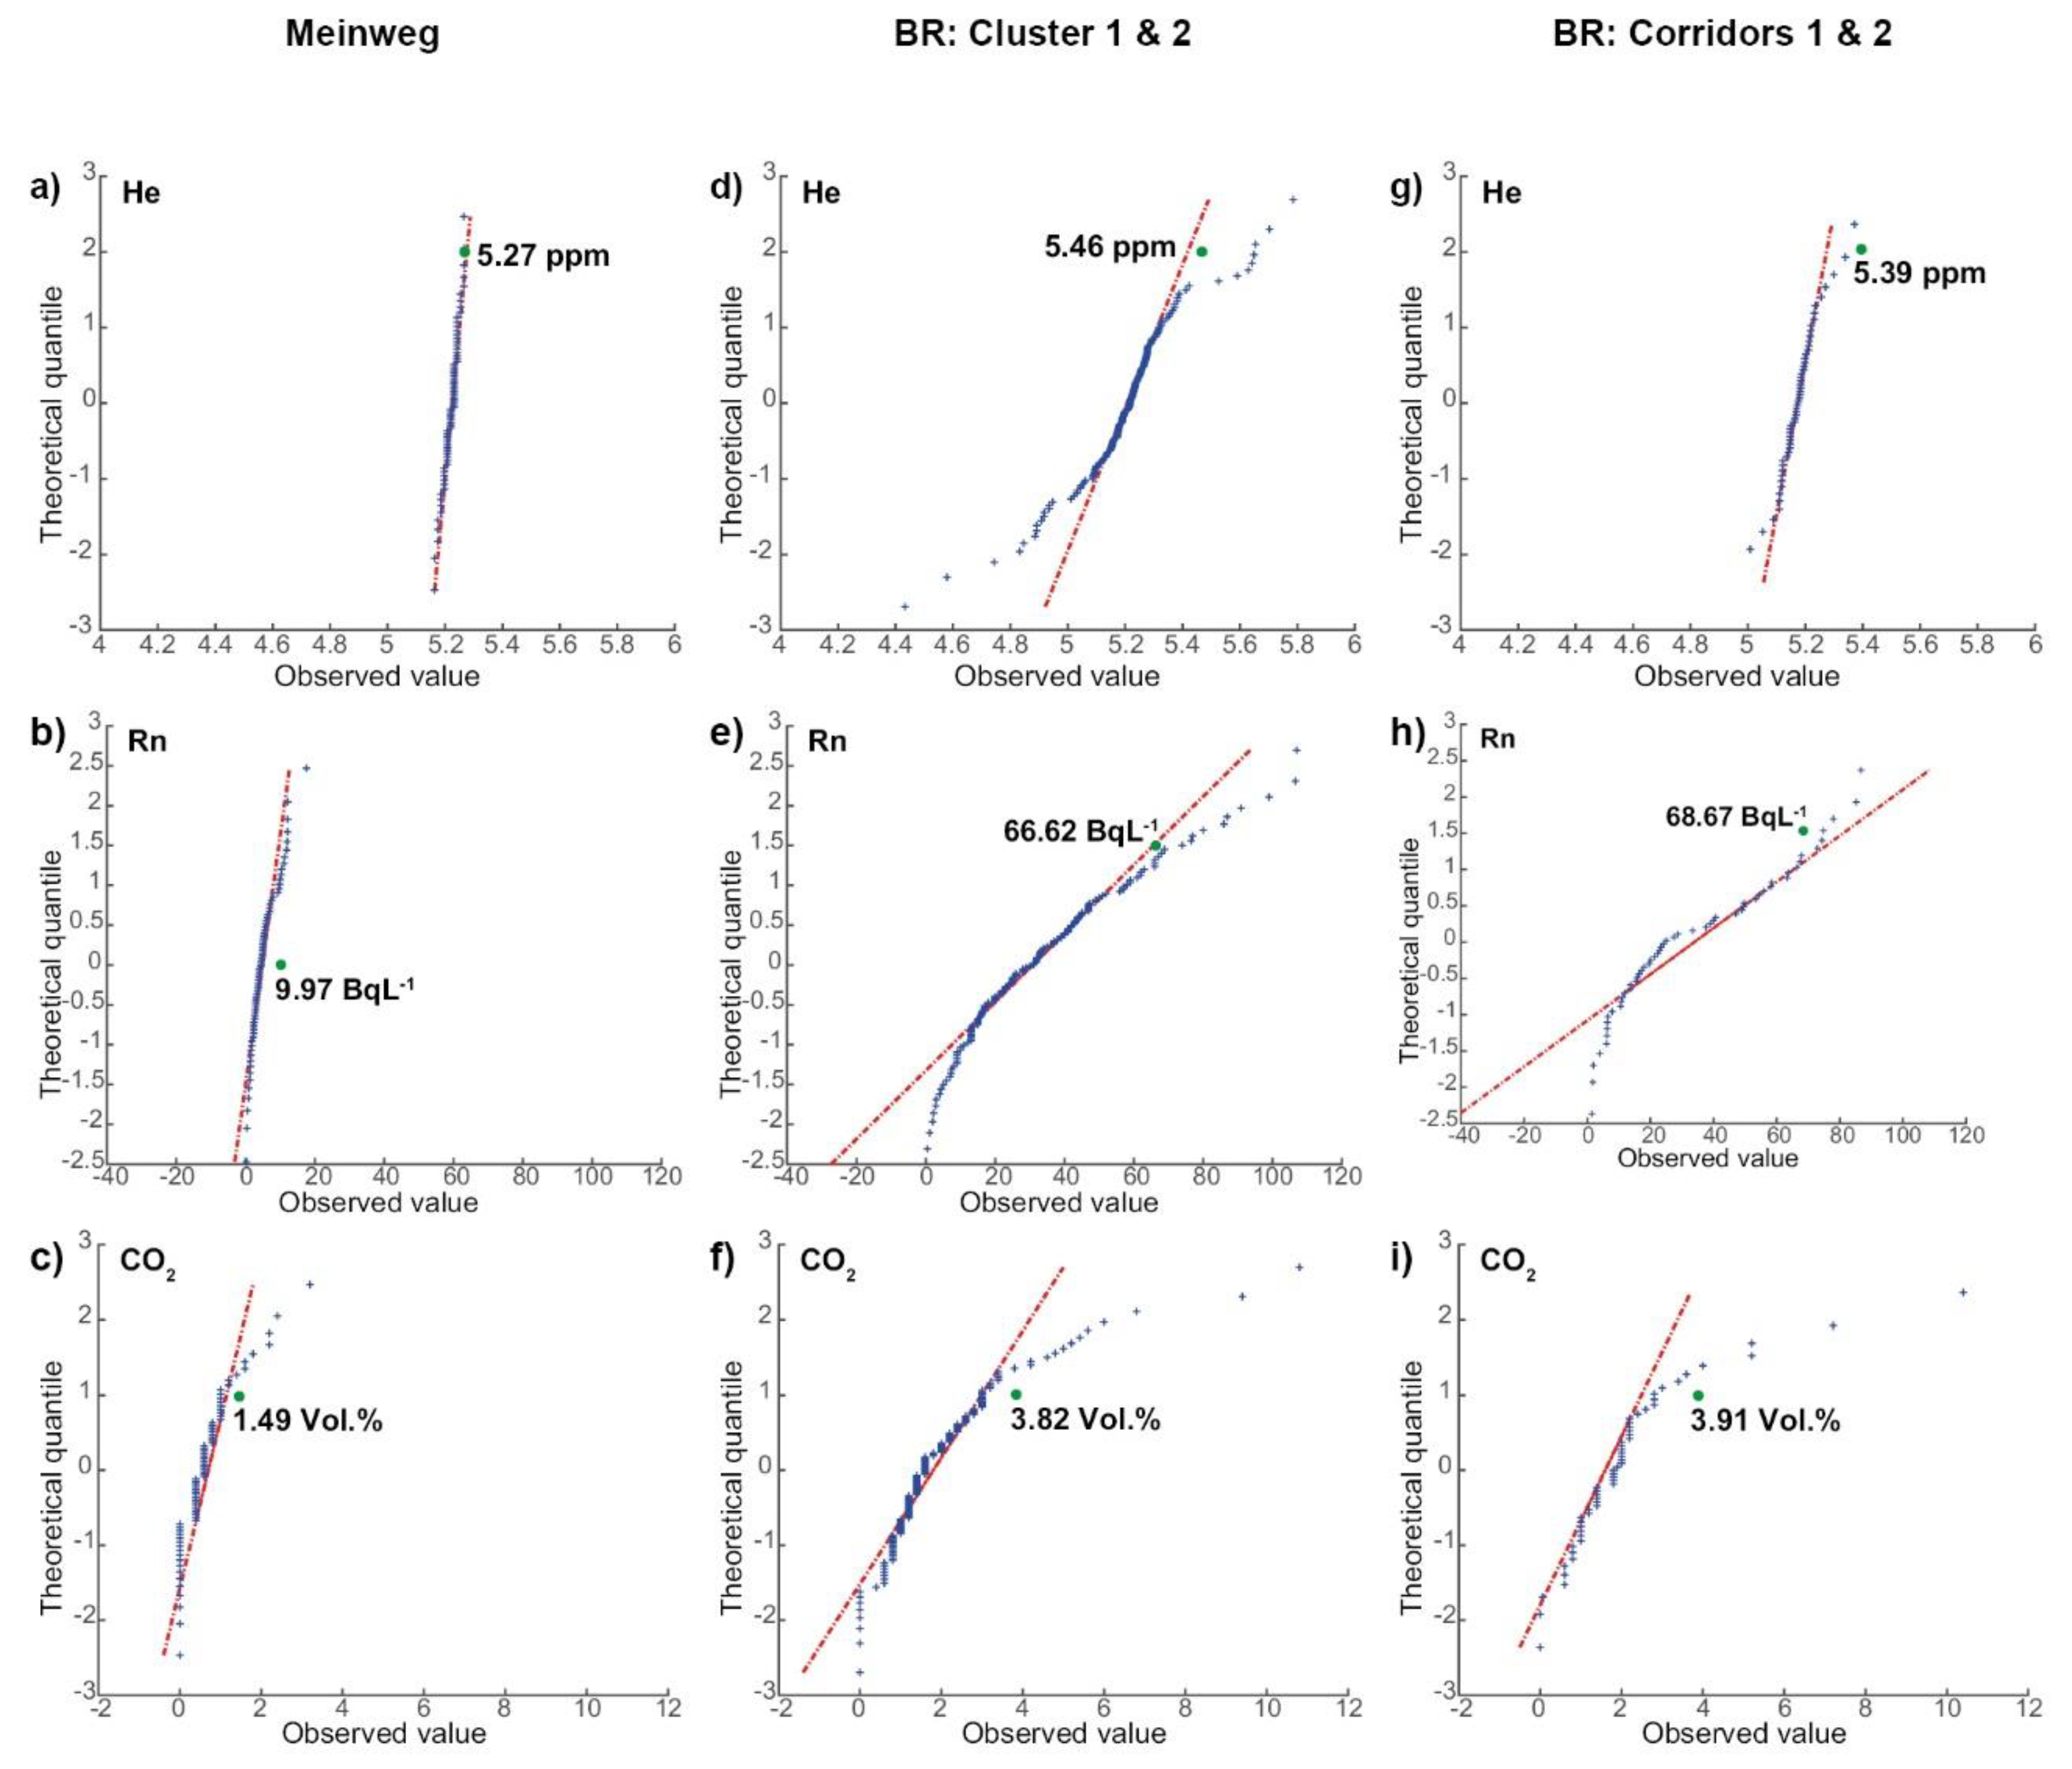
Figure 2. Quantile–quantile plots for He, Rn and CO2, for Meinweg (ac), BR clusters 1 and 2 (df) and BR corridors 1 and 2 (gi) highlighting anomalous upper thresholds (green dot) for the single gas species. The dashed red line is the theoretical cumulative distribution function.
Geosciences 12 00388 g002
Figure 3. Estimated K-function curves for He, Rn and CO2 for Meinweg (ac), BR clusters 1 and 2 (df) and BR corridors 1 and 2 (gi) compared to 99 different random distributions concerning the gas-specific anomalous thresholds. The behavior of the empirical means is indicated by solid black lines, the dashed red line is Ripley’s K-function and grey areas are the confidence envelopes.
Geosciences 12 00388 g003
Figure 4. Surface maps of degassing patterns for RWA-free Meinweg area with respect to the background, anomalous threshold, and maximum values for He (a), and anomalous threshold and maximum values for Rn (b) and CO2 (c). Inlet shows the present-day stress field for the study area. No faults have been reported in the literature so far for this area.
Geosciences 12 00388 g004
Figure 5. Surface maps of degassing patterns for subsets 1 (ac) and subset 2 (df) of cluster 1 and 2 at Bodanrück with respect to the background, anomalous threshold, and maximum values for He (a), Rn (b) and CO2 (c) in comparison with interpretation of re-activated strike-slip fault zones (black lines with black arrows) analysed from RWA prototype lines [10]. Black arrows indicating left-lateral strike slip mode for subset 1 and right-lateral strike-slip mode for subset 2 according to [10,42]. Inlets show (i) the Swabian–Franconian fault system of the Eocene–Oligocene [42] and (ii) the tectonic standard model for the Bodanrück area [10].
Geosciences 12 00388 g005
Table 2. Results of Pearson’s correlation test (level of significance p ≤ 0.05) for log-transformed soil gas data. Moderate-to-high positive relationships [75] are indicated in bold.
GasMeinwegBodanrück
Subsets of Cluster 1 and 2Corridors 1 and 2
HeRnCO2HeRnCO2HeRnCO2
He1 1 1
Rn−0.21 0.11 −0.01
CO2−0.20.510.20.71−0.00.41
Publisher’s Note: MDPI stays neutral with regard to jurisdictional claims in published maps and institutional affiliations.