Abstract
Hypersaline lakes are sensitive and increasingly threatened ecological and depositional environments that are host to a diverse spectrum of industrial services, natural resources, and environmental processes. Furthermore, they are also important repositories of high-resolution palaeoenvironmental information and are potentially key archives in the reconstruction of environmental, climatic conditions and past human impacts in areas where other such repositories may not be available. Many saline lakes are threatened by increased farming and irrigation practices and the effects of global warming. Geochemical XRF analyses of a transect of sediment cores from Laguna Salada de Chiprana, a permanent hypersaline lake in the Iberian Peninsula, provide insights into geochemical processes and palaeoenvironmental changes occurring at the site throughout the last 300–400 years. Key changes identified within the sequence are defined both from a spatial and temporal aspect and characterise the profundal and littoral sub-environments of the lake. Initially, the onset of a phase of widespread agriculture and irrigation in the region occurred in the late 16–17th century to ~1850AD and was associated with relative increases in lake levels. This was followed by decreasing lake levels between 1850 and 1950AD, likely associated with increasing evaporative processes and decreased irrigation returns to the lake, which also allowed for increased organic productivity in the profundal setting. This may have been associated with the transition of the site to a wetland-type setting, where biological processes were able to flourish in the shallower central depocentres of the lake. In sequence, the introduction of farm machinery and changing irrigation patterns occurred around 1950, causing small increases in lake levels, colonization by charophytes as well as increased organic productivity in the littoral setting, likely due to the establishment of suitable environments for biological processes to occur in the shallower margins of the lake when water levels rose. From this period to the present day, slow drawdown of the lake has occurred coupled with increasing management of the site by the regional government, leading to several phenomena. Evaporative processes are high throughout the lake; there are falling but highly variable water levels and there is a segmentation of organic productivity, whereby falling lake levels permit increased organic productivity in the profundal setting but decrease productivity in the littoral setting due to the establishment of harsh evaporitic and erosive conditions in this area. The reconstruction reveals the high sensitivity of Lake Chiprana as an environmental archive and illustrates the need to utilise multiple sediment cores for accurate palaeoenvironmental reconstructions of saline lakes due to the strong variability in depositional and geochemical sub-environments.
1. Introduction
Lacustrine basins are distributed worldwide and contain extensive and often detailed archives of palaeoenvironmental information essential for reconstructing the past and understanding the dynamics of such basins as well as global change [1]. Many studies have provided both numerous and detailed depositional, geochemical and palaeohydrological models for a wide range of these settings, including karstic [1,2,3], freshwater [4,5], fluvio-lacustrine [6], tufaceous [7] and volcanic [8] examples. Fewer studies have, however, considered the potential of hypersaline lacustrine systems [9] to act as valid repositories of environmental information. Many hypersaline lakes are highly complex systems with extreme environmental conditions, which nullify the development of complex life [10,11]. Globally, they are generally concentrated in closed, endorheic basins with low rainfall and high rates of evapotranspiration [12]. In many cases, saline–hypersaline lakes can effectively act as high-resolution archives of environmental information due to their high sensitivity to environmental and anthropogenic factors [13,14].
Though many hypersaline lakes can indeed be considered excellent targets for the study of environmental change at high resolutions, this also lends premise to the need for detailed investigations of such sites if their sedimentology and geochemistry are to be fully understood [9,15]. Reliable environmental archives are often scarce in many arid to semi-arid areas of the globe [9] and, subsequently, hypersaline lakes can offer a potential source of critical palaeoenvironmental information if their sequences are characterised in similar detail to other studies focusing on lacustrine settings. This is, however, becoming progressively achievable with the increasing availability and ease of non-destructive techniques, including microfacies description [16,17] and geochemical analyses, particularly (µ)X-ray fluorescence core scanning [18,19,20,21]. Using such multidisciplinary approaches, many studies have effectively generated high-resolution palaeoenvironmental reconstructions of lacustrine sedimentary archives at varying temporal scales [2,21,22,23], ranging from hundreds to tens of thousands of years. However, very few such studies have applied the same methods to hypersaline lake sediment records and the global occurrence of such systems [24] coupled with their ability to respond to environmental change [21,25] warrants further investigation of these environments in their consideration as palaeoenvironmental archives.
This study presents a multiproxy palaeoenvironmental reconstruction of the primary geochemical processes occurring in hypersaline Laguna Salada de Chiprana, Northern Spain, for the last ~350–400 years. This setting is a unique athalassic (non-sea-originated) hypersaline permanent lake in Europe [26], providing a natural laboratory to investigate environmental and anthropogenic processes occurring in the Ebro Basin [27]. The study aimed to determine the primary intrinsic and extrinsic factors and processes represented within the sediment sequence comparatively to other Iberian lakes throughout the peninsula [21,28,29]. To achieve this, the study describes and interprets various processes occurring in Lake Chiprana throughout the last three to four centuries, providing insights into the potential for hypersaline lacustrine systems to be used as palaeoenvironmental archives. Finally, the study aims to take a novel approach by adopting a multi-core approach to understand both climatic and anthropogenic influences acting on the site, presenting novel ways to investigate these unique ecological and depositional systems. This study is also a continuation of previous work undertaken on Laguna Salada de Chiprana, which considered the sedimentological aspects of the different depositional sub-environments associated with the lake [30]. Therein, nine facies, including one subfacies, were identified, including organic-, gypsum- and detrital-rich examples, as defined in Table S1. Integration of sedimentological and geochemical data was undertaken in order to further delineate palaeoenvironmental changes occurring within Lake Chiprana throughout the last three to four centuries.
2. Study Area
2.1. Geology and Geomorphological Characteristics
Laguna Salada de Chiprana (41°14′30″ N, 0°10′50″ W) is situated in the endorheic Ebro Basin in Northeast Spain, 5 km southwest of the town of Chiprana on the Ebro River (Figure 1). The lake is approximately 5 m deep and is the deepest, permanent hypersaline lake within the Iberian Peninsula [27]. The regional geological setting comprises Oligocene-Miocene claystones and marls, which are cross-cut by complexes of Oligocene sandstone palaeochannels [31,32]. Primary geomorphological features include flat-topped terraces composed of the Oligo-Miocene marl and mudstone bodies and ridges and topographic highs composed of the Oligocene sandstone palaeochannels. In Lake Chiprana, these sandstone palaeochannels form a distinctive topographical feature known as “inverted topography” [33], whereby the ridges formed by the channels segment the lake into multiple sub-basins [27]. This particular topographical feature has become increasingly more defined in recent years as a result of lake drawdown and segmentation [34].
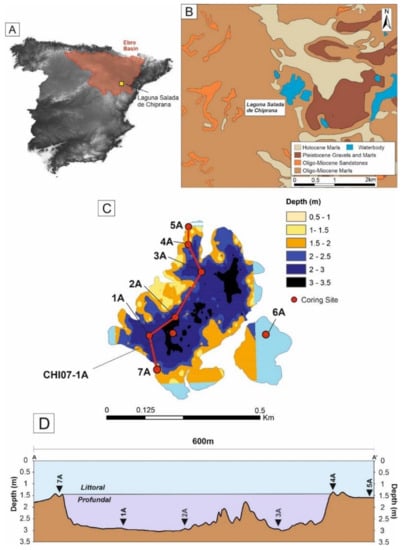
Figure 1.
Maps illustrating the location of Laguna Salada de Chiprana in Northeast Spain. (A) Digital elevation model of the Iberian Peninsula generated using ArcMap 10.14.1 with the location of the Ebro Basin highlighted in red. The location of Laguna Salada de Chiprana is marked by a yellow square. (B) Regional geology of the area of Laguna Salada de Chiprana. (C) Bathymetric map of Laguna Salada de Chiprana with sediment cores collected from the lake during March 2019 highlighted. (D) Bathymetrical cross-section, oriented NE-SW, of the main basin of Laguna Salada de Chiprana with all cores (with the exception of 6A, located in the side lagoon) marked on the section. Geological data sourced from [31], DEMs from CNIG (Centro Nacional de Informacion Geografica), bathymetrical data provided by the Instituto Pirenaico de Ecologica. Figure partially modified from [30].
2.2. Climatic and Hydrological Setting
The region of Northeast Spain where Lake Chiprana is situated is defined by a semi-arid and Mediterranean climate, with a strong summer drought and increased rainfall in winter. The mean temperature is 15.5 °C [35], with temperature minima and maxima of approximately 3 °C and 34 °C in winter and summer, respectively. High rates of evapotranspiration act as the primary hydrological output (1000–1500mm/year), whilst low rainfall (~400mm), groundwater input [36] and an over-ground channel inlet from Laguna de las Roces, a nearby freshwater pond, are the main hydrological inputs. July is typically the driest month of the year, while the wettest months are typically May and October. The surface area of the lake was approximately 0.2 km2 in November 2019 and had increased by approximately 0.01 km2 in December 2021. This surface area has varied between 10 and 50 m2 throughout previous annual hydrological cycles due to the increased aridity during summer and flooding and increased rainfall that occurs in the winter. Increasing land management since the 1980s [33] has further led to an overall fall in surface area of the lake from 0.3 km2 in 1991 [37] to 0.2 km2 in 2019.
2.3. Limnological Characteristics
Na+, Mg2+ and Cl and SO42− ions are the key chemical constituents in the lake water and occur, in descending order of concentration, as SO42− >Mg2+ > Na+ > Cl− > Ca2+. Salinity values are reported as being around 70–80g/L and observations from the Gobierno de Aragon (Aragon County Council) have shown it to be rising since the lake was first limnologically characterised in the early 1990s [38]. Two limnological surveys undertaken in November 2019 and in November 2021 are displayed in Table 1. The November 2019 survey shows that Lake Chiprana exhibits homogeneous chemistry in the primary waterbody and the Eastern side lagoon. During this survey, the lake exhibited an average temperature of 11.88 °C, an average dissolved oxygen value of 8.5 mg/L, an average conductivity of 46,965 μs/cm, an average total dissolved solids (TDS) value of 40 g/L and an average pH of 9.65. The December 2021 survey illustrated an average surface temperature of approximately 8.85 °C, an average dissolved oxygen value of 7.86 mg/L, an average conductivity of 39767 μs/cm, an average TDS of 37378 mg/L and an average pH of 9.6. Furthermore, a survey of the entire water column illustrated a strong vertical gradient in all of these parameters, with significant increases in temperature, TDS and conductivity, as well as significant decreases in dissolved oxygen and pH. Overall, the lake is largely meromictic but has been observed to show water mixing and non-stratification in the past due to changes in nutrient loading [39].

Table 1.
Limnological characteristics of Laguna Salada de Chiprana at the lake surface during November 2019 and at both the lake surface and approximately 4 m depth during December 2021. Limnological data are from a YSI Exo1 multiparameter multiprobe.
3. Material and Methods
Seven short sediment cores measuring between 30 and 50 cm were retrieved from Lake Chiprana in March 2019 using a UWITEC©-type gravity corer lowered from a pneumatic boat across a 600 m transect. Six of the cores were retrieved in a NE-SW transect across the primary waterbody (Figure 1) to include a range of sediments from the different depositional sub-environments of the lake. A single sediment core measuring approximately 37 cm was also retrieved from the smaller side lagoon. Cores were kept in a cool box and transported to the Institute of Pyrenean Ecology (IPE-CSIC), Zaragoza for temporary storage at 4 °C. They were then transported to the School of Geography, the University of Manchester, for analyses and permanent storage. Sediment cores were subjected to several methods of geochemical analysis, including ICP-MS and ICP-OES, XRF scanning, X-ray diffraction and δ13Corg−. Methods were undertaken and results carried out following a similar approach undertaken in Lake Zonar in 2011 due to the comparative similarity of the two settings [21].
3.1. Bulk Geochemistry
3.1.1. LOI and δ13Corg
Loss-on-ignition analyses for the determination of approximate carbon and carbonate content were also undertaken on samples from the cores at 1 cm intervals using the methods described by [40]. Samples were initially freeze dried in bulk to remove water and then heated in a furnace (CARBOLITE ELF11/14B). Samples were weighed before and after drying and after each incremental temperature step, with the determination of LOI from loss-on-ignition after ignition at 550 °C for 2 hours and carbonate content after ignition at 925 °C for 4 hours. For δ13Corg− measurements, organic carbon isotopes were measured on bulk sediment samples via sealed-tube combustion. For this, between 7.5 and 35 mg of rock powder was decarbonated in a quartz tube using hydrochloric acid (25%). Subsequently, sample powder was rinsed with deionised water until neutrality and dried at 40 °C. Sample powder was homogenously mixed with CuO wire. Carbon dioxide was liberated via sealed-tube combustion at 850 °C for three hours, purified cryogenically in a vacuum distillation line and collected in a Pyrex break-seal tube. Mass spectrometric measurements were performed on a ThermoScientific Delta V Advantage equipped with a dual inlet.
3.1.2. ICP-MS/OES
For ICP-MS and ICP-OES analyses, solid sediment samples were freeze dried and weighed to ~0.2 g. Digestion of a total of 381 samples was undertaken using an Aqua Regia (1 HNO3 + 3N HCl) digestion method in a CEM MARS Xpress 6 Microwave digestion system. After digestion, samples were filtered and twice diluted to a dilution factor of 100. Sample aliquots were analysed according to standard operating procedure, as described here, using a Perkin Elmer Optima 8300 ICP-OES system and a PerkinElmer NexION 350D ICP-MS at the Department of Geography, School of Environment and Education, University of Manchester. The ICP-OES and ICP-MS methodology used a 5-point linear calibration with a 99.999% minimum regression, with an internal Yttrium standard made up in ~2% Nitric Acid, using 18 MΩ Deionised Water and 70% Ultrapure Nitric Acid. To correct for instrument drift and matrix interferences, ICP-OES results were initially quantified against this curve in mg/L, or ppm, at a limit of detection of 0.005 mg/L. ICP-MS results were quantified against an internal standard in µg/L, or ppb, to a detection limit of 0.005 µg/L. Any figures below these detection limits were noted as being below the limit of detection (<LOD) including any quantities below zero, as the instrument cannot discern peaks from background noise below these levels.
3.2. XRF Scanning
Sediment cores were introduced to a Cox Analytical Systems Itrax XRF Core scanner in the School of Geography, University of Manchester. Photographs and radiographs were produced for subsequent sedimentological analyses [30,41]. The cores were also scanned using a Molybdenum (Mo) X-ray source tube. The parameters for scanning included a tube voltage of 30 kv, tube current of 30 mA and count time of 30 s, at a 1 mm interval [30]. Elemental data included a wide range of variables (approximately 30+ elements detected for each core) and were initially presented in the form of counts per second (cps). Processing and evaluation of X-ray spectra was undertaken with Qspec 6.5 software (Cox Analytical Systems, Mölndal, Sweden) and plotted in the ItraxPLOT (Raddec Ltd, Southampton, UK) and ReDiCore (Cox Analytical Systems, Mölndal, Sweden) software packages. For analysis of geochemical processes, logarithmic ratios of elements were utilised throughout.
3.3. Analysis and Transformation of Geochemical Data
Analyses of geochemical data were also undertaken to better define environmental processes occurring within Lake Chiprana. Despite this, in the case of the XRF data, there are a large number of elements detected by the Itrax XRF scanner and not all elements can be used to interpret palaeoenvironmental variations [42]. Thus, to reduce the number of elements considered for statistical analysis and palaeoenvironmental interpretation, several techniques were employed. This firstly involved the removal of elements that exhibited very low or exceedingly noisy values, those correlated with high argon readings (signifying air in the cores) and those with high mean standard errors. Secondly, basic statistical analysis was undertaken to determine possible relationships between geochemical variables, utilising Pearson’s correlation coefficient tests, signified by r [43]. Following this, XRF data were transformed via central log ratio calibration to account for the effects of factors such as grain size, water content and organic matter [44] using the ItraxR software (Thomas Bishop, Manchester) package [45]. Grouping was determined by using both the former Pearson correlative coefficient tests and principal component analyses undertaken in the Past 4.0 software (Natural History Museum, Oslo) package [46]. Elements which were quality controlled to remove invalid data were then subjected to principal component analysis (PCA) also using the Past 4.0 software package.
3.4. Chronological Model
The chronological model (Figure 2) was generated using sedimentological and geochemical indicators. The longest core (CHI19-1A) collected for this study was correlated with the same sequence in cores retrieved from Lake Chiprana in 1997 and 2007 (CHI97-1A and CHI07-1A, the former core being described and chronologically dated [27] by using indicators such as facies variations and sedimentological units, in addition to using XRF data as described in an earlier study [30]. As stated in a previous study, this provides a qualitative chronological constraint, which is accompanied by radiometric dating techniques including 137Cs and 14C of the older cores, with the associated dates utilised being presented in Table 2. The model presented in the aforementioned study has, however, been revised and updated for this study following further statistical analysis and the final model was generated from the dates in Table 2 using the R-based software (Queen’s University, Belfast) Clam [47,48] via linear interpolation methods (Figure 2B).
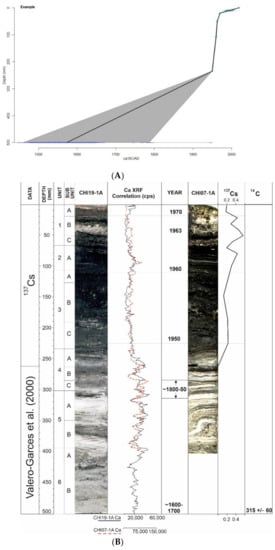
Figure 2.
(A) Clam [47] generated age-depth model for the last ~350–400 years of Lake Chiprana based on 210Pb, 137Cs and 14C dates. Chronological model modified from [30]. (B) Chronological correlation between core CHI19-1A and a core (CHI07-1A) retrieved from Lake Chiprana in 2007, provided by IPE. Adapted from [30], see this study for further details.
Table 2.
210Pb, 137Cs and 14C dates for associated cores. The carbon-14 date is from [49], 210Pb and 137CS dates provided by the Instituto Pirenaico de Ecologia (IPE).
4. Results
4.1. Sedimentological Sequence
Sediment cores retrieved from Lake Chiprana illustrate multiple sedimentary facies (Table S1 in Supplementary Materials) and are associated with two distinctive depositional sub-environments—the profundal and littoral zones. Facies, sedimentary features and sedimentary structures associated with each of these zones are described and further interpreted in an earlier study [30]. Nine facies in total were identified with one further sub-facies and include a wide range of sedimentological and depositional characteristics.
4.2. Geochemistry
4.2.1. Overview
The PCA analysis of elements from the profundal setting of Lake Chiprana is shown in Figure 3, while variations in major elements associated with the profundal main basin and profundal side basin of Lake Chiprana are shown in Figure 4 and Figure 5. The PCA analysis of elements from the littoral setting of Lake Chiprana is shown in Figure 6, and the variation in major elements in Figure 7 respectively. The relationship between ICP-OES/MS and XRF data suggests that the qualitative XRF dataset is a valid and reliable indicator of downcore variations in geochemical composition [21,50]. Statistical analysis of XRF data associated with the profundal and littoral sequences led to the removal of several elements out of the 35 that were initially detected by the Itrax XRF scanner due to noisy, low counts or high mean standard errors associated with the data. These variables were not considered in subsequent data analyses.
4.2.2. Profundal Setting
Table 3 displays Pearson correlative indices (r) for the raw (untransformed) element data associated with the profundal setting of Lake Chiprana. Principal component analysis includes elements, which are considered suitable following data processing and transformation and indicates that the first four components associated with the profundal sequence account for 77.89% of the total variance in the dataset (Figure 3, Figure S1, Table S2). The PCA biplot and Pearson correlative analyses also illustrate that four groupings of the present variables can be made. Group P1a consists of elements Al, Si, Mn, Fe, Ti, K and Rb, which display moderate to strong correlation coefficients (r > 0.5) and are in proximity on the PCA biplot. Increases in detrital calcite, phyllosilicates and quartz are also characteristically related to an increase in the intensity of this group of elements [30]. Group P1b consists solely of the element Ca. It displays moderate correlation with Group P1a, but also separation from this group within the PCA biplot. This group is associated with increases in detrital calcite, phyllosilicates, quartz and gypsum in some intervals [30]. Group P2 consists of elements S, Cl and Sr, which are grouped due to their moderate correlation (r > 0.35) and proximity on the biplot. This group of elements is typically associated with increases in gypsum, aragonite and non-detrital (i.e., precipitated) calcite. Group P3 is composed of elements Cu, Ni, Br and the ratio of Inc/Coh (defined as the Incoherent/Coherent scattering ratio detected by the XRF scanner [42]).
Transformed XRF intensities of elemental variables from the profundal sedimentary sequence of Lake Chiprana are exhibited in Figure 4 and Figure 5with ICP-OES data. Elemental intensities are also consistent with the occurrence of different facies with varying mineralogy and sedimentological characteristics throughout the sequence (Table S1) [30]. Elements from Group P1a (Al, Si, Zn, Mn, Fe, Ti, K and Rb) and Ca from Group P1b are both strongly associated with siliciclastic facies and show moderate increases within units 5 and 6, which are dominated by these facies. Ca, which is strongly co-ordinated with these elements (r > 0.75, except in the case of Al), is, however, associated with multiple facies, including gypsum, detrital-sourced carbonates and evaporitic carbonates, as seen in other settings, such as Lake Zonar [21]. Higher intensities are, for example, recorded in facies “e” and “f” associated with Units 1 and 4, within gypsum facies “d”, and additionally within detrital facies “a.1”. Group P2, consisting of S, Cl and Sr, is largely associated with facies with an evaporitic signal [21], including facies “e” and “f” microbial mats, facies “c” gypsum and facies “b” mudstones. Both elements show increases in the uppermost sections of the core, throughout all of unit 2, with a marked increase initially occurring within the lower section of unit 4. Group P3, consisting of the variables Br, Inc/Coh, Cu and Ni, is associated with organic-rich and dark black facies throughout the sequence. Increases in variables from this group are apparent within charophytic facies “g” within unit 3, within some instances of facies “a.1” and “a.2”, where organic material is distributed within the muds and silts and additionally within facies “h” at the top of units 5 and 6. Typical increases observed in this group throughout are highlighted within unit 3 to the top of unit 1 and also at several small intervals of unit 5 and 6 where organic material is present.
Table 3.
Table displaying Pearson correlation coefficients (r) between raw element cps data detected by the XRF scanner from profundal core CHI19-1A. Dark-green-shaded cells are indicative of variables which display a coefficient of r > 0.5, whilst light-green-shaded cells indicate variables with a correlation coefficient 0.25 < r < 0.5. Orange-shaded cells indicative a coefficient of r < −0.5, whilst light-orange-shaded cells indicate a correlation coefficient −0.5 < r < −0.25. LOI stands for loss on ignition.
| Al | Si | S | Cl | K | Ca | Ti | Mn | Fe | Sc | Ni | Cu | Zn | Br | Sr | Zr | Cr | Rb | Mo | Pb | Inc/Coh | |
|---|---|---|---|---|---|---|---|---|---|---|---|---|---|---|---|---|---|---|---|---|---|
| Al | |||||||||||||||||||||
| Si | 0.579 | ||||||||||||||||||||
| S | −0.127 | −0.333 | |||||||||||||||||||
| Cl | −0.202 | −0.414 | 0.609 | ||||||||||||||||||
| K | 0.509 | 0.924 | −0.418 | −0.384 | |||||||||||||||||
| Ca | 0.466 | 0.820 | −0.030 | −0.308 | 0.783 | ||||||||||||||||
| Ti | 0.520 | 0.900 | −0.443 | −0.380 | 0.981 | 0.759 | |||||||||||||||
| Mn | 0.450 | 0.777 | −0.184 | −0.222 | 0.815 | 0.800 | 0.839 | ||||||||||||||
| Fe | 0.516 | 0.875 | −0.426 | −0.341 | 0.969 | 0.742 | 0.984 | 0.849 | |||||||||||||
| Sc | −0.113 | −0.200 | 0.353 | 0.175 | −0.254 | 0.048 | −0.282 | −0.132 | −0.262 | ||||||||||||
| Ni | −0.073 | −0.064 | −0.048 | 0.105 | −0.023 | −0.171 | −0.024 | −0.061 | −0.001 | −0.153 | |||||||||||
| −0.162 | −0.292 | 0.047 | 0.417 | −0.238 | −0.476 | −0.222 | −0.256 | −0.204 | −0.168 | 0.399 | |||||||||||
| Zn | 0.347 | 0.588 | −0.259 | −0.275 | 0.662 | 0.548 | 0.657 | 0.536 | 0.653 | −0.140 | 0.044 | −0.152 | |||||||||
| Br | −0.299 | −0.458 | 0.150 | 0.559 | −0.405 | −0.628 | −0.389 | −0.371 | −0.359 | −0.133 | 0.360 | 0.659 | −0.337 | ||||||||
| Sr | −0.121 | −0.198 | 0.372 | 0.141 | −0.297 | 0.076 | −0.317 | −0.145 | −0.325 | 0.259 | −0.039 | −0.148 | −0.172 | −0.055 | |||||||
| Zr | −0.149 | −0.207 | 0.281 | 0.176 | −0.279 | −0.052 | −0.288 | −0.156 | −0.286 | 0.133 | 0.080 | 0.007 | −0.177 | 0.208 | 0.835 | ||||||
| Cr | 0.192 | 0.348 | 0.034 | 0.068 | 0.379 | 0.386 | 0.374 | 0.343 | 0.368 | 0.074 | −0.131 | −0.099 | 0.272 | −0.223 | −0.061 | −0.132 | |||||
| Rb | 0.410 | 0.686 | −0.418 | −0.268 | 0.784 | 0.517 | 0.808 | 0.684 | 0.832 | −0.268 | 0.036 | −0.070 | 0.559 | −0.190 | −0.348 | −0.263 | 0.271 | ||||
| Mo | −0.017 | −0.027 | 0.254 | 0.267 | −0.113 | 0.089 | −0.123 | −0.017 | −0.123 | 0.151 | 0.004 | 0.008 | −0.076 | 0.074 | 0.238 | 0.249 | −0.021 | −0.147 | |||
| Pb | 0.122 | 0.274 | −0.307 | −0.115 | 0.350 | 0.160 | 0.354 | 0.279 | 0.376 | −0.178 | 0.129 | 0.073 | 0.242 | 0.081 | −0.158 | −0.082 | 0.033 | 0.394 | −0.063 | ||
| Inc/Coh | −0.376 | −0.566 | 0.032 | 0.334 | −0.532 | −0.771 | −0.510 | −0.518 | −0.493 | −0.160 | 0.374 | 0.611 | −0.409 | 0.857 | −0.033 | 0.202 | −0.357 | −0.299 | 0.003 | 0.010 |

Figure 3.
PCA biplot illustrating groupings of the variables associated with the profundal cores (CHI19-1A) from Lake Chiprana. Rb and Al are included in Group P1a but are likely affected by noise causing the observed separation. Ellipse represents the 95% confidence ellipse and shaded areas represent element groupings.

Figure 4.
Figure illustrating a geochemical sequence of the profundal depositional sub-environment of the main basin (CHI19-1A) of Lake Chiprana, with elemental XRF data, expressed as transformed counts per second, carbon-13 organic measurements and magnetic susceptibility, expressed as SI, included. Elements are grouped according to the same groupings that are shown on the associated PCA biplot in Figure 3. Facies are described in Table S1. CT data, photographs, graphic lithology and facies are also defined in [30] and their collection methods described. Grey line = XRF, black line = ICP. Element ICP data expressed as mg/L. Inc/Coh = Incoherence/coherence scattering ratio of the X-ray detector.

Figure 5.
Figure illustrating a geochemical sequence of the profundal depositional sub-environment of the side basin (CHI19-6A) of Lake Chiprana, with elemental XRF data, expressed as transformed cps, and magnetic susceptibility expressed as SI. Facies are described in Table S1. CT scans and high-resolution photographs are included alongside elemental data. CT data, photographs, graphic lithology and facies are also defined in [30]. Grey line = XRF, black line = ICP. Element ICP data expressed as mg/L.
4.2.3. Littoral Setting
Table 4 displays the Pearson correlative indices for the elements associated with the littoral setting. Principal component analyses of XRF data from the littoral sequence are highlighted in Figure 6. The PCA shows that the first four components associated with the littoral sequence account for 83.9% of the total variance in the dataset (Figure S2, Table S2). As with the profundal sequence, the PCA biplot and Pearson correlative analyses illustrate that four key groupings of the elements can be made. Group L1a is composed of elements Mn, Rb, Ti, Fe and K. The latter three of these elements are loosely grouped on the PCA biplot, whilst Mn illustrates lower eigenvectors on the PC1 axis and Rb higher values on the PC2 axis. This group of elements typically displays increases in intensity in association with similar increases in detrital calcite, quartz and phyllosilicates [30]. Group L1b consists of elements Al and Si, which display a moderate correlation (r = 0.515) and are closely grouped on the PCA biplot. This group is considered a subgroup of group L1 due to the correlation of Si with elements from Group L1a. Al does not display a similar correlation, but the noisy signal displayed by this element may have contributed to the absence of any clear correlation. Group L2 consists of Ca, Cl, Sr and S, which are closely grouped on the PCA biplot. In contrast to the profundal sequence, here, Ca instead displays increases closely associated with increasing gypsum content as opposed to detrital calcite. Group L3 is associated with elements Cu, Ni, Br and the ratio of Inc/Coh. As with the profundal cores, this group again is typically associated with organic-rich facies and the association of proxies indicating organic content (Br, Inc/Coh).
Elemental fluctuations in the littoral setting of Lake Chiprana are depicted in Figure 7. Elements from Group L1a (Fe, K, Ti, Rb and Mn) again display increased intensities in detrital facies, those of which occur primarily within unit 3 of the littoral sequence. Overall, this group displays a down-sequence increasing trend which is most pronounced throughout unit 3, with the exception of a small increase in K at the top of the sequence. Al and Si within Group L1b both display a relatively inconsistent trend, with increases primarily observed within the organic-rich charophyte mudstone laminae associated with unit 3 and within the gypsiferous microbial mats in the central section of unit 1. Group L2 represents elements S, Cl, Sr and Ca, those of which are typically correlated with gypsiferous facies [30] “b”, “c” and “d”. Increases can also be observed within the gypsum-rich microbial mats (facies “f”) associated with the upper section of unit 1 and within the cm scale gypsum bed (facies “c”) that can be observed in the uppermost section of unit 3/base of unit 2. Group L3, pertaining to elements Br, Ni, Cu and the ratio of Inc/Coh, displays several significant changes throughout the sequence. Generally, the most significant increases within these variables can be observed within the organic-rich microbial mats within the uppermost section of unit 1 and within the charophytic, organic-rich black mudstones that are characteristic of unit 3. Heavy metals Cu and Ni again display specific covariance with Inc/Coh and Br, similar to that which occurred throughout the profundal sequence.
Table 4.
Table displaying Pearson correlation coefficients (r) between raw element cps data detected by the XRF scanner from littoral core CHI19-4A. Dark-green-shaded cells are indicative of variables which display a coefficient of r > 0.5, whilst light-green-shaded cells indicate variables with a correlation coefficient 0.25 < r < 0.5. Orange-shaded cells highlighted with red text indicative a coefficient of r < −0.5, whilst light-yellow-shaded cells indicate a correlation coefficient −0.5 < r < −0.25.
| Al | Si | S | Cl | K | Ca | Ti | Mn | Fe | Sc | Ni | Cu | Zn | Br | Sr | Zr | Rb | Cr | Mo | Pb | Inc/Coh | |
|---|---|---|---|---|---|---|---|---|---|---|---|---|---|---|---|---|---|---|---|---|---|
| Al | |||||||||||||||||||||
| Si | 0.515 | ||||||||||||||||||||
| S | 0.176 | 0.310 | |||||||||||||||||||
| Cl | 0.233 | 0.332 | −0.114 | ||||||||||||||||||
| K | 0.146 | 0.384 | −0.370 | 0.644 | |||||||||||||||||
| Ca | 0.268 | 0.511 | 0.792 | 0.062 | −0.104 | ||||||||||||||||
| Ti | −0.059 | 0.011 | −0.120 | 0.148 | 0.175 | −0.101 | |||||||||||||||
| Mn | 0.174 | 0.320 | −0.115 | 0.326 | 0.467 | 0.106 | 0.018 | ||||||||||||||
| Fe | 0.156 | 0.386 | −0.353 | 0.617 | 0.874 | −0.144 | 0.167 | 0.582 | |||||||||||||
| Sc | 0.079 | 0.280 | 0.414 | 0.169 | −0.054 | 0.494 | −0.117 | −0.017 | −0.057 | ||||||||||||
| Ni | 0.053 | 0.128 | −0.164 | 0.419 | 0.307 | −0.155 | 0.693 | 0.016 | 0.296 | −0.073 | |||||||||||
| Cu | 0.030 | 0.013 | −0.363 | 0.570 | 0.438 | −0.364 | 0.481 | 0.065 | 0.359 | −0.177 | 0.632 | ||||||||||
| Zn | 0.074 | 0.032 | 0.000 | 0.036 | 0.034 | 0.063 | −0.019 | 0.102 | 0.098 | 0.074 | −0.008 | −0.030 | |||||||||
| Br | 0.046 | 0.087 | −0.478 | 0.673 | 0.645 | −0.319 | 0.126 | 0.278 | 0.636 | −0.125 | 0.434 | 0.629 | −0.026 | ||||||||
| Sr | 0.154 | 0.300 | −0.056 | 0.427 | 0.280 | 0.285 | 0.025 | 0.184 | 0.331 | 0.269 | 0.215 | 0.083 | 0.059 | 0.377 | |||||||
| Zr | 0.074 | 0.134 | −0.354 | 0.492 | 0.475 | −0.155 | 0.292 | 0.207 | 0.486 | −0.040 | 0.512 | 0.461 | 0.026 | 0.619 | 0.724 | ||||||
| Rb | −0.032 | 0.133 | −0.158 | 0.200 | 0.277 | −0.100 | 0.048 | 0.198 | 0.320 | −0.015 | 0.109 | 0.157 | 0.083 | 0.270 | 0.079 | 0.164 | |||||
| Cr | 0.047 | 0.182 | 0.208 | 0.290 | 0.074 | 0.189 | 0.119 | 0.035 | 0.114 | 0.267 | 0.161 | 0.161 | 0.149 | 0.063 | 0.166 | 0.065 | 0.021 | ||||
| Mo | 0.212 | 0.366 | 0.700 | 0.105 | −0.171 | 0.679 | −0.031 | −0.061 | −0.171 | 0.443 | 0.020 | −0.171 | −0.020 | −0.241 | 0.074 | −0.146 | −0.052 | 0.148 | |||
| Pb | −0.029 | 0.118 | −0.309 | 0.332 | 0.433 | −0.176 | 0.036 | 0.177 | 0.458 | 0.058 | 0.159 | 0.235 | 0.015 | 0.431 | 0.203 | 0.271 | 0.269 | 0.003 | −0.203 | ||
| Inc/Coh | −0.025 | −0.039 | −0.533 | 0.567 | 0.549 | −0.511 | 0.439 | 0.120 | 0.492 | −0.272 | 0.652 | 0.811 | −0.052 | 0.802 | 0.182 | 0.622 | 0.232 | 0.023 | −0.309 | 0.338 |

Figure 6.
PCA biplot illustrating groupings of the variables associated with the littoral cores from Lake Chiprana. Ellipse represents the 95% confidence ellipse and shaded areas represent element groupings.

Figure 7.
Figure illustrating a geochemical sequence of the littoral depositional sub-environment of Lake Chiprana (CHI19-4A), with elemental XRF data, expressed as counts per second and MS, expressed as SI, included. Elements are grouped according to the those shown on the associated PCA biplot in Figure 5. CT scans and high-resolution photographs are included alongside elemental data. CT data, photographs, lithology and facies are also defined in [30]. Element ICP data expressed as mg/L. Grey line = XRF, black line = ICP.
5. Discussion
A range of environmental factors were identified in this study, comparable to many other lakes throughout the Iberian Peninsula, such as Lake Arreo [51], Estanya [28], Montcortes [29] and Zonar [21], and, as such, these processes are described in comparison with similar examples found in such settings.
5.1. Intrinsic Factors
5.1.1. Oxygenation, Meromixis and In-Lake Productivity
Correlation and interpretation of and productivity in Lake Chiprana is attempted by using (log)Fe/(log)Mn as an indicator of the intensity of reducing conditions occurring throughout the lake [52,53] and by using (log)Mn/(log)Fe as an indicator of more oxic conditions (Figure 8). The use of raw or transformed elemental data as standalone indicators of oxygenation and reducing conditions is not feasible due to the effect of detrital and biological processes upon them [21] and, thus, the use of such ratios, which effectively remove the effect of the denominating element, are considered more reliable when interpreting redox and biological processes [21,54]. In the profundal setting, periods of increased oxygenation occur at the base of unit 1 and within the basal sections of unit 4, corresponding to the deposition of microbial mats in the cores in the present day and between ~1850 and 1950AD. Small increases are also observed in the lower half of unit 6. In the profundal setting of the smaller side basin, increased oxygenation occurs most prominently within the lowermost section of unit 1 and at the base of unit 6. In contrast, in the littoral setting, oxygenation is increased within unit 2 and appears to decrease within unit 3. In terms of log(Fe)/log(Mn) and reducing conditions, small increases are apparent within the basal section of unit 5 and at the top of unit 6 within the profundal setting of the main basin, indicating that Lake Chiprana underwent more reducing conditions in the deeper sections of the lake between approximately 1600 and 1800AD. Furthermore, reducing conditions in the profundal setting of Chiprana are often associated with increases in heavy metals Cu and Ni. It is likely that this coeval increase represents the adsorption of heavy metals to organic molecules [55,56] in more anoxic environments and is not necessarily immediately indicative of increasing or decreasing levels of anthropogenic activity. Within the side basin, reducing conditions display small increases throughout unit 5, as well as at the base of unit 6. Reducing conditions within the littoral environments typically display a characteristic small to moderate increase in intensity towards the base of unit 3, which is first initiated at the base of unit 2.
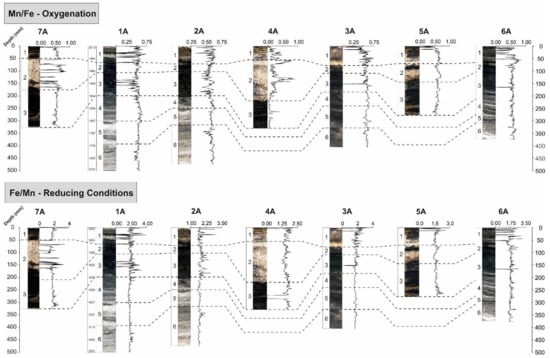
Figure 8.
Figure illustrating spatio-temporal variations in geochemical proxies typically used for determination of oxygenation [63] and anoxia and lowered oxygen levels [64]. Increasing values indicate increasing oxygenation and reducing conditions for each ratio.
Oxic conditions in Lake Chiprana can be related primarily to periods of microbial mat development (units 1 and 4) and also during the deposition of more massive units of white sandy siltstones (lower unit 6). Such oxic conditions and the presence of microbial mats are likely directly associated with decreasing lake levels, which lead to potential mixing of the lake water and subsequent increases in oxygenation at the base of the water column [21,57]. In contrast, reducing conditions are closely associated with influxes of charophytic material embedded in dark black mudstones in the pelagial and littoral settings (unit 3) and with the sandy silts and small organic-rich layers within unit 5 of the pelagial setting, as well as throughout unit 6. This may correspond to periods of stronger stratification of the water column [21,27,58], leading to stronger chemical gradients and harsh reducing conditions at the base of the column, as identified throughout the profundal sedimentary sequence. Increases in anoxic conditions at the base of the column may also have occurred as a result of periods of higher inflow from nutrients and fertilisers associated with agricultural practices and, subsequently, increased eutrophication [27,52].
When considering the PCA in the profundal setting of Lake Chiprana in terms of redox and productivity, decreases in the first eigenvector associated with the biplot for the profundal setting are interpreted to represent the increasing intensity of organic and biological processes [21,28] in confluence with evaporitic processes. Negative eigenvector values are associated with increased organic productivity and also evaporation (see Section 5.2.1), whilst positive values are instead associated with increases in the detrital signature throughout the sediments of Lake Chiprana [21,28,51]. This may reflect the transition of Lake Chiprana to a wetland-based environment where organic productivity increases when lake levels fall and more extensive organic processes occur throughout the deeper areas of the lake under a shallower depth [22]. However, in the case of the littoral setting, the grouping of variables indicative of increased biological productivity with those associated with increased detrital input means that the intensity of such productivity is difficult to reliably constrain within this setting. This phenomenon may instead relate to stronger evaporation within the littoral setting negating organic productivity and preservation due to harsh environmental conditions and erosion, whereby increases in the significance of both of these processes are achieved when lake levels rise in confluence with increasing detrital input [59].
5.1.2. Evaporation and Lake Drawdown
Elemental and environmental proxies, which indicate increased mineral precipitation and evaporation within Lake Chiprana, can be inferred from raw elemental data of S and Sr, from the normalisation of Sr to Ti as log(Sr)/log(Ti) [21] and from the normalisation of Ca via log(Ca)/log((∑(S+Ti+Fe+Al)) (Figure 9) [60,61]. These ratios, according to the aforementioned study on Lake Zonar in Southern Spain, provide indicators for drier conditions and, subsequently, increased mineral precipitation as a result of increasing evaporation. The increasing intensity of these proxies in units 1, 3 and at the base of unit 4 broadly coincides with the increased formation of carbonate and gypsum and reflects decreasing lake levels and increasing salinity in the modern day and in the period of approximately 1850–1950A. Correlation of elemental proxies corresponding between sediment cores additionally highlights the spatio-temporal variability in evaporitic processes throughout Lake Chiprana. The greatest degree of variability can be identified between sediments from the profundal and littoral sub-environments of the primary lake basin and between the pelagial sediments of the primary lake basin and the smaller side basin. In the pelagial setting of the primary lake basin, evaporative processes are heightened predominantly within units 1, 3 and 4 and within the upper sub-unit of unit 6. Contrastingly, within the pelagial setting of the side lagoon, such processes are generally only heightened in unit 4 and in the littoral settings, within unit 3.
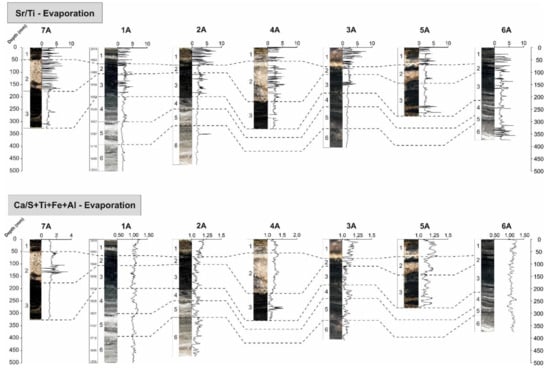
Figure 9.
Figure illustrating spatio-temporal variations in geochemical proxies typically used for determination of the intensity of evaporation [21]. Increasing values indicate increasing evaporation for both ratios.
The negative values of the first eigenvector in the profundal PCA correlate with evaporitic processes occurring within the profundal setting of the lake, as also identified in Lake Zonar [21], Lake Estanya [28] and Lake Arreo [51], indicated by the grouping of elements S, Cl and Sr on the biplot. In the littoral setting, the second eigenvector is also represented by evaporitic processes, as highlighted by the strong association of elements S, Cl, Sr and in the case of this setting, Ca, towards the negative end of PC2. In both cases, the negative values of eigenvector 1 are generally representative of periods of decreased lake level, detrital input and the increased precipitation of evaporitic mineralogical assemblages [21]. Such variation in the contribution of different elements to the PCA is further indicative of a shift in the importance and nature of different environmental processes between the profundal and littoral settings. For example, the inclusion of Ca within the evaporitic grouping in the littoral setting indicates that the Ca signal is more influenced here by evaporation and instead by detrital carbonates delivered from the geology of the catchment [62] in the lower units of the profundal setting.
5.2. Extrinsic Factors
5.2.1. Delivery of Detrital Material
There is a relatively significant influx of detrital material delivered to Lake Chiprana from surface runoff, small ephemeral streams and irrigation channels installed during periods of changing land management [27] throughout the cores. The ratio log(Ti)/log(Ca), which provides insights into processes of runoff and sediment delivery into the lake [65], was used as the primary indicator for the degree of detrital influx throughout the sedimentary sequences of Chiprana (Figure 10). This ratio also removes the mixed signal of Ca, which is influenced by multiple environmental processes [21,66]. For example, in many lacustrine environments, external Ca can be delivered to the lake from the catchment, particularly where marls or other carbonate-rich lithologies are present, as is the case for Lake Chiprana [61], or can increase as a result of in situ evaporative concentration of the lake waters, leading to carbonate and sulphate precipitation [67]. In the profundal sequence of the main basin, detrital input is typically highest in units 5 and 6, corresponding to approximately 1600–1850 AD, but also shows marked increases in the lower subunits of unit 3, around 1950 AD. Contrastingly, in the profundal setting of the smaller side basin, detrital input moderately increases in unit 3 and 4, significantly increases in unit 5, but is relatively low within unit 6. Within the littoral setting, detrital input is relatively low in unit 1 in all cores, but generally increases moderately in unit 2 and continues to increase throughout unit 3.
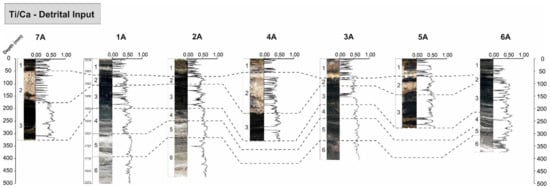
Figure 10.
Figure illustrating spatio-temporal variations in geochemical proxies typically used for determination the degree of detrital input [61]. Increasing values indicate increasing detrital input.
In the case of the principal component analyses, the detrital signal of Lake Chiprana can also be discussed when considering the first eigenvector of the PCA results in both the profundal and littoral settings. As shown in other Iberian lakes (Lake Zonar [21], Lake Sanabria [68]; Lake Arreo [69]; Lake Montcortès [70]; Lake Taravilla [71]), this eigenvector typically exemplifies the interplay between the input of detrital material to the lake and the degree at which evaporative processes and, thus, mineral precipitation occur. In the case of the profundal setting, positive values represent an increasing amount of detrital material being delivered to the lake and characterise the lower intervals of the sedimentary sequence (units 5 and 6) where detrital facies are more prevalent. In contrast, negative eigenvector 1 values are suggestive of decreased detrital input and are associated with intervals of microbial mat and gypsum development in units 1 and 4. In the littoral setting, positive values are also associated with increasing organic matter, as highlighted by the correlation of Br and Inc/Coh to detrital elements and the close association of these elements on the PCA biplot. This may relate to an input of mixed organic and detrital material to the littoral environments of the lake during runoff, a process which likely did not distribute the same organic material to the profundal zone. Alternatively, this may also reflect the establishment of increased biological processes in the shallower margins of the lake when water levels rise and, subsequently, when the intensity of evaporation is lower and erosion is reduced allowing for organic preservation [59].
5.2.2. Anthropogenic Water Management
A significant portion of Lake Chiprana’s late Holocene history has involved management from local regional authorities and from evolving farming practices (Figure 11) [27,33]. In the present day and for the last three decades in particular, the lake has been under the designation of a Ramsar convention, which aims to preserve unique mammalian and reptilian biological communities [33], vegetation and the unique microbial mat assemblages found here. Thus, presently, lake water levels are continuously monitored and regulated by inflow via an inlet channel connecting to the nearby freshwater to brackish Laguna de Las Roces [36,39], highlighting the strong anthropogenic factor in the lake’s present day environmental signatures. In the long-term past, the lake was primarily used as a reservoir for output from irrigation, associated with the use of water from the nearby Civan Canal [27]. Varying agricultural activities and the intensity of such activities throughout the last four centuries, as discussed throughout this study and other studies [27,30,36], have led to varying amounts of irrigation water delivered via inlet channels to Lake Chiprana, likely strongly associated with the degree of detrital material (highlighted by detrital elements and the ratio of log(Ti)/log(Ca)) being delivered to the lake. The lake has, thus, maintained a relatively long-standing history of anthropogenic impacts throughout the Late Holocene, a factor that has undoubtedly contributed to the sedimentological and geochemical processes that are discussed throughout this study.
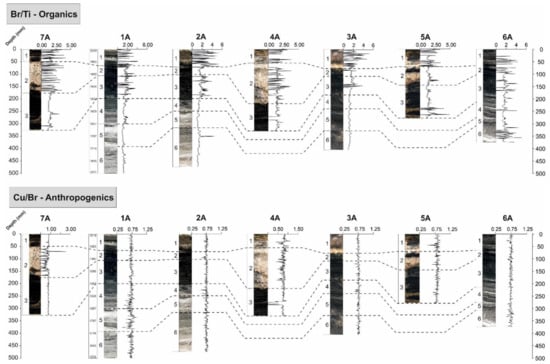
Figure 11.
Figure illustrating spatio-temporal variations in geochemical proxies typically used for determination of the degree of organics/bioproductivity [80] and anthropogenic input [81]. Cu/Br is used here due to the strong association of organics with Cu and Ni (see discussion). Increasing values indicate increasing organic content and anthropogenic input, respectively.
5.3. Spatial Variations
In both the profundal and littoral settings of Lake Chiprana, like the case of Lake Zonar in Southern Spain [21], increasing lake levels are associated with the most positive values of eigenvector 1, whereas more saline conditions and decreasing lake levels are associated with the most negative values of the same eigenvector. However, in the profundal setting, negative values of the first eigenvector are typically associated with increased biological productivity and, subsequently, evaporation and lower lake levels. As previously discussed, the intensity of processes associated with biological productivity is obscured within the first eigenvector, a characteristic that potentially relates to the strong stratification of Lake Chiprana and the heterogeneity of biological processes between the littoral and profundal settings [36]. The lack of strong anoxic conditions, like those of the profundal setting, may explain why these values are not grouped with indicators of organic productivity in the littoral setting, as Cu and Ni adsorption to these organic compounds would be reduced in a more oxic environment [72]. A plausible explanation is the development of a wetland when during lake drawdown, leading to increased organic productivity in the now shallower profundal basin. In confluence, such drawdown may lead to harsh environmental conditions in the littoral settings, where high salinity and erosion in small pools and brines may negate any complex productivity and reduce preservation.
5.4. Environmental and Human Impacts in the Semi-Arid Central Ebro Basin
Fluctuations in the significance of geochemical proxies within Lake Chiprana reflect the responses of the lake to the effects of various external and intrinsic impacts during the last few centuries in the semi-arid Central Ebro Basin. In Lake Chiprana, periods of increased lake levels primarily occur between ~1600 and ~1800 AD. In contrast, periods of low lake level occur primarily in the modern day to approximately 1960 AD and between ~1850 and 1950 AD. Broadly, such changes in lake level are indicated by variations in the dataset presented in this paper. Increases in elements, such as Ti, Fe and K, and minerals, including quartz and phyllosilicates, are often interpreted as being reflective of increased bottom water anoxia due to their association with increased lake levels and, subsequently, water stratification [61]. Increases in lake levels in Lake Chiprana are, however, contrastingly conducive to decreased organic productivity in the profundal settings of the lake and are, instead, more prominent when lake levels decreased, likely indicating the prominence of biological processes occurring under shallower conditions. The reverse effect is true for the littoral setting, whereby increases in lake levels likely promote organic productivity as a result of more suitable conditions occurring for biological processes to take place. In tandem, increases in variables, such as log(Sr)/log(Ti), S and minerals, such as gypsum, halite and hexahydrite [30], are instead indicative of decreases in lakewater levels and, thus, increasing salinity and evaporation [21].
A range of climatic, environmental and biological factors must be considered in the environmental reconstruction of Lake Chiprana (Figure 12). Despite this, the anthropogenic factor must also be measured as in any palaeoenvironmental investigation focusing upon the Late Holocene [73] and previous investigations of the site have revealed comparatively strong human impacts within the region of Chiprana and the Ebro Basin that are also reflected by the geochemical data presented here [27]. At the base of the sequence (~1600 AD), where increasing lake levels are apparent, studies have shown that areas of Northeast Spain experienced moderate increases in rainfall associated with the Late Maunder Minimum (1675–1715 AD), as recorded in historical archives [74] and lake sediment archives [75]. Flood events have, for example, been identified in the Northwestern Ebro Basin around the beginning of the 17th and 18th centuries in Lake Arreo [22], while periods of higher lake levels in Lake Estanya [23] were also identified during some later phases of the Little Ice Age. However, the onset of increased agricultural activities in the 15th century and later expansion of these activities in the 17th century in the region of Chiprana are coeval with increased lake levels occurring throughout the basal units of Lake Chiprana, indicating that increased irrigation returns may have represented a strong component of the hydrological input to the lake [27,30]. Therefore, lake levels in lake Chiprana likely correspond to an interplay between variations in climatic factors, such as rainfall and land-use changes in the region, but it is mostly apparent that the latter of these factors are more pronounced throughout the sequence.
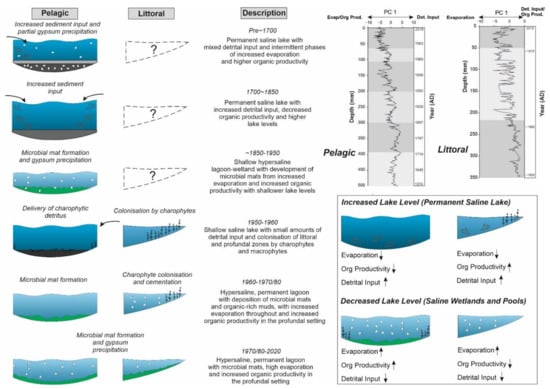
Figure 12.
Palaeoenvironmental models constructed from the sedimentary and geochemical sequence from Lake Chiprana. The sequence, representing approximately the past ~300–400 years of environmental change, has been subdivided into six primary phases. Each phase represents largely different environmental conditions leading to the highly variable sedimentary and geochemical characteristics associated with the sequence. In addition, principal components associated with the profundal and littoral settings are presented. These components highlight the degree of key environmental processes occurring within Lake Chiprana and additionally illustrate the variability and intensity of such processes in the spatial domain. The effects of increasing and decreasing on lake levels upon the different environments are also presented.
The onset of microbial mats within the lower section unit 4 and the subsequent lake level decreases associated with Lake Chiprana throughout 1850–1950 AD represent a transition to a time when lake levels were lower. This timeframe is associated with the end of the Little Ice Age, coinciding with a decrease in flood frequency in the northern Ebro basin and generally lower autumn precipitation in Northern Spain [22,75]. This timeframe also correlates with an agrarian crisis throughout Spain [27] and it is likely that relatively stable, non-anthropogenic influenced conditions occurred throughout the mid-19th century, allowing for lake levels to fall and microbial mats to develop. However, the effects of increased water delivery to Lake Chiprana from anthropogenic activities may have caused lake level rises occurring at the base of unit 3 around approximately 1950 [30], based on the changes in PC1, likely in response to increasing irrigation returns, again influenced by expanding agricultural activities [27,30]. Finally, in the modern day, hydrological management and the designation of the site under a Ramsar convention [33] have led to significant anthropogenic involvement in order to preserve the unique ecological reserves the lake is associated with.
Additionally, the presence of facies, such as microbial mats, occurring throughout the history of Lake Chiprana points to unique environmental conditions that may have promoted processes, such as mineral formation, dissolution and complex biological productivity, which can further skew the geochemical record [76,77]. Microbial mats in the modern-day setting of Chiprana are associated with heightened carbonate and sulphate precipitation as a result of metabolic activities, such as photosynthesis and sulphate precipitation, as a result of metabolic activities, such as photosynthesis and sulphate reduction, both of which induce increases in pH and the liberation of Ca2+ ions [78,79]. Caution must, therefore, be exercised and distinctions made between abiotic processes (e.g. evaporation, lake drawdown) and biotic processes (photosynthesis, sulphate reduction) leading to mineral precipitation in cases, such as Lake Chiprana, where both processes are prevalent [33].
Overall, the results of the study have not only shed light on the depositional changes in lake Chiprana during the last few centuries and their relationship with human disturbance and climate change but have also shown several key findings for the palaeolimnological community. Firstly, the geochemical sequence of Lake Chiprana has highlighted the reliability of saline-hypersaline lakes as potential palaeoenvironmental archives. In areas, such as the Ebro Basin, where saline lakes are characteristic features [82,83], the occurrence of a permanent lakes, such as Chiprana, and the subsequent preservation potential of sediments within the site illustrate its critical role as an archive of environmental information. Additionally, the study also revealed the large geochemical and sedimentological variability associated with saline lake depositional environments, both from a temporal and a spatial perspective. This ultimately emphasises the need for a multi-core strategy to better understand its past dynamics and past processes.
6. Conclusions
Intrinsic and extrinsic processes in Lake Chiprana are interpreted from a multi-parameter dataset and highlight a complex interaction between various environmental and anthropogenic factors, while also displaying good comparison with geochemical processes occurring in other lakes in the Iberian peninsula, such as Lake Zonar [21], Lake Estanya [23], Lake Montcortes [29] and further afield [15]. Firstly, organic productivity is complex and increases are typically associated with lake level decreases when oxic conditions prevail in the profundal setting of the lake. In contrast, lake level increases in the shallower settings likely allowed for the establishment of greater intensities of biological processes in this zone of the lake. Increases in organic matter are also strongly correlated with increases in heavy metal content (Ci and Nu) as a result of heavy metal adsorption to organic compounds. Contrastingly, increases in the intensity of S, Cl, Sr and the ratio of log(Sr)/log(Ti) indicate increased evaporation and the precipitation of mineralogical phases [21]. Increases in these proxies essentially reflect intermittent periods of lake drawdown and the development of microbial mats throughout the lakebed and are likely reflective of periods of stable saline conditions induced by decreasing anthropogenic input. Finally, increased flow of water to the lake is highlighted by increases in the intensity of clastic material as a result of increased runoff from agricultural land use and increased flooding during higher-intensity rainfall. Overall, the sequence and geochemistry of Lake Chiprana illustrates the strong variability in these unique ecosystems that should be considered in any study focusing upon saline lakes. Significant variations in sedimentology and geochemistry between the profundal and littoral settings also portray a widely heterogeneous ecological system that highlights both the temporal and spatial sensitivity of these settings.
Supplementary Materials
The following supplementary materials are available online at https://www.mdpi.com/article/10.3390/geosciences12100381/s1. Table S1: Table displaying sedimentological facies that were identified in both littoral and profundal cores from Laguna Salada de Chiprana; Table S2: Table displaying the output of the principal component analyses for the profundal and littoral settings; Figure S1: Scree plot from elements from core CHI19-1A (profundal setting); Figure S2: Scree plot from elements from core CHI19-4A (littoral setting).
Author Contributions
Conceptualization, C.D., S.S., J.P.C., B.V.-G.; methodology, C.D.; software, C.D.; validation, C.D., T.B., J.Y., J.P.C.; formal analysis, C.D., T.B., J.Y., H.S.; investigation, C.D.; resources, C.D.; data curation, C.D., T.B., J.Y., H.S.; writing—original draft preparation, C.D.; writing—review and editing, C.D., S.S., J.P.C., B.V.-G.; visualization, C.D.; supervision, S.S., J.P.C., B.V.-G.; project administration, S.S.; funding acquisition, S.S. All authors have read and agreed to the published version of the manuscript.
Funding
Financial support for this research was provided by the Natural Environment Research Council (NERC), grant no. NE/L002469/1 to C.D., from the Spanish Ministry of Science and Technology, project MEDLANT to B.V.-G.; and the from the European Union’s Horizon 2020 research and innovation programme under the Marie Sklodowska-Curie grant agreement Nº 796752 (FLOODARC) to J.P.C.
Institutional Review Board Statement
Not applicable.
Informed Consent Statement
Not applicable.
Data Availability Statement
The data that support the findings of this study are openly available in the Environmental Information Data Centre.
Acknowledgments
We are grateful for assistance and guidance that was provided by technical staff and research associates at the Instituto Pirenaico de Ecologia (IPE-CSIC) in Zaragoza. Additional thanks go to John Waters at the University of Manchester for his extensive support in the collection and processing of X-ray diffraction data and to Julia Behnsen at the Henry Moseley X-Ray Facility for assistance in the collection of computerised X-ray tomography data.
Conflicts of Interest
The authors declare no conflict of interest.
References
- Morellón, M.; Valero-Garcés, B.; Anselmetti, F.; Ariztegui, D.; Schnellmann, M.; Moreno, A.; Mata, P.; Rico, M.; Corella, J.P. Late Quaternary Deposition and Facies Model for Karstic Lake Estanya (North-Eastern Spain). Sedimentology 2009, 56, 1505–1534. [Google Scholar] [CrossRef]
- Valero-Garcés, B.; Morellón, M.; Moreno, A.; Corella, J.P.; Martín-Puertas, C.; Barreiro, F.; Pérez, A.; Giralt, S.; Mata-Campo, M.P. Lacustrine Carbonates of Iberian Karst Lakes: Sources, Processes and Depositional Environments. Sediment. Geol. 2014, 299, 1–29. [Google Scholar] [CrossRef]
- Martín-Puertas, C.; Valero-Garcés, B.L.; Mata, M.P.; González-Sampériz, P.; Bao, R.; Moreno, A.; Stefanova, V. Arid and Humid Phases in Southern Spain during the Last 4000 Years: The Zoñar Lake Record, Córdoba. Holocene 2008, 18, 907–921. [Google Scholar] [CrossRef]
- Sturm, M.; Matter, A. Turbidites and Varves in Lake Brienz (Switzerland): Deposition of Clastic Detritus by Density Currents. In Modern and Ancient Lake Sediments; Wiley: Hoboken, NJ, USA, 1978; ISBN 9781444303698. [Google Scholar]
- Corella, J.P.; Loizeau, J.L.; le Dantec, N.; Hilbe, M.; Gerard, J.; le Dantec, N.; Stark, N.; González-Quijano, M.; Girardclos, S. The Role of Mass-Transport Deposits and Turbidites in Shaping Modern Lacustrine Deepwater Channels. Mar. Pet. Geol. 2016, 77, 515–525. [Google Scholar] [CrossRef]
- Caran, S.C. Quaternary Paleoenvironmental and Paleoclimatic Reconstruction: A Discussion and Critique, with Examples from the Southern High Plains. Plains Anthropol. 1998, 43, 111–124. [Google Scholar] [CrossRef]
- Pellicer, X.M.; Corella, J.P.; Gutiérrez, F.; Roqué, C.; Linares, R.; Carbonel, D.; Zarroca, M.; Guerrero, J.; Comas, X. Sedimentological and Palaeohydrological Characterization of Late Pleistocene and Holocene Tufa Mound Palaeolakes Using Trenching Methods in the Spanish Pyrenees. Sedimentology 2016, 63, 1786–1819. [Google Scholar] [CrossRef]
- Sáez, A.; Valero-Garcés, B.L.; Moreno, A.; Bao, R.; Pueyo, J.J.; González-Sampériz, P.; Giralt, S.; Taberner, C.; Herrera, C.; Gibert, R.O. Lacustrine Sedimentation in Active Volcanic Settings: The Late Quaternary Depositional Evolution of Lake Chungará (Northern Chile). Sedimentology 2007, 54, 1191–1222. [Google Scholar] [CrossRef]
- Schröder, T.; van ’t Hoff, J.; Ortiz, J.E.; de Torres Pèrez-Hidalgo, T.J.; López-Sáez, J.A.; Melles, M.; Holzhausen, A.; Wennrich, V.; Viehberg, F.; Reicherter, K. Shallow Hypersaline Lakes as Paleoclimate Archives: A Case Study from the Laguna Salada, Málaga Province, Southern Spain. Quat. Int. 2018, 485, 76–88. [Google Scholar] [CrossRef]
- Jones, B.E.; Grant, W.D.; Duckworth, A.W.; Owenson, G.G. Microbial Diversity of Soda Lakes. Extremophiles 1998, 2, 191–200. [Google Scholar] [CrossRef]
- Jellison, R.; Williams, W.D.; Timms, B.; Alcocer, J.; Aladin, N.V. Salt Lakes: Values, Threats and Future. In Aquatic Ecosystems: Trends and Global Prospects; BioOne: Washington, DC, USA, 2008; ISBN 9780511751790. [Google Scholar]
- Hassani, A.; Azapagic, A.; D’Odorico, P.; Keshmiri, A.; Shokri, N. Desiccation Crisis of Saline Lakes: A New Decision-Support Framework for Building Resilience to Climate Change. Sci. Total Environ. 2020, 703, 134718. [Google Scholar] [CrossRef]
- Hardie, L.A.; Smoot, J.P.; Eugster, H.P. Saline Lakes and Their Deposits: A Sedimentological Approach. In Modern and Ancient Lake Sediments; Wiley Online Books: Hoboken, NJ, USA, 1978; pp. 7–41. ISBN 9781444303698. [Google Scholar]
- Last, F.M. Carbonate Microbialite Formation in a Prairie Saline Lake in Saskatchewan, Canada: Paleohydrologic and Paleoenvironmental Implications; University of Manitoba: Winnipeg, MB, Canada, 2013. [Google Scholar]
- Hammer, U.T. Saline Lake Ecosystems of the World, 1st ed.; Springer: Dordrecht, The Netherlands, 1986. [Google Scholar]
- Zhang, C.; Scholz, C.A.; Harris, A.D. Sedimentary Fills and Sensitivity Analysis of Deep Lacustrine Facies in Multi-Segment Rift Basins: Insights from 3D Forward Modeling. Sediment. Geol. 2020, 408, 105753. [Google Scholar] [CrossRef]
- Bonk, A.; Müller, D.; Ramisch, A.; Kramkowski, M.A.; Noryśkiewicz, A.M.; Sekudewicz, I.; Gąsiorowski, M.; Luberda-Durnaś, K.; Słowiński, M.; Schwab, M.; et al. Varve Microfacies and Chronology from a New Sediment Record of Lake Gościąż (Poland). Quat. Sci. Rev. 2021, 251, 106715. [Google Scholar] [CrossRef]
- Czymzik, M.; Brauer, A.; Dulski, P.; Plessen, B.; Naumann, R.; von Grafenstein, U.; Scheffler, R. Orbital and Solar Forcing of Shifts in Mid- to Late Holocene Flood Intensity from Varved Sediments of Pre-Alpine Lake Ammersee (Southern Germany). Quat. Sci. Rev. 2013, 61, 96–110. [Google Scholar] [CrossRef]
- Chawchai, S.; Kylander, M.E.; Chabangborn, A.; Löwemark, L.; Wohlfarth, B. Testing Commonly Used X-Ray Fluorescence Core Scanning-Based Proxies for Organic-Rich Lake Sediments and Peat. Boreas 2016, 45, 180–189. [Google Scholar] [CrossRef]
- Gebregiorgis, D.; Giosan, L.; Hathorne, E.C.; Anand, P.; Nilsson-Kerr, K.; Plass, A.; Lückge, A.; Clemens, S.C.; Frank, M. What Can We Learn From X-Ray Fluorescence Core Scanning Data? A Paleomonsoon Case Study. Geochemistry, Geophys. Geosystems 2019, 21, e2019GC008414. [Google Scholar] [CrossRef]
- Martín-Puertas, C.; Valero-Garcés, B.L.; Mata, M.P.; Moreno, A.; Giralt, S.; Martínez-Ruiz, F.; Jiménez-Espejo, F. Geochemical Processes in a Mediterranean Lake: A High-Resolution Study of the Last 4,000 Years in Zoñar Lake, Southern Spain. J. Paleolimnol. 2011, 46, 405–421. [Google Scholar] [CrossRef]
- Corella, J.P.; Benito, G.; Monteoliva, A.P.; Sigro, J.; Calle, M.; Valero-Garcés, B.L.; Stefanova, V.; Rico, E.; Favre, A.C.; Wilhelm, B. A 1400-Years Flood Frequency Reconstruction for the Basque Country (N Spain): Integrating Geological, Historical and Instrumental Datasets. Quat. Sci. Rev. 2021, 262, 106963. [Google Scholar] [CrossRef]
- Morellón, M.; Valero-Garcés, B.; Moreno, A.; González-Sampériz, P.; Mata, P.; Romero, O.; Maestro, M.; Navas, A. Holocene Palaeohydrology and Climate Variability in Northeastern Spain: The Sedimentary Record of Lake Estanya (Pre-Pyrenean Range). Quat. Int. 2008, 181, 15–31. [Google Scholar] [CrossRef]
- Finlayson, C.M. Salt Lakes. In The Wetland Book; Springer: Amsterdam, The Netherlands, 2018. [Google Scholar]
- Last, W.M. Geolimnology of Salt Lakes. Geosci. J. 2002, 6, 347–369. [Google Scholar] [CrossRef]
- De Wit, R. Lake La Salada de Chiprana (NE Spain), an Example of an Athalassic Salt Lake in a Cultural Landscape. In Lake Sciences and Climate Change; Rashed, M.N., Ed.; IntechOpen: Rijeka, Croatia, 2016; pp. 43–60. [Google Scholar]
- Valero-Garcés, B.L.; Navas, A.; Machin, J.; Stevenson, T.; Davis, B.; Valero-Garces, B.L.; Navas, A.; Machin, J.; Stevenson, T.; Davis, B.; et al. Responses of a Saline Lake Ecosystem in a Semiarid Region to Irrigation and Climate Variability. AMBIO A J. Hum. Environ. 2000, 29, 344–350. [Google Scholar] [CrossRef]
- Morellón, M.; Valero-Garcés, B.; Vegas-Vilarrúbia, T.; González-Sampériz, P.; Romero, Ó.; Delgado-Huertas, A.; Mata, P.; Moreno, A.; Rico, M.; Corella, J.P. Lateglacial and Holocene Palaeohydrology in the Western Mediterranean Region: The Lake Estanya Record (NE Spain). Quat. Sci. Rev. 2009, 28, 2582–2599. [Google Scholar] [CrossRef]
- González-Sampériz, P.; Aranbarri, J.; Pérez-Sanz, A.; Gil-Romera, G.; Moreno, A.; Leunda, M.; Sevilla-Callejo, M.; Corella, J.P.; Morellón, M.; Oliva, B.; et al. Environmental and Climate Change in the Southern Central Pyrenees since the Last Glacial Maximum: A View from the Lake Records. Catena 2017, 149, 668–688. [Google Scholar] [CrossRef]
- Doyle, C.; Schröder, S.; Aznar, J.P.C.; Valero Garces, B. Facies Variability and Depositional Settings of Laguna Salada de Chiprana, an Iberian Hypersaline Lake. Sedimentology 2022, 69, 2615–2641. [Google Scholar] [CrossRef]
- IGME Mapa Geologico de Espana, 1:50000; (Serie, MAGNA); Hoja 988, Puente-Genil; IGME: Madrid, Spain, 2003.
- Luzón, A. Oligocene-Miocene Alluvial Sedimentation in the Northern Ebro Basin, NE Spain: Tectonic Control and Palaeogeographical Evolution. Sediment. Geol. 2005, 177, 19–39. [Google Scholar] [CrossRef]
- De Wit, R.; Guerrero, M.C.; Legaz, A.; Jonkers, H.M.; Blocier, L.; Gumiaux, C.; Gautret, P. Conservation of a Permanent Hypersaline Lake: Management Options Evaluated from Decadal Variability of Coleofasciculus Chthonoplastes Microbial Mats. Aquat. Conserv. Mar. Freshw. Ecosyst. 2013, 23, 532–545. [Google Scholar] [CrossRef]
- Gorny, C.; Busby, C.; Pluhar, C.J.; Hagan, J.; Putirka, K. An In-Depth Look at Distal Sierra Nevada Palaeochannel Fill: Drill Cores through the Table Mountain Latite near Knights Ferry. Int. Geol. Rev. 2009, 51, 824–842. [Google Scholar] [CrossRef]
- Domínguez-Castro, F.; García-Herrera, R.; Ribera, P.; Barriendos, M. A Shift in the Spatial Pattern of Iberian Droughts during the 17th Century. Clim. Past 2010, 6, 553–563. [Google Scholar] [CrossRef]
- Jódar, J.; Rubio, F.M.; Custodio, E.; Martos-Rosillo, S.; Pey, J.; Herrera, C.; Turu, V.; Pérez-Bielsa, C.; Ibarra, P.; Lambán, L.J. Hydrogeochemical, Isotopic and Geophysical Characterization of Saline Lake Systems in Semiarid Regions: The Salada de Chiprana Lake, Northeastern Spain. Sci. Total Environ. 2020, 728, 138848. [Google Scholar] [CrossRef]
- Vidondo, B.; Martínez, B.; Montes, C.; Guerrero, M.C. Physico-Chemical Characteristics of a Permanent Spanish Hypersaline Lake: La Salada de Chiprana (NE Spain). Hydrobiologia 1993, 267, 113–125. [Google Scholar] [CrossRef]
- Guerrero, M.C.; Balsa, J.; Pascual, M.; Martínez, B. Caracterización Limnológica de La Laguna Salada de Chiprana (Zaragoza, España) y Sus Comunidades de Bacterias Fototróficas. Limnetica 1991, 7, 83–96. [Google Scholar] [CrossRef]
- Diaz, P.; Guerrero, M.C.; Alcorlo, P.; Baltanas, A.; Florin, M.; Montes, C. Anthropogenic Perturbations to the Trophic Structure in a Permanent Hypersaline Shallow Lake: La Salada de Chiprana (North-Eastern Spain). Int. J. Salt Lake Res. 1998, 7, 187–210. [Google Scholar] [CrossRef]
- Vereș, D. A Comparative Study Between Loss on Ignition and Total Carbon Analysis on Mineralogenic Sediments. Stud. Univ. Babes-Bolyai, Geol. 2002, 47, 171–182. [Google Scholar] [CrossRef]
- Croudace, I.W.; Rindby, A.; Rothwell, R.G. ITRAX: Description and Evaluation of a New Multi-Function X-Ray Core Scanner. Geol. Soc. Spec. Publ. 2006, 267, 51–63. [Google Scholar] [CrossRef]
- Gadd, P.; Heijnis, H.; Chagué-Goff, C.; Zawadzki, A.; Fierro, D.; Atahan, P.; Croudace, I.W.; Goralewski, J. ITRAX Core Scanner Capabilities Combined with Other Geochemical and Radiochemical Techniques to Evaluate Environmental Changes in a Local Catchment, South Sydney, NSW, Australia. In Developments in Paleoenvironmental Research; Springer: Dordrecht, The Netherlands, 2015; Volume 17. [Google Scholar]
- Edelmann, D.; Móri, T.F.; Székely, G.J. On Relationships between the Pearson and the Distance Correlation Coefficients. Stat. Probab. Lett. 2021, 169, 108960. [Google Scholar] [CrossRef]
- Weltje, G.J.; Tjallingii, R. Calibration of XRF Core Scanners for Quantitative Geochemical Logging of Sediment Cores: Theory and Application. Earth Planet. Sci. Lett. 2008, 274, 423–438. [Google Scholar] [CrossRef]
- Bishop, T. Using Itrax Data in R. Available online: https://tombishop1.github.io/itraxBook/ (accessed on 19 June 2022).
- Hammer, Ø.; Harper, D.A.T.; Ryan, P.D. PAST: Paleontological Statistics Software Package for Education and Data Analysis. Palaeontologia Electronica; University of Copenhagen: Copenhagen, Denmark, 2001. [Google Scholar]
- Blaauw, M. Methods and Code for “classical” Age-Modelling of Radiocarbon Sequences. Quat. Geochronol. 2010, 5, 512–518. [Google Scholar] [CrossRef]
- Reimer, P.J.; Austin, W.E.N.; Bard, E.; Bayliss, A.; Blackwell, P.G.; Bronk Ramsey, C.; Butzin, M.; Cheng, H.; Edwards, R.L.; Friedrich, M.; et al. The IntCal20 Northern Hemisphere Radiocarbon Age Calibration Curve (0-55 Cal KBP). Radiocarbon 2020, 62, 725–757. [Google Scholar] [CrossRef]
- Davis, B. Paleolimnology and Holocene Environmental Change from Endoreic Lakes in the Ebro Basin, North-East; University of Newcastle Upon Tyne: Newcastle upon Tyne, UK, 1994. [Google Scholar]
- Zhang, X.; Zhang, H.; Chang, F.; Ashraf, U.; Peng, W.; Wu, H.; Liu, Q.; Liu, F.; Zhang, Y.; Duan, L. Application of Corrected Methods for High-Resolution Xrf Core Scanning Elements in Lake Sediments. Appl. Sci. 2020, 10, 8012. [Google Scholar] [CrossRef]
- Corella, J.P.; Stefanova, V.; El Anjoumi, A.; Rico, E.; Giralt, S.; Moreno, A.; Plata-Montero, A.; Valero-Garcés, B.L. A 2500-Year Multi-Proxy Reconstruction of Climate Change and Human Activities in Northern Spain: The Lake Arreo Record. Palaeogeogr. Palaeoclimatol. Palaeoecol. 2013, 386, 555–568. [Google Scholar] [CrossRef]
- Corella, J.P.; Brauer, A.; Mangili, C.; Rull, V.; Vegas-Vilarrúbia, T.; Morellón, M.; Valero-Garcés, B.L. The 1.5-Ka Varved Record of Lake Montcortès (Southern Pyrenees, NE Spain). Quat. Res. 2012, 78, 323–332. [Google Scholar] [CrossRef]
- Vegas-Vilarrúbia, T.; Corella, J.P.; Pérez-Zanón, N.; Buchaca, T.; Trapote, M.C.; López, P.; Sigró, J.; Rull, V. Historical Shifts in Oxygenation Regime as Recorded in the Laminated Sediments of Lake Montcortès (Central Pyrenees) Support Hypoxia as a Continental-Scale Phenomenon. Sci. Total Environ. 2018, 612, 1577–1592. [Google Scholar] [CrossRef]
- Mackereth, F.J.H. Some Chemical Observations on Post-Glacial Lake Sediments. Philos. Trans. R. Soc. Lond. B Biol. Sci. 1966, 250, 165–213. [Google Scholar] [CrossRef]
- Lin, J.G.; Chen, S.Y. The Relationship between Adsorption of Heavy Metal and Organic Matter in River Sediments. Environ. Int. 1998, 24, 345–352. [Google Scholar] [CrossRef]
- Marchand, C.; Allenbach, M.; Lallier-Vergès, E. Relationships between Heavy Metals Distribution and Organic Matter Cycling in Mangrove Sediments (Conception Bay, New Caledonia). Geoderma 2011, 160, 444–456. [Google Scholar] [CrossRef]
- Żarczyński, M.; Wacnik, A.; Tylmann, W. Tracing Lake Mixing and Oxygenation Regime Using the Fe/Mn Ratio in Varved Sediments: 2000 year-Long Record of Human-Induced Changes from Lake Żabińskie (NE Poland). Sci. Total Environ. 2019, 657, 585–596. [Google Scholar] [CrossRef]
- Seguin, J.; Avramidis, P.; Haug, A.; Kessler, T.; Schimmelmann, A.; Unkel, I. Reconstruction of Palaeoenvironmental Variability Based on an Inter-Comparison of Four Lacustrine Archives on the Peloponnese (Greece) for the Last 5000 Years. E&G Quat. Sci. J. 2020, 69, 165–186. [Google Scholar] [CrossRef]
- Harris, N.B. Sepm The Deposition of Organic-Carbon-Rich Sediments: Models, Mechanisms, and Consequences. SEPM Spec. Publ. 2005. [Google Scholar]
- Mueller, A.D.; Islebe, G.A.; Hillesheim, M.B.; Grzesik, D.A.; Anselmetti, F.S.; Ariztegui, D.; Brenner, M.; Curtis, J.H.; Hodell, D.A.; Venz, K.A. Climate Drying and Associated Forest Decline in the Lowlands of Northern Guatemala during the Late Holocene. Quat. Res. 2009, 71, 133–141. [Google Scholar] [CrossRef]
- Kylander, M.E.; Ampel, L.; Wohlfarth, B.; Veres, D. High-Resolution X-Ray Fluorescence Core Scanning Analysis of Les Echets (France) Sedimentary Sequence: New Insights from Chemical Proxies. J. Quat. Sci. 2011, 26, 109–117. [Google Scholar] [CrossRef]
- IGME Mapa Geologico de Espana, 1:50000; (Serie, MAGNA); Hoja 137, Miranda de Ebro; IGME: Madrid, Spain, 2003.
- Naeher, S.; Gilli, A.; North, R.P.; Hamann, Y.; Schubert, C.J. Tracing Bottom Water Oxygenation with Sedimentary Mn/Fe Ratios in Lake Zurich, Switzerland. Chem. Geol. 2013, 352, 125–133. [Google Scholar] [CrossRef]
- Makri, S.; Wienhues, G.; Bigalke, M.; Gilli, A.; Rey, F.; Tinner, W.; Vogel, H.; Grosjean, M. Variations of Sedimentary Fe and Mn Fractions under Changing Lake Mixing Regimes, Oxygenation and Land Surface Processes during Late-Glacial and Holocene Times. Sci. Total Environ. 2021, 755, 143418. [Google Scholar] [CrossRef] [PubMed]
- Litt, T.; Krastel, S.; Sturm, M.; Kipfer, R.; Örcen, S.; Heumann, G.; Franz, S.O.; Ülgen, U.B.; Niessen, F. “PALEOVAN”, International Continental Scientific Drilling Program (ICDP): Site Survey Results and Perspectives. Quat. Sci. Rev. 2009, 28, 1555–1567. [Google Scholar] [CrossRef]
- Scholz, C.A.; Cohen, A.S.; Johnson, T.C.; King, J.; Talbot, M.R.; Brown, E.T. Scientific Drilling in the Great Rift Valley: The 2005 Lake Malawi Scientific Drilling Project—An Overview of the Past 145,000years of Climate Variability in Southern Hemisphere East Africa. Palaeogeogr. Palaeoclimatol. Palaeoecol. 2011, 303, 3–19. [Google Scholar] [CrossRef]
- Brown, E.T. Lake Malawi’s Response to “Megadrought” Terminations: Sedimentary Records of Flooding, Weathering and Erosion. Palaeogeogr. Palaeoclimatol. Palaeoecol. 2011, 303, 120–125. [Google Scholar] [CrossRef]
- Giralt, S.; Moreno, A.; Bao, R.; Sáez, A.; Prego, R.; Valero-Garcés, B.L.; Pueyo, J.J.; González-Sampériz, P.; Taberner, C. A Statistical Approach to Disentangle Environmental Forcings in a Lacustrine Record: The Lago Chungará Case (Chilean Altiplano). J. Paleolimnol. 2008, 40, 195–215. [Google Scholar] [CrossRef][Green Version]
- Corella, J.P.; Amrani, A.E.; Sigró, J.; Morellón, M.; Rico, E.; Valero-Garcés, B.L. Recent Evolution of Lake Arreo, Northern Spain: Influences of Land Use Change and Climate. J. Paleolimnol. 2011, 46, 469–485. [Google Scholar] [CrossRef]
- Corella, J.P.; Moreno, A.; Morellón, M.; Rull, V.; Giralt, S.; Rico, M.T.; Pérez-Sanz, A.; Valero-Garcés, B.L. Climate and Human Impact on a Meromictic Lake during the Last 6,000 Years (Montcortès Lake, Central Pyrenees, Spain). J. Paleolimnol. 2011, 46, 351–367. [Google Scholar] [CrossRef]
- Moreno, A.; Valero-Garcés, B.L.; González-Sampériz, P.; Rico, M. Flood Response to Rainfall Variability during the Last 2000 Years Inferred from the Taravilla Lake Record (Central Iberian Range, Spain). J. Paleolimnol. 2008, 40, 943–961. [Google Scholar] [CrossRef]
- Fedotov, A.P.; Phedorin, M.A.; Enushchenko, I.V.; Vershinin, K.E.; Melgunov, M.S.; Khodzher, T.V. A Reconstruction of the Thawing of the Permafrost during the Last 170years on the Taimyr Peninsula (East Siberia, Russia). Glob. Planet. Change 2012, 98-99, 139–152. [Google Scholar] [CrossRef]
- Guyard, H.; Chapron, E.; St-Onge, G.; Anselmetti, F.S.; Arnaud, F.; Magand, O.; Francus, P.; Mélières, M.A. High-Altitude Varve Records of Abrupt Environmental Changes and Mining Activity over the Last 4000 Years in the Western French Alps (Lake Bramant, Grandes Rousses Massif). Quat. Sci. Rev. 2007, 26, 2644–2660. [Google Scholar] [CrossRef]
- Yang, X.; Xiong, B.; Yang, M. Relationships among Heavy Metals and Organic Matter in Sediment Cores from Lake Nanhu, an Urban Lake in Wuhan, China. J. Freshw. Ecol. 2010, 25, 243–249. [Google Scholar] [CrossRef]
- Martínez-Cortizas, A.; Costa-Casais, M.; López-Sáez, J.A. Environmental Change in NW Iberia between 7000 and 500 Cal BC. Quat. Int. 2009, 200, 77–89. [Google Scholar] [CrossRef]
- Barriendos, M. Climatic Variations in the Iberian Peninsula during the Late Maunder Minimum (AD 1675-1715): An Analysis of Data from Rogation Ceremonies. Holocene 1997, 7, 105–111. [Google Scholar] [CrossRef]
- Vegas-Vilarrúbia, T.; Corella, J.P.; Sigró, J.; Rull, V.; Dorado-Liñan, I.; Valero-Garcés, B.; Gutiérrez-Merino, E. Regional Precipitation Trends since 1500 CE Reconstructed from Calcite Sublayers of a Varved Mediterranean Lake Record (Central Pyrenees). Sci. Total Environ. 2022, 826, 153773. [Google Scholar] [CrossRef]
- Visscher, P.T.; Stolz, J.F. Microbial Mats as Bioreactors: Populations, Processes, and Products. Palaeogeogr. Palaeoclimatol. Palaeoecol. 2005, 219, 87–100. [Google Scholar] [CrossRef]
- Dupraz, C.; Reid, R.P.; Braissant, O.; Decho, A.W.; Norman, R.S.; Visscher, P.T. Processes of Carbonate Precipitation in Modern Microbial Mats. Earth-Science Rev. 2009, 96, 141–162. [Google Scholar] [CrossRef]
- Jonkers, H.M.; Ludwig, R.; De Wit, R.; Pringault, O.; Muyzer, G.; Niemann, H.; Finke, N.; De Beer, D. Structural and Functional Analysis of a Microbial Mat Ecosystem from a Unique Permanent Hypersaline Inland Lake: “La Salada de Chiprana” (NE Spain). FEMS Microbiol. Ecol. 2003, 44, 175–189. [Google Scholar] [CrossRef]
- Camacho, A.; De Wit, R. Effect of Nitrogen and Phosphorus Additions on a Benthic Microbial Mat from a Hypersaline Lake. Aquat. Microb. Ecol. 2003, 32, 261–273. [Google Scholar] [CrossRef][Green Version]
- Vegas-Vilarrúbia, T.; González-Sampériz, P.; Morellón, M.; Gil-Romera, G.; Pérez-Sanz, A.; Valero-Garcés, B. Diatom and Vegetation Responses to Late Glacial and Early Holocene Climate Changes at Lake Estanya (Southern Pyrenees, NE Spain). Palaeogeogr. Palaeoclimatol. Palaeoecol. 2013, 392, 335–349. [Google Scholar] [CrossRef]
- Alonso, M. The Lagoons of Peninsular Spain. Limnetica 1998, 15, 1–176. [Google Scholar] [CrossRef]
Publisher’s Note: MDPI stays neutral with regard to jurisdictional claims in published maps and institutional affiliations. |
© 2022 by the authors. Licensee MDPI, Basel, Switzerland. This article is an open access article distributed under the terms and conditions of the Creative Commons Attribution (CC BY) license (https://creativecommons.org/licenses/by/4.0/).