Abstract
The detection of water leakage along its transportation network has important societal impacts, such as avoiding a large volume of water wasted along the waterways or preventing water-related chemical or physical surrounding media deterioration. Among the vast domain of destructive techniques, Ground-Penetrating Radar (GPR) is a common and efficient tool used for detection in many near-surface contexts, and it is particularly efficient in civil engineering cases, such as utility detection, due to its fine resolution and the ease of data acquisition. A peculiar form of signal enhancement appears in GPR profiles recorded over spheres and cylinders where velocity contrasts exist between the body’s material and the surrounding medium. We used this enhancement to detect potential water leakages in water pipes. After exhibiting the signal enhancement effect in a laboratory sandbox experiment using a spherical glass ball, we verified the results with numerical experiments with varied sphere and cylinder sizes and dielectric properties. We then investigated field and numerical experiments of GPR transects above a “real life” water-leaking PVC pipe. Our results show that the water cylinder and water infiltration bulb produced a characteristic signal that could be used for detecting water leakages along water pipes. The largest amplitude in the GPR signal is caused by a bottom pipe reflection enhanced by the water bulb and not by the top of the pipe. We stress the risk of miscalculating the pipe’s depth during velocity estimation when amplitude enhancement conditions are met. Beyond civil-engineering impacts, knowledge on signal amplification phenomena can help GPR data interpretations in sedimentology and hydrogeology studies.
1. Introduction
Within the increasing development of urban areas, the precise positioning of underground networks transporting water, gas, or electricity is challenging. This challenge’s importance increased since the awareness brought by various Intergovernmental Panel on Climate Change reports (e.g., Pachauri et al. [1]) on water scarcity and water as un-limitless resources, implying that action needs to be taken to avoid and prevent the loss of large, if any, volumes of water [2]. As a consequence of the loss of water through the network, soil stability and, in extreme cases, cavity formations also have a strong impact on citizen life in cases of sinkholes that can form at the level of long-term water leaks in loose materials or fast dissolution materials.
Beyond destructive trenches or coring, geophysical methods [3] have been developed since the 1950s to detect and characterize the near subsurface nondestructively. As water-related anomalies are easier to detect due to their geophysical signatures [4], many studies have tackled water-related characterisation and/or monitoring [5,6]. Bièvre et al. [5] compared Electrical Resistivity Tomography (ERT) data and P- and SH-wave tomography with destructive geotechnical data to characterize leakage in a canal dyke. Despite being unable to locate two leakages within the studied earth dyke because of water-table variations changing the apparent electrical resistivity, they were able to localize the most energetic water flow using an ambient vibration time series with a modified beam-forming algorithm. On a more constrained case, Cataldo et al. [6] compared ERT, Ground-Penetrating Radar (GPR), and Time-Domain Reflectometry (TDR) measurements in a laboratory-generated leak experiment and in a field one. They found that each of these methods could be seen as a complement/addition to the other and compared price and detection capacities for different cases.
Many studies have tackled detecting pipes using GPR. Olhoeft [7] performed pipe-depth estimations using hyperbola-fitting analyses to retrieve electromagnetic propagation velocity and tried to determine the radius of a pipe using different processing methods, which are now standard. Based on this prime study, Ristic et al. [8] performed a finer radius estimation by using a new version of the hyperbola-fitting algorithm. For calibration and QA/QC of different data-processing methods and hardware, several test sites have been built for testing GPR’s ability to detect buried pipes at different depths and surrounding media conditions [9,10] using information inferred from signal amplitudes such as full-waveform inversion (e.g., Klotzsche et al. [11]) to infer filling dielectric properties [12].
Several numerical analyses have been performed to validate GPR for detecting water pipe leakages. Nakhkash and Mahmood-Zadeh [13] modelled the leak as a vertically layered medium, with no water capillarity rising above the leak point. The authors used hyperbolic asymptotes into the saturated area to help distinguish water-saturated soil from other objects near the pipe. Crocco et al. [14] numerically imaged leaking pipes from single-fold, multi-receiver GPR data using a microwave tomographic method. Using a 2.5D Finite-Difference Time-Domain (FDTD) forward-modeling solver, they showed the difficulty in correctly retrieving pipe positioning when strong scattering due to water distorts the data. Another method used the back-projection algorithm on indoor and outdoor experiments to highlight a leakage zone from radar profiles acquired along a plastic pipe in dry sand or different soils [15]. The authors stressed the difficulty to observe the void phenomenon because of water leaking in inhomogeneous soils. They proposed the wavelet-based semblance analysis technique coupled with phase correlation between two time slices. Using pseudo-3D GPR acquisition in a sandbox experiment, the spatial signature of water leakage from PVC and metallic pipes was determined using surface cartography [16]. Lai et al. [16] highlighted the peculiar GPR signal from water leaking out of a pipe and sinkhole creation found in multiple injection laboratory experiments.
All of the above-mentioned studies demonstrate the suitability of using GPR for the detection of defective water pipes, but no studies account for the GPR signal amplitude enhancement by using oblong-shaped slow speed anomalies.
Physical and mathematical derivations of scattering produced by a dielectric circular cylinder has been studied since the XVIIth century, introducing the theory of caustics as the envelope of light rays reflected or refracted by a curved surface. This phenomenon explains the intensity and sharpness of colors and their boundaries in rainbows. Since then, many studies [17,18,19] have dealt with mathematical and physical derivations using classical optics and electromagnetism [20]. Adler et al. [17] mathematically derived the different interior caustics (high orders) inside a circular cylinder as a consequence of a diagonally incident plane wave. The authors showed different caustics depending on the optical index of the cylinder as well as the incident light angle. The same team [18] developed a similar study but for exterior caustics. Chen et al. [19] pushed further the physical formalism by studying the effect of particles with the size on the order of the incident light’s wavelength on the amplitude of caustics. They proposed a relationship between particle sizes and the backscattering enhancement of caustic amplitudes, reworked in [21].
We believe that these above-mentioned studies on caustics are contributing to what we have observed and link GPR amplitude enhancements by oblong-shaped slow-speed anomalies to these phenomena. Another phenomenon to consider is surface waves creeping along the curved surface that, depending on the surrounding medium velocity and the anomaly’s size, can interfere constructively with refractive focusing within anomaly waves that emanate near the anomaly’s base [22,23]. Although propagation dynamics of this phenomenon are well understood in terms of Mie scattering and optical ray paths, the associated backscatter attributes of amplitude, dispersion, and phase are not conceptually obvious from mathematics.
Examples of GPR signal enhancements in geosciences include reflections from localized water infiltration bulbs in sands [24,25], as well as within terrestrial glaciers until spheroidal boulders acted as perfect sphere anomalies [26], sub-lacustrine diamicton [27], and glaciers [28]. Airborne radar reflected events from parts of the Greenland ice sheet and resemble those of Jupiter’s icy Galilean satellites [29], both being intense with anomalous circular and linear polarization ratios [30]. These phenomena have been attributed to refraction within bodies containing concentric incremental increases in terms of the optical index [30,31], although Hagfors et al. [31] explained that there is usually an abrupt transition between solid ice and compacted snow that contradicts the existence of gradual transitions. Another study from Le Gall et al. [32] explains radar-bright channels on Titan as riverbeds with rounded pebbles acting as efficient natural retro-reflectors. In all the above situations, the GPR signal enhancement was caused by lower-speed cylindrical or spherical anomalies, such as a conduit, boulder, or water infiltration bulb in soils.
The present study proposes to perform the following: (i) illustrate the GPR amplitude signal enhancement in the case of a sphere in a laboratory-controlled experiment; (ii) run a sensitivity analysis, with 2D and 3D FDTD modelling, on the physical and dielectric properties required for observing the amplitude anomaly in cases of spheres and cylinders; and (iii) perform a field experiment where these peculiar phenomena can be used as assets for detecting leakage in a water-distribution pipe. Throughout the coupled numerical, laboratory, and field experiments, we aim to develop new methods of data interpretation to allow improved leak detection using GPR simple data processing.
2. Laboratory Experiment
2.1. Laboratory Setup
Our experiment took place in a laboratory sandbox that is 4 m long and 1.2 m wide, depicted in Figure 1). Quartz sand was oven-dried and packed at a bulk density corresponding to 40% porosity. To enhance the box–sand boundary, a thin metal sheet was placed at the base of the sand layer, at 1 m depth. A 0.12 m diameter soda lime glass sphere was buried in the sand at a depth of 0.3 m (measured relative to the top of the sphere). Quartz sand and soda lime glass’s relative dielectric permittivity values were reported to be, respectively, 2.55 and 6 at 2.45 GHz at room temperature [33]. A couple of 2.6 GHz GSSI GPR antennas were used for transmitting and receiving, and they are separated by 0.04 m distance. Both antennas were factory shielded. GPR profiles were acquired by an automatic system allowing centimeter displacements to be autonomous. GPR traces were acquired every 6.6 mm using the antennas placed at the surface of the sand.
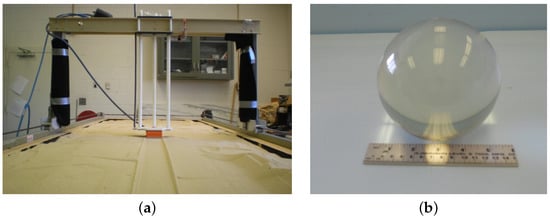
Figure 1.
(a) Laboratory apparatus comprised a sand box and the high-frequency GPR (orange box) maintained on the sand surface by an automated transverse support. The size of the box in the picture is 1.2 m horizontally and 4 m in the vertical direction; (b) soda lime glass sphere of 0.12 m diameter buried in the sand box presented in full view of the experiment in (a).
2.2. Results
One radargram resulting from one of the profile is displayed in Figure 2a, where time-zero was set to the first trough of the direct wave, as observed in Figure 2b, which corresponds to a trace at 2 m. Data were processed with moving window average removals (3 ns window size), but no range gain was applied. We normalized the amplitude of every radargram to the maximum absolute amplitude of the direct wave. As such, the color bar is at its maximum range between [−1; 1], and in most cases, it is clipped to [−0.2; 0.2].
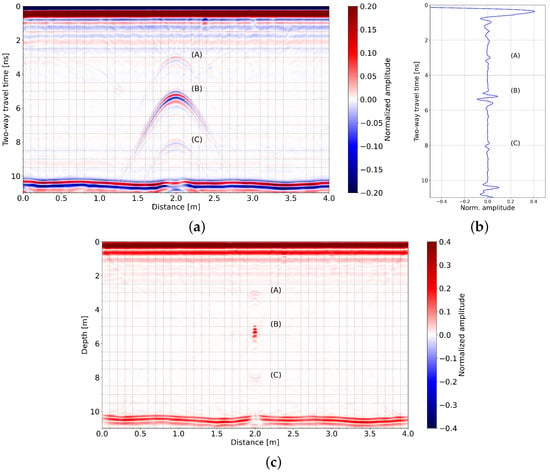
Figure 2.
(a) Radargram acquired above the 0.12 m diameter soda lime glass sphere buried 0.3 m deep in a dry sand box (See Figure 1); (b) central trace acquired corresponding to 2 m distance in the radargram; (a,c) migrated data using a velocity of m/ns.
In Figure 2a, three perfect hyperbolas, labelled (A), (B), and (C), indicate near-point scatterers. The linear reflection horizon arriving slightly later than 10 ns is from the metal sheet placed at the bottom of the sand box. As this reflection is not perfectly flat and several weak events are present, the sand is not perfectly homogeneous. The hyperbola (A) (Figure 2a) is assumed to be from the top of the sphere, (B) from its bottom, and (C) from the wave, which has propagated through the sphere and has been reflected by the top surface of the sand and a second time by the top of the sphere (usually called “multiple” reflection), comforted by the fact that the apex arrival time of hyperbola (C), around 8 ns, is equal to the apex arrival time of (B), around 5 ns, in addition to the one from hyperbola (A), around 3 ns.
Hyperbola (A) correctly migrated through Stolt migration [34] with a velocity estimated at m/ns. Hyperbola (B) correctly migrated using an estimated velocity of m/ns, as presented in Figure 2c, corresponding to the migrated radargram. In this figure, hyperbola (C) transformed into a “smile” (convex hyperbola), indicating that m/ns is overestimated for this hyperbola. It correctly migrated for a velocity m/ns. Using the sphere depth and diameter, velocities provide a dielectric permittivity of for the soda lime glass, in agreement with the literature [33]. It confirms that (B) reflection is associated with the bottom of the sphere using ray-tracing mathematics.
However on every subfigure contained in Figure 2, the amplitude of hyperbola (B) is higher than the one of hyperbola (A) even if the reflected wave (B) has propagated a longer distance than (A). As such, using standard and light GPR processing, it is very easy to obtain hyperbola (A) from the top of the sphere mixed with hyperbola (B), and the depth of the object can be easily misplaced. Here, working with hyperbola (B), the one with the highest amplitude, the object’s depth is incorrectly determined and is placed at 0.4 m depth instead of 0.3 m after migration (Figure 2c). In order to explore cases where the amplification of (B) amplitude may appear, we propose numerical experiment scenarios.
3. Numerical Experiments
3.1. Cylinder in Dry Sand Conditions
Numerical modeling was carried out using GprMax [35], an open source software that simulates electromagnetic wave propagation using Yee’s algorithm [36] to solve Maxwell’s equations in 2D or 3D with the FDTD method. A 2 m by 1.15 m domain was created, composed of 1 mm cells that are finer than wavelength for all computer runs. Perfectly matched layers, composed of 10 cells, surrounded the domain to avoid domain boundary reflections. The 2000 × 1150 cell domain (Figure 3) comprised a homogeneous material with a velocity of 0.19 m/ns (), in which a cylinder of velocity 0.11 m/ns () and of radius 0.06 m was embedded 0.3 m deep (distance surface-top of the sphere). A 0.05 m Perfect Electric Conductor (PEC) layer was placed at the bottom of the model. Apart from this PEC layer, each medium on all our simulations had properties of non-electrically conductive and non-magnetic materials.
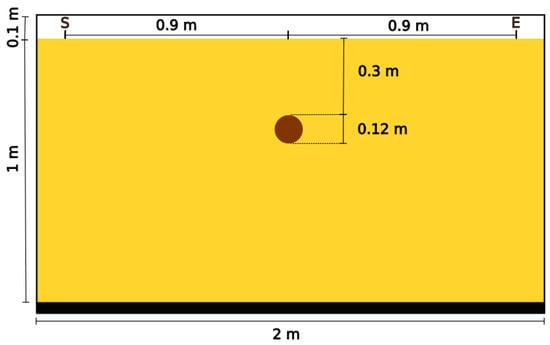
Figure 3.
Geometry of the first model used for gprMax simulations. A 0.1 m layer of air (white) overlies a homogeneous material (yellow colored) with 0.19 m/ns velocity, in which a 0.06 m radius cylinder (brown) characterized by a velocity of 0.11 m/ns is embedded at 0.3 m depth. A 0.05 m PEC layer (in black) is placed at the bottom of the model. Traces are simulated by considering antennas moving every 5 cm from point S to E.
A Hertzian dipole, emitting a Ricker wavelet centered at 2 GHz (central frequency of the experimental recorded signal) and polarized in the direction perpendicular to the 2D model plane, was placed 4 cm apart from the receiver. Traces were simulated every 0.05 m on the sand surface box from point S to point E (Figure 3).
The resulting radargram is displayed in Figure 4a with the trace acquired right above the middle of the cylinder in Figure 4b. Reflections are identified with the same letters than in Figure 2. As observed on the laboratory experiment, reflection (B)’s peak amplitude is clearly more than twice the peak amplitude of (A)’s reflection.
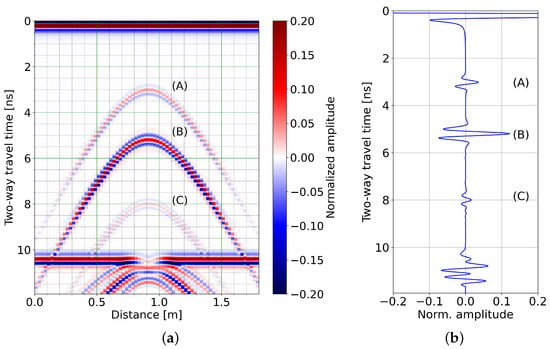
Figure 4.
(a) Simulated radargram with the geometry of Figure 3 and (b) central trace acquired at 0.9 m distance from the beginning of the profile.
3.2. Cylinder versus Sphere Simulation
We carried out a 3D FDTD simulation using the same geometry than the one in Figure 3 to explore the difference between a cylinder-shaped anomaly and a sphere-shaped anomaly on the amplitude enhancement observed on reflection (B). The model grid was 2.0 m width by 1.15 m height by 1.0 m thickness, with 1-mm cell size. The anomaly was a 0.06 m radius sphere embedded 0.3 m below the surface and positioned at 1.0 m by 0.5 m in the horizontal plane. Media velocities are similar to the 2D case with the embedded cylinder depicted in Figure 3. A 2 GHz Ricker point source with the same polarization for the 2D case was placed 0.04 m apart from the receiver. Only the trace right above the sphere was calculated.
Figure 5 compares the traces in the 2D (blue) and 3D (red) cases. For comparison purposes, we scaled up the amplitude of the 3D trace to obtain either the same direct wave amplitude in both traces in Figure 5a or the same reflection (A) amplitudes in Figure 5b. In Figure 5, we observe that the amplification effect (compare reflection (A) with (B)) is present for the sphere as well as for the cylinder. The phenomenon was twice as strong for the sphere than it was for the cylinder. Comparing 2D and 3D cases, the (B) reflection polarities are the inverse of each other, as is also visible in the laboratory data (Figure 2). The explanation of this feature is beyond the scope of this paper.
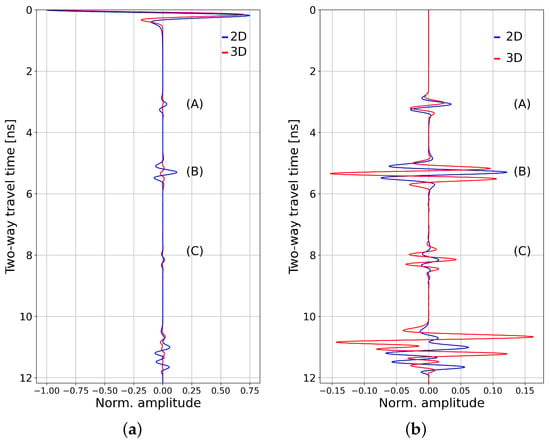
Figure 5.
Simulated traces for 2D and 3D geometry with (a) direct wave amplitude scaling; (b) reflection (A) amplitude scaling for 2D/3D comparisons and zeroing the direct wave amplitudes for visualisation purposes.
3.3. Amplification Sensitivity to the Anomaly Size and Velocity
We performed multiple 2D-FDTD simulations for different cylinder radius and velocity (dielectric permittivity) contrasts. The distance from the surface of acquisition to the top of the cylinder remained fixed at 0.3 m, and the velocity of the surrounding medium was fixed at 0.19 m/ns. The velocity ratio, varying from 1.1 up to 3, was computed as the velocity of the surrounding medium divided by the velocity of the cylinder medium. For each model, we calculated the middle trace corresponding to the position right above the cylinder, similarly to the one shown in Figure 4b, and the ratio of the absolute maximum amplitude of reflection (B) over the absolute maximum amplitude of reflection (A). The results are presented in Figure 6a.

Figure 6.
Amplitude ratio between reflections (A) and (B) for (a) different radius and velocity ratios between surrounding media and cylinder. (b) Amplitude ratio variation with radius for a velocity ratio set to 1.62 (red dots and red line in (a)) and amplitude ratio as a function of velocity ratio with the radius set to 0.06 m (blue dots and blue line in (a)).
Two curves are drawn in Figure 6b. Red dots represent varying cylinder radii from 0.01 m up to 0.18 m, with the velocity inside of the cylinder kept at 0.11 m/ns (velocity ratio of 1.62). Blue dots represent varying velocities (velocity ratio) inside the cylinder from 0.173 (1.1) down to 0.063 m/ns (3) with the radius kept at 0.06 m.
In Figure 6a, the amplification effect is not apparent for all radius and velocity contrasts. The highest amplitude ratio was observed for a radius between 0.04 m and 0.06 m and a velocity contrast between 1.6 and 1.8. It was fortunate that the laboratory experiment used radii and velocity contrast values close to the optimum ones to create GPR’s signal amplification.
For the 2 GHz antennas, the amplification of the reflection from the bottom of a cylinder with a velocity higher than 0.06 m/ns (corresponding to a ratio of 3 in our case), such as velocity in filled water, was not observed for all radii used in these calculations. A velocity ratio of about 2 was classically observed when dealing with a water infiltration bulb within water-unsaturated sand [25]. We suspect that the infiltration bulb that should appear when an underground water network is leaking will create such a signal enhancement. For this reason, we now consider a cylinder filled with water and that is embedded in dry soil, but with a defect resulting in water leaking into the surrounding medium. We then compute if we observe a signal enhancement on a surface GPR profile.
3.4. Leaking Pipe Model
We performed a 2D numerical model to simulate a radar profile acquired perpendicularly to a leaking pipe. In the geometry (Figure 7), the surrounding homogeneous medium velocity was set to 0.1 m/ns. A 2.5 cm-radius pipe with a velocity of 0.033 m/ns (as if filled with water) was placed in a trench with a velocity of 0.09 m/ns (soil around the pipe). The small pipe was surrounded by a 15 cm radius cylinder with a velocity of 0.05 m/ns (a soil with higher water content than the outside medium). In order to be more identical to usual GPR surveys, we used a 500 MHz Ricker signal as a source, which was placed perpendicularly to the plane of acquisition.
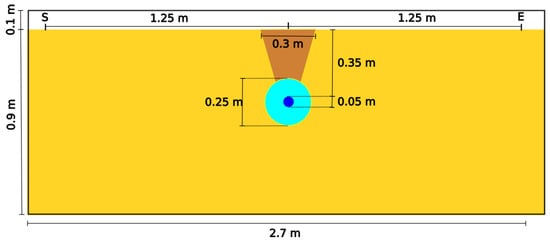
Figure 7.
Model geometry used for a numerical simulation in the case of a model leaking pipe. The inside 0.025 m-radius pipe, filled with water (velocity of 0.033 m/ns), is at the bottom of a trench (brown) (0.09 m/ns), surrounded by a 0.15 m radius water-saturated cylinder (0.05 m/ns). The surrounding medium is in yellow (0.1 m/ns).
The resulting radargram is shown in Figure 8. Even with the reflections coming from the trench presence, we clearly identify four hyperbolas, (A), (A’), (B’), and (B), in the order of arrival. Computing two-way arrival times from our model geometry and velocities, we recognise (A) as being related to the wave reflected by the top of the outside moist-soil cylinder; (A’) is related to the one from the top of the inside water-filled cylinder, (B’) is related to the bottom of the inside cylinder, and (B) from the bottom of the outside cylinder. The middle trace (Figure 8b) shows that reflection (B’) has stronger amplitudes than (A’) and, similarly, for reflection (B) compared to (A).
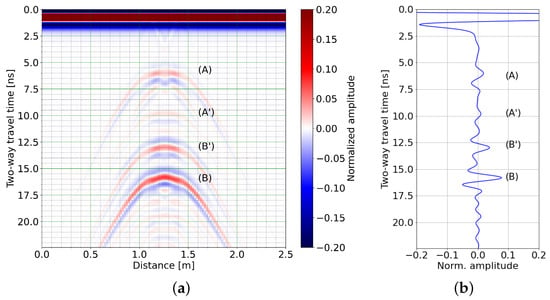
Figure 8.
(a) Radargram obtained using a 500 MHz Ricker source for the geometry of Figure 7; (A)–(B’) reflections are described in the text. (b) Trace simulated at 1.25 m from the beginning of the profile (see correspondence in (a)).
4. Field Test-Case Experiment
4.1. Setup
We used a PVC pipe (PolyVinyl Chloride), which has substantially the same dielectric characteristics than HDPE (High Density PolyEthylene) used for the water distribution network in urban areas. A 0.05 m diameter U-shaped pipe, as shown in Figure 9, was buried at 0.35 m depth in a Fontainebleau sand quarry. We made a trench that was as small as possible, with a triangular section as in Figure 7. A 0.03 m long by 0.005 m width opening was cut about two-third of the 1.5 m horizontal part of the pipe. During the experiment, the pipe was regularly filled through one of the pipe openings. Using a couple of 350 MHz GSSI antennas, two 2 m long profiles perpendicular to the pipe were acquired, with one right above the hole and one above the intact pipe, as shown in Figure 9. The radar profile above the leak repeated every 5 min from the beginning of filling the pipe with water.

Figure 9.
Geometry of the field experiment. The U-shaped pipe is 0.35 m deep and 1.5 m long. GPR profiles were recorded perpendicularly to the pipe’s main direction, right above the leak.
4.2. Results
Profiles, before and after migration, acquired on the reference line and right above the leak at 5, 10, 20, and 30 min from the start of the experiment are shown in Figure 10 along with their middle traces. Simple high-pass filtering was performed, but no gain function was applied to allow for amplitude comparisons. In this figure, we see a first diffraction hyperbola from the pipe and its surrounding water content and a second one arriving later and later, with an amplitude larger than that of the first hyperbola.
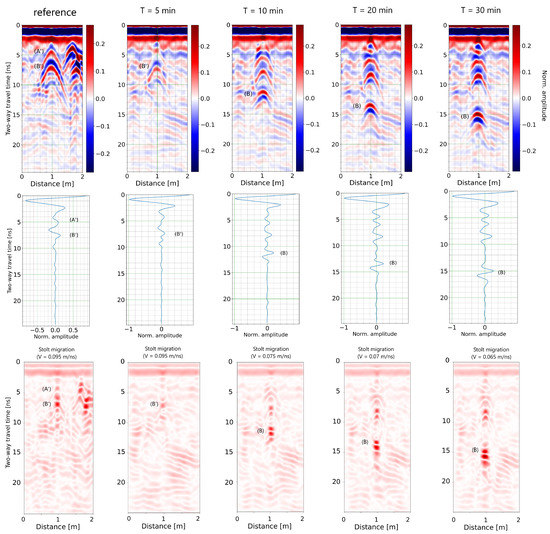
Figure 10.
(Top): Radargram (no gain applied) acquired at 5, 10, 20, and 30 min after the start of the experiment. (Middle): Trace acquired right above the pipe. (Bottom): Migrated radargram using the velocity indicated just above.
The radargram acquired on the part of the pipe with no leaks used as a reference shows a top hyperbola with an apex at 4.5 ns. On this profile, we observed other hyperbolas at 1.6 m from the begining. These come from metallic objects that we discovered when removing the experimental setup. The depth from the surface to the top of the pipe was 0.3 m, producing a velocity of 0.13 m/ns for the initial surrounding medium. The migration of the hyperbola (B’) with apex at 7.5 provided a velocity of 0.095 ± 0.005 m/ns (bottom left image of Figure 10). This produces a 0.35 ± 0.02 m depth. This hyperbola (B’) is also observed in the radargram acquired five minutes after water injection started. Five minutes later, three hyperbolas are visible on the radargram, and the latest one had an apex at 11.5 ns. Considering again the migration velocity (0.075 ± 0.005 m/ns), the two-way travel time corresponds to a depth of 0.43 ± 0.03 m. Twenty minutes after the start of water filling, the bottom hyperbola’s apex arrives at 13.5 ns, which produces 0.47 ± 0.035 m with a migration velocity of 0.07 ± 0.005 m/ns. Finally, 30 min after the beginning of the experiment, the bottom hyperbola is at 15.2 ns, i.e., 0.49 ± 0.038 m deep (using 0.065 ± 0.005 m/ns). These values with an amplitude of the considered hyperbola are summarized in Table 1. In addition to increasing time delays, the amplitude of these hyperbolas increase with the experimental time. Based on both observations, we interpret this signal as coming from the bottom of an infiltration bulb below the crack in the tube, namely reflection (B) in all simulation results above.

Table 1.
Characteristic values for hyperbolas (B’) and (B) observed in radargrams of Figure 10.
5. Discussion and Conclusions
This study pointed out a peculiar signal amplitude enhancement caused by a cylinder and spherical dielectric high anomalies in low dielectric media. The targets included size comparable to the in situ incident electromagnetic signal wavelengths. Basing our study on an empirical finding, we numerically and experimentally observed the amplitude enhancement in our GPR signals. More numerical experiments (not shown here) were conducted for cylinders of larger diameters, buried down to 1.2 m, and the results still show this phenomenon. Beyond the link between the theory of caustics [17,18] and what we observed, we stress that this phenomenon is underestimated in classical data processing applied to civil-engineering cases, especially in the case of liquid-filled underground pipes (water or other large permittivity liquids).
The role taken by the surrounding media is, evidently, one of the method’s limitations. At first, the contrast between pipe fluids and pipe-surrounding media (soil) should be taken into consideration (), as well as the pipe made of nonmetallic materials. The homogeneity of the surrounding soil is a strong criteria to meet, since diffraction from stones/boulders or a clay layer would dramatically affect the GPR’s amplitude and, thus, the phenomenon. A decent percentage of soil in urban environments may suffer from particularly heterogeneous soil grain sizes.
A second point of possible limitations concerns the angle of the incident electromagnetic wave. As pointed by Lock et al. [18], the amplitude, the order of the caustics, and the scattering angle depend on the incident arrival angle. As such, transposing to our pipe-leakage survey, we easily identified that the angle at which the pipe will be crossed will dramatically influence the amplitude’s enhancement effect. As such, we encourage crossing the pipe in multiple profile directions to explore possible situations where amplitude enhancement is the strongest.
By conducting this analysis, we propose that GPR data be obtained over shallow pipes along several angular perspectives while being aware that amplitude enhancements, if present, are most probably leakage-related and can increase the reaction time for spotting leaks. As these phenomena are linked to the dynamic evolution of water content relative to time, for monitoring the phenomenon, using long-term in situ static GPR measurements with geoscience applications is perfectly adequate, such as permafrost thawing [37].
Author Contributions
Conceptualization, A.S. and E.L.; methodology, A.S. and E.L.; software, P.C., A.S. and E.L.; validation, P.C., A.S. and E.L.; formal analysis, P.C., A.S., S.A.A. and E.L.; investigation, P.C., A.S., S.A.A. and E.L.; resources, A.S., S.A.A. and E.L.; data curation, P.C. and A.S.; writing—original draft preparation, E.L. and A.S.; writing—review and editing, A.S., E.L., S.A.A., P.C. and P.S.; visualization, P.C. and A.S.; supervision, A.S. and P.S.; project administration, A.S. and P.S.; funding acquisition, A.S. All authors have read and agreed to the published version of the manuscript.
Funding
Part of this research study was supported by the Association Nationale de la Recherche et de la Technologie.
Data Availability Statement
All data are available upon request from the corresponding author.
Conflicts of Interest
The authors declare no conflict of interest.
References
- Pachauri, R.K.; Allen, M.R.; Barros, V.R.; Broome, J.; Cramer, W.; Christ, R.; Church, J.A.; Clarke, L.; Dahe, Q.; Dasgupta, P.; et al. Climate Change 2014: Synthesis Report. Contribution of Working Groups I, II and III to the fifth Assessment Report of the Intergovernmental Panel on Climate Change; IPCC: Geneva, Switzerland, 2014. [Google Scholar]
- Li, W.; Ling, W.; Liu, S.; Zhao, J.; Liu, R.; Chen, Q.; Qiang, Z.; Qu, J. Development of systems for detection, early warning, and control of pipeline leakage in drinking water distribution: A case study. J. Environ. Sci. 2011, 23, 1816–1822. [Google Scholar] [CrossRef]
- Robertshaw, J.; Brown, P.D. Geophysical methods of exploration and their application to civil engineering problems. Proc. Inst. Civ. Eng. 1955, 4, 644–676. [Google Scholar] [CrossRef]
- Shön, J. Physical Properties of Rocks: Fundamentals and Principles of Petrophysics; Elsevier: Amsterdam, The Netherlands, 2015; Volume 65. [Google Scholar]
- Bièvre, G.; Lacroix, P.; Oxarango, L.; Goutaland, D.; Monnot, G.; Fargier, Y. Integration of geotechnical and geophysical techniques for the characterization of a small earth-filled canal dyke and the localization of water leakage. J. Appl. Geophys. 2017, 139, 1–15. [Google Scholar] [CrossRef]
- Cataldo, A.; Persico, R.; Leucci, G.; De Benedetto, E.; Cannazza, G.; Matera, L.; De Giorgi, L. Time domain reflectometry, ground penetrating radar and electrical resistivity tomography: A comparative analysis of alternative approaches for leak detection in underground pipes. NDT E Int. 2014, 62, 14–28. [Google Scholar] [CrossRef]
- Olhoeft, G.R. Maximizing the information return from ground penetrating radar. J. Appl. Geophys. 2000, 43, 175–187. [Google Scholar] [CrossRef]
- Ristic, A.V.; Petrovacki, D.; Govedarica, M. A new method to simultaneously estimate the radius of a cylindrical object and the wave propagation velocity from GPR data. Comput. Geosci. 2009, 35, 1620–1630. [Google Scholar] [CrossRef]
- Leparoux, D.; Gibert, D.; Cote, P. Adaptation of prestack migration to multi-offset Ground Penetrating Radar (GPR) data. Geophys. Prospect. 2001, 49, 374–386. [Google Scholar] [CrossRef]
- Sagnard, F.; Norgeot, C.; Derobert, X.; Baltazart, V.; Merliot, E.; Derkx, F.; Lebental, B. Utility detection and positioning on the urban site Sense-City using Ground-Penetrating Radar systems. Measurement 2016, 88, 318–330. [Google Scholar] [CrossRef]
- Klotzsche, A.; van der Kruk, J.; Linde, N.; Doetsch, J.; Vereecken, H. 3-D characterization of high-permeability zones in a gravel aquifer using 2-D crosshole GPR full-waveform inversion and waveguide detection. Geophys. J. Int. 2013, 195, 932–944. [Google Scholar] [CrossRef]
- Jazayeri, S.; Klotzsche, A.; Kruse, S. Improving estimates of buried pipe diameter and infilling material from ground-penetrating radar profiles with full-waveform inversion. Geophysics 2018, 83, H27–H41. [Google Scholar] [CrossRef]
- Nakhkash, M.; Mahmood-Zadeh, M.R. Water leak detection using ground penetrating radar. In Proceedings of the Tenth International Conference on Grounds Penetrating Radar, GPR 2004, Delft, The Netherlands, 21–24 June 2004; pp. 525–528. [Google Scholar]
- Crocco, L.; Prisco, G.; Soldovieri, F.; Cassidy, N. Early-stage leaking pipes GPR monitoring via microwave tomographic inversion. J. Appl. Geophys. 2009, 67, 270–277. [Google Scholar] [CrossRef]
- Demirci, S.; Yigit, E.; Eskidemir, I.H.; Ozdemir, C. Ground penetrating radar imaging of water leaks from buried pipes based on back-projection method. Ndt E Int. 2012, 47, 35–42. [Google Scholar] [CrossRef]
- Lai, W.W.; Chang, R.K.; Sham, J.F.; Pang, K. Perturbation mapping of water leak in buried water pipes via laboratory validation experiments with high-frequency ground penetrating radar (GPR). Tunn. Undergr. Space Technol. 2016, 52, 157–167. [Google Scholar] [CrossRef]
- Adler, C.L.; Lock, J.A.; Stone, B.R.; Garcia, C.J. High-order interior caustics produced in scattering of a diagonally incident plane wave by a circular cylinder. J. Opt. Soc. Am. A 1997, 14, 1305–1315. [Google Scholar] [CrossRef]
- Lock, J.A.; Adler, C.L.; Hovenac, E.A. Exterior caustics produced in scattering of a diagonally incident plane wave by a circular cylinder: Semiclassical scattering theory analysis. J. Opt. Soc. Am. A 2000, 17, 1846–1856. [Google Scholar] [CrossRef]
- Chen, Z.; Taflove, A.; Backman, V. Photonic nanojet enhancement of backscattering of light by nanoparticles: A potential novel visible-light ultramicroscopy technique. Opt. Express 2004, 12, 1214–1220. [Google Scholar] [CrossRef]
- Born, M.; Wolf, E. Principles of Optics: Electromagnetic Theory of Propagation, Interference and Diffraction of Light; Elsevier: Amsterdam, The Netherlands, 2013. [Google Scholar]
- Lecler, S. Light Scattering by Sub-Micrometric Particles. Ph.D. Thesis, Université Louis Pasteur, Strasbourg, France, 2005. [Google Scholar]
- Van de Hulst, H.C. Light Scattering by Small Particles John; Wiley & Sons Inc.: New York, NY, USA, 1957; Volume 470. [Google Scholar]
- Rheinstein, J. Backscatter from spheres: A short pulse view. IEEE Trans. Antennas Propag. 1968, 16, 89–97. [Google Scholar] [CrossRef]
- Saintenoy, A.; Schneider, S.; Tucholka, P. Evaluating Ground Penetrating Radar use for water infiltration monitoring. Vadose Zone J. 2008, 7, 208–214. [Google Scholar] [CrossRef]
- Léger, E.; Saintenoy, A.; Tucholka, P.; Coquet, Y. Hydrodynamic parameters of a sandy soil determined by ground-penetrating radar monitoring of Porchet infiltrations. IEEE J. Sel. Top. Appl. Earth Obs. Remote. Sens. 2015, 9, 188–200. [Google Scholar] [CrossRef]
- Arcone, S.A. The subbottom stratigraphy of Mirror Lake, Woodstock, NH: GPR profiles of Gyttja, glacial deposits and till. In Proceedings of the 15th International Conference on GPR, Brussels, Belgium, 30 June–4 July 2014. [Google Scholar]
- Arcone, S.A. Sedimentary architecture beneath lakes subjected to storms: Control by turbidity current bypass and turbidite armouring, interpreted from ground-penetrating radar images. Sedimentology 2018, 65, 1413–1446. [Google Scholar] [CrossRef]
- Arcone, S.A.; Yankielun, N.E. 1.4 GHz radar penetration and evidence of drainage structures in temperate ice: Black Rapids Glacier, Alaska, USA. J. Glaciol. 2000, 46, 477–490. [Google Scholar] [CrossRef]
- Rignot, E.J.; Ostro, S.J.; Van Zyl, J.J.; Jezek, K.C. Unusual radar echoes from the Greenland ice sheet. Science 1993, 261, 1710–1713. [Google Scholar] [CrossRef] [PubMed]
- Hagfors, T.; Gold, T.; Ierkic, H.M. Refraction scattering as origin of the anomalous radar returns of Jupiter’s satellites. Nature 1985, 315, 637–640. [Google Scholar] [CrossRef]
- Hagfors, T.; Dahlstrøm, I.; Gold, T.; Hamran, S.E.; Hansen, R. Refraction scattering in the anomalous reflections from icy surfaces. Icarus 1997, 130, 313–322. [Google Scholar] [CrossRef]
- Le Gall, A.; Janssen, M.; Paillou, P.; Lorenz, R.; Wall, S.; The Cassini Radar Team. Radar-bright channels on Titan. Icarus 2010, 207, 948–958. [Google Scholar] [CrossRef]
- Fenske, K.; Misra, D. Dielectric materials at microwave frequencies. Appl. Microw. Wirel. 2000, 12, 92–100. [Google Scholar]
- Stolt, R. Migration by Fourier transform. Geophysics 1978, 43, 23–48. [Google Scholar] [CrossRef]
- Warren, C.; Giannopoulos, A.; Giannakis, I. GprMax: Open source software to simulate electromagnetic wave propagation for Ground Penetrating Radar. Comput. Phys. Commun. 2016, 209, 163–170. [Google Scholar] [CrossRef]
- Yee, K. Numerical solution of initial boundary value problems involving Maxwell’s equations in isotropic media. IEEE Trans. Antennas Propag. 1966, 14, 302–307. [Google Scholar]
- Saintenoy, A.; Léger, E.; Grenier, C.; Thiéry, N. Perspectives in Ground-Penetrating Radar at High Latitudes: From Occasional Imaging to Automated Continuous Monitoring. Eur. Assoc. Geosci. Eng. 2021, 2021, 1–5. [Google Scholar] [CrossRef]
Publisher’s Note: MDPI stays neutral with regard to jurisdictional claims in published maps and institutional affiliations. |
© 2022 by the authors. Licensee MDPI, Basel, Switzerland. This article is an open access article distributed under the terms and conditions of the Creative Commons Attribution (CC BY) license (https://creativecommons.org/licenses/by/4.0/).