2. Materials and Methods
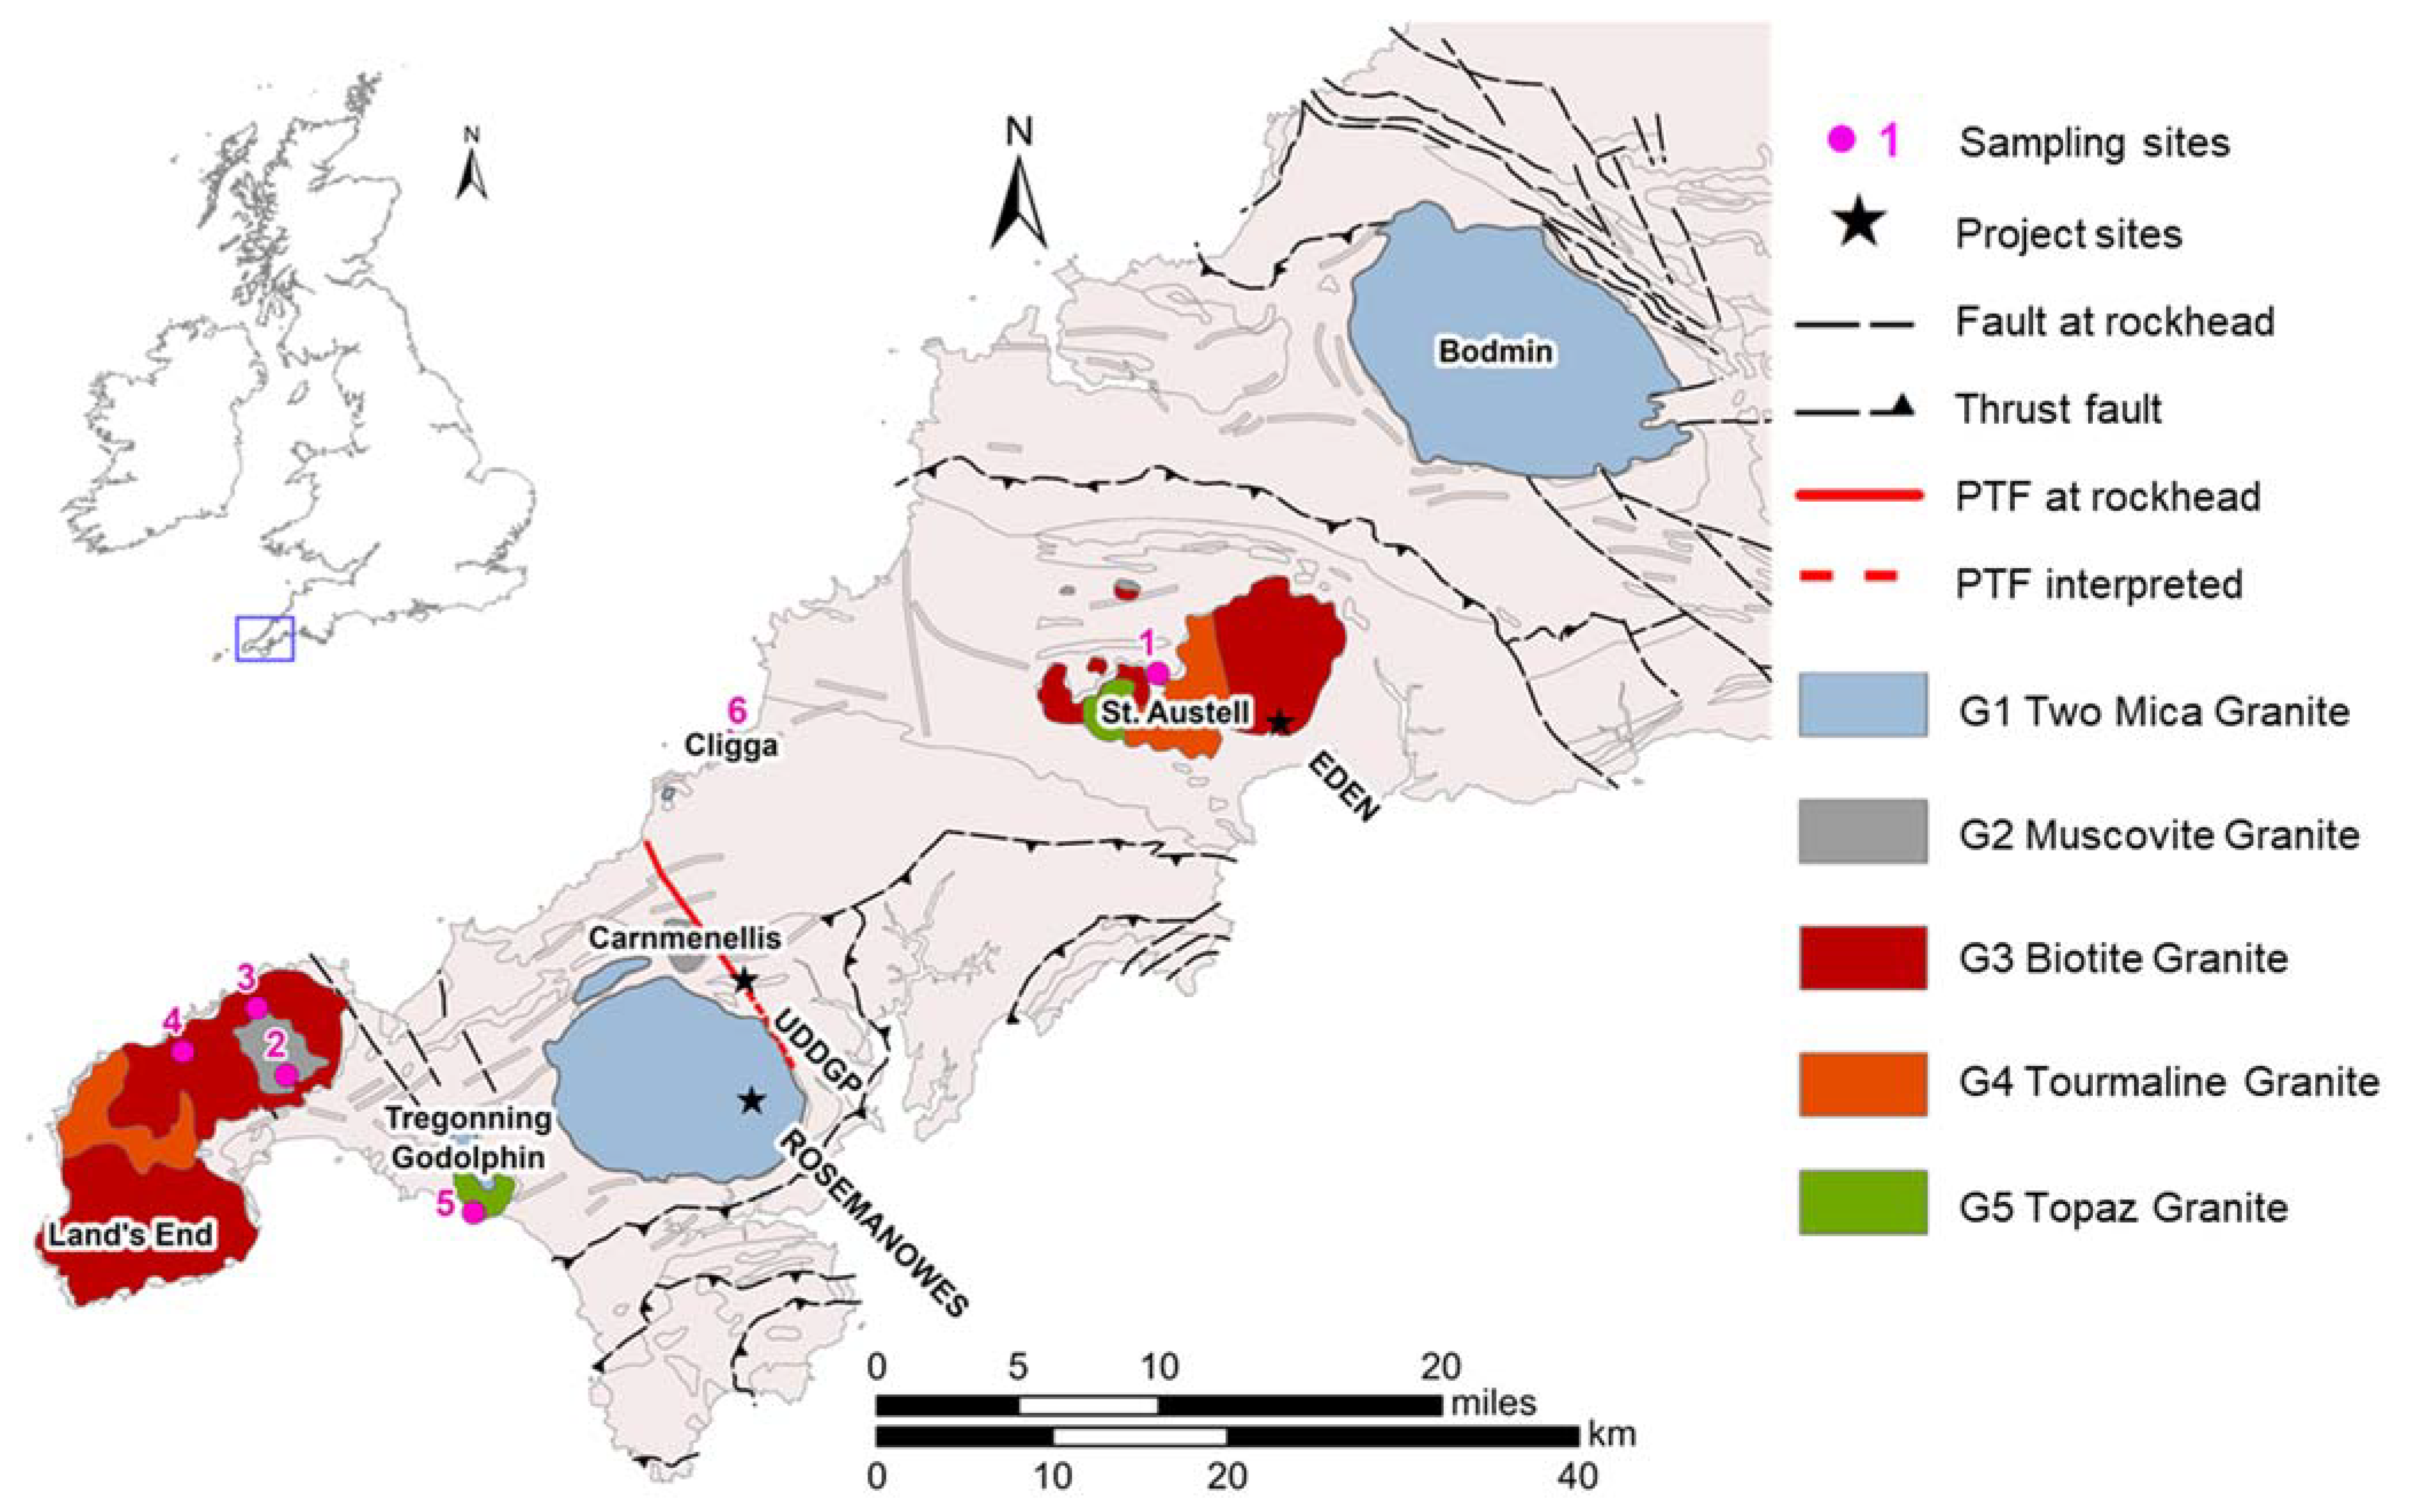
The analysed rock samples are outcrop analogue samples (OAS). They were collected during fieldwork in June 2019 from six different locations of the Cornubian Batholith (selected from a total of 47 samples from 35 different locations—sea cliffs, major and minor natural outcrops, rock dumps and active and abandoned quarries) [
23]. They have a relatively high geochemical conformity with the Carnmenellis Granite (based on data from Simons et al. [
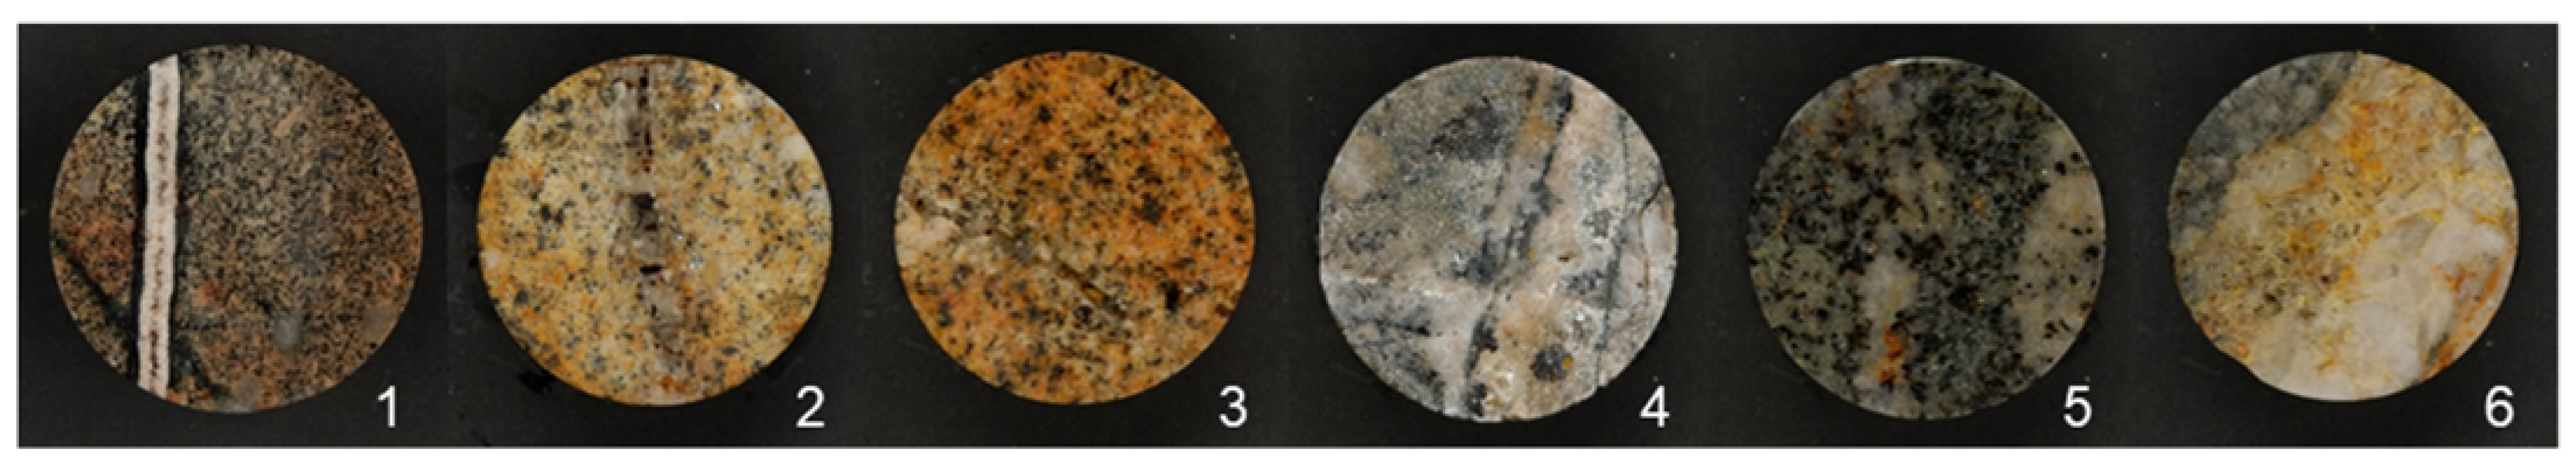
5]) and include mineralised veins, which allow analogies with hydrothermally altered zones around the faults and fractures of the PTF encountered in UD-1. As a result of a lack of sampling material from the granites of the Carnmenellis, Carn Marth or Carn Brea plutons, which contain veins, the representativity for the Carnmenellis granite is limited to far-field analogues (Land’s End, Tregonning Godolphin, Cligga and St. Austell plutons). Nevertheless, the present samples display an analogy to the fault and fracture zone itself. For analysis, the samples were cored into plugs 40 mm in diameter and ranging in length from 20 to 80 mm. Each core targets a vein, with the core axis drilled parallel to the vein (
Figure 2). Cutoffs were ground to powder finer than 63 µm for chemical and mineralogical analysis.
For comparison, drill cuttings from production well UD-1 from the open-hole section between 4 and 5 km MD are analysed. The cuttings, which were sampled by GEL/Geosciences Limited, represent 44 depth intervals of 10 m in length, between 4050 m TVD and 4930 m MD.
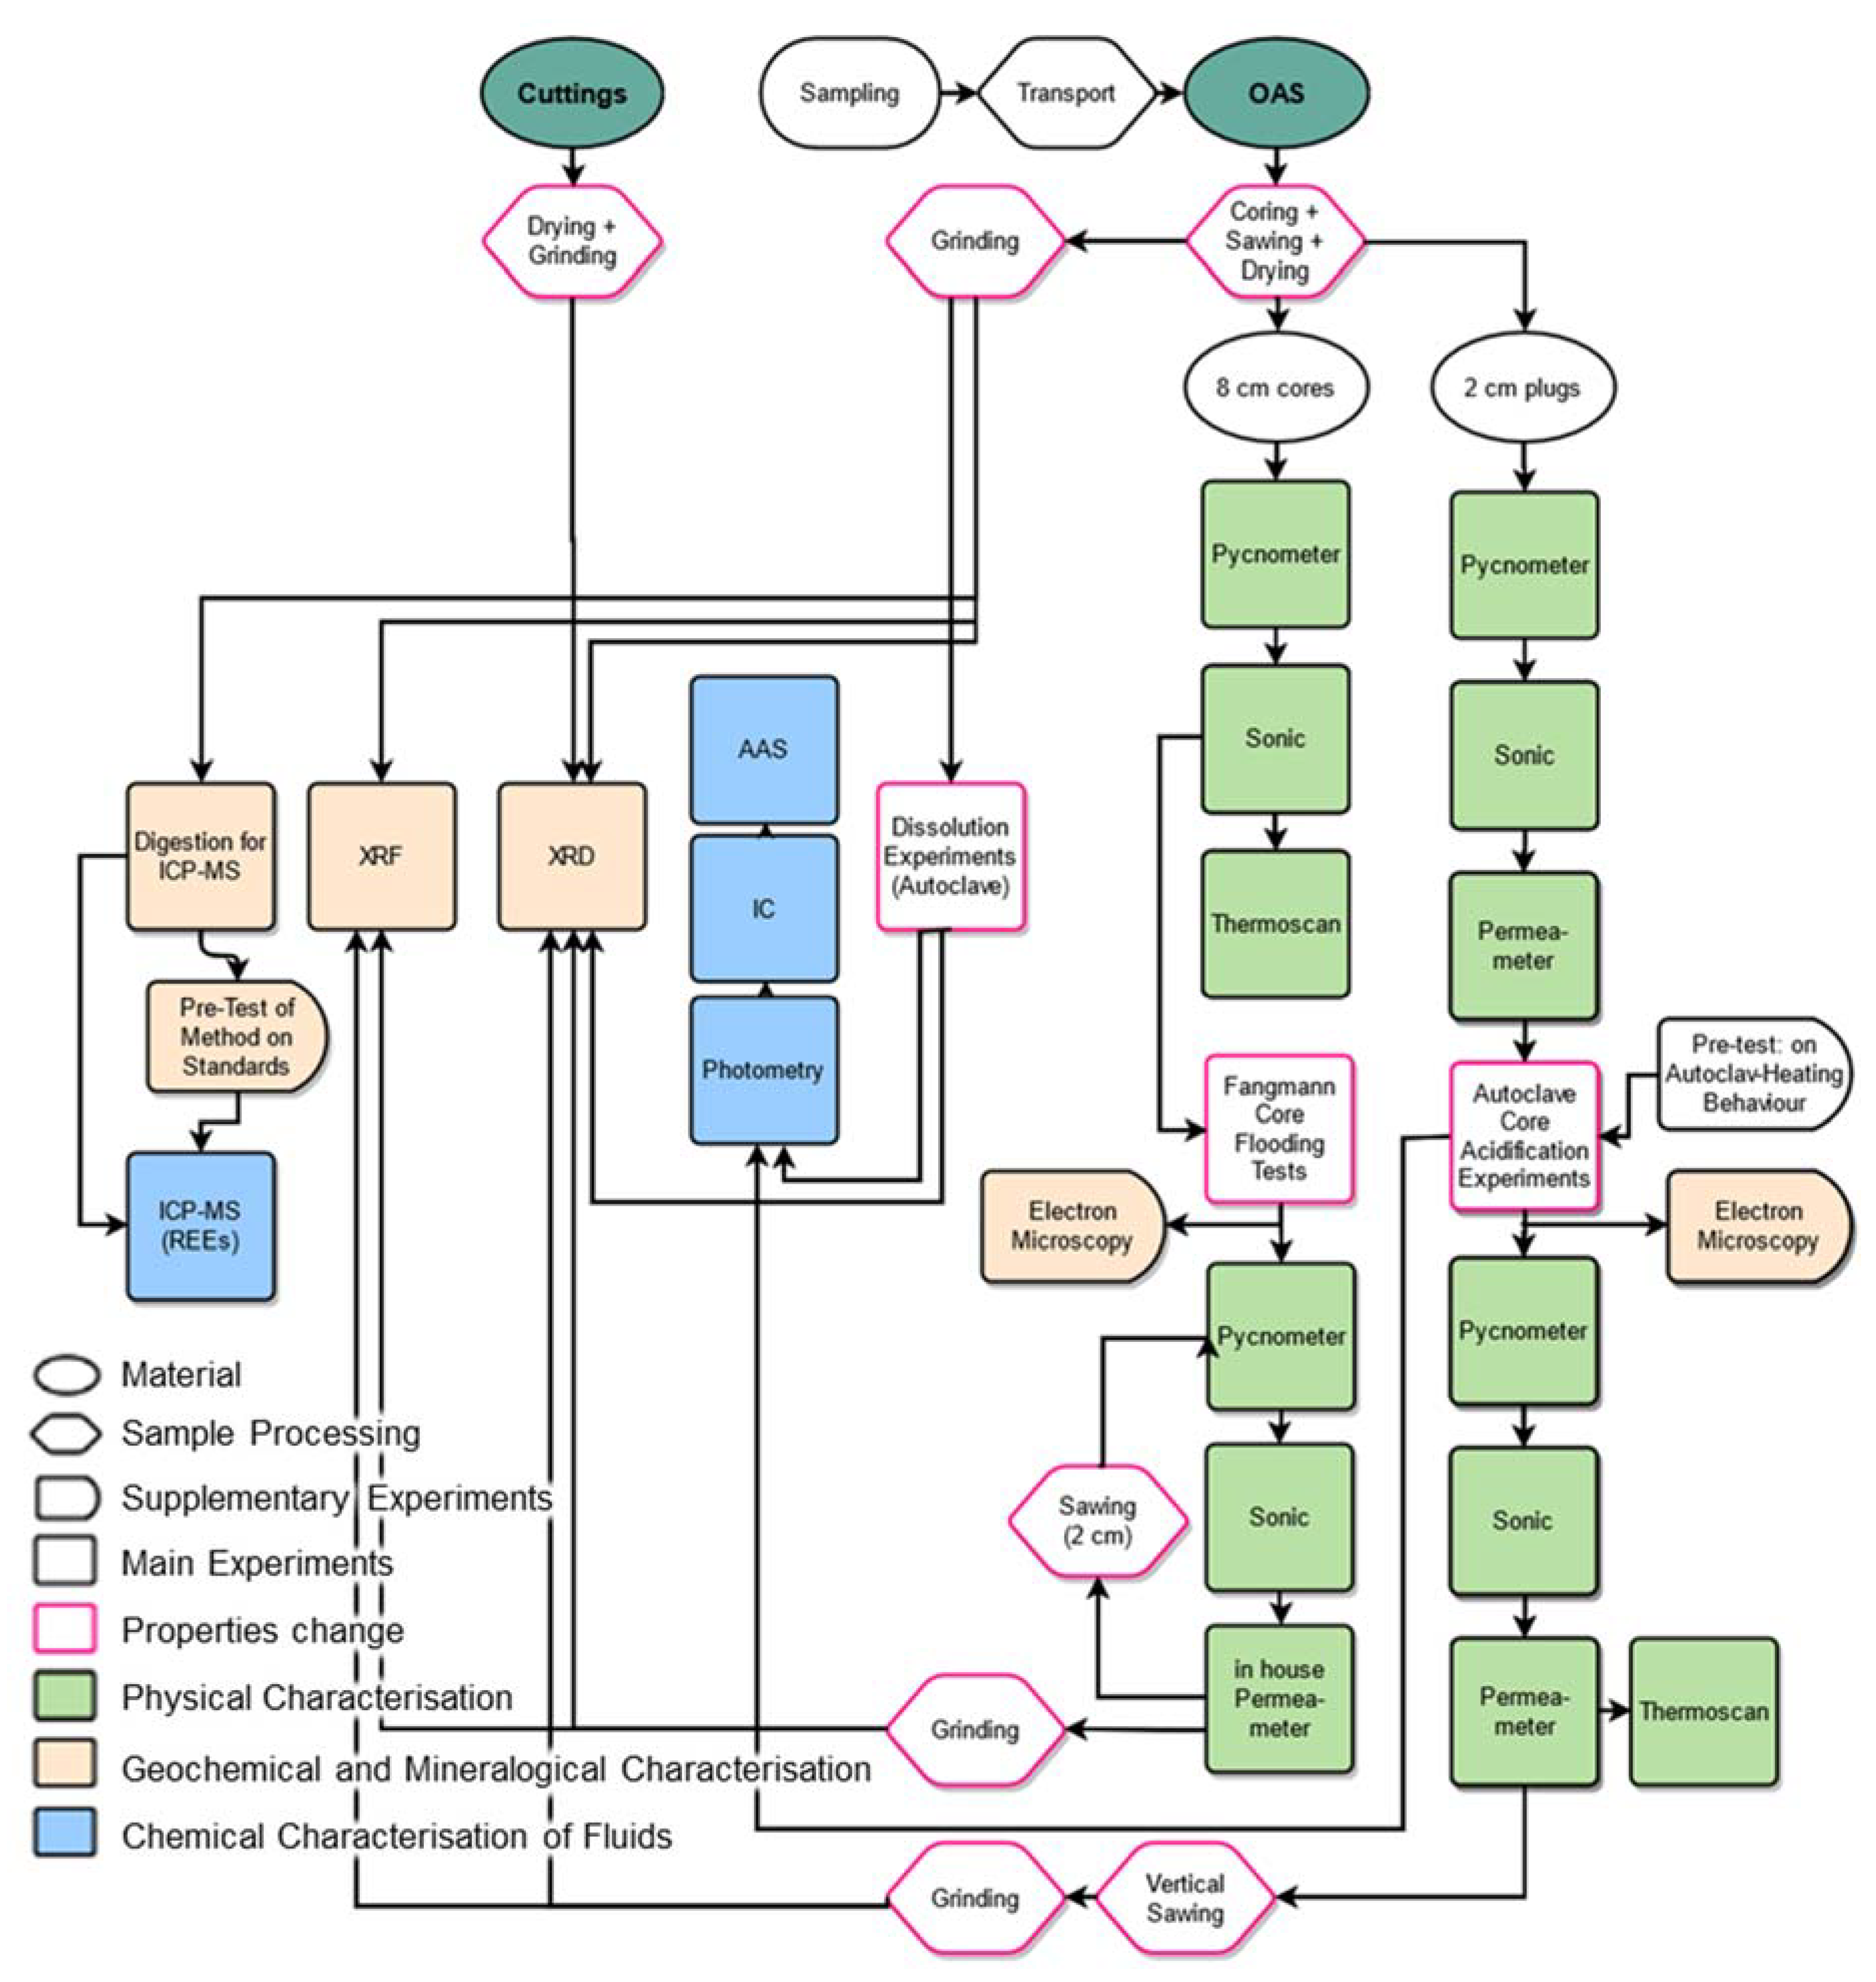
Besides an accompanying petrophysical analysis, the effect of chemical treatment on the permeability of the rock matrix and fracture systems due to acidification is investigated under approximation of reservoir conditions. This implies the acidification of samples using two methods (Core Flooding Tests, CFT; Autoclave Experiments, AE), a petrophysical before/after comparison and a geochemical analysis of the fluid–rock interaction.
A set of different analytical methods, such as XRF, XRD, AAS, IC, ICP-MS, thermoscanning, helium pycnometry, helium permeametry, water permeametry and sonic velocity, is used to characterise the samples petrologically and petrophysically before and after chemical treatment in AEs and CFTs at reservoir temperatures and pressures, as well as the spent acids from the AEs (
Table 2,
Figure 3).
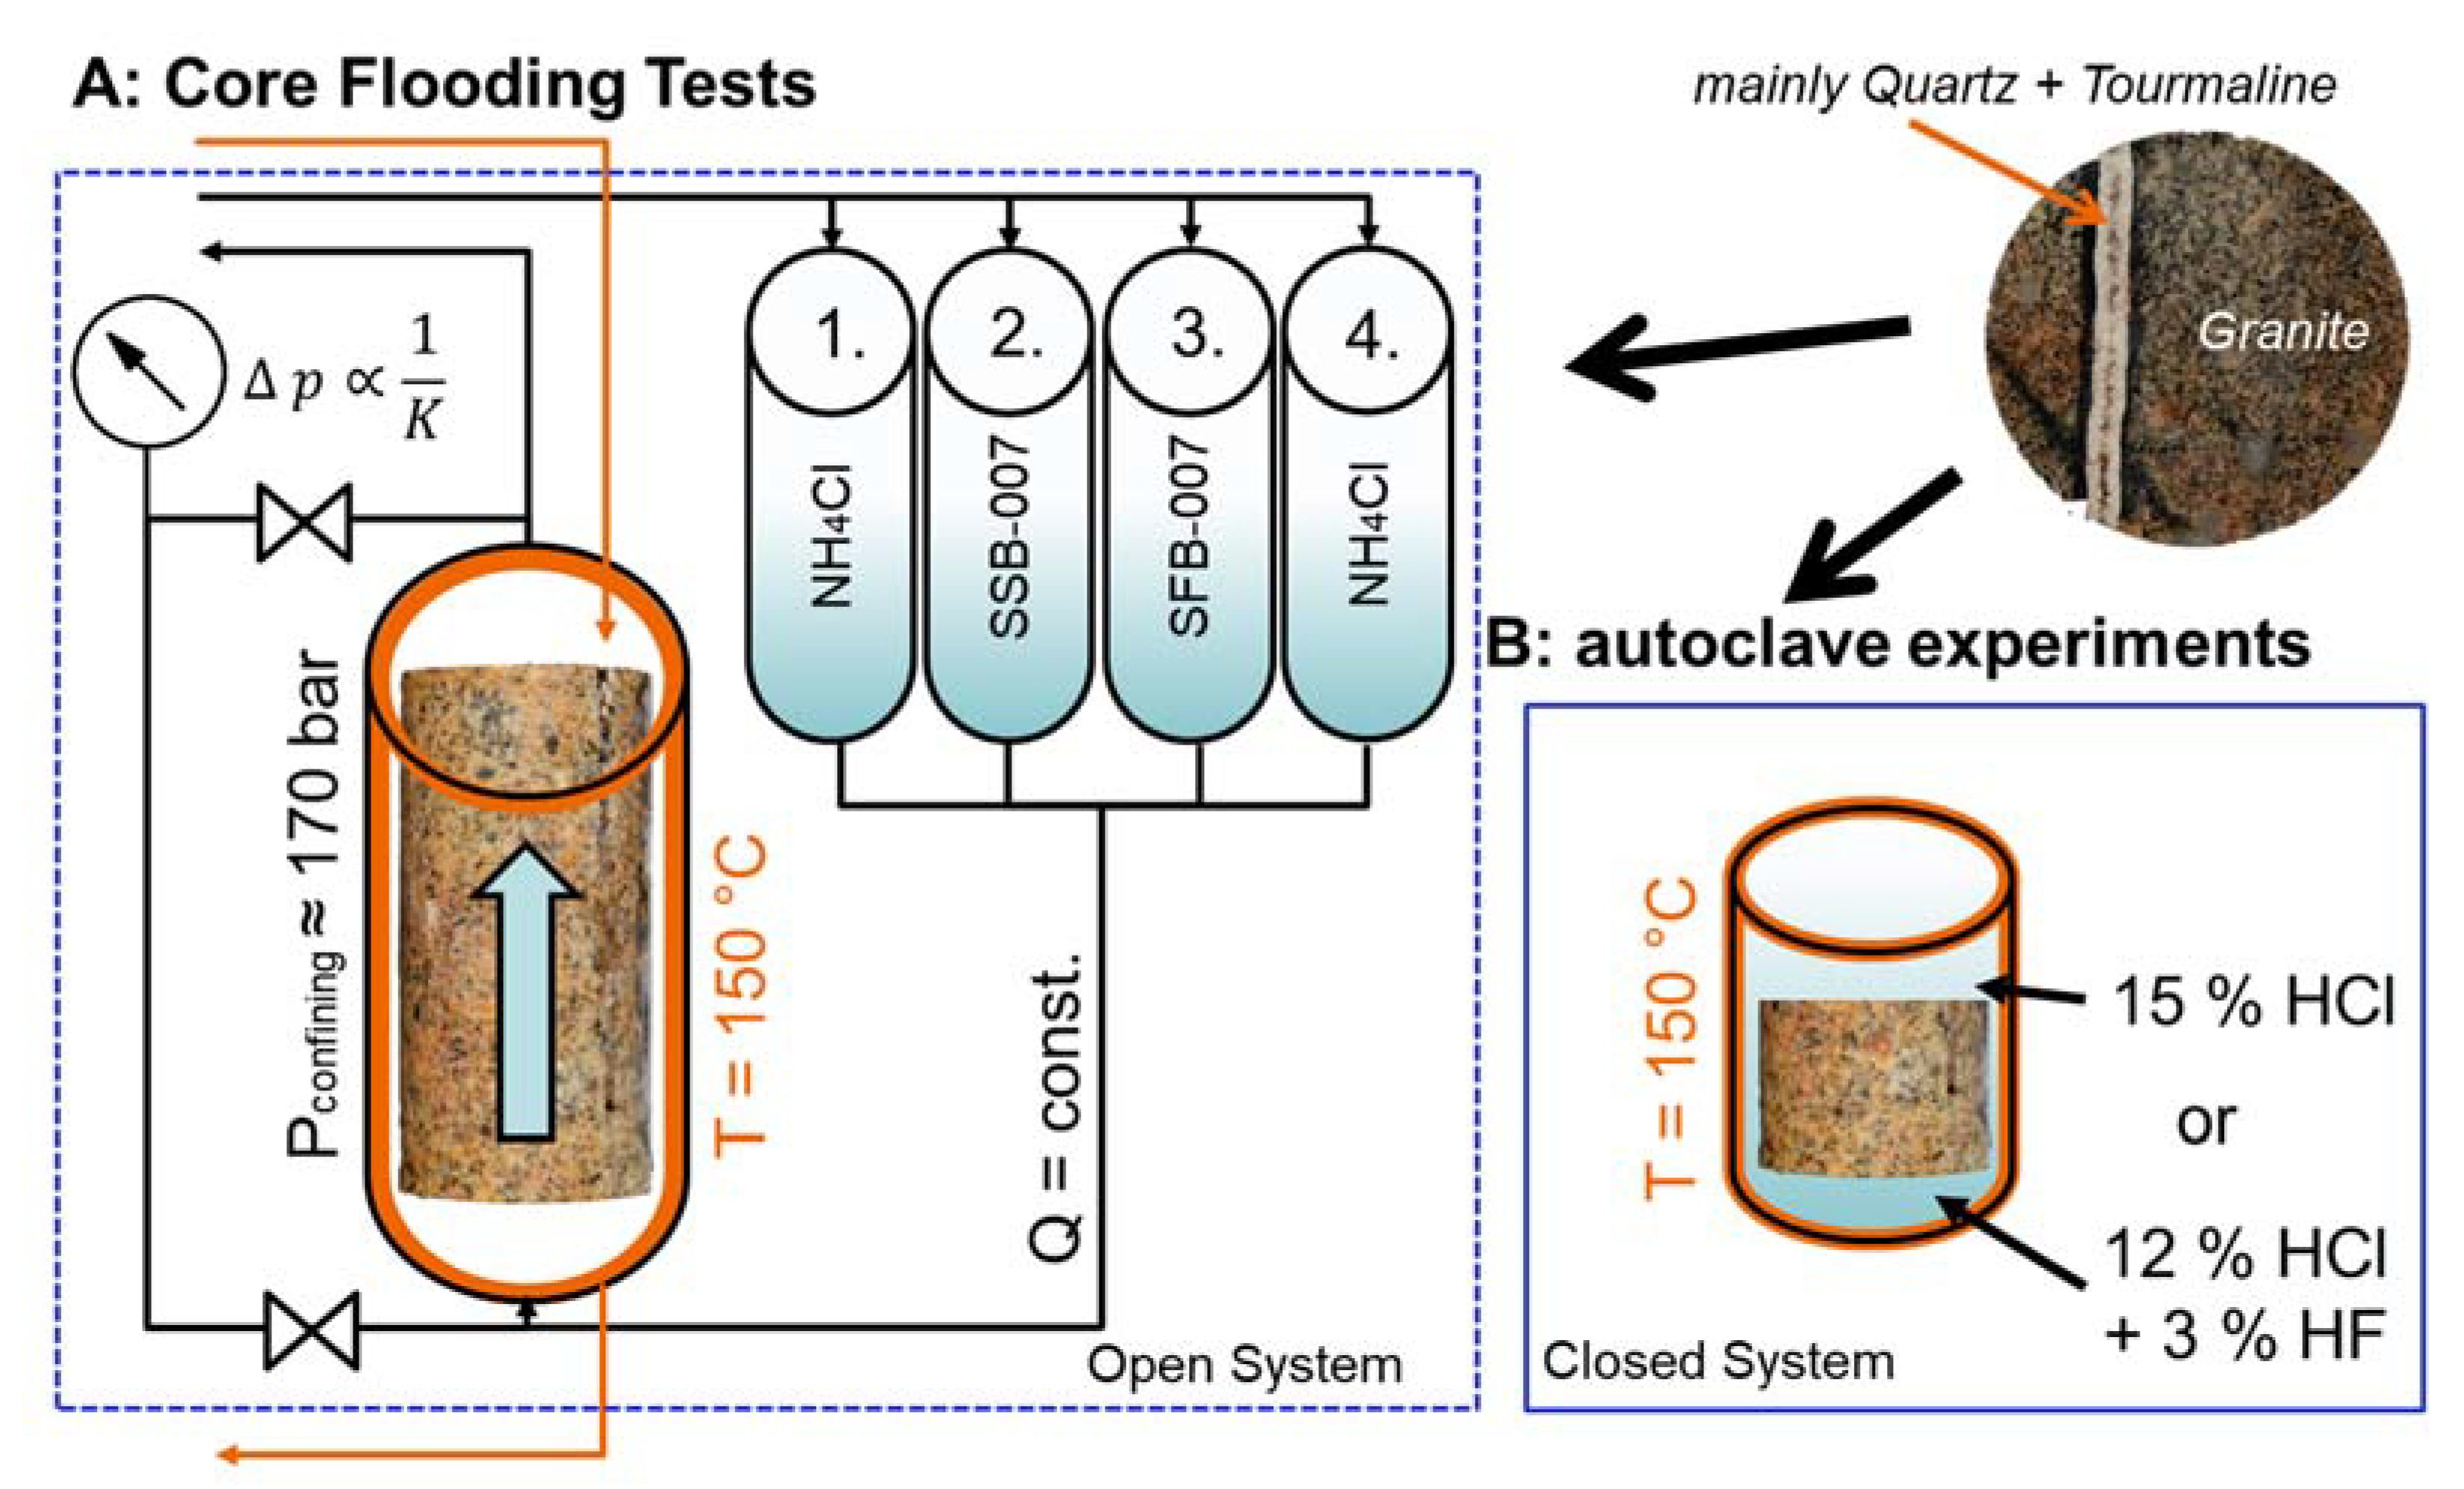
In the chemical treatment experiments (AEs), the samples are placed in autoclaves together with acids at 150 °C for 24 h. The utilised acids are: (a) 15% HCl and (b) ‘white acid’, which consists of 12% HCl and 3% HF and resembles Regular Mud Acid (RMA), which is commonly employed in chemical well stimulation.
In the CFTs, which were conducted at the labs of Fangmann Energy Services (FES), the chemical blends SSB-007 and SFB-007 were circulated through the cores at a temperature of 150 °C and a confining pressure of 172 bar (2500 psi). During the flow rate-controlled tests, the differential pressure is logged to calculate the permeability development over time [
24]. SSB-007 and SFB-007 have relatively similar characteristics to the fluids used in the autoclave experiments.
2.1. Sample-Preparation
All samples were dried to mass constancy (cuttings at 105° for 24 h, OAS at 65 °C for >48 h to avoid low-temperature alteration processes of clay minerals) and stored in closed containers at ~20 °C with silica gel. OAS were cored, sawn and burnished at the Institute of Applied Geosciences in Darmstadt. All cores have a diameter of 40 mm and include veins of different mineralogical composition. The initial length of the ‘cores’ was set to 80 mm (optimum: 2:1 length to width ratio), which had to be reduced to 20 mm ‘plugs’ for further experiments. The core axis was oriented parallel to the strike of the vein; the cores had plan-parallel surfaces. Grinding was performed in a tungsten carbide disc mill (two minutes at a speed of 1000 rpm) following Ferreiro Mählmann and Frey [
25]. Grinding was performed on cuttings and core-cutoffs from sawing, which allow best comparability with OAS cores. The cutting samples lack the sub-63 µm-fraction, which includes the clay minerals (due to washing at the project site: rinsing 2–3 times and decantation of excess water through a 63 µm sieve without containment).
2.2. Petrophysical Methods
Gas pycnometry (determination of the effective porosity, which is an approximation of the total porosity, due to He diffusion) was conducted on all samples according to the recommendations of Micromeritics [
26] as described in Weydt et al. [
27] with the two-chamber systems AccuPyc 1330, AccuPyc II 1340 and CorePyc 1360 (Micromeritics, Germany) using He. The bulk volume was calculated from the geometry of the cylindrical cores.
Sonic measurements were conducted as described in Weinert et al. [
28] with an ultrasonic pulse generator (USG40) (Geotron-Elektronik, Germany), a PicoScope Detector and a UPG-S/UPE-S emitter/receiver set (pushed against the sample with a pressure of 1 bar, coupled by Magnaflux 54-T04 shear gel) on 80 mm cores and 20 mm plugs to calculate the dynamic Poisson ratio and dynamic Young’s Modulus.
Thermal conductivity and thermal diffusivity were measured as described by Mielke et al. [
29] on the 80 mm cores before treatment and on 20 mm plugs after treatment with a Thermal Conductivity Scanner (Lippmann and Rauen, Germany), using gabbro standards (TC) and Quartz/Titan and Titan/Steel standards (TD) [
30]).
The permeability was analysed with a column gas permeameter (stationary air permeameter with a Hassler type cell [
31]). A verification of the results was performed with a water permeameter.
The gas permeameter measurements were conducted according to Filomena et al. [
31], using the different pressure levels 1050–1250–1500–2000–3000–5000 mbar and a mantle pressure of 10 bar for each experiment. The pressure difference was set between up to 1000 mbar (samples with permeabilities in the range of 10
−17 m
2) and only 50 mbar (permeabilities below 10
−14 m
2). Further information about the method is provided by Weydt et al. [
27]. Since the sample axis was parallel to the vein, the measured permeability was a combined vein and matrix permeability and the permeability of the whole sample was highly anisotropic.
2.3. Acidification
CFTs were conducted at the labs of Fangmann Energy Services, using a Manual Reservoir Permeability Tester (OFI Testing Equipment) to induce and analyse changes to the sample properties caused by acidification (
Figure 4). The relative permeability changes over time were analysed by the measurement of the pressure difference at the in- and outlet of the sample (constant flow rate; measurement similar to a permeameter). The CFT procedure can be summarised in the following steps:
18 h pre-saturation of the core with NH4Cl (Ammonium-chloride solution with 50 kg NH4Cl per m3 water) under vacuum conditions; installation of the sample in the permeability tester.
Pre-flush: Core flooding with NH4Cl and initial permeability measurement.
Acidification 1: Core flooding with SSB-007.
Acidification 2: Core flooding with SFB-007.
Post-flush: Core flooding with NH4Cl (flushing the spent acid and particles out of the core) and final permeability measurement.
Deinstallation.
The NH4Cl-brine was used because it has relatively similar flow properties compared to the applied acids and does not react with the acids, cores or the device. Besides, since NH4+ is not included in the geochemical analysis (and would be falsified anyway by the use of ammonium bifluoride as a constituent for the preparation of HF), the falsification of the analytical results was limited to Cl−.
The composition of Fangmann’s acid blends SSB-007 and SFB-007 is confidential. According to general information from Fangmann, SSB-007 is based on HCl or on a Strong Organic Acid (SOA) with comparable reaction kinetics. SFB-007 contains additional HF and is relatively similar to Regular Mud Acid (RMA) [
24]. RMA is a common acid used for sandstone matrix acidising [
32]. Recalde Lummer and Rauf [
24] state the applicability of Fangmann’s product SFB-007 as well for granite.
The applied test conditions were temperatures of 150 °C, confining pressure (mantle pressure, prevents lateral flow around the sample) of 172.4 bar and back pressure (system pressure, prevents boiling of the fluids) of 34.5 bar. A drive pressure pushed the fluid through the core and depended on the flow rate (sample 010006004: 0.9 mL/min through artificial fissure; 017001005: 1.36 mL/min through artificial fissure; 23001002: 0.665 mL/min through natural vein) and the permeability of the sample [
24]. As the initial permeability of two samples was too low for the circulation of the brine, those samples were sawn along the original vein. This joint was compressed by the confining pressure. Further information on the permeability measurement before and after the CFTs is given in
Appendix A.
Due to cost- and time-intensity and unknown composition of the acids, only three cores were analysed in CFTs and AEs were used to resemble the CFTs.
During the AEs, the acid and sample were encased in high-pressure autoclaves (Parr Acid Digestion Bombs, 302AC T304, Bomb No. 4748, stainless-steel autoclave system with a cylindrical Teflon (PTFE) container) and heated at 150 °C for 24 h (closed system). In contrast to the CFTs, no circulation of fluids though the sample was realised, implying that no pre- or post-flush was conducted to cleanse the samples of any reaction products after reaction (
Figure 4).
In the autoclave experiments, two different acids were used to resemble Fangmann’s acid blends SSB-007 and SFB-007:
15% HCl.
12% HCl with 3% HF (White acid, common basis for RMA, produced by mixing 1000 mL HCl (15%) and 50 g ammonium bifluoride (ammonium hydrogen fluoride, F
2H
5N, purchased as granulate) [
33].
HF in a concentration range between 1 and 7% is dangerous to life in case of skin contact, among other hazards, and is class 2 in the German Water Hazard Classification System [
34]. It is not biodegradable.
For powder acidification experiments (set 1: 12% HCl + 3% HF) the autoclaves were loaded with 6 g of powder (from ground OAS) and 60 mL of acid (ratio of powder mass to acid volume: 1:10, assuming that the entire powder participates in chemical reactions with the acid) and rotated and shaken carefully.
For core acidification experiments (set 2: 15% HCl and set 3: 12% HCl + 3% HF) the autoclaves were loaded with 40 mm diametral, 16–27 mm-high OAS plugs and a volume of acid corresponding to the surface area of the plug in a ratio 1:1. This approach assumed that mainly the sample surface, plus permeable parts of the sample, mainly along the vein–rock matrix interface, would contribute to chemical reactions.
To saturate the samples with the acids, the loaded Teflon cylinders were evacuated in a desiccator with a water-jet vacuum pump for 30 min.
After the heating phase, the autoclaves were cooled with wet tissue until they were cold enough to be touched and opened (approximately one hour, but as short a time as possible, to reduce precipitation). The liquid (spent acid) was then separated from the solid sample remnants for AAS and IC analysis via pipetting. The plugs were then rinsed with deionised water to allow safe handling and to reduce precipitation. For the powder samples, the non-dissolved solid fraction of the sample was repeatedly centrifugated with deionised water to increase the pH from pH < 1 to pH > 5, to allow safe handling of the sample and enable further analysis.
The following bullet points summarise the most important conditions of the autoclave experiments:
Firstly, 15% HCl or 12% HCl + 3% HF.
Plugs (surface to acid ratio 1:1) or powder samples (mass to acid ratio 1:10).
150 °C for 24 h.
Ambient pressure (pressure increase only due to fluid expansion and reaction processes).
No flushing of the samples during the experiment.
As the applied acids, especially at high temperatures, are very corrosive, the materials of the autoclaves and the Manual Reservoir Permeability Tester, as well as any used lab equipment in contact with the acids, had to be chosen accordingly and all devices and tools were visually controlled before and after use. With respect to the CFTs, the used acids contained corrosion inhibitors.
2.4. Fluid Chemistry
Atomic Absorption Spectroscopy (AAS) was conducted with a ContrAA 300 (Analytic Jena, Germany, Xenon continuum source lamp plus monochromator, PTFE impact bead; acetylene/air-flame (2200 °C) or N
2O/acetylene flame (2750 °C), measurement duration (3 to 4 s), flame height and the characteristic lines used for analysis depend on the element and are selected according to Analytic Jena recommendations, based on the software database; software Aspect CS, version 1.5.6.0). Further details on the method can be found in Broekaert, Skoog and Leary as well as Welz and Sperling [
35,
36,
37]. The spent acids from the autoclave experiments were diluted by a factor of 50 or 100 as a reasonable compromise between the fitting with the calibration range and a reduction in the dilution error. This affects the measurement quality for Si, Al, Fe and partly Ca, K and Na. A six (or seven)-point calibration was conducted, with calibration standards from single-element standards (Carl Roth) and a LaCl-CsCl-solution (Merck KGaA, Germany) in a 2% HCl (supra quality) matrix.
Ion exchange chromatography was conducted with a Compact IC (Metrohm, Germany; Compact IC autosampler plus, two separation columns for an- and cations with organic polymer resin (both Compact IC plus; software MagIC Net™; cation-eluents: Pyridine-2,6-dicarboxylic acid (C7H5NO4) and nitric acid (HNO3), anion eluent: Sodium carbonate (Na2CO3)/Sodium hydrogen carbonate (NaHCO3). A 16-point calibration of the device is performed every three to four months, a control measurement is conducted within the analysis.
The silica content of the spent acid was determined with a Photometer Specord 200+ (Analytik Jena, Germany), and the reagents ‘Merck 14,794 (Silicate Test)’ using the software WinAspect+, according to DIN 38405-21 [
38]. A nine-point calibration (0, 0.5, 1, 2, 3, 4, 5, 6 and 7 mg/L) was performed. Although the spent acid had a yellowish colour, the optical measurement was possible for set 1 and 3, as these samples were diluted by a factor of 1000; set 2 was not measured because the required dilution factor was too high, as the silicate content is very low.
2.5. Mineralogy and Geochemistry
X-ray diffractometry (XRD) was conducted on powder tablets (low-texture samples) by Dr. R. Petschick (Goethe University of Frankfurt) with a Panalytical X’Pert Pro Powder X-ray-diffractometer (Kassel, Germany; Cu-ray tube with Cu radiation: 40 kV, 30 mA; Ni-filter with λ(CuKα) = 1.542 Å (no separate α-peaks), automatic divergence slits, X’Cellerator line counter) with the following goniometer settings: two hours per sample with a detection angle from 2.5–70° 2θ, emitter and detector circuit step length of 0.0083° 2θ and 100 s measurement time. The software X’Pert Data Collector (Panalytical, German<), X’Pert Highscore Pro (Panalytical, Germany) and MacDiff [
39] were used to evaluate the measurements; measured intensities were normalised with an external standard (Corundum), approximating the natural concentration. Fluorescence effects were reduced by a baseline correction and a peak-position correction was conducted based on the Quartz peaks. Further details on the method are described by Petschick [
40].
For geochemical analysis the internal method ‘Quant Express, Best Detection’ (wavelength-dispersive, no external standards) of the X-ray-fluorescence-spectrometer S8 Tiger 4 kW (Bruker, Karlsruhe, Germany, scintillation counter for heavy elements, proportional counter for light elements (Bruker [
41]) was used. For the evaluation, the total sum of measured elements was normalised to 100%.
For the powder tablets, a ground <63 µm sample was combined with Hoechst wax C micro powder (C38H76N2O2) (Merck, Germany) in a ratio 1:4, homogenised in a rotator mixer for 30 min and pressed to tablets in a stainless-steel cylinder under pressure of 160 bar.
3. Results
Both acidification methods, CFTs and AEs, were used to analyse the permeability enhancement by chemical treatment (
Appendix B,
Figure A1) in samples from the Cornubian Batholith. Additionally, mineralogical, geochemical, petro- and thermophysical rock properties were determined, allowing before–after comparison and the quantification of the acidification effects. The OAS from the Cornubian Batholith were selected with focus on their comparability with the Carnmenellis granite and the presence of veins. The veins allowed comparison with hydrothermally altered zones in the well. Additionally, cuttings from the geothermal well UD-1 were used for a preliminary transfer of results from lab scale to the reservoir.
3.1. Sample Composition
All six sampled outcrops or quarries were granitic. However, as veins (mainly filled with Quartz) were targeted for sampling, all samples had elevated Quartz content compared to the cuttings from UD-1 and the regional chemistry, as described by Simons et al., (2016). In three cases the sample composition was classified as quartzolitic, as the volumetric overrepresentation of the veins caused elevated Quartz (and Tourmaline) content (
Table 3). In relation to Plagioclase, the K-Feldspar content was also slightly elevated. As the resilience of Plagioclase is usually lower, compared to K-Feldspar, this may be an indicator for weathering effects on the samples. Macroscopically, Muscovite and Biotite were detected in all samples (Ms ≥ Bt). As accessory minerals, Tourmaline, Chlorite and Cassiterite were identified in the OAS and Hornblende and Chlorite in the cuttings. All veins consisted of Quartz, plus Tourmaline in most cases and rarely ore minerals. The general mineralogical evaluation of the samples with XRD confirms the macroscopically detected minerals, except for Biotite, which is underrepresented in the XRD results. The conducted REE analysis [
42] generally correlates with the trends described by Simons et al. [
5]. Detected deviations in REE may also be explained by weathering processes in the samples, because an inverse Europium anomaly could be related to weathering of plagioclase. The REE evaluation might thus be useable as a tool to detect weathering.
3.2. Acidification
The CFTs, conducted and evaluated by Fangmann Energy Services [
44], resulted in a significant increase in permeability. To quantify the effectivity of the acidification, we defined the permeability enhancement factor (PEF), which is the ratio between the permeability before (K
pre) and after (K
post) treatment:
The CFTs resulted in a PEF between 4 and 50. On the treated samples, a white precipitate was visible after the acidification.
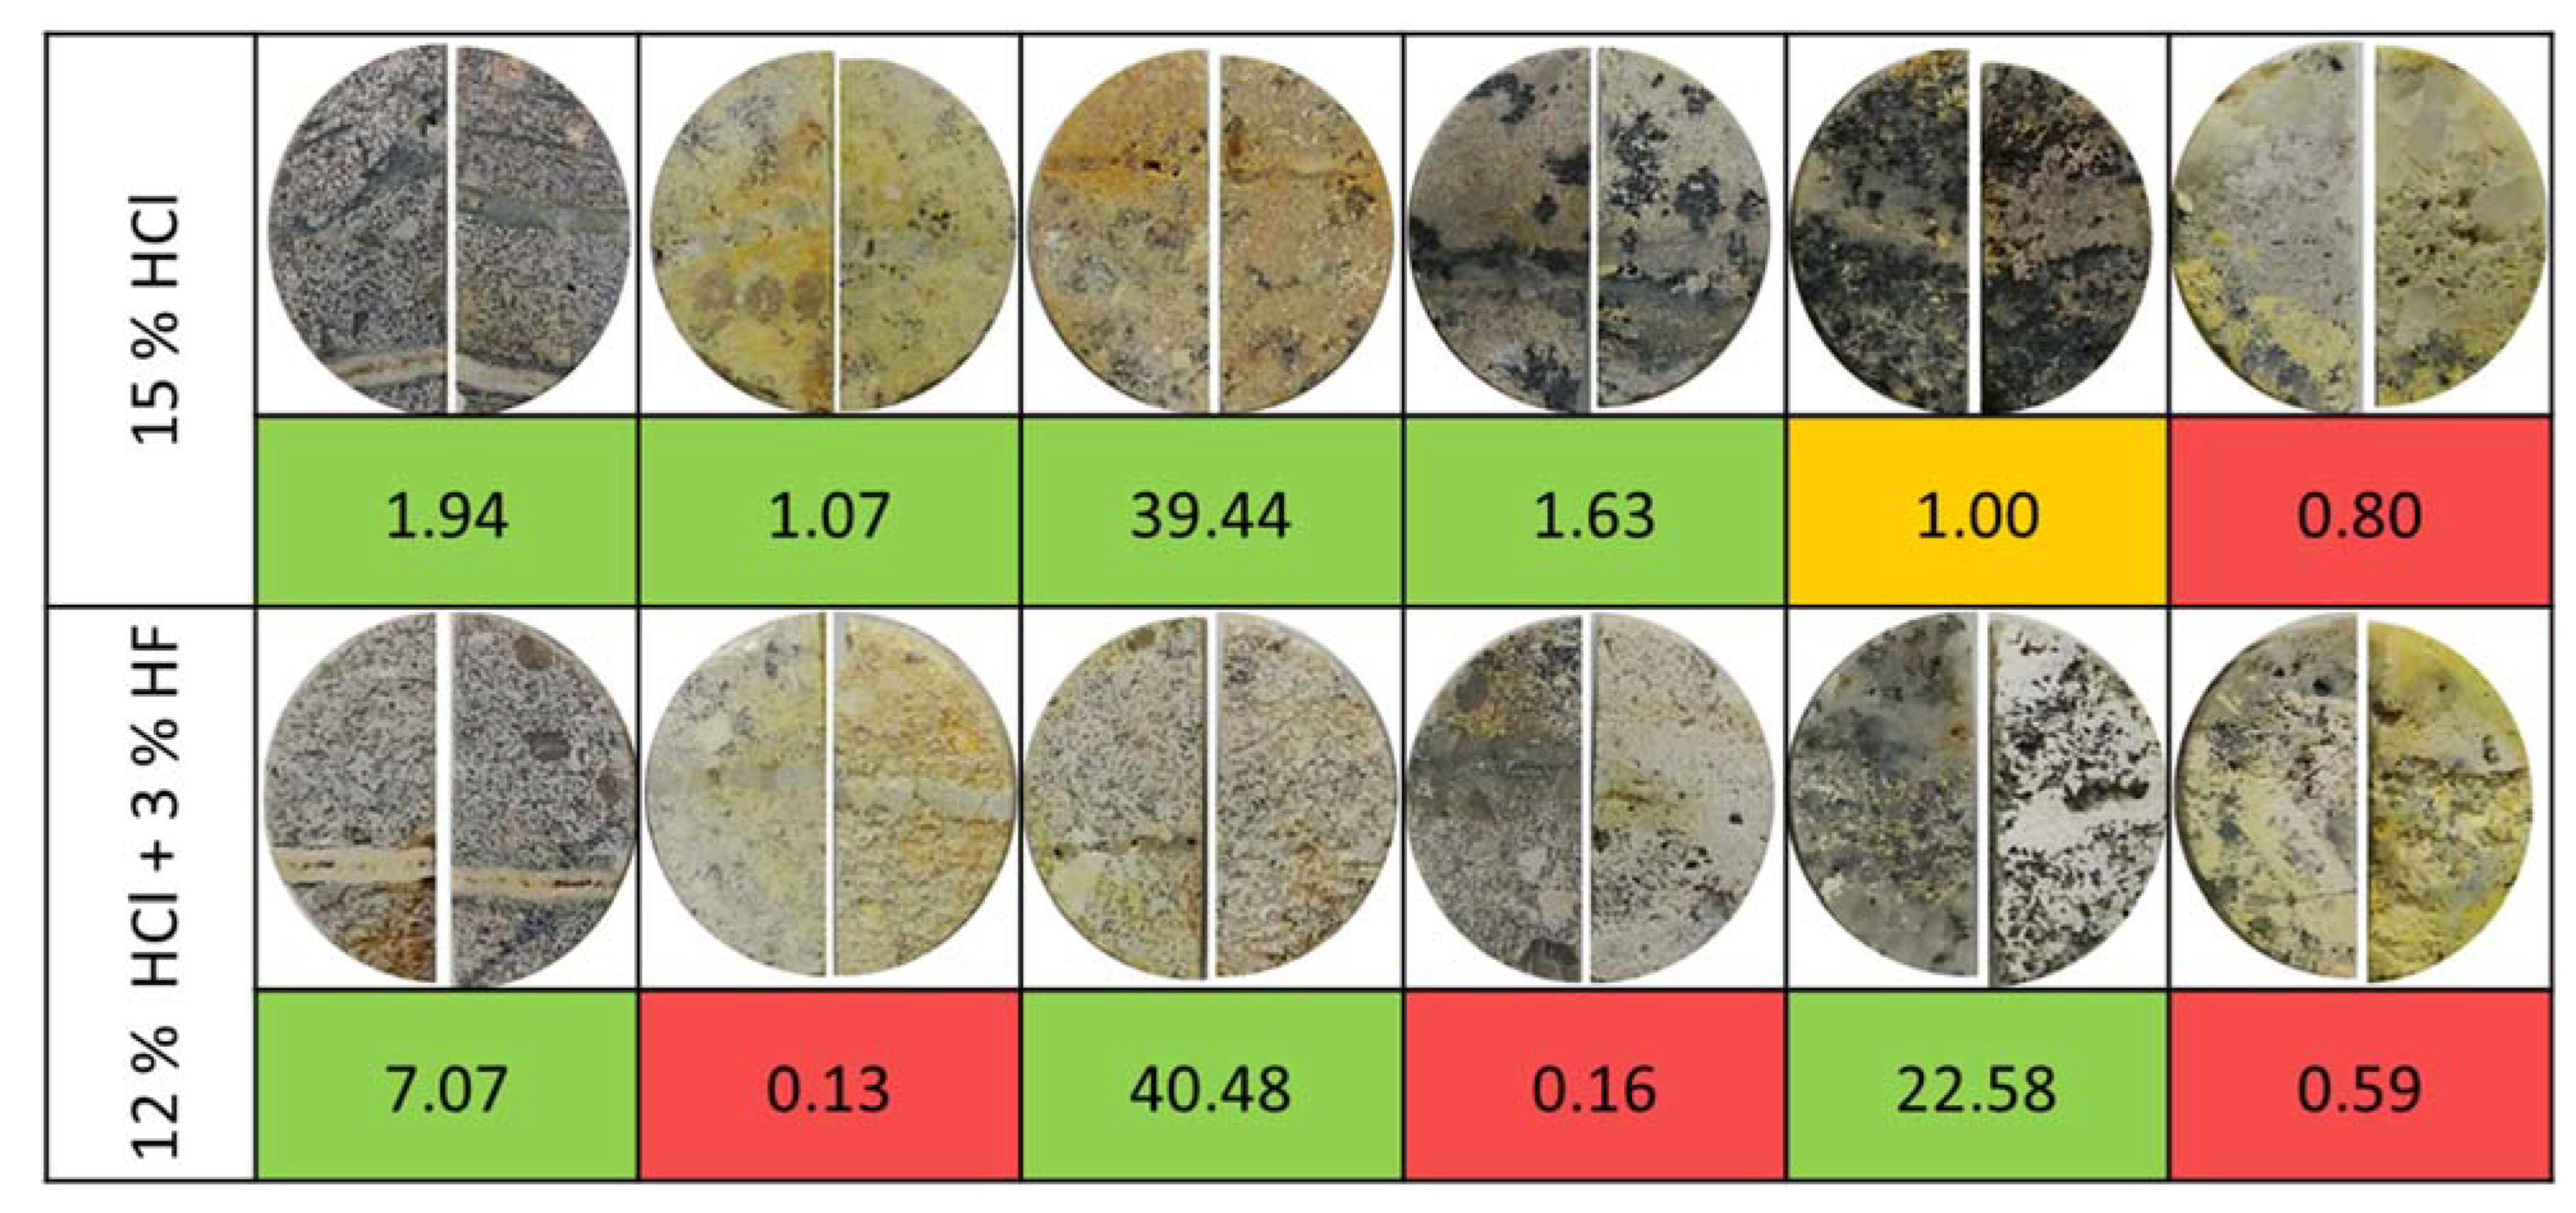
In contrast to the CFTs, the trend in permeability variation was more ambiguous in the AEs. The AEs induced a permeability variation by a PEF between 0.1 and 40 (for 15% HCl: 0.8–39.44; for 12% HCl + 3% HF: 0.13–40.48). A permeability decrease (PEF < 1) was, in most cases, accompanied by (and likely caused by) the precipitation of a yellowish and a white mineral, which were macroscopically visible on the plugs (
Figure 5). After treatment with HCl + HF, the bottom of the samples showed more intense changes: a relief was created, which was especially visible in samples 2, 3, 5 and 6 (
Figure 5). In this relief, the Quartz veins acted as the resistant parts and remained almost unaffected. In sample 3, this effect was visible for the Quartz grains in the matrix. On the top of the sample, these effects were less intense. In addition, samples 2 to 6 showed yellow or white precipitation, also mainly on the bottom of the samples. After treatment with HCl, a relief was only created in sample 2, 5 and 6, mainly close to the veins. No white precipitates were visible, but yellow precipitates occurred on sample 2 to 6.
The yellow mineral does not resemble any original crystal structures and can partially be dissolved or washed away, but reprecipitates during the drying process (65 °C). This is most likely caused by the evaporation of the remaining pore fluid and indicates that the acid penetrated the sample surface. This was confirmed by a reaction front, which was visible in most samples in the cross section of the plugs after sawing them vertically. This reaction front was commonly located around the vein (sample 1, 4, 5 and 6) or in the entire sample (sample 2 and 3), but with a gradual increase towards the vein. The white mineral mainly occurred on or along pre-existing minerals (Feldspars and Quartz), especially on the bottom of the plugs. In difference to the yellow reaction front, it did not seem to be related to the veins and occurred only on the outside of the samples. The precipitate occurred in spent 15% HCl as well as 12% HCl + 3% HF.
In the fluid samples, no precipitation processes were observed, even after several weeks of storage. During the AEs, the acid colour changed from clear transparent to an intense yellow. Based on the hydrochemical analysis of the spent acid, showing elevated iron concentrations, most likely these minerals were partly iron hydroxides (FeO(OH), Goethite or Limonite). Macroscopically this was indicated by the yellowish colour of the fluids, which could be interpreted as an indicator for hydrated trivalent iron, as the iron(III)complex [FeCl(H
2O)
5]
2+(aq) (ligand Cl
−) was yellow [
45]. The precipitate may also include silica gel. According to Portier and Vuataz [
46] this is formed by a secondary substitutionary reaction of hexafluorosilicic acid (high solubility) (which is formed from HF-acidification of Quartz) where Si ions are exchanged by Al
3+ and precipitate as SiO
2, while the fluoaluminates remain in the solution. This reaction is triggered when HF is nearly consumed. As clays or Micas are the main source for the Al
3+, they increase the probability of silica gel precipitation.
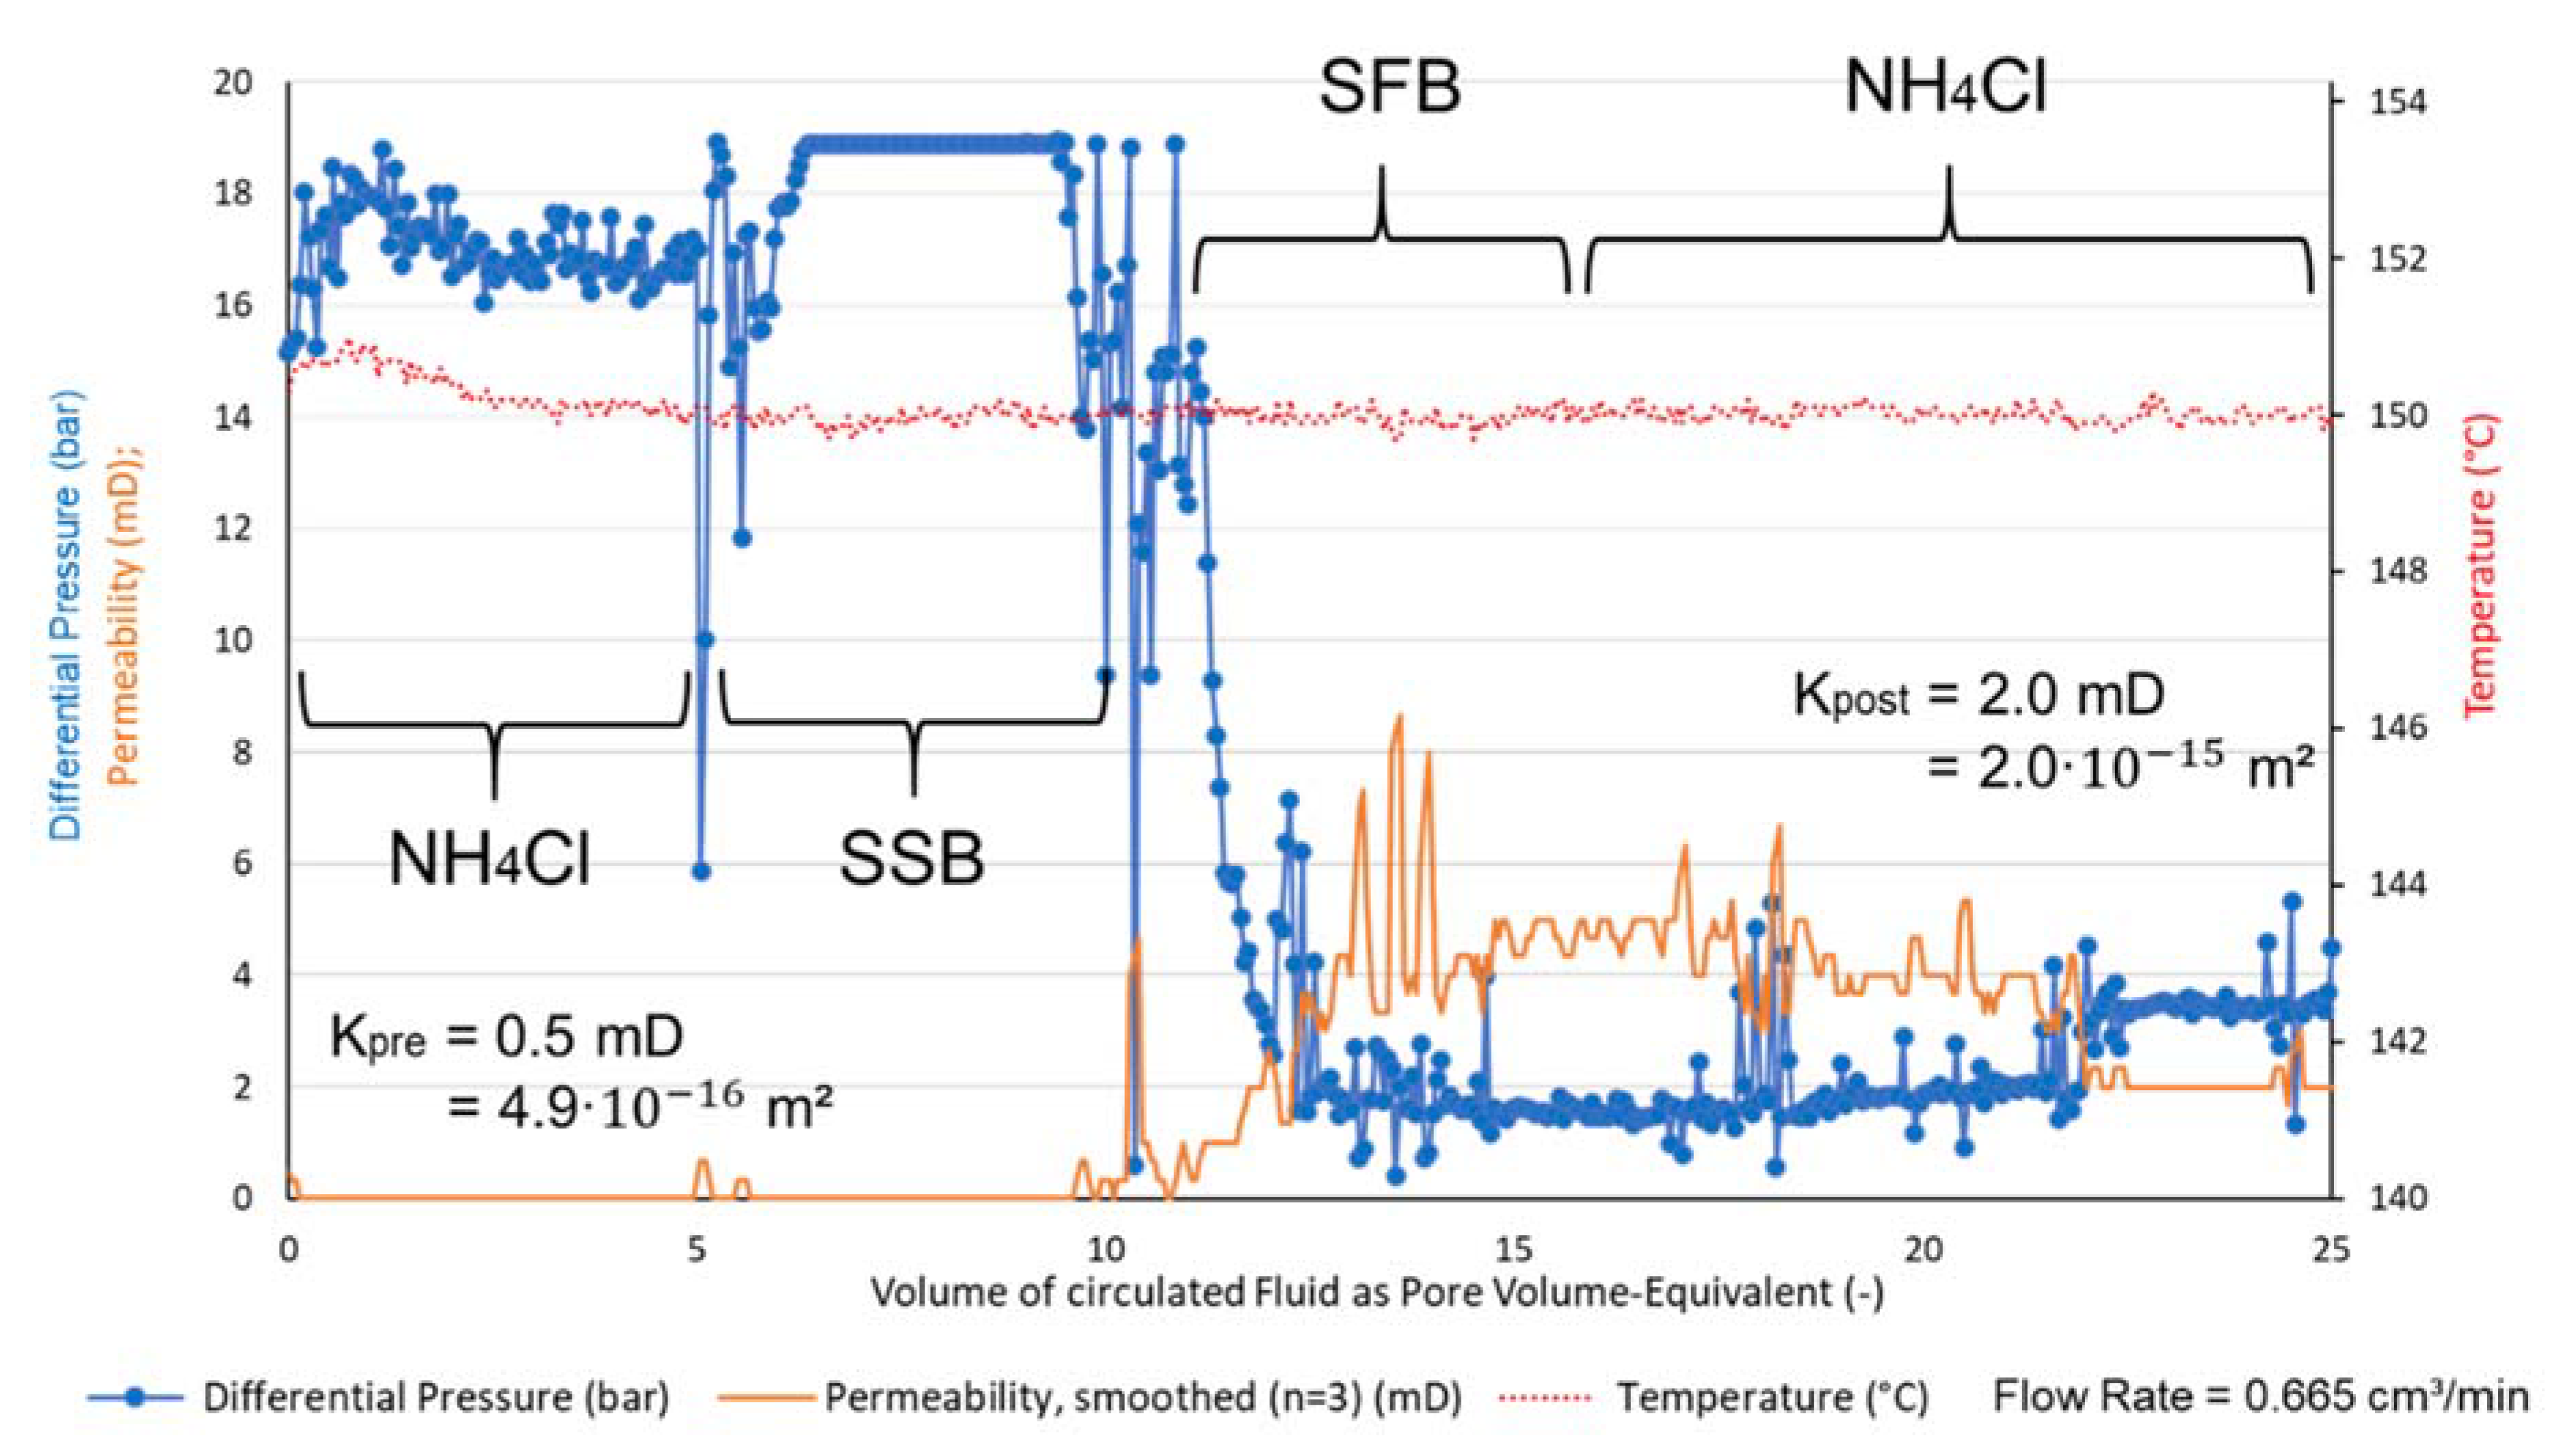
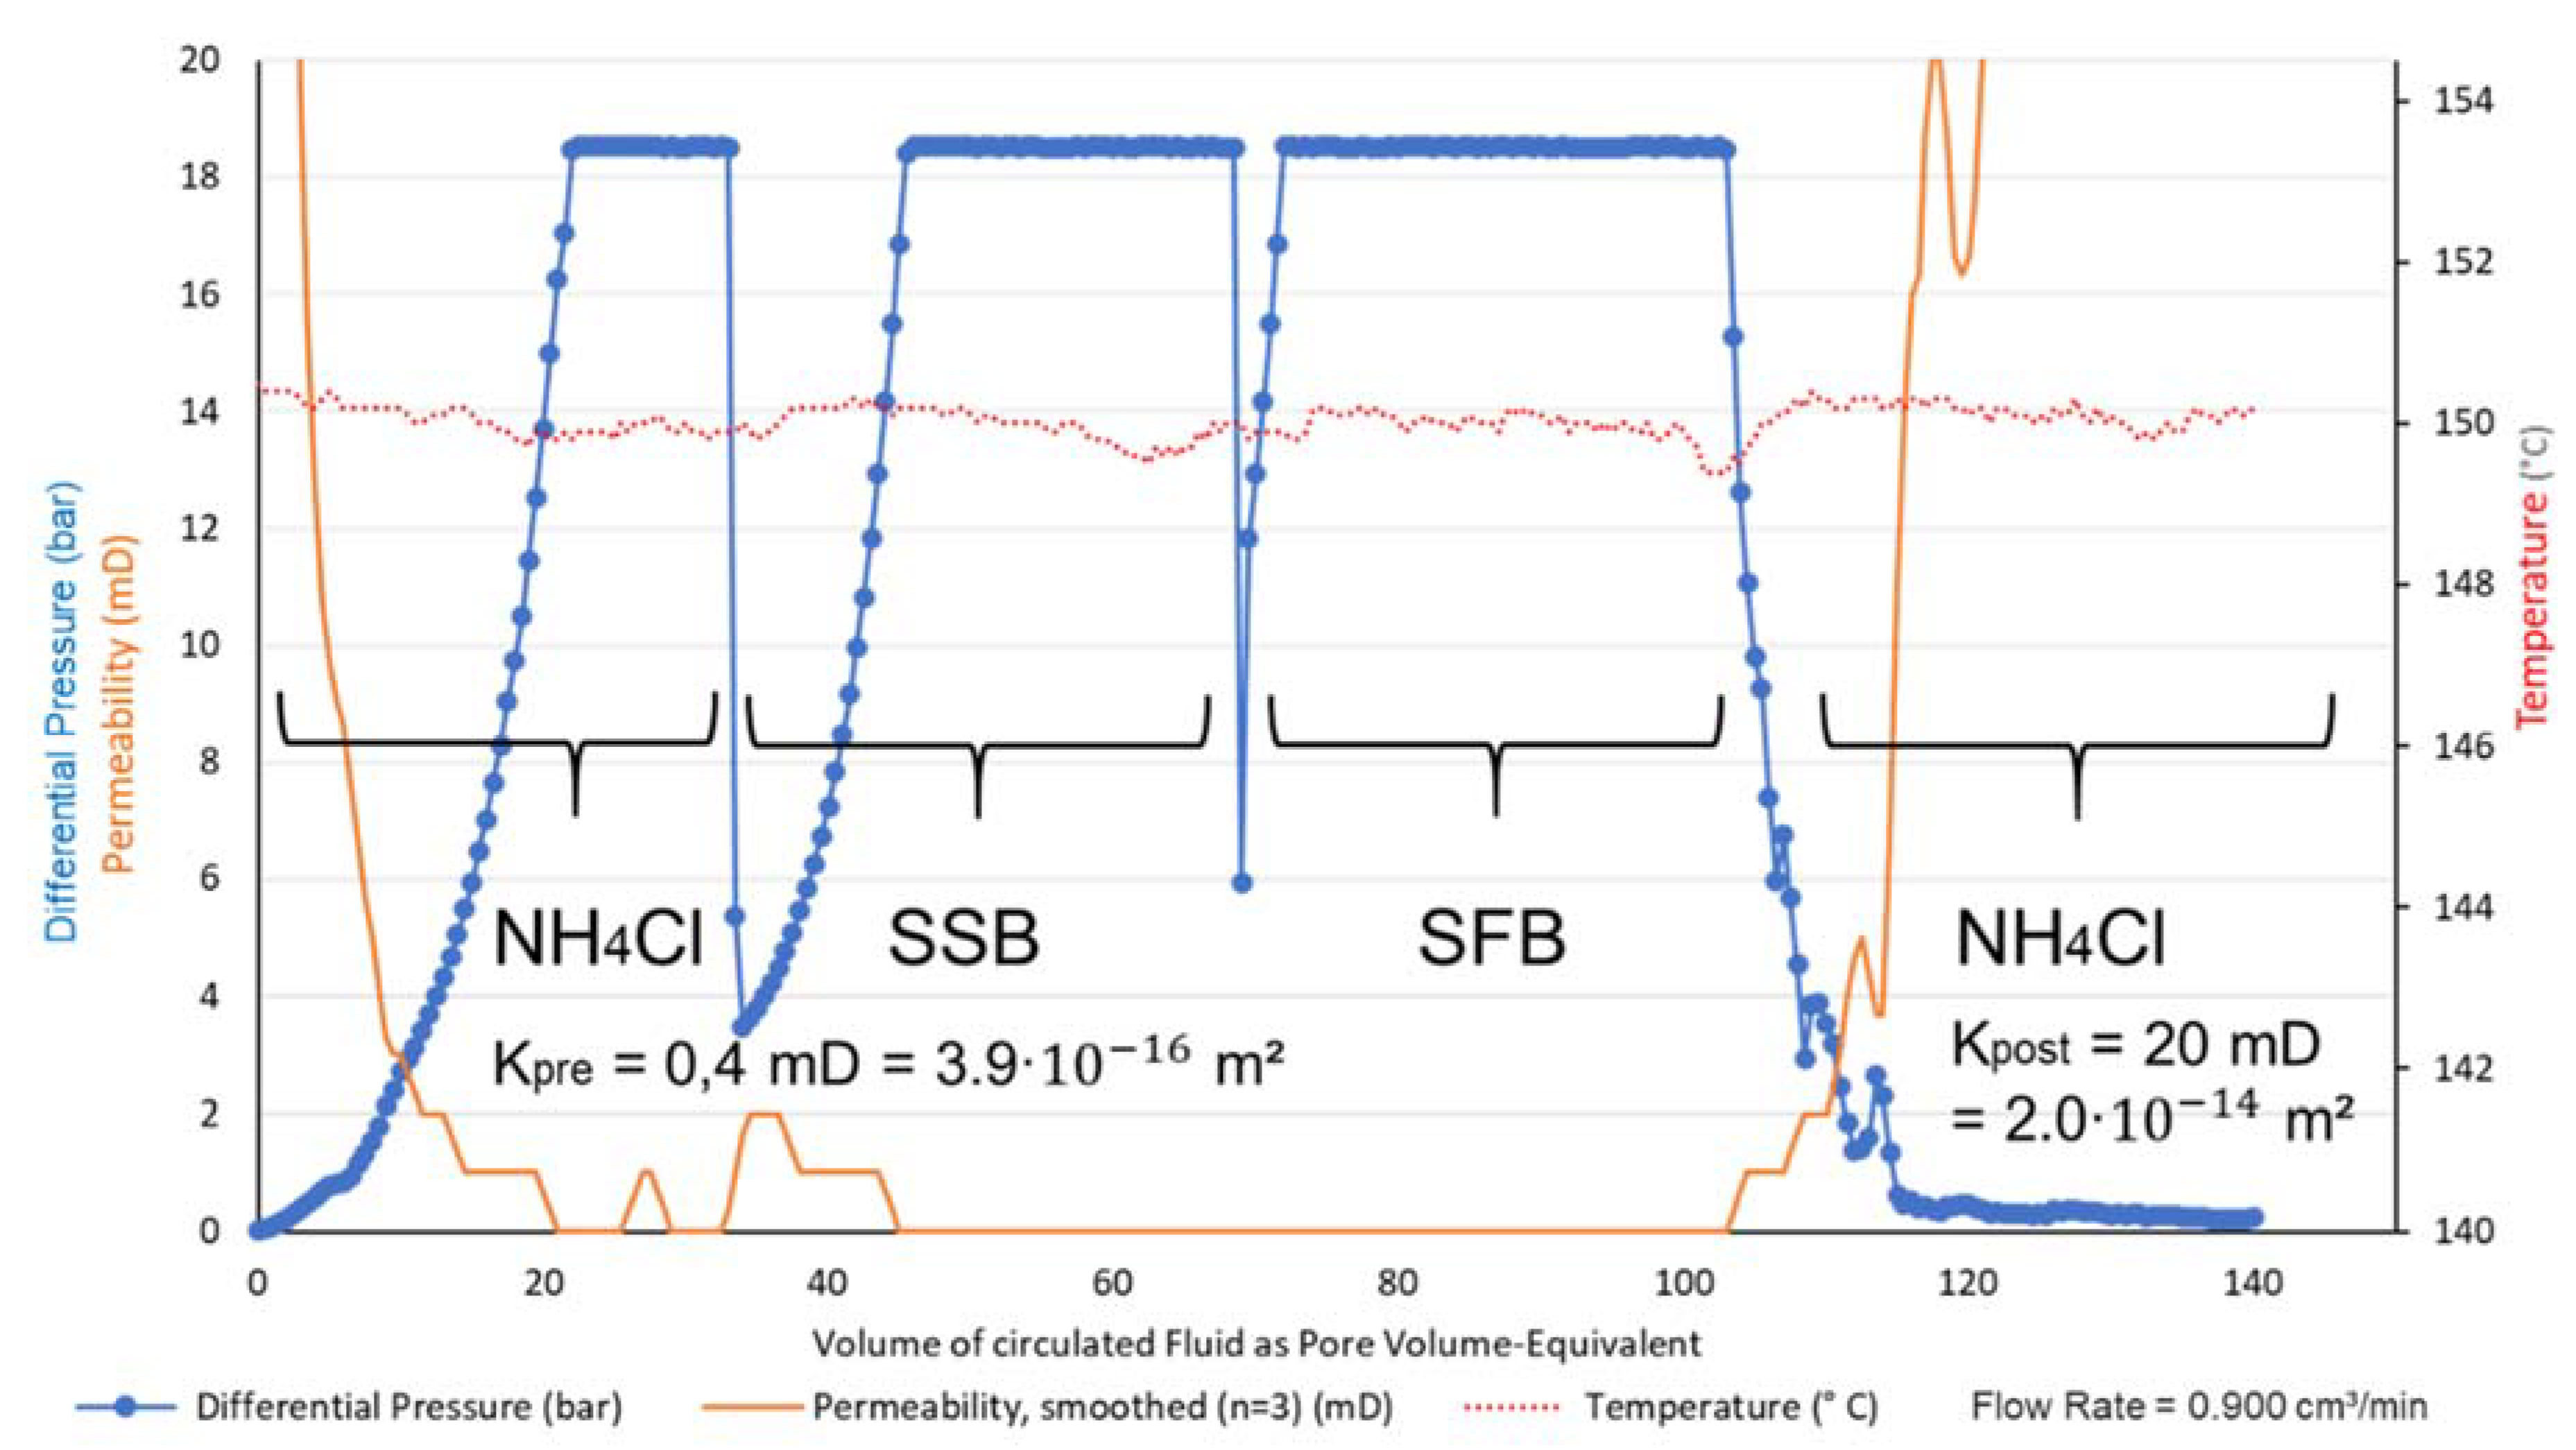
Permeability tracking during the CFTs, as displayed in
Figure 6, shows the processes during the acidification. Regarding the evaluation of the CFTs, the tracked pore volume can be considered proportional to time, since the flow rate was constant. As visible in Equation (A1) in
Appendix A, the pressure difference was inversely proportional to the permeability and the maximum measurement range of the device is approx. 19 bar. The sudden drop in measured pressure difference at the transitions between the different fluids, which was visible in all three CFTs, was caused by an inlet pressure drop when the fluid valves were changed. Regarding sample 6 (
Figure 6), the effect of SSB-007 was insignificant in the sample (no calcite or well-soluble minerals), as the differential pressure did not vary before and after SSB-007. During the application of SSB-007, differential pressure decreased, implying a high efficiency of HF in this sample. The shape of the curve resembled an exponential decrease, implying a fast efficiency decrease in HF. In the sample this effect could be due to an initial dissolution phase, which mainly affects pore throats and macropore contaminants. Combined with the flushing of the macropores and smaller pores, now with extended pore throats, the removal of particles increases the permeability with high effectivity in this initial phase. Another explanation might be that the exponential decrease was an effect of grain integrity and grain size distribution. Because this samples showed signs of weathering, the trend could express a significant reaction with fine- to very fine pre-damaged grains. After this, the grains with higher integrity showed a lower reactivity with SFB-007. In the post-flush phase, the pressure difference increased after the circulation of 22 pore volumes. This behaviour might indicate the collapse of a fracture under the applied confining pressure during the flushing process. This implies the risk of a permeability decrease by the reduction in rock stability during chemical treatment. In further CFTs, permeability increased during the post-flush phase displayed the relevance of the post-flush, which seemed to mobilise particles that cause pore clogging.
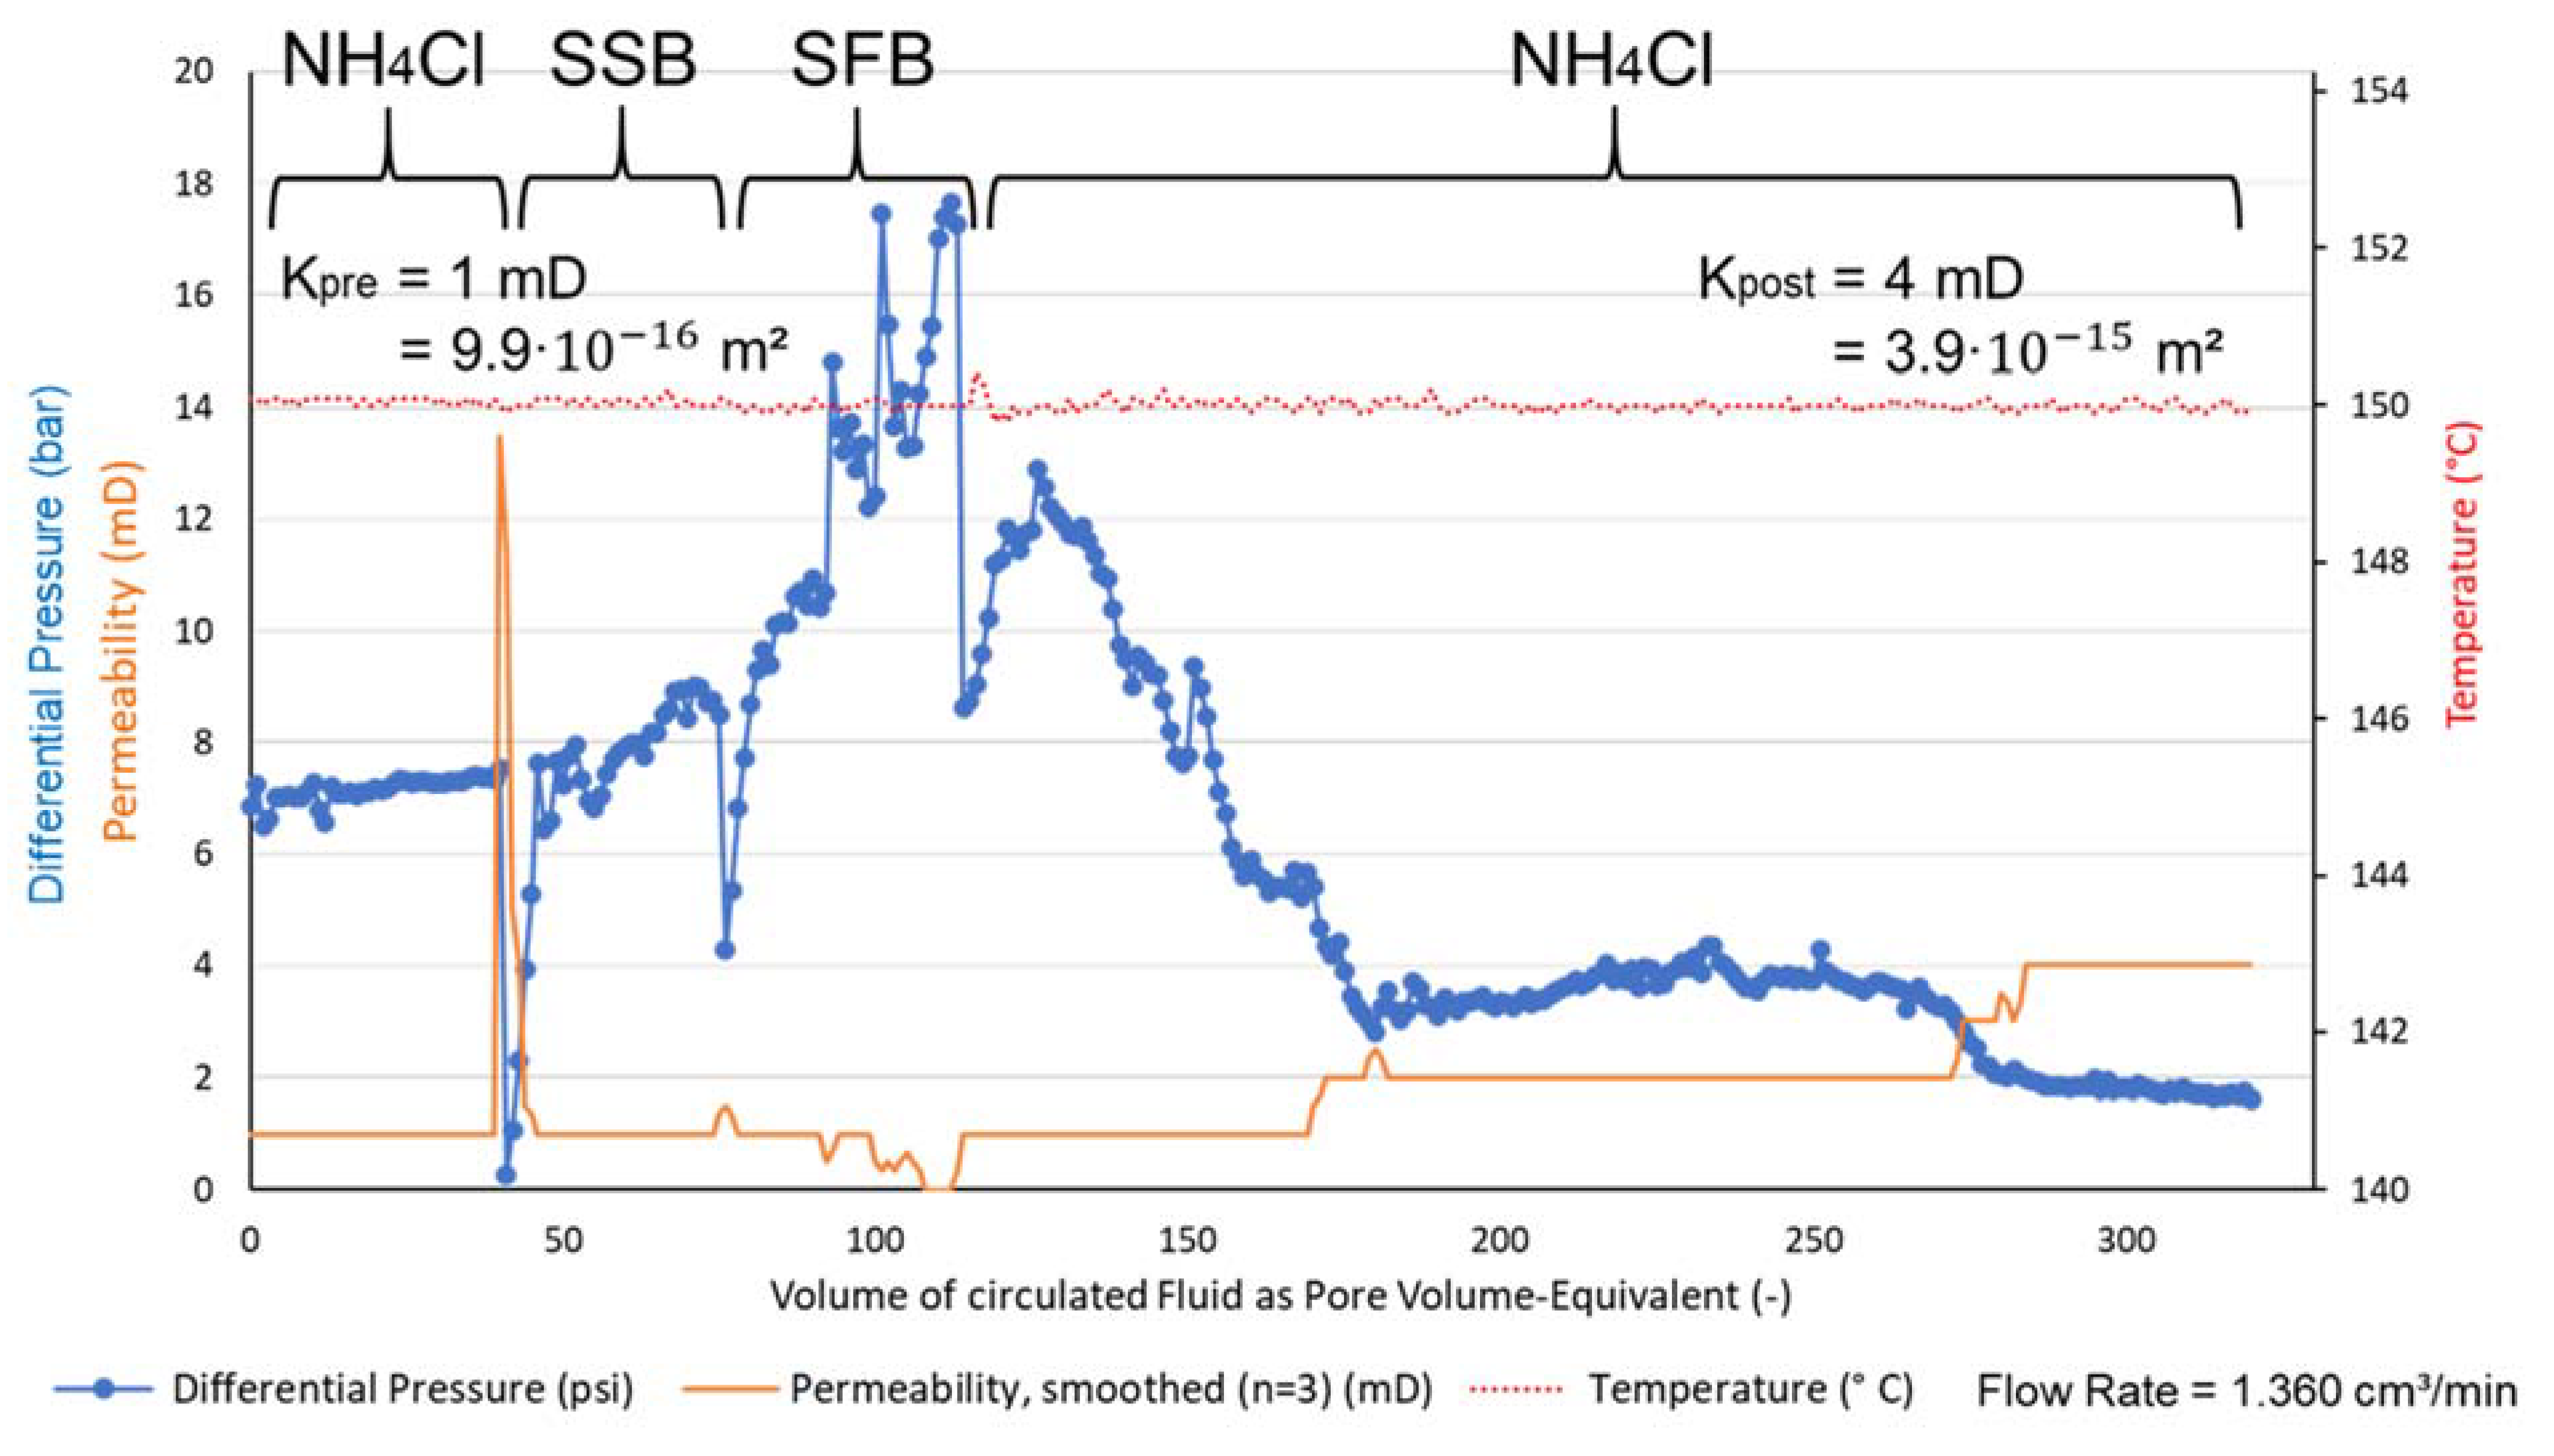
In difference to sample 6, the samples 5 (
Figure 7) and 3 (
Figure 8) were sawn vertically along the natural vein to increase the permeability, because the execution of the CFTs was not possible as the initial permeability was too low for circulation of ammonium chloride.
The documented pressure differences in the CFT on sample 5 resemble sample 6. A major difference is that during the long post-flush period, the pressure difference decreased significantly after a total of approximately 275 PV of circulated fluids and the permeability increased, respectively (doubling of the permeability from 1 mD (9.87 × 10⁻¹⁶ m2) to 4 mD (3.95 × 10⁻¹⁵ m2)). This implies a high relevance of the post-flush, which seems to mobilise particles, that cause pore clogging.
The evaluation of sample 3 shows major difficulties during the CFT. The permeability of the sample, even after sawing an artificial vein, was too low to allow the analysis of the pressure differences, because the device’s measurement range is exceeded. The given diagram cannot be analysed with regard to the effectivity of the acid blends, but a general statement about the acidification is still possible: the permeability increases significantly, since a low-rate circulation of ammonium chloride becomes possible after the acidification.
This implies a significant permeability increase in all three cases, which is almost exclusively caused by SFB-007. The flushing of the pores was identified as an important factor to increase the permeability after the acidification but may result in a pore collapse due to the confining pressure.
The three CFT diagrams show that the permeability increase could account for the HF-bearing acid blend SFB-007, while the effect of SSB-007 was insignificant in the samples.
The relevance of SSB-007 was mainly as a pre-treatment to avoid unwanted chemical reactions with HF, such as the precipitation of CaF2. In the AEs, the PEF was higher if HF was involved, but the number of cases with permeability decreased as well. Hydrochemical analyses, using AAS, IC and Si-Photometry, show that the total ion load of the spent HF-based acid was far higher compared to spent 15% HCl. The precipitation of the iron hydroxide was most intense in samples with the highest ion load in the fluid.
3.3. Petrophysical Methods
Permeametry, Sonic, Thermoscanning and Pycnometry were used to assess the petro- and thermophysical rock properties before and after treatment. The initial gas-permeabilities of the untreated samples ranged between 1.3 × 10⁻¹⁸ and 3.1 × 10⁻¹⁴ m2. After treatment, the gas permeabilities ranged between 1.2 × 10⁻¹⁷ m2 and 1.8 × 10⁻¹⁴ m2. The permeability correlated with the porosities, which ranged between 0 and 12.02% before treatment and increased to 0.92 to 14.52% after treatment. The largest porosity increase was achieved during the CFTs (max. plus 5.03%). In the AEs the treatment 12% HCl + 3% HF was more effective than 15% HCl. Thermal conductivity (2.5–4.5 W·m−1·K−1)) and thermal diffusivity (1.2–3.9 × 10⁻⁶ m2/s) resulted in specific heat capacities between 572 and 827 J·kg−1·K−1) and were not significantly affected by acidification. Sonic velocities (p-wave velocities between 3095 and 6360 m/s, s-wave velocities between 1909 and 4447 m/s, mean value per sample before treatment) resulted in high Young’s moduli and low Poisson ratios. These deviated from the literature, possibly because Quartz veins provide preferential wave propagation paths. While the Poisson ratio decreased after acidification, Young’s modulus increased, indicating that precipitation might have increased the mineral interconnectivity.
4. Discussion
As a major difference between the CFTs and the AEs, in the CFTs the applied acids SSB-007 (based on a strong organic acid), followed by SFB-007 (based on hydrochloric acid plus hydrofluoric acid) were circulated through up to 80 mm long cores for up to 2.5 h under approximation of reservoir conditions (150 °C, 172.4 bar confining pressure). In contrast, in the AEs, the acids 15% HCl or 12% HCl + 3% HF, together with 20 mm long rock plugs or powder from ground samples, were heated to 150 °C for 24 h without circulation. This implies that no pre- or post-flush was conducted.
The analysis of the effectivity of the acids regarding different minerals, quantified by using XRD and XRF as well as AAS, IC and Si-Photometry on the spent acids, displayed similar trends, which generally correlate with earlier studies [
46,
47] as well as with results from Economides and Nolte [
48].
The most relevant chemical equations for reactions with HCl + HF are listed below to give a preliminary understanding of the results discussed in the following section. Chemical reactions with only HCl are not displayed separately since, chemically, Cl
- has comparable characteristics to F
- and can therefore be involved in similar chemical reactions, but with reaction rates that are several magnitudes lower. The following chemical equations were documented by Economides and Nolte [
48]:
Quartz 4HF + SiO2 ⇔ 2H2O + SiF4 (silicon tetrafluoride)
SiF4 + 2HF ⇔ H2SiF6 (hexafluorosilicic acid)
Na-feldspar NaAlSi3O8 + 14HF + 2H+ ⇔Na+ + AlF2+ + 3SiF4 + 8H2O
K-feldspar KAlSi3O8 + 14HF + 2H+ ⇔ K+ + AlF2+ + 3SiF4 + 8H2O
Calcite CaCO3 + 2HF⇔ CaF2 + H2O + CO2
Depending on the respective stoichiometry, clay minerals reacted with HF + H+ under the creation of AlF2+, SiF4 and H2O in different ratios. As the composition of Tourmaline is extremely variable, no chemical reaction was provided.
While the reactions between HF and silicates generally resulted in the creation of liquid hexafluorosilicic acid, which, depending on the pH of the resulting fluid, could precipitate as amorphous silica gel, a reaction between HF and Calcite would immediately result in the precipitation of CaF2 and cause pore clogging.
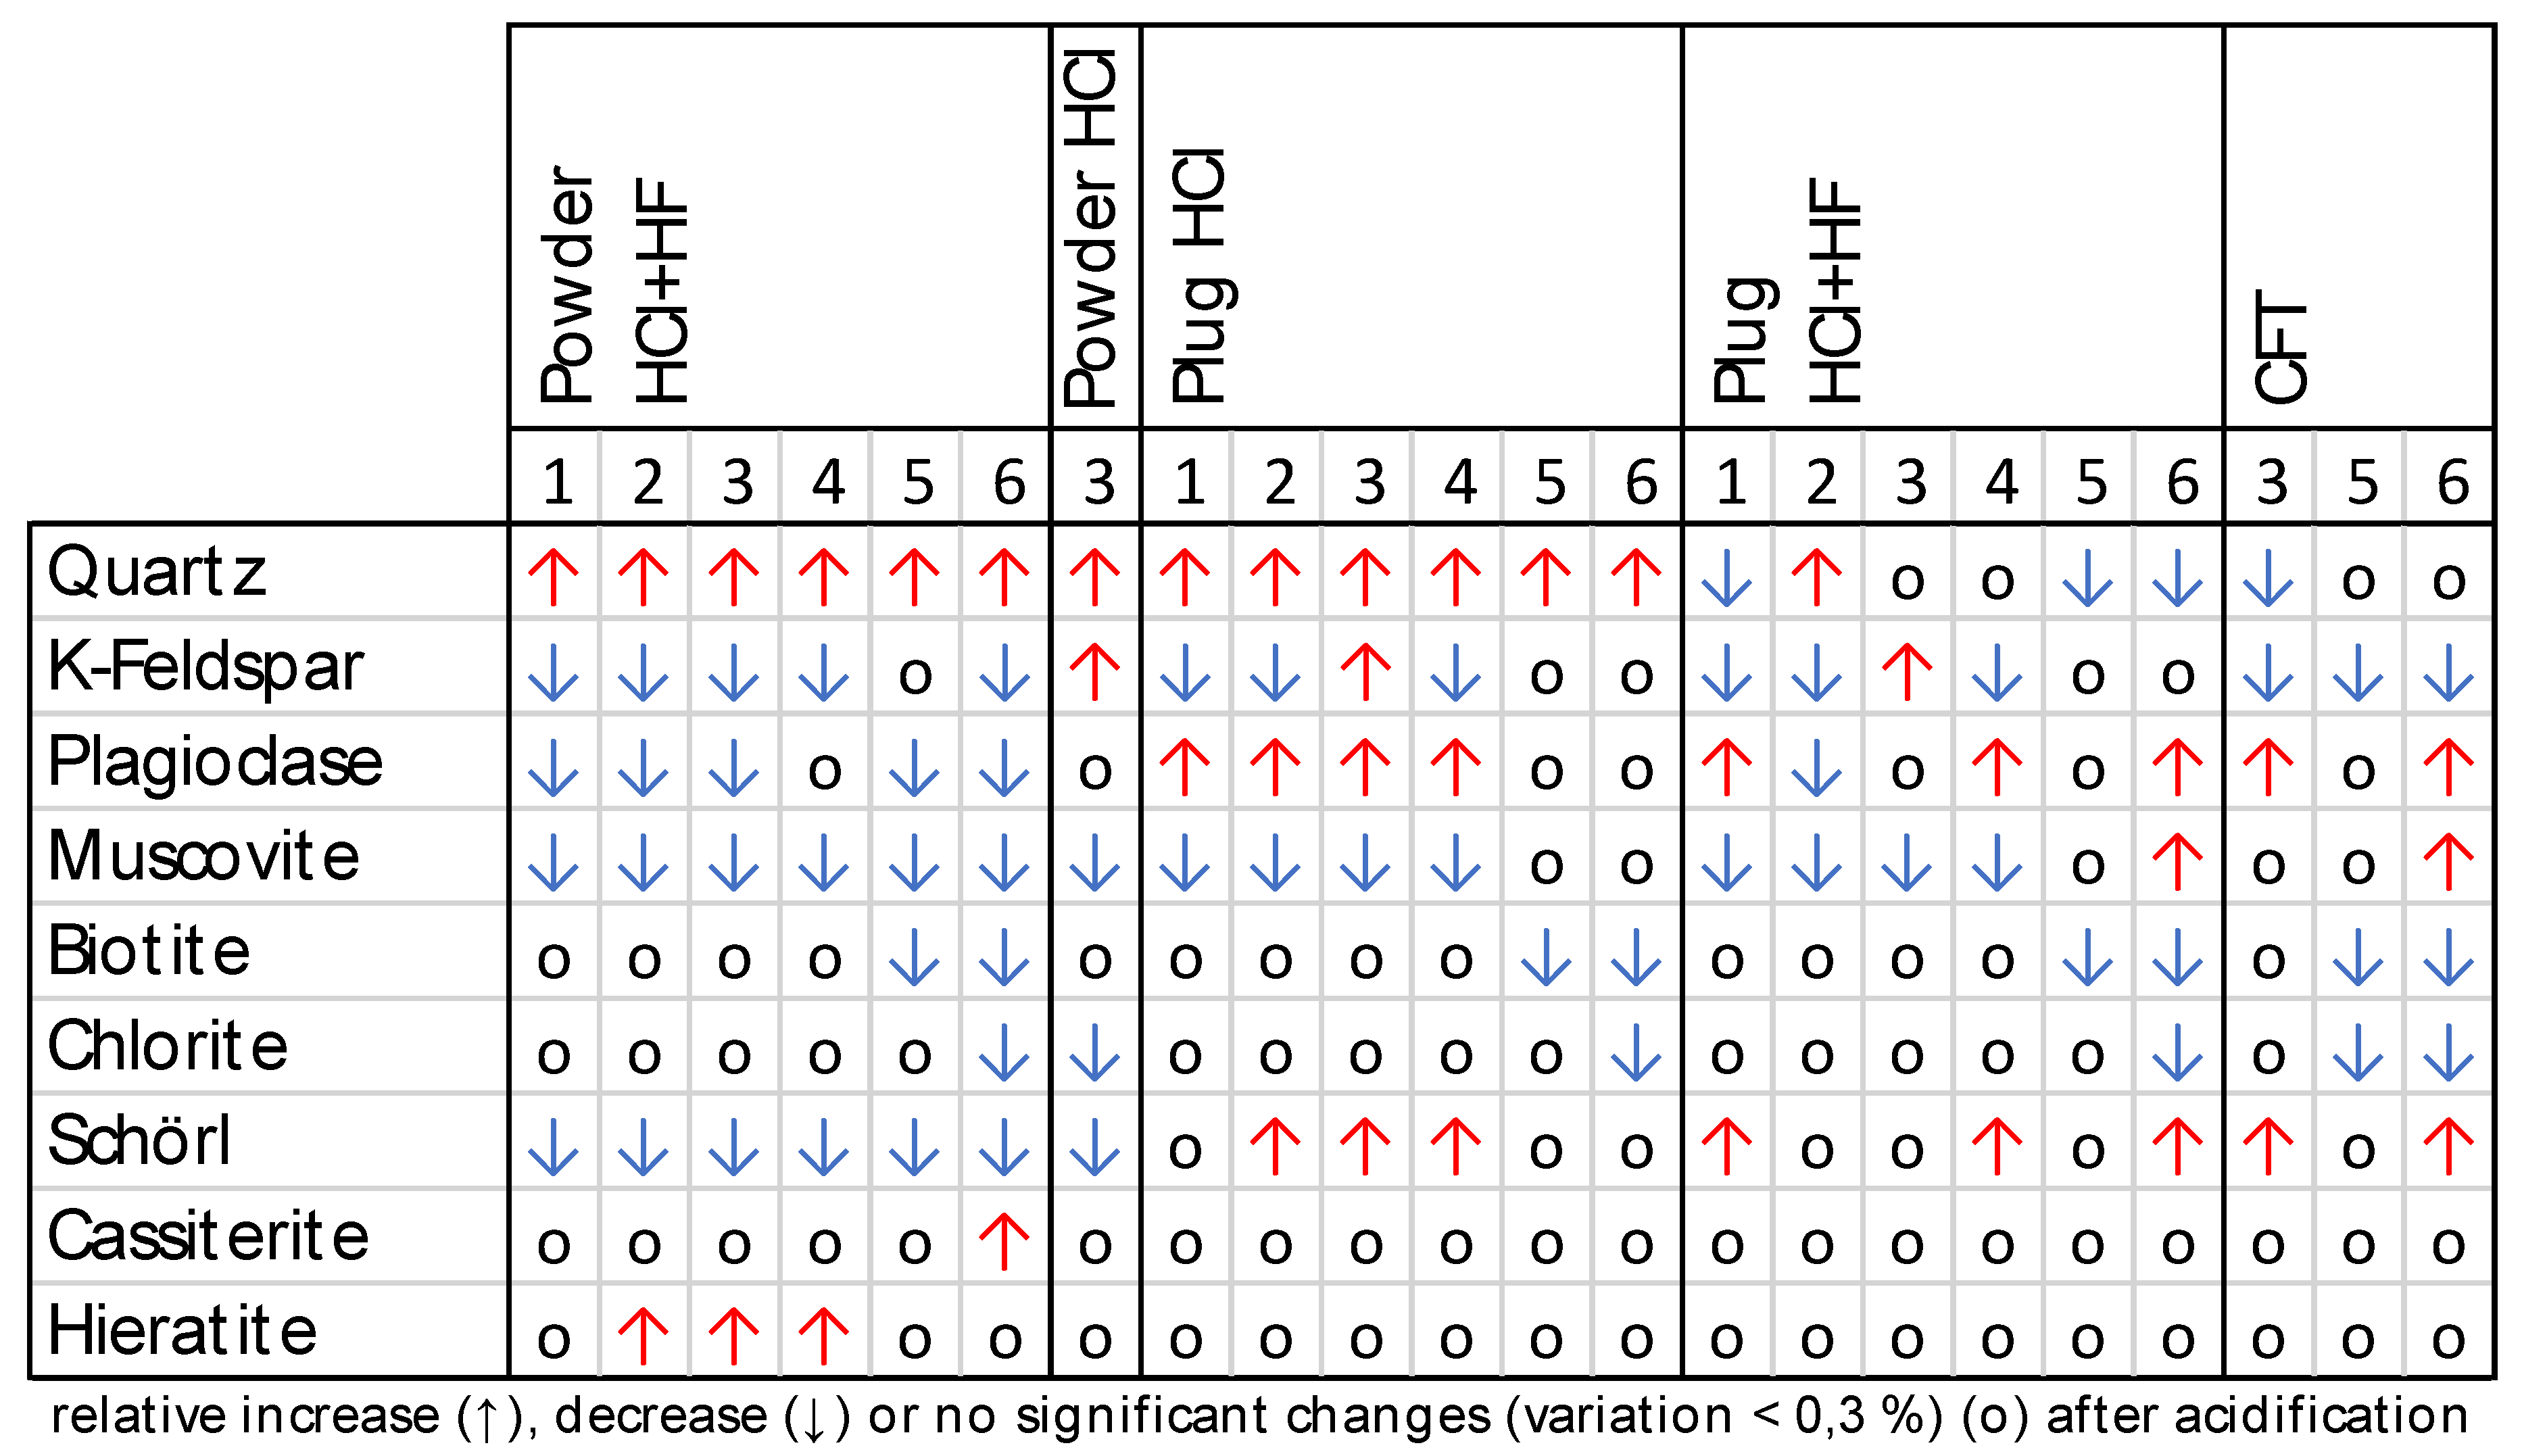
The XRD results show that on ground samples 12% HCl + 3% HF, the Quartz content in the treated samples increased to up to 100%. This implies that every other mineral reacted entirely. An exception is Tourmaline (Schorl), which was partly persistent in samples with an initial concentration above 5.5%. As a product of the HF acidification, Hieratite (K
2[SiF
6]) crystallised in several samples. In accordance with results from Sclar and Fahey [
49], it was most likely a product of the acidification of K-Feldspars, since it contains K and F and was found in the samples with initially highest K-Feldspar concentrations. In the powder samples, Micas and Plagioclase were dissolved completely, but no correlation reaction products could be identified. The crystallisation of further minerals is indicated with additional spectral peaks in the XRD-results, but those minerals could not be identified, as well as amorphous phases. In the acidified rock samples (plugs) trends were less distinctive. For 12% HCl + 3% HF as well as 15% HCl, Quartz and Tourmaline were least affected, while Micas, especially Fe-Chlorite, were statistically most affected. The Feldspar contents did not display clear trends, but in relative numbers Plagioclase seemed to be less affected than K-Feldspar. If 15% HCl was applied, the effect on Quartz was insignificant. In all samples the effectivity of the acidification regarding the relative mineral concentrations increased if HF was involved. Comparing the SSB-007 plus SFB-007 acidification in CFTs with 12% HCl + 3% HF in AEs, the trends were similar, except for Muscovite, which seemed to be less affected. This may be related to additives with the purpose of inhibiting the participation of clay minerals.
The XRD results were generally confirmed by the XRF results, which displayed low to no effectivity regarding Quartz, depending on the acid, (relative SiO2 increase) and higher effectivity regarding Micas and Feldspars or other Al-bearing silicates (relative Al2O3, K2O or Na2O decrease). The effectivity regarding Schorl was low to intermediate (Fe2O3 concentration decreased or did not change in samples without Fe-Chlorite and Biotite). Again, the trends accounted for 15% HCl as well as for 12% HCl + 3% HF, but the magnitude was larger for 12% HCl + 3% HF. Further trends in other main elements (TiO2, MnO, MgO, CaO, Na2O, K2O, P2O5) or trace elements cannot be generalised.
In sample 6 (023001, Cligga granite), as an exception, indicators for Cassiterite, Galena, Pyrite or other ore minerals were detected. This confirms the XRD results and macroscopic observations for the specific sample.
The chemical analysis of the spent acids, using AAS, IC and Si-Photometry also confirmed the trends from XRD and XRF. In most cases, relative concentrations can be generalised as trends for the respective acidification set:
12% HCl + 3% HF, 150 °C, powder: Al > Si > Na > Ca > K > Ti > Mg > Fe > Mn
15% HCl, 150 °C, plugs: Mn > Al > Fe > Ti > Ca > K > Mg > Si
12% HCl + 3% HF, 150 °C, plugs: Al > Na > Fe > Si > Ca > K > Mg > Ti > Mn
Regarding 12% HCl + 3% HF as well as 15% HCl acidification on plugs, the relative participation rates of Feldspars are low (relatively low K+, Na+ and Ca2+ concentrations), while Micas, especially Muscovite, are strongly affected (relatively high Al3+-concentrations). Tourmaline and other Fe-bearing minerals have intermediate relative participation rates, if present (relatively high Mn2+ and Fe2+/3+ concentrations). If 15% HCl is used, Si is absent in the fluid, implying zero participation of silicates. This is a contradiction to the abovementioned results unless assuming precipitation of silica gel, as described above. In contrast, applying 12% HCl + 3% HF (comparable trends on plugs as on powder), the participation of Feldspars and Micas, as well as mafic minerals, is magnitudes higher compared to 15% HCl (extremely high Al3+, high Si and high Fe2+/3+, Mg2+, Ca2+, Na+ and K+ concentrations). Total ion loads reach up to approx. 11,000 mg/L in spent 12% HCl + 3% HF, but only approx. 550 mg/L in spent 15% HCl.
Comparing the acidification on plugs and powder (with 12% HCl + 3% HF in both cases), the data show similar trends. In relative numbers, the ratio of the dissolved elements fits quite well between acidised OAS powder and plugs. The main difference is an extremely low Fe2+/3+ concentration in the fluid from powder acidification experiments (maximum Fe2+/3+ concentration in powder experiment: 16 mg/L; in plug experiment: 1355 mg/L). This might indicate the precipitation of an iron mineral on the large powder surface and separation during centrifugation of the powder sample. In XRD, the respective mineral would likely not be detected as the precipitate would most likely precipitate as an amorphous mineral. No XRF measurements of the powder samples were performed, because the remaining material mass was too small for the method.
Summarising the effects on specific minerals, the effectivity of the acidification depends primarily on the composition of the spent acid. Theoretically, the effect of the temperature is relevant, but since all experiments were conducted at the same temperature, this cannot be validated by the data. The effect of the grainsize is minor, as powder and plug acidification had comparable effectivities regarding different minerals, although the grainsize was homogenised by pulverisation. It also depends on geochemical variations in the sample, such as varying concentrations of ore minerals, Chlorite, Muscovite and Biotite or Tourmaline. Feldspars and Mica are mainly affected by the chemical reactions. The effect on Quartz is far lower, even if HF is involved. Since the AEs last 24 h and near-equilibrium conditions are established, reaction kinetics are not as important for the resulting effects on the samples as they would be in a real stimulation or in CFTs, in which the reaction time is much lower (0.5 to 6 h). However, since all relevant reactions imply an activation energy threshold, reaction kinetics still influence the results. Equilibrium constants in a multi-phase—multi-component system can be derived from reaction rate constants. Portier and Vuataz [
46] use respective parameters for a granite system and state that, using 12% HCl + 3% HF, the reaction rates for Feldspars and Micas are two magnitudes higher than for Quartz. Their results also confirm a higher reactivity of K-Feldspar compared to Plagioclase. Reaction rates for HCl and HCl + HF in varying concentrations are also provided by Economides and Nolte [
48] and confirm the present results. If the effectiveness of the acids is summarised in terms of the estimated solubility of the minerals, which are predominantly involved in the analysed samples, the following order can be derived:
Further quantifications of the reaction kinetics in the autoclave experiments would require a larger dataset and more detailed analysis. Regarding SSB-007 and SFB-007, reaction kinetics are influenced by the addition of retardants and corrosion inhibitors. As the exact composition of the acid blends has not been provided, no further interpretation of the reaction processes during the CFTs is possible.
Regarding the comparability of the acidification methods (CFTs versus AEs; 15% HCl versus SSB-007; SFB-007 versus 12% HCl + 3% HF), it is very important to consider the different reaction times, as the SSB-007 flush lasted less than one hour in the CFTs, while the AEs were conducted during 24 h. As a summarising comparison, 15% HCl has a weak, but evident effect on the AE samples and in the fluid samples, while SSB-007 did not cause any effect on permeability that could be identified during the CFTs. All effects related to geochemical variations induced by the CFTs could solely account for SFB-007. Comparing SFB-007 and 12% HCl + 3% HF, the effects seem to be quite comparable, except for the slightly lower effectivity of SFB-007 on Micas, detected in the XRF data. From several papers published by Fangmann Energy Services, only Recalde Lummer and Rauf [
24] unambiguously describe the application of SFB-007, stating that K-Feldspars of the analysed samples are not affected by conducted experiments. This is not confirmed by the present results. The absolute effectivity of both methods is not comparable due to the differences in duration, pressure and the acid circulation in the CFTs.
The most important limitations of methods are related to the acidification experiments: in the CFTs, no absolute permeability is measured since the fluid properties (viscosity of the acid, as well as the exact composition of the acid blends) are unknown and likely change during the experiment. Thus, unfortunately, the permeability determination is only reliable during the ammonium chloride flush. The dynamic viscosity of ammonium chloride under test conditions would need to be determined, as well as the fluid properties of SSB-007 and SFB-007, which are required for hydraulic modelling. The flow behaviour, and thus also the retardation and reaction behaviour, is highly dependent on viscosity and density. In the AEs, the quantification of the mineral dissolution is corrupted by precipitates, which do not occur in the CFTs to a comparable extent and would not occur in the near-well regions of the reservoir (metres to tens of metres), if an adequate post-flush is conducted to displace the reaction products deeper into the formation. This displays the main limitation of the AEs.
Indicators for the relevance of ore minerals in acidification are found in sample 6 (023001), where precipitates are most abundant. The thickness and the extent of the yellow to white precipitate is highest. Uniquely, sample 6 contains macroscopically visible fine-grained ore minerals. Cassiterite was identified by XRD; further ore minerals (possibly Galena and Pyrite) are indicated in XRF data. The AEs on sample 6 result in a PEF of 0.8 for 15% HCl and 0.59 for 12% HCl + 3% HF. It is the only sample with a permeability decrease after acidification with 15% HCl. Fe was identified to cause the yellow precipitate, which occurs not only in the presence of ore minerals but also in samples that contain mafic or Fe-rich minerals, such as Schorl, Hornblende or Fe-Chlorite. Assuming the presence of Pyrite, the abundance of the precipitate can be explained. In the XRF data, the relative Fe2O3 content increases, indicating that Fe-ions reprecipitate. To assess the presence of ore minerals for a chemical stimulation, XRF is recommended instead of XRD, as XRD is not a well-suited method to identify ore minerals.
Comparing OASs and cuttings, only limited transferability is given between the two sample types. This highlights the significant effect of surface weathering or alteration processes on the samples, which can be excluded by the drilling of Side Wall Cores for a high-quality assessment of the reservoir. The reduced normalised Plagioclase content in the OAS, in comparison to the cuttings, could be another indicator—besides the REE pattern—for weathering, because Plagioclase has higher weathering rates than K-Feldspars. Nevertheless, the mineralogical composition of the OAS resembles hydrothermally altered fracture zones and is therefore a relevant approach for deep geothermal systems in fractured granite.
5. Conclusions
Regarding the results of the present study, the most efficient acid for United Downs is clearly HF-based. In other wells, when calcite is present in veins, HCl or an Organic Acid is usually sufficient for stimulation, but this is not the case in UDDGP. In case chemical treatment is not an option, e.g., due to due to regulatory requirements regarding the applied acids, pulse fracturing treatment—as described by Tariq et al. [
50]—might be an option. Thermochemical acid fracturing, as described by Tariq et al. [
51], which is based on the pressure increase during specific chemical reactions and can be based on less hazardous chemicals, may also display an alternative. HF is not biodegradable and not environmentally friendly, although Recalde Lummer and Rauf state that the treatment system SSB-007 + SFB-007 is biodegradable [
24], which is confirmed by the safety sheets of the single components. To reduce safety and environmental risks, the HF-based acid is prepared on site from ammonium bifluoride and strong organic acids, which are less hazardous. This allows safer handling and a demand-controlled preparation of the required acid volume. Technical restrictions regarding the project site, such as swelling of clays and compatibility with borehole and reservoir fluids, as well as casing steel and cements were analysed and show no signs of incompatibility. Technical constraints from the environmental side include the presence of a hydraulic barrier, such as a customised barrier (e.g., inert, impermeable textiles or foils) on top of a concrete pad of sufficient extent around the well, the integrity of the well cementation, the exclusion of any leaks in or around the well or project site and the exclusion of any other hydraulic links between the reservoir and non-target areas.
The CFTs were conducted to approximate a chemical reservoir stimulation on lab scale. A major difference between the lab-scale experiments and a reservoir stimulation is that in a reservoir stimulation, chemical stimulation is accompanied by hydraulic and thermal stimulation effects.
As relatively cold fluids, compared to the reservoir temperature, are injected, thermoelastic effects may cause fracture opening or fracturing as well, as significant contraction effects may occur due to the large reservoir volume and will strongly be influenced by injection volume and the duration of injection. In the CFTs, the sample is heated to 150 °C, while the fluid is at room temperature before the contact with the sample. For the small core volume, thermal contraction is not relevant. Effects of thermal contraction would most likely occur during the ammonium chloride pre-flush but have not been detected.
The hydraulic pressure is at least the hydrostatic pressure of the fluid column in the well, but may be artificially increased, depending on the stimulation approach.
Regarding the pressure conditions, the applied confining pressure in the CFTs was set to 172.4 bar and a back pressure of 34.5 bar was applied to prevent boiling of the fluids. The pore pressure was in a dynamic relation with the measured differential pressure and depended on the pump pressure, which varied to maintain a constant flow rate (OFITE 2019). In comparison, the stress conditions in the production well were strike–slip stress conditions (max. horizontal pressure > vertical pressure > min. horizontal pressure), critically stressed for shearing on pre-existing fractures with matching orientation [
22]. Indicators for a change of stress regime in the open-hole sections were found and are described by Reinecker et al. [
22].
While the CFTs affect a specific fissure or vein, a reservoir stimulation is conducted with packers or coiled tubing, affecting entire well sections. The fluid follows preferential flow paths, which implies the risk of creating wormholes along the most permeable fractures, while closed fractures might only be affected by the acid to a very low degree. This issue should be investigated in further studies, e.g., by digital rock imaging, as well as quantification of the changes in roughness.
In the CFTs, during the flushing process under the applied confining pressure, a fracture collapse was detected, as described in
Section 3.2. This risk is transferable to the reservoir, as it implies the risk of a permeability decrease by the reduction in vein or fissure stability by particle washout or during chemical treatment. In hydraulic stimulations, proppants are commonly used to avoid fracture collapse. In the case of the granitic reservoir rocks, the Quartz grains, however, might act as natural proppants and keep the fractures open, while Micas and ore minerals in the fractures are preferentially dissolved.
The dissolution characteristics for a HF based acid are good, but imply the precipitation of pore-clogging minerals. A post-flush needs to be executed, which ensures that precipitation occurs only in the reservoir at greater distance of the well, minimising negative hydraulic effects to the well productivity. As an attempt to quantify the required post-flush volume for chemical treatment, it should correspond to at least one times the pore volume of the sample. With respect to the possible fracture collapse and pressure limitations due to technical and safety constraints, the maximum post-flush volume is limited as well. In view of these limitations, a post-flush of three to five times the pore volume is recommended.
Chemical stimulation with HF is common in petroleum projects and has also been applied in geothermal projects [
52,
53,
54], but open-access datasets are scarce. HF-treatment involves severe risks for human health and the environment. The company and operator have to ensure that during chemical treatment, all risks to health and the environment are considered. Procedures to handle the fluids have to be designed accordingly and countermeasures need to be in place to be applied immediately if needed. The acid blend SFB-007 has already been applied in geothermal projects with granitic reservoir rocks as Soultz sous Forêts, Rittershoffen and Vendenheim [
24]. An intense pre-stimulation assessment of the reservoir is required to search for the optimum acid blends and to define required volumes or technical alternatives. The presented research contributes to the optimisation of stimulation pre-assessment, which is transferable to other projects in fractured crystalline rock. The present work contributes significantly to the stimulation pre-assessment for the United Downs Deep Geothermal Power project and therefore improves the planning process of the reservoir treatment. It complies with the MEET project objective to optimise chemical treatment and reservoir assessment. SSB-007 + SFB-007 are innovative, state of the art acid blends, which are applied internationally. The approximation of these acid blends with 15% HCl and 12% HCl + 3% HF has proven to be a suitable approach. Elaborated results from the selected samples can be transferred to further project sites in a fractured granitic basement. The applied methods in the compiled workflow are an innovative, well-suited tool set for a generalised approach to the lab scale assessment of rock acidification, particularly for application in a crystalline basement.
Using a set of laboratory tests that, to our knowledge, have never before been performed with similar acid combinations on granitic rocks for geothermal purposes, the present study provides new insights into the efficiency as well as possible difficulties of chemical stimulation in such rock types.


